 Dimitris Velaoras
 Sotiris Kioroglou
 Evi Bourma1
- 1Hellenic Centre for Marine Research, Institute of Oceanography, Anavyssos, Greece
- 2Department of Marine Sciences, School of the Environment, University of the Aegean, Mytilene, Greece
This work presents evidence of double diffusive convection (DDC) in the form of salt fingers (SF) forming a thermohaline staircase in the Cretan Sea (South Aegean Sea). The phenomenon was identified at the eastern edge of the Cretan Sea in March 2023 but had vanished by September 2023. To estimate vertical diffusivities and fluxes, four DDC models were applied to the hydrographic data. The vulnerability of the staircase appears to be related to weak, downward, salt finger–induced density fluxes, possibly caused by tilting of the salt fingers due to prevailing strong horizontal shears. Two of the four model implementations showed closer agreement with predictions from a previous staircase study in the area. Analysis of the density ratio and Turner angle from individual cruises demonstrated the widespread susceptibility of the Cretan Sea water column to such phenomena. Specifically, cruise data from 2016 to 2023, covering the layer between the intermediate salinity maximum (Levantine Intermediate Water) and the deep salinity minimum (Transitional Mediterranean Water), showed that 71%–85% of Turner angle values lie in the salt fingering zone. Thermohaline staircases in the Cretan Sea play a significant role in shaping the physical and biochemical processes of the basin by transporting salt and density toward deeper layers while uplifting nutrients. Although small scale, the phenomenon can significantly influence the evolution of the water column and large-scale climatic processes, such as vertical heat and salt transport and overturning circulation in deep basins.
1 Introduction
1.1 Oceanographic setting
The Cretan Sea lies at the southern extremity of the Aegean Sea and constitutes the largest basin of the South Aegean Sea. It is bounded to the north by the Cyclades island complex and to the south by the island of Crete (Figure 1). This sea is a key Eastern Mediterranean (EMed) basin, acting both as a large heat and salt reservoir for the entire EMed and as a source of dense waters for the Levantine and Ionian basins (Theocharis et al., 1993; Theocharis et al., 1999; Theocharis et al., 2002).
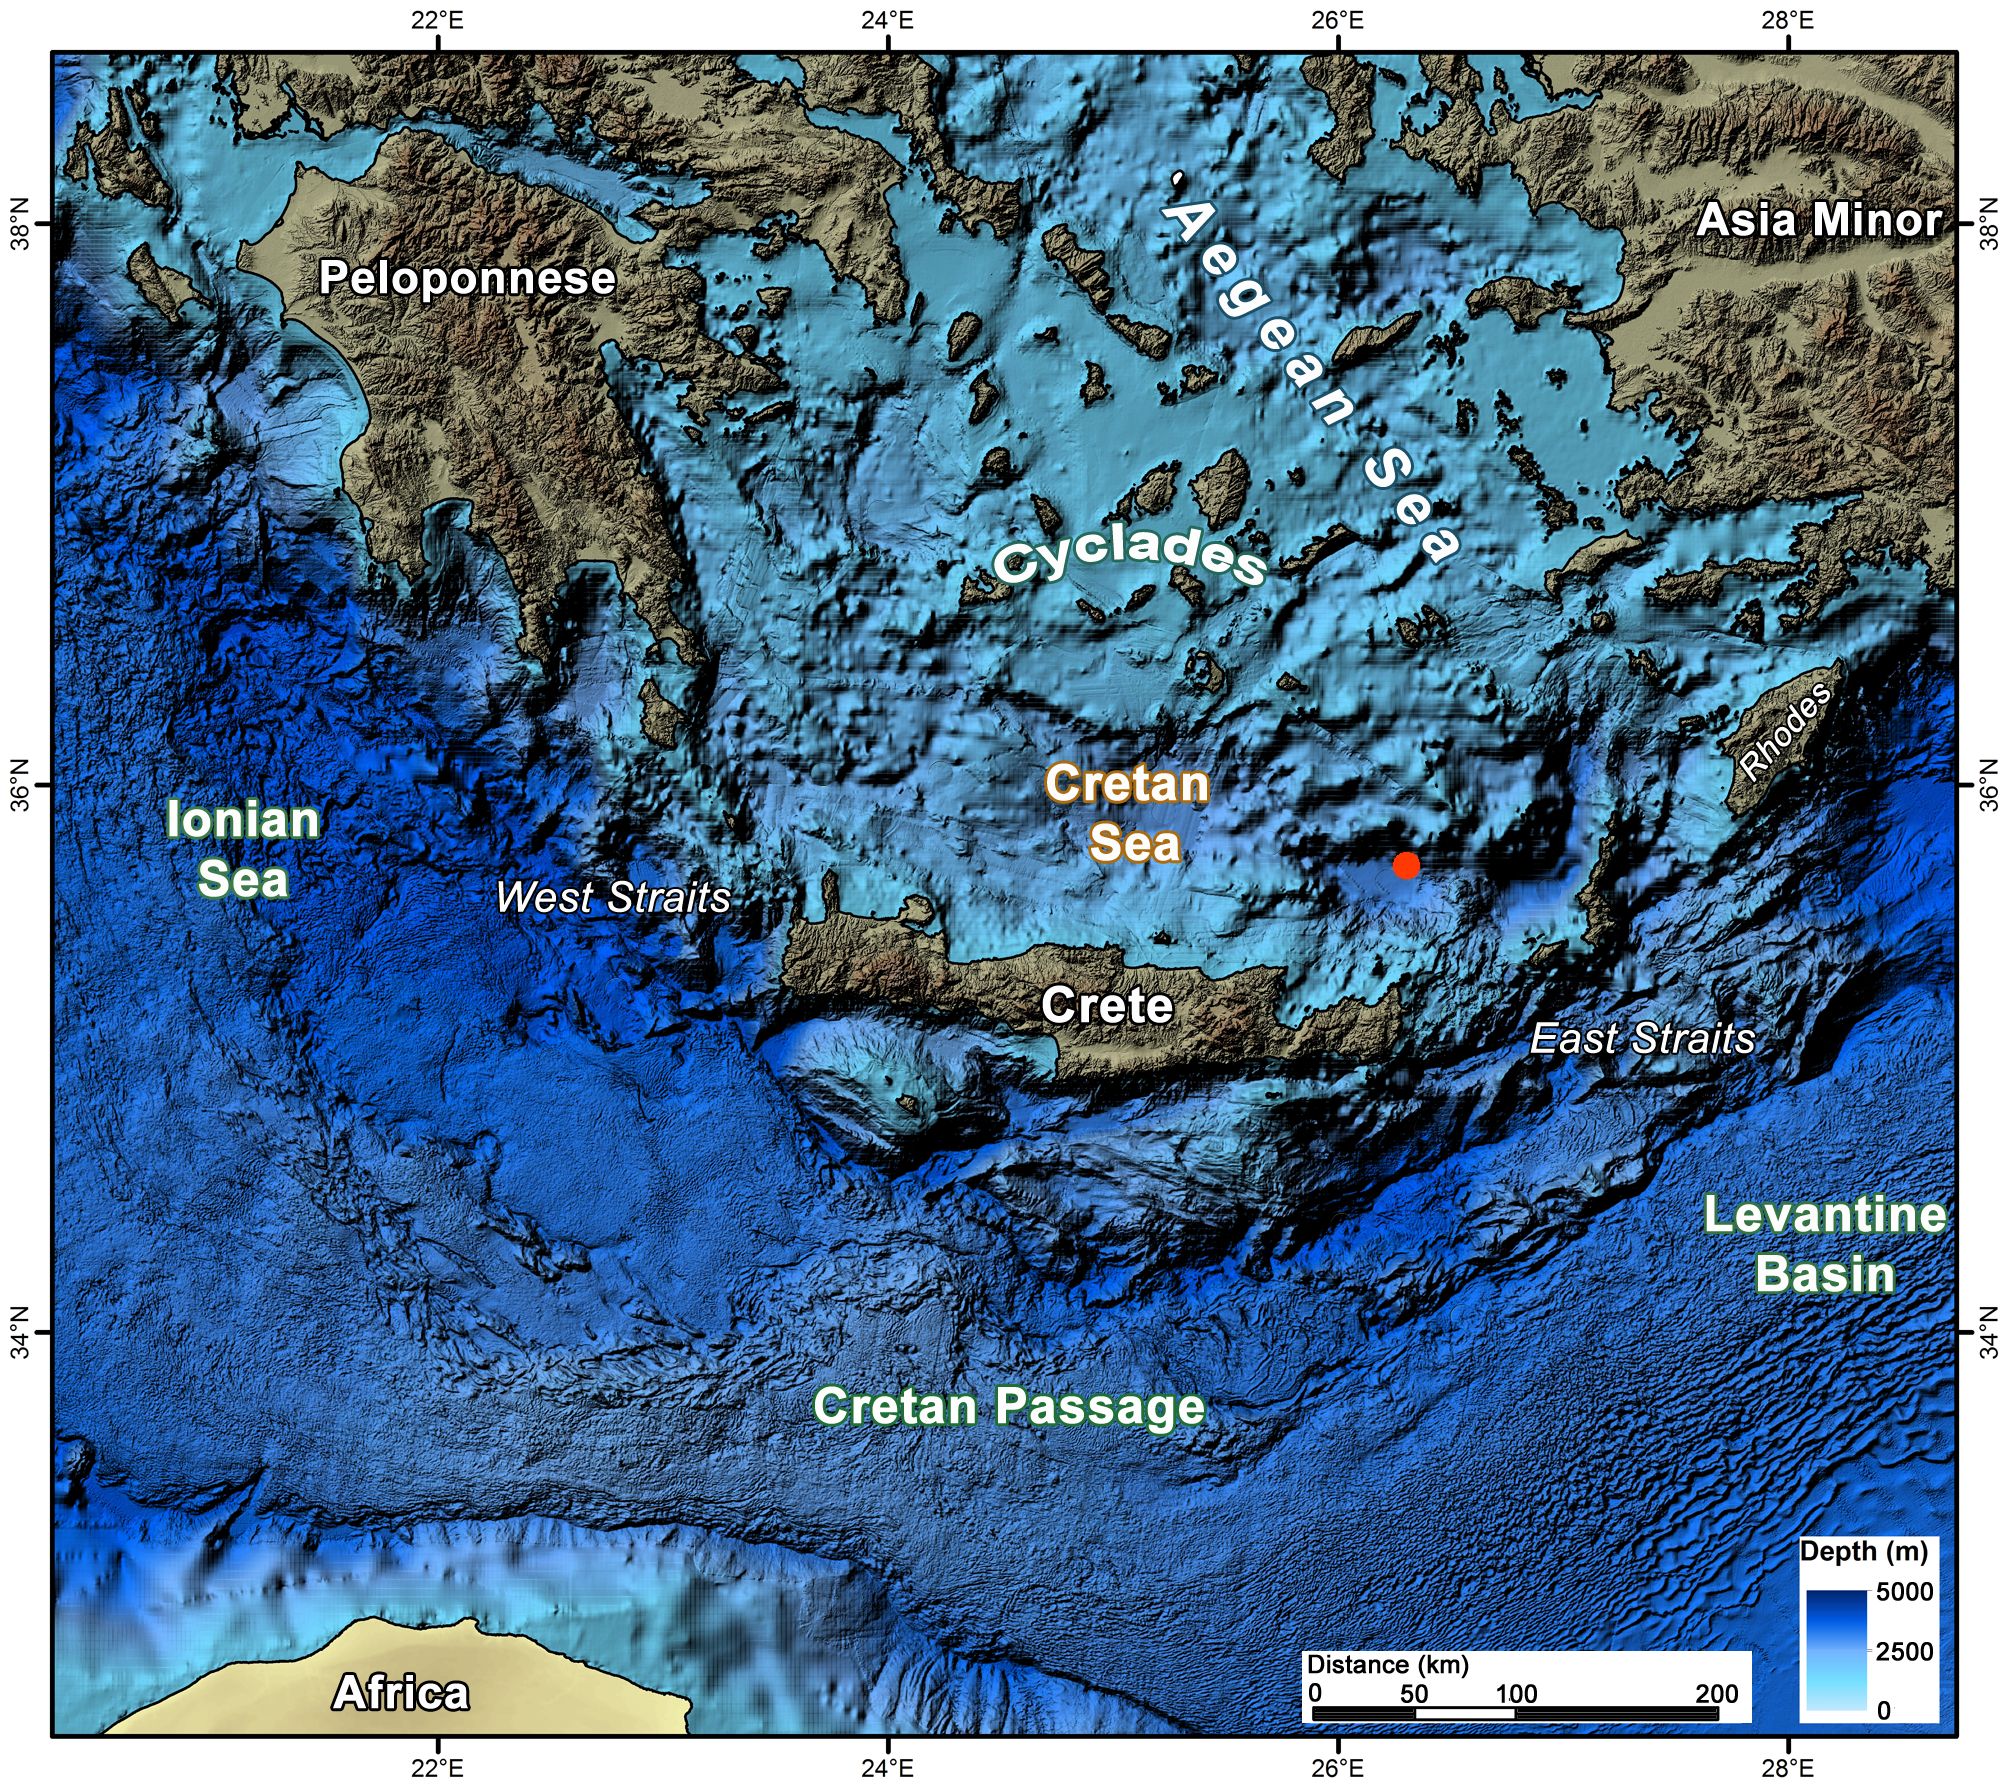
Figure 1. Bathymetric map of the South Aegean Sea (data from EMODnet Bathymetry Consortium, 2016). The red dot indicates the position of the CTD profile (Latitude 35° 45.20 N, Longitude 026° 13.71 E) showing the thermohaline staircase (see Figure 2).
Its intermediate layers are occupied by a mixture of warm, saline waters either imported from the Levantine Sea through the eastern Cretan Straits [Levantine Intermediate Water (LIW)] or produced locally [Cretan Intermediate Water (CIW)]. Below these layers lies a colder, less saline water mass imported from the open EMed. The core of this mass, known as Transitional Mediterranean Water (TMW), is characterized by a local salinity and oxygen minimum. It enters the basin from both the eastern and western Cretan Straits at sill depths (~800–1,000 m) and stabilizes according to its typical potential density (σθ ~29.17–29.18 kg/m³) at horizons below the LIW/CIW layer. The TMW core depth varies interannually and conforms to the changing density stratification of the Cretan Sea below the intermediate waters (for information on Cretan Sea hydrology, see Velaoras et al., 2014; Velaoras et al., 2015; Velaoras et al., 2019; for information on LIW, see POEM Group, 1992; LIWEX Group, 2003; Kubin et al., 2019; Taillandier et al., 2022).
Thus, the Cretan Sea is a basin where waters of different origins and characteristics converge and gradually mix. The aforementioned TMW enters through the Cretan Straits and forms a layer that separates the saltier CIW from the Cretan Deep Water (CDW). Studies have shown that the TMW signal (in the form of a salinity minimum) is strongest during maximal exchange through the Cretan Straits, and that when this exchange weakens, the TMW layer is gradually eroded through mixing with CIW and CDW (Boscolo and Bryden, 2001; Velaoras et al., 2015). However, the exact mechanism of this erosion has not been studied in depth. Recently, Potiris et al. (2024), analyzing historical hydrographic data from the Cretan Sea, identified notable intrusions of warmer, saltier water into the TMW layer. These intrusions were statically stable; thus, their mixing was not necessarily turbulent. However, they did induce steep temperature and salinity gradients, conditions that could favor double diffusive fluxes of heat and salt in the absence of strong shear-generated turbulence.
1.2 Double diffusive convection and salt finger thermohaline staircases
In this work, we present evidence of a salt finger thermohaline staircase (SF-TS) in the eastern Cretan Sea. These staircases comprise a spatially organized evolution of double diffusive convection (DDC). DDC arises from the contact of two fluid mixtures whose density-defining thermodynamic properties undergo molecular diffusion at different rates (see Radko, 2013, and references therein).
For seawater, double diffusive phenomena emerge because the molecular diffusivity ratio of heat () and salt () is on the order of 100 (). In the ocean, DDC rises in the stably stratified interior () of an oceanic basin, and emerges as a gradually enhancing instability within a water mass characterized by gradients of the same sign. Positive or negative gradients give rise to the two known DDC variants; salt fingers (SF, for positive gradients) and diffusive layers (DL, for negative gradients).
Generally, diffusive instability occurs when the unequal molecular fluxes of heat and salt create statically unstable vertical density profiles (inversions), leading to localized convective motions. For both DDC variants, the instability develops due to differences in the magnitude of molecular fluxes of heat and salt, which are controlled by the interaction between molecular diffusivities and the respective ambient gradients. . Under certain conditions, the instabilities evolve into spatially organized staircases, such as the SF_ThS herein presented. Salt fingering occurs in the presence of positive gradients , where both and increase upwards in the water column and has been first described and theoretically explained by M.E. Stern (Stern, 1960). Under such stratification conditions, the dominance of molecular heat diffusion over salt diffusion leads to convective motion of water parcels, either downward toward cooler and less saline waters or upward toward warmer and more saline waters. Downward convection is driven by the net buoyancy loss that the parcel experiences before and during its descent through progressively cooler waters. Analogous arguments apply for upward convection. The phenomenon evolves into vertically elongated, narrow saline convective cells with alternating upward/downward orientation, resembling convective fingers. These cells tend to occupy the depth regimes between the overlying saline, warm waters [Levantine Intermediate Water (LIW)/Cretan Intermediate Water (CIW)] and the core of the underlying fresher, colder waters [Transitional Mediterranean Water (TMW)].
The growth of salt fingers halts when their height reaches a limiting value (e.g., ~30 cm, according to Kunze, 1987), at which point they break into turbulence, either due to Richardson number–induced overturning instabilities (Kunze, 1987) or to secondary instabilities that develop in a manner analogous to the convective growth of the fingers themselves, until they reach a disruptive potential (Radco and Smith, 2012). Ultimately, the mixing potential of salt fingers culminates in the transformation of convection into mechanical turbulence.
The overall effective diffusive fluxes, from the rise of the initial growth of SF to their turbulent break down, can be described by the SF diffusivities of salt and potential temperature, . These diffusivities are unequal, with Indeed, the combination of the formulas for fluxes and , buoyancy flux ratio , density ratio in terms of the heat expansion and saline contraction coefficients, , and the background vertical gradients of salinity and potential temperature, , , yield a ratio of diffusivities, . This in turn, if combined with the flux ratio formula of Kunze’s model for growing fingers (Kunze, 1987), i.e., with , results in . The latter formula indeed verifies that the ratio of the two SF diffusivities is generally smaller than 1, apart from the limiting case of very intense salt fingers with 1, and accordingly with Considering the descending finger growth period, (where is defined as the lifetime of the finger from its onset to its turbulent breakout), the difference in molecular mixing rates () preconditions the preponderance of the finger’s salinity surplus over the finger’s = , as remains much more unaffected than , due to its much lower (100 times smaller) molecular diffusivity . Thus, the salinity surplus delivered by the descending fingers for mixing by the ensuing turbulent break out, outweighs the respective potential temperature surplus (analogous argumentation applies for the salinity and potential temperature deficits delivered by the ascending fingers). The sequence of laminar finger convection followed by turbulent breakout, with its marked predominance of downward salt mixing over heat mixing, results in a net up-gradient flux of density, in contrast to the down-gradient flux produced by molecular or eddy diffusion.
The salt-finger staircase studied herein comprises a spatiotemporally persistent and coherent configuration of the latter sequel, wherein ‘interfaces’, i.e. vertical regimes (1 to 10 m) of growing fingers with marked gradients are alternated by ‘layers’ (10 to 100m or more), that have been homogenized by the finger-into-turbulence breakouts (). Diffusive-layer staircases are quite analogous (Kelley, 1984; Kelley, 1990; Kelley et al., 2003). Nevertheless, the exact mechanisms and conditions responsible for the sustainment of the thermohaline staircases are still under debate within the oceanographic community with various proposed different mechanisms (see Radko, 2013).
According to You (2002), the criteria for salt fingering are met in 30% of the world’s oceans, wherever warm, saline water masses overlie colder, less saline ones. In the Mediterranean Sea, favorable conditions for the onset of salt fingering exist throughout most of the basin, as warm and salty intermediate water masses of the upper thermohaline cell overlie the colder, less saline deep layers (Meccia et al., 2016). However, SF-TSs in the Mediterranean have been regularly observed mostly in the western basin (Western Mediterranean, WMed), particularly in the Tyrrhenian Sea and the Algerian Basin, between the warm, salty LIW originating in the EMed and the colder, less saline western Mediterranean deep waters (e.g., Zodiatis and Gasparini, 1996; Schroeder et al., 2010; Bryden et al., 2014; Falco et al., 2016; Taillandier et al., 2020; Durrieu de Madron et al., 2024). Notably, some SF-TSs in the WMed have exhibited remarkable spatial and temporal coherence (200 km, up to 40 years) (Buffett et al., 2017; Durante et al., 2019, Durante et al., 2021; Kokoszka et al., 2021).
In contrast, observations of ThSs in the EMed are relatively scarce, reported mainly in the southeastern Ionian Sea in the vicinity of water lenses with and characteristics different from the surrounding masses (Zodiatis, 1992; Kontoyiannis et al., 2016). In the study area of the present paper (the Cretan Sea), although the water mass distribution favors the development of SF-ThSs—since warm, saline LIW/CIW overlies colder, less saline TMW—such features have only been occasionally reported (Zodiatis, 1990, Zodiatis, 1991; Kioroglou et al., 2014). In particular, Kioroglou et al. (2014) provided evidence of SF_ThSs in other EMed sites, including the Ionian, the North Aegean (Skyros Basin), and the Levantine Seas, as well as of DL_ThSs associated with intermediate–deep saline water intrusions or at the interface between the TMW and EMed deep water.
Finally, of particular importance to the present analysis is the value used to indicate the strength of SF_DDCs, namely the so-called density ratio, , where is the thermal expansion coefficient and the haline contraction coefficient. expresses the ratio of temperature to salinity contributions on density stratification and can take values from -∞ to +∞. It comprises a measure of the compensation between the temperature and salinity gradients on the density stratification. Strong fingering is more active at , while values correspond to weaker fingering. The closer is to 1, the stronger the fingers.
Apart from , the Turner angle (Ruddick, 1983), constitutes an alternative and simultaneously more efficient categorization tool for DDC. The two parameters are connected through . In short, diffusive layer DDC (for which ) correspond to -90°< <-45°, stable conditions are met within -45°< <+45°, salt fingering DDC corresponds to +45°< <+90° while unstable conditions (convection) to the remaining angle values. The closer is to +90°, the stronger the fingers.
The present work is divided into two main aims. The first is to estimate DDC fluxes and diffusivities produced by the recorded SF-TS and to compare them with previous results for the Cretan Sea, the EMed, and other regions. The second is to evaluate the susceptibility of the Cretan Sea to SF-DDC events by statistically analyzing the stability ratio and the Turner angle, based on an ensemble of spatiotemporal coverages within the basin.
2 Materials and methods
In March 2023, during a cruise with R/V AEGAEO of the Hellenic Centre for Marine Research (HCMR) in the Aegean Sea under the Marine Strategy Framework Directive (MSFD) monitoring program, a profile in the eastern Cretan Sea (red dot in Figure 1) was sampled with a shipborne conductivity–temperature–depth (CTD) probe. A well-defined SF-TS (Figure 2) was detected in this cast but not in the subsequent MSFD cast at the same location in September 2023, nor in a later cast obtained during the CLIMPACT project in April 2025. Apart from these CTD casts, additional data from the region were considered, obtained from: a) the CRELEV 2016 oceanographic cruise, conducted in June 2016 under EUROFLEETS2 with R/V AEGAEO (Velaoras et al., 2019); b) the PERLE 2 French oceanographic cruise, conducted in February–March 2019 with R/V POURQUOI PAS? (Conan et al., 2019); and c) the PERLE 4 French oceanographic cruise, conducted in April 2021 with R/V L’ ATALANTE (Conan et al., 2019). CTD data from all cruises were collected using Seabird SBE 911+ CTD probes with a 24 Hz sampling rate. Data were processed with the manufacturer’s (Sea-Bird) software routines and interpolated to 1 dbar bins.
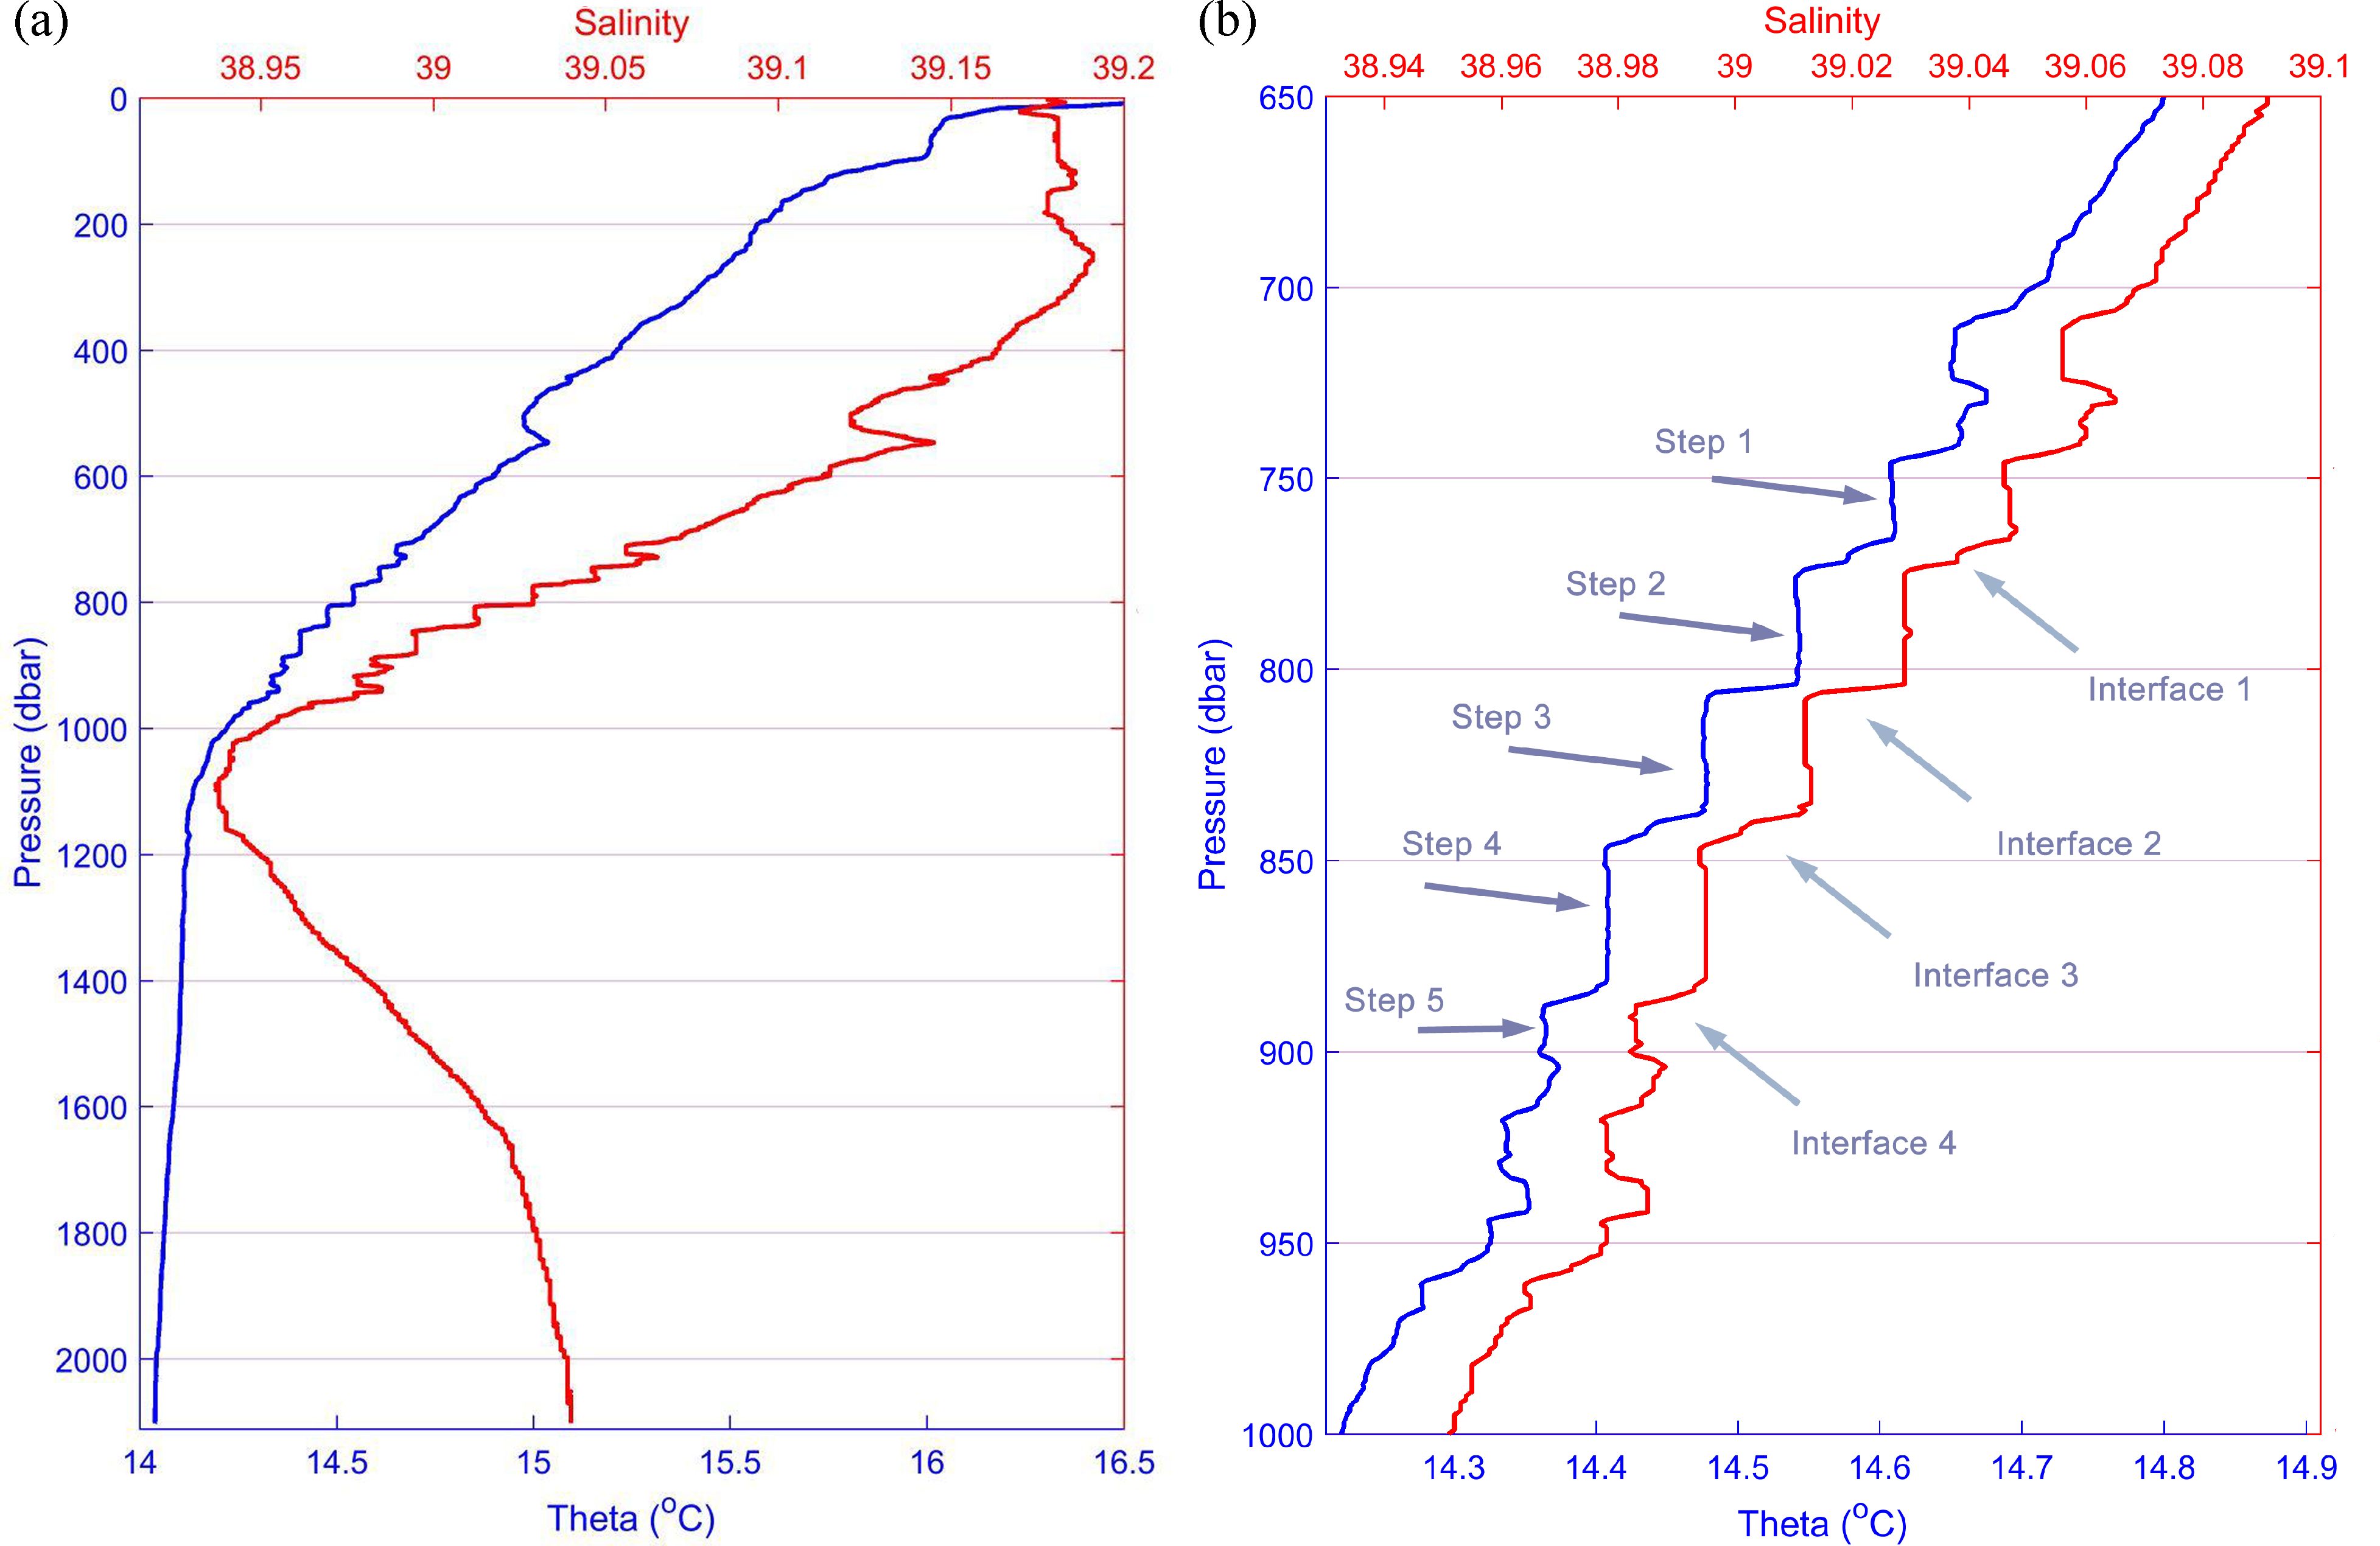
Figure 2. CTD cast of March 17th, 2023. Cast position: latitude 35° 45.20 N, longitude 026° 13.71 E Potential temperature (theta) and salinity of the thermohaline staircase profile (a). Same parameters in the 650–1,000 dbar layer (b).
Glider data presented herein are part of HCMR’s glider mission no. 33, conducted north of Crete in the framework of repeated seasonal missions established in the Cretan Sea. The mission lasted 18 days (March 15–April 2, 2023), covering ~400 km mostly north of Crete and performing vertical measurements in a sawtooth pattern. An Alseamar SeaExplorer glider equipped with a Seabird GPCTD payload was used. Full data with a 4 s sampling period were retrieved directly upon recovery of the glider and subsequently interpolated to 1 dbar bins. These data were validated by comparison with reference CTD casts performed at both the beginning and the end of the mission. To construct Turner angle distributions from the dataset, a 10 dbar running mean filter was applied.
The criteria for delimiting the layers followed those of Taillandier et al. (2020), i.e., θ and S not varying by more than 0.005°C (or psu) over at least 10 dbar. Bulk density ratios were calculated by linear fitting the data within the depth zone Θi(zi), Si(zi) encompassing the entire SF_ThS, i.e. zLIW<zi<zTMW, which is the zone between the depths zLIW, zTMW of the two core masses LIW/CIW and TMW and finally by inserting the assessed slopes into the formula of the density ratio. Interfacial density ratios were derived analogously for the data zones of each of the four SF_ThS interfaces, i.e., zupper_bound<zi<zlower_bound where zupper_bound and zlower_bound were the two boundary depths of any of the four interfaces. and were calculated using the Gibbs‐SeaWater (GSW) routines (IOC, SCOR, IAPSO, 2010).
Four different models were used to estimate SF_ThS-induced fluxes of potential temperature, , heat, , salinity, , and buoyancy, along with potential temperature and salinity diffusivities, and . These were: i) the parametrization of Large et al. (1994), acronymized hereinafter as “L94”; ii) the parametrization of Zhang et al. (1998) (also used by Glessmer et al., 2008), henceforth “Z98”; iii) the theory of Radco and Smith (2012), fitted by empirical formulation, in short “RS12”; and iv) the 4/3 power law, in short “LAB_4/3,” for buoyancy fluxes across SF_ThS interfaces, confirmed by lab experiments focused on fingering buoyancy fluxes (Turner, 1967; Linden, 1973; Schmitt, 1979; McDougall and Taylor, 1984) and substantiated by theoretical models (e.g., Stern, 1976). The first three models based their flux and diffusivity calculations on the characteristics of the four “major” interfaces that are clearly visible in Figure 2, whereas the fourth model (LAB_4/3) based its flux calculations on identified “minor” interfaces hosting only a few fingers within them (thin interface method). These ten minor interfaces were identified as microstructures of the four major ones, as explained in the Supplementary Material. Tables 1, 2 show the terminology and formulation of the four models. Among these models, only LAB_4/3 directly derives buoyancy fluxes in terms of trans-interfacial salinity differences, and thereafter fluxes and diffusivities of heat and salt in terms of the derived buoyancy fluxes. The other three models, L14, Z98, and RS12 estimate heat and salt diffusivities in terms of the stability ratios, , i.e., in terms of the ambient gradients , that the fingers will ‘sense’ during their growth.
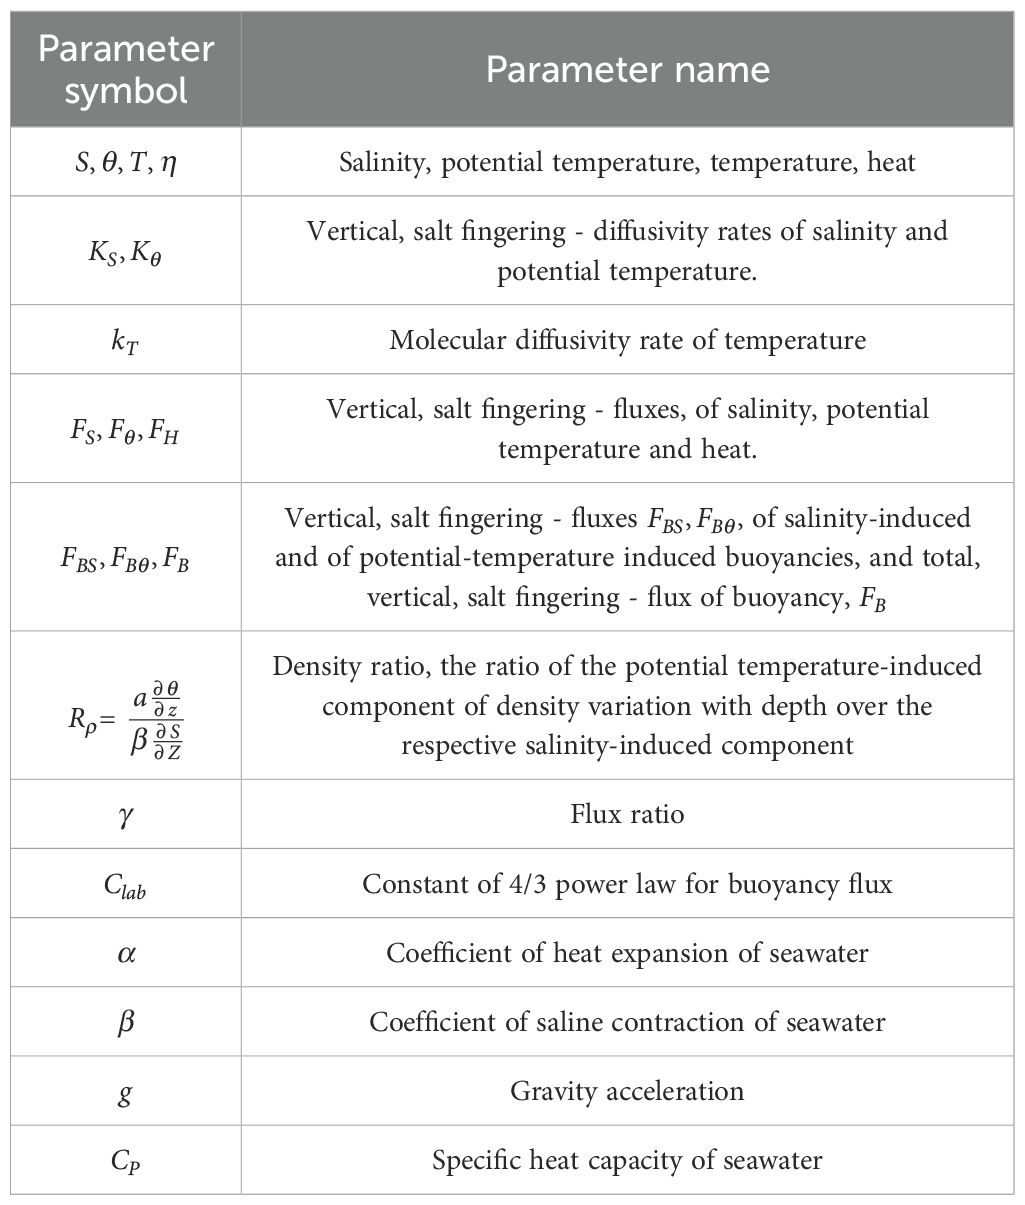
Table 1. Terminology.
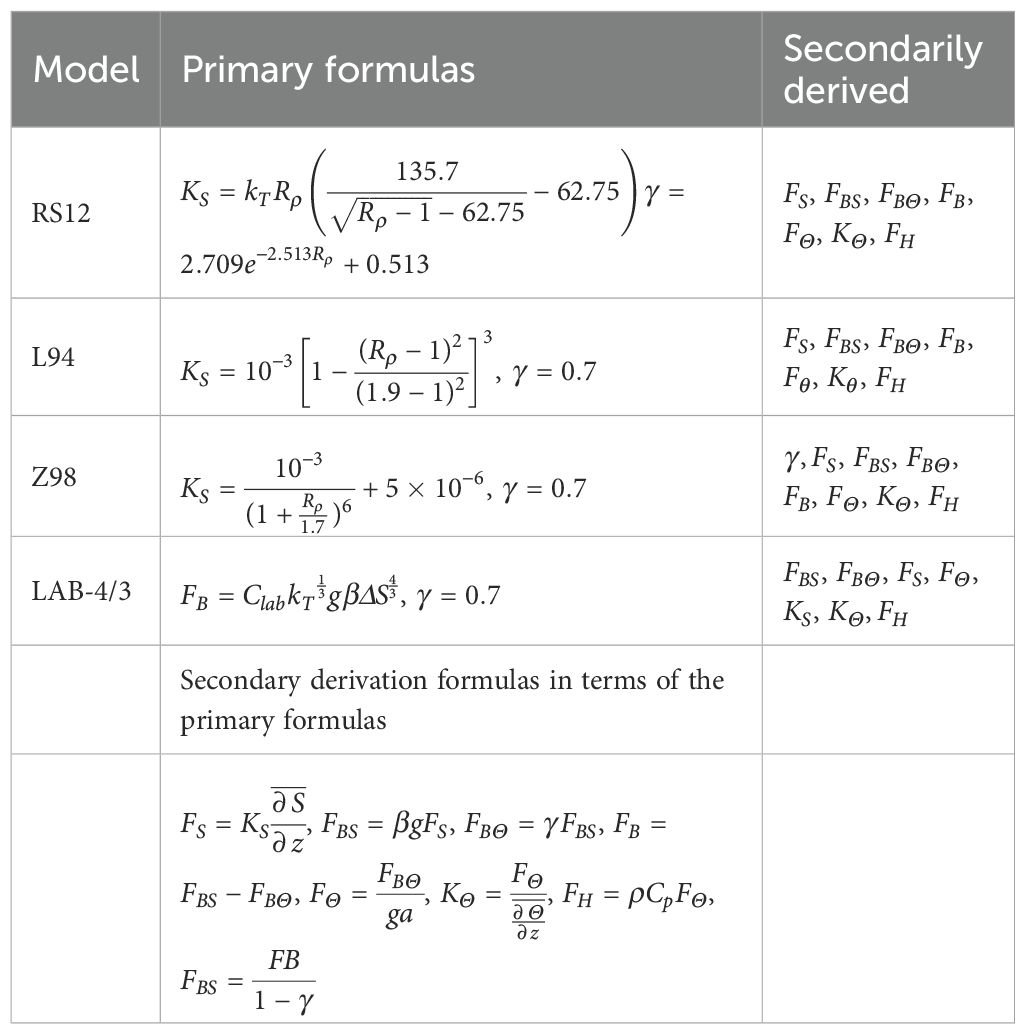
Table 2. Formulation of the SF_ThS Flux models of Radko and Smith 2012, (RS12), Large et al., 1994 (L94), Zhang et al., 1998 (Z98), and the lab-derived 4/3-power law (LAB-4/3).
The application of the semi-empirical models of L94, Z98 started off with calculation, per interface, of salt diffusivities , in terms of the background density ratio (a different formula per model). Subsequently, potential temperature diffusivities, could be determined in terms of and the flux ratio γ, which was taken constant and equal to 0.7, i.e. . Thereafter, in sequence, the fluxes of salt, , potential temperature, heat content, , and salt and heat components of buoyancy fluxes, and along with their resultant, total buoyancy fluxes , were calculated in terms of , and the interfacial, vertical gradients , of potential temperature and of salinity, as follows: ; ; , being the seawater density and the specific heat capacity; ; , and respectively being the coefficients of saline contraction and heat expansion of seawater, and the gravitational constant, and ultimately, . The application of the theoretical model RS12, followed the same methodological route as the afore-mentioned ones of L14 and Z98. The distinction in RS12 considered here was the calculation of in terms of , instead of assigning, as in L14 and Z98, the constant flux ratio value, =0.7. Finally, the use of model LAB_4/3 was initiated by the estimation of the total buoyancy flux , in terms of the interfacial salinity increase, . Thereupon, by using just as for L14, Z98, a constant value of flux ratio =0.7, we applied the following formulas in sequence: ; ; ; ; and finally, . Tables 1, 2, summarize the terminology and formulation of the four models.
The calculations derived smoothed out flux profiles of Potential Temperature (, Salinity, , Heat, (, and Buoyancy, ( versus depth . Fifty percent–overlapping sliding window means were implemented, using a width of 2 data points for the “thick interface” methods of Large (1994, L94), Zhang et al. (1998), Z98), and Radco and Smith (2012), RS12), and a width of 4 data points for the “thin interface” method, the 4/3 power law (LAB 4/3). The sliding window means resulted in smoothed flux profiles of 3 flux values, for the thick interface methods that processed the four major interfaces and of seven flux values, for the thin interface method of LAB 4/3 that processed the 10 thin (minor) interfaces of the SF_ThS. Finally, regression straight lines of optimal fit have been estimated.
3 Results
3.1 Monitoring the SF_ThS
The March 2023 CTD profile in the eastern Cretan Sea (red dot in Figure 1) revealed the existence of a well-defined SF_ThS (Figure 2). The background (or bulk) stability ratio, , calculated by linear regression on the data-curve within the depth-range between the local salinity maximum in the intermediate layer (250 dbar) and the local salinity minimum of the TMW core (1090 dbar) amounts to 1.53. If, on the other hand, the local salinity maximum at 546 dbar is used instead of the intermediate one at 250 dbar, then drops to 1.30. It should be noted here that in contrast to other Mediterranean regions where an intermediate salinity maximum is clearly discernible, this is not the case in the Cretan basin which is a source of intermediate water. The latter value of , is quite close to the one of 1.28 estimated by Bryden et al. (2014) for the respective and transition zone of the southwestern part of the WMed, or even to the values of of Taillandier et al. (2020) in the Tyrrhenian Sea and Algerian basin (1.32 and 1.38 respectively). Furthermore, linear regression of the profile segments between 546 and 1090 dbar produces bulk potential temperature and salinity gradients of = 16.29 ×10⁻⁴ °C m-1 and = 3.88 ×10⁻⁴ m-1 respectively. Between 746 and 901 dbar, five distinct layers with nearly constant temperature and salinity values were identified, interspersed with four interfaces. The layer and interface thicknesses ranged from 13 to 35 dbar and from 3 to 10 dbar, respectively. Table 3 summarizes the characteristics of the observed staircase.
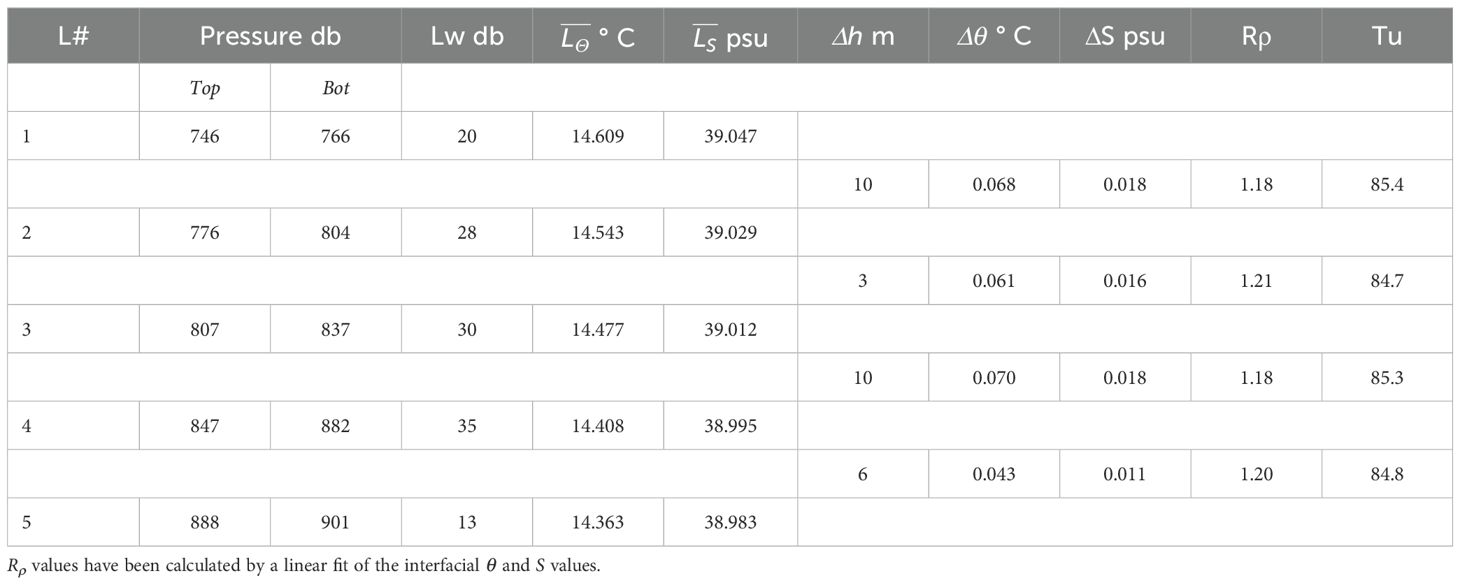
Table 3. Characteristics of the observed staircase in the Cretan Sea: layer sequence number (L#), pressure of layer top and bottom, layer width (Lw), and layer-averaged potential temperature and salinity , interfacial height, , trans-interfacial potential temperature and salinity differences, and ΔS, interfacial stability ratio and angle Turner, Rρ and Tu.
During the same month (March 2023), a SeaExplorer glider mission of HCMR sampled along a zonal track across the Cretan Sea, producing a total of 54 deep (down to 970 dbar) temperature and salinity profiles along this track. Thermohaline steps were observed only on the easternmost glider-CTD profile, located in close vicinity to the shipborne CTD profile with the SF_ThS. These profiles were sampled only two days apart (March 17 and March 19, respectively) and were separated by 9.2 km. As shown in Figure 3, only two steps are clearly identifiable in the glider-CTD profile. The first step appears between 734 and 753 dbar, followed by a 10 dbar interface, while the second step lies between 763 and 779 dbar.
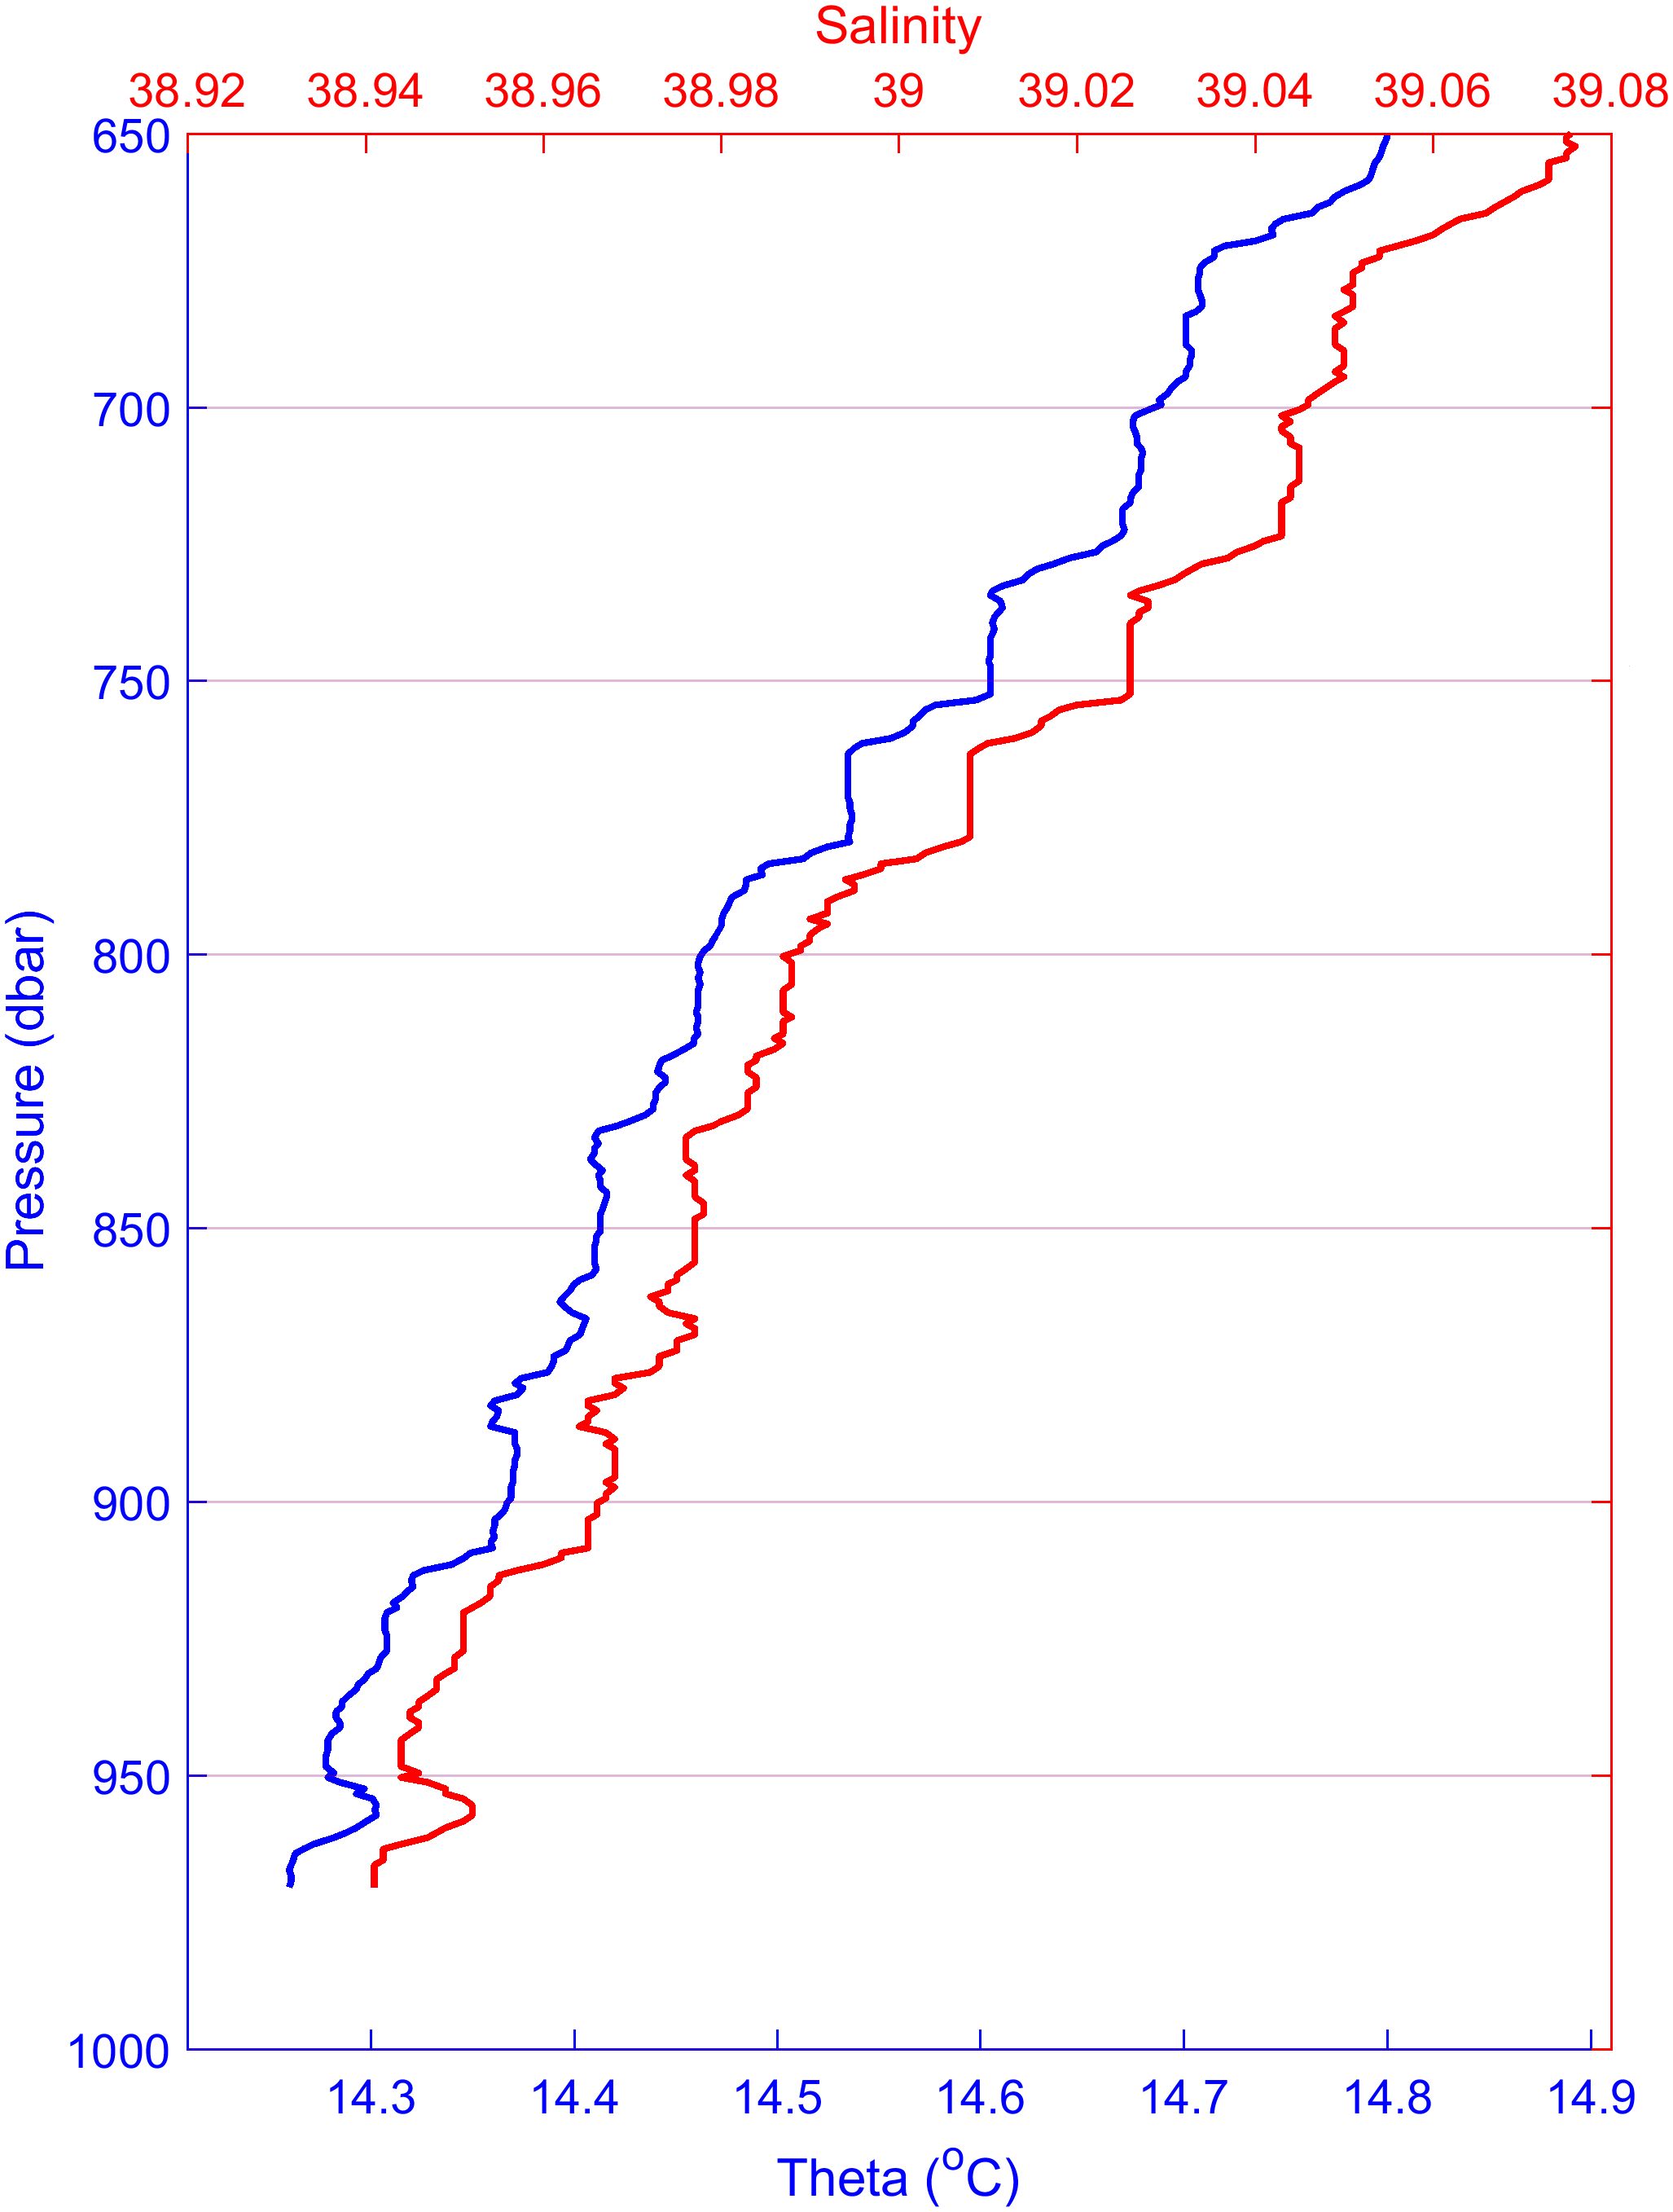
Figure 3. SeaExplorer glider cast of March 19th, 2023. Cast position: latitude 35° 46.47 N, longitude 026° 07.82 E. Potential temperature (theta) and salinity profile in the 650–970 dbar layer.
3.2 Fluxes and diffusivities of the SF_ThS. Comparisons with other studies
As visualized in Figure 1 of Kunze (1987), which models finger growth until their turbulent breakdown, the ambient gradients are modified by the fingers themselves during their growth, and steeper gradients emerge following finger collapse. Describing this process in a discretized time domain, the fingers’ growth within a given time step is based on background gradients developed by fingers grown during the previous time step and so forth. Thus, the substitution into the three density ratio () - dependent models (L94, Z98, RS12), of the values i = 1 to 4, for each of the 4 interfaces of the monitored SF_ThS, yields discrete profiles of fluxes and diffusivities versus depth, such as , respectively for salinity, that strictly refer to the background gradients at the time of monitoring (as Δt approaches zero).
Alternatively, the substitution of the previously mentioned bulk stability ratio over the depth regime (547 to 1090 dbar), which apart from encompassing the SF_ThS, extends further up/down to the two mass cores (LIW/CIW and TMW), has yielded bulk fluxes such as and subsequently bulk diffusivities, such as , wherein and accounts for the fact that the mixing-effective portion of the total bulk-salinity gradient, , lies only within the four interfaces of height rather than within the whole staircase regime of depth , as suggested by Bryden et al. (2014).
The calculations of the flux profiles are tabulated in Table 4 and visualized in Figure 4, while the diffusivity calculations are tabulated/visualized in Table 5 and Figure 5 respectively. One can confirm in the latter figures that the bulk and interfacial values of both fluxes and diffusivities are in relative agreement. The three models that are dependent on the stability ratio/gradients of the interfaces of the SF_ThS, yield diffusivity profiles (e.g., for salinity) that are relatively constant with depth, in contrast to the flux profiles which on average exhibit a tendency of weakening downward fluxes with depth, especially when the latter fluxes are smoothed by a two-point running mean. Particularly, the latter convergence of the smoothed flux-profiles is largely shaped by the influence of the positive flux overshoot at the second interface of the depth regime (804 - 807 dbar) on the running mean. For example, focusing on the salinity fluxes, of the latter interface is much larger than , and as can be clearly seen in Table 5. This occurs because is much larger than for the other interfaces. Indeed, the second interface has a height 2 – 3 times smaller (3 m, compared with 10 m, 10 m, and 6 m for the other three interfaces), while exhibiting comparable across-interface property variation ( for salinity). This gradient sharpening is crucial for enhancing mixing via the downward transport of the salinity surplus and its respective flux, as emphasized by Bryden et al. (2014). Among the three stability-ratio-dependent models, L14 and Z98 predict almost identical flux and diffusivity profiles, while RS12 yields smaller values, albeit all of them reproduce the overshooting of the second interfacial flux (Table 5). This overshooting is not reproduced by the LAB_4/3 model, since the flux estimation of this model is independent of the aforementioned gradients and is instead based on thin (minor) interfaces within the four major ones.
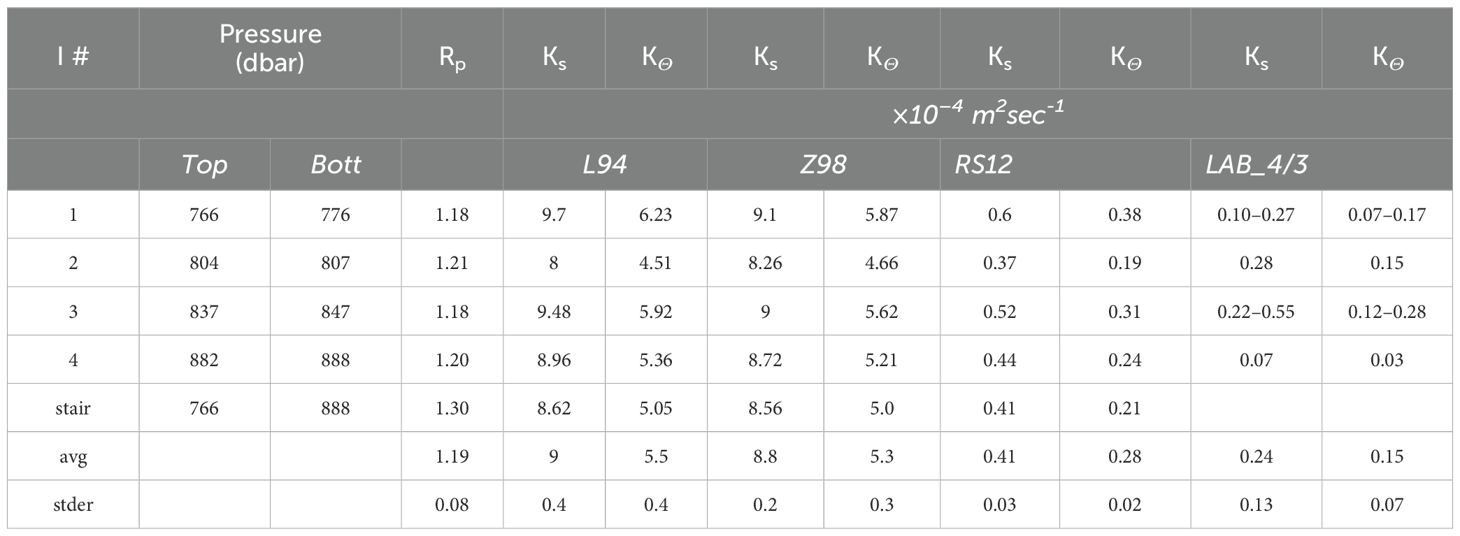
Table 4. Vertical salt and heat diffusivities , , over interfaces 1 to 4 and over the whole staircase, along with average interfacial (avg) diffusivities with 95% confidence interval (stder).
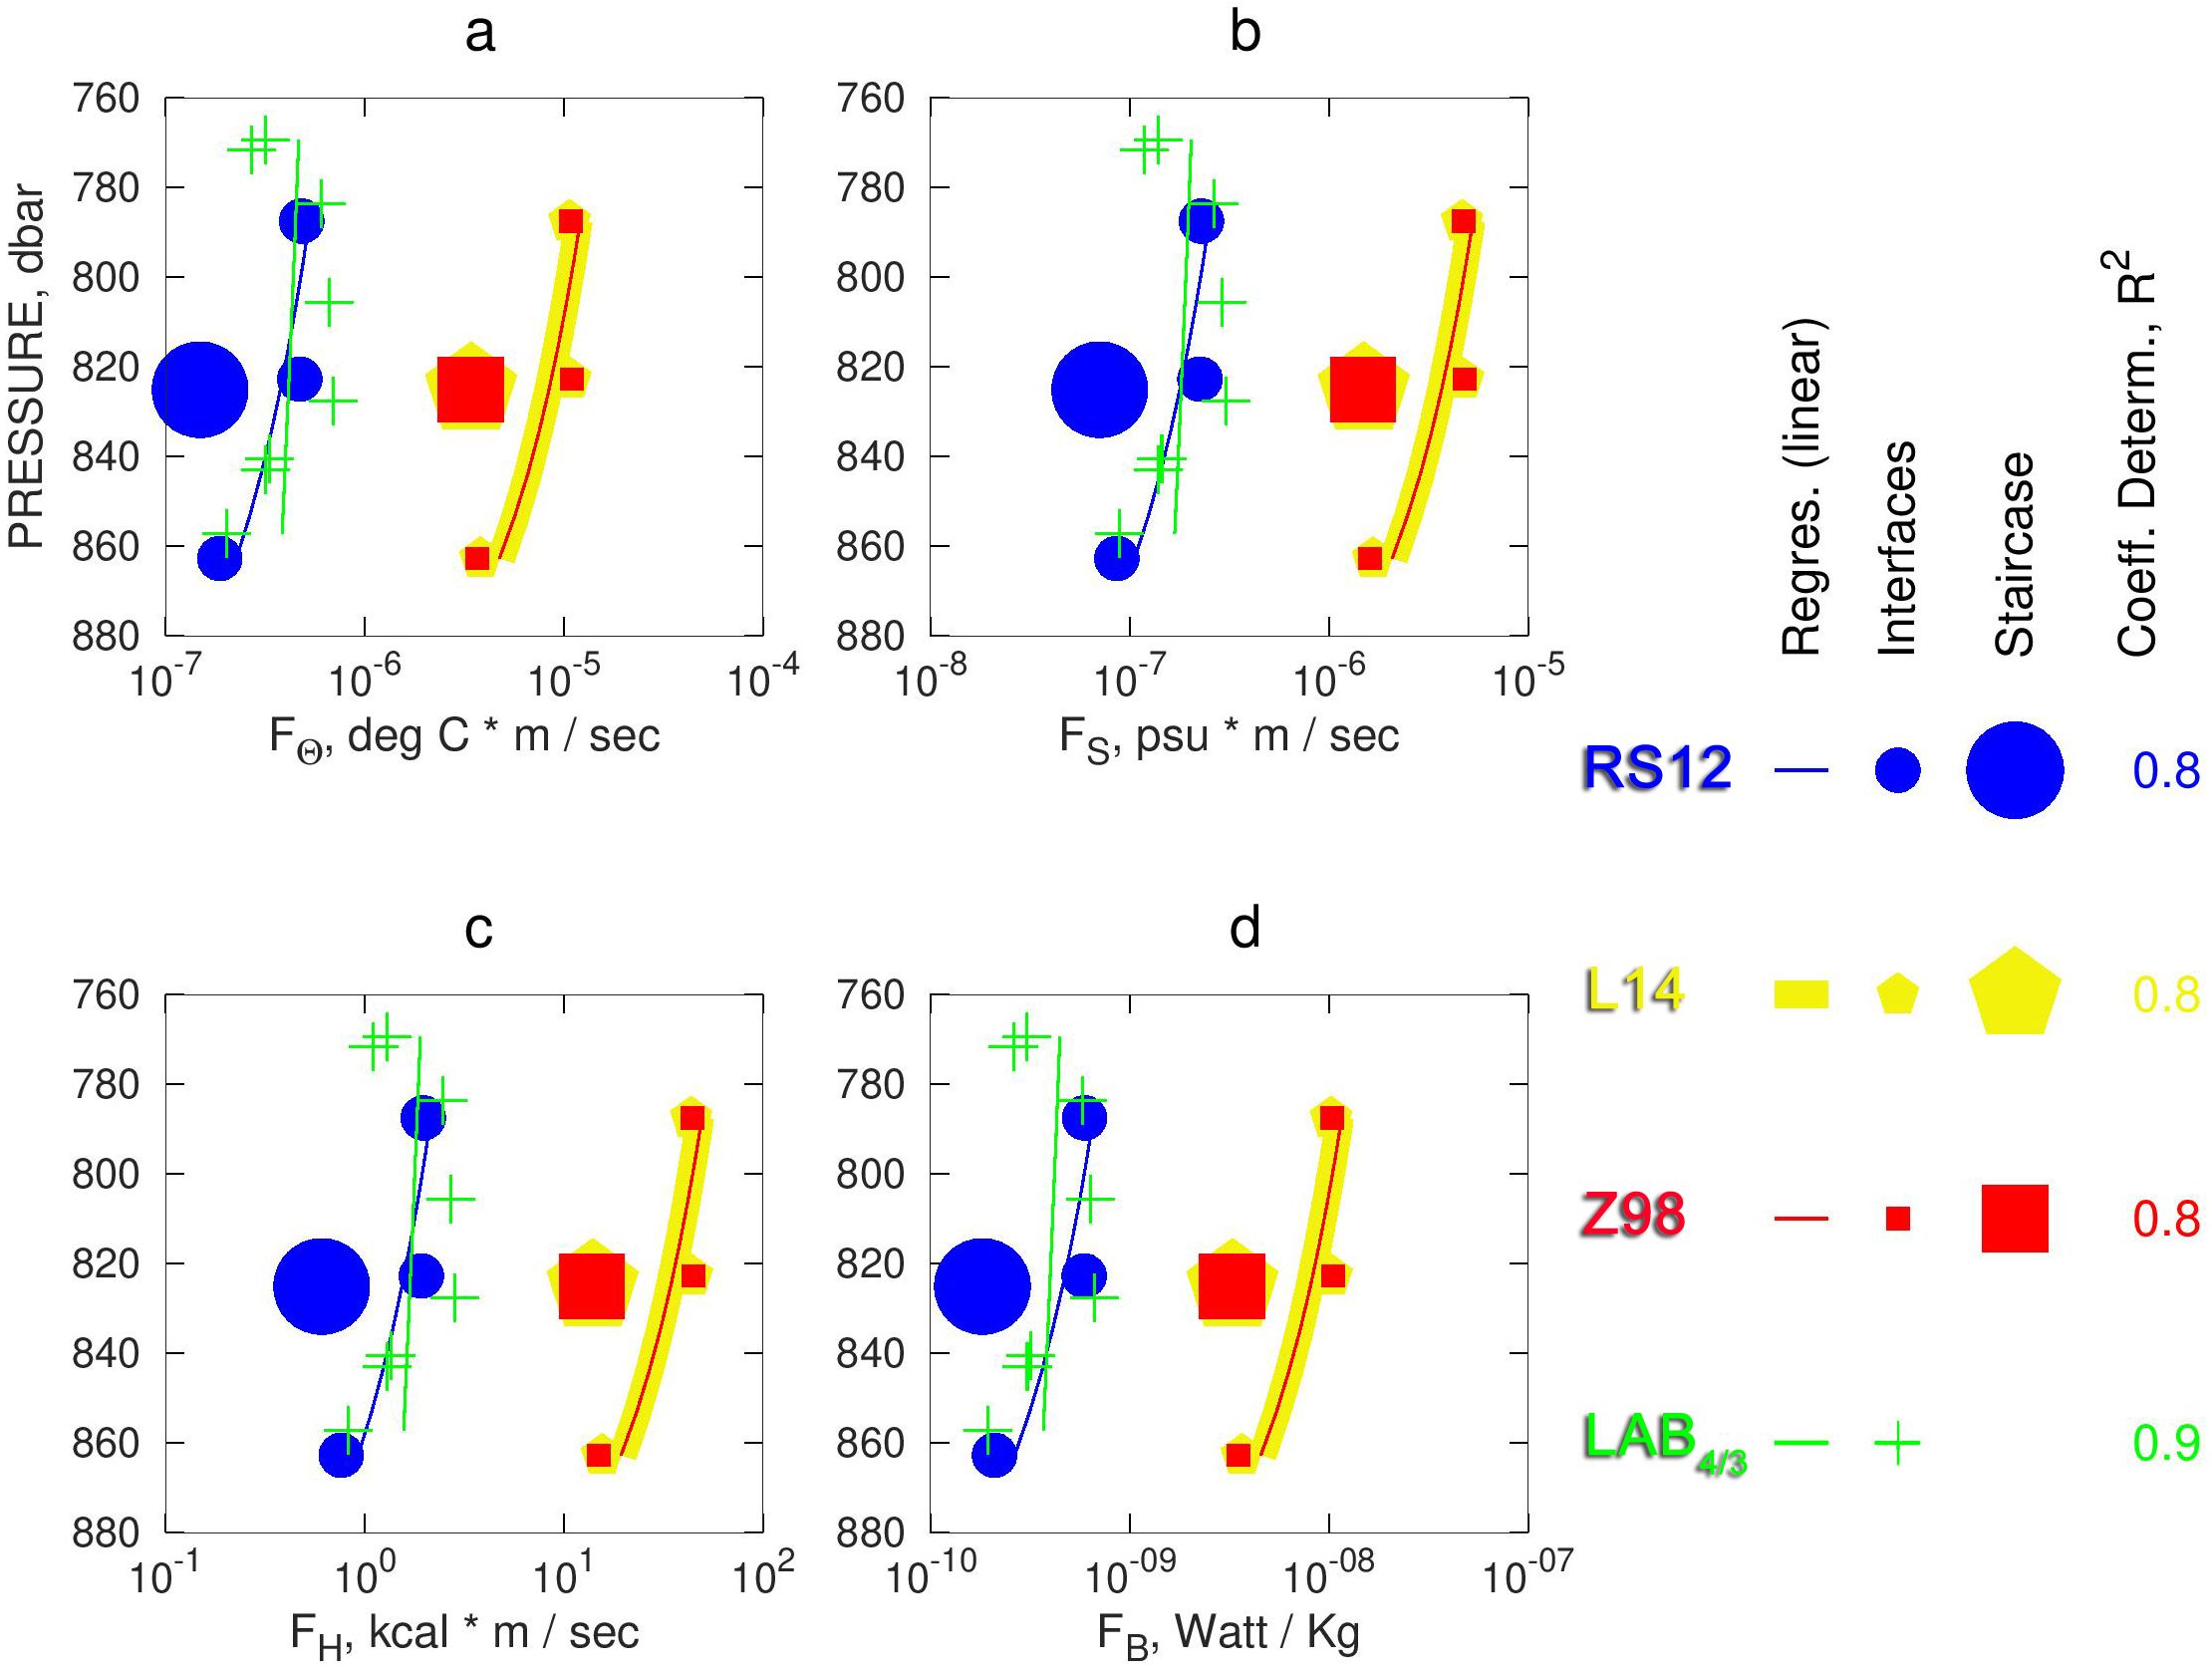
Figure 4. Panels (a–d) show for each of the four models (Large et al, 1994 (L94), Zhang et al., 1998 (Z98), Radco and Smith, 2012 (RS12), 4/3 power law (LAB 4/3)) the moving-averaged flux values (small symbols) of Potential Temperature (, salinity, , heat, (, and buoyancy, ( versus depth . The larger symbols represent the single, per-model predictions over the whole SF-TS for three of the four models (excluding LAB_4/3). Overlaid are regression lines of optimal fit (the logarithmic x-axis visually attenuates the negative curvature). Different model estimations are shown with distinct markers and colors. The numbers are the values.
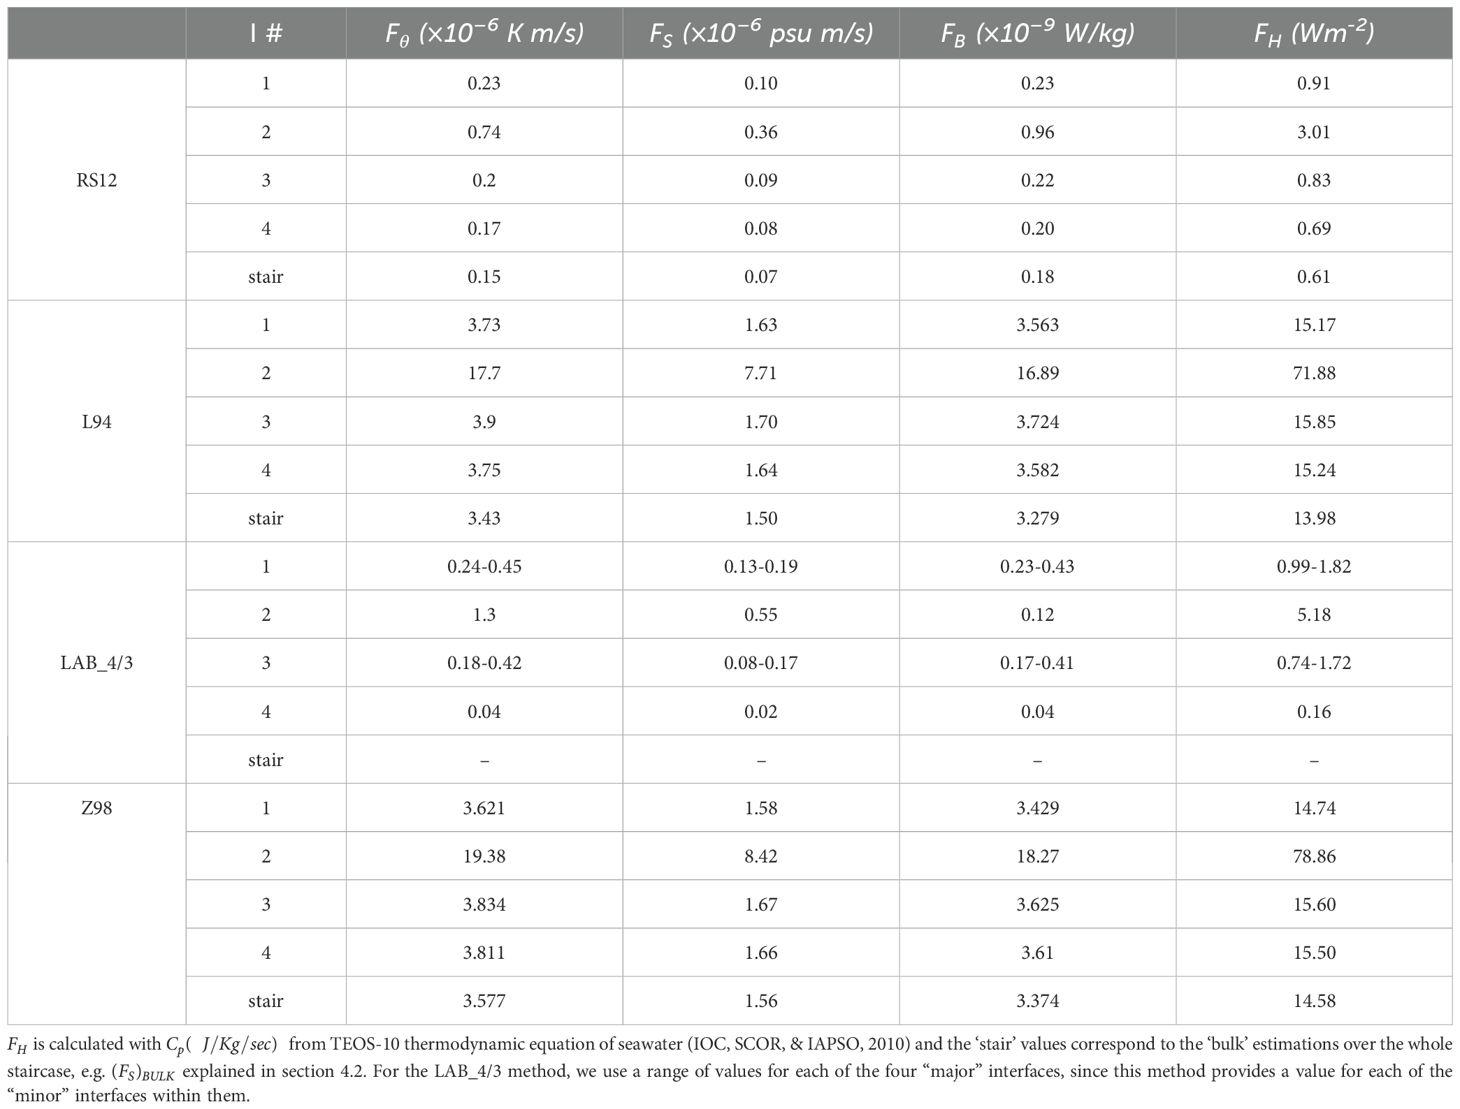
Table 5. Downward fluxes of potential temperature, salt, buoyancy, and heat ( ) in the interfaces.
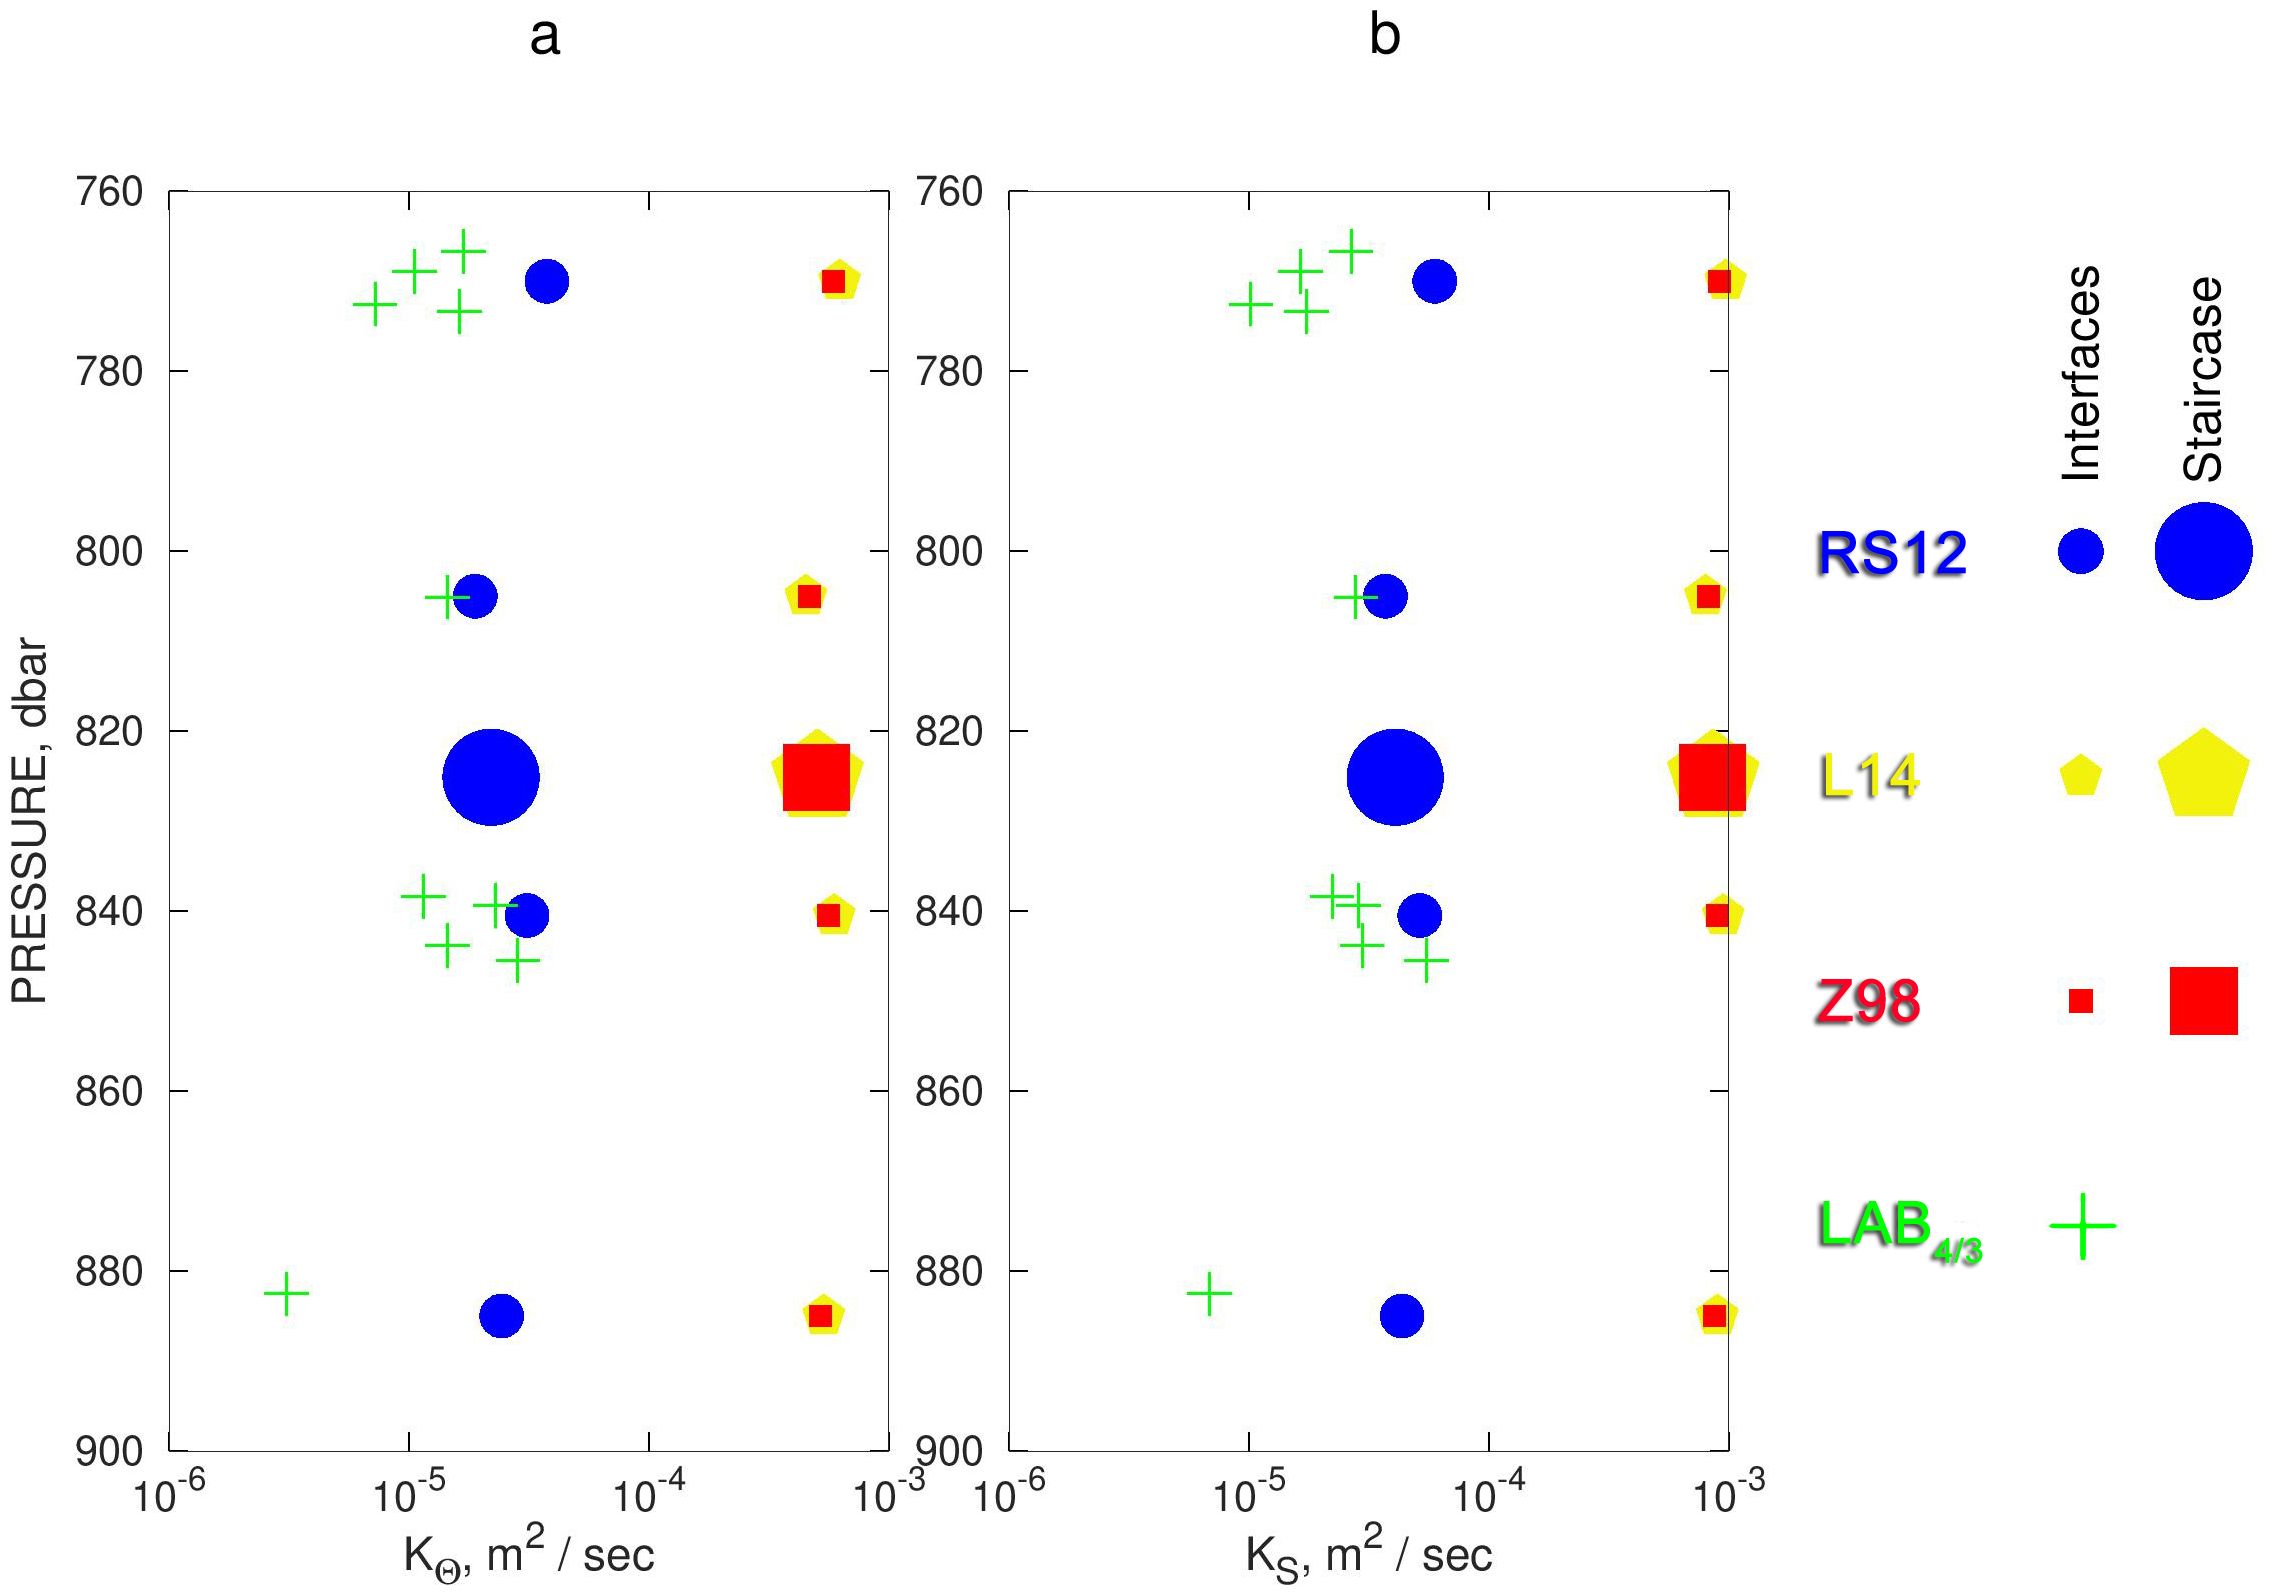
Figure 5. Interfacial diffusivity profile predictions (small symbols) of the four models (RS12, L14, LAB_4/3 and Z98), for potential temperature (a) and salinity (b). The large symbols represent the single, per-model predictions over the whole SF_ThS for three of the four models (excluding the LAB_4/3).
3.3 The susceptibility of the Cretan Sea to salt fingering and SF_ThSs
Using the whole glider dataset, the Turner angle was calculated for each sampling depth in the layer between 250 dbar and the end of each cast. The ceiling of this layer is taken as a typical LIW depth inside the Cretan Sea, while the layer floor corresponds to the maximum glider deployment depth of 970 dbar, which is as close as possible to the TMW core. A histogram showing the normalized distribution of the Turner angle from the glider dataset is presented in Figure 6.
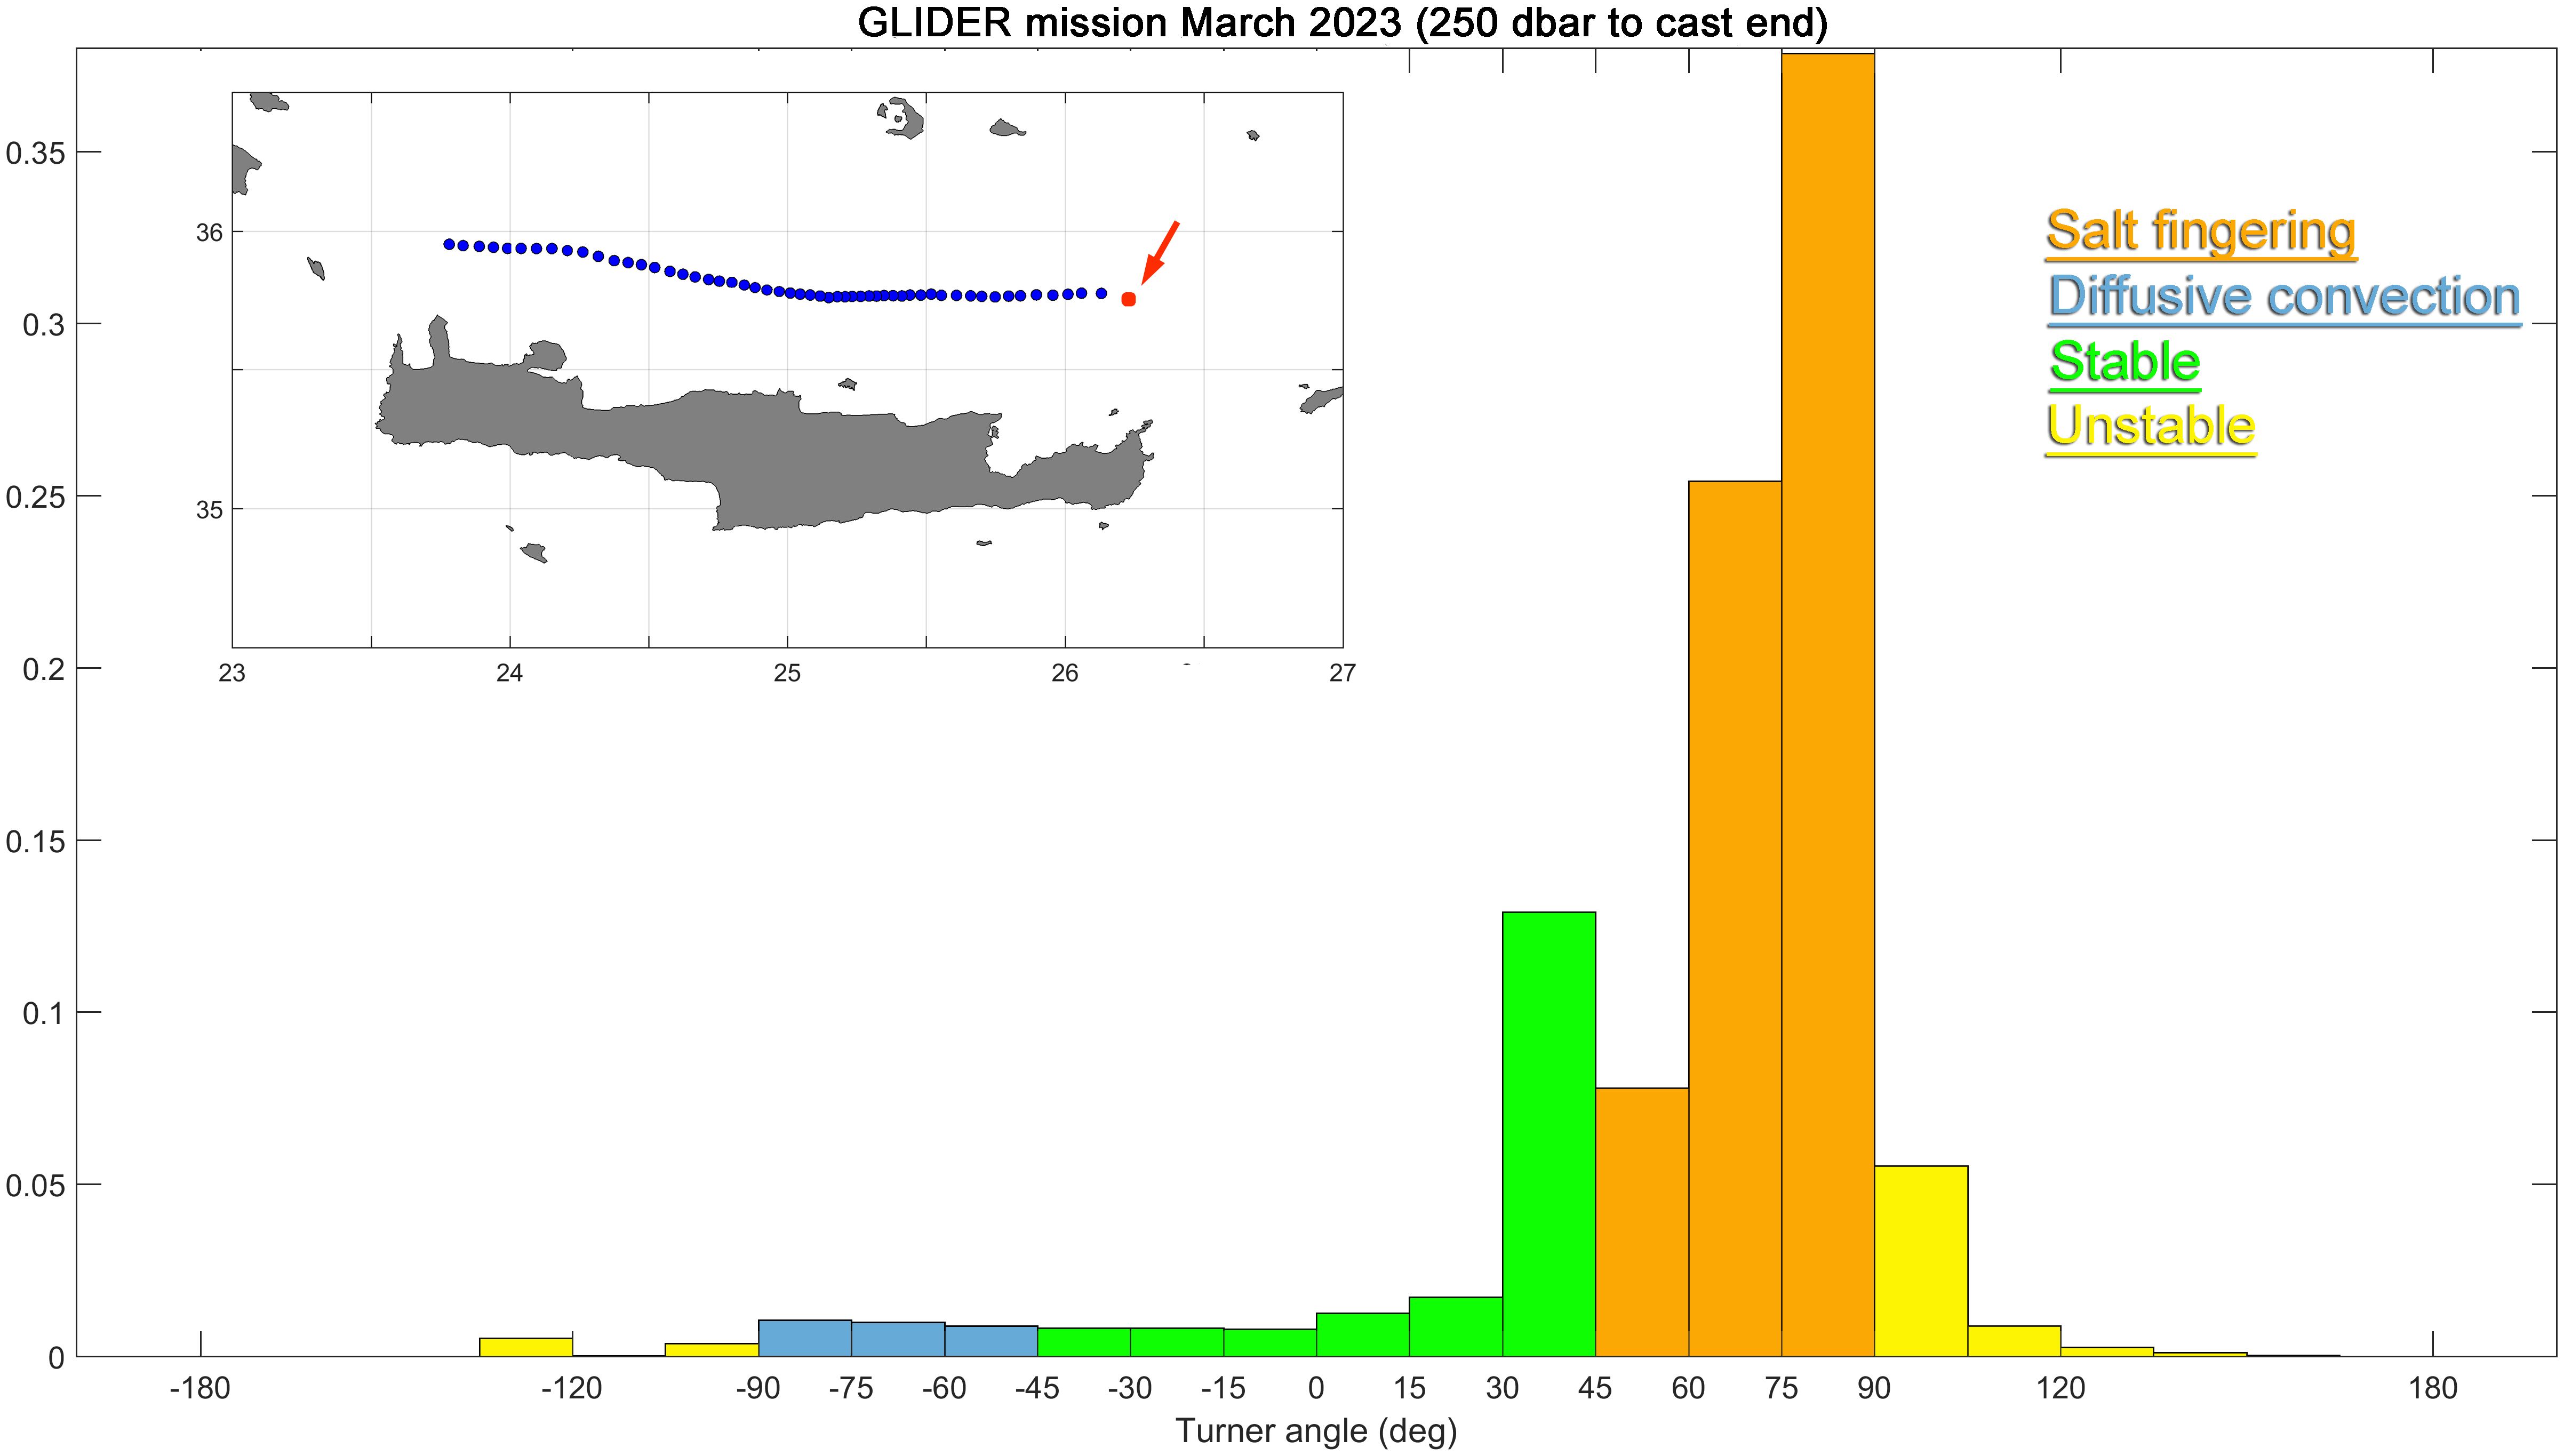
Figure 6. Normalized distribution of the Turner angle in the 250-dbar to end-of-cast layer from the March 2023 HCMR glider dataset. The histogram is divided into 15° segments. Salt fingering, diffusive convection, stable conditions, and unstable conditions are shown in the inset color legend. The inset map shows the position of the glider profiles. The red arrow indicates the position of the shipborne CTD cast shown in Figure 2 relative to the glider profiles.
To investigate the hydrological status of the Cretan Sea during the last decade with respect to the basin’s proneness to double diffusion, shipborne CTD profiles from three different cruises (2016, 2019, and 2021) in the Cretan Sea were examined. These cruises were selected because they collected data along a west-to-east transect, covering most of the open Cretan Sea longitude. For each cruise, we calculated the Turner angle at each sampling depth in the layer between 250 dbar and the deep salinity minimum corresponding to the TMW core. In the EMed, where the upper layers are mostly covered by very saline waters (Velaoras et al., 2019), it is not possible to identify a clear local intermediate salinity maximum corresponding to LIW/CIW masses, in contrast with the WMed, where the upper layers are mostly occupied by low-salinity Atlantic Water (Taillandier et al., 2020). Hence, the upper limit of 250 dbar was chosen as a typical intermediate layer depth in the basin. Density at this depth varied between ~29 and 29.1 kg/m³, i.e., well within the intermediate layer. Since the TMW core depth shows interannual variability (Velaoras et al., 2015), the deeper limit for Turner angle calculation was identified separately for each cast. The mean TMW core depth was 702 dbar in the 2016 dataset, 831 dbar in 2019, and 961 dbar in 2021; these respective depths were taken as the deeper limits. Figures 7a, b present salinity profiles and their positions in the Cretan Sea sampled during the aforementioned cruises. The 250-dbar horizon can be seen to represent a typical intermediate local salinity maximum denoting LIW. The mean TMW core depth for each cruise, corresponding to the mean salinity-minimum depth between 600 and 1,100 dbar, is also shown in the figure. This core depth has deepened between 2016 and 2021. Histograms presenting the normalized distribution of the Turner angle from the three cruises are shown in Figure 8. Although the cruise transects inside the Cretan basin were geographically close (see Figure 1), variations in the distribution of Turner angle values were observed. Specifically, 71% of the glider data (March 2023) lie in the salt fingering zone (45°–90°), while 38% of the dataset corresponds to strong salt fingering (75°–90°). The respective percentages for the other cruises are: 79% and 45% for the 2016 dataset, 78% and 42% for 2019, and 85% and 47% for 2021.
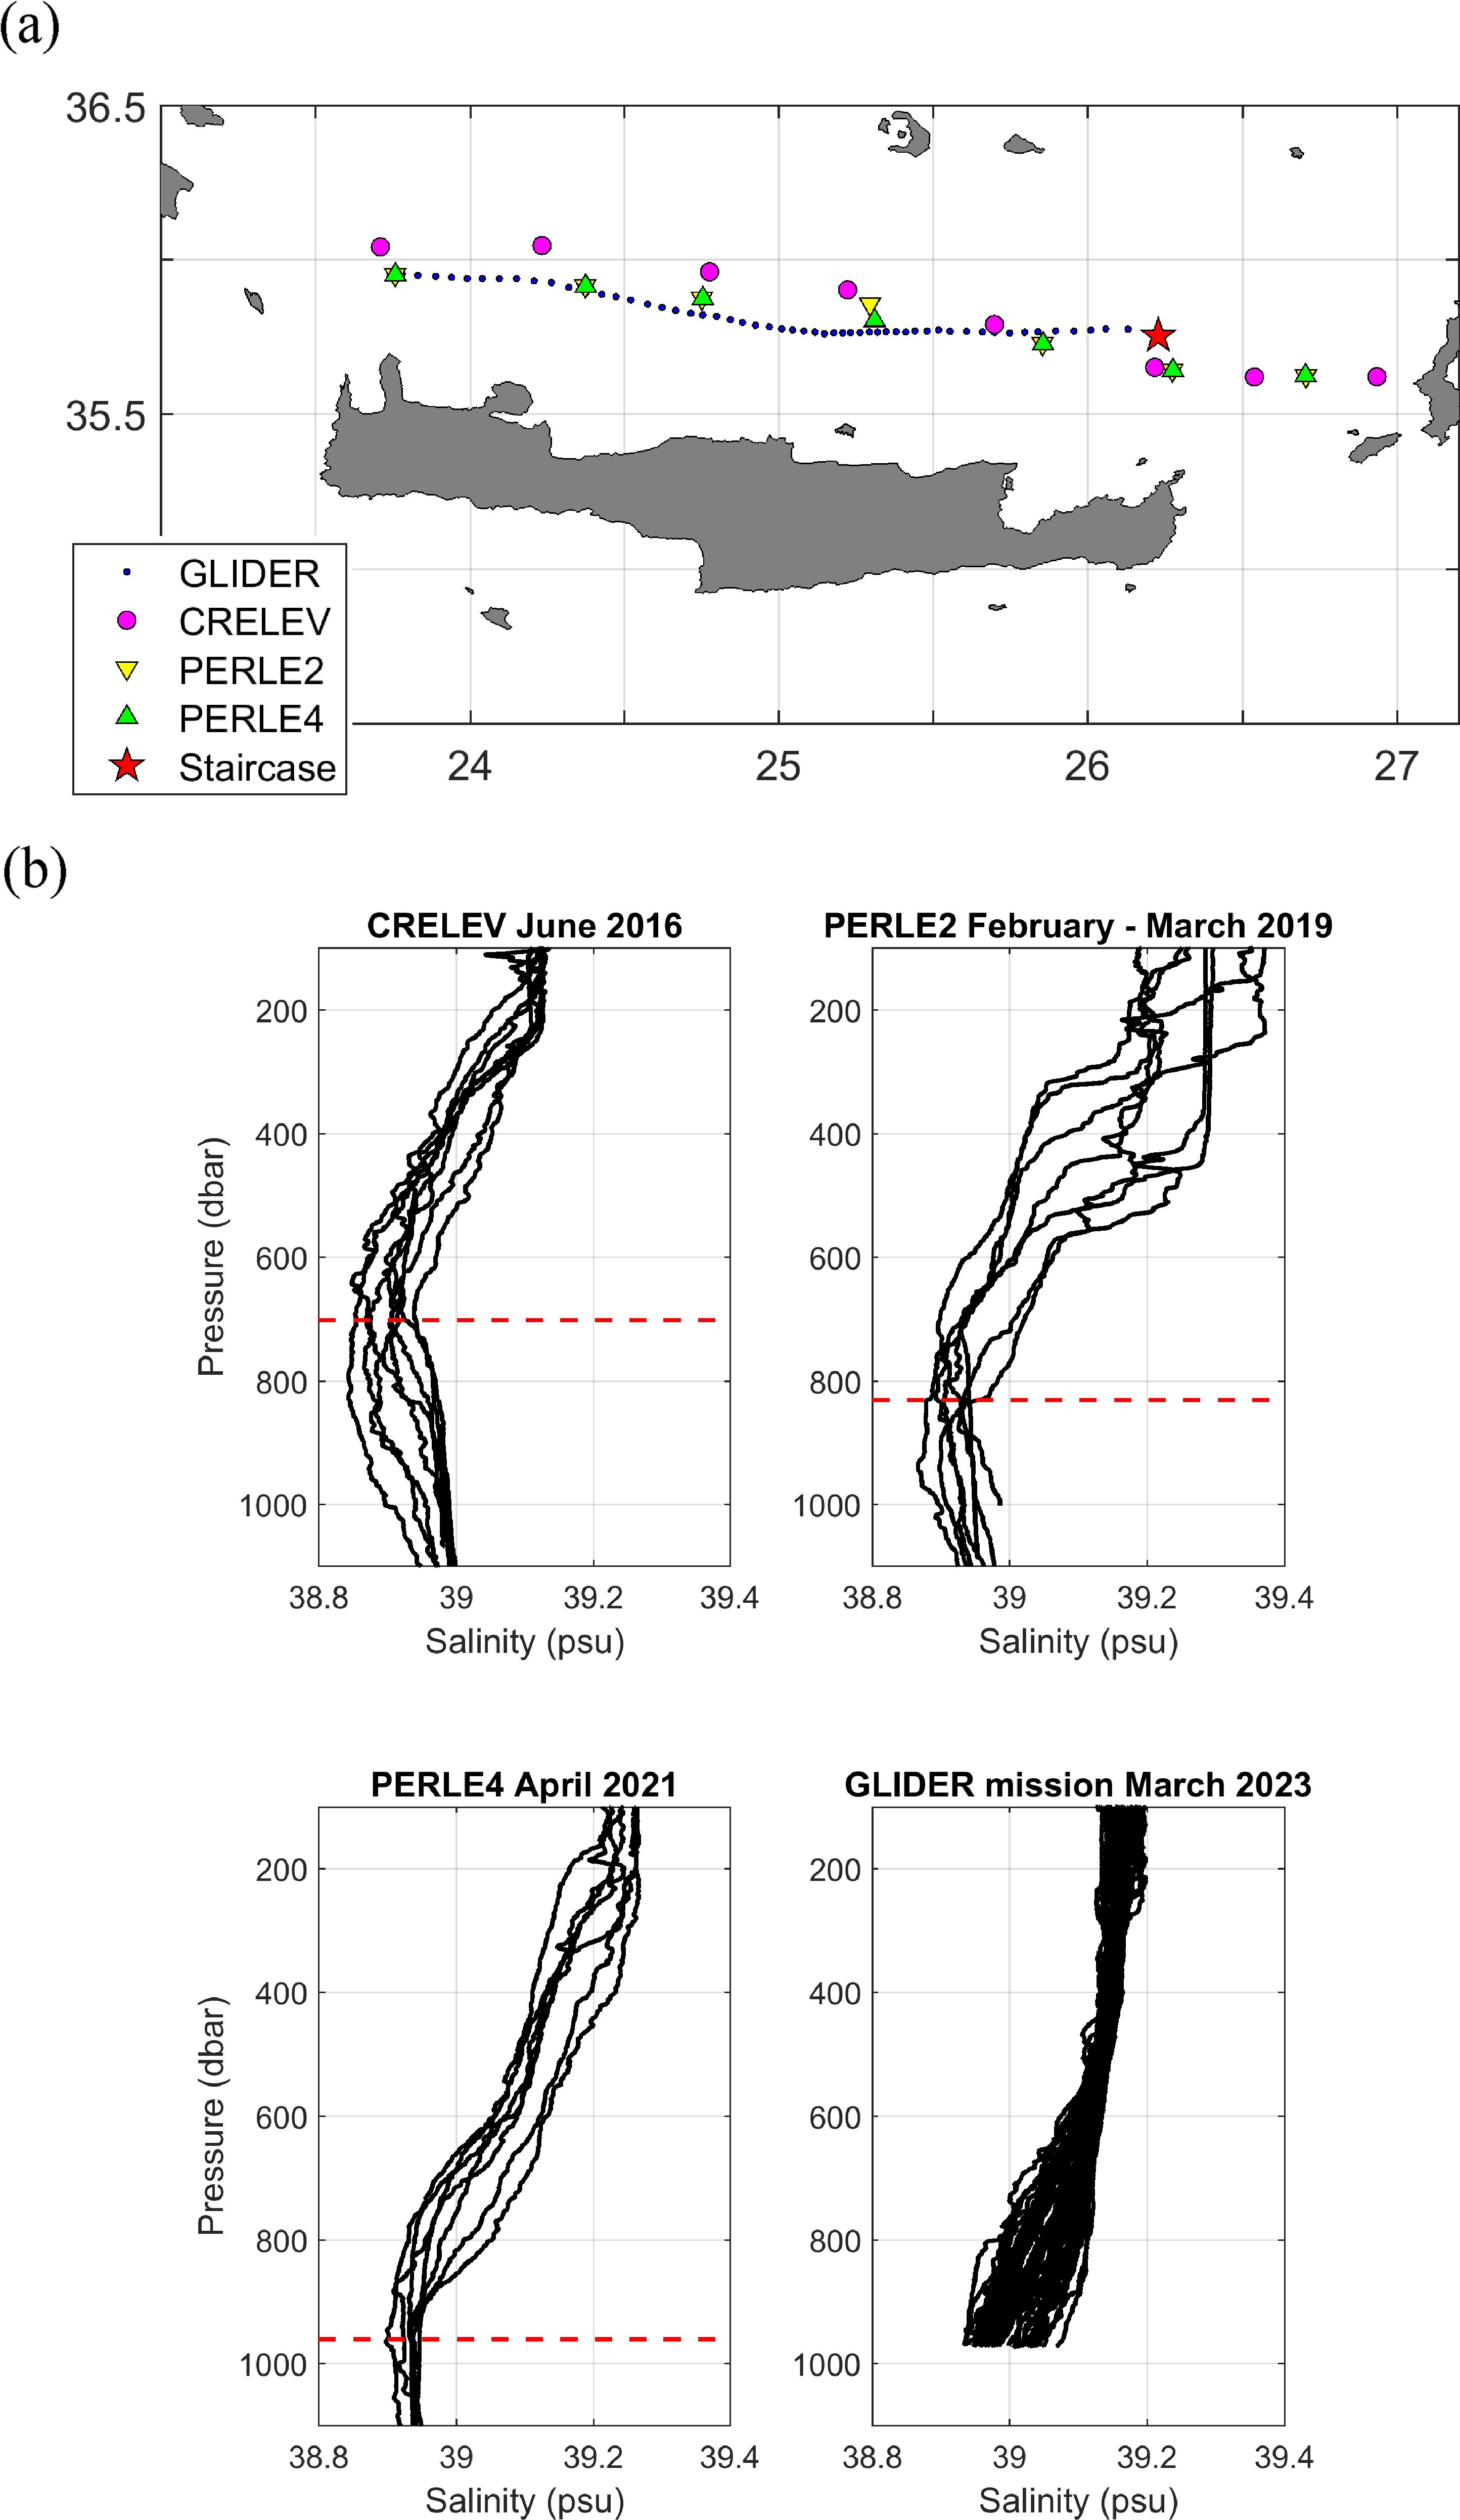
Figure 7. (a) Sampling sites of the CRELEV, PERLE 2, PERLE 4, and glider cruises in the Cretan Sea. The observed salinity staircase site shown in Figure 1 is also indicated. (b) Salinity profiles of the CRELEV, PERLE 2, PERLE 4, and glider cruises in the Cretan Sea. Data between 100 and 1,100 dbar are shown. Red lines denote the mean TMW core depth (local salinity minimum) for each cruise. For the glider data, profiles are restricted to 970 dbar, the maximum deployment depth of the glider. This was shallower than the TMW core, and therefore the local salinity minimum was not reached.
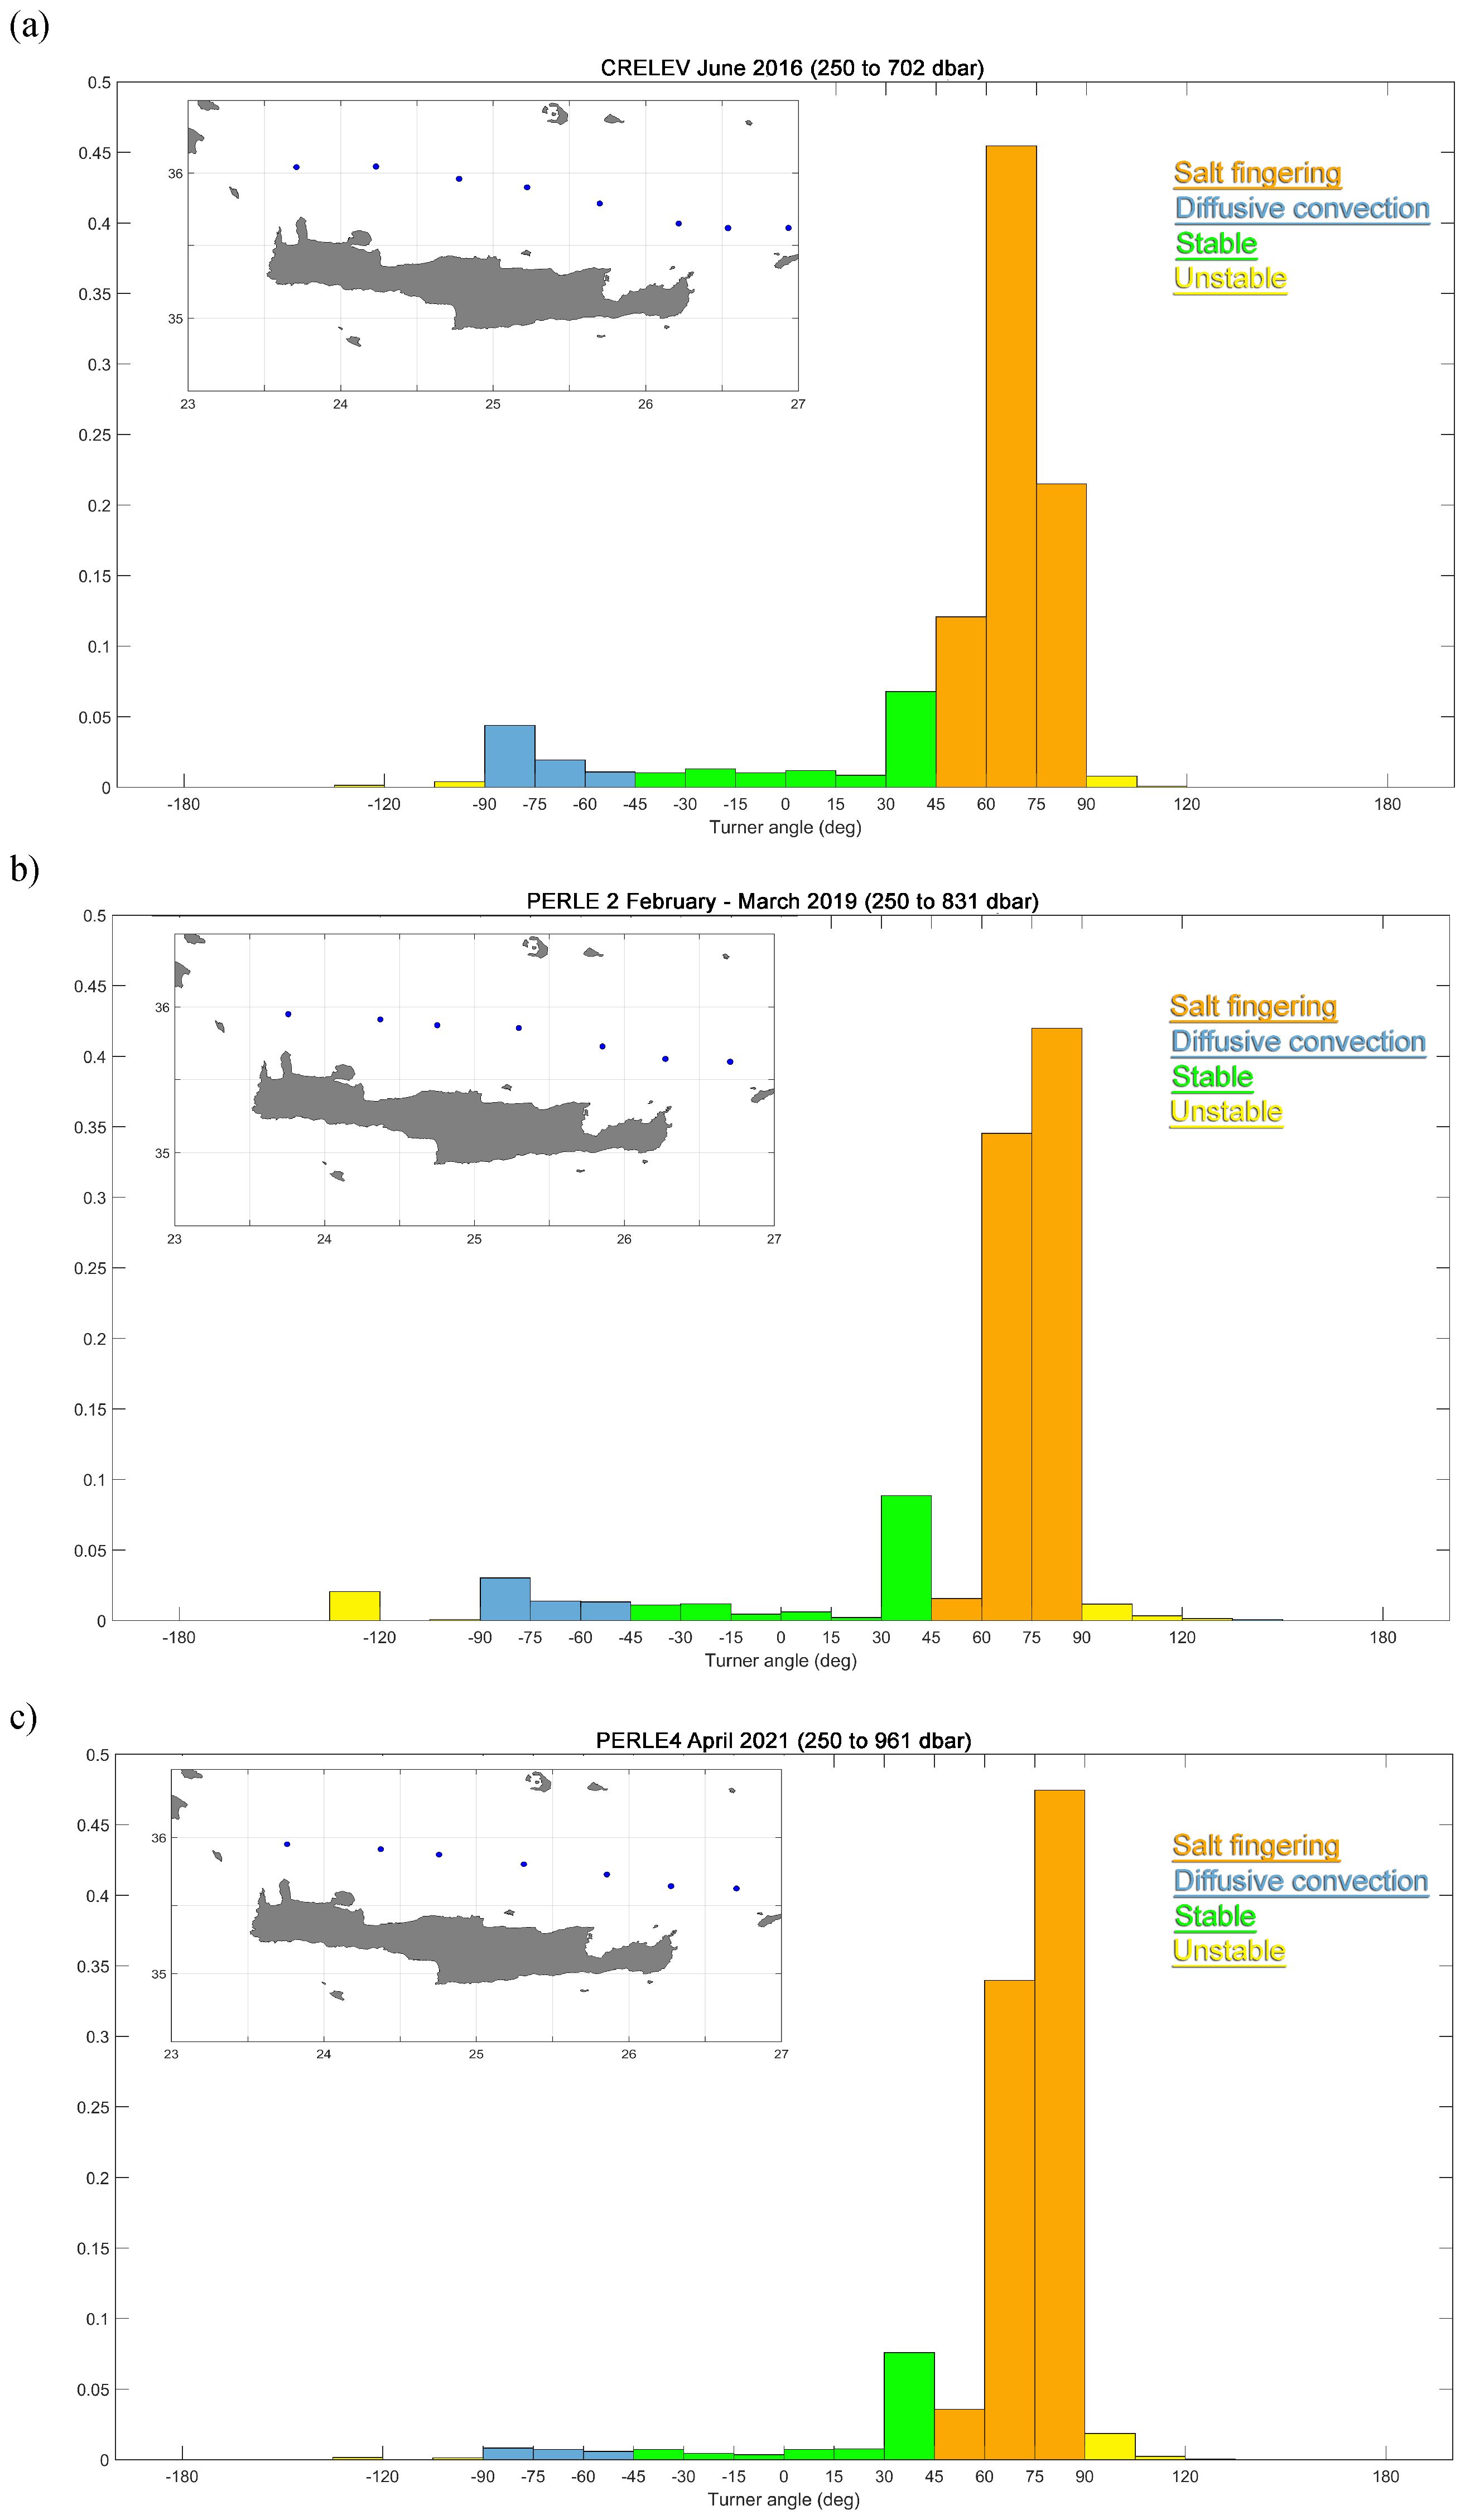
Figure 8. Normalized distribution of the Turner angle from 250 dbar to the deep salinity minimum corresponding to the mean TMW core depth for the following: CRELEV 2016 cruise (a), PERLE 2 2019 cruise (b), and PERLE 4 2021 cruise (c). The histogram is divided into 15° segments. For color coding, refer to the inset legend.
4 Discussion and conclusions
As already mentioned, the water mass distribution in the Cretan Sea—i.e., warm, saline LIW/CIW overlying cold, less saline TMW—favors salt fingering processes at the interfaces between these water masses. This is supported by the analysis of Turner angle distributions of in situ data presented here, where cruise data spanning 2016–2023 show that more than 70% of the layer between the intermediate water and the TMW core is prone to salt fingering. However, the occurrence of a thermohaline staircase in the Cretan Sea is rarely reported, previously documented only once (Kioroglou et al., 2014). The staircase presented here, analyzed in the context of its surrounding water masses, therefore provides a valuable additional contribution to knowledge of EMed staircases. It also warranted multiple estimations of staircase fluxes and diffusivities, derived from four well-established models selected for this study: LAB_4/3, RS12, L14, and Z98.
Overall, LAB_4/3 predicted fluxes and diffusivities similar to those of RS12. The average , values for the Cretan Sea in 2012–2013, (see in Kioroglou et al., 2014; Figures 8, 9, Table 1) amounted to 0.12-0.16 m2/s and m2/s respectively, which, if compared to diffusivities of the four models herein, fall nearest to the RS12 (and LAB 4-3) estimates, e.g., the RS12’s values are larger by a factor of 3, while if compared to the estimates of the other three models, the Kioroglou et al. (2014) values are between one and two orders of magnitude smaller. Furthermore, comparison of the derived estimates with values obtained from recent extended microstructure observations of salt fingers in the Western Mediterranean (Ferron et al., 2021) was quite revealing. Our RS12 and LAB_4/3 estimates agreed closely with values reported for several areas in the western basin, whereas estimates from the other models were almost one order of magnitude higher.
Additionally, the buoyancy fluxes predicted by the models ranged from 10-10W/kg (RS12 and LAB_4/3) to 10-8 W/kg (L14 and Z98). Our LAB_4/3 predictions are one order of magnitude smaller than those obtained in the framework of a major SF-TS monitoring experiment in the western tropical North Atlantic, the C-SALT project (Schmitt et al., 1987; Gregg and Sanford, 1987; Lueck, 1987; Marmorino et al., 1987). Our RS12 estimates of buoyancy fluxes also aligned more closely than the other models with those of Ferron et al. (2021) in the Western Mediterranean. Profiling microstructure measurements Gregg and Sanford (1987) within the framework of the C_SALT experiment indicated rather low dissipation rates ~ 10-10 W/Kg within the homogeneous layers of the local SF_ThSs in the Caribbean Sea (Barbados). Given that in areas of prevailing buoyant convection, such as SF_ThSs, turbulent dissipation rates are expected to balance buoyancy fluxes (Tennekes and Lumley, 1972; Stern, 1976; Larson and Gregg, 1983), we conclude that these microstructure measurements of agree with the RS12 and LAB 4/3 predictions of buoyancy fluxes for the SF_ThS under study, while appearing as underestimates when compared with predictions from the other models. The RS12 and LAB 4/3 predictions of low buoyancy fluxes/low dissipation rates seem to be further confirmed by the observed lack of persistence of the SF_ThS. This lack of persistence is demonstrated by the short duration of the staircase, first detected in March 2023 during a cruise under the MSFD monitoring program. If one disregards the absence of sampling between April 2021 (PERLE 4 cruise) and March 2023 (MSFD cruise)—which could potentially extend the duration of the phenomenon backward in time—the staircase was absent in subsequent surveys. Specifically, it was not detected during the MSFD cruise in September 2023 nor during sampling conducted in the same area in April 2025 under the CLIMPACT project (unpublished data). Previous research has linked low buoyancy fluxes within SF-TSs to pronounced tilting of the fingers, with the tilting attributed to strong vertical shear of horizontal velocity. Shear-induced finger tilting attenuates vertical turbulent buoyancy fluxes, which are both necessary and sufficient to sustain an SF-TS Gregg and Sanford (1987). Moreover, shear decreases the Richardson number sufficiently for turbulent instabilities (overturns) to emerge and disrupt the staircase (Kunze, 1987). These conditions appear to characterize the environment of the present SF-TS, as the area is strongly affected by vertical shear between the LIW/CIW layer and the deeper TMW layer (see Velaoras et l, 2014; Velaoras et l, 2015; Velaoras et al, 2021, and references therein). Finally, turbulence induced by other factors, such as breaking internal waves, could further hinder SF-TS development and persistence. In assessing turbulent mixing in a nearby region, Gregg et al (2012) reported very low background eddy diffusivities (on the order of 10–6 m2s-1) away from steep topographic features and related turbulent “hotspots.” These low mechanical turbulence estimates may indeed provide the calm conditions required for the occurrence and viability of double diffusive phenomena. In summary, a more extensive time series of SF-TS observations from the Cretan Sea is needed to enable definitive conclusions.
In any case, SF-TS occurrences are important for the hydrology and climatic variability of the Cretan Sea. As salt fingering transports salt toward deeper layers, this double diffusive process can contribute to the gradual erosion—at least of the upper part—of the TMW low-salinity core within the Cretan Sea. This process drives the core to greater depths with increasing salinity values, as reported by Velaoras et al. (2015). However, salt fingering has an even more important effect, particularly in relation to climate change. According to long-term climatic studies (see Chiggiato et al., 2023, and references therein), sea surface temperature in the EMed has increased by ~0.04°C per year since the 1980s, accompanied by a parallel salinity rise of ~0.008 per year in Levantine Basin surface waters and ~0.005 per year in LIW since the 1970s (Ozer et al., 2017). These trends have likely moderated the relative strength of the background buoyancy gradients , in favor of a net decrease of the density ratio between the warm and saline surface/intermediate layers in the Cretan Sea and the deeper TMW layers. Thus, SF-DDCs are expected to become stronger and consequently act to mitigate the climate change footprint on the marine system, as argued by Johnson and Kearney (2009). SF-DDCs remove salt from shallower layers and transport it to deeper ones, thereby moderating the long-term trend of salinity increase at the salt “removal” depths and acting as a negative feedback mechanism to the climatic trend. As observed in the WMed (Durante et al., 2021), vertical heat and salt fluxes in the Tyrrhenian Sea staircases have intensified after 2010, following the T and S trends in the characteristics of intermediate water imported from the EMed. Since the Cretan Sea is an intermediate water formation area, local double diffusion phenomena will affect the LIW/CIW properties, which in turn will influence the intermediate water characteristics in the Tyrrhenian Sea, where they will again be subjected to double diffusion. In other words, double diffusion in the Cretan Sea can act as a preconditioning factor affecting the strength of DDC in the WMed.
Moreover, the upward buoyancy flux induced by the vertical motions of the fingers increases stratification, which in turn impedes dense water formation. This hindrance may reduce the role of the Cretan Sea as one of the most important dense water sources of the EMed, despite the invariable winter heat loss observed over the basin since 1950 (Josey and Schroeder, 2023). Furthermore, the salt fingering–induced increase in stratification in the upper water column may suppress vertical mixing, thereby intensifying heating of the upper layers by air–sea fluxes and amplifying extreme events associated with high sea surface temperatures (Kilicarslan et al., 2021; Martínez et al., 2023; Khodayar et al., 2022).
An additional effect of salt fingering in the Cretan Sea concerns nutrient supply to the intermediate water. In particular, SF-DDCs induce a net upward nutrient flux, thereby steepening the positive (increasing with depth) vertical nutrient gradient recorded by Pavlidou et al. (2020) in the layer between LIW/CIW and TMW. Specifically, ascending and descending fingers generate antagonistic nutrient transport within this depth regime. The ascending fingers transport nutrient-rich waters upward from deeper layers, while the descending fingers transport waters with lower nutrient concentrations downward from shallower layers. The superposition of these fluxes results in a net upward nutrient flux toward nutrient-consuming shallower depths. This mechanism is expected to influence the biogeochemical functioning of the basin, as suggested for other salt fingering regions of the ocean (Oschlies et al., 2003; Glessmer et al., 2008; Taillandier et al., 2020), by enhancing biological productivity with further impacts on the basin’s uptake of carbon dioxide and oxygen. Moreover, these effects may extend to the WMed, since intermediate waters formed in the Cretan Sea—after mixing with LIW—are advected toward the WMed enriched with nutrients from deeper layers. This argument highlights the need for further monitoring to obtain denser spatiotemporal coverage of nutrient data, which would allow realistic quantification of nutrient fluxes and their correlation with SF-DDCs. Finally, the distinct vertical layers created by SF-DDCs hinder vertical particle transport, thereby facilitating particle retention and promoting the formation of larger aggregates, ultimately affecting particle size distribution (Durrieu de Madron et al., 2024).
In conclusion, SF-DDCs in the Cretan Sea have not yet been adequately monitored and analyzed, although the basin’s water mass distribution favors their ubiquitous presence. Future work should therefore focus on further investigating these processes, particularly their most pronounced manifestations in the form of SF-TSs, since they are linked to important marine ecosystem functions and respond to pressures induced by climate change.
Data availability statement
The raw data supporting the conclusions of this article will be made available by the authors, without undue reservation.
Author contributions
DV: Visualization, Formal analysis, Data curation, Writing – original draft, Conceptualization, Methodology, Writing – review & editing, Investigation. SK: Visualization, Formal analysis, Writing – original draft, Data curation, Conceptualization, Methodology, Writing – review & editing, Investigation. EB: Investigation, Data curation, Writing – original draft. DB: Data curation, Investigation, Writing – original draft. VZ: Writing – review & editing.
Funding
The author(s) declare financial support was received for the research and/or publication of this article. The authors acknowledge financial support by the program “Monitoring and recording the status of the marine sub-regions of Greece/Upgrading and functional updating of the MSFD monitoring network”, (MIS 5010880), funded by national Greek and EU funds under the Ministry of Development & Investment, National Strategic Reference Framework (NSRF 2014-2020) and the program “Support for upgrading the operation of the National Network for Climate Change - CLIMPACT” (Grant Agreement: 2023NA11900001, MIS 5201588), funded by national Greek funds under the Ministry of Development & Investment.
Acknowledgments
The authors would like to thank the officers, crews and scientific personnel of the research vessels that collected the data used in this work.
Conflict of interest
The authors declare that the research was conducted in the absence of any commercial or financial relationships that could be construed as a potential conflict of interest.
Generative AI statement
The author(s) declare that no Generative AI was used in the creation of this manuscript.
Any alternative text (alt text) provided alongside figures in this article has been generated by Frontiers with the support of artificial intelligence and reasonable efforts have been made to ensure accuracy, including review by the authors wherever possible. If you identify any issues, please contact us.
Publisher’s note
All claims expressed in this article are solely those of the authors and do not necessarily represent those of their affiliated organizations, or those of the publisher, the editors and the reviewers. Any product that may be evaluated in this article, or claim that may be made by its manufacturer, is not guaranteed or endorsed by the publisher.
Supplementary material
The Supplementary Material for this article can be found online at: https://www.frontiersin.org/articles/10.3389/fmars.2025.1649311/full#supplementary-material
References
Boscolo R. and Bryden H. (2001). Causes of long-term changes in aegean sea deep water. Oceanol. Acta 24, 519–5 27. doi: 10.1016/S0399-1784(01)01172-0
Bryden H. L., Schroeder K., Sparnocchia S., Borghini M., and Vetrano A. (2014). Thermohaline staircases in the western Mediterranean sea. J. Mar. Res. 72, 1–18. doi: 10.1357/002224014812655198
Buffett G. G., Krahmann G., Klaeschen D., Schroeder K., Sallarès V., Papenberg C., et al. (2017). Seismic oceanography in the Tyrrhenian Sea: thermohaline staircases, eddies, and internal waves. J. Geophys. Res. 122, 8503–8523. doi: 10.1002/2017JC012726
Chiggiato J., Artale V., Durrieu de Madron X., Schroeder K., Taupier-Letage I., Velaoras D., et al. (2023). “Recent changes in the mediterranean sea,” in Oceanography of the mediterranean sea. Eds. Schroeder K. and Chiggiato J. (Elsevier), 289–334. doi: 10.1016/B978-0-12-823692-5.00008-X
Durante S., Oliveri P., Nair R., and Sparnocchia S. (2021). Mixing in the tyrrhenian interior due to thermohaline staircases. Front. Mar. Sci. 8. doi: 10.3389/fmars.2021.672437
Durante S., Schroeder K., Mazzei L., Pierini S., Borghini M., and Sparnocchia S. (2019). Permanent thermohaline staircases in the Tyrrhenian Sea. Geophys. Res. Lett. 46, 1562–1570. doi: 10.1029/2018GL081747
Durrieu de Madron X., Blin P., Pujo-Pay M., Taillandier V., and Conan P. (2024). Effect of double diffusion processes in the deep ocean on the distribution and dynamics of particulate and dissolved matter: a case study in Tyrrhenian Sea, EGUsphere [preprint]. doi: 10.5194/egusphere-2024-3436
EMODnet Bathymetry Consortium (2016). “EMODnet digital bathymetry (DTM 2016),” in EMODnet bathymetry consortium. doi: 10.12770/c7b53704-999d-4721-b1a3-04ec60c87238
Falco P., Trani M., and Zambianchi E. (2016). Water mass structure and deep mixing processes in the Tyrrhenian Sea: Results from the VECTOR project. Deep-Sea Res. I: Oceanogr. Res. Pap. 113, 7–21. doi: 10.1016/j.dsr.2016.04.002
Ferron B., Bouruet-Aubertot P., Schroeder K., Bryden H. L., Cuypers Y., and Borghini M. (2021). Contribution of thermohaline staircases to deep water mass modifications in the western mediterranean sea from microstructure observations. Front. Mar. Sci. 8. doi: 10.3389/fmars.2021.664509
Glessmer M. S., Oschlies A., and Yool A. (2008). Simulated impact of double-diffusive mixing on physical and biogeochemical upper ocean properties. J. Geophys. Res. Oceans 113, C08029. doi: 10.1029/2007JC004455
Gregg M. C., Alford M. H., Kontoyiannis H., Zervakis V., and Winkel D. (2012). Mixing over the steep side of the Cycladic Plateau in the Aegean Sea. J. Mar. Sys. 89, 30–47. doi: 10.1016/j.jmarsys.2011.07.009
Greg M. C. and Sanford T. B. (1987). Shear and turbulence in thermohaline staircases. Deep-Sea Res. A. Oceanogr. Res. Pap. 24 (10), 1689–1696. doi: 10.1016/0198-0149(87)90017-3
IOC, SCOR, and IAPSO (2010). The international thermodynamic equation of seawater–2010: Calculation and use of thermodynamic properties. Intergovernmental Oceanographic Commission, Manuals and Guides 56, UNESCO(English), 196pp.
Johnson G. C. and Kearney K. A. (2009). Ocean climate change fingerprints attenuated by salt fingering? Geophys. Res. Lett. 36, L21603. doi: 10.1029/2009GL040697
Josey S. A. and Schroeder K. (2023). Declining winter heat loss threatens continuing ocean convection at a Mediterranean dense water formation site. Environ. Res. Lett. 18, 024005. doi: 10.1088/1748-9326/aca9e4
Kelley D. E. (1984). Effective diffusivities within oceanic thermohaline staircases. J. Geophys. Res. 89, 10484–10488. doi: 10.1029/JC089iC06p10484
Kelley D. E. (1990). Fluxes through diffusive staircases: a new formulation. J. Geophys. Res. 95, 3365–3371. doi: 10.1029/JC095iC03p03365
Kelley D. E., Fernando H. J. S., Gargett A. E., Tanny J., and Özsoy E. (2003). The diffusive regime of double-diffusive convection. Prog. Oceanogr. 56, 461–481. doi: 10.1016/S0079-6611(03)00026-0
Khodayar S., Pastor F., Valiente J. A., Benetó P., and Ehmele F. (2022). What causes a heavy precipitation period to become extreme? The exceptional October of 2018 in the Western Mediterranean. Weather Clim. Extrem. 38, 100493. doi: 10.1016/j.wace.2022.100493
Kilicarslan B. M., Yucel I., Pilatin H., Duzenli E., and Yilmaz M. T. (2021). Improving WRF-Hydro runoff simulations of heavy floods through the sea surface temperature fields with higher spatio-temporal resolution. Hydrol. Process. 35, e14338. doi: 10.1002/hyp.14338
Kioroglou S., Tragou E., Zervakis V., Georgopoulos D., Herut B., Gertman I., et al. (2014). Vertical diffusion processes in the Eastern Mediterranean — Black Sea System. J. Mar. Sys., 135, 53–63. doi: 10.1016/j.jmarsys.2013.08.007
Kokoszka F., Iudicone D., Zingone A., Saggiomo V., Ribera D’Alcalá M., and Conversano F. (2021). A note about density staircases in the Gulf of Naples: 20 years of persistent weak salt-fingering layers in a coastal area. Adv. Oceanogr. Limnol. 12. doi: 10.4081/aiol.2021.10008
Kontoyiannis H., Lykousis V., Papadopoulos V., Stavrakakis S., Anassontzis E. G., Belias A., et al. (2016). Hydrography, Circulation, and Mixing at the Calypso Deep (the Deepest Mediterranean Trough) during 2006 – 09. J. Phys. Oceanogr. 46, 1255–1276. doi: 10.1175/JPO-D-15-0198.1
Kubin E., Poulain P.-M., Mauri E., Menna M., and Notarstefano G. (2019). Levantine intermediate and levantine deep water formation: an argo float study from 2001 to 2017. Water 11, 1781. doi: 10.3390/w11091781
Kunze E. (1987). Limits on growing, finite-length salt fingers: A Richardson number constraint. J. Mar. Res. 45, 533–566. doi: 10.1357/002224087788326885
Large W. G., McWilliams J. C., and Doney S. C. (1994). Oceanic vertical mixing: A review and a model with a nonlocal boundary layer parameterization. Rev. Geophys. 32, 363–403. doi: 10.1029/94RG01872
Larson N. G. and Gregg M. C. (1983). Turbulent dissipation and shear in thermohaline intrusions. Nature 306, 26–32. doi: 10.1038/306026a0
Linden P. F. (1973). On the structure of salt fingers. Deep-Sea Res. 20, 325–340. doi: 10.1016/0011-7471(73)90057-0
LIWEX Group (2003). The Levantine Intermediate Water Experiment (LIWEX) Group: Levantine basin—A laboratory for multiple water mass formation processes. J. Geophys. Res. 108, 8101. doi: 10.1029/2002JC001643
Lueck R. G. (1987). Microstructure measurements in a thcrmohaline staircase. Deep-Sea Res. 34, 1677–1688. doi: 10.1016/0198-0149(87)90016-1
Marmorino G. O., Brown W. K., and Morris W. D. (1987). Two-dimensional temperature structure in the C-SALT thermohaline staircase. Deep-Sea Res. 34, 1667–1676. doi: 10.1016/0198-0149(87)90015-X
Martínez J., Leonelli F. E., García-Ladona E., Garrabou J., Kersting D. K., Bensoussan N., et al. (2023). Evolution of marine heatwaves in warming seas: the Mediterranean Sea case study. Front. Mar. Sci. 10. doi: 10.3389/fmars.2023.1193164
McDougall T. J. and Taylor J. R. (1984). Flux measurements across a finger interface at low values of the stability ratio. J. Mar. Res. 42, 1–14. doi: 10.1357/002224084788506095
Meccia V. L., Simoncelli S., and Sparnocchia S. (2016). Decadal variability of the Turner Angle in the Mediterranean Sea and its implications for double diffusion. Deep-Sea Res. I: Oceanogr. Res. Pap. 114, 64–77. doi: 10.1016/j.dsr.2016.04.001
Oschlies A., Dietze H., and Kähler P. (2003). Salt-finger driven enhancement of upper ocean nutrient supply. Geophys. Res. Lett. 30, 3–6. doi: 10.1029/2003GL018552
Ozer T., Gertman I., Kress N., Silverman J., and Herut B. (2017). Interannual thermohaline, (1979 – 2014) and nutrient, (2002 – 2014) dynamics in the Levantine surface and intermediate water masses, SE Mediterranean Sea. Glob. Plan. Change 151, 60–67. doi: 10.1016/j.gloplacha.2016.04.001
Pavlidou A., Velaoras D., Karageorgis A. P., Rousselaki E., Parinos C., Dähnke K., et al. (2020). Seasonal variations of biochemical and optical properties, physical dynamics and N sta ble isotopic composition in three northeastern Mediterranean basins (Aegean, Cretan and Ionian Seas). Deep-Sea Res. II: Top. Stud. Oceanogr. 171, 104704. doi: 10.1016/j.dsr2.2019.104704
POEM Group (1992). General circulation of the eastern mediterranean. Earth-Sci. Rev. 32, 285–309. doi: 10.1016/0012-8252(92)90002-B
Potiris M., Mamoutos I. G., Tragou E., Zervakis V., Kassis D., and Ballas D. (2024). Dense water formation variability in the aegean sea from 1947 to 2023. Oceans 5, 611–6 36. doi: 10.3390/oceans5030035
Radco T. and Smith D. P. (2012). Equilibrium transport in double-diffusive convection. J. Fluid Mech. 692, 5–27. doi: 10.1017/jfm.2011.343
Radko T. (2013). Double-diffusive convection (Cambridge: Cambridge University Press), 344. doi: 10.1017/CBO9781139034173
Ruddick B. (1983). A practical indicator of the stability of the water column to double-diffusive activity. Deep-Sea Res. A. Oceanogr. Res. Pap. 30, 1105–1107. doi: 10.1016/0198-0149(83)90063-8
Schmitt R. W., Perkins H., Boyd J. D., and Stalcup M. C. (1987). C-SALT: An investigation of the thermohaline staircase in the western tropical North Atlantic. Deep Sea Res. 34, 1655–1665. doi: 10.1016/0198-0149(87)90014-8
Schroeder K., Josey S. A., Herrmann M., Grignon L., Gasparini G. P., and Bryden H. L. (2010). Abrupt warming and salting of the Western Mediterranean Deep Water after 2005: Atmospheric forcings and lateral advection. J. Geophys. Res. Oceans 115, 1–18. doi: 10.1029/2009JC005749
Stern M. E. (1960). The “Salt-fountain“ and thermohaline convection. Tellus 12, 172–175. doi: 10.3402/tellusa.v12i2.9378
Stern M. ,. E. (1976). Maximum buoyancy flux across a salt finger interface. J. Mar. Res. 34, 95–11.
Taillandier V., D’Ortenzio F., Prieur L., Conan P., Coppola L., Cornec M., et al. (2022). Sources of the Levantine intermediate water in winter 2019. J. @ Geophys. Res. Oceans 127, e2021JC017506. doi: 10.1029/2021JC017506
Taillandier V., Prieur L., D’Ortenzio F., Ribera d’Alcalà M., and Pulido-Villena E. (2020). Profiling float observation of thermohaline staircases in the western Mediterranean Sea and impact on nutrient fluxes. Biogeosciences 17, 3343–3366. doi: 10.5194/bg-17-3343-2020
Tennekes H. and Lumley J. L. (1972). A first course in turbulence (Cambridge, MA: The MIT Press), 293.
Theocharis A., Georgopoulos D., Lascaratos A., and Nittis K. (1993). Water masses and circulation in the central region of the Eastern Mediterranean. Deep-Sea Res. II 40, 1121–1142. doi: 10.1016/0967-0645(93)90064-T
Theocharis A., Klein B., Nittis K., and Roether W. (2002). Evolution and status of the eastern mediterranean transien- 1999). J. Mar. Sys. 33 – 34, 91–116. doi: 10.1016/S0924-7963(02)00054-4
Theocharis A., Nittis K., Kontoyiannis H., Papageorgiou E., and Balopoulos E. (1999). Climatic changes in the Aegean Sea influence the eastern Mediterranean thermocline circulatio- 1997). Geophys. Res. Lett. 26, 1617–1620. doi: 10.1029/1999GL900320
Turner J. S. (1967). Salt fingers across a density interface. Deep-Sea Res. 14, 599–611. doi: 10.1016/0011-7471(67)90066-6
Velaoras D., Krokos G., Nittis K., and Theocharis A. (2014). Dense intermediate water outflow from the Cretan Sea: A salinity driven, recurrent phenomenon, connected to thermohaline circulation changes. J. Geophys. Res. Oceans 119, 4797–4820. doi: 10.1002/2014JC009937
Velaoras D., Krokos G., and Theocharis A. (2015). Recurrent intrusions of transitional waters of Eastern Mediterranean origin in the Cretan Sea as a tracer of Aegean Sea dense water formation events. Progr. Oceanogr. 135, 113–124. doi: 10.1016/j.pocean.2015.04.010
Velaoras D., Papadopoulos V. P., Kontoyiannis H., Cardin V., and Civitarese G. (2019). Water masses and hydrography during April and June 2016 in the Cretan Sea and Cretan Passage (Eastern Mediterranean Sea). Deep-Sea Res. II: Top. Stud. Oceanogr. 164, 25–40. doi: 10.1016/j.dsr2.2018.09.005
Velaoras D., Zervakis V., and Theocharis A. (2021). The physical characteristics and dynamics of the aegean water masses (Berlin Heidelberg: Springer), 1–29. doi: 10.1007/698_2020_730
You Y. (2002). A global ocean climatological atlas of the Turner angle: Implications for double-diffusion and water-mass structure. Deep-Sea Res. Part I: Oceanogr. Res. Pap. 49, 2075–2093. doi: 10.1016/S0967-0637(02)00099-7
Zhang J., Schmitt R. W., and Huang R. X. (1998). Sensitivity of the GFDL modular ocean model to parameterization of double-diffusive processes. J. Phys. Oceanogr. 28, 589–605. doi: 10.1175/1520-0485(1998)028<0589:SOTGMO>2.0.CO;2
Zodiatis G. (1990). Double Diffusive Activities in the Cretan Sea during late summer 1987. Rapp. Commun. Int. Mer Medit. 32, 1, 189.
Zodiatis G. (1991). The multi-scaled thermohaline structure of the cretan sea waters, ph.D. Thesis Vol. 551.465 (St. Petersburg, UDK: LHMI (RSHM University), 191.
Zodiatis G. (1992). Lens formation in the SE Ionian Sea and double diffusion. Annales Geophysicae 10, 935–941.
Keywords: Eastern Mediterranean Sea, Cretan Sea, double diffusive convection, salt fingering, thermohaline staircase, heat and salt diffusivities, heat and salt fluxes
Citation: Velaoras D, Kioroglou S, Bourma E, Ballas D and Zervakis V (2025) Evidence of thermohaline staircase in the Cretan Sea (Eastern Mediterranean Sea). Front. Mar. Sci. 12:1649311. doi: 10.3389/fmars.2025.1649311
Received: 18 June 2025; Accepted: 11 August 2025;
Published: 09 September 2025.
Edited by:
Donglai Gong, College of William & Mary, United StatesReviewed by:
Sara Durante, National Research Council (CNR), ItalyAnıl Akpınar, Middle East Technical University, Türkiye
Copyright © 2025 Velaoras, Kioroglou, Bourma, Ballas and Zervakis. This is an open-access article distributed under the terms of the Creative Commons Attribution License (CC BY). The use, distribution or reproduction in other forums is permitted, provided the original author(s) and the copyright owner(s) are credited and that the original publication in this journal is cited, in accordance with accepted academic practice. No use, distribution or reproduction is permitted which does not comply with these terms.
*Correspondence: Dimitris Velaoras, ZHZlbGFvcmFzQGhjbXIuZ3I=
†These authors have contributed equally to this work