Abstract
Understanding spatiotemporal distribution patterns of fish across life history stages is critical for sustainable fishery management, particularly in data-poor regions such as the extensive yet poorly explored western African coastal regions. This study investigates the distribution patterns and ontogenetic habitat shifts of Atlantic bigeye (Priacanthus arenatus) at various life stages on the coast of Sierra Leone using data from twelve cruises conducted between 2019 and 2021. Our results reveal distinct life-stage partitioning across multiple life stages of Atlantic bigeye. Juveniles (<60 mm body length) predominantly distribute in the pelagic waters beyond the continental shelf. As individuals reach a body length of approximately 60 mm, they enter the sub-adult stage, characterized by the onset of gonad development and a noticeable migration to demersal areas within the continental shelf. Adults (≥150 mm body length) are basically demersal as populations primarily distribute in demersal areas within the continental shelf. Our observations also suggest that juvenile Atlantic bigeye exhibits capture peaks: one prior to the rainy season (April–May) and the other after the rainy season (September–October), suggesting a potential correlation with spawning. Moreover, the extensive offshore distribution of juveniles beyond the continental shelf appears to be closely associated with seasonal river plume spread, potentially reflecting a behavioral adaptation to utilize oceanic dispersal pathways during periods of enhanced freshwater input. These findings fill a critical knowledge gap and provide a scientific basis for fisheries research and management of this species in western African waters.
1 Introduction
To ensure the conservation of populations, fish must adapt to environmental fluctuations or avoid adverse environmental conditions by evolving appropriate life history strategies and traits through natural selection (Reynolds et al., 2005). Understanding the distribution patterns of fish across their life stages is essential for elucidating their full life history. Critical information on the distribution patterns at multiple life history stages is a prerequisite for effectively managing and exploiting fish species (Olden et al., 2006; Meador and Brown, 2015). The distribution of fish populations is often influenced by individual feeding and reproductive behaviors, as well as environmental factors (Mclean et al., 2016). Thus, fish exhibit a wide range of life history strategies, such as habitat selection, which enable them to cope with various environmental stressors (Meador and Brown, 2015; Teichert et al., 2017). Furthermore, fluctuations in population abundance vary among different life history types, reflecting life history traits and strategies of specific fish species (Wiedmann et al., 2014).
Numerous studies have documented changes in the distribution of adult fish over various temporal scales, from short-term to long-term (Fonseca and Cabral, 2007; Pecuchet et al., 2018). However, most marine fish exhibit complex life histories, characterized by distinct morphological phases (Carter et al., 2013). Changes in the distribution of these phases can affect the connectivity between different life stages, which in turn influences processes such as individual reproduction and stock recruitment (Tondato et al., 2018). Therefore, it is imperative to prioritize the study of distribution patterns across different life stages. The size of fish populations is mainly dependent on stock recruitment, which can vary significantly from year to year due to fluctuations in the survival of individuals during early life stages. As a result, understanding the spatiotemporal distribution of juveniles is essential for comprehending the dynamics of early individual survival (Saville and Schnack 1981; Hays, 2017).
The planktonic larvae of many oviparous and ovoviviparous fish species are characterized by limited swimming capability, making their movements and distribution highly susceptible to fluid motions. For example, large-scale hydrological features such as ocean currents (Xu et al., 2019), upwelling (Tiedemann et al., 2016), and river runoff (Qiu et al., 2008, 2010) can significantly alter the distribution of juvenile fish with weak swimming capabilities. After several days to months, juveniles develop into sub-adults with enhanced swimming abilities, enabling better predation and predator avoidance. Following several months to years, individuals reach maturity and seek opportunities to reproduce. It is evident that individuals at different life stages exhibit distinct needs (Moore et al., 2014). A unifying factor is that specific life stages are often associated with particular habitats (Peterson et al., 2000; Wang et al., 2017), necessitating a connection between each life history and its habitat. This connection is influenced by various factors, including environmental disturbances, dietary requirements, and reproductive needs. At the end of each life stage, fish must identify suitable opportunities to transition to the next habitat stage, a decision influenced by both innate instincts and external environmental conditions (Kuparinen et al., 2016). Therefore, understanding population distribution across different life history stages is crucial for evaluating fishery resources, formulating comprehensive conservation strategies, and implementing effective regional species management (Barry and Price, 2015). This is particularly relevant for economically valuable species whose life history traits and spatial dynamics remain poorly understood.
The Atlantic bigeye, Priacanthus arenatus Cuvier, 1829, is widely distributed from Madeira southward to Angola in the eastern Atlantic Ocean and has become an important economic species in demersal fisheries in recent years. The family Priacanthidae is primarily benthic in its adult stage, and its fishery resources have been exploited relatively late (Toledo et al., 2000). Adult Atlantic bigeye is nocturnal and inhabit coastal areas, with a diet mainly consisting of small fish, crustaceans, and polychaetes. However, little is known about the distribution of Atlantic bigeye across different life history stages. Additionally, Sierra Leone, located in the southwestern sector of the West African bulge, features a narrow continental shelf near the western tip of Sherbro Island. The northern part of Sherbro Island has a wider continental shelf with predominantly sandy sediment, while the southern part is narrower with muddy sediment. The distinct rainy and dry seasons, combined with the convergence of multiple water systems and diverse topography, maintain abundant fishery resources for local communities while exerting complex influences on the feeding, spawning, migration, and distribution of native fish (Feng et al., 2022).
This study examined the distribution patterns of the Atlantic bigeye (P. arenatus), a dominant native species, across different life history stages, and further identified key ecological factors driving these spatial dynamics. Our objectives were to (1) refine existing life history information for this species and their relationships with environmental factors; (2) provide critical insights to support regional fisheries stock assessments, management strategies, and conservation efforts.
2 Material and methods
2.1 Study site
The study was conducted in the coastal waters of Sierra Leone, which borders the Atlantic Ocean and experiences a tropical monsoon climate characterized by high temperatures and seasonal rainfall. The region has two distinct seasons: rainy season (May to October) and dry season (November to April). The coastline of Sierra Leone spans 506 kilometers, encompassing an exclusive economic zone (EEZ, is an area of the ocean which extends up to 200 nautical miles from country ‘s coastline) and an area of approximately 45,400 square nautical miles. The convergence of multiple water systems and rivers with high primary productivity supports a diverse array of economically significant aquatic species. The generally calm environment also provides optimal conditions for marine operations such as fishing and research.
2.2 Sampling protocol and environmental data
Twelve cruises were conducted for trawl surveys of Sierra Leone’s offshore fishery resources. Six cruises focused on demersal fishery resources by using demersal trawl (SL01: September 12-22, 2019; SL03: October 14-21, 2019; SL05: December 1-14, 2020; SL07: January 10-19, 2021; SL09: April 22-30, 2021; SL11: May 21-30, 2021), while the other six focused on pelagic fishery resources by using midwater trawl (SL02: September 26-October 10, 2019; SL04: November 7-15, 2019; SL06: December 15-24, 2020; SL08: January 20-30, 2021; SL10: May 1-10, 2021; SL12: May 30-June 6, 2021; Figure 1; Table 1). Investigation trawls both equipped with a cod-end mesh size of 20 mm, were deployed for sample collection. Each haul lasted 45–75 minutes with an average trawling speed of 3.5 knots. To estimate the swept area, GPS locations were used to calculate the trawling distance from the moment the gear first contacted the seabed until its retrieval. The mean width of the trawl sweeping path was 15.012 m, based on pre-survey calibration tests conducted at the same average vessel speed of 3.5 knots.
Table 1
| Cruise | Number of survey stations (Number of stations P. arenatus caught) | Date | Geographic Range | |
|---|---|---|---|---|
| dd/mm/yyyy - dd/mm/yyyy | Latitude (N) | Longitude (W) | ||
| SL01 (D, rainy) | 35 (4) | 12/09/2019 - 22/09/2019 | 7°03′ - 8°52′ | 11°50′ - 14°04′ |
| SL02 (P, rainy) | 21 (7) | 26/09/2019 - 10/10/2019 | 6°42′ - 8°37′ | 13°13′ - 16°15′ |
| SL03 (D, rainy) | 27 (9) | 14/10/2019 - 21/10/2019 | 7°08′ - 8°50′ | 11°57′ - 14°05′ |
| SL04 (P, dry) | 30 (5) | 07/11/2019 - 15/11/2019 | 4°33′ - 8°49′ | 11°48′ - 16°29′ |
| SL05 (D, dry) | 41 (23) | 01/12/2020 - 14/12/2020 | 6°54′ - 8°53′ | 11°36′ - 14°08′ |
| SL06 (P, dry) | 53 (2) | 15/12/2020 - 24/12/2020 | 5°03′ - 8°44′ | 11°49′ - 15°22′ |
| SL07 (D, dry) | 40 (28) | 10/01/2021 - 19/01/2021 | 6°58′ - 8°52′ | 11°42′ - 14°09′ |
| SL08 (P, dry) | 60 (10) | 20/01/2021 - 30/01/2021 | 5°01′ - 8°44′ | 11°49′ - 15°50′ |
| SL09 (D, dry) | 40 (23) | 22/04/2021 - 30/04/2021 | 6°56′ - 8°54′ | 11°38′ - 14°07′ |
| SL10 (P, rainy) | 60 (12) | 01/05/2021 - 10/05/2021 | 5°02′ - 8°45′ | 11°49′ - 15°48′ |
| SL11 (D, rainy) | 41 (18) | 21/05/2021 - 30/05/2021 | 6°55′ - 8°52′ | 11°38′ - 14°10′ |
| SL12 (P, rainy) | 27 (2) | 30/05/2021 - 06/06/2021 | 5°02′ - 8°27′ | 11°48′ - 15°49′ |
Summary of the 12 research cruises, including survey date, geographic location, total number of sampling stations, and the number of stations where P. arenatus was captured.
The surveys were categorized as either demersal (D) or pelagic (P) fishery resource assessments.
Figure 1
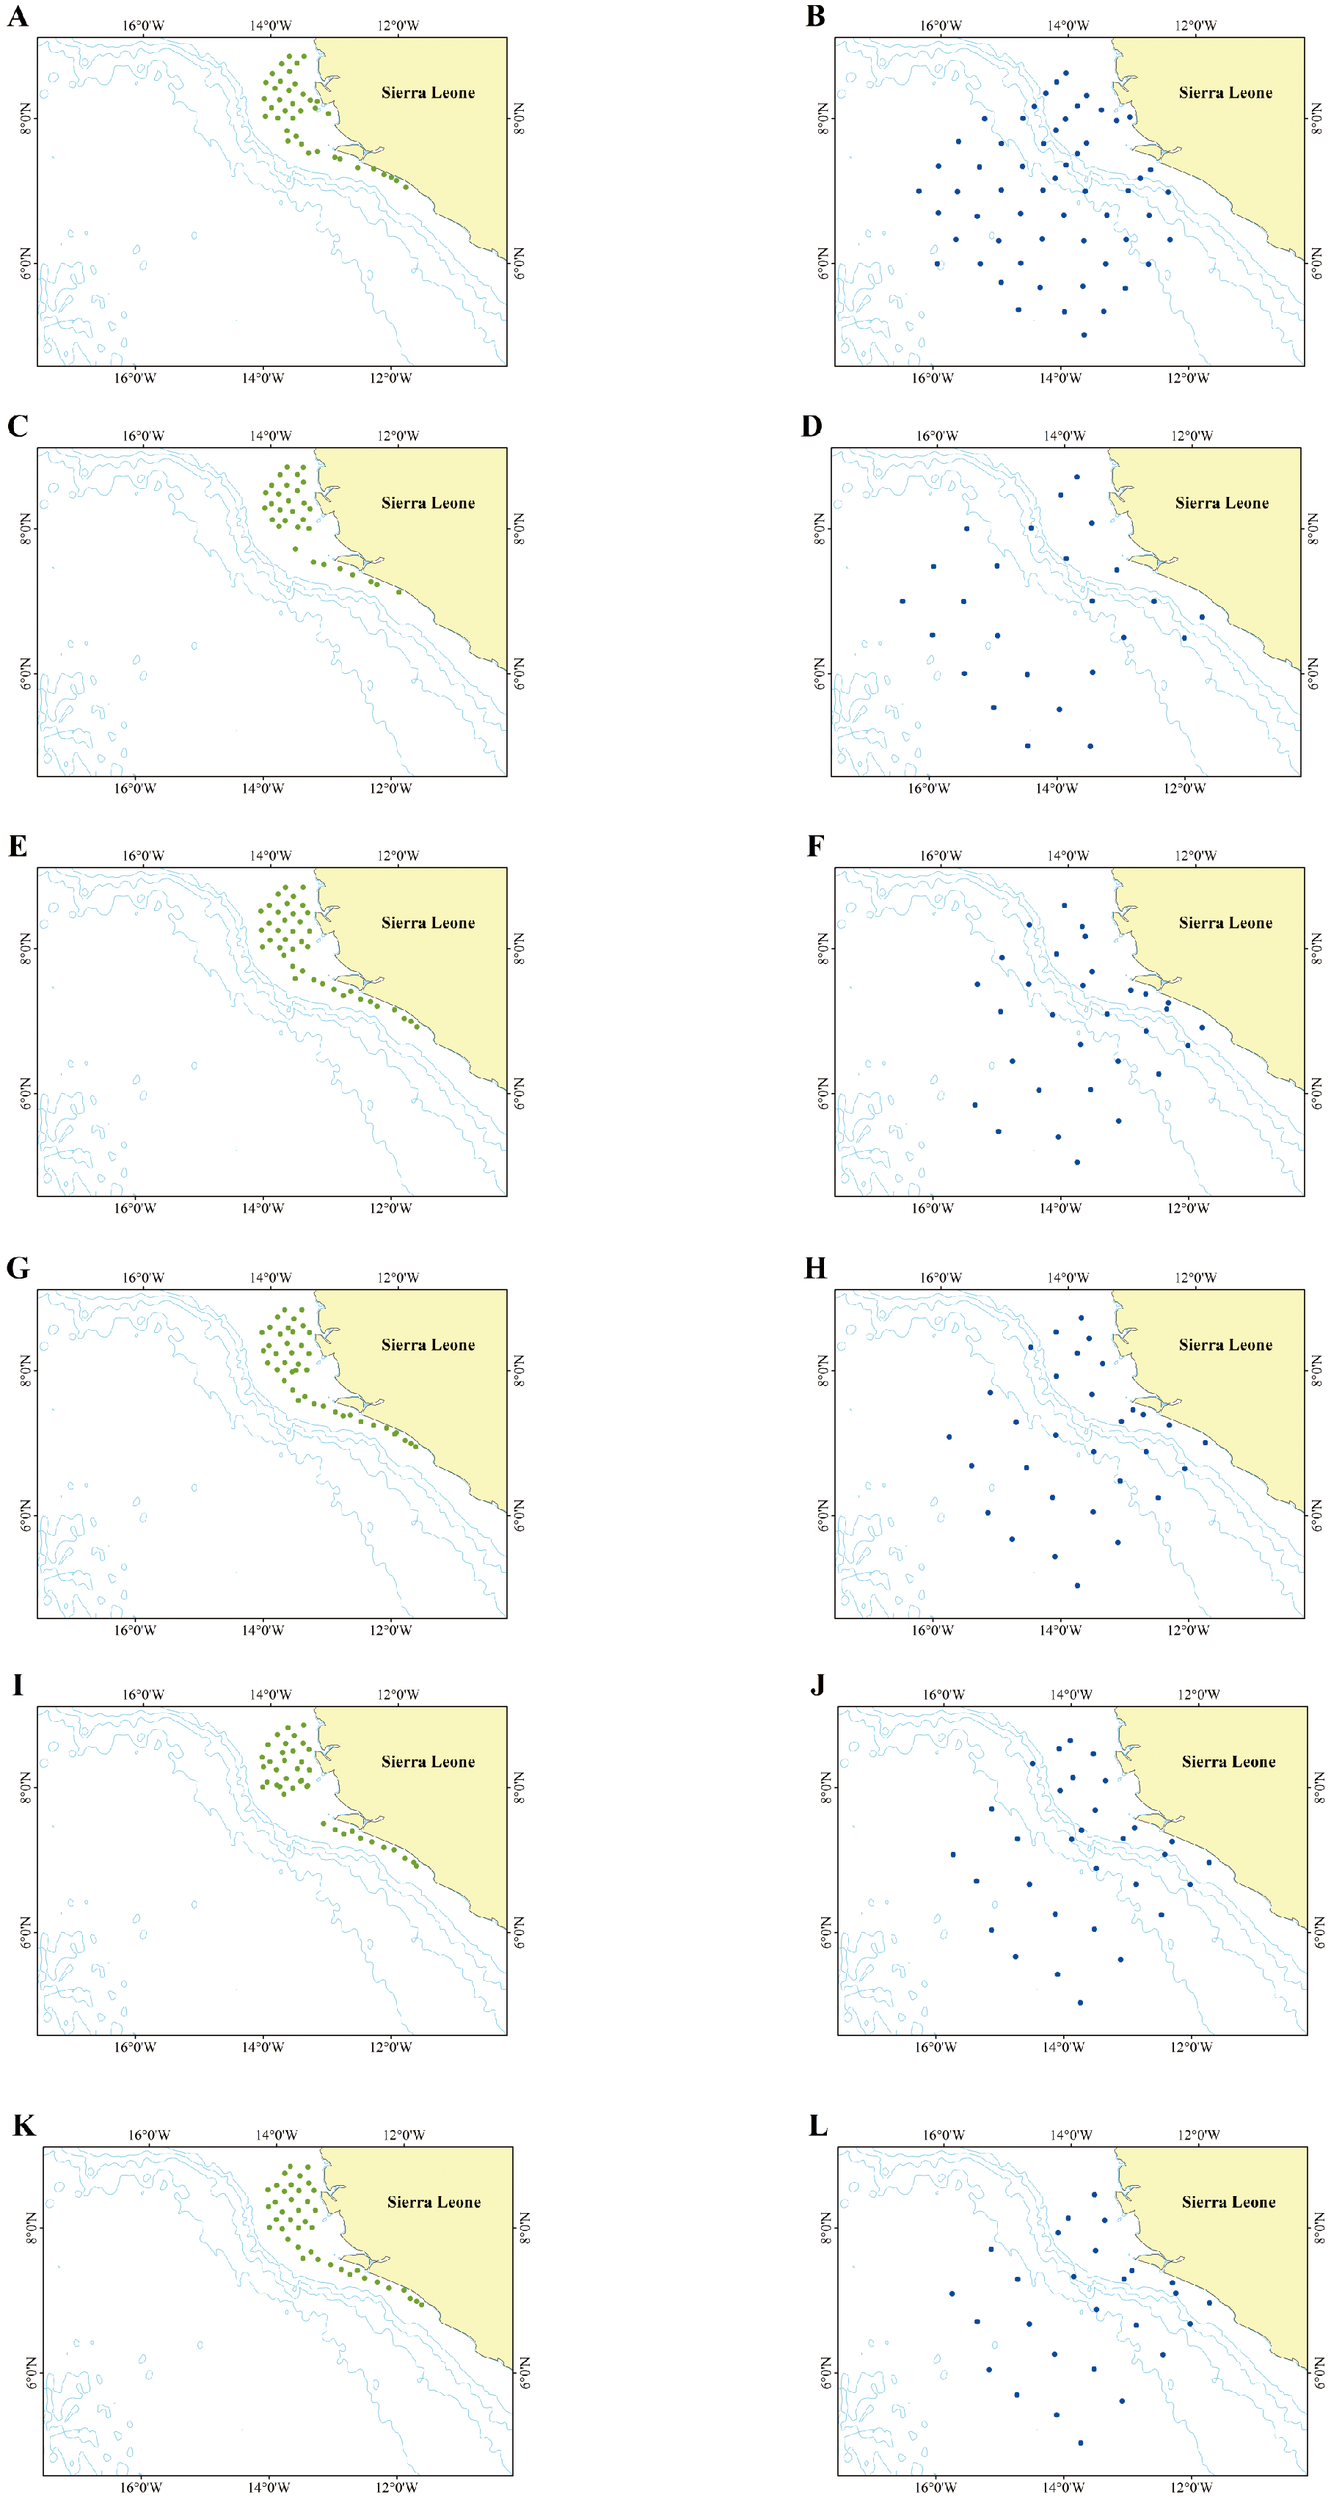
Stations in twelve cruises (A): SL01, (B): SL02, (C): SL03, (D): SL04, (E): SL05, (F): SL06, (G): SL07, (H): SL08, (I): SL09, (J): SL10, (K): SL11, (L): SL12). Green dots represent demersal survey stations, and blue dots represent pelagic survey stations.
To investigate the potential impacts of environmental factors on the distribution of the study subjects, we obtained the following relevant datasets: (1) ERA5 reanalysis data from the European Centre for Medium-Range Weather Forecasts (ECMWF) were used in this study. The dataset covers the middle of the dry season and the middle of the rainy season for each year from 2019 to 2021. The study area spans the oceanic region from 17°W to 11°W longitude and 4°N to 9°N latitude. The extracted variables include the total precipitation, which are used to analyze the relationship between atmospheric forcing and oceanic responses in the study area. (2) Environmental data used for GLMMs were extracted from the GLORYS12V1 product of the E.U. Copernicus Marine Environment Monitoring Service (CMEMS; https://doi.org/10.48670/moi-00021). Generalized Linear Mixed Models (GLMMs) represent a powerful and flexible statistical framework that extends the capabilities of generalized linear models (GLMs) by incorporating random effects. The primary function of a GLMM is to model non-normal response data while accounting for non-independence among observations arising from hierarchical, longitudinal, or repeated-measures designs. The selected environmental variables—sea surface temperature (T), salinity (S), sea surface pressure (SP), northerly current (NV), and easterly current (EV)—were derived from the GLORYS12V1 global ocean reanalysis. To ensure spatial consistency, all variables were resampled to a common resolution of 1/12° using nearest-neighbor interpolation before being spatiotemporally aligned with the fishery data.
2.3 Sample processing and classification
The samples were dissected to examine the development of the gonads. The fish was placed on its dorsal side on a dissection tray. Using scissors and forceps, a mid-ventral incision was made from the anus forward towards the pectoral girdle. The body wall was carefully cut and pinned back to expose the internal organs, or viscera. The gonads (testes or ovaries) were typically paired, elongated organs located dorsal to the swim bladder and adjacent to the digestive tract. Their appearance (size, color, texture) was carefully noted to determine sex and reproductive stage. A small tissue sample was excised for further histological examination under a microscope to confirm the stage of gamete development. These experiments indicated that gonad development initiates at a body length of 60 mm. Consequently, individuals with a body length of less than 60 mm were classified as juveniles, while those with a body length between 60 mm and 150 mm and a gonad development level of 2–3 were classified as sub-adults. Individuals with a body length exceeding 150 mm were classified as adults, and those with a gonad development level exceeding 4 were designated as the reproductive population. Gonadal level classification (Male: Stage I The paired testes are closely adherent to the dorsal abdominal wall, presenting as translucent, thread-like structures. Histologically, spermatogonia are irregularly distributed within the connective tissue; Stage II The testes appear as semi-transparent, flattened ribbons with faint vascularization and a pale hue. Spermatogonia increase in number and begin to organize into clusters; Stage III The testes become rod-shaped, pale red, and highly vascularized. A central lumen forms within the ampullae, which are primarily populated by primary spermatocytes, while spermatogonia become less abundant; Stage IV The testes further enlarge, adopting a grayish-white, sac-like appearance with prominent blood vessels. The ampullae contain germ cells at various stages of development. Female: Stage I The ovaries are attached to the mesentery near the swim bladder, appearing as pale, translucent linear structures with minimal vascularization. They consist mainly of oogonia, which are small and exhibit a high nuclear-to-cytoplasmic ratio; Stage II The ovaries widen and acquire a flesh-red color. A dense network of microvessels becomes visible on the surface and within the tissue. The ovary is predominantly composed of primary oocytes; Stage III Ovarian volume increases significantly, forming expanded sac-like structures with prominent and densely distributed blood vessels. Oocytes are visible to the naked eye but cannot be easily separated; Stage IV The ovaries approach maturity, occupying most of the coelomic cavity. Blood vessels are thickened, well-developed, and form a reticular pattern across the ovarian membrane. Most oocytes have completed vitellogenesis and are markedly enlarged.
2.4 Data and statistical analysis
All data were analyzed using SPSS 19.00 (IBM Corp., Armonk, NY, USA) and R (version 4.3.2; R Foundation for Statistical Computing, Vienna, Austria). For comprehensive spatial and statistical analyses, multiple software platforms were employed. Spatial distribution patterns were visualized using ArcGIS (version 10.6; ESRI, Redlands, CA, USA) to generate all geospatial maps. To determine whether a correlation exists between depth and the body length and weight of P. arenatus, Pearson correlation analysis was employed. Prior to testing for differences in abundance and mean weight between the rainy and dry seasons at each site, the data were first assessed for normality using appropriate statistical tests. In cases where the data did not meet the assumptions of normality, non-parametric tests were applied. Quantitative data visualization was performed using OriginPro (version 2018C; OriginLab Corporation, Northampton, MA, USA) for constructing bar graph and other statistical graphs.
Generalized linear mixed models (GLMMs) were used to assess the effects of environmental factors on the abundance and mean weight of P. arenatus at each site. The GLMMs were implemented using an R package, glmmTMB. We calculated abundance (Equation 1) and mean weight (Equation 2), and used these as the response variables. Explanatory variables were Sea surface temperature (T), salinity (S), sea surface pressure (SP), northerly current (NV), and easterly current (EV), and their effects on abundance and mean weight are shown in Equations 3 and 4:
“Site” and “lon\lat” are different levels of grouping variables: “lon/lat” captures the fine-scale geographical differences, while “site” represents the larger-scale ecological zones, which in this study are mainly divided into different habitat types (such as open ocean areas and benthic areas). All values were expressed as the mean ± S.E. For data derived from non-parametric tests (Mann-Whitney U test), values are presented with the lower and upper quartiles in parentheses. Statistical significance was set at p < 0.05.
3 Result
3.1 Differences in distribution across life history stages
The distribution and abundance (kg/km²) of P. arenatus captured during the twelve cruises were analyzed and plotted, categorized into four stages based on gonad development and body length.
As illustrated in Figure 2, the stations where juveniles were captured exhibited the widest distribution, with the majority located in the pelagic zone beyond the continental margin. Most juveniles were captured during pelagic surveys (Figure 2A), while only four stations recorded juveniles during demersal surveys, all with abundances below 1 kg/km² (Figure 2B). High abundances of juveniles were encountered in pelagic surveys conducted in October 2019 and May 2021 (270–280 kg/km²). Furthermore, three instances of moderate abundance (55–85 kg/km²)were documented during the October 2019 survey (Figure 2A).
Figure 2
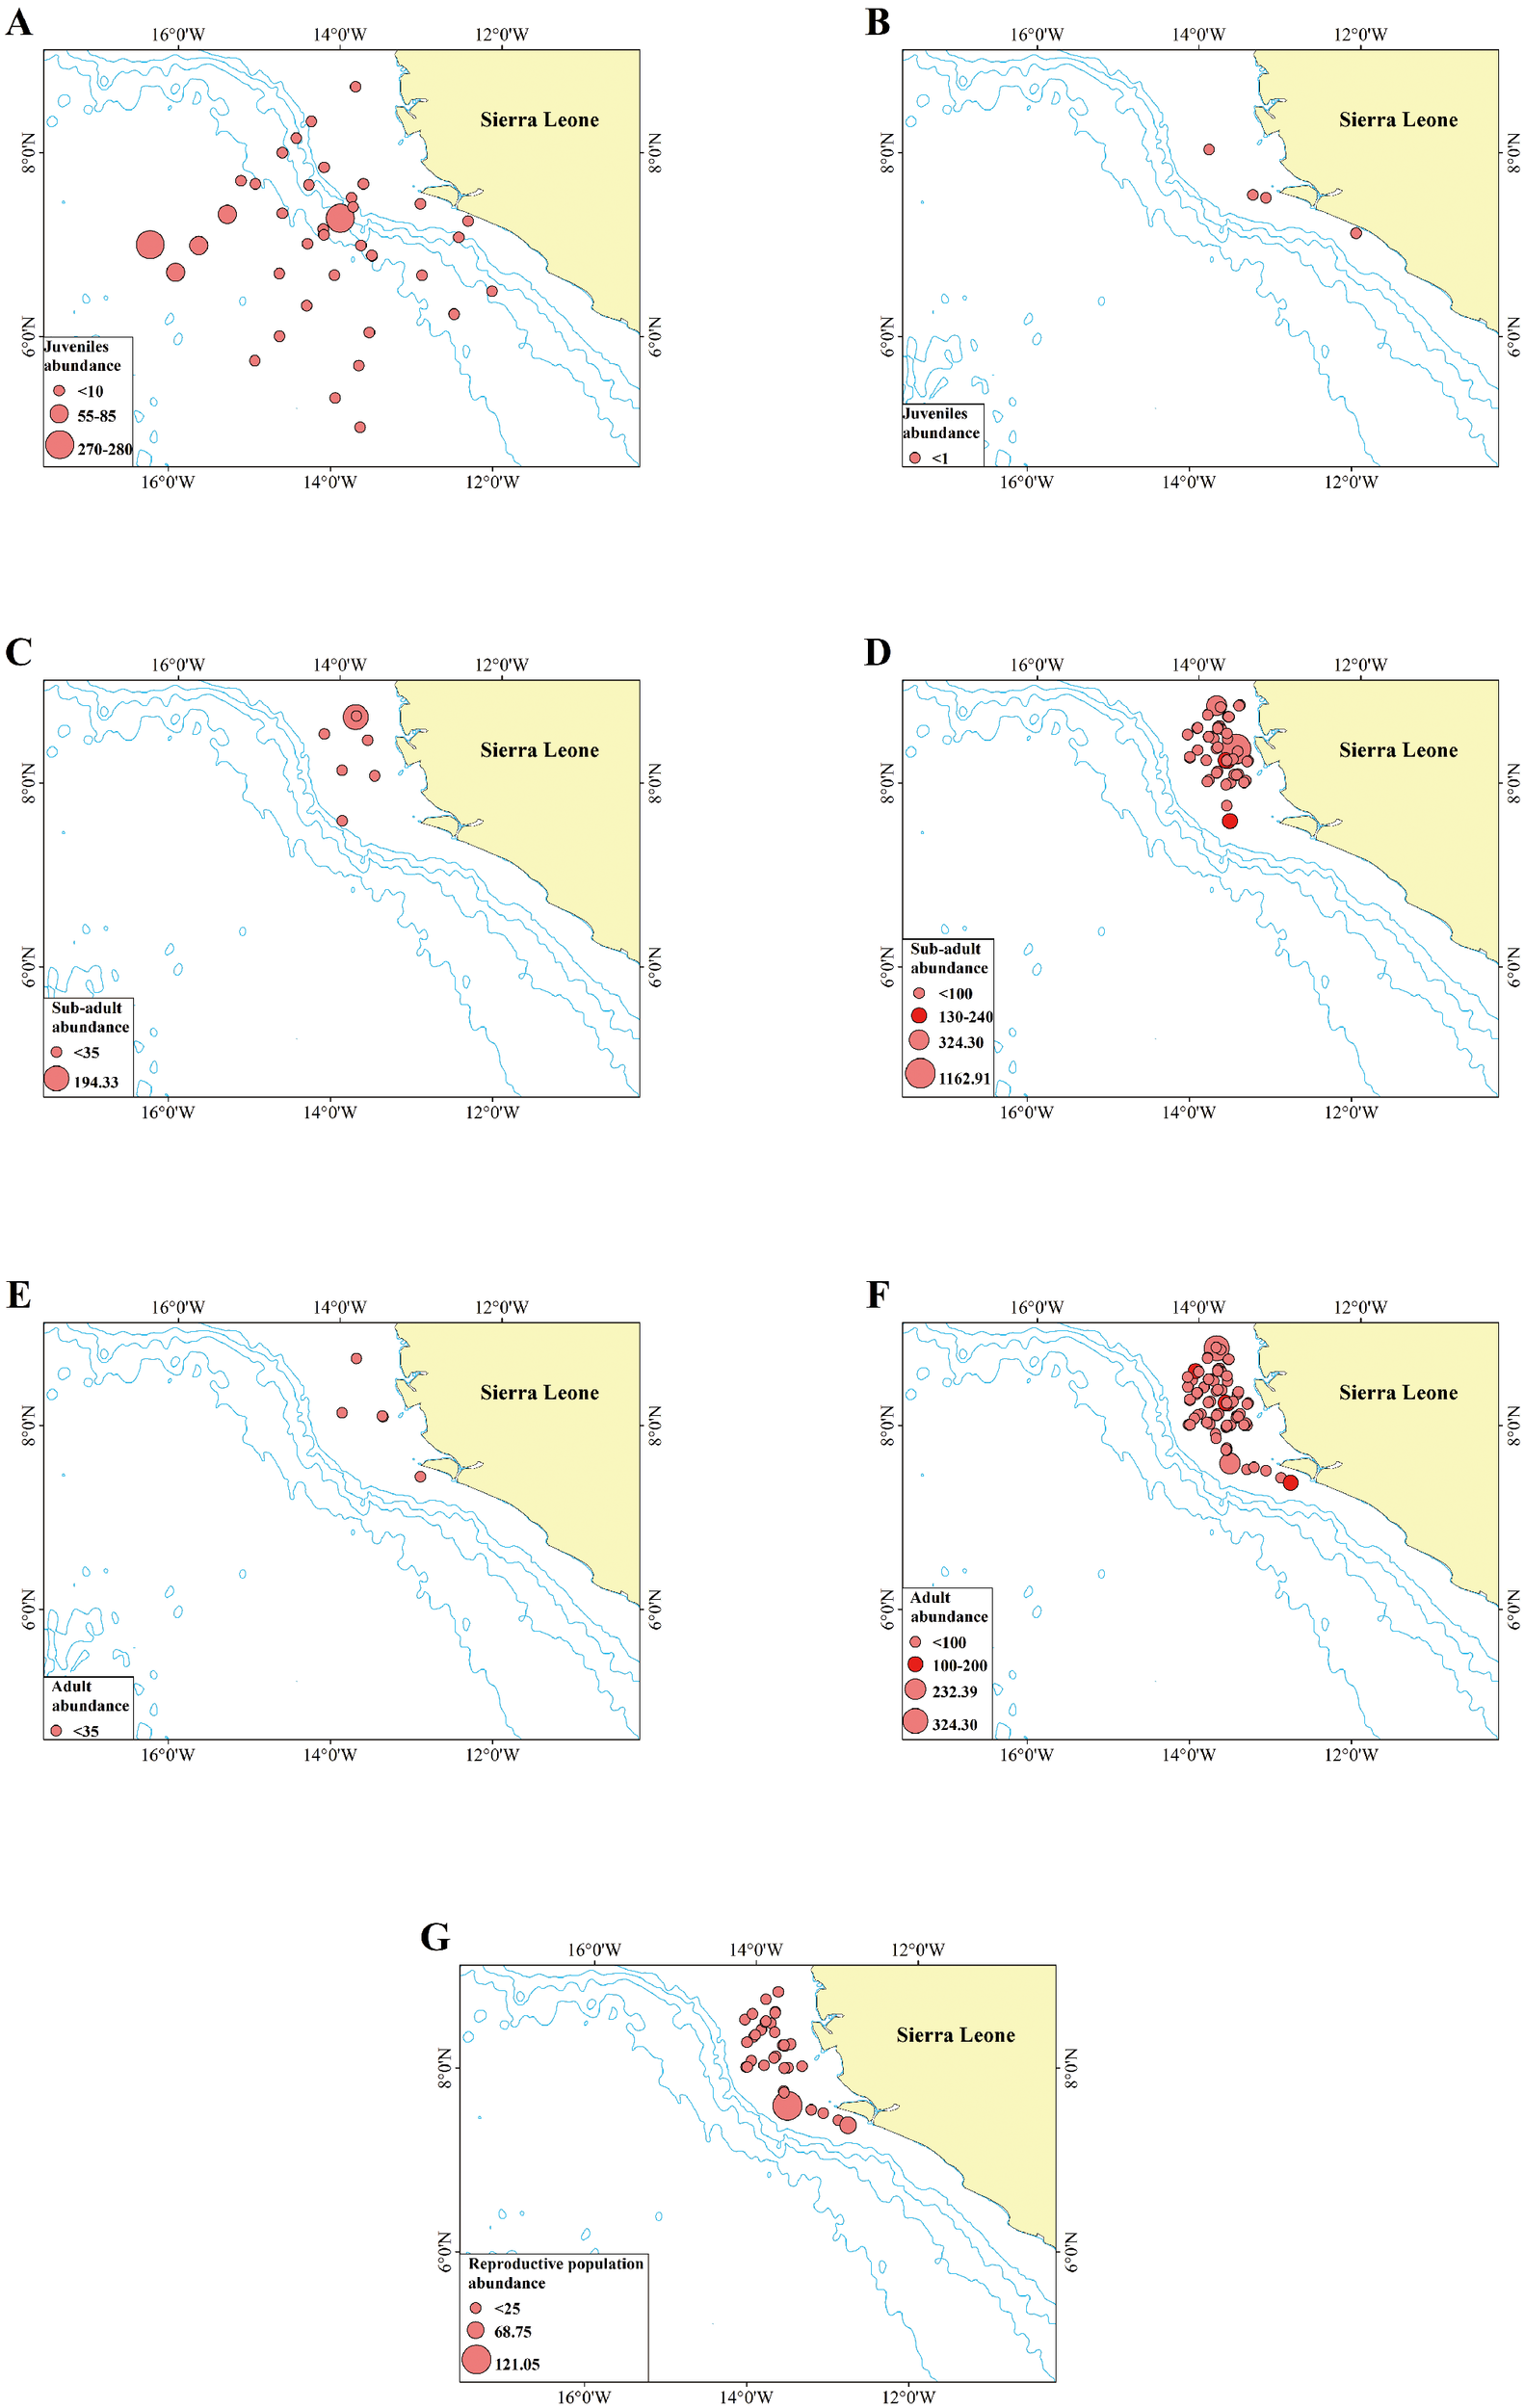
The distribution of juvenile individuals captured by pelagic survey (A) and demersal survey (B); sub-adult individuals captured by pelagic survey (C) and demersal survey (D) and adult individuals captured by pelagic survey (E) and demersal survey (F); reproductive individuals captured by demersal survey (G). The light blue line depicted in the figure represents the 1000-meter isobath. The bigger red circle represents higher abundance (kg/km2). Overlapping points are denoted by a darker red for clarity. Due to the different scales, the size of the circles in each figure does not represent the same abundance.
In contrast to juveniles, sub-adult individuals were predominantly captured during demersal surveys, with only seven stations recording sub-adults during pelagic surveys (Figure 2 C, D). This distribution pattern differs significantly from that of juveniles. One station during a pelagic survey recorded a high abundance of sub-adults (194.33 kg/km²); however, this station was located in a shallow area within the continental margin. This suggests a shift in habitat preference during the sub-adult stage.
Compared to sub-adults and juveniles, a higher number of adult individuals were captured during demersal surveys, with only five pelagic survey stations recording adults at low abundances (Figure 2 E, F). The transition in habitat preference from the pelagic zone beyond the continental margin to demersal areas within the continental shelf was most pronounced during this stage.
Individuals of the reproductive population were exclusively captured during demersal surveys (no individuals with gonad development levels exceeding 4 were recorded in pelagic surveys) and were distributed exclusively in demersal areas within the continental shelf (Figure 2 G).
3.2 Transforming in habitat preference
Since individuals captured beyond the continental margin were highly homogeneous in size (with the majority measuring less than 6 cm), data from stations located in shallow areas within the continental margin were selected for analysis. These stations encompass nearly all life history stages and a wide range of sizes, from small to large.
The results of the Pearson correlation analysis revealed a significant positive correlation between the body length, body weight, and fishing depth of P. arenatus (Table 2). Clearly, the transition in habitat preference occurred when individuals reached a body length of 60 mm (Figure 3).
Table 2
| Depth | Body length | Body weight | |
|---|---|---|---|
| Depth | 1 | ||
| Body length | .344** | 1 | |
| Body weight | .389** | .886** | 1 |
| **. The correlation is statistically significant at the 0.01 level (two-tailed). | |||
Pearson’s correlation coefficients between depth and body length and weight.
Figure 3
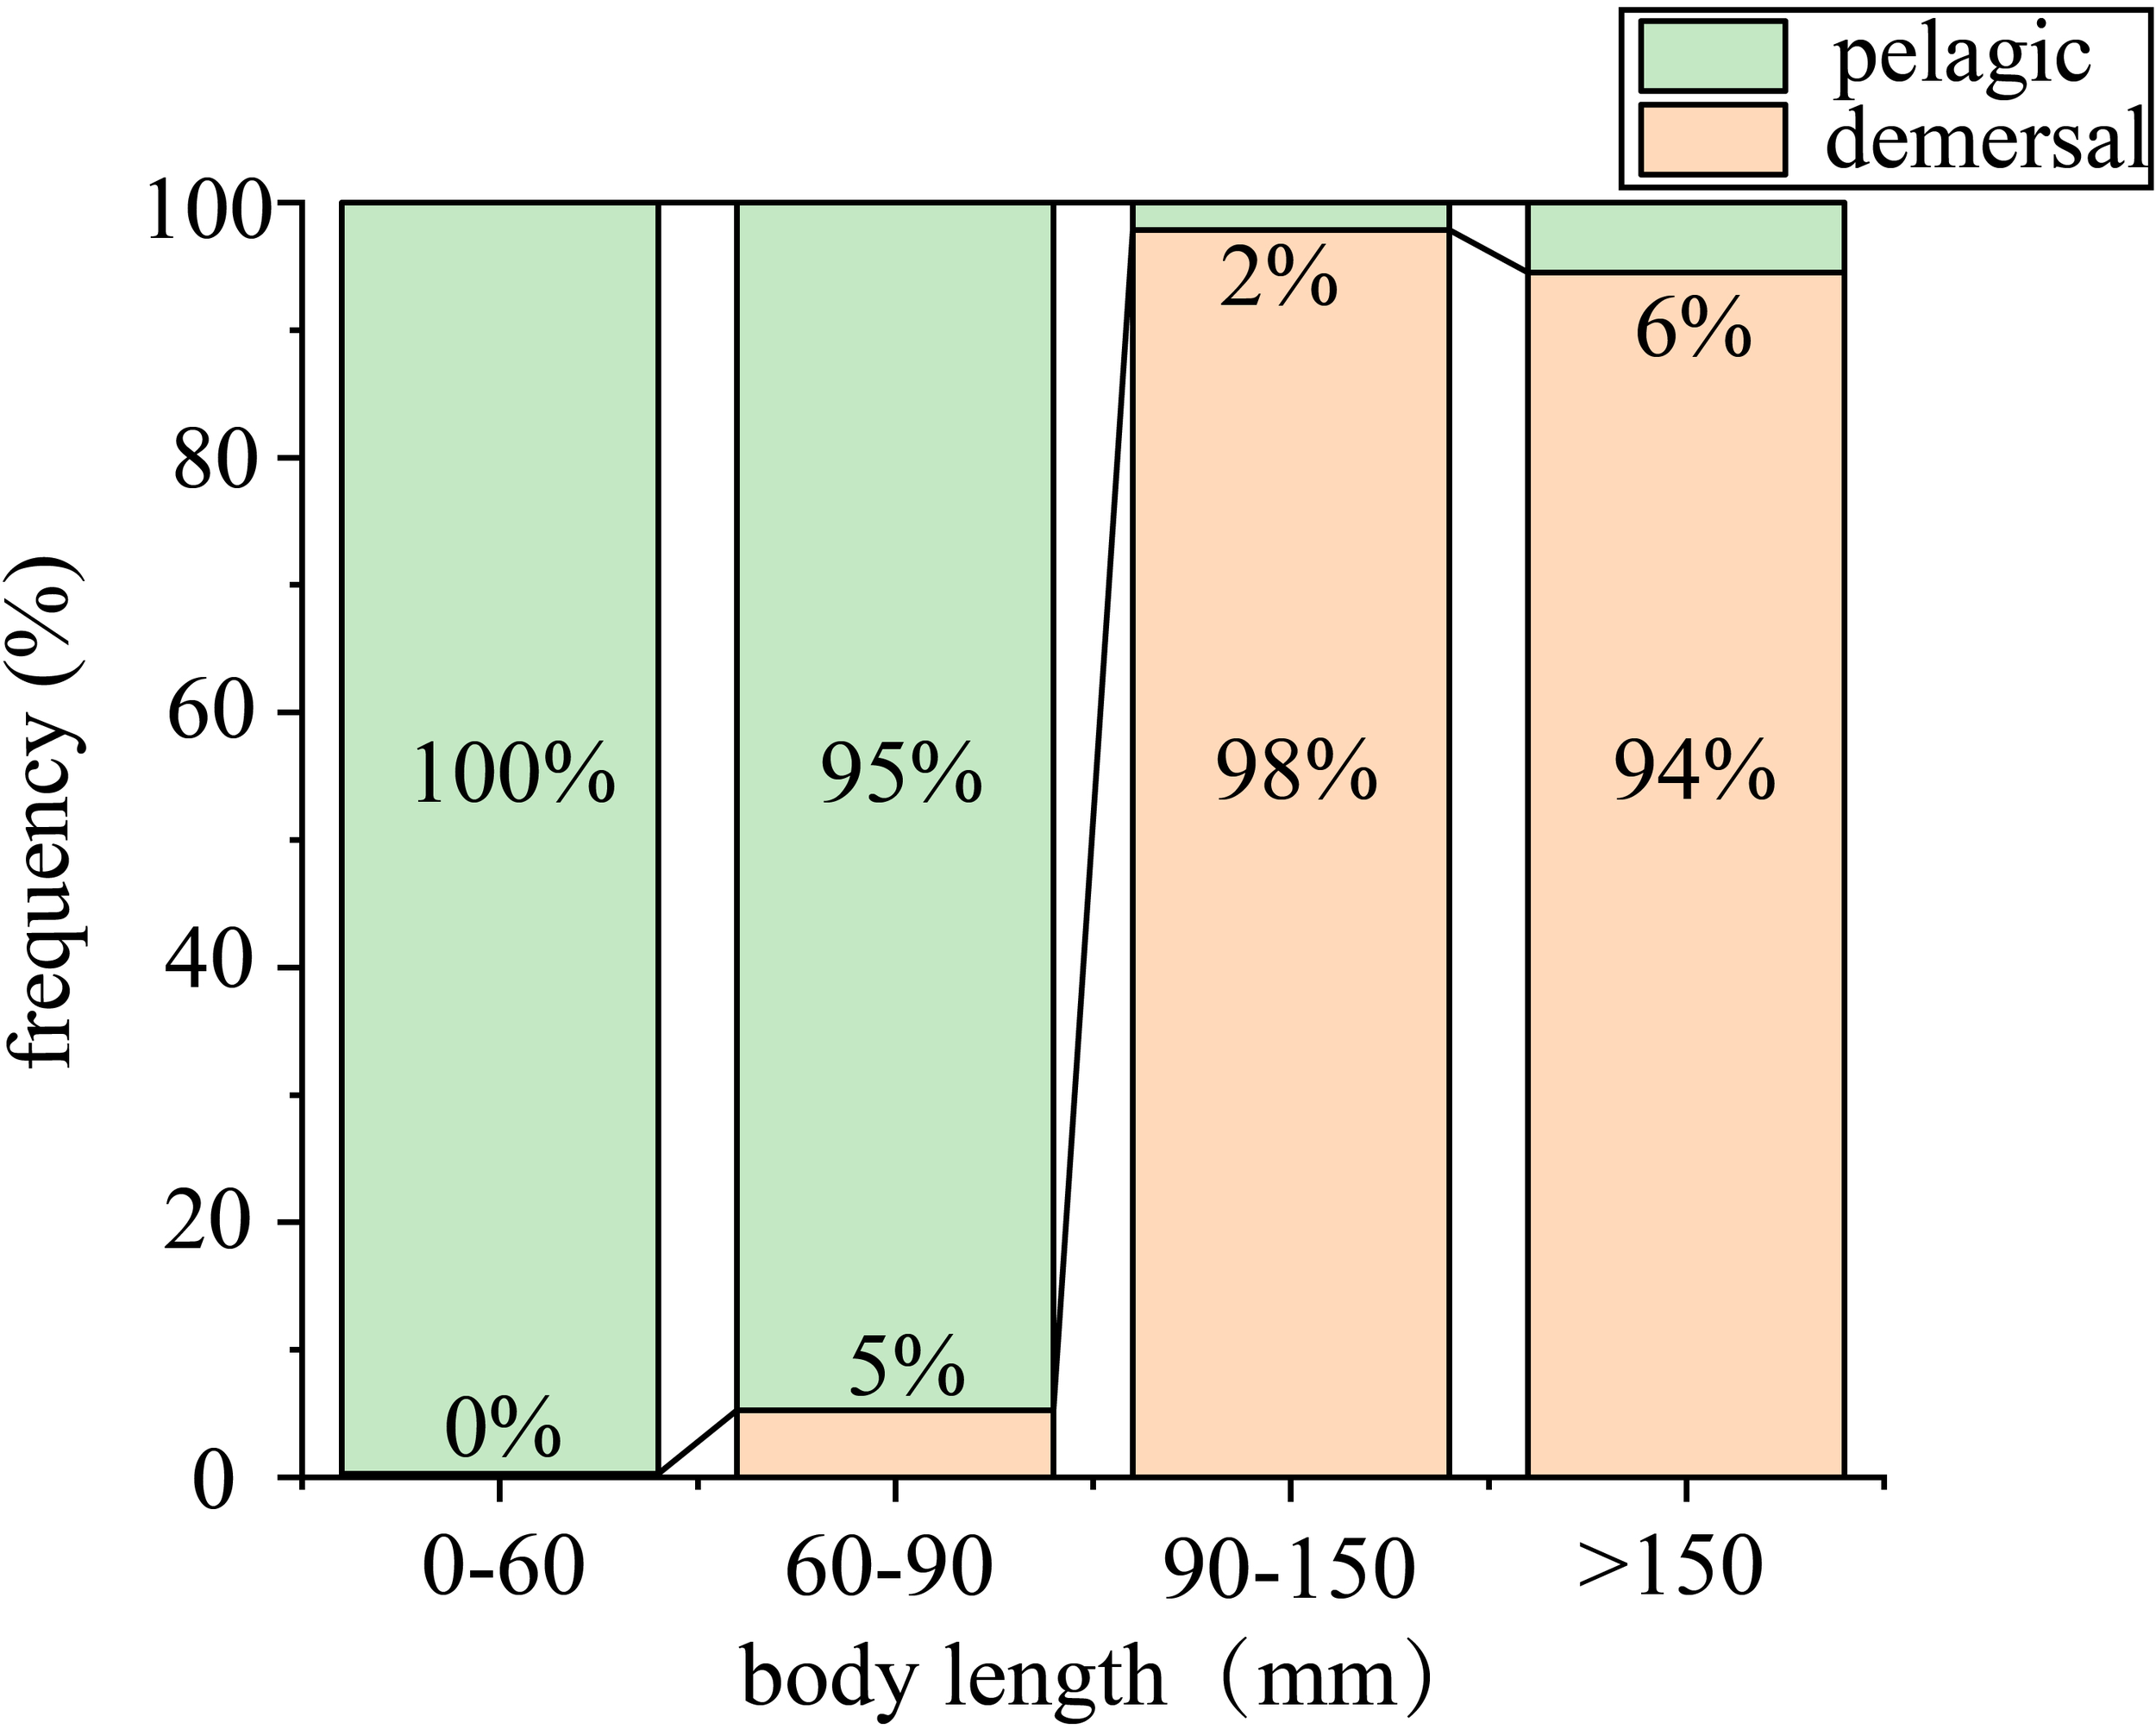
The frequency of different individual body length groups captured by pelagic survey and demersal survey. The green bar depicted in the figure represents the pelagic survey, and the orange bar represents the demersal survey.
3.3 Seasonal difference in population abundance and individual mean weight
Due to these data did not meet the assumptions of normality, so Mann-Whitney U non-parametric tests were applied. The results revealed a statistically significant difference in abundance between the rainy and dry seasons, with stations during the dry season exhibiting significantly higher abundances than those during the rainy season (p < 0.05, Table 3).
Table 3
| Rainy/Dry season | Abundance (kg/km2) | Z | p |
|---|---|---|---|
| Rainy season | 1.6009 (0.2692~15.2118) | -2.9530 | 0.0031 |
| Dry season | 9.4891 (2.1420~29.5237) |
The Mann-Whitney U test results for the abundance in rainy and dry seasons are presented below. p<0.05 indicating a statistically significant difference.
The numbers in parentheses represent the lower and upper quartiles.
As illustrated in Figure 4, the number of stations in the pelagic region beyond the continental margin that captured P. arenatus during the rainy season (33 stations) was more than three times that during the dry season (10 stations). During the rainy season, one station recorded an abundance of 40–60 kg/m², two stations recorded 60–80 kg/m², and two stations recorded abundances greater than 80 kg/m². In contrast, no stations in the outer part of the continental margin recorded abundances exceeding 20 kg/m² during the dry season. During the dry season, two stations recorded abundances of 80–100 kg/m², seven stations recorded 100–350 kg/m², and one station recorded an abundance greater than 350 kg/m². Conversely, no stations in the neritic zone within the continental margin recorded abundances exceeding 80 kg/m² during the rainy season.
Figure 4
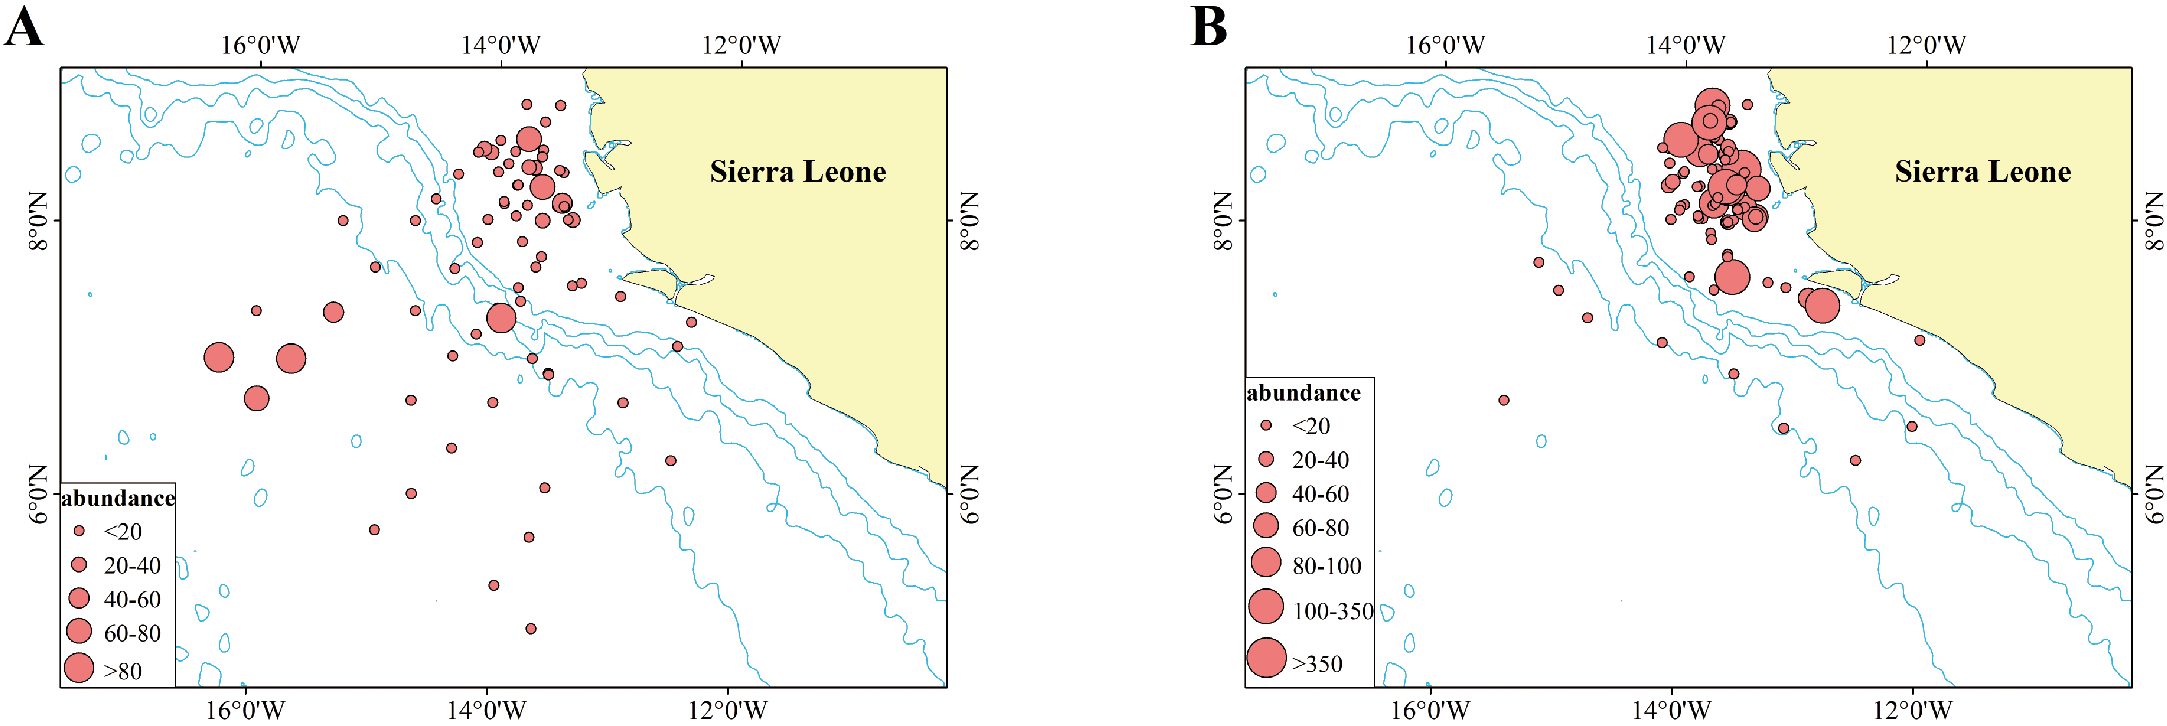
Abundance of P. arenatus recorded at each station during the rainy (A) and dry (B) seasons. The light blue line depicted in the figure represents the 1000-meter isobath. The bigger red circle represents higher abundance (kg/km2).
Our results indicated that mean individual weight of P. arenatus was significantly higher during the dry season than during the rainy season across the study site (p < 0.05, Table 4). As shown in Figure 5, during the rainy season in the pelagic zone beyond the continental margin, only one station captured P. arenatus with mean weights ranging from 90 to 220 g, and only one individual was recorded at this station. Furthermore, the remaining stations recorded individuals with mean weights all below 7 g. In the neritic zone within the continental margin, all five weight intervals were observed across stations, with the 90–220 g interval being the most frequent (21 stations). Similarly, during the dry season, the mean weight of individuals captured at all ten stations beyond the continental margin was below 7 g. In the neritic zone within the continental margin, all five weight intervals were present, with the 90–220 g interval being the most common (44 stations).
Table 4
| Rainy/Dry season | Mean weight (kg) | Z | p |
|---|---|---|---|
| Rainy season | 0.0042 (0.0024~0.1514) | -1.9936 | 0.0462 |
| Dry season | 0.0950 (0.0640~0.1381) |
The Mann-Whitney U test results for the mean weight in rainy and dry seasons are presented below. p<0.05 indicating a statistically significant difference.
The numbers in parentheses represent the lower and upper quartiles.
Figure 5
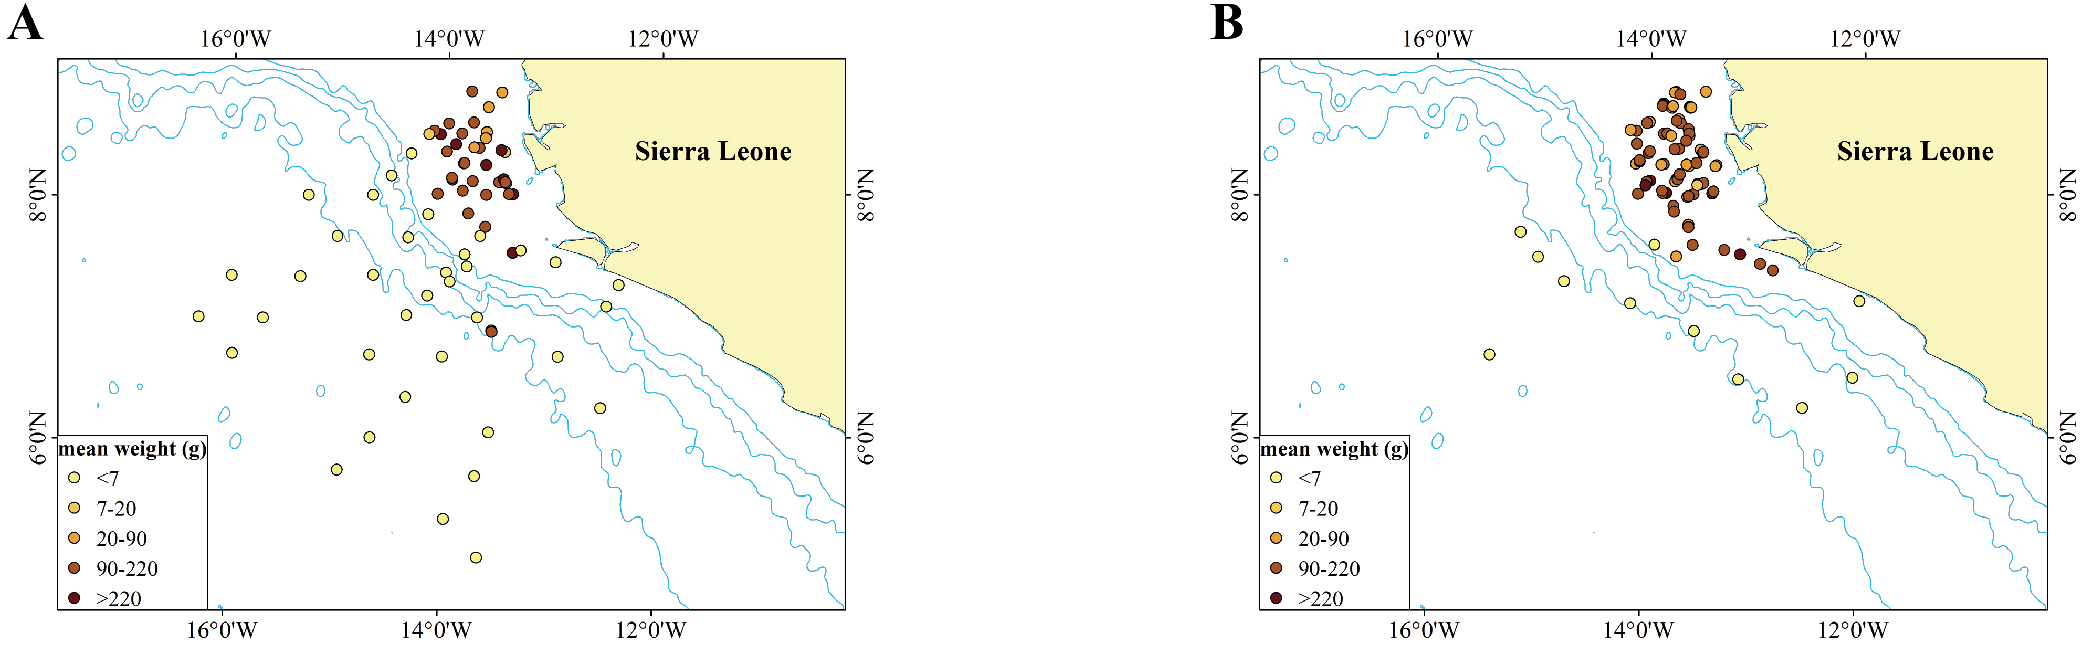
Mean body weights of captured P. arenatus at each site in the rainy season (A) and the dry season (B) The light blue line depicted in the figure represents the 1000-meter isobath.
3.4 Analysis of relevant environmental factors
3.4.1 Difference in precipitation between the rainy season and the dry season
We conducted comparative analyses of seasonal precipitation patterns using data collected during peak climatic periods: July (mid-rainy season) and January (mid-dry season), across our study area (17°W-11°W, 4°N-9°N) from 2019 to 2021. The results demonstrated significant seasonal differences in daily precipitation from 2019 to 2021 in this area (non-parametric test, Table 5), with rainy season measurements showing substantially higher values for both daily and monthly total precipitation (Figure 6).
Table 5
| Year | Season | Monthly total precipitation | Z | p |
|---|---|---|---|---|
| 2019 | Mid-rainy season | 6397.1411 (2840.1651~8899.0395) | -6.6099 | <0.01 |
| Mid-dry season | 652.3244 (164.0699~1016.8731) | |||
| 2020 | Mid-rainy season | 4959.0120 (1563.2296~7159.5306) | -5.7223 | <0.01 |
| Mid-dry season | 747.5094 (95.7260~705.4143) | |||
| 2021 | Mid-rainy season | 7195.7271 (3406.0512~9367.8198) | -6.2720 | <0.01 |
| Mid-dry season | 1150.3471 (497.3166~1374.3124) |
The Mann-Whitney U test results for the daily precipitation between rainy and dry seasons in 2019–2021 are presented below. p<0.05 indicating a statistically significant difference.
The numbers in parentheses represent the lower and upper quartiles.
Figure 6
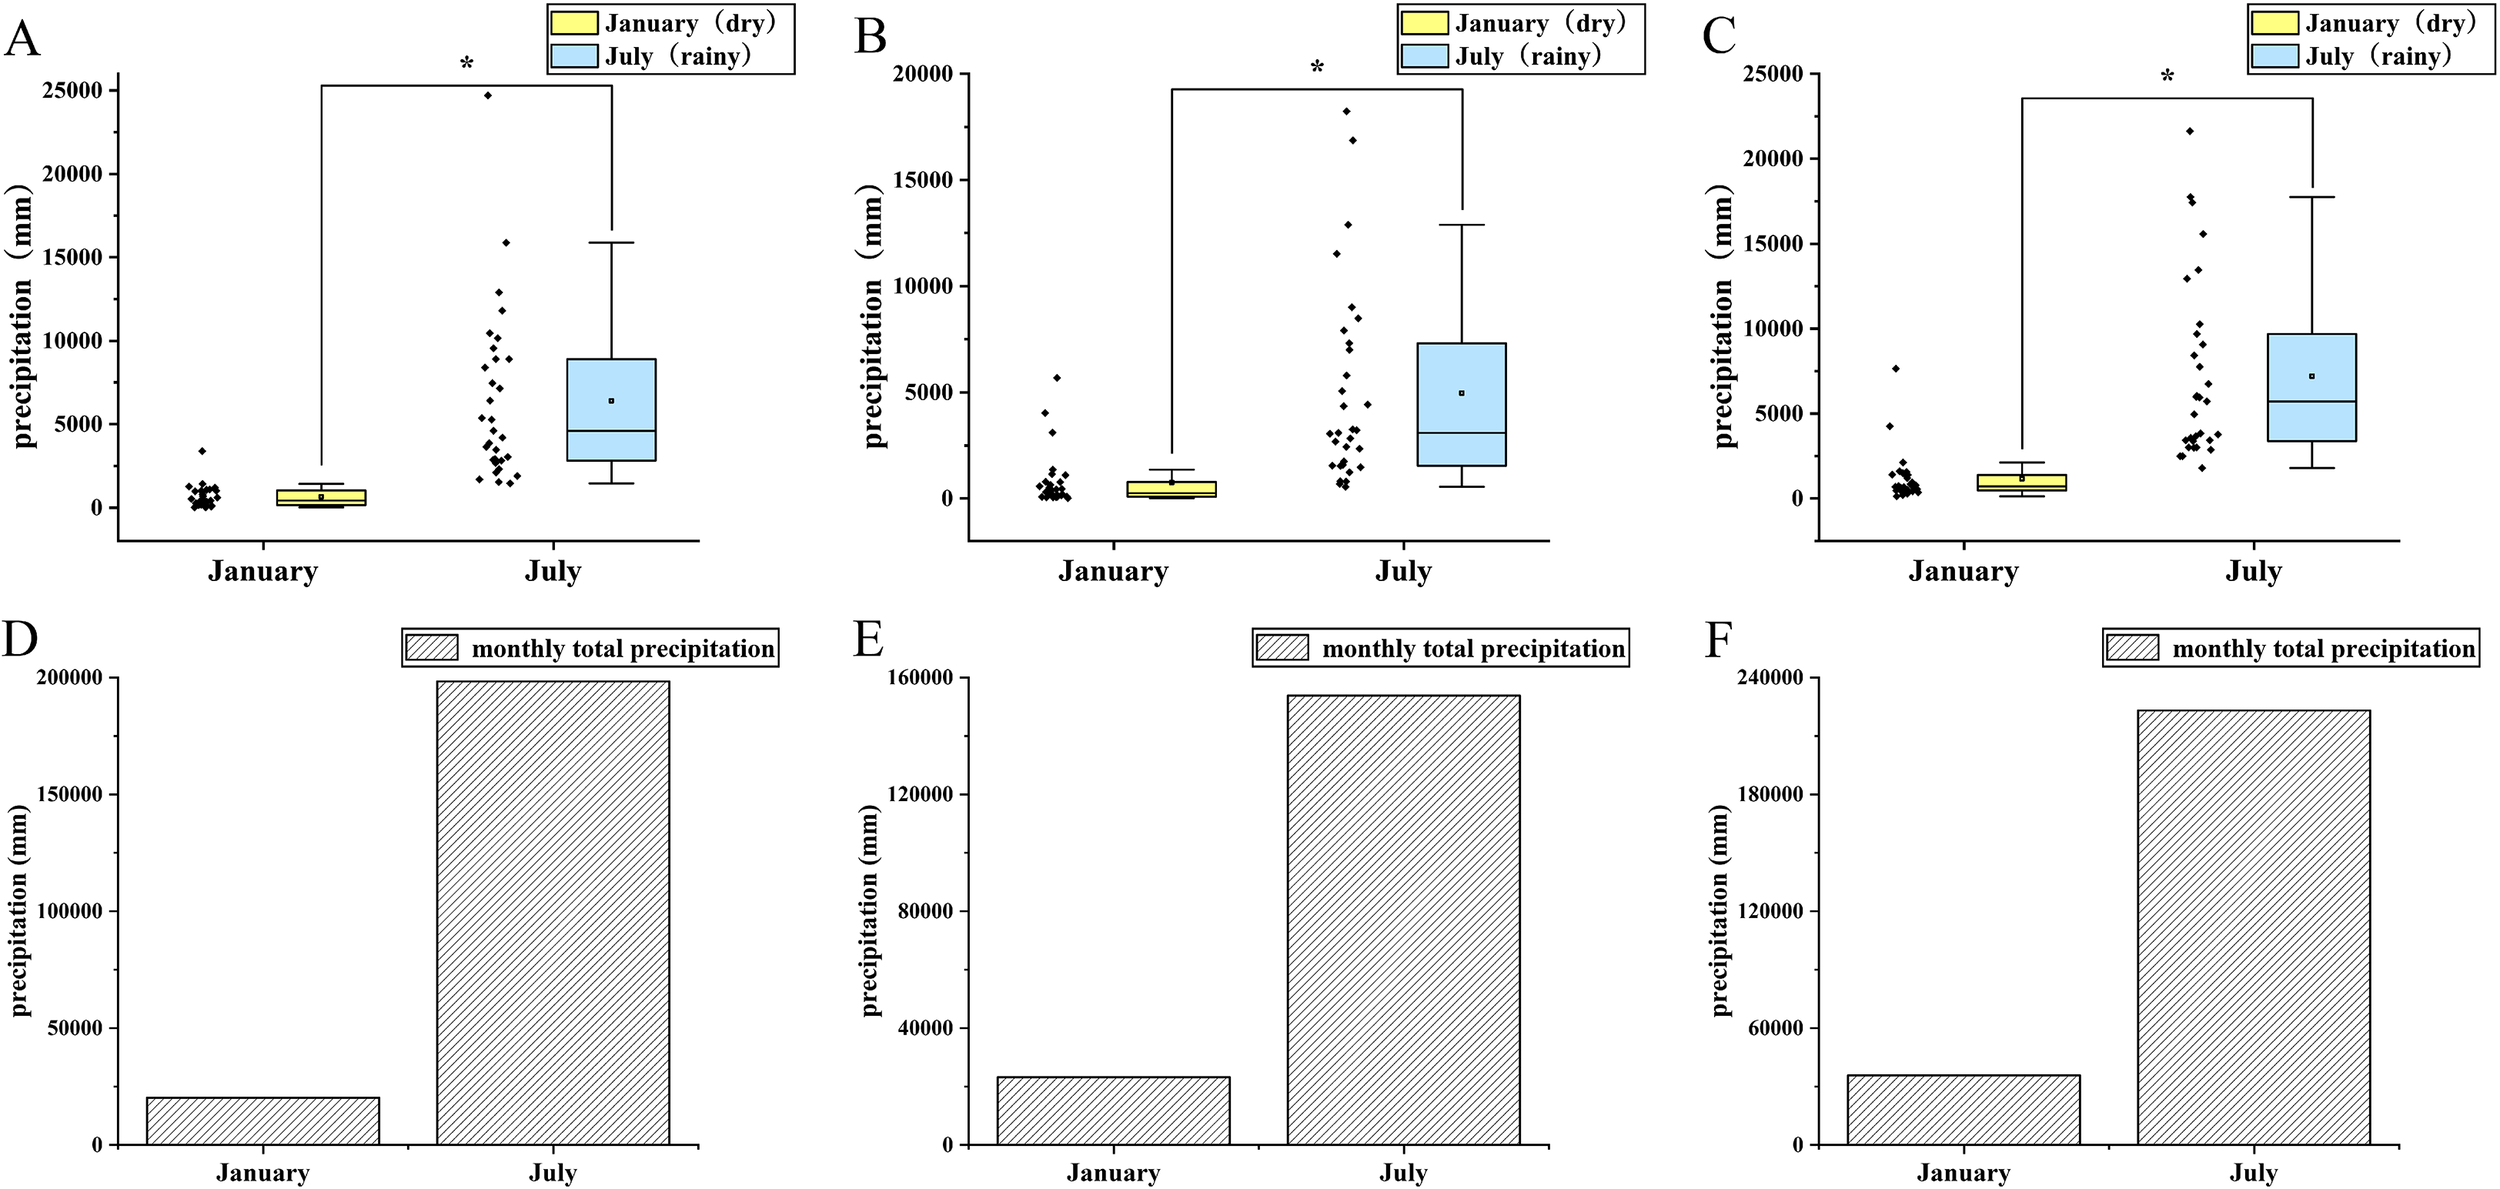
The difference between the average daily rainfall and the total monthly rainfall in the middle of the dry season and the middle of the rainy season in the study area. (A) average daily precipitation in 2019; (B) average daily precipitation in 2020; (C) average daily precipitation in 2021; (D) monthly total precipitation in 2019; (E) monthly total precipitation in 2020; (F) monthly total precipitation in 2021.
These pronounced hydrological variations suggest corresponding fluctuations in surface runoff dynamics, which may subsequently influence the spatial distribution of juvenile fish populations along the coastal margin.
3.4.2 Multicollinearity analysis and environmental factors on mean weight and abundance
VIF (Variance Inflation Factor) is a statistical indicator used to diagnose multicollinearity among independent variables in a regression model. The results of a VIF-based multicollinearity diagnosis are shown in Table 6. The VIF values for all environmental variables were below 2, indicating no substantial multicollinearity issue, and the effects of each variable can be interpreted independently. The results of the first GLMMs on mean body weight indicated that EV and T had a significant negative effect on the mean weight of P. arenatus at each site, whereas S, NV, and SP had a non-significant effect on the mean weight of P. arenatus (Table 7a, Figure 7A). Moreover, the results of the second GLMMs on abundance indicated that T and S had a significant negative effect on the abundance of P. arenatus at each site, while EV had a positive effect on the abundance of P. arenatus at each site. Conversely, SP and NV had a non-significant effect on the abundance of P. arenatus at each site. (Table 7b, Figure 7B).
Table 6
| Factors | VIF |
|---|---|
| Surface pressure (SP) | 1.055 |
| Northward Velocity (NV) | 1.311 |
| Eastward Velocity (EV)) | 1.189 |
| Salinity (S) | 1.099 |
| Temperature (T) | 1.151 |
Multicollinearity diagnosis results.
Table 7
| (a)Parameter | Estimate | Std. Error | Z value | P-value |
|---|---|---|---|---|
| (intercept) | -3.02455 | 0.42323 | -7.146 | 8.91E-13 |
| SP | 0.16414 | 0.08666 | 1.894 | 0.05822 |
| NV | -0.0752 | 0.10355 | -0.726 | 0.46766 |
| EV | -0.22907 | 0.09469 | -2.419 | 0.01555 |
| S | -0.12288 | 0.16087 | -0.764 | 0.44496 |
| T | -0.4821 | 0.1559 | -3.092 | 0.00199 |
| (b) | ||||
| (intercept) | 1.54142 | 0.53208 | 2.897 | 3.77E-03 |
| SP | -0.06921 | 0.2176 | -0.318 | 0.75043 |
| NV | 0.09588 | 0.21367 | 0.449 | 0.65362 |
| EV | 0.48878 | 0.21349 | 2.289 | 0.02205 |
| S | -0.71152 | 0.31063 | -2.291 | 0.02199 |
| T | -1.01926 | 0.33938 | -3.003 | 0.00267 |
Model output from GLMMs: (a) mean weight versus Sea surface temperature (T), salinity (S), sea surface pressure (SP), northerly current (NV), and easterly current (EV); (b) model output from GLMMs of abundance versus Sea surface temperature (T), salinity (S), sea surface pressure (SP), northerly current (NV), and easterly current (EV).
Figure 7
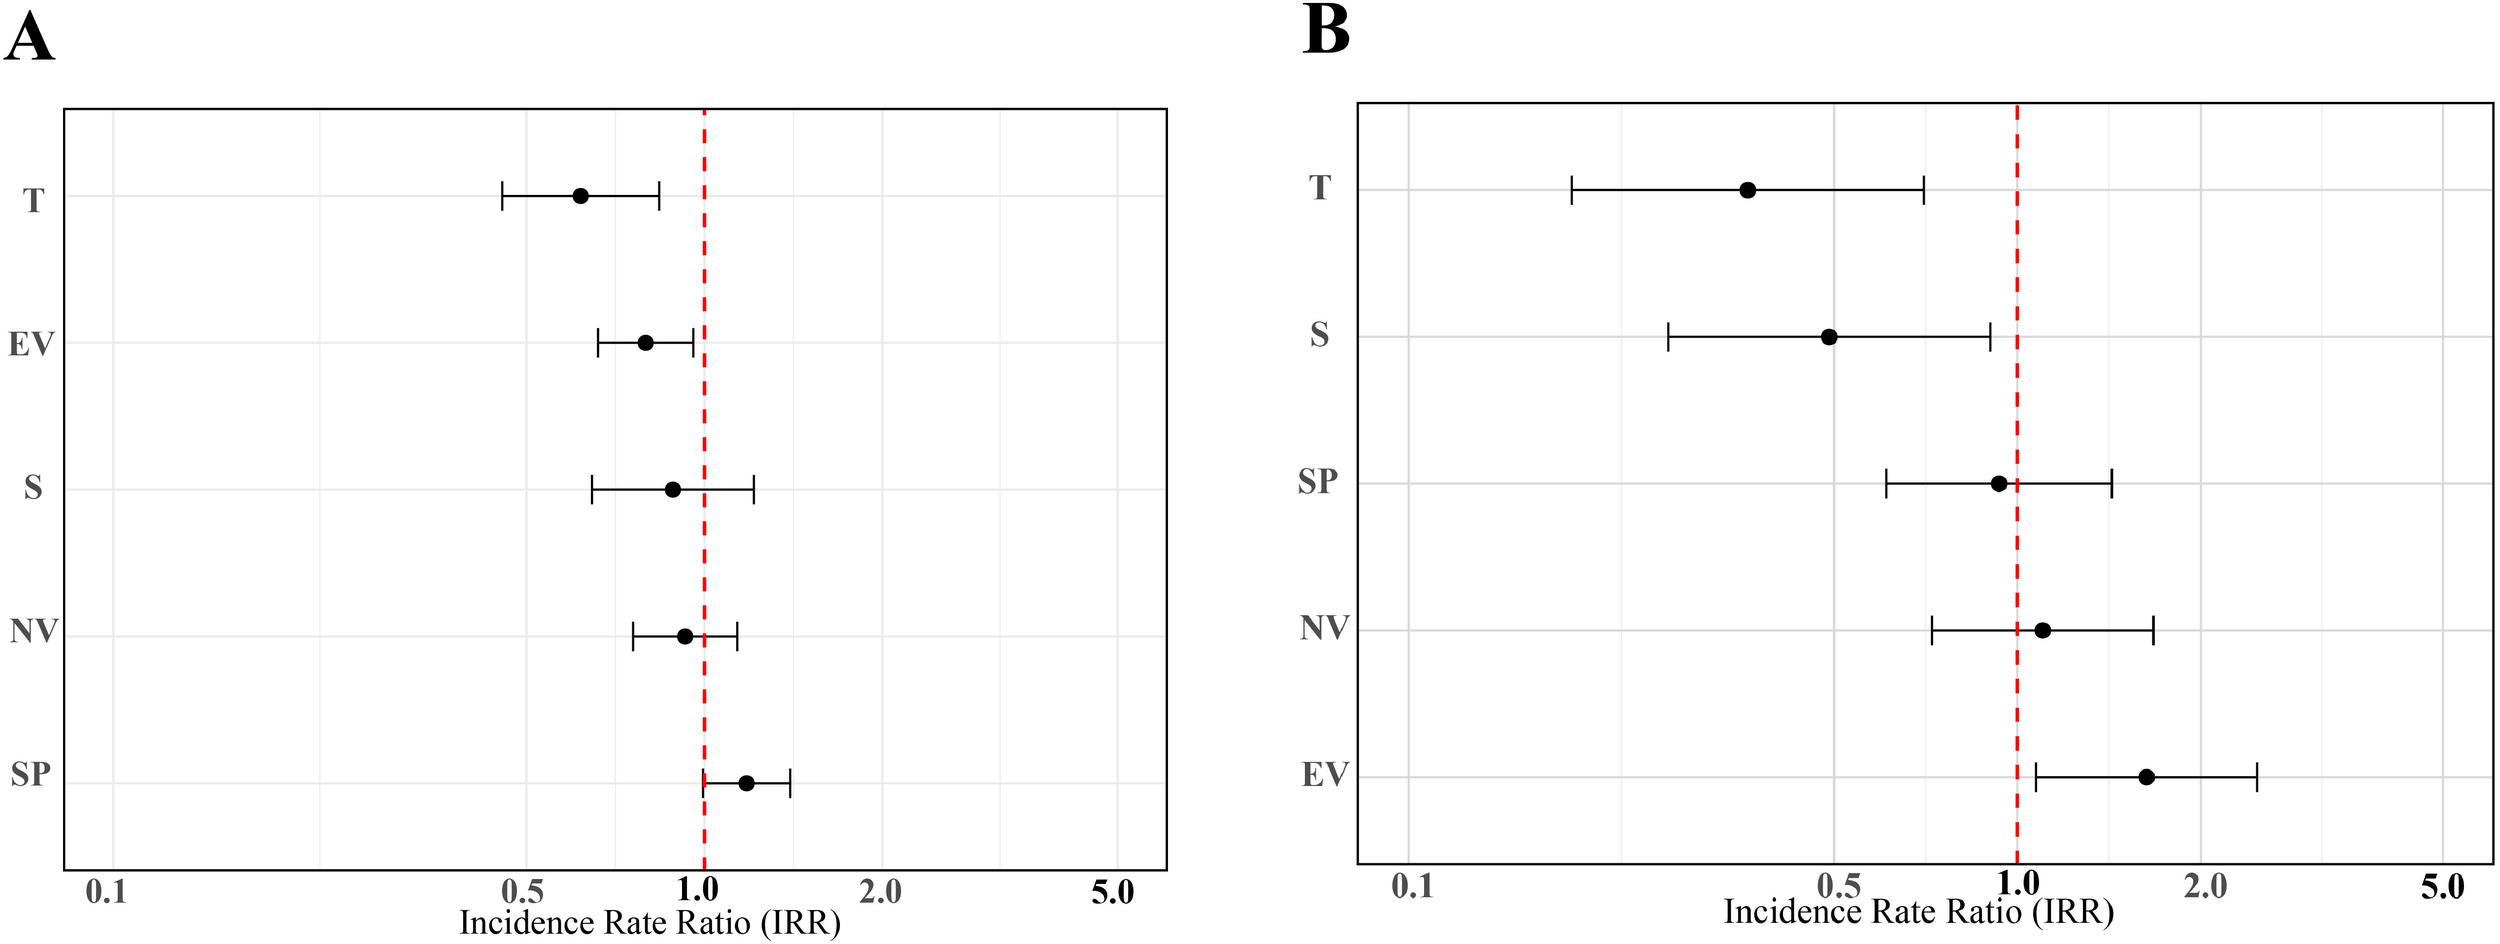
Visualization of parameter estimates from GLMMs comparing P. arenatus mean weight (A) and abundance (B). The red dotted vertical bar indicates no statistically significant effect of that covariate level on the response variable.
4 Discussion
This study provides critical baseline information on the distribution patterns and ontogenetic habitat shifts of Atlantic bigeye (P. arenatus) across different life stages in the coastal waters of Sierra Leone. The results indicate that: (1) Juveniles (body length <60 mm) were predominantly distributed in pelagic waters beyond the continental shelf. A distinct habitat transition occurred at approximately 60 mm in body length. This transitional phase was characterized by a progressive migration from pelagic waters to shelf demersal habitats. Full maturation (at a body length of approximately 150 mm) marked the final transition to a nearshore benthic lifestyle. (2) Peak captures of Atlantic bigeye juveniles occurred from April to May (pre-rainy season) and September to October (pre-dry season), suggesting a potential correlation with spawning. (3) Environmental drivers: GLMMs indicated that mean weight showed significant correlation with eastward current and temperature, whereas abundance was primarily influenced by salinity, temperature, and eastward current velocity.
4.1 Ontogenetic habitat shifts and distribution patterns
Despite its significant economic value in Sierra Leone, the Atlantic bigeye (P. arenatus) remains understudied regarding its life history and distribution patterns. Current knowledge is largely limited to adult ecology, with Cardozo et al. (2018) documenting their demersal habitat preference. However, substantial knowledge gaps persist concerning the juvenile life stages within this species, as well as for the Priacanthidae family in general. Our study reveals that juvenile Atlantic bigeye predominantly occupies pelagic waters, like many other marine teleost larvae and juveniles (Montgomery et al., 2006; Leis et al., 2011; Baldwin, 2013; Santana-Garcon et al., 2014). This finding contrasts markedly with the demersal behavior observed in adults, suggesting a complex life history strategy involving habitat transition during development, which is relevant to reduce resource competition and predation risk across different life stages (Meador and Brown, 2015; Peterson et al., 2000).
Although there is a lack of data related to reproduction and eggs, the habitat preferences and locations of Atlantic bigeye across different life stages from juveniles to adult have been identified. The life history of Atlantic bigeye in this region can be summarized as follows: after spawning within the continental shelf, eggs and juveniles are influenced by river runoff and ocean currents, dispersing to pelagic waters beyond the shelf, similar to other species (Baldwin, 2013). At approximately 60 mm in length, gonad development begins, marking the transition to the sub-adult stage. Individuals then migrate from pelagic areas outside the continental shelf to demersal areas within the shelf. Upon reaching approximately 150 mm, individuals attain adulthood and reproductive capacity, transitioning fully to a demersal, benthic lifestyle (Figure 8). The observed spatial segregation between life stages supports a bipartite life history strategy: adults occupy shelf habitats for reproduction, while pelagic waters serve as nursery grounds for juveniles. This pattern is consistent with other congeneric species, such as P. tayenus, which also transitions from pelagic to demersal habitats around 35–55 mm BL (Caldwell, 1962; Starnes, 1988). While the exact size at transition may vary, the consistency in this behavioral shift across related species underscores its evolutionary adaptation for maximizing survival and reproductive success. The strong positive correlation between body length, weight, and depth (Table 2) further supports the conclusion that larger, older individuals inhabit deeper demersal waters on the continental shelf.
Figure 8
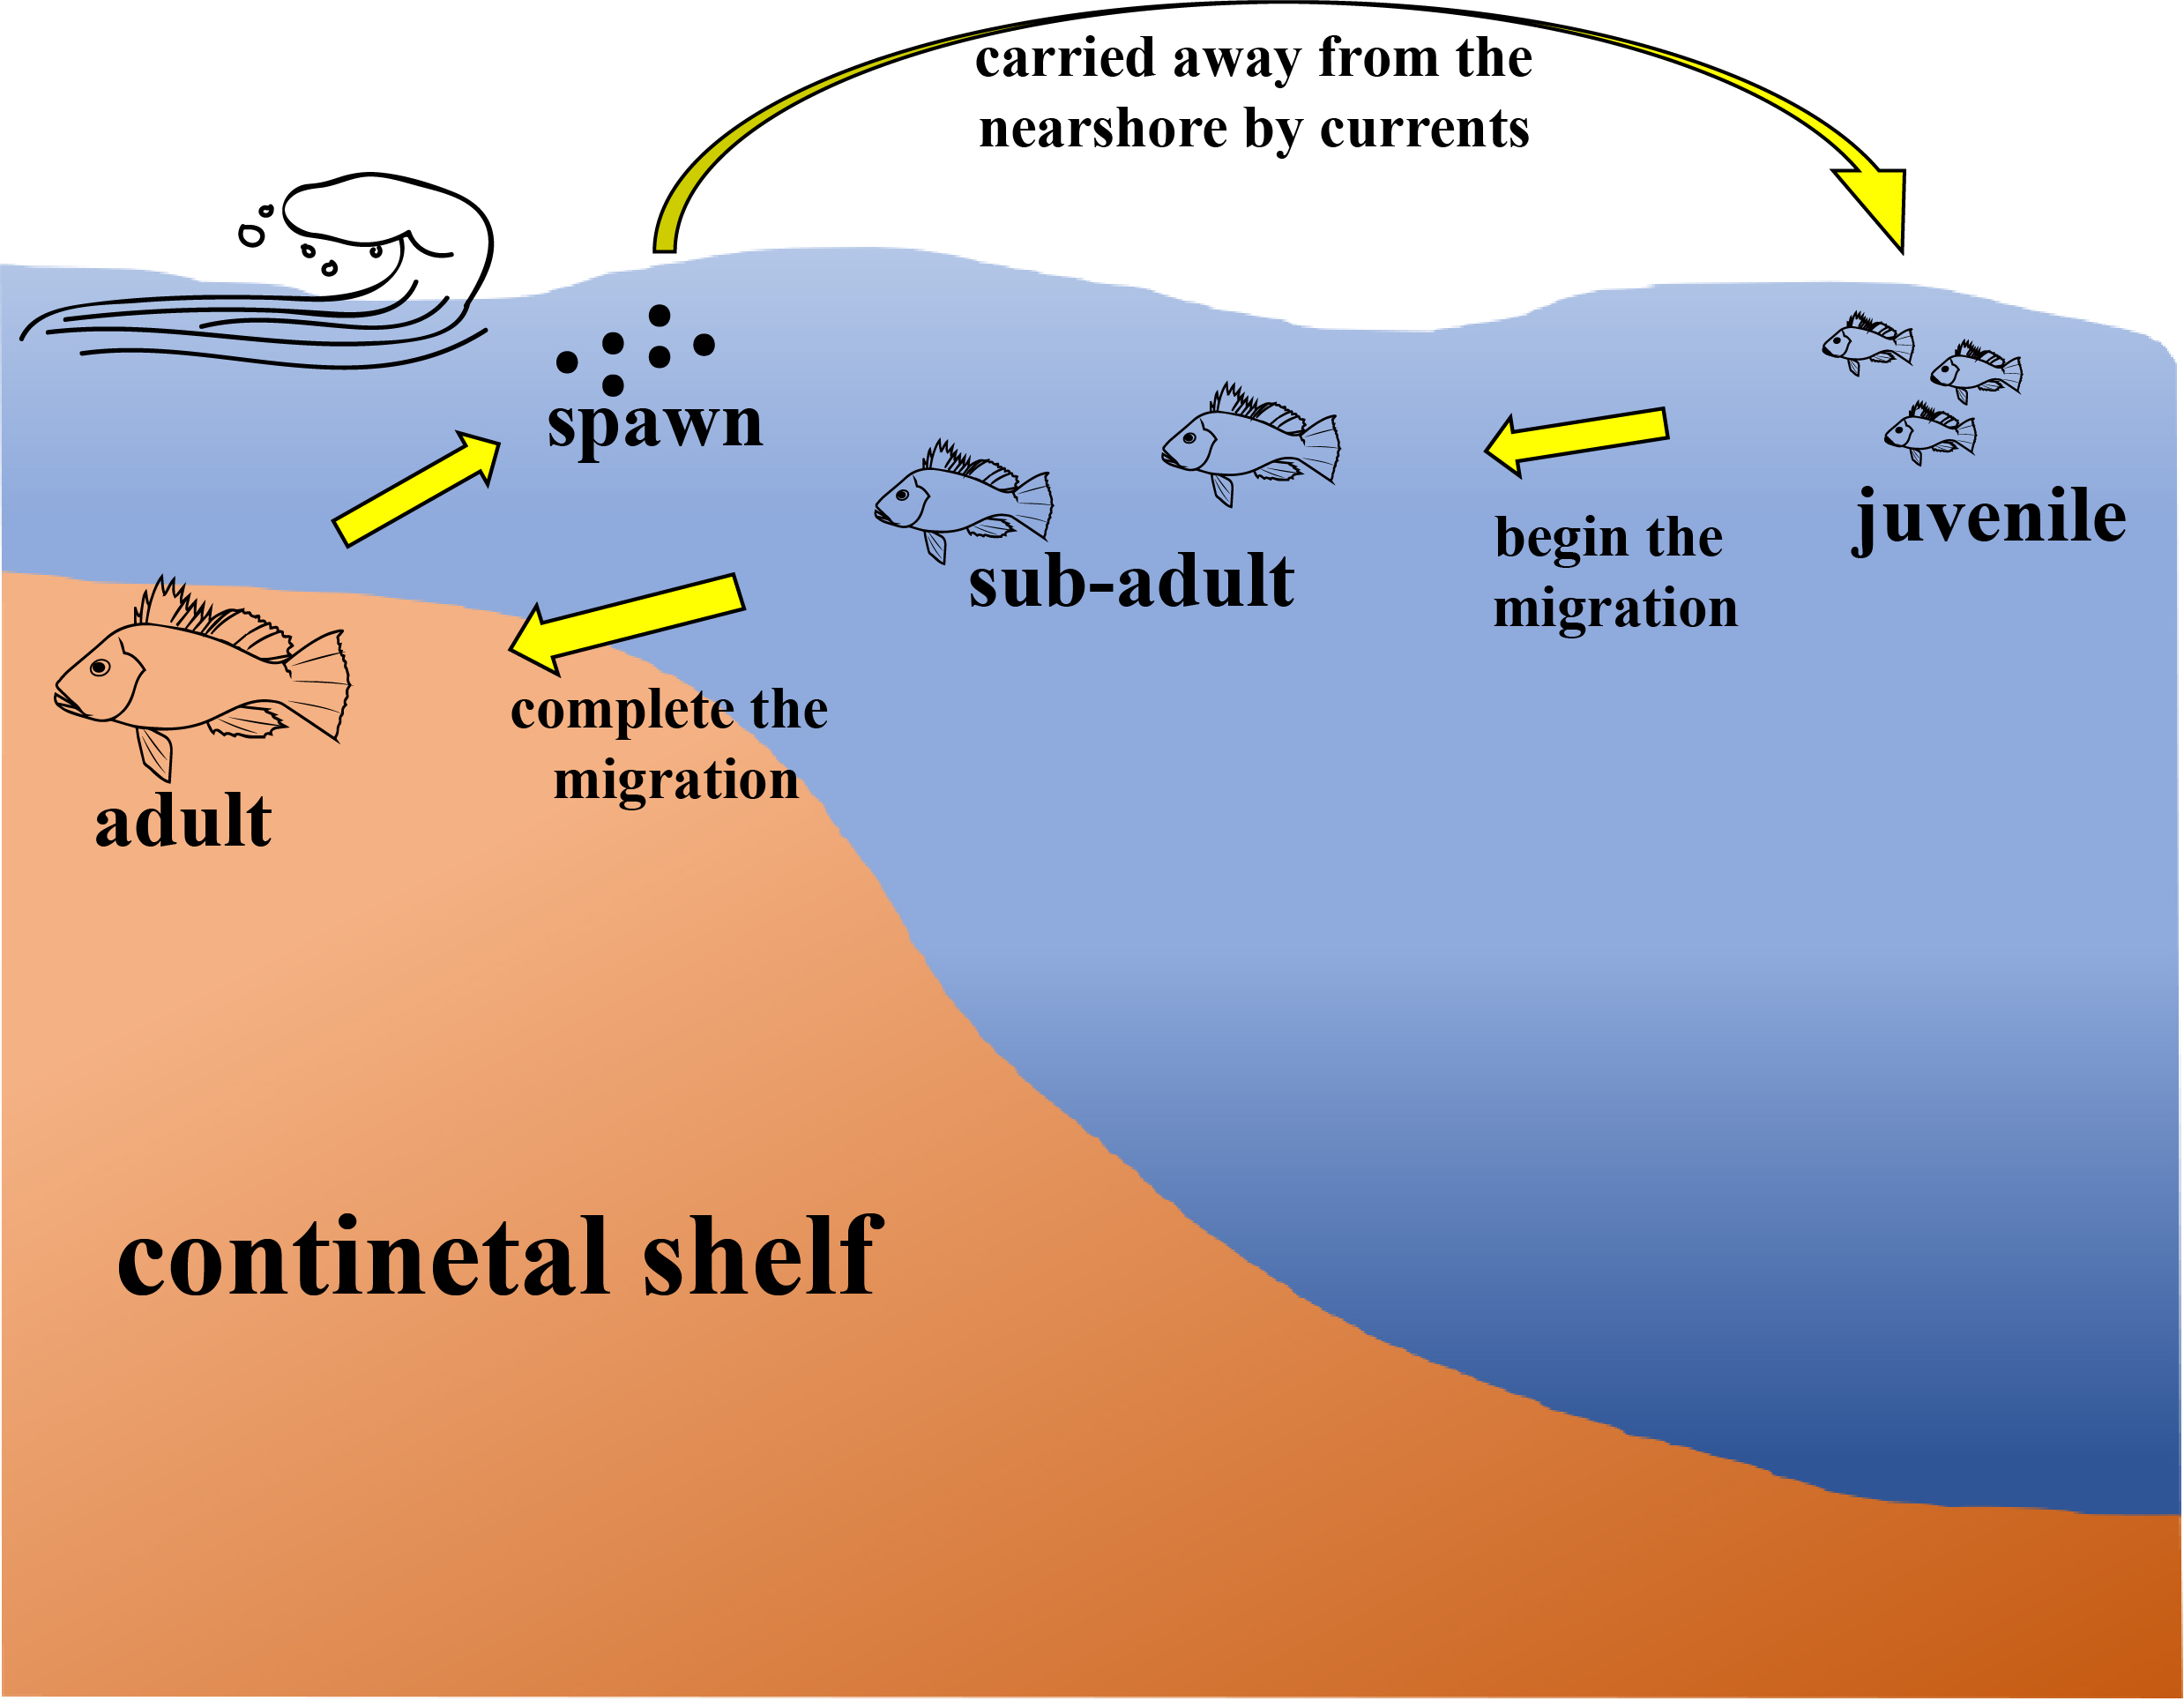
A schematic diagram of shifting habitat preferences during different life history stages of Atlantic bigeye P. arenatus.
4.2 Seasonal variation and reproductive timing prediction
Reproductive strategies exhibit considerable interspecific variability (Johannes, 1978; Brochier et al., 2009). To date, no studies have investigated the reproductive timing of Atlantic bigeye. Our results show that reproductive individuals were exclusively captured in demersal surveys, with the smallest mature individual measuring 148 mm in body length. Spawning adults were mainly distributed in continental shelf waters.
Reproductive timing plays a fundamental role in determining reproductive success and offspring survival by regulating mating opportunities and shaping the environmental conditions experienced by early life stages (Lowerre-Barbieri et al., 2011; Juntti and Fernald, 2016). A thorough understanding of reproductive timing is essential for predicting population recruitment, guiding recovery efforts, and implementing effective fisheries management strategies (Carson et al., 2010; Lowerre-Barbieri et al., 2011; Brown-Peterson et al., 2011). Although direct observations of spawning events were beyond the scope of this study, the size distribution and timing of juvenile catches suggest possible biannual peaks in reproductive activity—around April–May and September–October—corresponding to the transitions between dry and rainy seasons. This inference is based on the appearance of juvenile cohorts following these periods, a common approach in fisheries studies where direct reproductive data are scarce (Lowerre-Barbieri et al., 2011). However, without gonad somatic index (GSI) data or detailed larval staging, these inferences remain tentative. These seasonal peaks may reflect adaptive responses to optimal environmental conditions, including enhanced food availability and improved larval survival conditions. The observed seasonal variation in reproduction likely influences population dynamics through multiple pathways, including effects on potential age truncation due to size-selective fishing pressure (Marcano et al., 2007; Pecquerie et al., 2009; Wright and Trippel, 2009). These findings provide critical biological reference points for fisheries management, particularly in identifying when spawning stock protection may be most impactful. Further research should investigate the environmental drivers of these reproductive peaks and their consequences for recruitment variability.
Tropical fishes generally exhibit prolonged reproductive seasons compared to cold-water species, which are often constrained by strong seasonal variability. This extended reproductive period results in a broader temporal distribution of spawning events, leading to significant intra-annual variation in juvenile life-history traits (Lowerre-Barbieri et al., 1998). Additionally, the extended reproductive window increases mating opportunities for sexually mature individuals, thereby enhancing population recruitment and resilience (James et al., 2003; Drazen and Haedrich, 2012). The Atlantic bigeye (P. arenatus) demonstrates a year-round reproductive strategy, with the consistent presence of individuals at advanced gonadal stages in demersal trawl. Furthermore, we speculated at least two distinct spawning peaks annually based on the data. This reproductive plasticity likely contributes to population stability and sustained recruitment in the Sierra Leone coastal region, where resource availability and predation pressures fluctuate less predictably than in temperate zones.
This study provides a preliminary assessment of reproductive timing in Atlantic bigeye, based on seasonal distribution of different life history populations. However, geographical variations are likely to exist. Environmental differences can lead to variability in reproductive timing (Santos et al., 2011; Cooper et al., 2013). Furthermore, the absence of reproductive individuals in pelagic surveys further supports the hypothesis that spawning is demersal, though the specific environmental cues triggering reproduction (e.g., temperature, photoperiod) warrant further investigation.
4.3 Analysis of changes in habitat preference through different life stages
Like many marine teleosts, the Atlantic bigeye (P. arenatus) exhibits a pelagic juvenile phase, a strategy widely associated with enhanced foraging efficiency and predator avoidance (Santana-Garcon et al., 2014; Jeon et al., 2013; Gouraguine et al., 2017). Habitat selection during this phase is influenced by a combination of local environmental conditions, prey availability, predation pressure, and ontogenetic development, including diel behavioral shifts. Most fish species rely on plankton as their primary food source during the larval stage. As they grow, their diet diversifies, and they develop stronger swimming abilities and better eyesight (Balon, 1986; Nunn et al., 2012). Additionally, presettlement schooling behavior has been observed in the early pelagic stages of P. tayenus and other benthic fishes (Leis and Carson-Ewart, 1998; Sabate et al., 2010; Santana-Garcon et al., 2014). The high abundance of juveniles at specific sites may result from a combination of presettlement schooling behavior, peak reproductive periods, and limited swimming capacity. Swimming speeds of pelagic juveniles vary across fish species, with most species capable of sustained speeds of 3–5 body lengths per second (Leis, 2010). Although data on the swimming speeds of Atlantic bigeye juveniles are lacking, P. tayenus, a congeneric species, has been documented to swim at 3.6 body lengths per second, indicating relatively slow locomotion (Santana-Garcon et al., 2014). As members of the congeneric species, Atlantic bigeye juveniles likely exhibit similar swimming speeds, which could influence their feeding ecology and spatial distribution (Mas-Muñoz et al., 2011; Nie and Fu, 2017). Reduced swimming capacity may heighten vulnerability to predation, potentially driving an evolutionary trade-off between prolonged pelagic juvenile duration and presettlement aggregation behavior. Schooling prior to settlement could enhance survival rates by diluting predation risk through predator confusion or encounter-dilution effects (Goulart and Young, 2013; Cai et al., 2017). Further research is needed to quantify the swimming performance and predator avoidance strategies of Atlantic bigeye juveniles to better understand their early life history dynamics.
Swimming capacity is one of a critical determinant of a fish’s ability to cope with environmental stressors, particularly hydrodynamic forces such as currents and river runoff. Juveniles with limited swimming capacity are more susceptible to displacement by water flow, increasing their vulnerability to dispersal or stranding in suboptimal habitats (Liao, 2007; Leavy and Bonner, 2009; Johansson et al., 2014). The coastal waters of Sierra Leone are influenced by significant freshwater input from multiple river systems, with peak runoff occurring during the rainy season (Feng et al., 2022). This seasonal influx alters nearshore salinity, turbidity, and current dynamics, potentially impacting the distribution of weakly swimming juvenile fish. Offshore areas near river mouths may experience pronounced fluctuations in water chemistry and flow regimes, further exacerbating the challenges for early life stages with restricted mobility. The GLORYS12V1 global ocean reanalysis indicate different currents patterns between the dry and rainy season. The mechanism underlying this shift is likely related to rainfall, which changes the river runoff along the coastline (Figure 9). Our GLMM results indicated a significant negative correlation between abundance and both salinity (S) and temperature (T), while eastward velocity (EV) had a positive effect (Table 7b). This suggests that the extensive distribution of juveniles in pelagic waters during the rainy season (Figure 4A) is likely facilitated by the combined effects of cooler, lower-salinity freshwater plumes and ocean currents, which may jointly transport eggs and early larvae away from the shelf. This mechanism, where river discharge alters key water characteristics and influences larval dispersal, is observed in other coastal systems (Qiu et al., 2008; 2010). This phenomenon may not be limited to a single species. However, the mechanisms behind these correlations remain speculative without direct analysis of larval transport pathways.
Figure 9
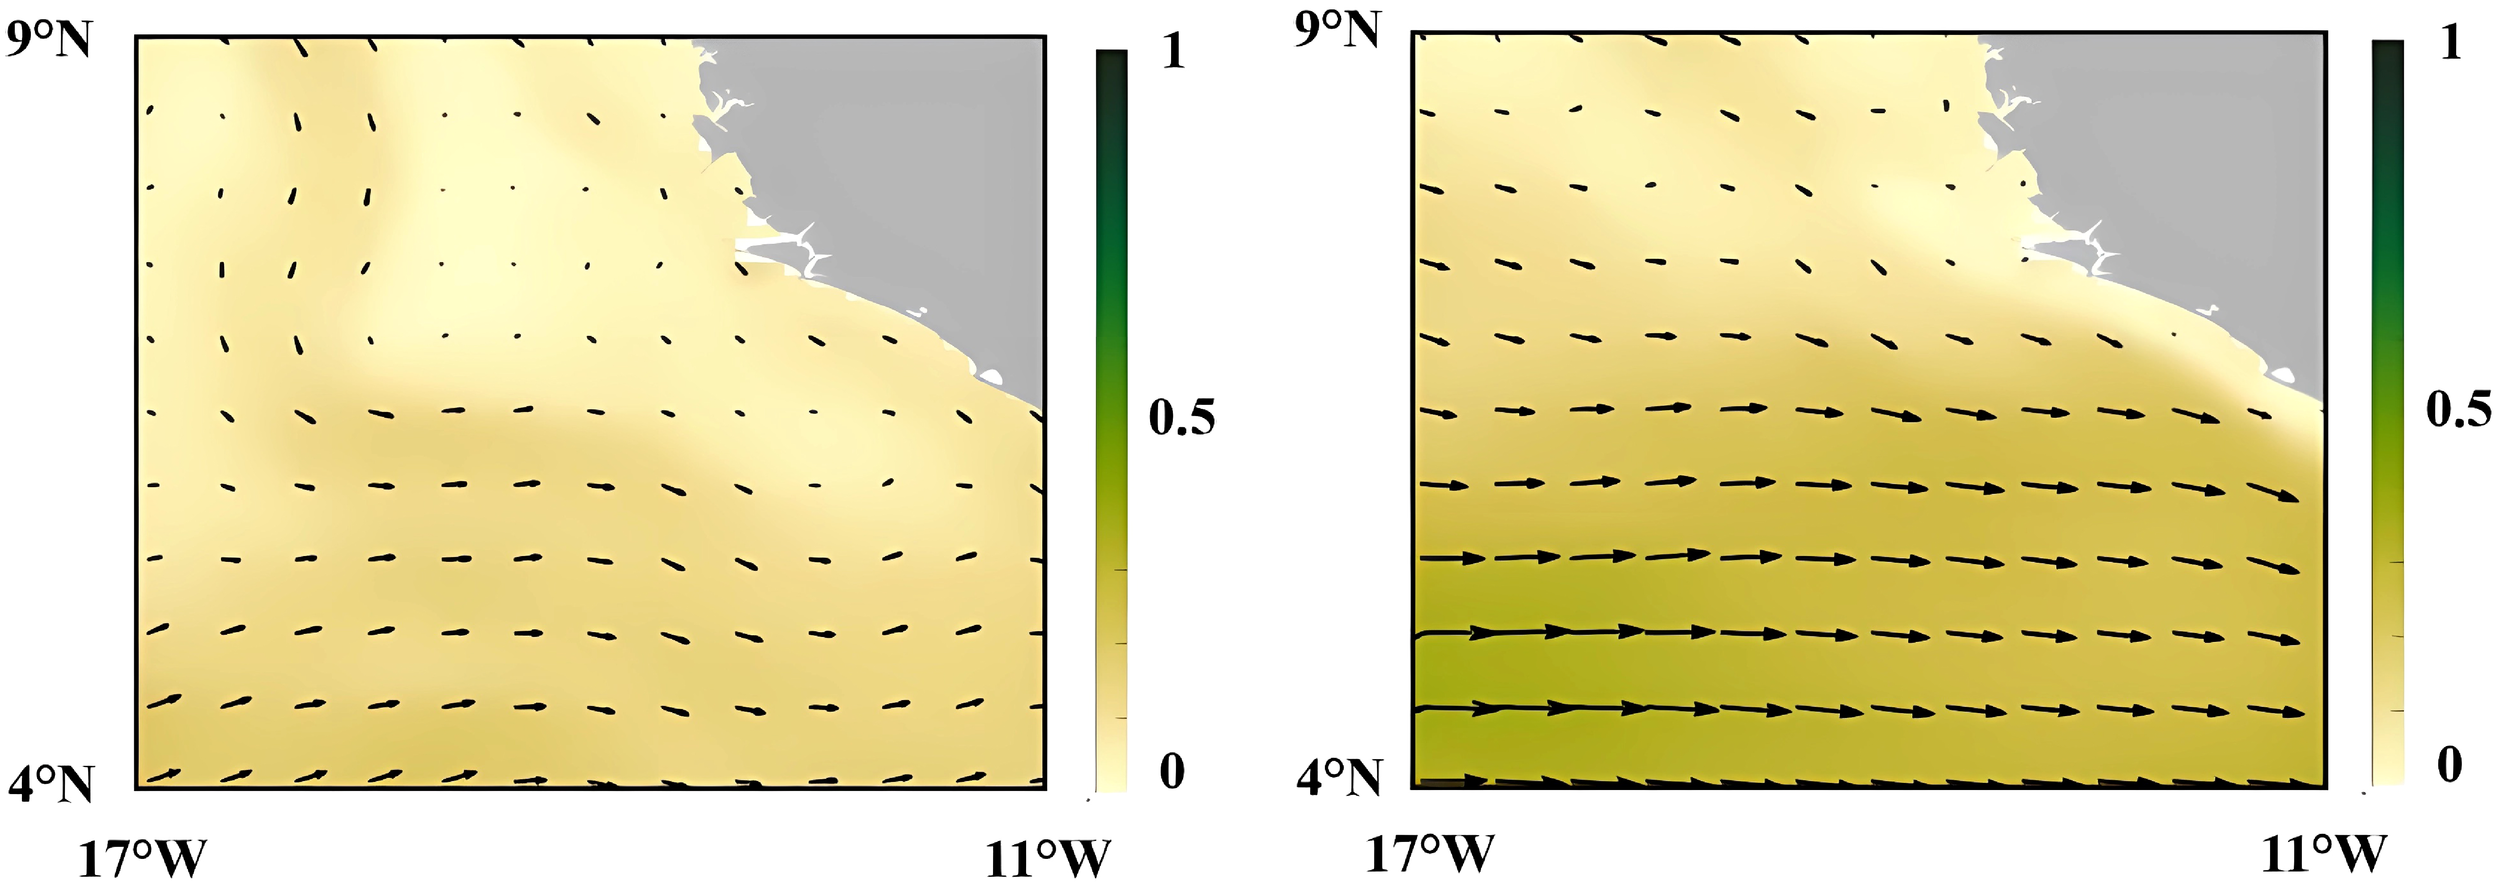
Schematic representation of surface current patterns in the study area during rainy season (July 2019, left) and dry season (January 2021, right). Current derived from the GLORYS12V1 global ocean reanalysis product with arrows indicating direction and color intensity indicating relative velocity (scale: 0–1 m/s). The gray area indicates the Sierra Leone.
It is noteworthy that both the GLMM results and distribution patterns indicate a markedly higher thermal preference for warmer waters in juvenile Atlantic bigeye compared to adults. This ontogenetic divergence may reflect underlying differences in physiological constraints and trophic interactions. Water temperature plays a critical role in structuring planktonic communities and broader pelagic food webs (Toseland et al., 2013; Yao and Somero, 2014), thereby indirectly governing the spatial distribution, mean body size, and abundance of juvenile P. arenatus across different habitats. This study found that lower salinity levels were linked to higher abundance of P. arenatus. More of these individuals, mostly adults, were found in nearshore estuarine areas where river discharge makes the water less salty (Figures 4 and 5).
It is critical to determine whether this unique climate exerts distinct influences on the life-history strategies of local species—affecting reproduction, behavior, age structure, and recruitment dynamics (Rothschild, 2000; Goodwin et al., 2006). These biological responses, in turn, have direct implications for the formulation of fisheries resource management policies (King and McFarlane, 2003; Young et al., 2006). A thorough understanding of species’ life history is fundamental to assessing their ecological function and potential environmental impacts. This study on Atlantic bigeye further reveals that juveniles undergo a significant ontogenetic shift, migrating from offshore pelagic zones to demersal spawning grounds on the continental shelf. A key area for future research is whether the scale of this dispersal is governed by site fidelity or other orientation mechanisms (Kieffer and Colgan, 1992; Ueda, 2011).
4.4 Research limitations and future directions
This study has several limitations that should be addressed in future research. First, the inference of reproductive timing based on juvenile catches, rather than direct gonad development or larval surveys, limits the certainty of our conclusions. Second, while environmental variables were included in the models, direct measurements of current speed and direction, river plume extent, and larval behavior were not available. Finally, the reliance on trawl survey data may introduce bias in abundance estimates due to gear selectivity and spatial coverage.
Despite these limitations, this study establishes a foundational understanding of the life history and distribution of P. arenatus in West Africa, offering valuable insights for regional fisheries management. Future studies should prioritize several key directions to advance this knowledge, including conducting targeted surveys to identify and characterize spawning grounds through gonad sampling and ichthyoplankton collections; employing fine-scale tracking techniques such as otolith microchemistry or acoustic telemetry to clarify migration routes and potential homing behavior; and investigating the physiological and behavioral drivers of ontogenetic habitat shifts, with emphasis on dietary transitions and predation pressure. The application of complementary methods, such as acoustic surveys or underwater video, could further refine spatial and behavioral assessments. Additionally, integrated research combining direct reproductive monitoring and larval ecology is essential to elucidate the mechanisms driving dispersal, recruitment, and population connectivity of P. arenatus in this understudied region.
5 Conclusion
This study documents for the first time the ontogenetic habitat shifts and seasonal distribution patterns of P. arenatus in the coastal waters of Sierra Leone. We found that juveniles inhabit pelagic waters beyond the continental shelf, while sub-adults and adults transition to demersal shelf habitats. The abundance and mean weight demonstrated seasonal variations. These findings provide critical baseline data for the management of this economically important species. The identified patterns highlight the need for spatially and seasonally tailored conservation measures.
Statements
Data availability statement
The raw data supporting the conclusions of this article will be made available by the authors, without undue reservation.
Author contributions
FS: Conceptualization, Formal Analysis, Writing – original draft, Writing – review & editing. YZ: Data curation, Writing – review & editing. CF: Investigation, Writing – review & editing. TQ: Investigation, Writing – review & editing. RF: Investigation, Writing – review & editing. ZF: Writing – review & editing. HZ: Funding acquisition, Project administration, Resources, Validation, Writing – review & editing. HX: Writing – review & editing. HL: Data curation, Writing – review & editing. SL: Data curation, Writing – review & editing. XF: Writing – review & editing. XW: Data curation, Writing – review & editing. IC: Investigation, Writing – review & editing. LS: Investigation, Writing – review & editing. LL: Formal Analysis, Funding acquisition, Investigation, Project administration, Resources, Validation, Writing – review & editing.
Funding
The author(s) declare that financial support was received for the research and/or publication of this article. The present study was supported by the Central Public-interest Scientific Institution Basal Research Fund, CAFS (2020TD03), Central Public-interest Scientific Institution Basal Research Fund, ECSFR, CAFS (2021M06), Fundamental Scientific Research Funds for the Central Public Welfare Research Institutes of Chinese Academy of Fishery Sciences (2025ZX03) and Key Research and Development Program of Lianyungang City (SF2407).
Acknowledgments
We are very grateful to Ministry of Fisheries and Marine Resources of Sierra Leone for the assistance in the survey work. We also acknowledge all participants in this joint program.
Conflict of interest
The authors declare that the research was conducted in the absence of any commercial or financial relationships that could be construed as a potential conflict of interest.
Generative AI statement
The author(s) declare that no Generative AI was used in the creation of this manuscript.
Any alternative text (alt text) provided alongside figures in this article has been generated by Frontiers with the support of artificial intelligence and reasonable efforts have been made to ensure accuracy, including review by the authors wherever possible. If you identify any issues, please contact us.
Publisher’s note
All claims expressed in this article are solely those of the authors and do not necessarily represent those of their affiliated organizations, or those of the publisher, the editors and the reviewers. Any product that may be evaluated in this article, or claim that may be made by its manufacturer, is not guaranteed or endorsed by the publisher.
Supplementary material
The Supplementary Material for this article can be found online at: https://www.frontiersin.org/articles/10.3389/fmars.2025.1652191/full#supplementary-material
References
1
Baldwin C. C. (2013). The phylogenetic significance of colour patterns in marine teleost larvae. Zool. J. Linn. Soc168, 496–563. doi: 10.1111/zoj.12033
2
Balon E. K. (1986). Types of feeding in the ontogeny of fishes and the life-history model. Environ. Biol. Fish.16, 11–24. doi: 10.1007/BF00005156
3
Barry T. Price C. (2015). Arctic biodiversity: from science to policy. J. Environ. Stud. Sci.5, 283–287. doi: 10.1007/s13412-015-0267-3
4
Brochier T. Colas F. Lett C. Echevin V. Cubillos L. A. Tam J. et al . (2009). Small pelagic fish reproductive strategies in upwelling systems: A natal homing evolutionary model to study environmental constraints. Prog. Oceanogr.83, 261–269. doi: 10.1016/j.pocean.2009.07.044
5
Brown-Peterson N. J. Wyanski D. M. Saborido-Rey F. Macewicz B. J. Lowerre-Barbieri S. K. (2011). A standardized terminology for describing reproductive development in fishes. Mar. Coast. Fish.3, 52–70. doi: 10.1080/19425120.2011.555724
6
Cai L. Johnson D. Fang M. Mandal P. Tu Z. Huang Y. (2017). Effects of feeding, digestion and fasting on the respiration and swimming capability of juvenile sterlet sturgeon (Acipenser ruthenus, Linnaeus 1758). Fish Physiol. Biochem.43, 279–286. doi: 10.1007/s10695-016-0285-4
7
Caldwell D. K. (1962). Development and distribution of the short bigeye Pseudopriacanthus altus (Gill) in the western North Atlantic. Fish. Bull. U.S. Fish Wildlife Serv.62, 103–150.
8
Cardozo A. L. P. Farias E. G. G. Rodrigues-Filho J. L. Moteiro I. B. Scandolo T. M. Dantas D. V. (2018). Feeding ecology and ingestion of plastic fragments by Priacanthus arenatus: What’s the fisheries contribution to the problem? Mar. pollut. Bull.130, 19–27. doi: 10.1016/j.marpolbul.2018.03.010
9
Carson H. S. López-Duarte P. C. Rasmussen L. Wang D. Levin L. A. (2010). Reproductive timing alters population connectivity in marine metapopulations. Curr. Biol.20, 1926–1931. doi: 10.1016/j.cub.2010.09.057
10
Carter M. J. Silva-Flores P. Oyanedel J. P. Ramos-Jiliberto R. (2013). Morphological and life-history shifts of the exotic cladoceran Daphnia exilis in response to predation risk and food availability. Limnologica43, 203–209. doi: 10.1016/j.limno.2012.09.004
11
Cooper W. T. Barbieri L. R. Murphy M. D. Lowerre-Barbieri S. K. (2013). Assessing stock reproductive potential in species with indeterminate fecundity: Effects of age truncation and size-dependent reproductive timing. Fish. Res.138, 31–41. doi: 10.1016/j.fishres.2012.05.016
12
Drazen J. C. Haedrich R. L. (2012). A continuum of life histories in deep-sea demersal fishes. Deep Sea Res. Pt. I61, 34–42. doi: 10.1016/j.dsr.2011.11.002
13
Feng C. Huang H. Qu T. Fan R. Coker I. C. R. Seisay L. D. et al . (2022). Temporal and spatial patterns of demersal fish assemblages in the coastal water of Sierra Leone. Reg. Stud. Mar. Sci.56, 102674. doi: 10.1016/j.rsma.2022.102674
14
Fonseca V. F. Cabral H. N. (2007). Are fish early growth and condition patterns related to life-history strategies? Rev. Fish Biol. Fisher.17, 545–564. doi: 10.1007/s11160-007-9054-x
15
Goodwin N. B. Grant A. Perry A. L. Dulvy N. K. Reynolds J. D. (2006). Life history correlates of density-dependent recruitment in marine fishes. Can. J. Fish. Aquat. Sci.63, 494–509. doi: 10.1139/f05-234
16
Goulart V. D. L. R. Young R. J. (2013). Selfish behaviour as an antipredator response in schooling fish? Anim. Behav.86, 443–450. doi: 10.1016/j.anbehav.2013.05.041
17
Gouraguine A. Díaz-Gil C. Reñones O. Otegui D. S. Palmer M. Hinz H. et al . (2017). Behavioural response to detection of chemical stimuli of predation, feeding and schooling in a temperate juvenile fish. J. Exp. Mar. Biol. Ecol.486, 140–147. doi: 10.1016/j.jembe.2016.10.003
18
Hays G. (2017). Ocean currents and marine life. Curr. Biol.27, R470–R473. doi: 10.1016/j.cub.2017.01.044
19
James A. Pitchford J. Brindley J. (2003). The relationship between plankton blooms, the hatching of fish larvae, and recruitment. Ecol. Model.160, 77–90. doi: 10.1016/S0304-3800(02)00311-3
20
Jeon W. Kang S.-H. Leem J.-B. Lee S.-H. (2013). Characterization of fish schooling behavior with different numbers of Medaka (Oryzias latipes) and goldfish (Carassius auratus) using a Hidden Markov Model. Physica A392, 2426–2433. doi: 10.1016/j.physa.2013.01.065
21
Johannes R. E. (1978). Reproductive strategies of coastal marine fishes in the tropics. Environ. Biol. Fish.3, 65–84. doi: 10.1007/BF00006309
22
Johansson D. Laursen F. Fernö A. Fosseidengen J. E. Klebert P. Stien L. H. et al . (2014). The interaction between water currents and salmon swimming behaviour in sea cages. PloS One9, e97635. doi: 10.1371/journal.pone.0097635
23
Juntti S. A. Fernald R. D. (2016). Timing reproduction in teleost fish: cues and mechanisms. Curr. Opin. Neurobiol.38, 57–62. doi: 10.1016/j.conb.2016.02.006
24
Kieffer J. D. Colgan P. W. (1992). The role of learning in fish behaviour. Rev. Fish Biol. Fisher.2, 125–143. doi: 10.1007/BF00042881
25
King J. R. McFarlane G. A. (2003). Marine fish life history strategies: applications to fishery management. Fisheries Manage. Ecol.10, 249–264. doi: 10.1046/j.1365-2400.2003.00359.x
26
Kuparinen A. Boit A. Valdovinos F. Lassaux H. Martinez N. (2016). Fishing-induced life-history changes degrade and destabilize harvested ecosystems. Sci. Rep.6, 22245. doi: 10.1038/srep22245
27
Leavy T. R. Bonner T. H. (2009). Relationships among swimming ability, current velocity association, and morphology for freshwater lotic fishes. N. Am. J. Fish. Manage.29, 72–83. doi: 10.1577/M07-040.1
28
Leis J. M. (2010). Ontogeny of behaviour in larvae of marine demersal fishes. Ichthyol. Res.57, 325–342. doi: 10.1007/s10228-010-0177-z
29
Leis J. M. Carson-Ewart B. M. (1998). Complex behaviour by coral-reef fish larvae in open-water and near-reef pelagic environments. Environ. Biol. Fishe.53, 259–266. doi: 10.1023/A:1007424719764
30
Leis J. M. Siebeck U. Dixson D. L. (2011). How nemo finds home: the neuroecology of dispersal and of population connectivity in larvae of marine fishes. Integr. Comp. Biol.51, 826–843. doi: 10.1093/icb/icr004
31
Liao J. C. (2007). A review of fish swimming mechanics and behaviour in altered flows. Philos. T. R. Soc B362, 1973–1993. doi: 10.1098/rstb.2007.2082
32
Lowerre-Barbieri S. K. Ganias K. Saborido-Rey F. Murua H. Hunter J. R. (2011). Reproductive timing in marine fishes: variability, temporal scales, and methods. Mar. Coast. Fish.3, 71–91. doi: 10.1080/19425120.2011.556932
33
Lowerre-Barbieri S. K. Lowerre J. M. Barbieri L. R. (1998). Multiple spawning and the dynamics of fish populations: inferences from an individual based simulation model. Can. J. Fish. Aquat. Sci.55, 2244–2254. doi: 10.1139/cjfas-55-10-2244
34
Marcano D. Cardillo E. Rodriguez C. Poleo G. Gago N. Guerrero H. Y. (2007). Seasonal reproductive biology of two species of freshwater catfish from the Venezuelan floodplains. Gen. Comp. Endocr.153, 371–377. doi: 10.1016/j.ygcen.2007.01.042
35
Mas-Muñoz J. Komen H. Schneider O. Visch S. W. Schrama J. W. (2011). Feeding behaviour, swimming activity and boldness explain variation in feed intake and growth of sole (Solea solea) reared in captivity. PloS One6, e21393. doi: 10.1371/journal.pone.0021393
36
Mclean D. L. Langlois T. J. Newman S. J. Holmes T. H. Fisher R. (2016). Distribution, abundance, diversity and habitat associations of fishes across a bioregion experiencing rapid coastal development. Estuar. Coast. Shelf Sci.178, 36–47. doi: 10.1016/j.ecss.2016.05.026
37
Meador M. R. Brown L. M. (2015). Life history strategies of fish species and biodiversity in eastern USA streams. Environ. Biol. Fish.98, 663–677. doi: 10.1007/s10641-014-0304-1
38
Montgomery J. C. Jeffs A. Simpson S. D. Meekan M. Tindle C. (2006). Sound as an orientation cue for the pelagic larvae of reef fishes and decapod crustaceans. Adv. Mar. Biol.51, 143–196. doi: 10.1016/S0065-2881(06)51003-X
39
Moore J. W. Yeakel J. D. Peard D. Lough J. Beere M. (2014). Life-history diversity and its importance to population stability and persistence of a migratory fish: steelhead in two large North American watersheds. J. Anim. Ecol.83, 1035–1046. doi: 10.1111/1365-2656.12212
40
Nie L. Fu S. (2017). Metabolic, behavioral, and locomotive effects of feeding in five cyprinids with different habitat preferences. Fish Physiol. Biochem.43, 1531–1542. doi: 10.1007/s10695-017-0390-z
41
Nunn A. D. Tewson L. H. Cowx I. G. (2012). The foraging ecology of larval and juvenile fishes. Rev. Fish Biol. Fisher.22, 377–408. doi: 10.1007/s11160-011-9240-8
42
Olden J. D. Poff N. L. Bestgen K. R. (2006). Life-history strategies predict fish invasions and extirpations in the colorado river basin. Eco. Monogr.76, 25–40. doi: 10.1890/05-0330
43
Pecquerie L. Petitgas P. Kooijman S. (2009). Modeling fish growth and reproduction in the context of the dynamic energy budget theory to predict environmental impact on anchovy spawning duration. J. Sea Res.62, 93–105. doi: 10.1016/j.seares.2009.06.002
44
Pecuchet L. Reygondeau G. Cheung W. W. L. Licandro P. van Denderen P. D. Payne M. R. et al . (2018). Spatial distribution of life-history traits and their response to environmental gradients across multiple marine taxa. Ecosphere9, e02460. doi: 10.1002/ecs2.2460
45
Peterson M. Comyns B. Hendon J. Bond P. Duff G. (2000). Habitat use by early life-history stages of fishes and crustaceans along a changing estuarine landscape: differences between natural and altered shoreline sites. Wetl. Ecol. Manage.8, 209–219. doi: 10.1023/A:1008452805584
46
Qiu Y. Lin Z. Wang Y. (2010). Responses of fish production to fishing and climate variability in the northern South China Sea. Prog. Oceanogr.85, 197–212. doi: 10.1016/j.pocean.2010.02.011
47
Qiu Y. Wang Y. Chen Z. (2008). Runoff- and monsoon-driven variability of fish production in East China Seas. Estuar. Coast. Shelf Sci.77, 23–34. doi: 10.1016/j.ecss.2007.09.001
48
Reynolds J. D. Webb T. J. Hawkins L. A. (2005). Life history and ecological correlates of extinction risk in European freshwater fishes. Can. J. Fish Aquat. Sci.62, 854–862. doi: 10.1139/F05-066
49
Rothschild B. (2000). Fish stocks and recruitment”: the past thirty years. ICES J. Mar. Sci.57, 191–201. doi: 10.1006/jmsc.2000.0645
50
Sabate F. de la S. Sakakura Y. Tanaka Y. Kumon K. Nikaido H. et al . (2010). Onset and development of cannibalistic and schooling behavior in the early life stages of Pacific bluefin tuna Thunnus orientalis. Aquaculture301, 16–21. doi: 10.1016/j.aquaculture.2010.01.023
51
Santana-Garcon J. Leis J. M. Newman S. J. Harvey E. S. (2014). Presettlement schooling behaviour of a priacanthid, the Purplespotted Bigeye Priacanthus tayenus (Priacanthidae: Teleostei). Environ. Biol. Fish.97, 277–283. doi: 10.1007/s10641-013-0150-6
52
Santos S. Cardoso J. F. M. F. Carvalho C. Luttikhuizen P. C. van der Veer H. W. (2011). Seasonal variability in somatic and reproductive investment of the bivalve Scrobicularia plana (da Costa 1778) along a latitudinal gradient. Estuar. Coast. Shelf Sci.92, 19–26. doi: 10.1016/j.ecss.2010.12.005
53
Starnes W. C. (1988). Revision, phylogeny and biogeographic comments on the cirmtropical marine percoid fish family Priacanthidae. Bull. Mar. Sci.43, 117–203.
54
Saville A. Schnack D. (1981). Some thoughts on the current status of studies of fish egg and larval distribution and abundance. Rapp PV Reùn Cons. Int. Explor Mer.178, 153–157.
55
Teichert N. Pasquaud S. Borja A. Chust G. Uriarte A. Lepage M. (2017). Living under stressful conditions: fish life history strategies across environmental gradients in estuaries. Estuar. Coast. Shelf Sci.188, 18–26. doi: 10.1016/j.ecss.2017.02.006
56
Tiedemann M. Fock HO Brehmer P. Döring J Möllmann C (2016). Does upwelling intensity determine larval fish habitats in upwelling ecosystems? The case of Senegal and Mauritania. Fish Oceanogr.26, 655–667. doi: https://doi.org/10.1111/fog.12224
57
Toledo J. Mendoza J. Marcano L. (2000). Crecimiento, mortalidade y tasa de explotación de Priacanthus arenatus (Perciformes: Priacanthidae), en la pesca de arrastre del nororiente de Venezuela. Rev. Biol. Trop.48, 133–136.
58
Tondato K. K. Súarez Y. R. de Fátima Mateus L. A. Vicentin W. Fialho C. B. (2018). Life history characteristics and recruitment of fish under the effect of different hydrological regimes in a tropical floodplain. Environ. Biol. Fish101, 1369–1384. doi: 10.1007/s10641-018-0784-5
59
Toseland A. Daines S. J. Clark J. R. Kirkham A. Strauss J. Uhlig C. et al . (2013). The impact of temperature on marine phytoplankton resource allocation and metabolism. Nat. Clim. Change3, 979–984. doi: 10.1038/nclimate1989
60
Ueda H. (2011). Physiological mechanism of homing migration in Pacific salmon from behavioral to molecular biological approaches. Gen. Comp. Endocr.170, 222–232. doi: 10.1016/j.ygcen.2010.02.003
61
Wang T. Gao X. Jakovlić I. Liu H. (2017). Life tables and elasticity analyses of Yangtze River fish species with implications for conservation and management. Rev. Fish Biol. Fisher.27, 255–266. doi: 10.1007/s11160-016-9464-8
62
Wiedmann M. A. Aschan M. Certain G. Dolgov A. Greenacre M. Johannesen E. et al . (2014). Functional diversity of the barents sea fish community. Mar. Ecol. Prog. Ser.495, 205–218. doi: 10.3354/meps10558
63
Wright P. J. Trippel E. A. (2009). Fishery-induced demographic changes in the timing of spawning: consequences for reproductive success. Fish Fish.10, 283–304. doi: 10.1111/j.1467-2979.2008.00322.x
64
Xu Y. Ma L. Sun Y. Li X. Wang H. Zhang H. (2019). Spatial variation of demersal fish diversity and distribution in the East China Sea: Impact of the bottom branches of the Kuroshio Current. J. Sea Res.144, 22–32. doi: 10.1016/j.seares.2018.11.003
65
Yao C. L. Somero G. N. (2014). The impact of ocean warming on marine organisms. Chin. Sci. Bull.59, 468–479. doi: 10.1007/s11434-014-0113-0
66
Young J. L. Bornik Z. B. Marcotte M. L. Charlie K. N. Wagner G. N. Hinch S. G. et al . (2006). Integrating physiology and life history to improve fisheries management and conservation. Fish Fish7, 262–283. doi: 10.1111/j.1467-2979.2006.00225.x
Summary
Keywords
distribution patterns, life history, ontogenetic habitat shifts, Priacanthus arenatus , Western Africa coast
Citation
Shen F, Zhang Y, Feng C, Qu T, Fan R, Feng Z, Zheng H, Xu H, Liu H, Li S, Fan X, Wang X, Cokerd ICR, Seisayd LD and Li L (2025) Life-history-dependent and seasonally varying distribution patterns of Atlantic bigeye (Priacanthus arenatus) in western African coast. Front. Mar. Sci. 12:1652191. doi: 10.3389/fmars.2025.1652191
Received
23 June 2025
Accepted
01 October 2025
Published
20 October 2025
Volume
12 - 2025
Edited by
Marco Casu, University of Sassari, Italy
Reviewed by
Gang Hou, Guangdong Ocean University, China; Elizabeth Talbot, Plymouth Marine Laboratory, United Kingdom
Updates
Copyright
© 2025 Shen, Zhang, Feng, Qu, Fan, Feng, Zheng, Xu, Liu, Li, Fan, Wang, Cokerd, Seisayd and Li.
This is an open-access article distributed under the terms of the Creative Commons Attribution License (CC BY). The use, distribution or reproduction in other forums is permitted, provided the original author(s) and the copyright owner(s) are credited and that the original publication in this journal is cited, in accordance with accepted academic practice. No use, distribution or reproduction is permitted which does not comply with these terms.
*Correspondence: Lingzhi Li, llilz@ecsf.ac.cn
Disclaimer
All claims expressed in this article are solely those of the authors and do not necessarily represent those of their affiliated organizations, or those of the publisher, the editors and the reviewers. Any product that may be evaluated in this article or claim that may be made by its manufacturer is not guaranteed or endorsed by the publisher.