Abstract
The biological carbon pump comprises a set of processes that transfer organic carbon from the ocean surface to its depths, playing a vital role in the global carbon cycle. Estimating the amount of carbon transported by this pump remains challenging due to the complex, variable nature of its pathways and the limited availability of comprehensive measurements. While the contribution of zooplankton to active flux has been examined, with studies reporting 10-30% of total particle export, the role of micronekton in this process is still poorly understood. Furthermore, the relative capacity of both communities to export carbon remains largely unclear. Here, we report total (zooplankton plus micronekton) active and passive fluxes from the Mediterranean Sea to the Atlantic Ocean around the Iberian Peninsula, to explore how total active flux is influenced by environmental conditions. Water column physical properties differed between the Mediterranean and Atlantic Ocean zones, with chlorophyll a values two-fold higher in the upwelling off Portugal. Particulate organic carbon fluxes from sediment traps ranged from 4.24 ± 0.2 to 7.94 ± 3.9 mg C·m-2·d-1. Active flux was dominated by zooplankton in the Mediterranean Sea (77.2 ± 21.2 vs. 14.8 ± 3.4 mg C·m-2·d-1 in the Atlantic), whereas micronekton contributed more in the Atlantic Ocean (15.1 ± 9.4 vs. 7.9 ± 6.8 mg C·m-2·d-1). This pattern shows that active flux far exceeded passive flux in all regions, with pelagic decapods playing a particularly important role in the northern Atlantic. Our results highlight the ecological significance of both zooplankton and micronekton in driving carbon flux, underlining the need to understand their relative contributions across contrasting environments to better explain the functioning of the biological carbon pump.
1 Introduction
The biological carbon pump describes the set of mechanisms driving the carbon flux from the euphotic to the meso- and bathypelagic layers through interactions between the physical, chemical, and biological components of the pelagic system (Longhurst and Harrison, 1989). Organic carbon is transported downwards by three different mechanisms: (1) the sinking of organic matter through the water column, the so-called passive or gravitational flux (Carlson et al., 1994; Mestre et al., 2018), (2) the physical mixing of dissolved and particulate organic matter (Buesseler et al., 2007), and (3) the active flux, also known as migrant pump, referring to the active transport of organic matter by zooplankton and micronekton to the deepest areas of the ocean (Longhurst and Harrison, 1988; Hernández-León et al., 2019a; Kwong et al., 2020; Sarmiento-Lezcano et al., 2022a, 2022b; Baker et al., 2025). While passive flux has been extensively studied in the past (see Honjo et al., 2008; Guidi et al., 2015), research of active flux is scarce due to the complex sampling, distribution, and composition of these communities.
Active flux is driven by meso- and bathypelagic organisms performing diel vertical migrations. Diel vertical migrants show a high diversity and a wide size spectrum: they are primarily zooplankton (mainly large copepods and euphausiids, Hernández-León et al., 2019a), mesopelagic fishes (mainly myctophids, Davison et al., 2013; Olivar et al., 2017), large crustaceans (decapods and euphausiids, Ariza et al., 2016), and cephalopods (Judkins and Vecchione, 2020). These organisms remain at depth during daylight hours, move upwards to near the surface at night to feed and return back to depth before dawn (Lampert, 1989; Steinberg et al., 2002; Bianchi et al., 2013). At depth, organic carbon is released via several processes such as respiration (Longhurst et al., 1990), excretion (Steinberg et al., 2002), gut flux (Angel, 1989), and mortality (Zhang and Dam, 1997). A key effect of these up-and-down movements is the transport of organic matter to the deep sea (Romero-Romero et al., 2019), where it can be either remineralized (releasing CO2 back into the water column) or stored at depth for years to centuries, contributing to carbon sequestration (Nowicki et al., 2022; Pinti et al., 2023). Carbon exported by diel vertical migrants can locally account for more than 80% of the total flux (passive plus active) (Stukel et al., 2013; Hernández-León et al., 2019b), and has been estimated to increase global total flux by 14% in model simulations (Archibald et al., 2019).
Most of the research on active flux has focused on zooplankton (see Steinberg and Landry, 2017; Hernández-León et al., 2019b; Clements et al., 2025), and, to our knowledge, only five studies have empirically investigated both zooplankton (0.2–20 mm) and micronekton (20–200 mm, such as mesopelagic fish and decapods) active flux concurrently: Hidaka et al. (2001) in the North Pacific, Ariza et al. (2015) and Hernández-León et al. (2019a) both in the North Atlantic Ocean, Kwong et al. (2020) in Southeast Australia, and Baker et al. (2025) in the Southern Ocean. Consequently, our knowledge on the relative importance of these two groups is very limited, with significant gaps in understanding how their contributions to active flux vary across regions or environmental conditions.
The efficiency of the biological pump is shaped by local conditions such as productivity (Hernández-León et al., 2019a), community composition (Basu and Mackey, 2018), and mesoscale activity (Kwong et al., 2020). The waters around the Iberian Peninsula are especially valuable in this sense: they include a sharp gradient from the nutrient-poor Mediterranean Sea to the productive Atlantic upwelling systems (Villegas-Ríos et al., 2011; Massutí et al., 2021), offering a unique scenario to compare contrasting regimes. Yet, despite their importance, these areas remain underrepresented in active flux studies. This lack of knowledge not only hampers our ability to accurately parameterize models of the biological carbon pump but also introduces uncertainties in global carbon budgets, potentially leading to underestimates of carbon sequestration by the ocean. Understanding the environmental response of the biological pump is fundamental to projecting future atmospheric CO2 concentrations (Passow and Carlson, 2012). Here, we aim to contribute to cover the existing knowledge gap in the variability of the zooplankton and micronekton active flux across different productive regimes. To do so, we estimated the variability and efficiency of the total active and passive flux in contrasting environmental areas from the Mediterranean Sea to the Atlantic Ocean, around the Iberian Peninsula.
2 Materials and methods
2.1 Sampling and study area
The study is part of the CSIC-SUMMER cruise carried out on board the RV “Sarmiento de Gamboa” around the Iberian Peninsula from September 28th to October 25th, 2020 (Olivar et al., 2022). Five zones were sampled repeatedly throughout the day and night: south of the Balearic Islands (Z1; 38.5°N, 2.5°E), western Alborán Sea (Z2; 36°N, 4°W), Gulf of Cádiz (Z3; 36°N, 8°W), off Lisbon (Z4; 38.1°N, 9.4°W), and off Galicia (Z5; 42°N, 9.5°W). Briefly, Z1 is an oligotrophic zone, Z2 and Z3 are transition zones between the Atlantic and Mediterranean waters, but Z2 is more productive than Z1 and Z3. Z4 and Z5 are more productive zones due to the influence of the upwelling (for detailed area descriptions see Supplementary Material SM1). We spent between 48 and 60 hours at each zone conducting repeated stations sampling zooplankton and micronekton for a minimum of two consecutive days during day- and nighttime. However, Z5 was limited to just one day and one-night stations due to rough sea conditions (Supplementary Table S1).
2.2 Hydrography
The vertical profiles of temperature, conductivity, and fluorescence were recorded from the surface to 1000 m depth using a SeaBird SBE 911plus CTD equipped with a Seabird-43 Dissolved Oxygen sensor and a Seapoint Fluorometer mounted on a rosette sampler equipped with 24 Niskin bottles of 12 L each. Fluorescence obtained in vertical profiles in the upper 200 m depth were converted to chlorophyll a (Chl a) according to Yentsch and Menzel (1963). The vertical profiles of temperature, salinity, and fluorescence were averaged every 1 dBar. Monthly average values (October 2020) of sea surface temperature (SST) were downloaded from the NASA’s OceanColorWeb site with a spatial resolution of 4x4 km and processed using the proto-algorithm from MODIS Ocean Team Computing Facility (MOTCF) based on satellite infrared retrievals of ocean temperature. Net primary production (NPP) was obtained from remote sensing data following Behrenfeld and Falkowski (1997) through the Ocean Productivity website (https://www.science.oregonstate.edu/ocean.productivity/index.php) for the specific dates of the cruise and using the Vertical Generalized Production Model (VGPM) as the standard algorithm.
2.3 Trap-derived passive flux
Sediment trap-derived passive flux to estimate gravitational export was measured at 150 m depth using a free-drifting multi-trap array with eight cylinders, as the model described by Knauer et al. (1979) and using the procedure described in Hernández-León et al. (2019a). The traps were deployed for approximately 24 h, each equipped with cylinders containing filtered seawater enriched with NaCl (∼45 g·L-1 analytical grade) to increase density. No poisons were added to retard bacterial decomposition. After recovering, samples were filtered onto pre-combusted (450 °C for 12 h) 25 mm Whatman GF/F filters. Then, they were frozen at -20 °C until analysis in a Carlo Erba CHNSO 1108 elemental analyzer (UNESCO, 1994).
2.4 Zooplankton sampling
Zooplankton samples were obtained using a MOCNESS-1 net with a 1 m2 mouth opening area fitted with 200 μm mesh size (Wiebe et al., 1976). Oblique hauls were made from 700 m depth to the surface in eight strata: 700-600, 600-500, 500-400, 400-300, 300-200, 200-100, 100-50, 50–0 m, at about 1.5-2.5 knots (Supplementary Table S1). Filtered volume was measured using an electronic flowmeter. After sampling, representative organisms - based on visual inspection of the most abundant species (mainly copepods, euphausiids, and chaetognaths) - were gently picked for enzymatic measurements, frozen in liquid nitrogen (-196 °C) and preserved at -80 °C. The rest of the sample was preserved in 4% buffered formalin and seawater. In the laboratory, a subsample was selected for taxonomic analysis. Samples were digitized using an EPSON scan version 4990 at 2400 dpi, processed in ZooProcess (Gorsky et al., 2010; Vandromme et al., 2012), and uploaded to EcoTaxa (Picheral et al., 2017) to AI-supported manual classification. The body area (in pixel)-to-dry weight (DW) conversion was done using the equations provided by Lehette and Hernández-León (2009), assuming an uncertainty based on the standard error of the regression slope for general mesozooplankton (slope = 1.54 ± 0.03) and to carbon weight (CW) using a conversion factor of 0.40 ± 0.08 based on a literature review (Banse, 1996; Dam and Peterson, 1993; Andersen and Hessen 1991; Andersen et al., 2016. See SM4. Sensitivity analysis). Biomass estimates need to be corrected for potential net avoidance, which is commonly referred to as ‘capture efficiency’ (CE). For zooplankton, we assumed no net avoidance (Skjoldal et al., 2013). A sensitivity analysis for the conversion factors was carried out and is described below.
2.5 Micronekton sampling
Details of the overall micronekton sampling operations during the cruise have been published by Olivar et al. (2022). Briefly, day and night samples were obtained using a Mesopelagos midwater trawl (Meillat, 2012) with a total length of 58 m and a graded mesh netting of 30 mm near the mouth and 4 mm in its lower part. At the end of the net, a VERDA multi-sampler (Castellón and Olivar, 2023) was fitted to enable stratified sampling (Supplementary Table S1). The ship course was kept constant during the hauls, and ship speed was maintained at ca. 2 knots using the Speed Over Ground system provided by the onboard GPS. The volume of water filtered was calculated as the product of mouth opening of the net and the distance travelled by the vessel. Mean net opening area was 30 m2. The distance travelled during each haul (d), was calculated by spherical trigonometry applying the Haversine formula, which takes into account the earth radius (R) and the differences of the latitude (Δφ=φ1−φ0) and longitude (Δλ=λ1−λ0) at the beginning (0) and end (1) of the hauls.
On board, fish and decapods were sorted and identified. Wet weight was measured using a marine precision balance POLS S-182 P-15 (precision 2 g). Selected species of mesopelagic fishes and decapods (based on a visual assessment of the most abundant types) were frozen in liquid nitrogen and stored at -80°C for later metabolic analysis. Biomass was estimated converting wet weight (WW) to DW using conversion factors of 0.18 ± 0.01 for decapods (Pakhomov et al., 2019) and 0.23 ± 0.04 for fishes (López-Pérez et al., 2020)s, and then to CW using the above-mentioned ratio. All micronekton CW estimates need to be corrected for potential net avoidance (CE). For the net we used for micronekton (Mesopelagos), there are, to our knowledge, no published data on CE. Hence, we assumed a CE of 20 ± 13% based on a literature review (Gjøsaeter, 1984; May and Blaber, 1989; Koslow et al., 1997; Davison, 2011; Pakhomov et al., 2019) of other midwater trawls. The sensitivity analysis of these conversions, using a range of conversion factors, is described in Supplementary Material (SM4. Sensitivity analysis.).
2.6 Active flux
To compare the relative contribution of zooplankton and micronekton to the carbon flux, active fluxes (AF) were estimated as the sum of the respiratory (RF), mortality (MF), gut flux (GF), and excretion (EF) (Equation 1).
Briefly, RF was estimated using electron transfer system (ETS) activity, measured following the method of Packard (1971) modified by Owens and King (1975); Kenner and Ahmed (1975), and Gómez et al. (1996). Respiration in carbon units was estimated applying a R/ETS ratio of 0.5 ± 0.1 (Hernández-León and Gómez, 1996; Hernández-León et al., 2019c; Couret et al., 2024) and a respiratory quotient of 0.97 ± 0.4 (Omori and Ikeda, 1984; Hernández-León and Ikeda, 2005). MF was estimated from growth assuming steady-state conditions (growth = mortality) in the mesopelagic zone, using the equation of Ikeda and Motoda (1978) relating respiration and growth and applying a conversion factor of 0.75 ± 0.19 for zooplankton (Omori and Ikeda, 1984) and 0.66 ± 0.17 for micronekton (Brett and Groves, 1979). EF was estimated using the values given by Steinberg et al. (2000), assuming that the excretion of dissolved organic carbon makes up 24 ± 26% (range = 5-42%) of the total carbon metabolized. GF was estimated from respiration by assuming that zooplankton feeding is 2.5 ± 0.5 times respiration (Ikeda and Motoda, 1978), and migrant zooplankton egested 50% of the gut content at depth (Ariza et al., 2015). For micronektonic migrants, we assumed they egest an amount equivalent to the 40% of the respired carbon (Brett and Groves, 1979) and that they transport feces to the mesopelagic because of their density and the long gut passage time of large animals. Assuming that micronektonic migrants egest after the downward migration, the egestion should be double in relation to respiration during 24 h. Therefore, we used an egestion equivalent to 80 ± 16% of the respired carbon (Ariza et al., 2015). Detailed information is given in Supplementary Material (SM2, 3).
2.7 Sensitivity analysis
To account for the uncertainties and potential error propagation, we carried out a sensitive analysis for the biomass and metabolic rate estimates of both zooplankton and micronekton (mesopelagic fish and decapods) using the Monte Carlo method with a range of conversion factors (CF) (Supplementary Table S2). Briefly, we incorporated uncertainties in measurements and conversion factors at each calculation step and conducted 100,000 simulations. The mean and standard deviation of these simulations were then calculated and presented as the final estimates. Detailed information is given in Supplementary Material (SM4).
2.8 Statistics
To identify environmental patterns that control fluxes and assess the correlation between biomass, migrant biomass and active flux of zooplankton, decapods, and mesopelagic fish with environmental parameters, we first calculated the average values of temperature, salinity, chlorophyll a concentration, and oxygen concentration for the regions in the approximate mixed layer (0–50 m), epipelagic (0–200 m) and mesopelagic (200–700 m) layers. We also included satellite-derived NPP and POC flux measured by the sediment traps. The correlation between all parameters was calculated using R’s co function and visualized using the ComplexHeatmap package (Gu, 2022). We checked whether correlations are significant (p< 0.05) using simple linear regression. Note that a discrepancy between a strong correlation and the lack of significance in the linear regression (or vice versa) could occur due to the small sample size (n = 5) and, in some cases, narrow range of parameter values. All regressions were visually checked, but care should be taken to not overinterpret individual results. All analyses were performed in the programming language R (R Core Team, 2022). The sampling map was generated using the geographic information system QGIS (V.3.22.3) (QGIS Development Team, 2021).
3 Results
3.1 Hydrography conditions
The vertical temperature profiles (Figure 1A) showed lower average values in the northern Atlantic, both in the epipelagic layer (Z4 = 13.7°C and Z5 = 14.3°C) and mesopelagic layer (Z4 = 11.9°C and Z5 = 10.9°C), compared to the Mediterranean stations (Z1 = 17.1°C; Z2 = 16.9°C and Z1 = 13.5°C; Z2 = 13.3°C, respectively). The Gulf of Cádiz showed epipelagic values similar to the Mediterranean ones (17.2°C), but lower mean temperature at depth (11.5°C). Salinity profiles (Figure 1B) showed high mean values in the epipelagic at Z1 and Z2 (37.8 and 36.9, respectively), compared to the Atlantic stations, increasing at depth due to the high salinity of the Mediterranean Sea (38.5 for both). Salinity at Z3 decreased with depth, with a mean value of 36.3 in the epipelagic zone and 35.7 in the mesopelagic zone, likely influenced by the presence of less saline Atlantic waters. Z4 and Z5 exhibited a consistent salinity pattern in the upper 400 m, with mean values of approximately 35.6-35.7. Beyond this depth, salinity increased slightly, reaching 36.3 at Z4 and 36.0 at Z5 by 800 m. Surface oxygen levels were similar across all stations, with values of 4.7, 5.0, 4.9, 5.1, and 5.2 ml·L-1 at Z1 through Z5, respectively (Figure 1C). Higher oxygen concentrations were observed at depth at Z4 and Z5, coinciding with the layers of lowest temperature and salinity. At Z1 and Z3, an oxygen peak occurred at 50–75 m depth, corresponding to the onset of the thermocline and a decline in temperature.
Figure 1
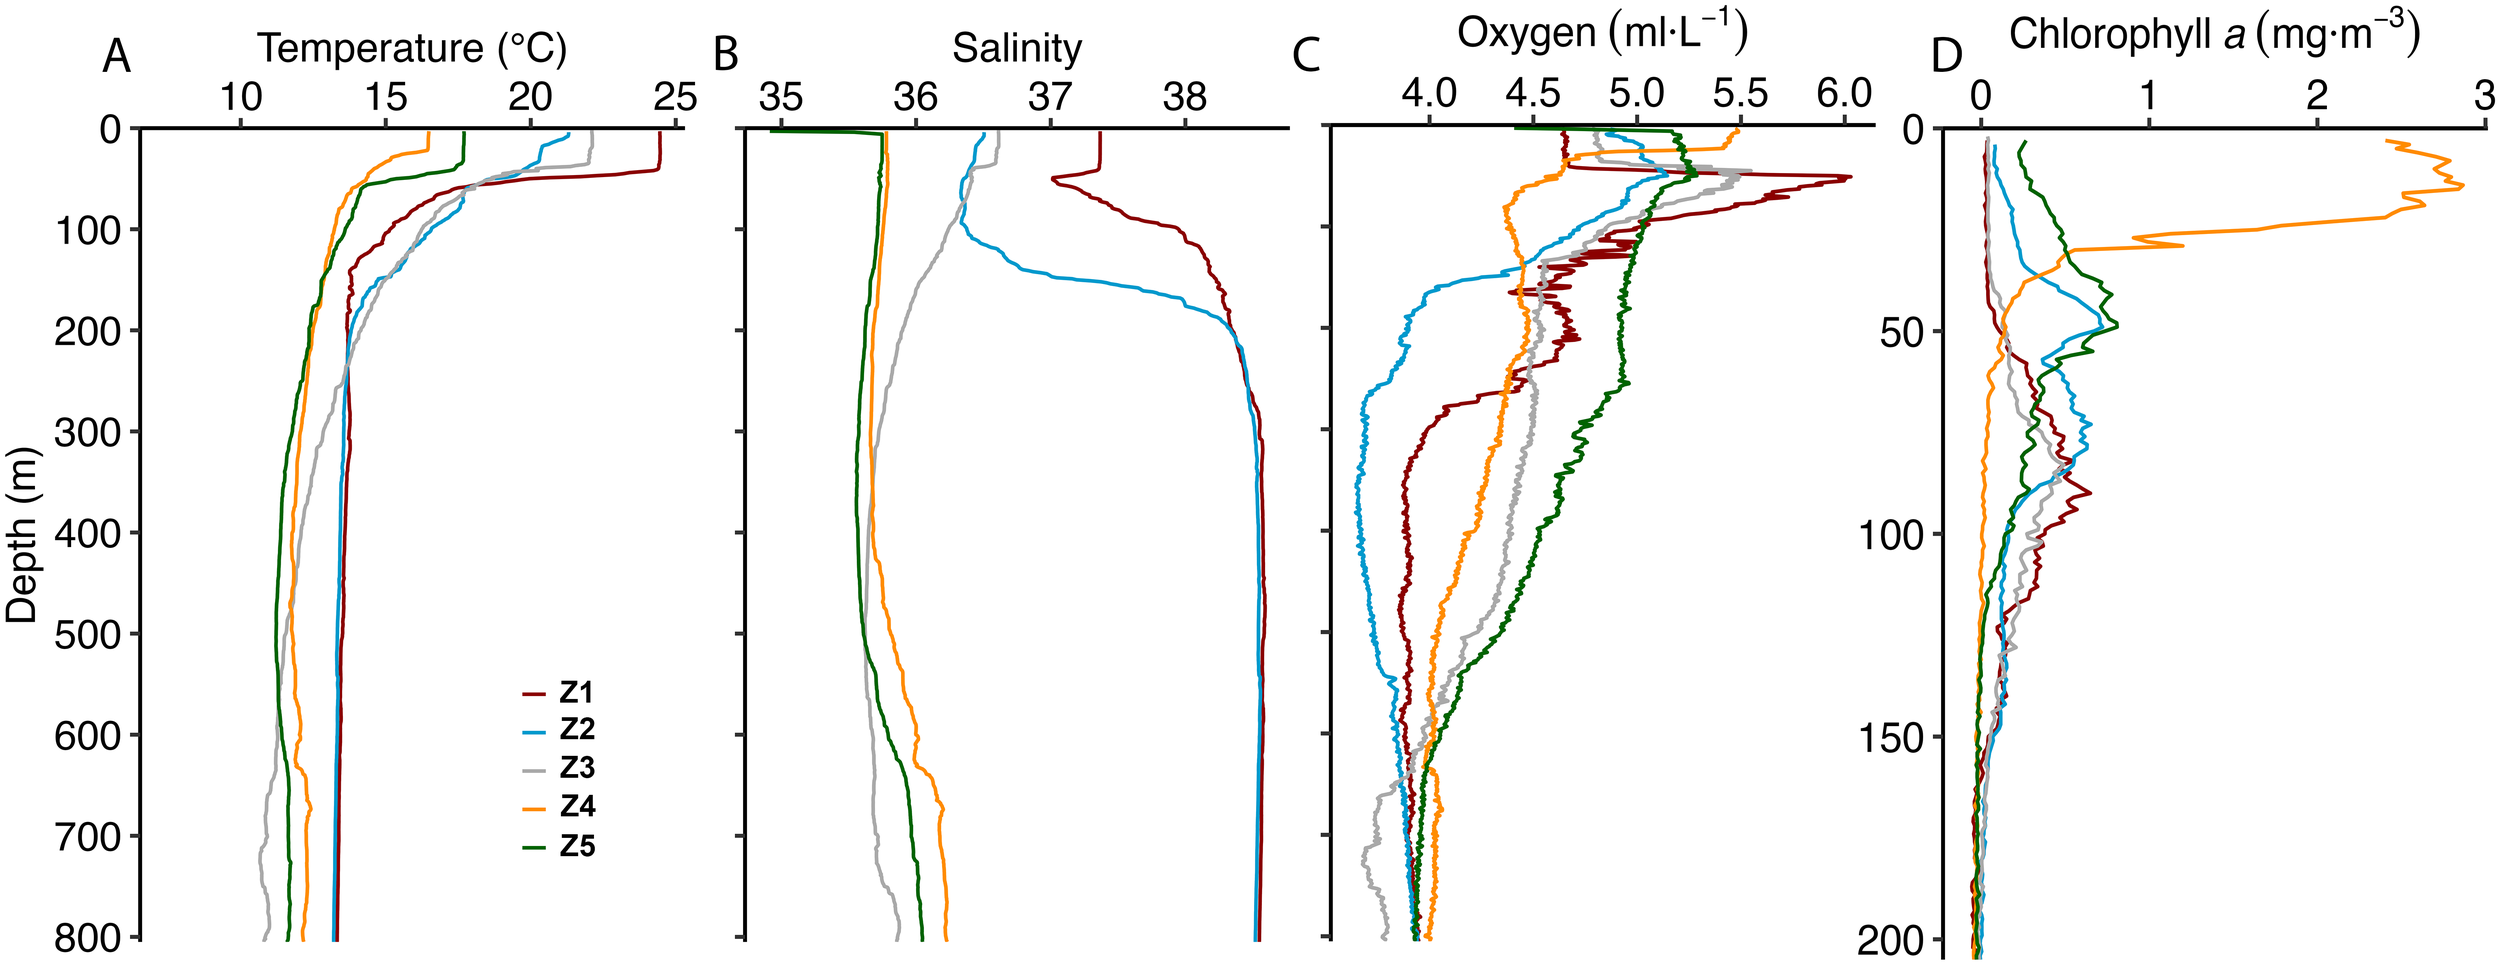
Vertical profiles of (A) temperature (°C), (B) salinity, (C) mL·L-1 and (D) chlorophyll a (mg·m-3) at Z1 (red), Z2 (blue), Z3 (purple), Z4 (orange), and Z5 (green). Note the different y-axis scale for chlorophyll a.
Epipelagic Chl a values (Figure 1D) were generally low, displaying maximum values lower than 0.4 mg·m-3 at Z1, from 0.4-0.9 mg·m-3 at Z2,<0.3 mg·m-3 at Z3, and 0.7 mg·m-3 at Z5, with the exception of Z4 in the upwelling zone off Portugal, where surface Chl a concentrations reached values close to 3 mg·m-3. Higher net primary production values occurred at the Atlantic stations (1006 ± 449 mg C·m-2·d-1) compared to the Mediterranean stations (451 ± 141 mg C·m-2·d-1), showing the highest values in Z4 (Table 1).
Table 1
| Zone | Net | POC flux | Zooplankton | Mesopelagic fish | Decapods | |||
|---|---|---|---|---|---|---|---|---|
| Primary production | Trap-estimated | Migrant biomass | Active flux | Migrant biomass | Active flux | Migrant biomass | Active flux | |
| (mg C·m-2·d-1) | (mg C·m-2·d-1) | (mg C·m-2) | (mg C·m-2·d-1) | (mg C·m-2) | (mg C·m-2·d-1) | (mg C·m-2) | (mg C·m-2·d-1) | |
| Z1 | 401 | 7.9 ± 3.9 | 497 ± 98 | 40.9 ± 10.2 | 108 ± 72 | 8.9 ± 10.3 | 56 ± 39 | 1.9 ± 1.1 |
| Z2 | 611 | 953 ± 192 | 113.4 ± 32.2 | 104 ± 73 | 7.0 ± 7.9 | 329 ± 245 | 13.4 ± 7.7 | |
| Z3 | 342 | 4.2 ± 0.2 | 173 ± 34 | 30.6 ± 7.5 | 89 ± 62 | 4.6 ± 5.2 | 189 ± 127 | 15.1 ± 8.9 |
| Z4 | 1324 | 5.5 ± 0.6 | 174 ± 34 | 12 ± 2.5 | 98 ± 66 | 4.3 ± 4.9 | 450 ± 302 | 42.1 ± 24.1 |
| Z5 | 688 | 29 ± 6 | 1.8 ± 0.3 | 6 ± 4 | 0.3 ± 0.3 | 338 ± 231 | 22.6 ± 13.2 | |
Net primary production (0–200 m depth), passive organic carbon (POC) flux measured at 150 m depth, zooplankton, mesopelagic fish, and decapods migrant biomass (± sensitivity analysis error) and active flux (± sensitivity analysis error) from epipelagic layer (0–200 m depth) to mesopelagic layer (200–700 m depth).
Micronekton (mesopelagic fish and decapods) values were estimated using a capture efficiency of 20 ± 13%.
3.2 Trap-derived particulate organic carbon flux
Due to strong currents at Z2 and rough sea conditions at Z5, it was not possible to measure trap-derived POC flux at these stations. Across the remaining stations, POC flux values were relatively consistent, ranging from 4.2 ± 0.2 mg C·m-2·d-1 at Z3 to 7.9 ± 3.9 mg C·m-2·d-1 at Z1 (Table 1). No significant relationship (assessed by linear regression) was found between POC flux, net primary production, or active flux values (Supplementary Table S3).
3.3 Zooplankton and micronekton vertical distribution
Vertical profiles of zooplankton biomass showed the expected patterns of higher biomass in the upper 100 m layer and decreasing with depth (Figure 2A), except at Z2 where a biomass peak was observed in the mesopelagic layer between 400 and 500 m depth. At Z1-3, mean zooplankton biomass in the epipelagic layer was higher during nighttime, whereas at the northern Atlantic stations (Z4-5) daytime mean biomass was greater. Micronekton biomass vertical profiles revealed higher values in the upper 300 m during nighttime compared to deeper layers, where greater variability in biomass distribution between day and night was found (Figure 2B). This pattern was consistent for both mesopelagic fish (Figure 2C) and decapods (Figure 2D).
Figure 2
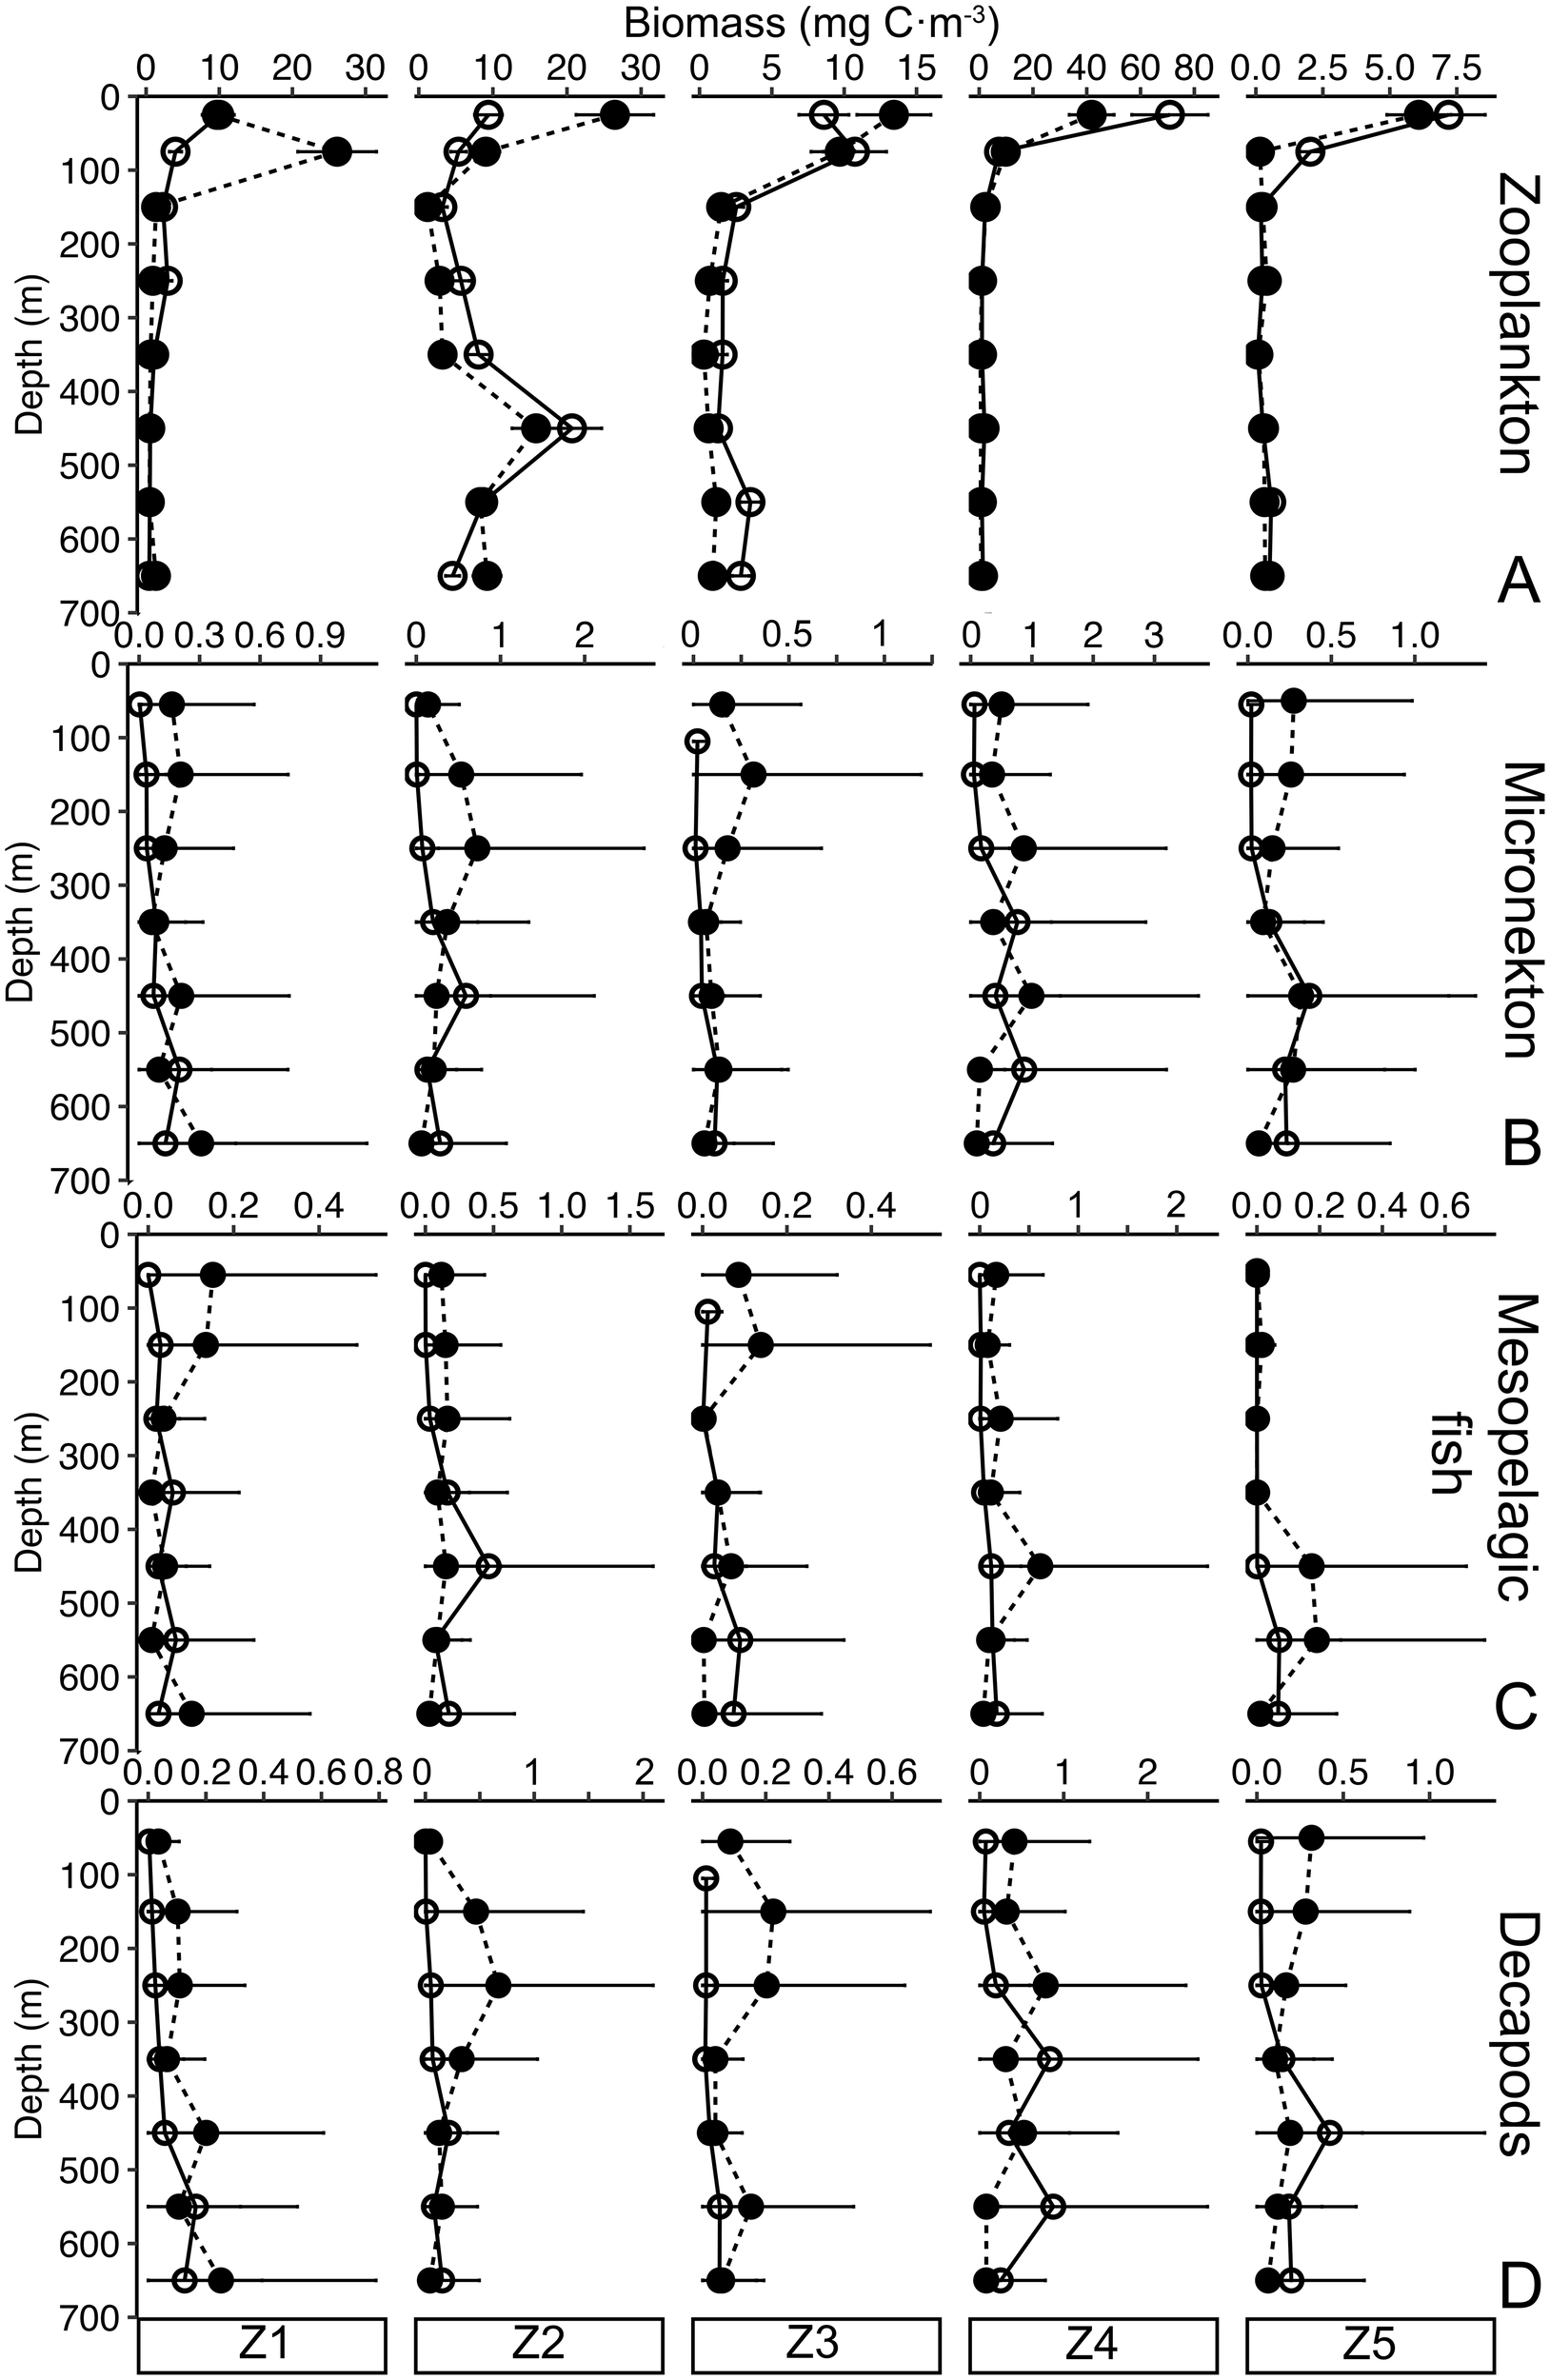
Biomass (mg C·m-3) vertical distribution (0–700 m depth) of (A) zooplankton, (B) micronekton (mesopelagic fish and decapods), (C) mesopelagic fish, and (D) decapods during day (empty dots) and night (black dots) at the different zones. Note different x-axis scale for each station. Black lines stand for the sensitive analysis error.
3.4 Zooplankton and micronekton ETS profiles
Zooplankton specific ETS activity profile represents the average specific ETS activity of the zooplankton community (Figure 3A). Except for Z3, zooplankton specific ETS activities were higher in the upper 200 m depth during nighttime, gradually decreasing with depth. Copepods (Figure 3B) and euphausiids (Figure 3C) exhibited higher specific ETS activities, with more pronounced day-night and spatial variability compared to chaetognaths (Figure 3D). Micronekton (mesopelagic fish and decapods average specific activity) ETS values were not measured at all depths across the stations (Figure 3E). Generally, micronekton specific ETS activity stations (Figures 3E–G) showed higher values at depth during the daytime, except at Z3.
Figure 3
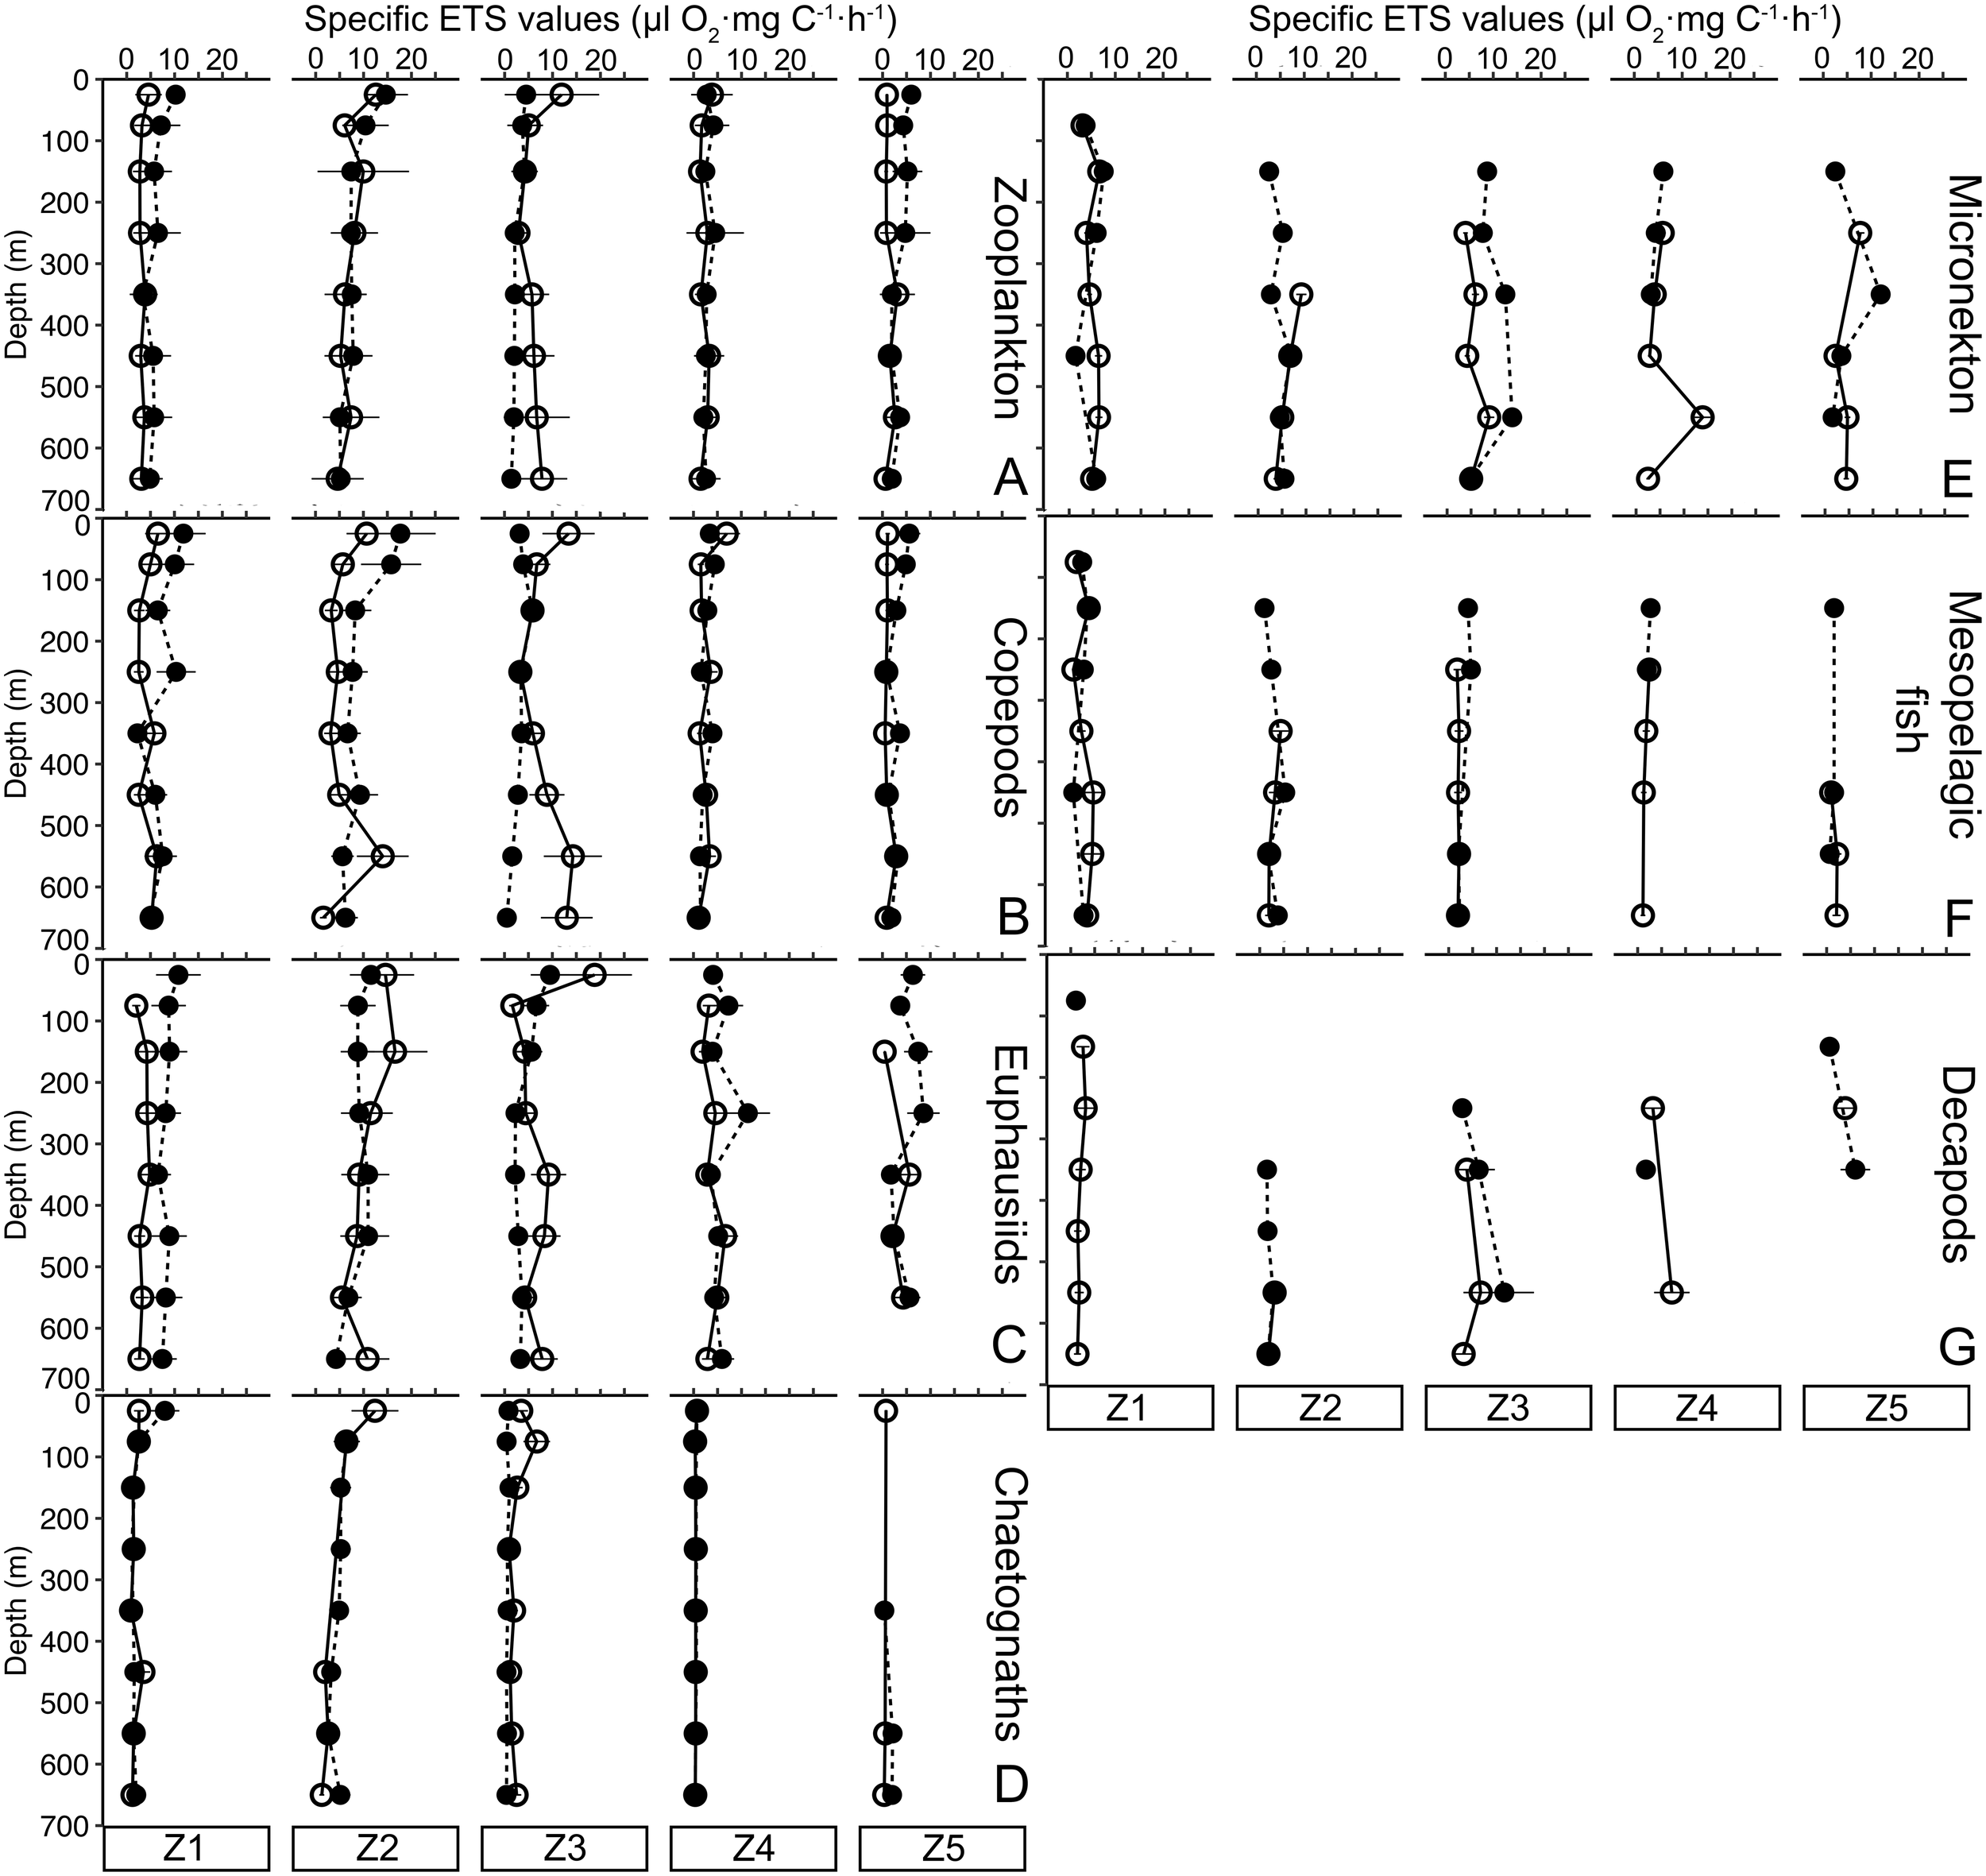
Specific ETS activity (µl O2·mg C-1·h-1) vertical profiles of (A) total zooplankton, (B) copepods, (C) euphausiids, (D) chaetognaths, (E) micronekton (mesopelagic fish and decapods), (F) mesopelagic fish, and (G) decapods. Empty dots are daytime activity values, while black dots are nighttime specific ETS activity. Black lines stand for the sensitive analysis error.
3.5 Respiratory and total active flux
Zooplankton respiratory flux was almost 6-fold higher in the Mediterranean (26.9 ± 20.2 mg C·m-2·d-1) than in the Atlantic (4.6 ± 4.5 mg C·m-2·d-1) (Supplementary Table S4, Figure 4). In contrast, total micronekton (mesopelagic fish and decapods) respiratory flux was lower in the Mediterranean by a factor of 2 compared to the Atlantic (5.7 ± 2.5 and 10.8 ± 5.3 mg C·m-2·d-1, respectively). This difference was driven by changes in decapods migration: Like for zooplankton, mesopelagic fish respiratory fluxes were higher at Mediterranean stations (2.9 ± 2.8 mg C·m-2·d-1) compared to the Atlantic stations (1.1 ± 0.8 mg C·m-2·d-1), while decapods respiratory fluxes were higher by a factor of 3 at Atlantic stations (9.7 ± 6.6 mg C·m-2·d-1) compared to the Mediterranean stations (2.8 ± 1.7 mg C·m-2·d-1) (Figure 4). Mortality, gut and excretion fluxes followed the same patterns as these are estimated based on respiration fluxes.
Figure 4
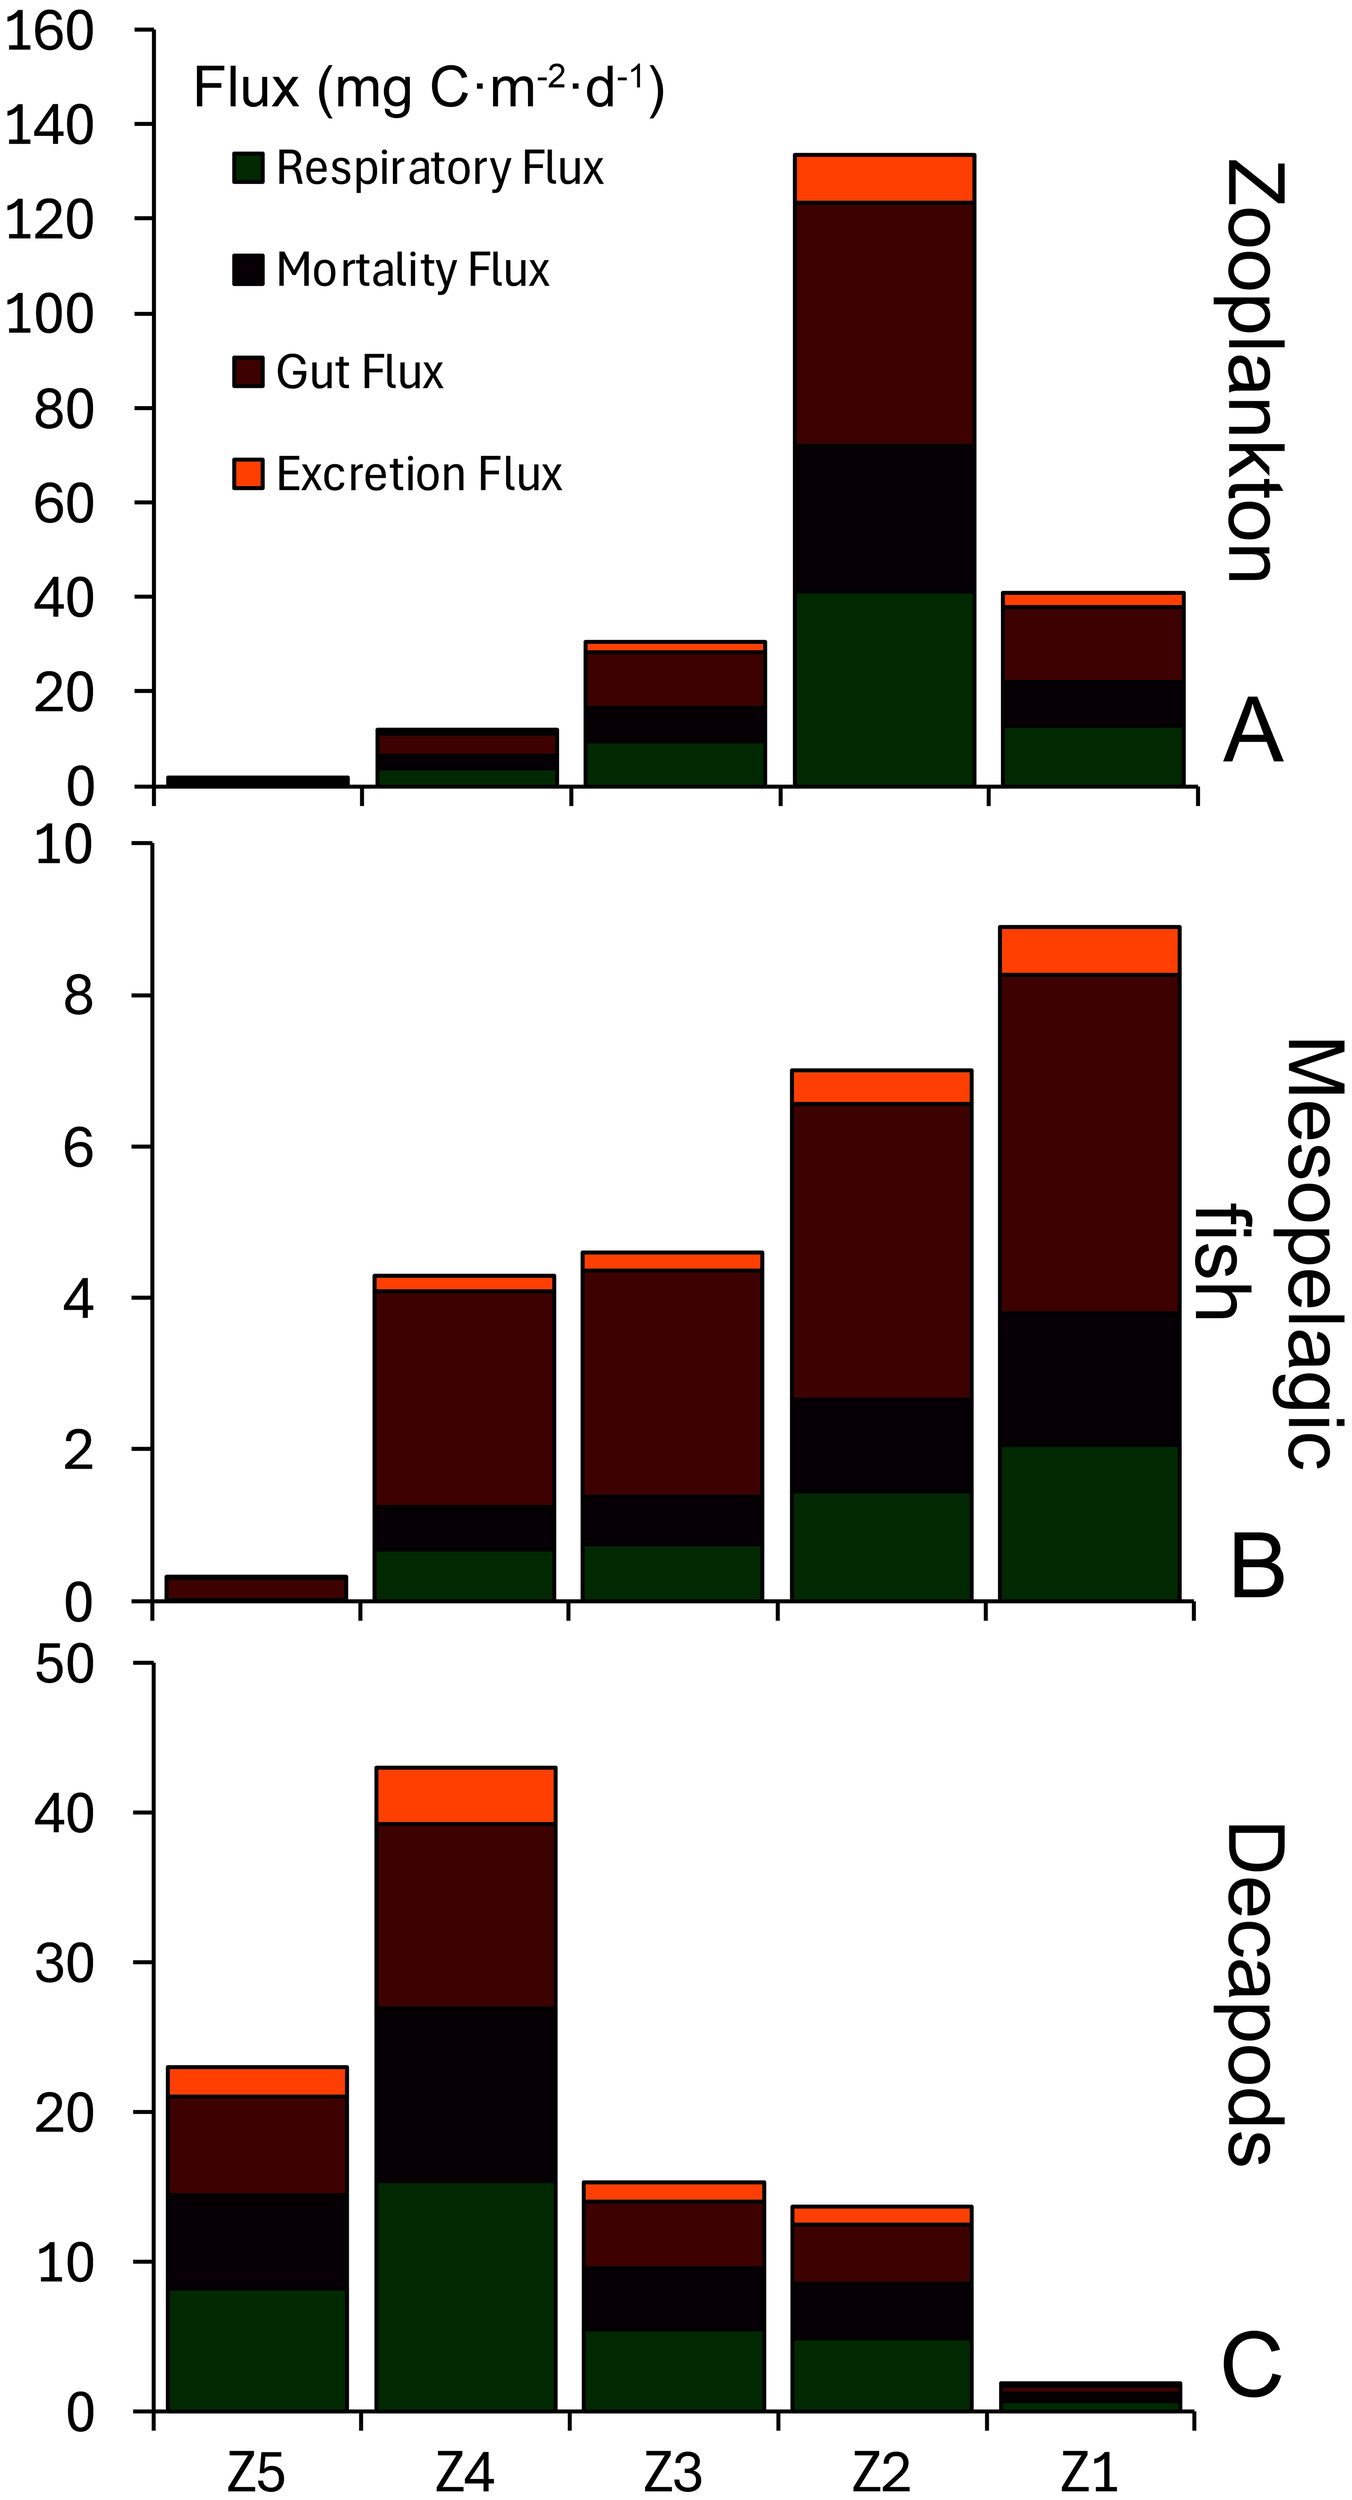
Respiratory (in green), mortality (in purple), gut (in dark red), and excretion (in orange) fluxes (mg C·m-2·d-1) of (A) zooplankton, (B) mesopelagic fish, and (C) decapods.
3.6 Migrant biomass
Considerable variability in zooplankton migrant biomass was observed across zones, with higher values at the Mediterranean stations (497 and 953 mg C·m-2 at Z1 and Z2, respectively), accounting for 70% of the total migrant biomass, compared to Z3 (173 mg C·m-2), Z4 (174 mg C·m-2), and Z5 (29 mg C·m-2) (Table 1, Figure 5). In contrast, micronekton migrant biomass was higher in the Atlantic (Z3-5) compared to the Mediterranean (Z1-2) where migrant biomass exceeded 50% (Table 1, Figure 5). Fish migrant biomass ranged from 6 at Z5 to 108 mg C·m-2 at Z1, while decapods biomass exhibited larger variability (ranging from 56 at Z1 to 450 mg C·m-2 at Z4) with an average biomass value 3-fold higher than mesopelagic fish migrants. At Z1, fish accounted for a larger proportion of migrant biomass than decapods, but the proportion of decapods increased progressively across the stations, reaching over 80% of the total migrant biomass at Z5 (Figure 5).
Figure 5
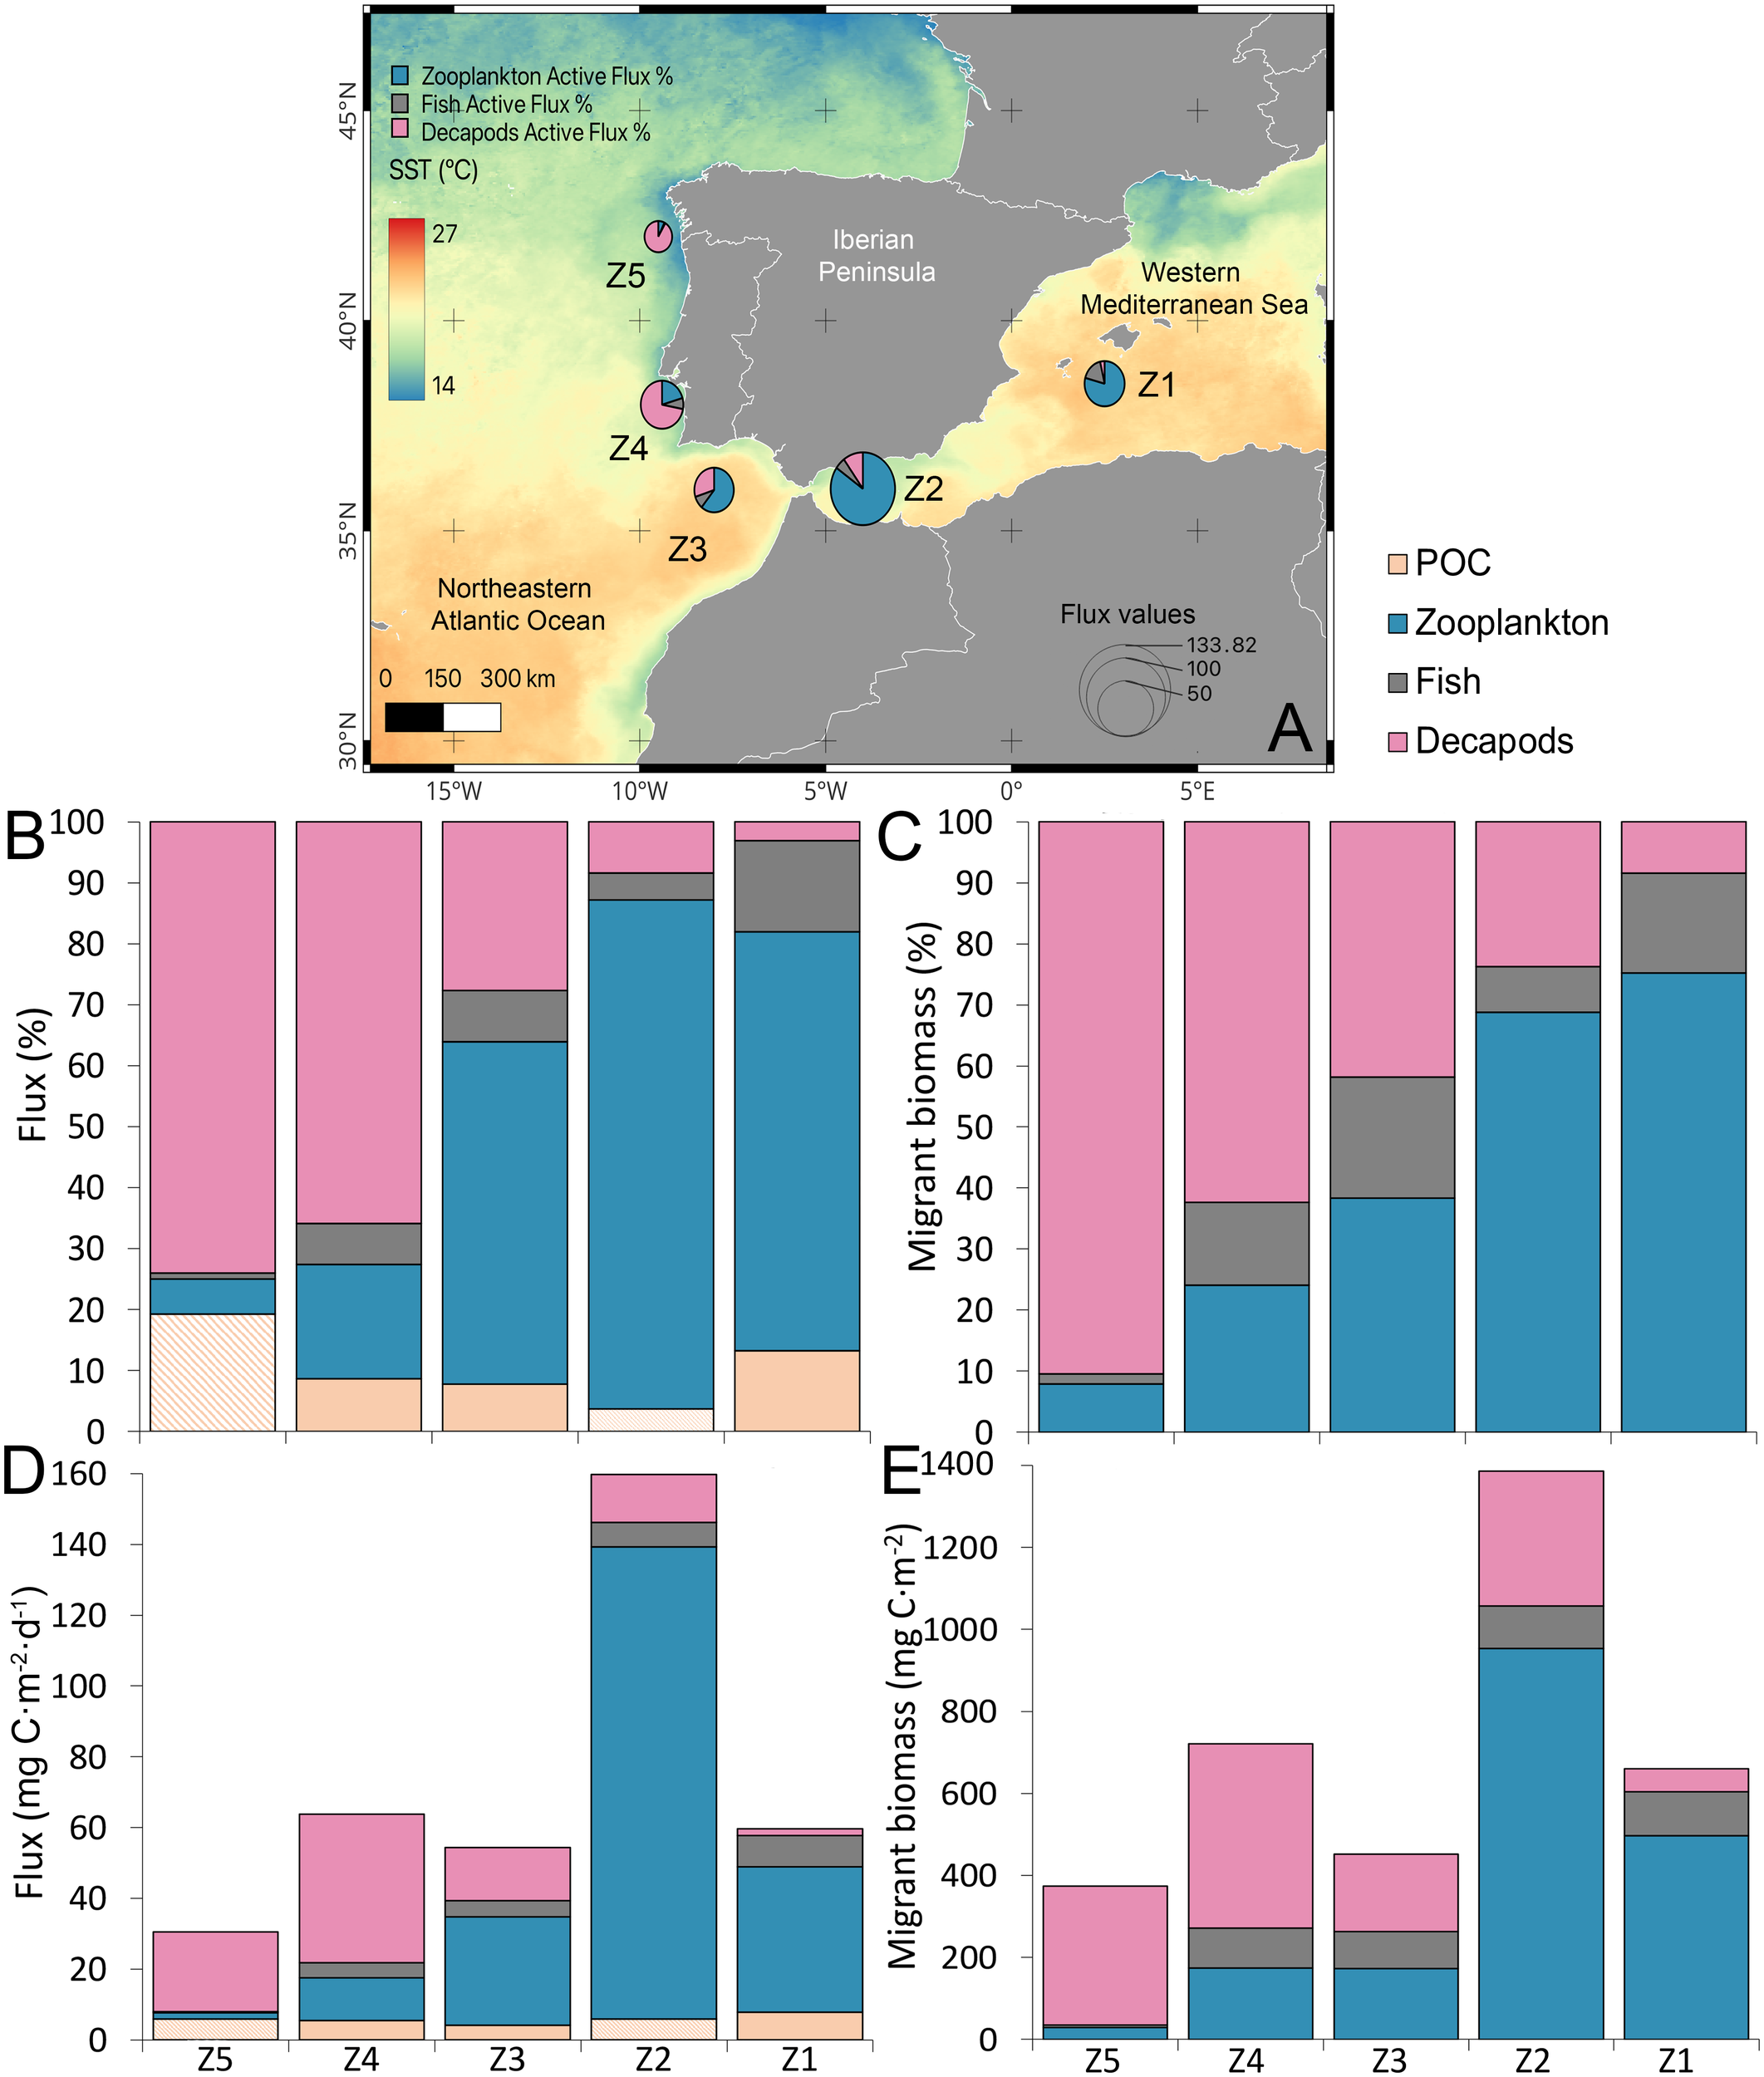
(A) Study zones sampled during the CSIC-SUMMER cruise, with background colors representing sea surface temperature (SST, °C) in October 2020. Zone 1 (Z1) corresponds to the south of the Balearic Islands, Zone 2 (Z2) to the western Alborán Sea, Zone 3 (Z3) to the Gulf of Cadiz, Zone 4 (Z4) off Lisbon, and zone 5 (Z5) off Galicia. Bubble size indicates total active flux (zooplankton + micronekton), with blue for zooplankton, grey for fish, and pink for decapods. (B) Percentage contribution to the biological carbon pump by passive flux (light orange), zooplankton (blue), and micronekton (purple; fish + decapods). For Z5 and Z2, we do not have direct passive flux measurements, so we applied the average value from Z1, Z3 and Z4 (shaded orange). (C) Percentage distribution of migrant biomass among zooplankton, fish, and decapods. (D) Carbon fluxes (mg C·m-2·d-1). (E) Migrant biomass values (mg C·m-2).
3.7 Carbon budget for active and sinking fluxes
Total active flux (zooplankton and micronekton) displayed the highest value at station Z2 (133.8 mg C·m-2·d-1) and the lowest at station Z5 (24.6 mg C·m-2·d-1), while the remaining stations exhibited similar values: Z1 = 51.7, Z3 = 50.2, and Z4 = 58.4 mg C·m-2·d-1 (Table 1, Figure 5). In the Mediterranean (Z1-2), micronekton active flux contributed to the total flux by 13% at Z1 and 18% at Z2 to the carbon flux, while zooplankton active flux was the dominant contributor (Figure 5). In contrast, at Z4 and Z5, zooplankton active flux accounted for only 7% and 19% of the total flux, respectively, playing a relatively minor role. Instead, micronekton activity drove the majority of the flux in these zones due to decapods flux. Notably, POC flux was substantially lower, contributing just 13%, 8%, and 9% of the total carbon flux at Z1, Z3, and Z4, respectively.
3.8 Correlation between biological and environmental parameters
Zooplankton migrant biomass was significantly correlated with salinity (positive) and oxygen (negative) in the mesopelagic layer (Figure 6). Similarly, zooplankton active flux was negatively correlated with oxygen in the mesopelagic. Fish active flux exhibited significant positive correlations with temperature in the mesopelagic layer and salinity in the epipelagic layer but was negatively correlated with oxygen in the first 50 m depth. Decapods biomass was significantly positively correlated with NPP and Chl a in the upper 50 m depth, and migrant biomass negatively correlated with salinity and temperature in the upper 50 m depth. Additionally, decapods active flux was significantly positively correlated to NPP, Chl a in the upper 50 m depth, and Chl a in the epipelagic layer. Strikingly, the matrix correlation revealed that decapods exhibited an opposite pattern compared to zooplankton and mesopelagic fish, showing positive correlation with productivity (both NPP and Chl a) but a negative correlation to temperature and salinity. Finally, POC flux exhibited a negative correlation with oxygen in the mesopelagic layer.
Figure 6
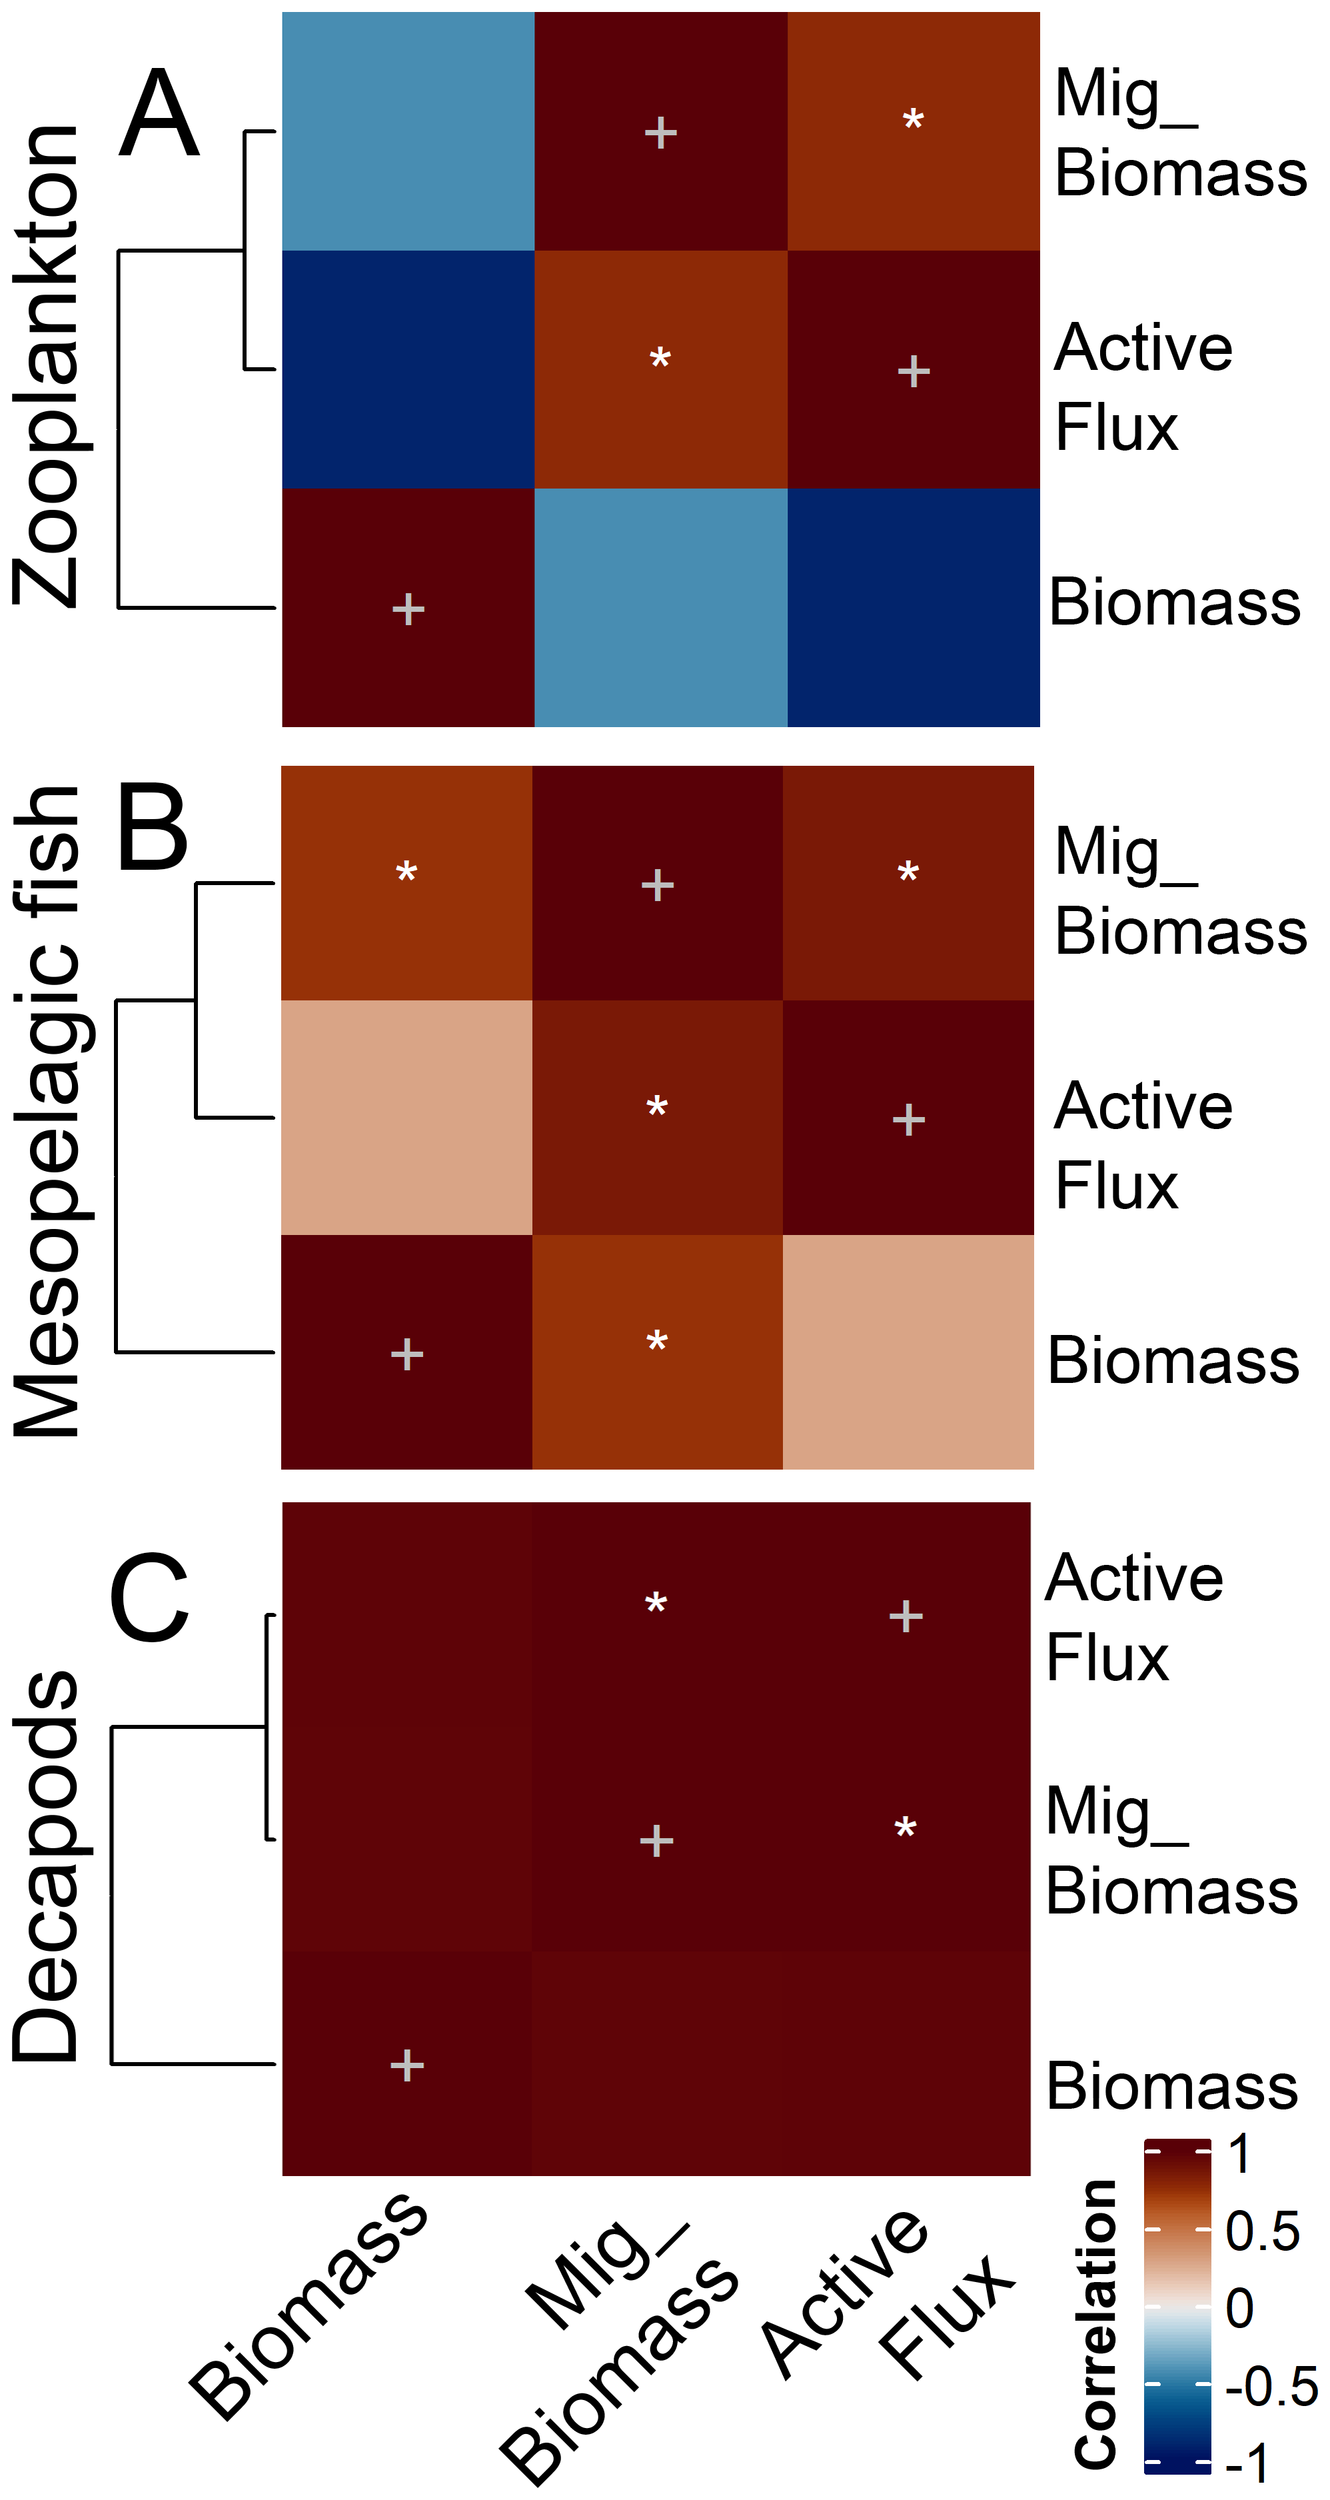
Results of the correlation analysis between the (A) zooplankton, (B) mesopelagic fish, and (C) decapods biomass, migrant biomass (Mig_Biomass), and active flux with the environmental variables. T stands for temperature, Sal for salinity, Oxy for oxygen, ML for the Mixed Layer (0–50 m), Epi for epipelagic (0–200 m), and Meso for mesopelagic (200–700 m). White stars indicate significant (p<0.05) linear regressions, while grey crosses indicate autocorrelation of the same variable. R2 for all significant relationships are > 0.78. * stand for significant correlations.
We only found a significant relationship between decapods and NPP (R2 = 0.845, p<0.05, n=5), but no significant relationship between zooplankton nor fish and NPP (not shown). Fish migrant biomass was the only variable that exhibited a significant positive relationship with biomass, while no significant relationship was observed between biomass and active flux in any of the other groups. Noteworthy here is that for both fish and decapods, total biomass and migrant biomass was positively correlated, whereas for zooplankton there appeared to be a negative correlation. Finally, in all three communities, migrant biomass was -as expected due to autocorrelation- significant positive correlation with active flux (Figure 7).
Figure 7
Results of the correlation analysis between zooplankton, decapods, and mesopelagic fish biomass, migrant biomass (Mig_Biomass), and active flux. White stars stand for signi cant p-values and grey crosses the same variables. All p-values are p<0.5 and R2 > 0.78. * stand for significant correlations.
4 Discussion
This study quantifies the zooplankton and micronekton active flux as well as passive flux across different productive regimes in both the Mediterranean Sea and the Atlantic Ocean. To our knowledge, only one study quantified total active flux along a productivity gradient (Atlantic Ocean; Hernández-León et al., 2019a). Contrary to the previous study, we found that the total active flux did not vary consistently with the net primary production of the area. Instead, total active flux depended on the composition of the migrating community, with varying contributions by zooplankton and micronekton. Strikingly, micronekton active flux was dominated by decapods, especially in the north Atlantic Ocean stations. Based on our understanding, no prior research has specifically addressed carbon active flux by micronekton in the Mediterranean Sea, and even data from the Atlantic Ocean remain scarce (Hernández-León et al., 2019a). Furthermore, no studies have simultaneously examined active and passive flux in these two distinct regions (Supplementary Table S4).
4.1 Zooplankton and micronekton carbon flux
The relative contribution of each group (zooplankton, decapods, and mesopelagic fish) to the carbon flux shifted from the Mediterranean Sea to the Atlantic Ocean. While zooplankton dominated the carbon flux in the Mediterranean Sea, micronekton -specifically decapods- played a particularly prominent role in the North Atlantic Ocean (Figure 4).
While mesopelagic fish have recently become an intense subject of study (see Aksnes et al., 2023), our data highlights that the role of decapods in the active flux is substantial and may exceed active flux by both zooplankton and fishes. Despite the high abundance of decapods in many parts of the world’s oceans (Flock and Hopkins, 1992), their active flux has received little attention (Angel and Pugh, 2000; Schukat et al., 2013; Pakhomov et al., 2019). Estimates of decapod active flux vary widely between studies with no clear agreement on the values. In the North Atlantic Ocean, previous estimates of decapod active flux varied by an order of magnitude [2 versus 12.1 mg C·m-2·d-1; Angel and Pugh (2000); Schukat et al. (2013)], while our estimates were up to 20 times higher (ranging from 15.1 to 42.1 mg C·m-2·d-1) compared to Angel and Pugh (2000). On the other hand, in the central North Pacific Subtropical Gyre, decapod active flux estimates were up to two orders of magnitude lower than those in our study (0.4 to 0.6 mg C·m-2·d-1; Pakhomov et al., 2019). The large discrepancies between studies and regions, in addition to the limited availability of data, emphasize the urgent need to increase research efforts to better understand the contribution of decapods to the carbon flux.
We observed a strong, although not statistically significant, positive correlation between decapod active flux and total biomass. While total biomass itself does not directly determine active flux, our results suggest that higher total biomass is associated with higher migrant biomass (Díaz-Pérez et al., 2024), which is directly used in flux calculations. Therefore, total decapod biomass can serve as a rough indicator of potential active flux. Enhanced decapod biomass has been associated with oxygen minimum zones (Vereshchaka et al., 2016; Hernández-León et al., 2019a), lower mesopelagic fish biomass (Ariza et al., 2015), and high productivity (Schukat et al., 2013; Hernández-León et al., 2019a). The latter scenario may explain our findings, as decapod biomass (and active flux) were significantly correlated with NPP and Chl a (Figure 5). Similarly, in the Costa Rica Dome (Stukel et al., 2018) and in the open-ocean upwelling of the Guinea Dome (Hernández-León et al., 2019a), active transport by these pelagic micronektonic fauna was the dominant vertical transport mechanism in areas of high productivity. Although no direct explanation has been provided, it seems that the continuous fueling of primary production, the role of protists as an important intermediate trophic level in these upwelling systems (Ward and Follows, 2016; Armengol et al., 2019), or both, in these areas of persistent productivity influence the contribution of the decapods to the biological pump. Despite the limited research on how environmental variables influence decapods distribution, high primary production appears to be a common factor driving increased decapods biomass.
In terms of both biomass and total active flux, the Alboran Sea (Z2) stands out in our dataset. The relatively high zooplankton migrant biomass observed here, compared to other stations, may be linked to the influence of the anticyclonic gyre. This gyre enhances both migration from deeper waters and active flux by deepening the thermocline, which promotes the sinking of bacteria and phytoplankton due to inward motion (Arístegui et al., 1994, 1997), thereby providing a significant source of carbon (Yebra et al., 2005). Previous research on zooplankton active flux in that area reported a similar value of zooplankton migrant biomass to ours (993 and 953 mg C·m-2, respectively), but a zooplankton respiratory flux 2.4 times lower than ours (17.2 and here 41.1 ± 5.4 mg C·m-2·d-1, respectively) (Yebra et al., 2018). Even though the values of migrant biomass were rather similar, the higher estimates in zooplankton respiratory flux in our study imply higher zooplankton active flux. The enhanced NPP observed in this study compared to Yebra et al. (2018) (84 and 611 mg C·m-2·d-1, respectively) could explain the discrepancy in both respiration and active flux due to increased metabolic activity. This aligns with the expectation that productive areas, characterized by a large and consistent food supply, tend to exhibit higher carbon flux (Hernández-León et al., 2019a). On the other hand, discrepancies in the respiratory fluxes might be related to variations in zooplankton body size (Hernández-León et al., 2024), as smaller organisms tend to exhibit higher respiration rates (Ikeda, 1985). Yebra et al. (2018) sampled the core of western anticyclonic gyre, that was found to host larger organisms compared to nearby areas (Valcárcel-Pérez et al., 2019). Thus, larger organisms at the core of the eddy likely exhibit lower respiration rates compared to the smaller organisms found in the surrounding areas, such as our sampling station.
The relatively low zooplankton migrant biomass values and active flux observed at the northern Atlantic stations could possibly be attributed to zooplankton biomass patchiness, which is common in high-productivity areas and particularly pronounced in upwelling zones (Barton et al., 1998). These sites (Z4 and Z5) also had higher zooplankton biomass at the surface during the day, contrary to expected diel vertical migration patterns. Mesoscale structures, such as eddies and upwelling filaments, promote large differences in phytoplankton and zooplankton populations over short periods and distances in coastal transition zones (Hernández-León et al., 2024). In this context, we suggest that the higher zooplankton biomass found during daytime off Portugal and Galicia was related to important advection due to Ekman offshore transport in upwelling systems, which could induce large mesoscale variability (Batchelder et al., 2002).
4.2 Relationship between biomass and environmental variables
While decapods biomass was influenced by the productivity of the area, zooplankton and mesopelagic fish biomass in the water column showed no significant relationship with any of the analyzed environmental variables (Figure 6). This lack of correlation hampers the direct explanation for the distinct vertical profiles observed between the Mediterranean and the Atlantic Ocean. These results suggest that zooplankton and mesopelagic fish biomass vertical distribution in the water column should be also affected by other factors beyond the traditional environmental metrics of Chl a, NPP, temperature, salinity, and oxygen. Drivers may include nutrient stress impacting phytoplankton diversity (Tian et al., 2017), the depth of the deep chlorophyll maximum affecting the trophic coupling between phytoplankton and heterotrophic prokaryotic production (Marañón et al., 2021), as well as predation pressure and competition among zooplankton species (Gage and Tyler, 1992). Furthermore, shifts in the zooplankton feeding ecology -such as a transition from omnivorous to carnivorous or gelatinous filter-feeding zooplankton- could reduce food quality for fish, making it less nutritious (Heneghan et al., 2023).
Finally, it is worth mentioning that only fish biomass was significantly related to fish migrant biomass (Figure 7). Thus, higher zooplankton and decapods biomass in the water column does not imply higher migratory biomass or higher fluxes as one might expect. These findings suggest that factors beyond biomass, such as species composition (Hays et al., 2001), behavior (Forward, 1988), trophic interactions (Pinti et al., 2019) or food supply, play a critical role in governing vertical migration and carbon transport. It becomes increasingly evident that a comprehensive understanding of the influence of environmental conditions on biomass vertical distribution, requires looking beyond traditional metrics (e.g., temperature, salinity, oxygen, and productivity) to uncover the mechanisms shaping biomass distribution.
4.3 Relationship between total active flux and environmental conditions
We found no clear relationship between NPP and total active flux, with active flux estimates up to 10 times higher than previously reported under similar NPP (Ariza et al., 2015; Hernández-León et al., 2019a). Instead, the total active flux varied depending on the composition of the migrating community, which, similarly to biomass, appeared to be influenced by different environmental variables. According to the correlation matrix, active flux by zooplankton and mesopelagic fish was negatively correlated with oxygen (although, not significantly) and positively correlated with temperature and salinity, whereas decapods displayed the inverse pattern (Figure 6). Our loose interpretation of this pattern is that the active flux by these groups is on a broader scale influenced by water masses, with active flux by zooplankton and mesopelagic fish being, relatively, more prevalent in the warmer and saltier waters of the Mediterranean, whereas decapods dominate active flux in the colder fresher Atlantic waters.
Of particular interest is the significantly negative relationship between oxygen concentrations (in the mesopelagic) and zooplankton active flux. This relationship might be related to the influence of oxygen availability on the community structure, vertical distribution (Ekau et al., 2010), metabolic activity (Kiko and Hauss, 2019), as well as feeding and excretion rates (Robinson et al., 2010). However, care should be taken with zooplankton correlation as it is expected the avoidance of the mesopelagic zone if oxygen levels decline below approximately 20 µmol O2·kg-1 (Hauss et al., 2016). Thus, enhanced active flux by low oxygen might be related to other factors such as food availability while minimizing predation risk from larger predators that are less tolerant of low oxygen levels (Gilly et al., 2013).
4.4 Passive and active flux
Finally, our findings indicated that carbon flux was mainly driven by diel vertical migrants rather than by the passive flux (see Table 1, Figure 4). Recent global models suggested that active flux of carbon due to zooplankton diel vertical migration accounts for 10-18% of the passive flux (Aumont et al., 2018; Archibald et al., 2019; Nowicki et al., 2022) in areas of low productivity (Koppelmann and Weikert, 2007). In contrast, in high-productivity areas, carbon flux has been suggested to be primarily carried out by diel migrants, due to high biomass of low-turnover organisms such as zooplankton (Yebra et al., 2005, 2018; Hernández-León et al., 2019a). Thus, active flux is expected to be low on a global scale due to widespread oligotrophic conditions, as the transfer of organic carbon to the deep ocean should be enhanced along with net primary production (Davison et al., 2013; Hernández-León et al., 2020). However, our findings suggest that the relationship between the passive and active flux is not directly dependent on productivity.
4.5 Conclusion
This study examined different pathways of the biological carbon pump from the Mediterranean Sea to the Atlantic Ocean, revealing strong regional differences in the active flux. We found no clear relationship between NPP and total active flux; instead, flux varied according to the composition of the migrating community. In the Mediterranean Sea, zooplankton were the dominant contributors, with enhanced migrant biomass driving a substantial zooplankton-mediated carbon export. By contrast, in the North Atlantic Ocean, micronekton, particularly decapods, played a prominent role, while mesopelagic fishes contributed more modestly but in patterns linked to the distribution of water masses. Decapod active flux appeared influenced by regional productivity, whereas zooplankton and mesopelagic fish fluxes were more closely associated with the properties of the water column. Finally, the relatively low contribution of passive flux compared to total active flux underscores the central role of the mesopelagic-migrant pump, with distinct taxonomic groups dominating in different oceanic regions.
Statements
Data availability statement
The original contributions presented in the study are included in the article/Supplementary Material, further inquiries can be directed to the corresponding author/s.
Author contributions
MC: Conceptualization, Data curation, Formal analysis, Investigation, Methodology, Writing – original draft, Writing – review & editing. AS: Conceptualization, Data curation, Formal analysis, Investigation, Methodology, Writing – review & editing. JL: Conceptualization, Investigation, Methodology, Writing – review & editing. SG: Data curation, Formal analysis, Investigation, Methodology, Writing – review & editing. WM: Methodology, Writing – review & editing. MO: Conceptualization, Funding acquisition, Investigation, Methodology, Writing – review & editing. JD: Formal analysis, Writing – review & editing. AC: Methodology, Writing – review & editing. SH: Conceptualization, Funding acquisition, Investigation, Supervision, Writing – review & editing.
Funding
The author(s) declare financial support was received for the research and/or publication of this article. This work was supported by projects “Sustainable Management of Mesopelagic Resources” (SUMMER, H2020, Grant agreement No 817806), “DisEntangling Seasonality of Active Flux In the Ocean” (DESAFÍO, PID 2020- 118118RB-100), and IMDEEP (CajaCanarias-LaCaixa, ref. 2022CLISA15). María Couret was supported by a postgraduate grant (TESIS2022010116) co-financed by the Agencia Canaria de Investigación, Innovación y Sociedad de la Información de la Consejería de Universidades, Ciencia e Innovación y Cultura and by the Fondo Social Europeo Plus (FSE+) Programa Operativo Integrado de Canarias 2021-2027, Eje 3 Tema Prioritario 74 (85%). JDP by a postgraduate grant (ULPGC2022-2) from Universidad de Las Palmas de Gran Canaria. ASL by a postgraduate grant (IN606B-2024/018) from the “Agencia Gallega de Innovación”.
Acknowledgments
The authors wish to thank the crew and other scientists on board the R/V “Sarmiento de Gamboa” as well as the technicians of the “Unidad de Tecnología Marina” (UTM) for their support and help during the cruise. This work was supported by projects “Sustainable Management of Mesopelagic Resources” (SUMMER, H2020, Grant agreement No 817806), “DisEntangling Seasonality of Active Flux In the Ocean” (DESAFÍO, PID 2020- 118118RB-100), and IMDEEP (CajaCanarias-LaCaixa, ref. 2022CLISA15). María Couret was supported by a postgraduate grant (TESIS2022010116) co-financed by the Agencia Canaria de Investigación, Innovación y Sociedad de la Información de la Consejería de Universidades, Ciencia e Innovación y Cultura and by the Fondo Social Europeo Plus (FSE+) Programa Operativo Integrado de Canarias 2021-2027, Eje 3 Tema Prioritario 74 (85%). JDP by a postgraduate grant (ULPGC2022-2) from Universidad de Las Palmas de Gran Canaria. ASL by a postgraduate grant (IN606B-2024/018) from the “Agencia Gallega de Innovación”.
Conflict of interest
The authors declare that the research was conducted in the absence of any commercial or financial relationships that could be construed as a potential conflict of interest.
Generative AI statement
The author(s) declare that no Generative AI was used in the creation of this manuscript.
Any alternative text (alt text) provided alongside figures in this article has been generated by Frontiers with the support of artificial intelligence and reasonable efforts have been made to ensure accuracy, including review by the authors wherever possible. If you identify any issues, please contact us.
Publisher’s note
All claims expressed in this article are solely those of the authors and do not necessarily represent those of their affiliated organizations, or those of the publisher, the editors and the reviewers. Any product that may be evaluated in this article, or claim that may be made by its manufacturer, is not guaranteed or endorsed by the publisher.
Supplementary material
The Supplementary Material for this article can be found online at: https://www.frontiersin.org/articles/10.3389/fmars.2025.1652483/full#supplementary-material
References
1
Aksnes D. L. Løtvedt A. S. Lindemann C. Calleja M. L. Morán X. A. G. Kaarvedt S. et al . (2023). Effects of migrating mesopelagic fishes on the biological carbon pump. Mar. Ecol. Prog. Ser.717, 107–126. doi: 10.3354/MEPS14373
2
Andersen T. Hessen D. O. (1991). Carbon, nitrogen, and phosphorus content of freshwater zooplankton. Limnology and Oceanography36(4), 807–814.
3
Andersen K. H. Berge T. Gonçalves R. J. Hartvig M. Heuschele J. Hylander S. et al . (2016). Characteristic sizes of life in the oceans, from bacteria to whales. Annual Review of Marine Science8, 217–241.
4
Angel M. V. (1989). Vertical profiles of pelagic communities in the vicinity of the Azores Front and their implications to deep ocean ecology. Prog. Oceanogr.22, 1–46. doi: 10.1016/0079-6611(89)90009-8
5
Angel M. V. Pugh P. R. (2000). Quantification of diel vertical migration by micronektonic taxa in the northeast Atlantic. Hydrobiologia. 440, 161–179. doi: 10.1007/978-94-017-1982-7_16
6
Archibald K. M. Siegel D. A. Doney S. C. (2019). Modeling the impact of zooplankton diel vertical migration on the carbon export flux of the biological pump. Global Biogeochem. Cycles33, 181–199. doi: 10.1029/2018GB005983
7
Arístegui J. Sangrá P. Hernández-León S. Cantón M. Hernández-Guerra A. Kerling J. L. (1994). Island-induced eddies in the canary islands. Deep sea res. Part I Oceanogr. Res. Pap.41, 1509–1525. doi: 10.1016/0967-0637(94)90058-2
8
Arístegui J. Tett P. Hernández-Guerra A. Basterretxea G. Montero M. F. Wild K. et al . (1997). The influence of island-generated eddies on chlorophyll distribution: a study of mesoscale variation around Gran Canaria. Deep Sea Res. Part I Oceanogr. Res. Pap.44, 71–96. doi: 10.1016/S0967-0637(96)00093-3
9
Ariza A. Garijo J. C. Landeira J. M. Bordes F. Hernández-León S. (2015). Migrant biomass and respiratory carbon flux by zooplankton and micronekton in the subtropical northeast Atlantic Ocean (Canary Islands). Prog. Oceanogr.134, 330–342. doi: 10.1016/j.pocean.2015.03.003
10
Ariza A. Landeira J. M. Escánez A. Wienerroither R. Aguilar de Soto N. Røstad A. et al . (2016). Vertical distribution, composition and migratory patterns of acoustic scattering layers in the Canary Islands. J. Mar. Syst.157, 82–91. doi: 10.1016/j.jmarsys.2016.01.004
11
Armengol L. Calbet A. Franchy G. Rodríguez-Santos A. Hernández-León S. (2019). Planktonic food web structure and trophic transfer efficiency along a productivity gradient in the tropical and subtropical Atlantic Ocean. Sci. Rep.9, 2044. doi: 10.1038/s41598-019-38507-9
12
Aumont O. Maury O. Lefort S. Bopp L. (2018). Evaluating the potential impacts of the diurnal vertical migration by marine organisms on marine biogeochemistry. Global Biogeochem. Cycles32, 1622–1643. doi: 10.1029/2018GB005886
13
Baker K. Halfter S. Scoulding B. Swadling K. M. Richards S. A. Bressac M. et al . (2025). Carbon injection potential of the mesopelagic-migrant pump in the Southern Ocean during summer. Front. Mar. Sci.12, 1461723. doi: 10.3389/fmars.2024.1461723
14
Banse K. (1996). Zooplankton: pivotal role in the control of ocean production. Oceanogr. Lit. Rev.5, 455.
15
Barton E. D. Arístegui J. Tett P. Cantón M. García-Braun J. Hernández-León S. et al . (1998). The transition zone of the Canary Current upwelling region. Prog. Oceanogr.41, 455–504. doi: 10.1016/S0079-6611(98)00023-8
16
Basu S. Mackey K. R. (2018). Phytoplankton as key mediators of the biological carbon pump: Their responses to a changing climate. Sustainability10, 869. doi: 10.3390/su10030869
17
Batchelder H. P. Edwards C. A. Powell T. M. (2002). Individual-based models of copepod populations in coastal upwelling regions: implications of physiologically and environmentally influenced diel vertical migration on demographic success and nearshore retention. Prog. Oceanography53, 307–333. doi: 10.1016/S0079-6611(02)00035-6
18
Behrenfeld M. J. Falkowski P. G. (1997). Photosynthetic rates derived from satellite-based chlorophyll concentration. Limnol. Oceanogr.42, 1–20. doi: 10.4319/lo.1997.42.1.0001
19
Bianchi D. Stock C. Galbraith E. D. Sarmiento J. L. (2013). Diel vertical migration: Ecological controls and impacts on the biological pump in a one-dimensional ocean model. Global Biogeochem. Cycles27, 478–491. doi: 10.1002/gbc.20031
20
Brett J. R. Groves T. D. D. (1979). Physiological energetics. Fish Physiol.8, 280–352. doi: 10.1016/S1546-5098(08)60029-1
21
Buesseler K. O. Antia A. N. Chen M. Fowler S. W. Gardner W. D. Gustafsson Ö. et al . (2007). An assessment of the use of sediment traps for estimating upper ocean particle fluxes. J. Mar. Res. 65, 345–416. doi: 10.1357/002224007781567621
22
Carlson C. A. Ducklow H. W. Michaels A. F. (1994). Annual flux of dissolved organic carbon from the euphotic zone in the northwestern Sargasso Sea. Nature371, 405–408. doi: 10.1038/371405a0
23
Castellón A. Olivar M. P. (2023). VERDA: A multisampler tool for mesopelagic nets. J. Mar. Sci. Eng.11, 72. doi: 10.3390/jmse11010072
24
Clements D. J. Stamieszkin K. Bianchi D. Blanco-Bercial L. Record N. R. Rodriguez-Perez R. B. et al . (2025). Active carbon transport by diel vertical migrating zooplankton: calculated and modeled, but never measured. Annu. Rev. Mar. Sci.18. doi: 10.1146/annurev-marine-121422-015330
25
Couret M. Díaz-Pérez J. Sarmiento-Lezcano A. N. Landeira J. M. Hernández-León S. (2024). Respiration rates and its relationship with ETS activity in euphausiids: implications for active flux estimations. Front. Mar. Sci.11. doi: 10.3389/fmars.2024.1469587
26
Dam H. G. Peterson W. T. (1993). Seasonal contrasts in the diel vertical distribution, feeding behavior, and grazing impact of the copepod Temora longicornis in Long Island Sound. J. Mar. Res.51, 561–594. doi: 10.1357/0022240933223972
27
Davison P. (2011). The specific gravity of mesopelagic fish from the Northeastern Pacific Ocean and its implications for acoustic backscatter. ICES J. Mar. Sci. 68, 2064–074. doi: 10.1093/icesjms/fsr140
28
Davison P. C. Checkley D. M. Koslow J. A. Barlow J. (2013). Carbon export mediated by mesopelagic fishes in the northeast Pacific Ocean. Prog. Oceanogr.116, 14–30. doi: 10.1016/j.pocean.2013.05.013
29
Díaz-Pérez J. Landeira J. M. Hernández-León S. Reyes-Martínez M. J. González-Gordillo J. I. (2024). Distribution patterns of micronektonic crustaceans (Decapoda, Euphausiacea, and Lophogastrida) in the tropical and subtropical Atlantic Ocean. Prog. Oceanography228, 103331. doi: 10.1016/j.pocean.2024.103331
30
Ekau W. Auel H. Pörtner H. O. Gilbert D. (2010). Impacts of hypoxia on the structure and processes in pelagic communities (zooplankton, macro-invertebrates and fish). Biogeosciences7, 1669–1699. doi: 10.5194/bg-7-1669-2010
31
Flock M. E. Hopkins T. L. (1992). Species composition, vertical distribution, and food habits of the sergestid shrimp assemblage in the eastern Gulf of Mexico. J. Crustac. Biol.12, 210–223. doi: 10.2307/1549076
32
Forward R. B. (1988). Diel vertical migration: zooplankton photobiology and behaviour. Oceanogr. Mar. Biol. Annu.26, 1–393.
33
Gage J. D. Tyler P. A. (1992). Deep-sea biology: a natural history of organisms at the deep-sea floor. ( Cambridge University Press). 504.
34
Gilly W. F. Beman J. M. Litvin S. Y. Robison B. H. (2013). Oceanographic and biological effects of shoaling of the oxygen minimum zone. Annu. Rev. Mar. Sci.5, 393–420. doi: 10.1146/annurev-marine-120710-100849
35
Gjøsaeter J. (1984). Mesopelagic fish, a large potential resource in the Arabian Sea. Deep Sea Res.31, 1019–1035. doi: 10.1016/0198-0149(84)90054-2
36
Gómez M. Torres S. Hernández-León S. (1996). Modification of the electron transport system (ETS) method for routine measurements of respiratory rates of zooplankton. S. Afr. J. Mar. Sci.17, 15–20. doi: 10.2989/025776196784158446
37
Gorsky G. Ohman M. D. Picheral M. Gasparini S. Stemmann L. Romagnan J. B. et al . (2010). Digital zooplankton image analysis using the ZooScan integrated system. J. Plankton Res.32, 285–303. doi: 10.1093/plankt/fbp124
38
Gu Z. (2022). Complex heatmap visualization. iMeta1, e43. doi: 10.1002/imt2.43
39
Guidi L. Legendre L. Reygondeau G. Uitz J. Stemmann L. Henson S. A. (2015). A new look at ocean carbon remineralization for estimating deepwater sequestration. Glob. Biogeochem. Cycles29, 1044–1059. doi: 10.1002/2014GB005063
40
Hauss H. Christiansen S. Schütte F. Kiko R. Edvam Lima M. Rodrigues E. et al . (2016). Dead zone or oasis in the open ocean? Zooplankton distribution and migration in low-oxygen modewater eddies. Biogeosciences13, 1977–1989. doi: 10.5194/bg-13-1977-2016
41
Hays G. C. Kennedy H. Frost B. W. (2001). Individual variability in diel vertical migration of a marine copepod: why some individuals remain at depth when others migrate. Limnol. Oceanogr.46, 2050–2054. doi: 10.4319/lo.2001.46.8.2050
42
Heneghan R. F. Everett J. D. Blanchard J. L. Sykes P. Richardson A. J. (2023). Climate-driven zooplankton shifts cause large-scale declines in food quality for fish. Nat. Clim. Change13, 470–477. doi: 10.1038/s41558-023-01630-7
43
Hernández-León S. Calles S. Fernández de Puelles M. L. (2019c). The estimation of metabolism in the mesopelagic zone: disentangling deep-sea zooplankton respiration. Prog. Oceanogr.178, 102163. doi: 10.1016/j.pocean.2019.102163
44
Hernández-León S. Gómez M. (1996). Factors affecting the respiration/ETS ratio in marine zooplankton. J. Plankton Res.18, 239–255. doi: 10.1093/plankt/18.2.239
45
Hernández-León S. Ikeda T. (2005). “ Zooplankton respiration,” in Respiration in Aquatic Ecosystems. ( Oxford University Press, Oxford), 67–82.
46
Hernández-León S. Koppelmann R. Fraile-Nuez E. Bode A. Mompeán C. Irigoien X. et al . (2020). Large deep-sea zooplankton biomass mirrors primary production in the global ocean. Nat. Commun.11, 11. doi: 10.1038/s41467-020-19875-7
47
Hernández-León S. Olivar M. P. Fernández de Puelles M. L. Bode A. Castellón A. López-Pérez C. et al . (2019a). Zooplankton and micronekton active flux across the tropical and subtropical Atlantic Ocean. Front. Mar. Sci.6. doi: 10.3389/fmars.2019.00535
48
Hernández-León S. Putzeys S. Almeida C. Bécognée P. Marrero-Díaz A. Arístegui J. et al . (2019b). Carbon export through zooplankton active flux in the Canary Current. J. Mar. Syst.189, 12–21. doi: 10.1016/j.jmarsys.2018.09.002
49
Hernández-León S. Sarmiento-Lezcano A. Couret M. Armengol L. Medina-Suárez I. Fatira E. et al . (2024). Seasonality of zooplankton active flux in subtropical waters. Limnol. Oceanogr. 69, 2564–2579. doi: 10.1002/lno.12689
50
Hidaka K. Kawaguchi K. Murakami M. Takahashi M. (2001). Downward transport of organic carbon by diel migratory micronekton in the western equatorial Pacific: its quantitative and qualitative importance. Deep Sea Res. Part I Oceanogr. Res. Pap.48, 1923–1939. doi: 10.1016/S0967-0637(01)00003-6
51
Honjo S. Manganini S. J. Krishfield R. A. Francois R. (2008). Particulate organic carbon fluxes to the ocean interior and factors controlling the biological pump: a synthesis of global sediment trap programs since 1983. Prog. Oceanogr.76, 217–285. doi: 10.1016/j.pocean.2007.11.003
52
Ikeda T. (1985). Metabolic rates of epipelagic marine zooplankton as a function of body mass and temperature. Mar. Biol.85, 1–11. doi: 10.1007/BF00396409
53
Ikeda T. Motoda S. (1978). Estimated zooplankton production and their ammonia excretion in the Kuroshio and adjacent seas. Fish. Bull.76, 357–367.
54
Judkins H. Vecchione M. (2020). Vertical distribution patterns of cephalopods in the northern Gulf of Mexico. Front. Mar. Sci.7. doi: 10.3389/fmars.2020.00047
55
Kenner R. A. Ahmed S. I. (1975). Measurements of electron transport activities in marine phytoplankton. Mar. Biol.33, 119–127. doi: 10.1007/BF00390716
56
Kiko R. Hauss H. (2019). On the estimation of zooplankton-mediated active fluxes in oxygen minimum zone regions. Front. Mar. Sci.6. doi: 10.3389/fmars.2019.00741
57
Knauer G. A. Martin J. H. Bruland K. W. (1979). Fluxes of particulate carbon, nitrogen, and phosphorus in the upper water column of the northeast Pacific. Deep Sea Res. Part A Oceanogr. Res. Pap.26, 97–108. doi: 10.1016/0198-0149(79)90089-X
58
Koppelmann R. Weikert H. (2007). Spatial and temporal distribution patterns of deep-sea mesozooplankton in the eastern Mediterranean – indications of a climatically induced shift? Mar. Ecol.28, 259–275. doi: 10.1111/j.1439-0485.2007.00154.x
59
Koslow J. A. Kloser R. J. Williams A. (1997). Pelagic biomass and community structure over the mid-continental slope off southeastern Australia based upon acoustic and mid-water trawl sampling. Mar. Ecol. Prog. Ser.146, 21–35. doi: 10.3354/meps146021
60
Kwong L. E. Henschke N. Pakhomov E. A. Everett J. D. Suthers I. M. (2020). Mesozooplankton and micronekton active carbon transport in contrasting eddies. Front. Mar. Sci.6. doi: 10.3389/fmars.2019.00825
61
Lampert W. (1989). The adaptive significance of diel vertical migration of zooplankton. Funct. Ecol.3, 21. doi: 10.2307/2389671
62
Lehette P. Hernández-León S. (2009). Zooplankton biomass estimation from digitized images: a comparison between subtropical and Antarctic organisms. Limnol. Oceanogr. Methods7, 304–308. doi: 10.4319/lom.2009.7.304
63
Longhurst A. R. Bedo A. W. Harrison W. G. Head E. J. H. Sameoto D. D. (1990). Vertical flux of respiratory carbon by oceanic diel migrant biota. Deep Sea Res. Part A Oceanogr. Res. Pap.37, 685–694. doi: 10.1016/0198-0149(90)90098-G
64
Longhurst A. R. Harrison G. W. (1988). Vertical nitrogen flux from the oceanic photic zone by diel migrant zooplankton and nekton. Deep Sea Res. Part A Oceanogr. Res. Pap.35, 881–889. doi: 10.1016/0198-0149(88)90065-9
65
Longhurst A. R. Harrison W. G. (1989). The biological pump: profiles of plankton production and consumption in the upper ocean. Prog. Oceanogr.22, 47–123. doi: 10.1016/0079-6611(89)90010-4
66
López-Pérez C. Olivar M. P. Hulley P. A. Tuset V. M. (2020). Length–weight relationships of mesopelagic fishes from the equatorial and tropical Atlantic waters: influence of environment and body shape. J. Fish Biol.96, 1388–1398. doi: 10.1111/jfb.14307
67
Marañón E. Van Wambeke F. Uitz J. Boss E. S. Dimier C. Dinasquet J. et al . (2021). Deep maxima of phytoplankton biomass, primary production and bacterial production in the Mediterranean Sea. Biogeosciences18, 1749–1767. doi: 10.5194/bg-18-1749-2021
68
Massutí E. Sánchez-Guillamón O. Farriols M. T. Palomino D. Frank A. Bárcenas P. et al . (2021). Improving scientific knowledge of Mallorca Channel seamounts (Western Mediterranean) within the framework of Natura 2000 network. Diversity14, 4. doi: 10.3390/d14010004
69
May J. L. Blaber S. J. M. (1989). Benthic and pelagic fish biomass of the upper continental slope off eastern Tasmania. Mar. Biol.101, 11–25. doi: 10.1007/BF00393474
70
Meillat M. (2012). “ Essais du chalut mésopélagos pour le programme MYCTO 3D-MAP de l’IRD, à bord du Marion Dufresne,” in IFREMER Rapport de mission Marion Dufresne R.INT.RBE/STH/LTH 2012–2015.
71
Mestre M. Ruiz-González C. Logares R. Duarte C. M. Gasol J. M. Sala M. M. (2018). Sinking particles promote vertical connectivity in the ocean microbiome. Proc. Natl. Acad. Sci. U.S.A.115, E6799–E6807. doi: 10.1073/pnas.1802470115
72
Nowicki M. DeVries T. Siegel D. A. (2022). Quantifying the carbon export and sequestration pathways of the ocean’s biological carbon pump. Glob. Biogeochem. Cycles36, e2021GB007083. doi: 10.1029/2021GB007083
73
Olivar M. P. Castellón A. Sabatés A. Sarmiento-Lezcano A. Emelianov M. Bernal A. et al . (2022). Variation in mesopelagic fish community composition and structure between Mediterranean and Atlantic waters around the Iberian Peninsula. Front. Mar. Sci.9. doi: 10.3389/fmars.2022.1028717
74
Olivar M. P. Hulley P. A. Castellón A. Emelianov M. López C. Tuset V. M. et al . (2017). Mesopelagic fishes across the tropical and equatorial Atlantic: Biogeographical and vertical patterns. Prog. Oceanogr.151, 116–137. doi: 10.1016/j.pocean.2016.12.001
75
Omori M. Ikeda T. (1984). Methods in Marine Zooplankton Ecology. (New York, NY: John Wiley and Sons).
76
Owens T. G. King F. D. (1975). The measurement of respiratory electron-transport-system activity in marine zooplankton. Mar. Biol.30, 27–36. doi: 10.1007/BF00393750
77
Packard T. T. (1971). The measurement of respiratory electron-transport activity in marine phytoplankton. J. Mar. Res.29, 235–244.
78
Pakhomov E. A. Podeswa Y. Hunt B. P. V. Kwong L. E. Woodson C. B. (2019). Vertical distribution and active carbon transport by pelagic decapods in the North Pacific Subtropical Gyre. ICES J. Mar. Sci.76, 702–717. doi: 10.1093/icesjms/fsy134
79
Passow U. Carlson C. A . (2012). The biological pump in a high CO2 world. Marine Ecology Progress Series470, 249–271.
80
Picheral M. Colin S. Irisson J. O. (2017). EcoTaxa, a tool for the taxonomic classification of images.
81
Pinti J. Devries T. Norin T. Serra-Pompei C. Proud R. Siegel D. A. et al . (2023). Model estimates of metazoans’ contributions to the biological carbon pump. Biogeosciences20, 997–1009. doi: 10.5194/bg-20-997-2023
82
Pinti J. Kiørboe T. Thygesen U. H. Visser A. W. (2019). Trophic interactions drive the emergence of diel vertical migration patterns: a game-theoretic model of copepod communities. Proc. R. Soc B Biol. Sci.286, 20191645. doi: 10.1098/rspb.2019.1645
83
QGIS Development Team (2021). QGIS geographic information system ( Open Source Geospatial Foundation Project). Available online at: http://qgis.osgeo.org (Accessed March 04, 2022).
84
R Core Team (2022). R: A Language and Environment for Statistical Computing.
85
Robinson C. Steinberg D. K. Anderson T. R. Arístegui J. Carlson C. A. Frost J. R. et al . (2010). Mesopelagic zone ecology and biogeochemistry – a synthesis. Deep Sea Research Part II: Topical Studies in Oceanography, 57 (16), 1504–1518 doi: 10.1016/j.dsr2.2010.02.018
86
Romero-Romero S. Choy C. A. Hannides C. C. S. Popp B. N. Drazen J. C. (2019). Differences in the trophic ecology of micronekton driven by diel vertical migration. Limnol. Oceanogr.64, 1473–1483. doi: 10.1002/lno.11128
87
Sarmiento-Lezcano A. N. Busquets-Vass G. Rubio-Rodríguez U. Olivar M. P. Peña M. Medina-Suárez I. et al . (2022b). Active flux seasonality of the small dominant migratory crustaceans and mesopelagic fishes in the Gulf of California during June and October. Prog. Oceanography208, 102894. doi: 10.1016/j.pocean.2022.102894
88
Sarmiento-Lezcano A. N. Olivar M. P. Peña M. Landeira J. M. Armengol L. Medina-Suárez I. et al . (2022a). Carbon remineralization by small mesopelagic and bathypelagic Stomiiforms in the Northeast Atlantic Ocean. Prog. Oceanography203, 102787. doi: 10.1016/j.pocean.2022.102787
89
Schukat A. Bode M. Auel H. Carballo R. Martin B. Koppelmann R. et al . (2013). Pelagic decapods in the northern Benguela upwelling system: Distribution, eco-physiology and contribution to active carbon flux. Deep Sea Res. Part I Oceanogr. Res. Pap.75, 146–156. doi: 10.1016/j.dsr.2013.02.003
90
Skjoldal H. R. Wiebe P. H. Postel L. Knutsen T. Kaartvedt S. Sameoto D. D. (2013). Intercomparison of zooplankton (net) sampling systems: Results from the ICES/GLOBEC sea-going workshop. Prog. Oceanogr.108, 1–42. doi: 10.1016/j.pocean.2012.10.006
91
Steinberg D. K. Carlson C. A. Bates N. R. Goldthwait S. A. Madin L. P. Michaels A. F. (2000). Zooplankton vertical migration and the active transport of dissolved organic and inorganic carbon in the Sargasso Sea. Deep Sea Res. Part I Oceanogr. Res. Pap.47, 137–158. doi: 10.1016/S0967-0637(99)00052-7
92
Steinberg D. K. Goldthwait S. A. Hansell D. A. (2002). Zooplankton vertical migration and the active transport of dissolved organic and inorganic nitrogen in the Sargasso Sea. Deep Sea Res. Part I Oceanogr. Res. Pap.49, 1445–1461. doi: 10.1016/S0967-0637(02)00037-7
93
Steinberg D. K. Landry M. R. (2017). Zooplankton and the ocean carbon cycle. Annu. Rev. Mar. Sci.9, 413–444. doi: 10.1146/annurev-marine-010814-015924
94
Stukel M. R. Ohman M. D. Benitez-Nelson C. R. Landry M. R . (2013). Contributions of mesozooplankton to vertical carbon export in a coastal upwelling system. Marine Ecology Progress Series491, 47–65.
95
Stukel M. R. Ohman M. D. Kelly T. B. Biard T. (2018). The roles of suspension-feeding and flux-feeding zooplankton as gatekeepers of particle flux into the mesopelagic ocean in the Northeast Pacific. Front. Mar. Sci.6. doi: 10.3389/fmars.2019.00397
96
Tian W. Zhang H. Zhao L. Zhang F. Huang H. (2017). Phytoplankton diversity effects on community biomass and stability along nutrient gradients in a eutrophic lake. Int. J. Environ. Res. Public Health14, 95. doi: 10.3390/ijerph14010095
97
UNESCO (1994). Protocols for the joint global ocean flux study (JGOFS) core measurements. Manuals Guides29.
98
Valcárcel-Pérez N. Yebra L. Herrera I. Mercado Carmona J. M. Gómez-Jakobsen F. Salles S. (2019). Usefulness of semi-automatic image analysis for the assessment of zooplankton community structure in a highly dynamic area of the Alboran Sea (SW Mediterranean).
99
Vandromme P. Stemmann L. Garcìa-Comas C. Berline L. Sun X. Gorsky G. (2012). Assessing biases in computing size spectra of automatically classified zooplankton from imaging systems: A case study with the ZooScan integrated system. Methods Oceanogr.1–2, 3–21. doi: 10.1016/j.mio.2012.06.001
100
Vereshchaka A. Abyzova G. Lunina A. Musaeva E. Sutton T. (2016). A novel approach reveals high zooplankton standing stock deep in the sea. Biogeosciences13, 6261–6271. doi: 10.5194/bg-13-6261-2016
101
Villegas-Ríos D. Álvarez-Salgado X. A. Piedracoba S. Rosón G. Labarta U. Fernández-Reiriz M. J. (2011). Net ecosystem metabolism of a coastal embayment fertilised by upwelling and continental runoff. Cont. Shelf Res.31, 400–413. doi: 10.1016/j.csr.2010.07.010
102
Ward B. A. Follows M. J. (2016). Marine mixotrophy increases trophic transfer efficiency, mean organism size, and vertical carbon flux. Proc. Natl. Acad. Sci. U.S.A.113, 2958–2963. doi: 10.1073/pnas.1517118113
103
Wiebe P. H. Burt K. H. Boyd S. H. Morton A. W. (1976). A multiple opening/closing net and environmental sensing system for sampling zooplankton. J. Mar. Res.34, 313–326. Available online at: https://elischolar.library.yale.edu/journal_of_marine_research/1361
104
Yebra L. Almeida C. Hernández-León S. (2005). Vertical distribution of zooplankton and active flux across an anticyclonic eddy in the Canary Island waters. Deep Sea Res. Part I Oceanogr. Res. Pap.52, 69–83. doi: 10.1016/j.dsr.2004.08.010
105
Yebra L. Herrera I. Mercado J. M. Cortés D. Gómez-Jakobsen F. Alonso A. et al . (2018). Zooplankton production and carbon export flux in the western Alboran Sea gyre (SW Mediterranean). Prog. Oceanogr.167, 64–77. doi: 10.1016/j.pocean.2018.07.009
106
Yentsch C. S. Menzel D. W. (1963). A method for the determination of phytoplankton chlorophyll and phaeophytin by fluorescence. Deep Sea Res. Oceanogr. Abstr.10, 221–231. doi: 10.1016/0011-7471(63)90358-9
107
Zhang X. Dam H. G. (1997). Downward export of carbon by diel migrant mesozooplankton in the central equatorial Pacific. Deep Sea Res. Part II Top. Stud. Oceanogr.44, 2191–2202. doi: 10.1016/S0967-0645(97)00060-X
Summary
Keywords
mesopelagic migrant pump, carbon flux, Mediterranean Sea, Atlantic Ocean, deep-sea community
Citation
Couret M, Sarmiento-Lezcano AN, Landeira JM, Giering SLC, Major W, Olivar MP, Díaz-Pérez J, Castellón A and Hernández-León S (2025) Zooplankton and micronekton active flux around the Iberian Peninsula. Front. Mar. Sci. 12:1652483. doi: 10.3389/fmars.2025.1652483
Received
23 June 2025
Accepted
14 October 2025
Published
29 October 2025
Volume
12 - 2025
Edited by
Vinicius Tavares Kutter, Federal University of Pará, Brazil
Reviewed by
Lívia Dias Fernandes De Oliveira, Helmholtz Institute for Functional Marine Biodiversity (HIFMB), Germany; Alina Criane Pires, Federal University of Pará, Brazil
Updates
Copyright
© 2025 Couret, Sarmiento-Lezcano, Landeira, Giering, Major, Olivar, Díaz-Pérez, Castellón and Hernández-León.
This is an open-access article distributed under the terms of the Creative Commons Attribution License (CC BY). The use, distribution or reproduction in other forums is permitted, provided the original author(s) and the copyright owner(s) are credited and that the original publication in this journal is cited, in accordance with accepted academic practice. No use, distribution or reproduction is permitted which does not comply with these terms.
*Correspondence: María Couret, maria.couret@ulpgc.es; mariacouhuertas@gmail.com
Disclaimer
All claims expressed in this article are solely those of the authors and do not necessarily represent those of their affiliated organizations, or those of the publisher, the editors and the reviewers. Any product that may be evaluated in this article or claim that may be made by its manufacturer is not guaranteed or endorsed by the publisher.