 Daniel C. O. Thornton
- Department of Oceanography, Texas A&M University, College Station, TX, United States
Form I Ribulose-1,5-bisphosphate oxygenase/carboxylase (RuBisCO) is the most abundant enzyme on Earth, playing a key role in carbon fixation during oxygenic photosynthesis. Using published sequence data, I show that there are significant differences in the amount of elemental resources (C, N and S) and energy required to synthesize the different Types of Form I RuBisCO. The shorter amino acid lengths of cyanobacterial RuBisCO had lower resource requirements to build the holoenzyme compared with eukaryotes. Consequently, the rise to dominance of eukaryote phytoplankton during the Neoproterozoic (1000–541 Ma) led to a shift to more expensive eukaryote RuBisCO. There are also significant differences in the elemental composition of RuBisCO between eukaryotes in different supergroups. Estimates of resource allocation were used to estimate how much C, N and S is associated with RuBisCO in the modern ocean. The marine cyanobacterium Prochlorococcus is the most numerically abundant photosynthetic organism on Earth and accounts for 7.3 – 8.9% of net ocean primary productivity. There are 2.11- 2.69 x 10⁶ mol RuBisCO in Prochlorococcus, which amounts to 4 to 5% of the total RuBisCO pool in the ocean. The relatively low RuBisCO content compared with productivity indicates highly efficient photosynthesis in Prochlorococcus. The total marine RuBisCO reservoir is equivalent to 0.016 Pg C, 5.1 Tg N, and 0.4 Tg S. The estimated annual productivity of RuBisCO is equivalent to 0.725 - 0.890 Pg C yr-1, 228–283 Tg N yr-1, and 16.5 - 22.5 Tg S yr-1. In the context of the marine nitrogen cycle, the amount of nitrogen fluxing through the pool of RuBisCO each year is equivalent to, or even higher, than the rate of biological nitrogen fixation (223 ± 30 Tg N yr−1). Turnover of RuBisCO is rapid, occurring every 6.6 to 8.2 days. In conclusion, RuBisCO is not only significant as the primary carbon fixation enzyme in the ocean, but also as a pool of chemical elements, particularly nitrogen.
1 Introduction
The protein ribulose-1,5-bisphosphate oxygenase/carboxylase (RuBisCO; EC 4.1.1.39) is the most abundant enzyme on Earth and is an essential component of the biosphere and global carbon cycle (Bar-On and Milo, 2019). RuBisCO is found in all oxygenic photosynthetic organisms, where it catalyzes the light-independent step of carbon fixation during the Calvin-Benson-Bassham (CBB) cycle (Tabita, 1999; Raines, 2022). An estimated standing stock of 1 Pg RuBisCO (Bar-On and Milo, 2019) catalyzes the fixation of ~120 Pg C year-1 from atmospheric CO2 into organic matter on Earth (Field et al., 1998). RuBisCO is an old enzyme (> 3,500 Ma; Bouvier et al., 2024), which has evolved several forms that vary in structure and organization of the protein subunits that make the holoenzyme (Tabita, 1999; Bouvier et al., 2024). With the evolution of oxygenic photosynthesis (3,400 to 2,900 Ma; Fournier et al., 2021) and the subsequent Great Oxidation Event (GOE) ~ 2.4 billion years ago (Gumsley et al., 2017; Olejarz et al., 2021), Form I RuBisCO played a pivotal role in the oxygenation of the atmosphere and ocean. Oxygenation continued with the Neoproterozoic Oxidation Event between 850 and 540 Ma (Och and Shields-Zhou, 2012; Chen et al., 2022), though the dynamics of oxygen during the Proterozoic and early Phanerozoic are debated (Lenton et al., 2016; Tostevin and Mills, 2020; Stockey et al., 2024). The oxygenation of Earth’s atmosphere and ocean resulted in profound changes in biological evolution, and the coupled geochemistry of the planet (Lenton and Watson, 2011; Lenton et al., 2014). Oxygenation contributed to the conditions that led to the Cambrian explosion over a ~ 20 Ma year period from 541 Ma (He et al., 2019; Stockey et al., 2024), during which rapid evolution and radiation of animal taxa laid the foundations for the major groups of animals found on Earth today.
Form I RuBisCO is found in oxygenic photosynthetic organisms such as cyanobacteria, marine protists, and terrestrial plants. Form I RuBisCO has a quaternary structure composed of two protein subunits encoded in two genes. The large subunit (L) is ~ 55,000 Da and is encoded in the rbcL gene, while the small subunit (S) is ~ 15,000 Da and is encoded in the rbcS gene. These two subunits are organized in a hexadecameric (L8S8) holoenzyme (Figure 1), with a combined molecular mass of ~ 550,000 Da (Andersson, 1996).
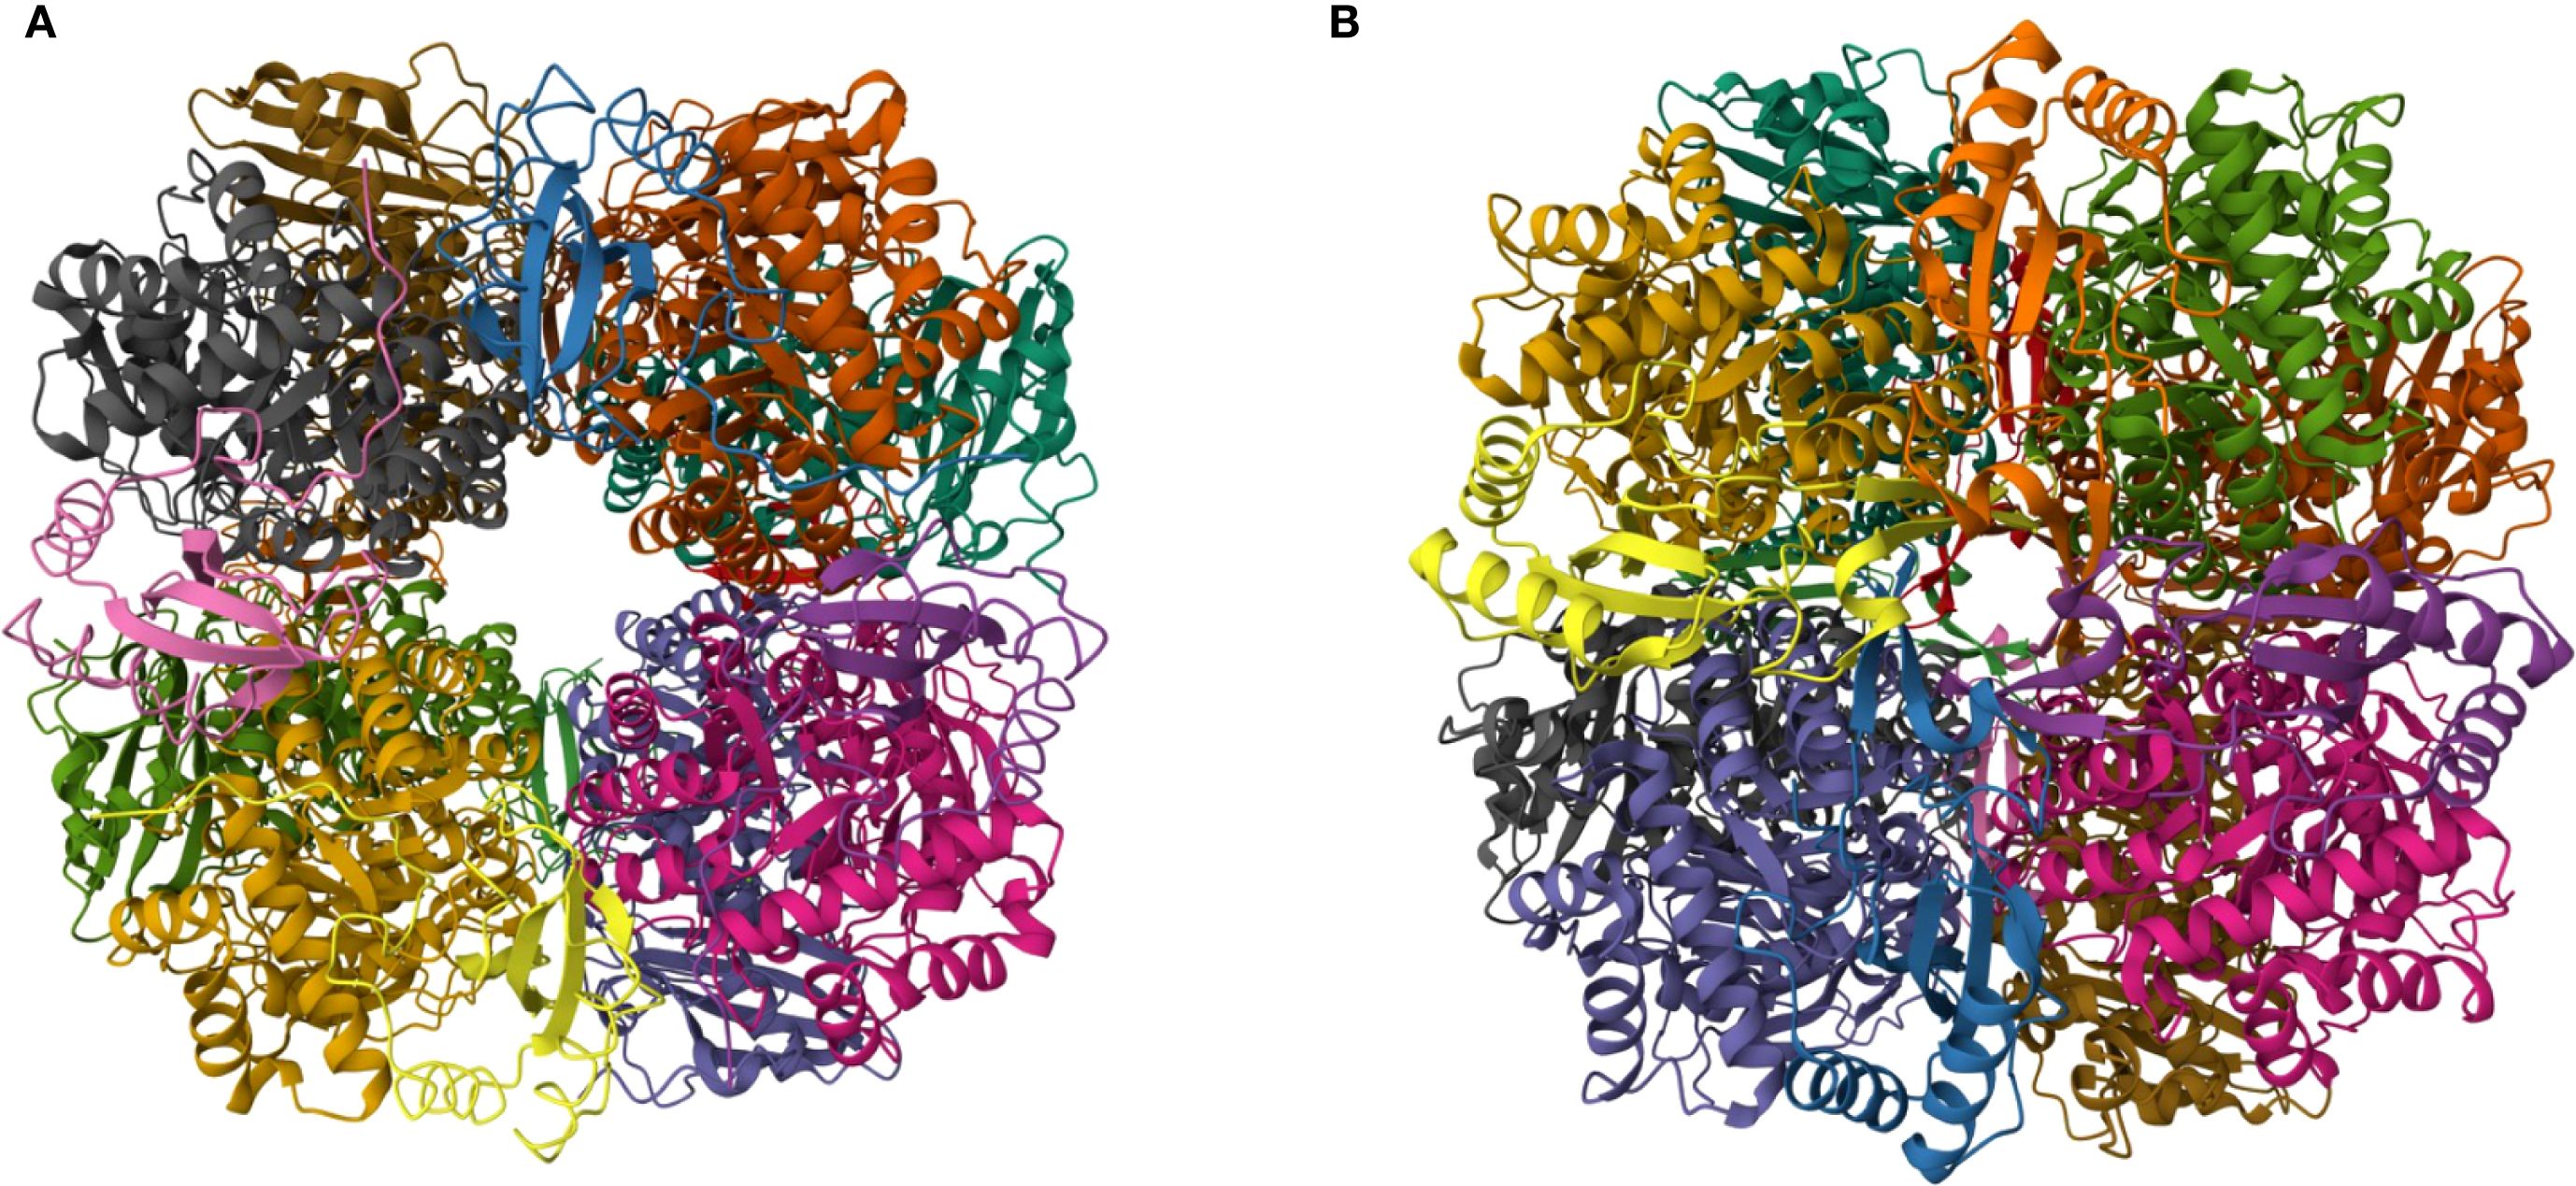
Figure 1. Structure of RuBisCO proteins. (A) RuBisCO from the cyanobacterium Synechococcus elongatus PCC 6301 (Newman et al., 1993) (https://doi.org/10.2210/pdb1RBL/pdb). (B) RuBisCO from the diatom Thalassiosira antarctica var. borealis (Valegård et al., 2018) (http://doi.org/10.2210/pdb5mz2/pdb). Each protein subunit in the L8S8 quaternary structure is represented by a different color. RuBisCO images from the Research Collaboratory for Structural Bioinformatics (RCSB) Protein Data Bank (PDB) (https://www.rcsb.org/; Berman et al., 2000). Images were produced under the Creative Commons CC0 1.0 Universal Public Domain Dedication.
Different taxa of photosynthetic organisms contain different types of Form I Rubisco (Badger and Bek, 2008; Tabita et al., 2008a). Type IAc is found in cyanobacteria in the clade containing the genera Prochlorococcus and Synechococcus (except S. elongatus). All other cyanobacteria (including S. elongatus) contain Type IBc RuBisCO. Type IB, or ‘green-type’ RuBisCO, is the most abundant form of RuBisCO as it is found in green plants and algae (Viridiplantae). Type ID RuBisCO, or ‘red-type’ RuBisCO, is found in red algae (Rhodophyta) and other abundant eukaryote clades [see Keeling and Burki, (2019) for a current taxonomic organization of eukaryotes], including the Stramenopila (containing diatoms and brown algae), Cryptista, and Haptista. Several supergroups of eukaryotes contain photosynthetic organisms (e.g. Alveolata, Archaeplastida, Cryptista, Discoba, Haptista, Stramenopila) due to the complex history of primary, secondary, and tertiary endosymbiotic processes in eukaryotes (Falkowski et al., 2004; Fehling et al., 2007). Terrestrial photosynthesizers are almost exclusively Viridiplantae in the Archaeplastida supergroup (containing Type IB RuBisCO). In contrast, the marine environment contains cyanobacteria (containing both types IAc and IBc RuBisCO), plus representatives of several eukarytote supergroups with RuBisCO originating from green-type lineages (Type IB) and red-type lineages (Type ID).
Form I RuBisCO contributes up to 65% of total soluble protein mass in leaves and 2 to 23% of the total protein in phytoplankton (Ellis, 1979; Losh et al., 2013). Therefore, differences in RuBisCO composition have potentially profound implications for resource allocation in photosynthetic organisms, in terms of both the chemical elements and energy required to build a RuBisCO protein. Proteins of longer length require more elemental resources (C, N, O, H, and S) to assemble than shorter sequences. There are also significant compositional differences between the 20 amino acids found in proteins. Carbon content per amino acid varies between 2 and 11 atoms per molecule, and nitrogen content varies between 1 and 4 atoms per molecule. Only two amino acids (cysteine and methionine) contain sulfur (Kessel and Ben-Tal, 2018; Alberts et al., 2022). Consequently, the abundance of individual amino acids in a protein determine the resource cost, and those costs may vary significant between different taxa for the same protein.
Understanding how organisms assign resources and respond to resource availability is fundamental to understanding life on Earth and global biogeochemical cycles. Despite its slow rate of evolution, there are structural differences between Form I RuBisCo from different major groups of oxygenic photosynthetic organisms. This reflects the hundreds of millions of years since the major groups diverged on the tree of life (Bouvier et al., 2024). Here, I show that there are significant differences in the elemental composition of RuBisCO between the different major lineages of oxygenic photosynthesizers found in the ocean, with significant implications for resource use. This was achieved using the conceptual framework of stoichiogenomics. Stoichiogenomics integrates ecology, evolution, and bioinformatics to explain the differential usage of chemical elements in nucleic acids and proteins (Elser et al., 2011).
2 Methods
2.1 Protein sequence selection and elemental composition
Protein sequences were downloaded from Uniprot Knowledgebase (UniprotKB), a freely available online database of protein sequences and functional information (Apweiler et al., 2004; Bateman et al., 2023). The amino acid sequences were generally derived from genetic sequencing studies. UniprotKB contains almost 250 million protein sequences, including approximately 181,056 sequences corresponding to the RuBisCO large subunit (rbcL gene) and 4,491 sequences corresponding to the small subunit (rbcS gene) (April 2025). The majority of RuBisCO protein sequences in UniprotKB are from land plants. UniprotKB is composed of two sets of data, UniprotKB/Swiss-Prot and UniprotKB/TrEMBL. Data in UniprotKB/TrEMBL are unreviewed protein sequences, with computationally generated annotation and functional characterization. UniprotKB/Swiss-Prot consists of a high quality, manually curated and annotated, non-redundant protein sequence database. Data from both the Swiss-Prot and TrEMBL components of UniprotKB were used in this study. Most sequences were from TrEMBL, as Swiss-Prot represents < 0.25% of sequences. The protein sequences analyzed were representative of precursor proteins, i.e. proteins before post-translational modification.
The sequences were downloaded in Microsoft Excel format (.xlsx) during July 2023. Separate files were downloaded for each taxonomic group of photosynthetic organisms and each of the two genes in Form I RuBisCO. As the focus of this work was the major groups of photosynthetic organisms extant in the ocean, the taxonomic focus was families of aquatic photosynthetic eukaryotes and the cyanobacteria (Table 1). For comparison, data for dicotyledon flowering plants (class Magnoliopsida) were also used (Table 1). Only the Swiss-Prot subset of UniprotKB data were used for the analysis of flowering plants to reduce biases caused by the large size of this dataset compared with the others. Secondly, only using Swiss-Prot reduced the bias and redundancy of multiple sequences from a relatively small group of crop plants and model species (e.g. Arabidopsis thaliana).
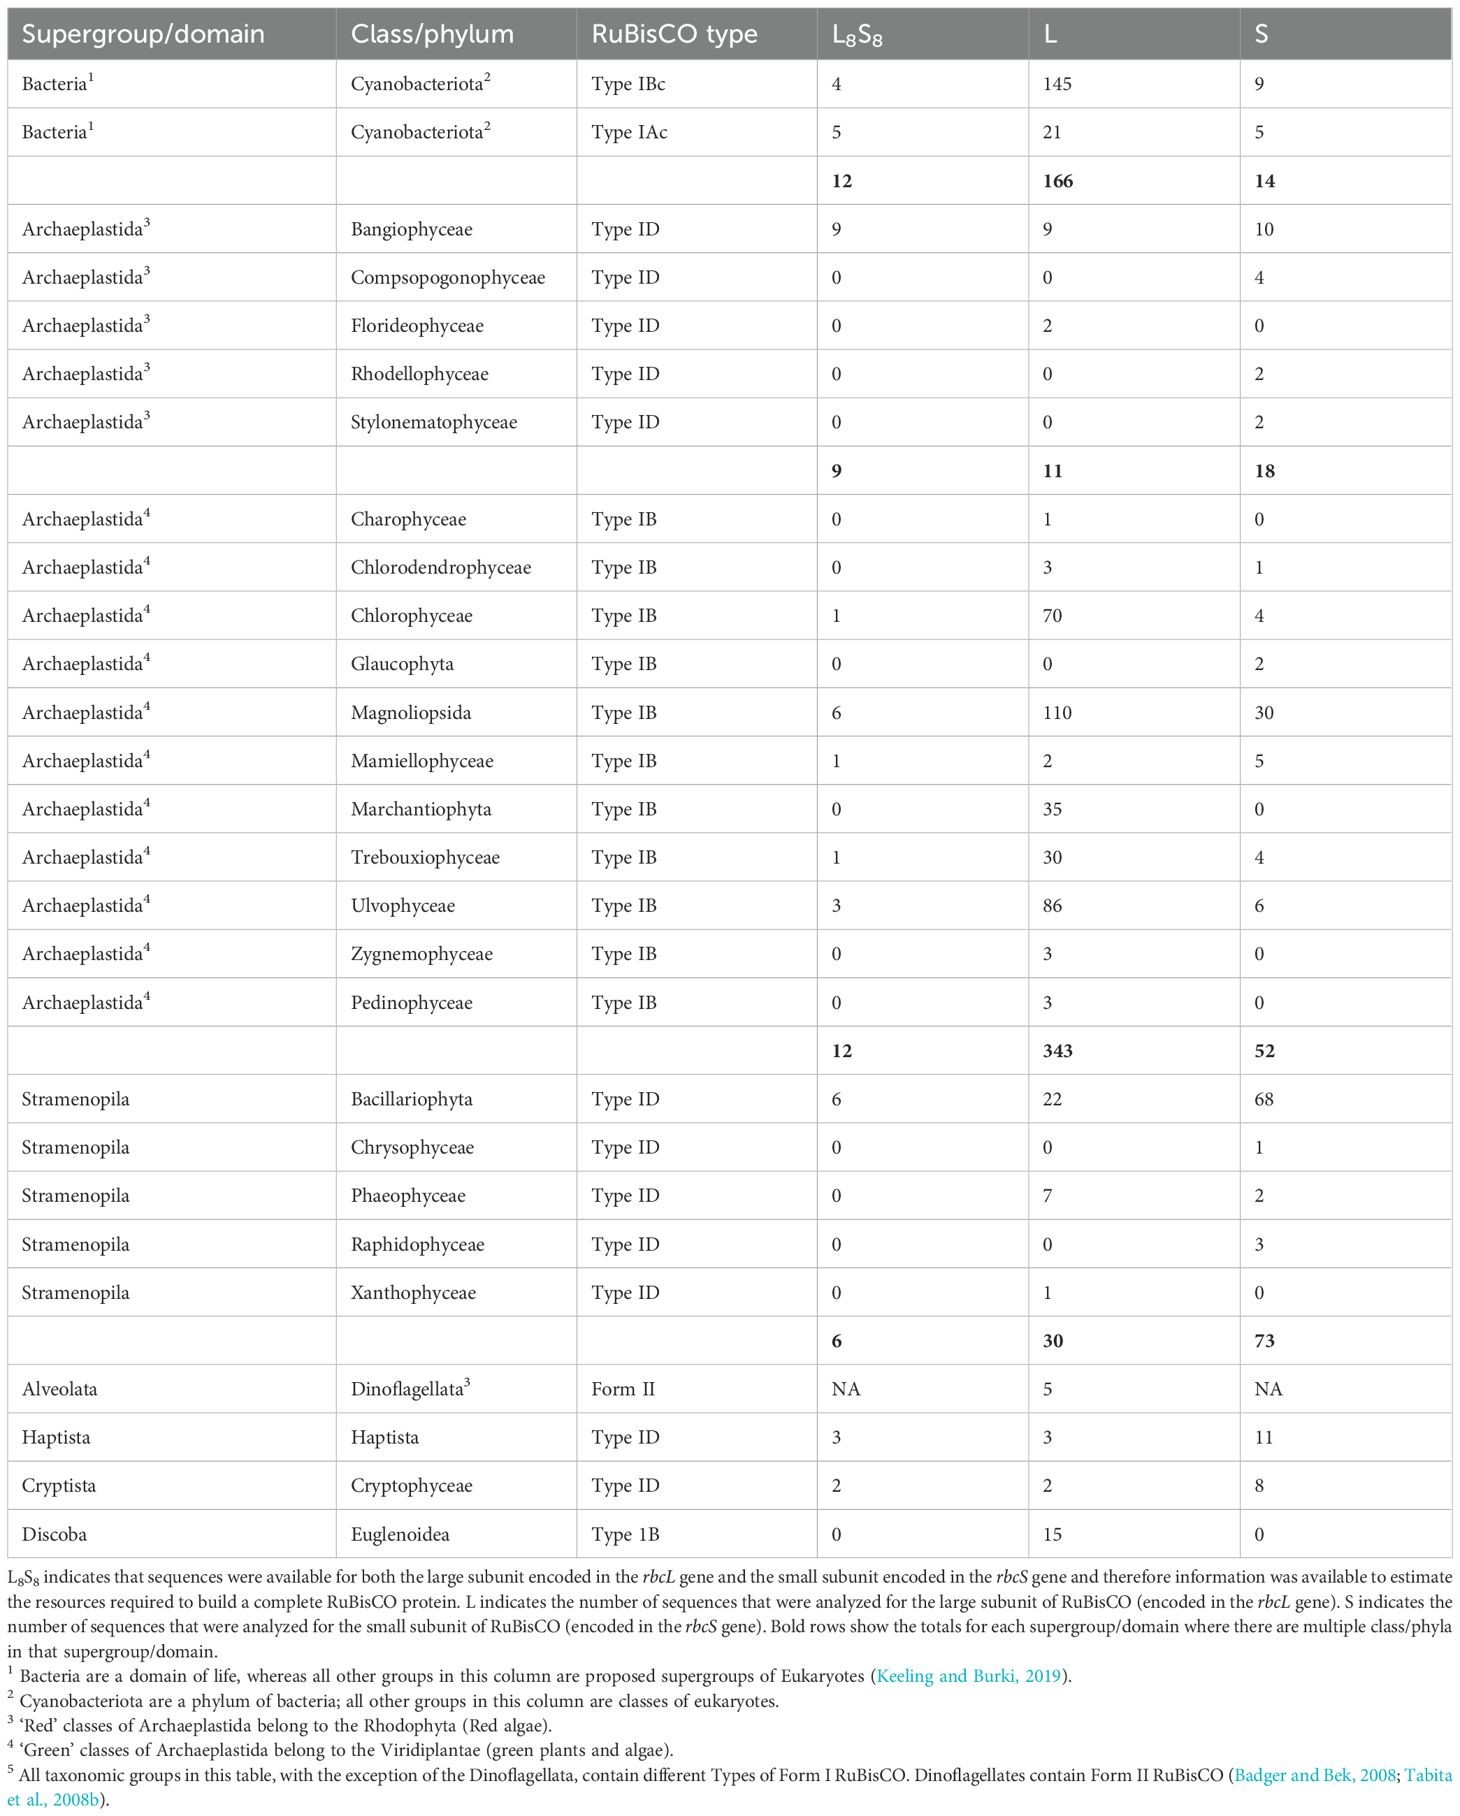
Table 1. Number of sequences analyzed for each taxonomic group.
The data were processed to eliminate incomplete sequences or sequences annotated as having potentially significant structural issues. Most of the amino acid sequences representing the large and small subunits were annotated as ‘fragments’ and therefore did not represent the full length of the protein. All fragments were discarded and not used in further analysis. A conservative approach was used to eliminate sequences within the remaining pool containing possible sequence errors. Sequences flagged with ‘sequence caution’, ‘sequence conflict’ or ‘caution’ labels were eliminated from the data, with each of these categories of warning indicating a range of different potential issues with the sequence. A very few sequences contained unknown or atypical amino acids within the sequence, indicated by the presence of ‘X’. These sequences were not analyzed as subsequent calculations assume that each amino acid in the sequence can be identified.
A significant number of the remaining sequences were likely to be incomplete or fragments, however they were not identified by the automated annotation within UniprotKB. In some cases, these sequences were less than half or more than double the length of reviewed sequences for that group of organisms, indicating that they were highly unlikely to represent a functional subunit. The elimination of short and long sequences were performed consistently, allowing for variation in sequence length (N) without biasing the data by adding erroneously short or long protein sequences. The ‘normal’ sequence length for each protein subunit for each taxonomic group was defined as the mode amino sequence length. In most cases, the mode sequence length corresponded to the length of reviewed reference sequences (Swiss-Prot) for that taxonomic group. Sequences outside of a range determined by the mode sequence length (Nmode) ± 2% were eliminated from the data. For example, the mode sequence length of the large subunit (encoded in the rbcL gene) in diatoms (Bacillariophyta) is 490 amino acids, therefore sequences ranging from 490 ± 10 amino acids (rounding to the nearest whole amino acid) were included in the analysis (Table 1). For diatoms, large subunit sequences outside of the range 480 to 500 amino acids were eliminated from further analysis. Finally, replicated sequences from the same operational taxonomic unit were removed. Replicates were defined as coming from the same species of eukaryote or the same strain of cyanobacterium. Strains of cyanobacteria, rather than species, were considered more appropriate as there is a significant genetic diversity within ‘species’ of cyanobacteria such as Prochlorococcus marinus (Biller et al., 2015). In the few cases where replicates were present in the data, the first sequence in the list was retained and the subsequent replicates were deleted.
The content of each element in a protein subunit was determined based on the total number of each specific amino acid in the sequence and the elemental content of each amino acid (Supplementary Table S1). This approach was used to calculate the number of C, N and S atoms in each protein subunit analyzed. The content of H and O in each protein subunit was determined using the same approach, with the addition of a correction accounting for the loss of a water molecule (H2O) through the formation of peptide bonds between two amino acids. The number of peptide bonds in a protein subunit is N-1, resulting in the loss of N-1 oxygen atoms and 2(N-1) hydrogen atoms.
2.2 Energy costs associated with protein subunit synthesis
A similar approach was used to estimate the amount of energy required to synthesize each protein subunit. These determinations are not absolute, but useful for comparing the relative amount of energy required to assemble RuBisCO in different organisms. The energetic cost of building a protein can be divided into the direct costs of assembling the protein and indirect energetic costs associated with supporting the process. Only direct costs were accounted for in this calculation, specifically the energetic cost of building each amino acid in the protein, plus the energetic cost of assembling those amino acids into proteins. The energy used to synthesize proteins can be quantified in terms of high-energy phosphate bonds (~P) and reducing power (H) (Akashi and Gojobori, 2002). These costs are associated with the requirement of adenosine triphosphate (ATP) and Guanosine-5’-triphosphate (GTP) and hydrogen atoms (from nicotinamide adenine dinucleotide (NADH), nicotinamide adenine dinucleotide phosphate (NADPH), and dihydroflavine adenine dinucleotide (FADH2) molecules). High energy phosphate bonds (~P) were used as the energy unit in these calculations, assuming 2 phosphate bonds are required per H (Akashi and Gojobori, 2002). The energetic costs of synthesizing each of the 20 amino acids found in proteins was from Akashi and Gojobori (2002) (Supplementary Table S1). These energetic costs were determined for the bacterium Escherichia coli, therefore it is assumed that these values are representative for the diverse range of bacteria and eukaryotes investigated in this work. This assumption was checked by comparison with Wagner (2005), who calculated the energetic cost of synthesizing amino acids in the yeast Saccharomyces cerevisiae (a eukaryote) and found similar values to Akashi and Gojobori (2002) (Supplementary Table S1). While the values were not identical, there was a significant positive correlation (r = 0.950; n = 19) between the energetic costs for the 20 amino acids determined in the two studies (Supplementary Figure S1).
The energetic cost of synthesizing the amino acids in each protein subunit were determined by multiplying the count of each amino acid in the sequence by the energetic cost of synthesizing that amino acid. These values were added together for each of the 20 amino acids to calculate a total energetic cost of synthesizing all the amino acids in the protein subunit. A cost of 4.5 to 5.9 ~P per amino acid is the estimated energetic cost for polymerizing amino acids into a primary protein structure (Amthor, 2000). The median value of this range (5.2 ~P per amino acid) was used to account for this energetic cost in this study, therefore the cost of assembling all the amino acids into the protein subunit was 5.2(N-1). The total energetic cost for synthesizing the primary structure of the protein subunit was calculated by adding together the energetic costs associated with synthesizing the all the amino acids in the protein sequence and the cost of assembling them into a protein.
The total cost of synthesizing the hexadecameric holoenzyme was calculated by simply adding up the costs of synthesizing the 8 large subunits and 8 small subunits to form the final L8S8 structure. Unaccounted energetic costs include those associated with the correct folding of the subunits, and transport to the site of assembly. The final assembly of L and S subunits into the L8S8 structure would incur energetic costs from binding and associated chaperone proteins and cofactors required to assemble the final molecule (Aigner et al., 2017; Yeates and Wheatley, 2017). These costs were not included in the estimate as they are difficult to determine and are a step removed from the basic research question. Therefore, the energetic costs calculated here represent the cost of producing the primary structures of the 16 protein subunits required to build a Form I RuBisCO molecule.
2.3 Data analysis
Data were plotted and analyzed using SigmaPlot 15.0 (Grafiti LLC.). Analysis of variance (ANOVA) was conducted on data that met the assumptions of normality and equality of variance. The Holm-Sidak method was used to make post-hoc pairwise comparisons. The Kruskall-Wallace one-way analysis of variance on ranks (H) was used on data did not meet these assumptions. Post-hoc pairwise comparisons were conducted using Dunn’s Method. Data were pooled to compare the properties of RuBisCO proteins between eukaryotes and bacteria. The non-parametric Mann-Whitney U test (U) was used to compare the median properties of RuBisCO proteins between eukaryotes and bacteria as these pooled data violated the assumption of normality and therefore a parametric t-test was not suitable.
The taxonomic groups that were included in the analysis, and which type of RuBisCO they contain, are listed in Table 1. Phytoplankton are usually categorized in terms of phylogenetic groups, but types of RuBisCO are not associated with single clades of organisms due to the endosymbiotic origins of different groups. Consequently, the data were summarized using a scheme that emphasizes both taxa and type of RuBisCO. Cyanobacteria were divided into two groups, associated with Type IAc and Type IBc RuBisCO. The eukaryotes were grouped by supergroup (according to Keeling and Burki, 2019). However, the Archaeplastida were split into two groups according to whether the included taxa were ‘red’ (Rhodophyta) or ‘green’ (Viridiplantae), containing Types ID and IB RuBisCO, respectively (Leebens-Mack et al., 2019).
3 Results
3.1 Resources to build the L8S8 holoenzyme of RuBisCO by taxonomic group
Despite the large number of RuBisCO sequences in UniprotKB, data filtering resulted in a total of only 41 complete holoenzyme sequences (Table 2). RuBisCO molecules in cyanobacteria (both Types 1Ac and 1Bc) contained > 390 less amino acids than the eukaryotes. There was a positive correlation between the number of carbon and nitrogen atoms in the L8S8 holoenzyme of RuBisCO (Figure 2A), with different groups of organisms clustering based on the type of RuBisCO. Cyanobacteria (Types 1Ac and 1Bc) contained significantly (p < 0.05) less C and N than the Viridiplantae (Type 1B) (Supplementary Figure S2). The sulfur content of RuBisCO from cyanobacteria containing Type IAc RuBisCO (Prochlorococcus and marine Synechococcus) was significantly (p < 0.05) lower than that of the Stramenopila (Type ID), Haptista (Type ID), and Viridiplantae (Type IB) (Supplementary Figure S2). There was no significant difference between the sulfur content of Type IAc cyanobacteria and the Rhodophyta (Type ID) (Figure 2B, Supplementary Figure S2).
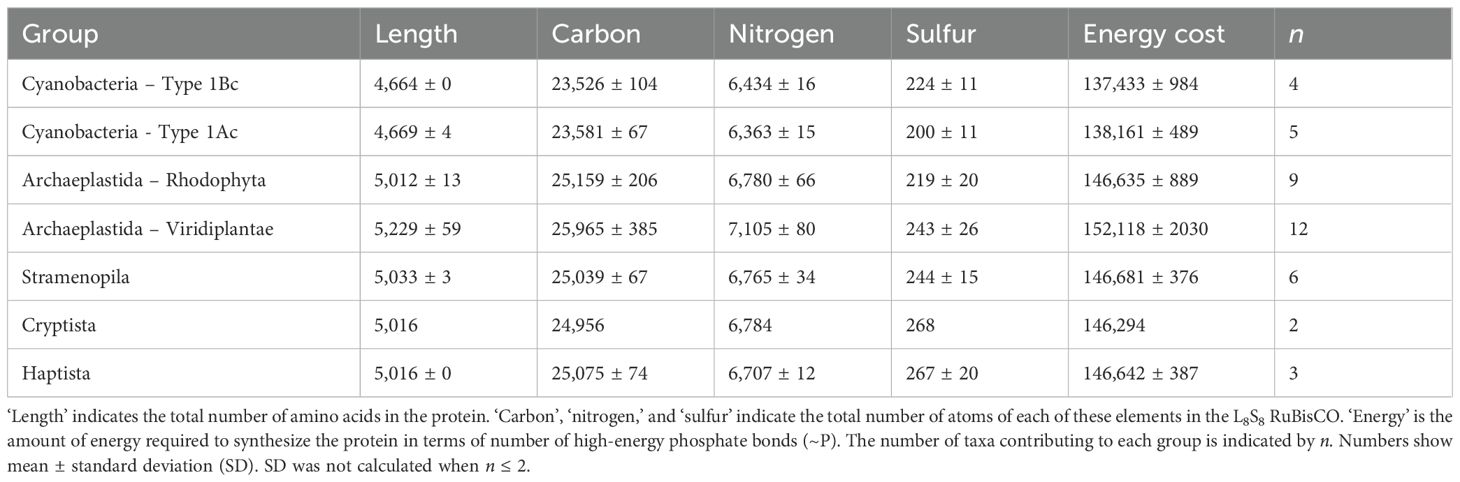
Table 2. Mean composition of L8S8 RuBisCO holoenzymes from different groups of photosynthetic organisms.
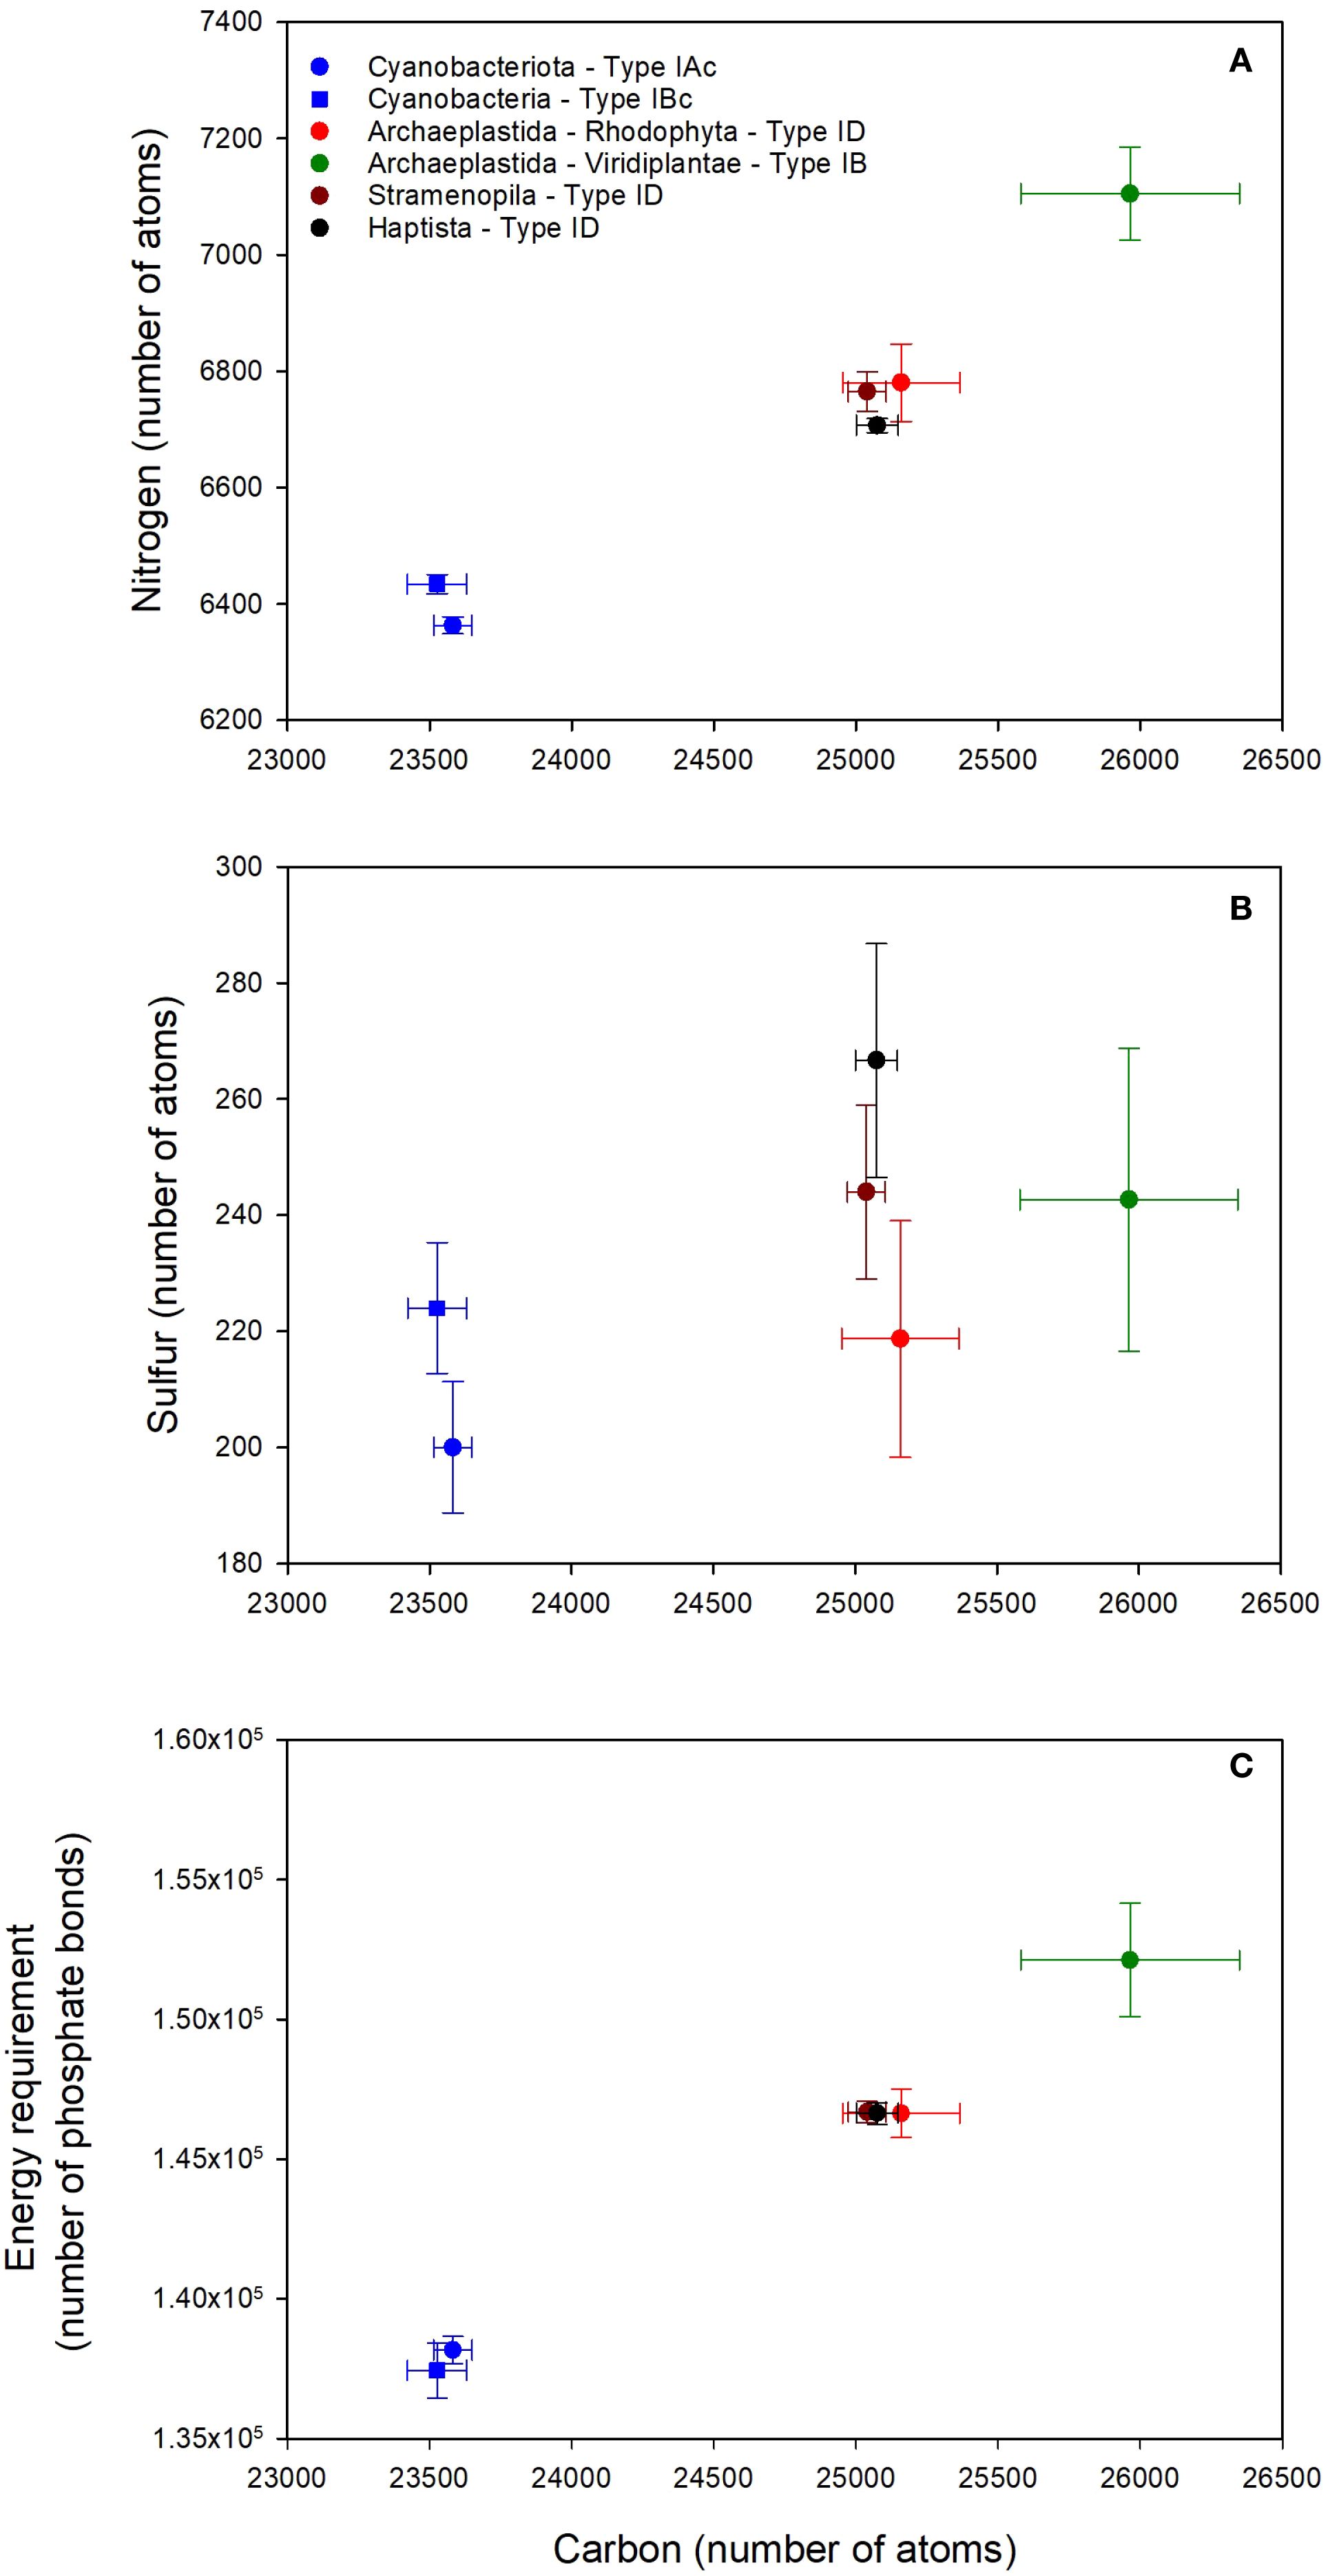
Figure 2. Elemental composition of the L8S8 holoenzyme of form I RuBisCO for different taxonomic groups of phytoplankton. (A) Number of carbon and nitrogen atoms. (B) Number of carbon and sulfur atoms. (C) Number of carbon atoms and the energy required to synthesize the holoenzyme quantified in phosphate bonds. Data points show the mean ± SD, where n is variable and is listed in Table 2.
Energy requirements to synthesize RuBisCO were aligned with taxonomic group and RuBisCO type (Figure 2C). It required significantly less energy to synthesize cyanobacterial RuBisCO than eukaryote RuBisCO. There was no significant difference in the amount of energy required to synthesize the two types of cyanobacterial RuBisCO (Types 1Ac and Type 1Bc) (Supplementary Figure S2). Groups containing Type 1D RuBisCO clustered together (Figure 2C), indicating that there was no significant difference between them in the amount of energy required to synthesize RuBisCO (Supplementary Figure S2). Type 1B RuBisCO, found in plants and green algae, required the most energy for RuBisCO synthesis (Supplementary Figure S2).
3.2 Resources to build the large subunit (L) protein of RuBisCO
Data from the large and small subunits of RuBisCO were analyzed separately, which increased the number of available sequences for analysis (Table 1). Analysis of the large subunits added two supergroups that were absent from the analysis of the holoenzyme; the Alveolata and the Discoba. All the Alveolata sequences were from dinoflagellates (Dinoflagellata) and the Discoba were Euglenoidea (Table 3). Compared with all other taxa, Dinoflagellates had the longest large subunit sequences (561 ± 108; mean ± SD) (Table 3). However, there was a high degree of uncertainty in this estimate as the shortest sequence was 471 amino acids and the longest was 740 in length. The number of Alveolata sequences analyzed was small (n = 5) and there was no mode sequence length. Therefore, despite the variation in sequence length, none of the sequences could be excluded from the data based on the criteria described in the methods. There was a significant difference in the amino acid length of the large subunits between different taxa (H = 191.2, 6 degrees of freedom, p < 0.001) (Supplementary Figure S3), with the shortest sequences (471 ± 0 amino acids) occurring in the cyanobacteria with Type 1Ac RuBisCO and the longest sequences (with the exception of the dinoflagellates) occurring in the Stramenopila (490 ± 2 amino acids). Amino acid sequences were longer in the ‘red type’ lineages containing Type ID RuBisCO than the ‘green type’ lineages containing Type IA RuBisCO. There were notable differences in the numbers of specific amino acids between the different groups (Figure 3). For example, the median number of threonine in cyanobacteria containing Type IAc RuBisCO was 27, compared to 32 in cyanobacteria containing Type IBc RuBisCO. There was also variation in the number of sulfur-containing amino acids (cysteine and methionine) across the different groups. Red type Archaeplastida, containing Type 1D RuBisCO, had the minimum median number of cysteine (4) compared with the Discoba (Type IB RuBisCO), which had the maximum median number of cysteine (33). Median methionine varied from 9 in cyanobacteria containing Type IAc RuBisCO, to 18 in the red type Archaeplastida.
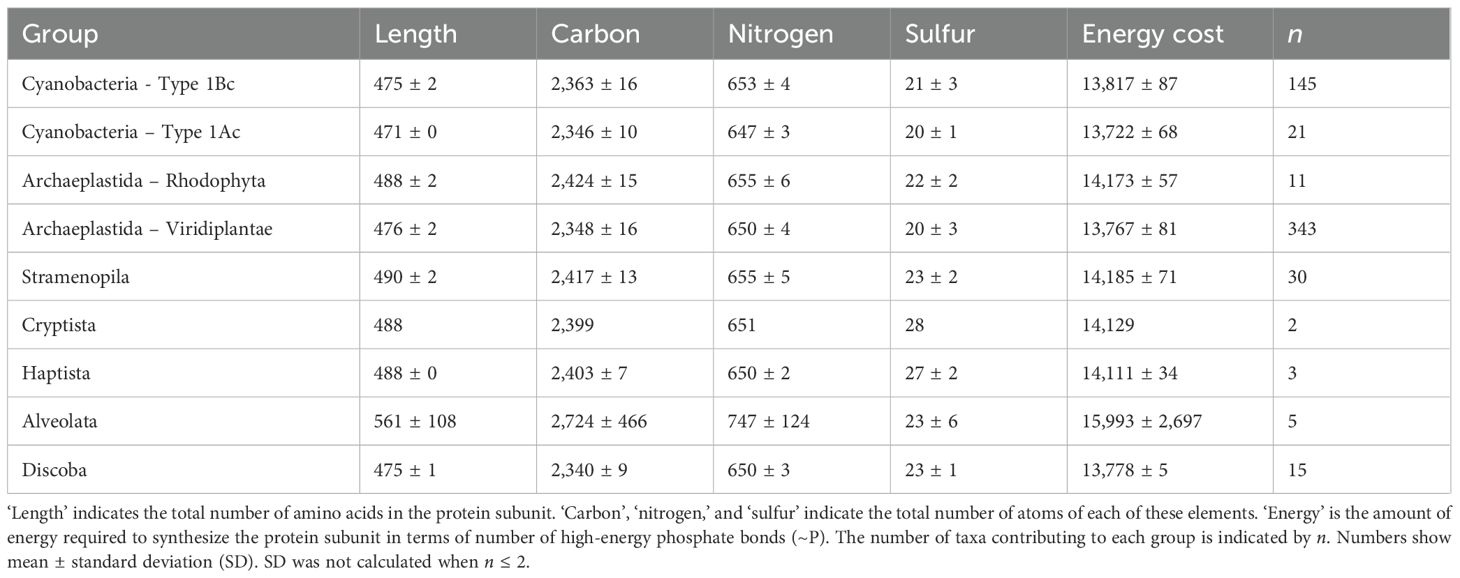
Table 3. Mean composition of a single large subunit (L) in RuBisCO proteins from different groups of photosynthetic organisms.
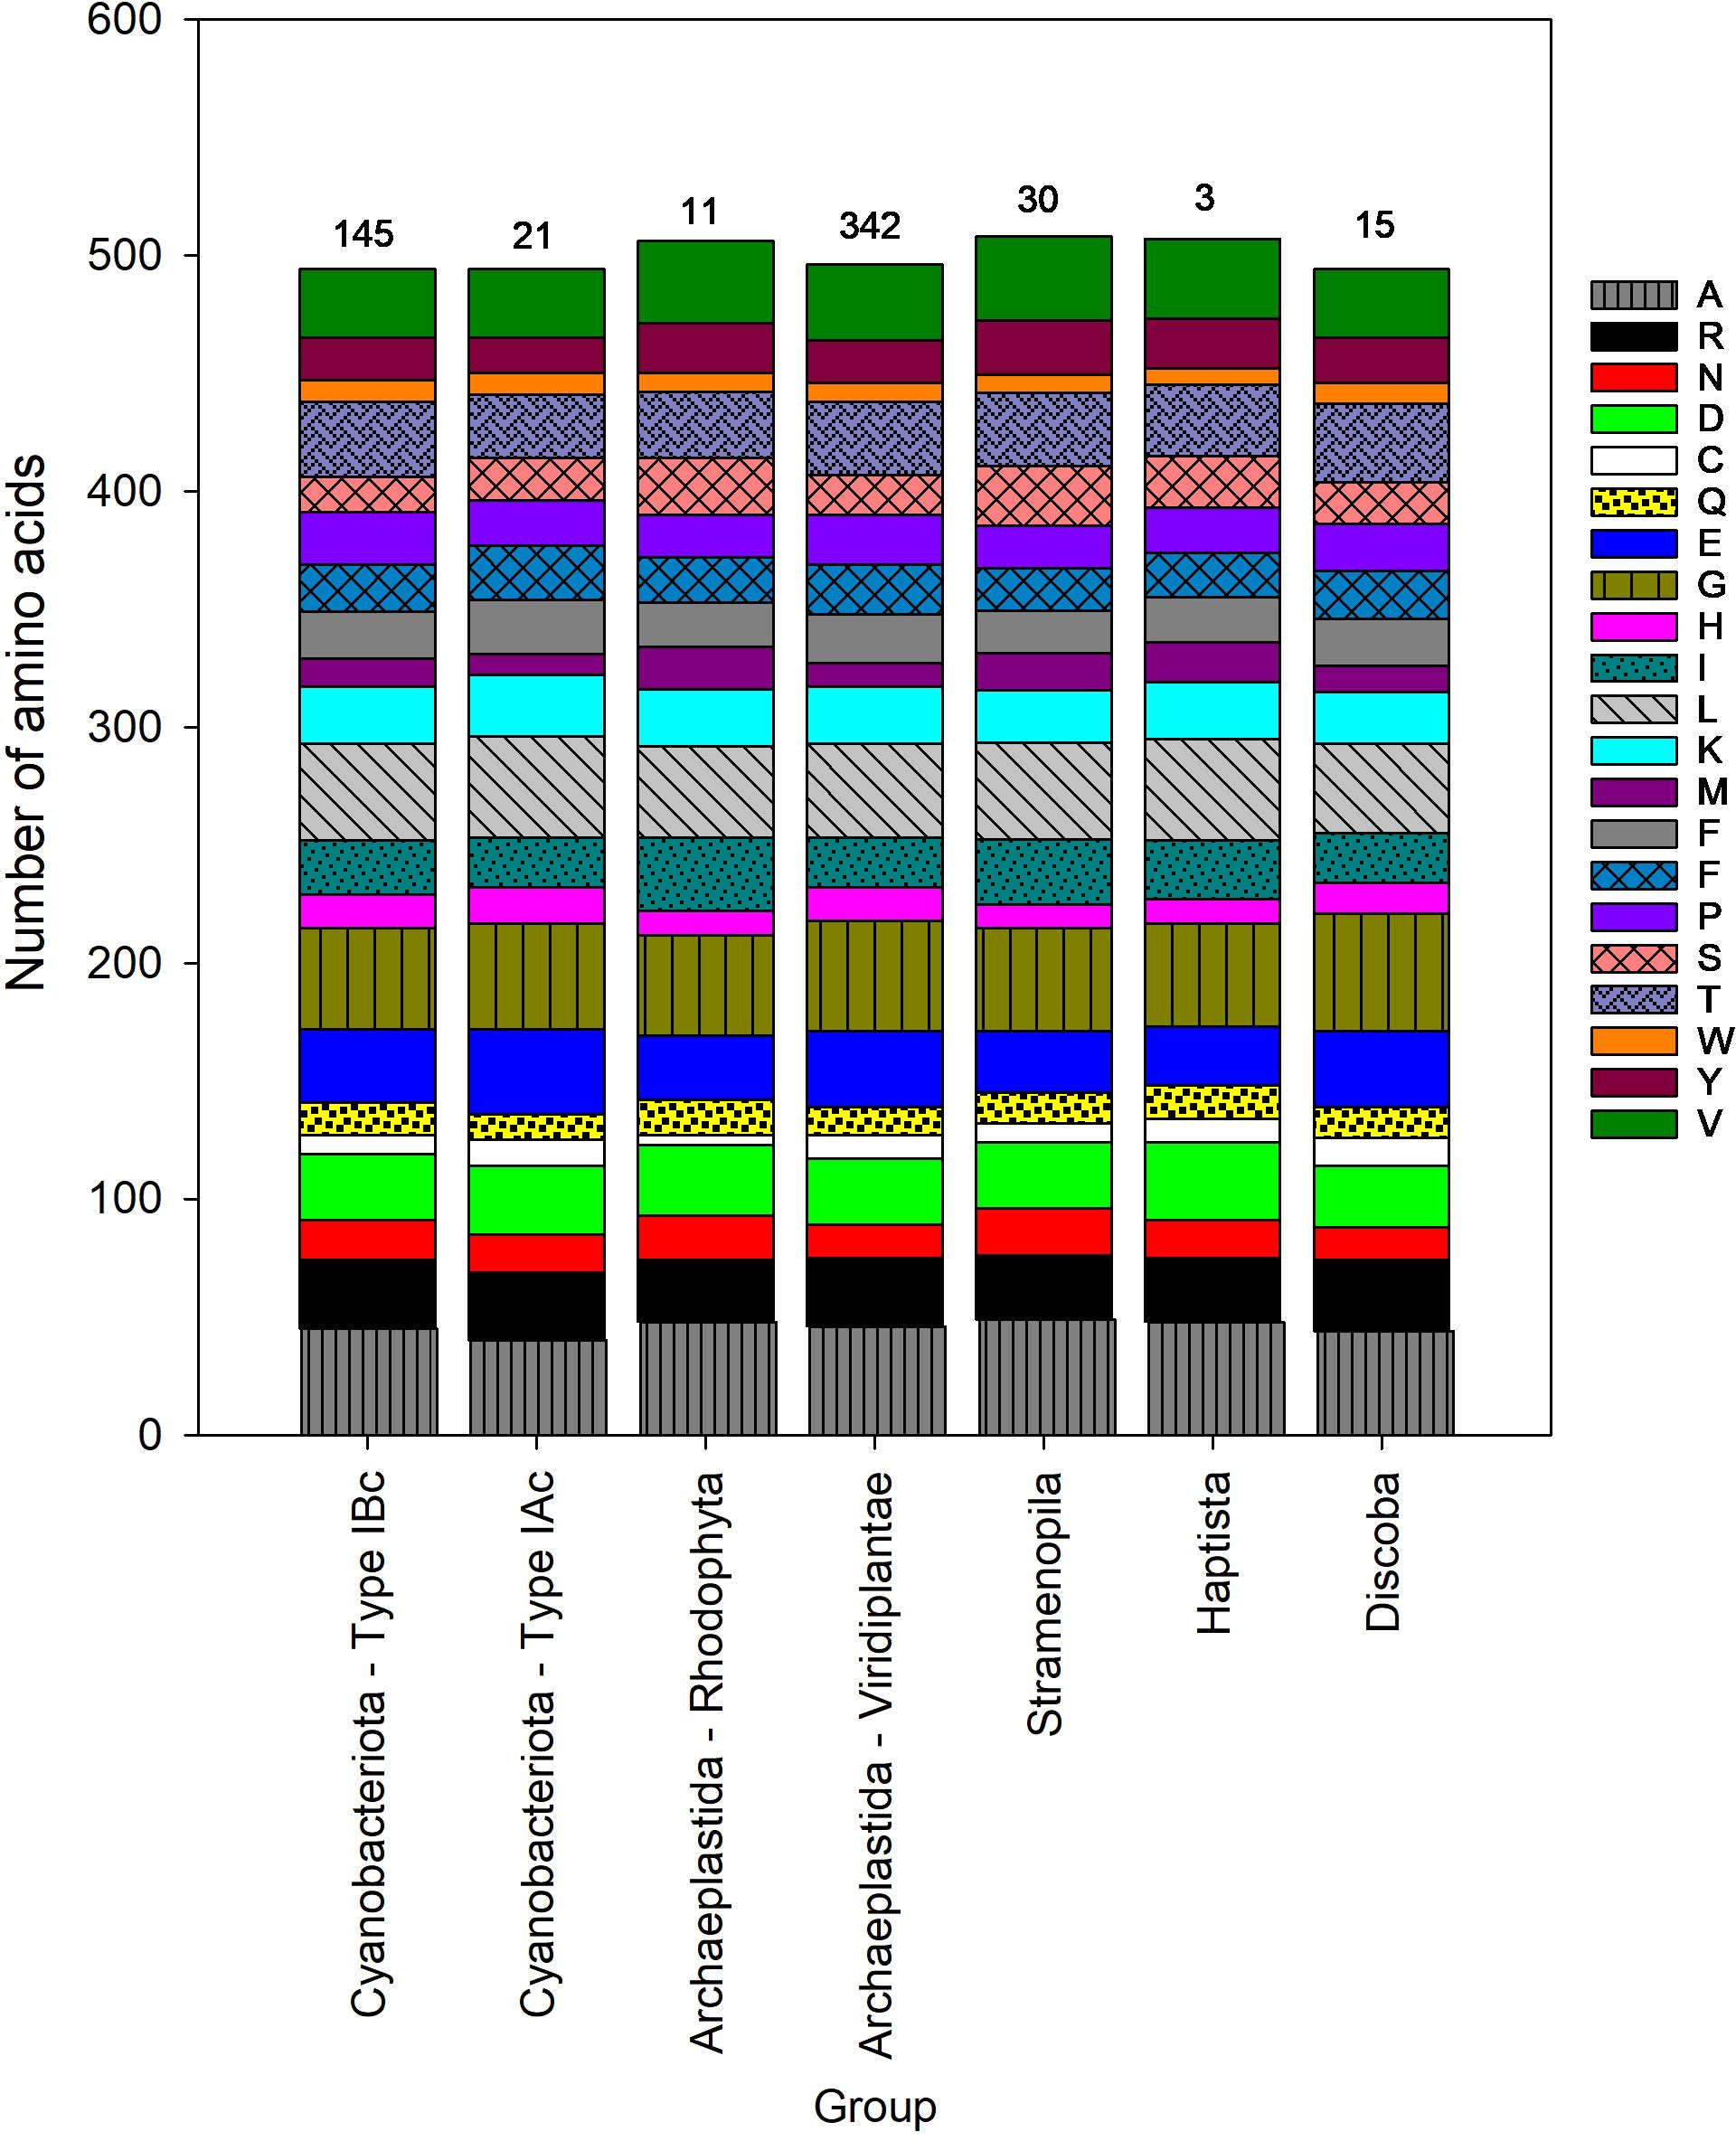
Figure 3. Median amino acid composition of the large subunit (L) of form I RuBisCO for different groups of phytoplankton. The number above each stacked bar is the number of taxa in each phytoplankton group. Each amino acid is listed using the standard 1 letter code, see Supplementary Table S1 for the corresponding amino acid name.
Pooling data from all the eukaryote groups, the mean length of the large subunit protein was 477 ± 5 (mean ± SD) (n = 403; excluding dinoflagellates). This was a small, but significant, difference from the length of the large subunit in cyanobacteria (474 ± 2; n = 166) (U = 29295, p = 0.05). The mean elemental resources required to build the large subunit in eukaryotes (excluding dinoflagellates) was 2356 ± 27 carbon, 651 ± 5 nitrogen, and 20 ± 3 sulfur atoms; which is similar to the 2361 ± 16 carbon, 652 ± 4 nitrogen, and 20 ± 3 sulfur atoms required to build the large subunit in cyanobacteria. Despite the similarity in carbon and nitrogen content of eukaryotes and cyanobacteria, there were significant differences in the median carbon (U = 23808, p < 0.001) and nitrogen content (U = 26659, p < 0.001) of these groups.
The comparative number of carbon, nitrogen, sulfur, and energy required to synthesize the large subunit varied across different taxa of photosynthetic organism (Figure 4). These data are presented at a higher taxonomic resolution than the previous data, with each data point representing a single class or division of organisms (see Table 1 for a list of classes analyzed). The classes and divisions grouped according to RuBisCO type; groups containing Type ID RuBisCO (e.g. diatoms (Bacillariophyta), golden algae (Haptista) and red algae (Bangiophyceae) required more carbon per large subunit than organisms containing both Type IB RuBisCO (e.g. green algae, land plants and cyanobacteria) and Type IA RuBisCO (Cyanobacteria) (Figure 4A, Supplementary Figure S3). Land plants (Magnoliopsida and Marchantiophyta) contained less sulfur per large subunit compared with marine groups of Eukaryotes (Bacillariophyta, Phaeophyceae and Haptista). Just as in the complete L8S8 RuBisCO molecule, the energy requirement to build the large subunit was proportional to its carbon content (Figure 4C, Supplementary Figure S3). There were significant differences in the elemental composition and amount of energy required to synthesize the large subunit of RuBisCO between different taxa (Supplementary Figure S3).
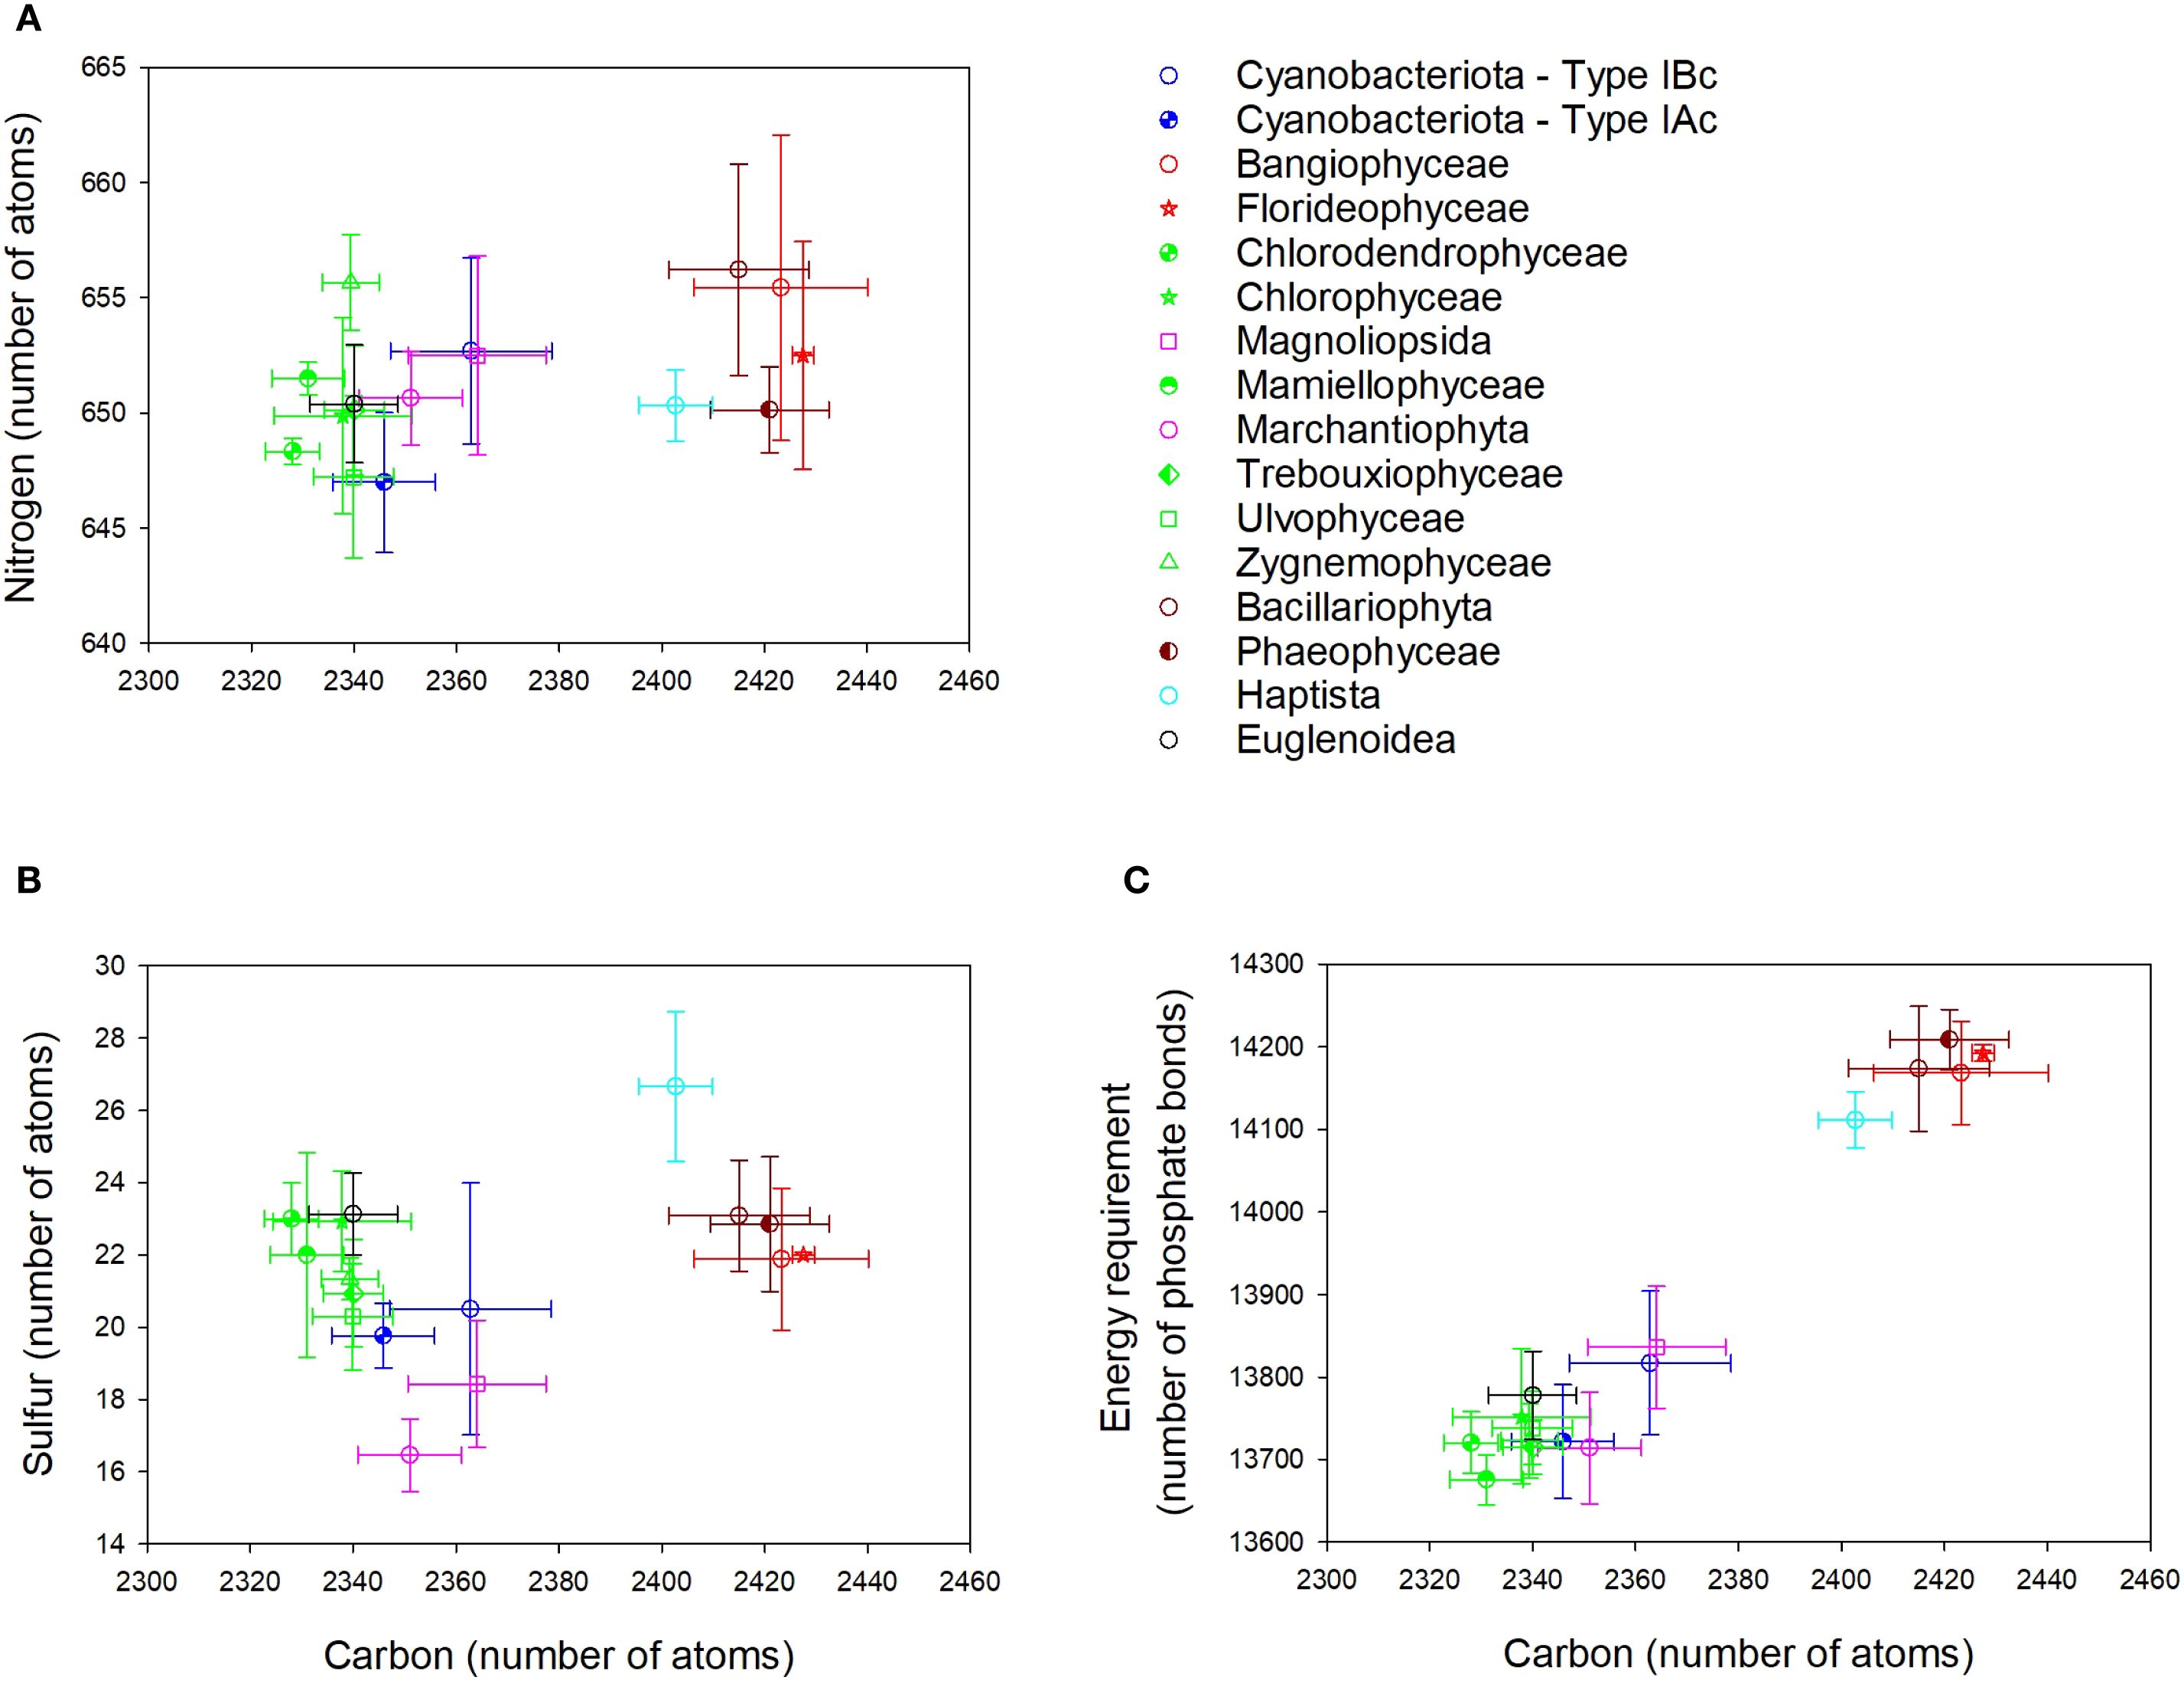
Figure 4. Elemental composition of the large subunit (L) of Form I RuBisCO for different taxonomic groups of phytoplankton. (A) Number of carbon and nitrogen atoms. (B) Number of carbon and sulfur atoms. (C) Number of carbon atoms and the energy required to synthesize the holoenzyme quantified in phosphate bonds. Data points show the mean ± SD, where n is variable and is listed in Table 3.
3.3 Resources to build the small subunit (S) protein of RuBisCO
There was a significant difference in amino acid length of the small subunit between different taxa (H = 138.9, p < 0.001) (Figure 5, Supplementary Figure S4). Land plants and green algae (Viridiplantae) had the longest sequences, with a mean length of 177 amino acids. The mean length of the small subunit in other common groups of eukaryotes (Stramenopila, Cryptista and Hatpista) was 139 amino acids (Table 4). The mean (± SD) length of the small subunit in cyanobacteria was 112 ± 1 (n = 14) amino acids, compared with 153 ± 27 (n = 165) in eukaryotes. The Stylonematophyceae (a class of red algae) were excluded from subsequent analysis due to their extremely long sequences for the small subunit (mean = 313 amino acids) and low representation in the data (n =2). Based on the length of the small subunit in other classes of red algae, it is probable that these long sequences are a result of a sequencing error. As observed with the large subunit, there was variation in the number of specific amino acids between different groups (Figure 5). For example, the median number of alanines in Cyanobacteria containing Type IBc RuBisCO was 4 (3.6% of amino acids), compared with 18 (9.0% of amino acids) in the Viridiplantae (Type IB).
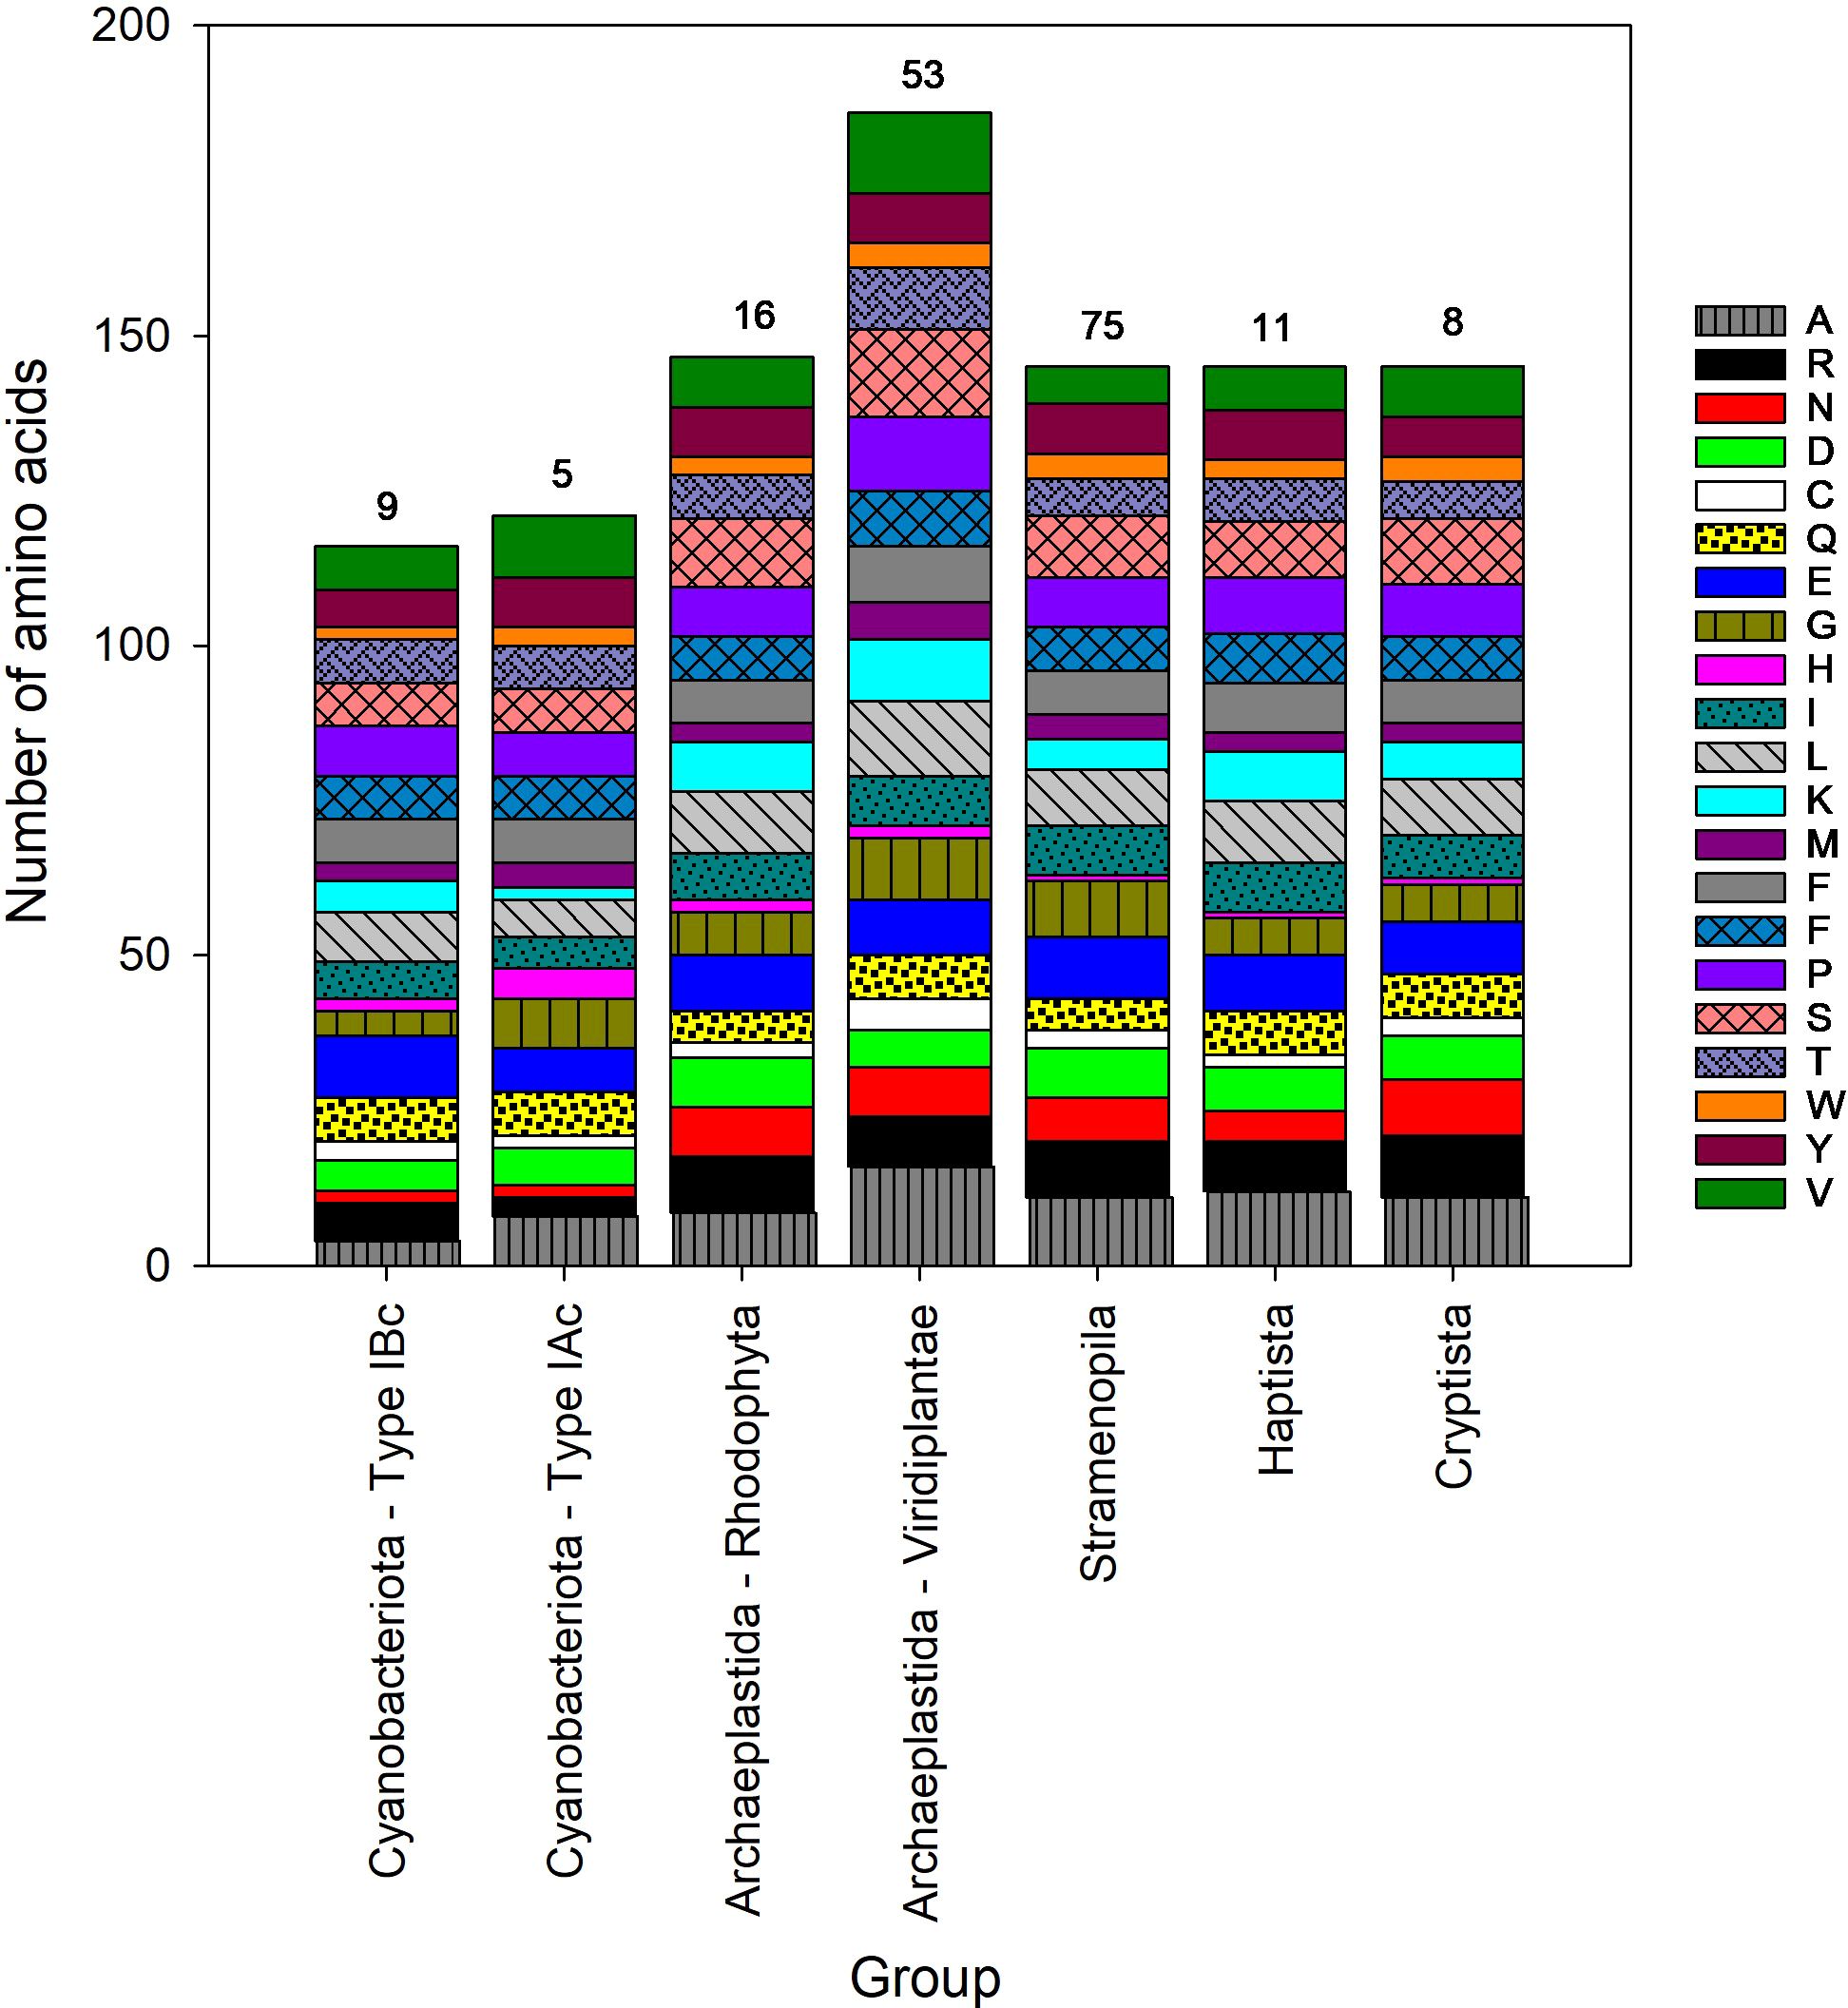
Figure 5. Median amino acid composition of the small subunit (S) of form I RuBisCO for different groups of phytoplankton. The number above each stacked bar is the number of taxa in each phytoplankton group. Each amino acid is listed using the 1 standard letter code, see Supplementary Table S1 for the corresponding amino acid name.
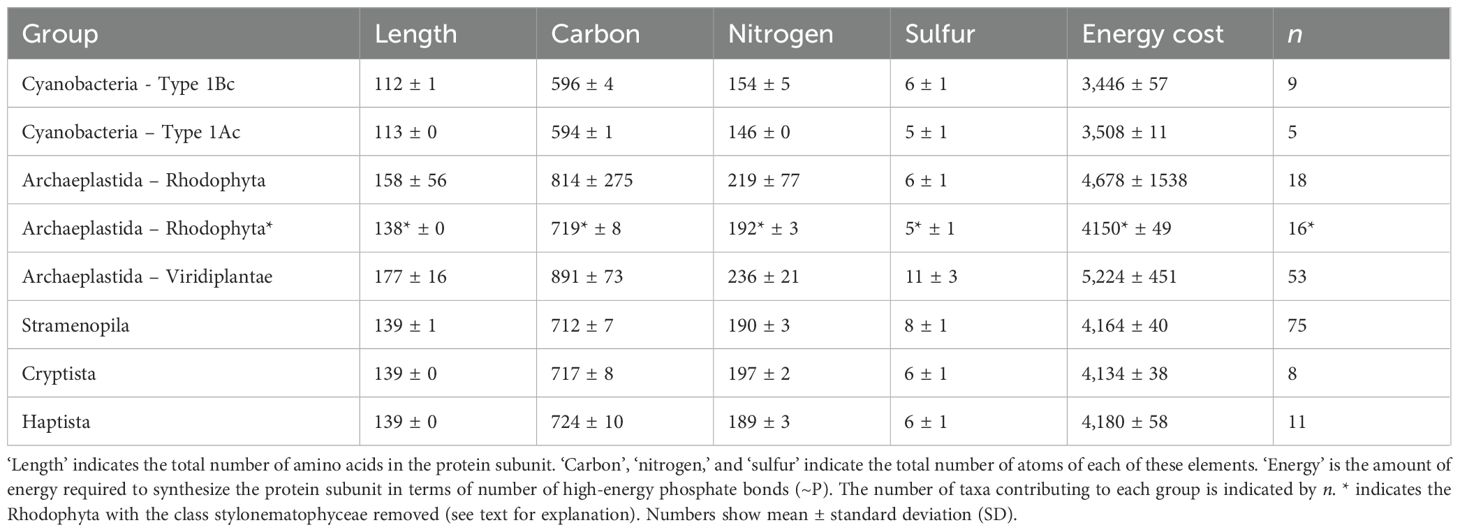
Table 4. Mean composition of a single small subunit (S) in RuBisCO proteins from different groups of photosynthetic organisms.
Significant variation in the length of the small subunit protein resulted in significant variation in the amount of elemental resources (C, N and S) and energy required to synthesize it across different taxonomic groups (Figure 6). There are 3 distinct clusters of taxonomic groups in Figure 6, corresponding to the Cyanobacteria (Types IAc and IBc RubisCO), eukaryotes containing Type 1D RuBisCO (Stramenopila, Haptista, Cryptista and red-type Archaeplastida (Rhodophyta)), and eukaryotes containing Type IB RuBisCO (green-type Archaeplastida (Viridiplantae)). As expected by their relatively long amino acids sequences, significantly more elemental resources in terms of carbon, nitrogen (Figure 6A), sulfur (Figure 6B), and energy (Figure 6C) were needed to build a small subunit RuBisCO in the Viridiplantae compared with the other taxa (Supplementary Figure S4). The small subunit protein of the Viridiplantae contained approximately twice as much sulfur (11 ± 3 atoms; mean ± standard deviation) as all other groups, except for the Stramenopila (8 ± 1 atoms) (Table 4, Supplementary Figure S4). The mean (± SD) elemental resources needed to build the small subunit in eukaryotes were 782 ± 127 carbon, 208 ± 35 nitrogen, and 8 ± 3 sulfur atoms. This is significantly more resources than those needed to build the small subunit in cyanobacteria; 596 ± 3 carbon (U = 28.000, p < 0.001), 151 ± 5 nitrogen (U = 28.000, p < 0.001), and 6 ± 1 sulfur atoms (U = 416.000, p < 0.001). The variation in elemental resources required to build the small subunit in eukaryotes was much greater than observed in the cyanobacteria. This was due to the significant variation in size of the small unit between different groups of eukaryotes (Table 4, Figure 5). However, the relatively small size of the sample from cyanobacteria (n = 14) compared with the eukaryotes (n = 165) may have played a role.
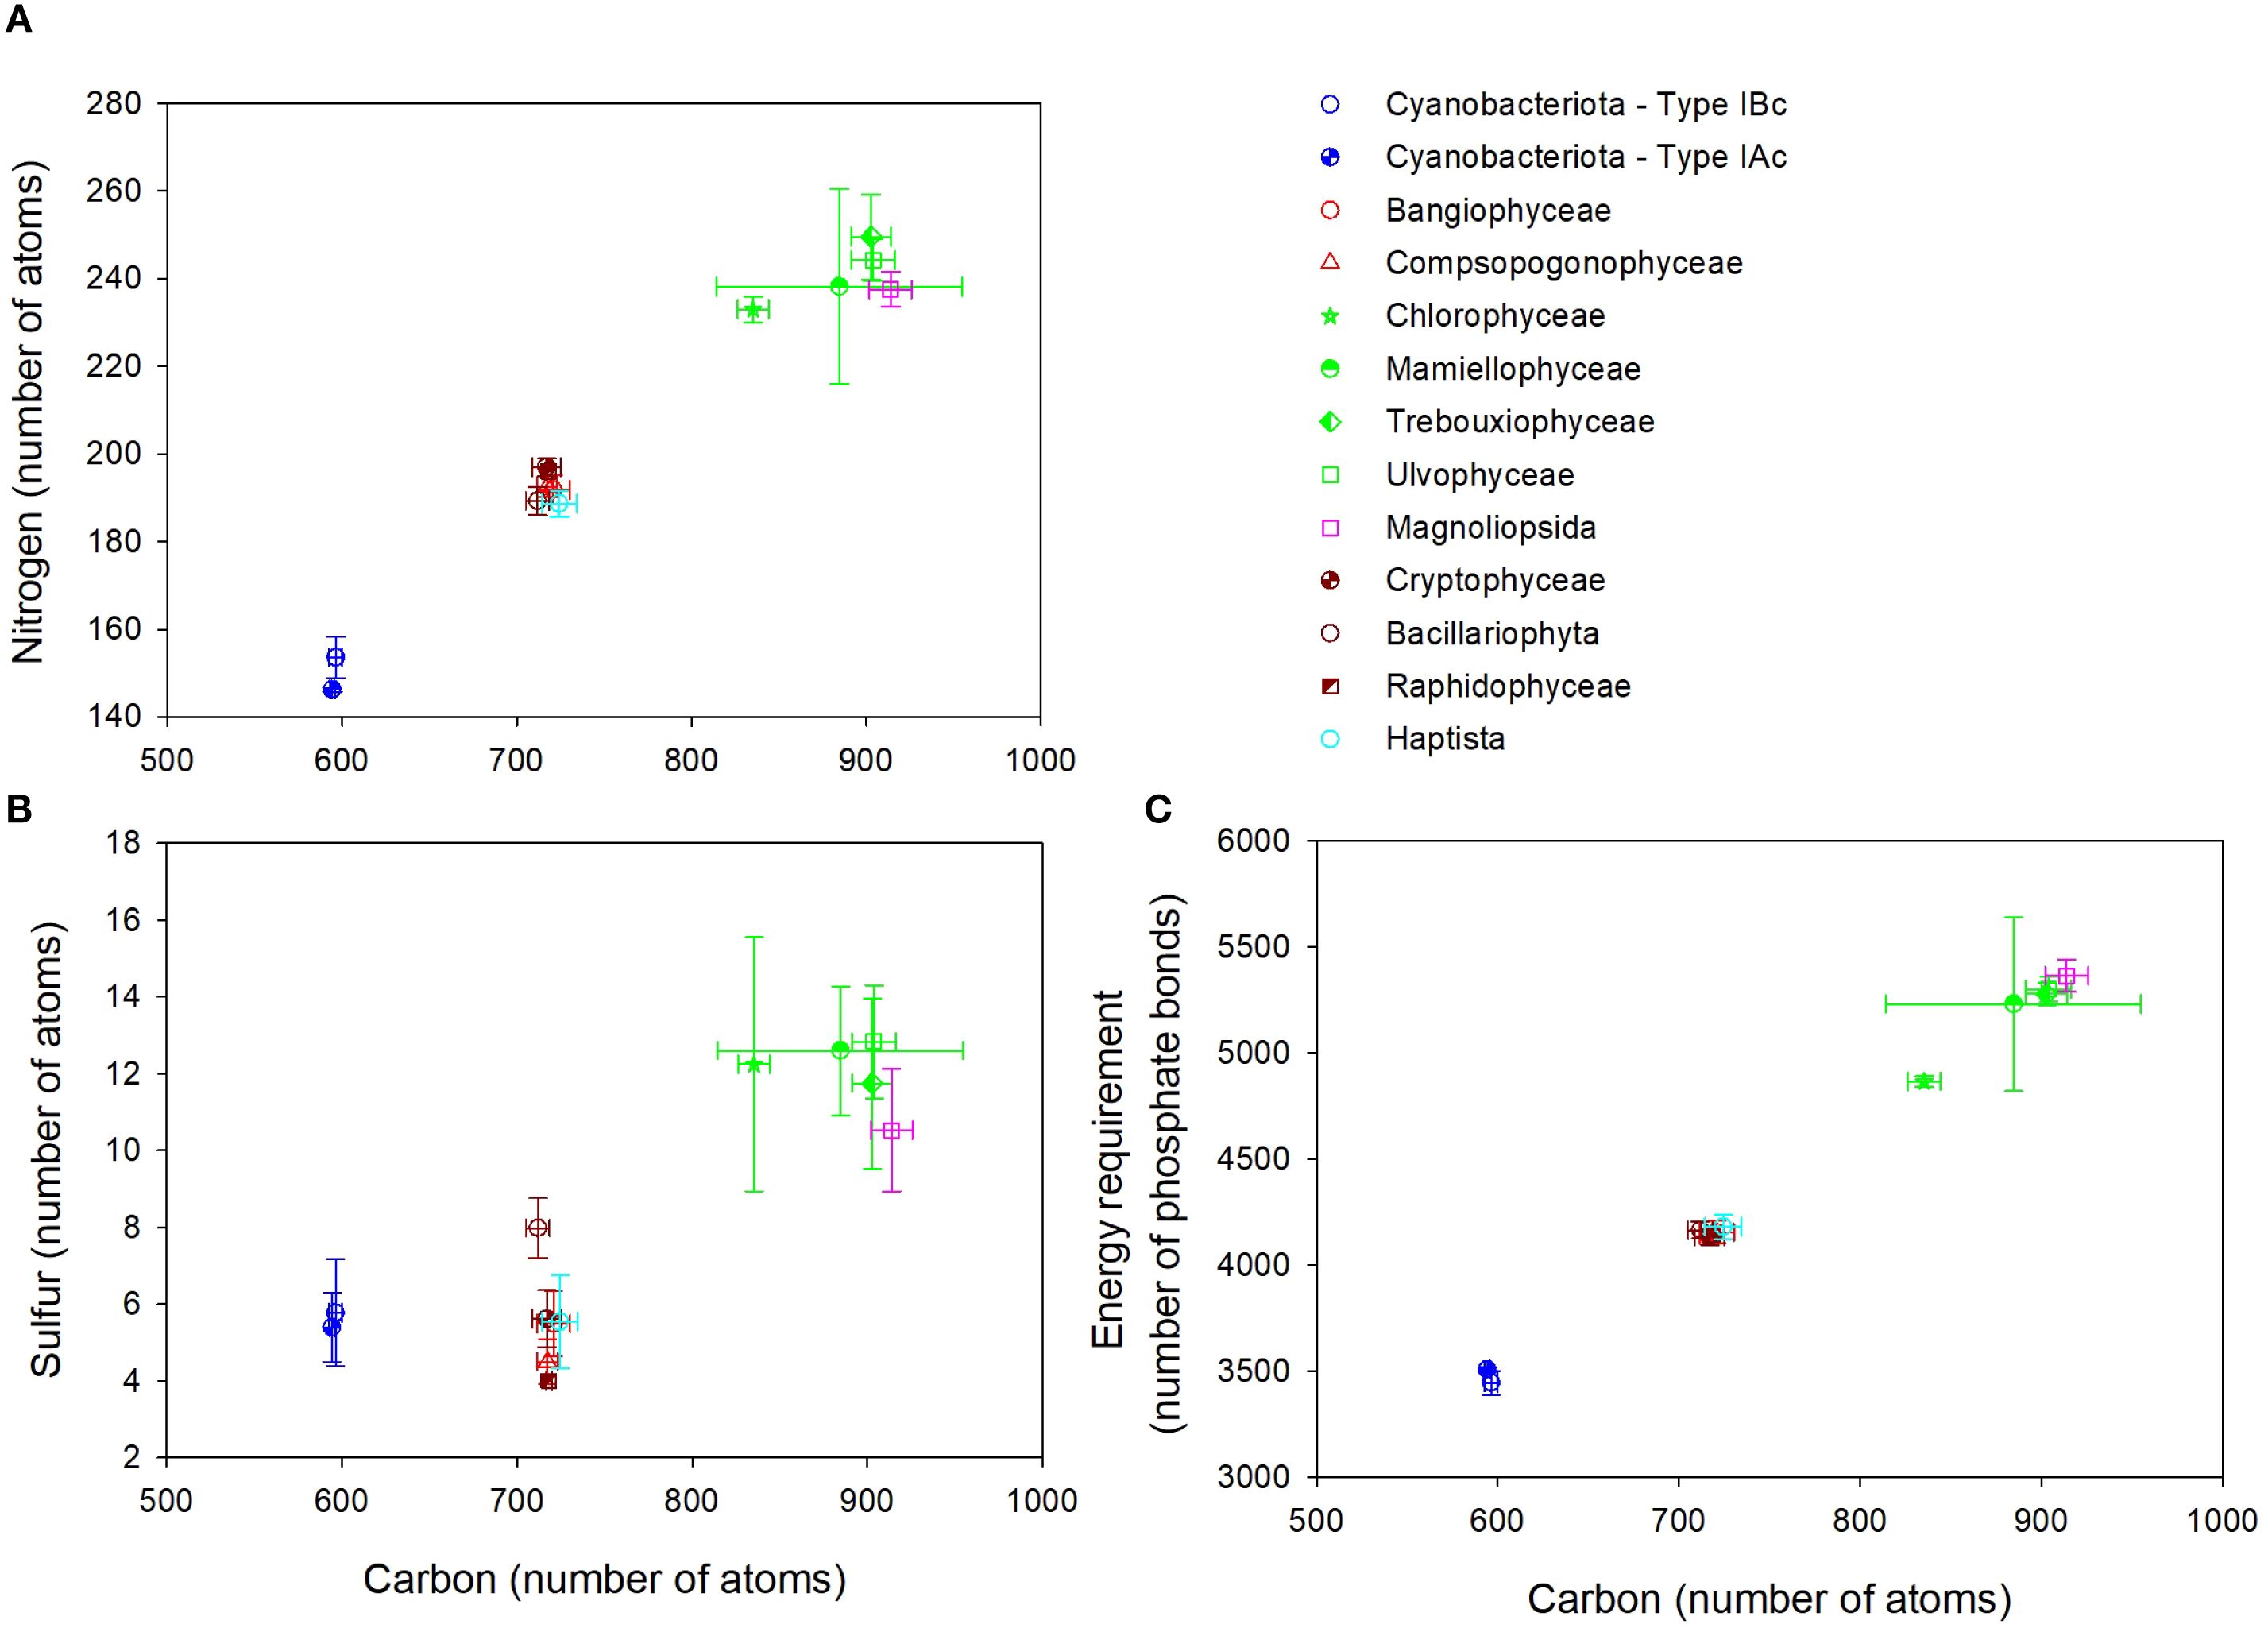
Figure 6. Elemental composition of the small subunit (S) of form I RuBisCO for different taxonomic groups of phytoplankton. (A) Number of carbon and nitrogen atoms. (B) Number of carbon and sulfur atoms. (C) Number of carbon atoms and the energy required to synthesize the holoenzyme quantified in phosphate bonds. Data points show the mean ± SD, where n is variable and is listed in Table 3.
The mean length of the small subunit across all groups (excluding the stylonematophyceae) was 148 ± 22 amino acids (± SD; n = 177), with a range of 107 to 205 amino acids. The mean length of the large subunit across all groups (excluding dinoflagellates) was 476 ± 4 (± SD; n = 570), with a range of lengths from 465 to 496 amino acids. The lower variation in length of the large subunit compared with the small subunit suggests that its structure is more conserved. Considering just the small subunit of RuBisCO, the range of protein length was 113–113 amino acids in Type IAc, 111–113 in Type IBc, 138–141 in Type ID, and 107–205 in Type IB organisms. Variation in the Type IB was much greater than in the other groups as this group included the Viridiplantae (green algae, terrestrial plants) and Glaucophyta. Discoba (euglenoids) also contain Type IB RuBisCO, but they were not represented in the small subunit data.
3.4 Comparing the different types of form I RuBisCO
The costs of creating L8S8 RuBisCO for the different types of RuBisCO are presented in Table 5. This is different from the data presented in Table 2, as all the groups containing Type ID RuBisCO (Bangiophyceae, Bacillariophya, Haptista, and Cryptophyceae) are grouped together. Comparing the two types of eukaryote RuBisCO, the ‘green type’ (Type IB) contains significantly more carbon and nitrogen compared with the ‘red type’ (Type ID) (Table 5, Supplementary Figure S5). There were significant differences in the C:N ratio (F3,37 = 11.240, p < 0.001) of the different types of RuBisCO, with Type ID having a significantly (p < 0.05) higher C:N ratio than Type IB and Type IBc (Table 5, Supplementary Figure S5). The C:N ratio of the two types of cyanobacterial RuBisCO were also significantly (p < 0.05) different, with Type IAc (Prochlorococcus and marine Synechococcus) having a higher C:N ratio than Type IBc RuBisCO. There was no significant difference in the C:S or N:S ratios of the different types of RuBisCO (Table 5, Supplementary Figure S5). The number of nitrogens per holoenzyme was a much more useful metric for comparing RuBisCO between groups than the C:N ratio. This is simply because there is significant variation in the number of amino acids required to build RuBisCO between the different Types (Table 5). For example, while both Types IAc and ID have a mean C:N ratio of 3.71, it takes a mean 6,363 nitrogen atoms to build the holoenzyme of Type IAc RuBisCO compared with 6,765 nitrogen atoms for Type ID.
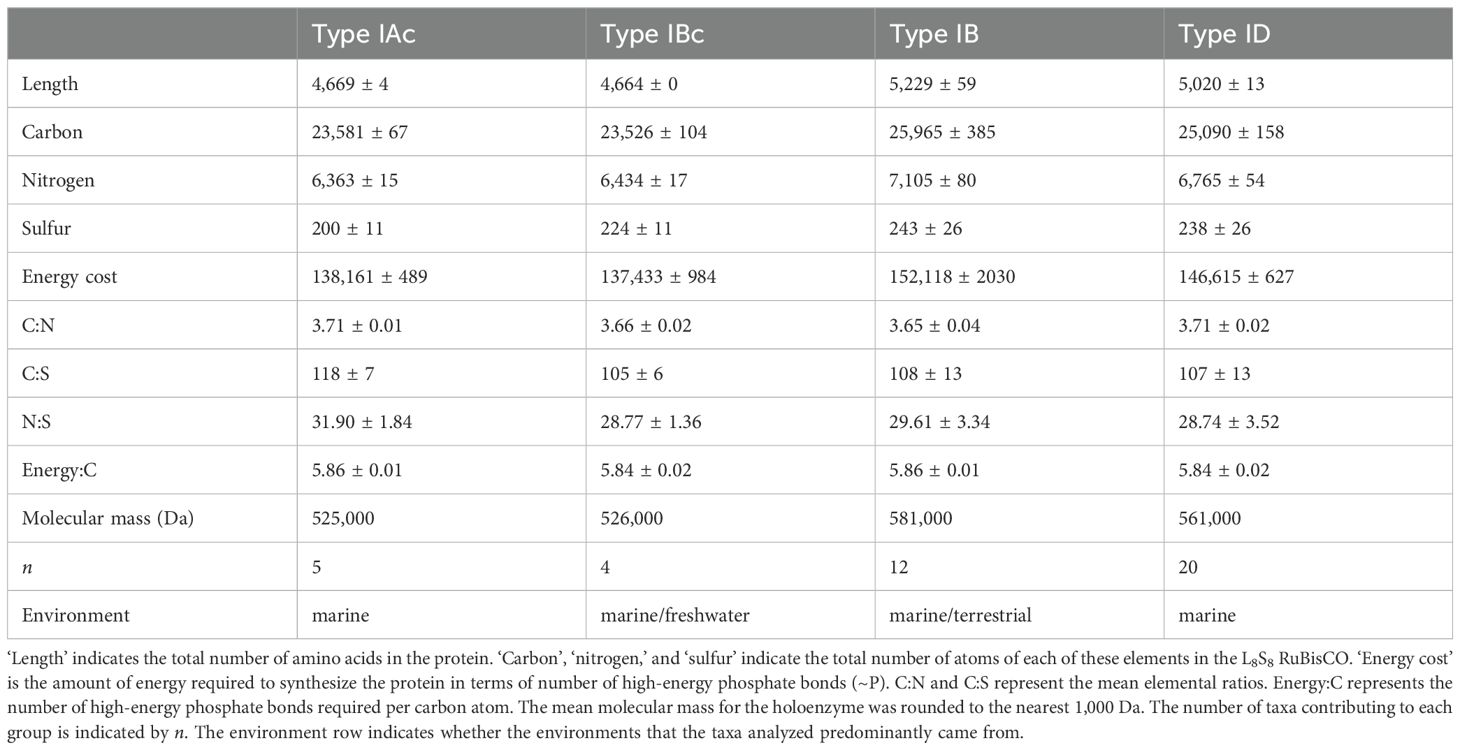
Table 5. Mean (± standard deviation) composition of L8S8 RuBisCO holoenzymes for different types of form I RuBisCO found in photosynthetic organisms.
The mean energy: C ratio for the four RuBisCO types was constant (5.84 to 5.86 high energy phosphate bonds per carbon), reflecting the fact that it is the carbon content that determines how much energy is required to build the proteins and it is not affected by the nitrogen and sulfur content of the RuBisCO. For example, the cost of synthesizing glycine (2 carbons) is 11.7 phosphate bonds, compared with 74.3 phosphate bonds for tryptophan (11 carbons) (Supplementary Table S1). There was a significant correlation (r = 0.997, p < 0.001, n = 41) between the carbon content of the protein and the estimated energy required to synthesize it.
4 Discussion
4.1 RuBisCO size in eukaryotes and cyanobacteria
The largest difference between the elemental composition of the RuBisCo protein corresponds to the difference between cyanobacteria and eukaryotes (Table 2). It requires ~ 390 more amino acids to build eukaryote RuBisCO compared to cyanobacterial RuBisCO. The resources required to build an L8S8 RuBisCO in eukaryotes were approximately 1,900, 400 and 37 more carbon, nitrogen and sulfur atoms, respectively, than in cyanobacteria. This finding fits with the observation that proteins are significantly longer in Eukarya compared with Bacteria (Zhang, 2000; Brocchieri and Karlin, 2005; Tiessen et al., 2012). Tiessen et al. (2012) found that the average protein length in Eukarya was 472 amino acids, compared with 320 in Bacteria and 283 in Archaea. By these criteria, the small RuBisCO subunit is smaller than an average protein in both eukaryotes and cyanobacteria (Table 4). The large RuBisCO subunit is larger than the average protein in cyanobacteria and slightly larger than average in eukaryotes (Table 3).
4.2 Variations in subunit length
A dimer of the large subunit (L2) is the minimum active unit able to fix carbon in Form I RuBisCO (Tabita et al., 2008a). While the large subunit is essential for the function of RuBisCO, the small subunit is hypothesized to play a structural role in stabilizing the holoenzyme and moderating its catalytic efficiency (Mao et al., 2023; Amritkar et al., 2025). This may explain why there was much more variation in protein length in the small subunit protein than the large subunit; the large subunit must be relatively conserved to maintain the active site and its catalytic function when organized in a dimer and activated.
Type 1B RuBisCO is found in both multicellular and single celled organisms, which inhabit marine, freshwater, and terrestrial habitats. Variation in the length of the small subunit did not show patterns associated with specific habitats. Even within one family associated with one environment, there was considerable variation in small subunit length. The Mamiellophyceae had small subunit protein lengths of 162 to 204 amino acids and all species analyzed were marine. The small subunit length in land plants (Magnoliopsida) varied between 177–183 amino acids, similar to those of marine green macroalgae such as Ulva. Variation in the length of the small subunit in land plants may be due to multiple isoforms of rbcS within a single plant species, which are expressed under different environmental conditions (Dedonder et al., 1993). The freshwater glaucophytes (Cyanophora spp.) were outliers with the shortest small subunit proteins (107 amino acids). Glaucophyta are a primitive group that diverged from the Viridiplantae early in the evolutionary history of the Archaeplastida, around 1500 to 1600 Ma (De Clerck et al., 2012; Leebens-Mack et al., 2019). While variation in overall length may be challenging to relate to enzyme function, specific regions of the protein are known to be important, such as the βA-βB loop. Green algae have long (20–31 amino acid residues) βA-βB loops compared with plants (∼ 22 amino acid residues) and non-green algae and prokaryotes (∼ 10 amino acid residues) (Mao et al., 2023). When the βA-βB loop in the green alga Chlamydomonas reinhardtii was substituted for the shorter βA-βB loop of spinach, the resulting RuBisCO from the mutant C. reinhardtii had carboxylation and oxygenation kinetic constants indistinguishable from spinach (Spreitzer et al., 2005).
4.3 C:N stoichiometry of RuBisCO
Pooling the data for all the complete holoenzymes analyzed, the C:N ratio was 3.69 ± 0.04 (mean ± SD; n = 41). The general stoichiometric equation for phytoplankton proteins is C106H168O34N28S (Sarmiento and Gruber, 2006), or a C:N ratio of 3.79. Inomura et al. (2020) report a C:N value for phytoplankton protein of 3.82, based on the work of Brown (1991). These values suggest that RuBisCO is enriched in nitrogen when compared with average phytoplankton protein (Table 5). Therefore, RuBisCO must contain a relatively high proportion of amino acids that contain 2 or more N atoms (arginine, asparagine, glutamine, histidine, lysine, and tryptophan; Supplementary Table S1).
Baudouin-Cornu et al. (2001) found significant correlations between atomic composition and metabolic function – sulfur and carbon assimilatory enzymes were depleted in S and C, respectively, in both Escherichia coli (a bacterium) and Saccharomyces cerevisiae (a yeast). The enrichment of nitrogen relative to C in RuBisCO suggests a similar pattern as the primary function of RuBisCO is the acquisition of reduced carbon during photosynthesis. This observation fits with a stoichiogenomic paradigm in which natural selection has biased monomer usage (i.e. amino acids in proteins) to reduce elemental costs associated with limiting elements (Elser et al., 2011). While there were differences between the C:N ratio between different supergroups of phytoplankton, these differences are not as important as the variation in protein length in determining nitrogen and carbon requirements.
4.4 RuBisCO in dinoflagellates
The sequence lengths of the large subunit in the dinoflagellates were exceptionally long (561 ± 108 amino acids; mean ± SD) compared with the next longest group, the Stramenopila (490 ± 2). This may have been due to fundamental differences between the large subunit protein of dinoflagellates compared with all the other photosynthetic organisms. More likely, the wide range of protein lengths suggests that there were errors in the sequencing from dinoflagellates and therefore the data were unreliable. This was compounded by the very small (n = 5) sample size and consequently no modal value, so outliers could not be eliminated.
The organization of genetic material in dinoflagellates is very different from that in other eukaryote phytoplankton and they are challenging to sequence (Bachvaroff and Place, 2008; Beauchemin et al., 2012; Lin, 2024). In addition, there are fundamental differences between the structure and organization of RuBisCO in dinoflagellates compared with the other major groups of marine phytoplankton. Dinoflagellates contain Form II RuBisCO encoded in the nucleus, whereas all other eukaryote groups in this work contain Form I RuBisCO in which the large subunit genes reside in the plastid and the small subunit genes reside inside the nucleus (Morse et al., 1995; Rowan et al., 1996; Tabita et al., 2008b; Gruber and Feiz, 2018). Dinoflagellate RuBisCO is fundamentally different from the hexadecameric (L8S8) structure of Form I RuBisCO. Dinoflagellates RuBisCO is a homodimer of the large subunit (L2), or in the form (L2)n where n is an integer of 5 or less (Tabita et al., 2008b; Gruber and Feiz, 2018; Rydzy et al., 2021). This explains why there were no small subunit sequences for dinoflagellates in these data (Table 1).
4.5 Resources other than C, N and S required to synthesize RuBisCO
This study has considered resources in terms of carbon, nitrogen, sulfur, and energy in the form of phosphate bonds. As the stoichiometric equation for phytoplankton protein shows (C106H168O34N28S; Sarmiento and Gruber, 2006), Oxygen and hydrogen are very abundant elements in proteins. Using Type 1D RuBisCO as an example, it has a mean oxygen content of 7,368 atoms and 38,854 hydrogen atoms, compared with 6,765 nitrogen and 25,090 carbon atoms. Despite their abundance, oxygen and hydrogen data were not presented in this paper as they are not limiting elements in the ocean, and the energy required to incorporate them into amino acids was included in the energy cost of synthesizing the amino acids.
Energy costs were presented in terms of phosphate bonds, but this does not represent a consumption of phosphorus due to the rapid recycling of phosphate through adenosine diphosphate (ADP) (C10H15N5O10P2) and back to ATP (C10H16N5O13P3) within the cell. Nevertheless, a large pool of P is needed within cells to maintain metabolism. Based on cellular ATP measurements by Hamilton and Holm-Hansen (1967), the amount of P associated with ATP in marine bacteria ranges from 2.96 x 10⁻³ to 38.4 x 10⁻³ fmol P cell-1. For aquatic eukaryotes (both marine and freshwater), with cell diameters from 10 to 50 μm, the amount of P in ATP ranges from 0.946 to 118 fmol P cell-1 (Peperzak et al., 2024).
The number of carbon atoms dictated the energetic cost of synthesizing the amino acids as the number of nitrogen or sulfur atoms in the amino acid did not significantly add to the cost (Supplementary Table S1, Supplementary Figure S1). The cost associated with polymerization of amino acids was proportional to the number of amino acids, and therefore carbon atoms. As a result, the energy cost of synthesizing RuBisCO was highly correlated with its carbon content. Calculating the energy costs of synthesizing RuBisCO provided no more insight than counting the number of carbon atoms in the protein. A more sophisticated approach to evaluate the energy cost of synthesizing RuBisCo would include indirect costs. Examples of indirect energy costs include those associated with the acquisition of biologically available nitrogen and phosphorus from the environment, transcription costs, and the costs associated with synthesizing the chaperon proteins required to synthesize the holoenzyme (Gruber and Feiz, 2018).
Time can also be considered a resource as it takes more time to obtain the resources and synthesize longer proteins. Protein elongation in a range of organisms (both bacteria and eukaryotes) is 0.59 to 21 amino acids per ribosome per second (Karpinets et al., 2006). Using the mean length of Type IB RuBisCO as an example (5229 amino acids in the L8S8 holoenzyme), this would be equivalent to a time range of 249 to 8,863 seconds (4 to 148 minutes). This compares to 222 to 7,905 (4 to 132 minutes) for Type IBc RuBisCO. As RuBisCO has a long half-life (5 to 9 days in Zea mays; Simpson et al., 1981), these time differences may not be significant, or act as a constraint, in maximizing photosynthesis. However, it does mean that the ribosomes are not available to synthesize other proteins. Of course, protein elongation rates are one of many time costs in synthesizing a protein, some of which are directly proportional to the lengths of the protein (e.g. mRNA synthesis) and others that are not (initiation and termination).
4.6 What about co- and post-translational modifications?
The translation of proteins encoded in genes does not necessarily result in the final mature protein due to modifications during translation (co-translational modifications) and at any point during the lifetime of the protein after translation (post-translational modifications (PTMs)) Kessel and Ben-Tal, 2018; Morales-Polanco et al., 2022; Zhong et al., 2023). Therefore, the elemental compositions of the mature protein will differ slightly from that of the encoded sequence. Even the composition of the mature protein is not fixed and may change as the organism responds to the environment (Kessel and Ben-Tal, 2018; Amaral et al., 2024). The number of known PTMs in protein are > 650 and these are generally poorly characterized in specific proteins (Zhong et al., 2023). Therefore, there are not a fixed set of PTMs that can be accounted for in these calculations. It is known that RuBisCO is controlled by several PTMs, including phosphorylation, tyrosine-nitration, acetylation, lysine-methylation, nitrosylation (NO) and glutathionylation (Grabsztunowicz et al., 2017). The large subunit of diatoms is known to undergo a number of PTMs, such as 4-hydroxyproline, ß-hydroxyleucine, hydroxylated and nitrosylated cysteine, mono- and dihydroxylated lysine, and trimethylated lysine (Valegård et al., 2018). A consistent PTM in RuBisCO is the carbamylation of an active-site lysine residue, which is essential for RuBisCO activity as it is needed for RuBisCO to bind to its substrate, ribulose-1,5-bisphosphate (RuBP) (Spreitzer and Salvucci, 2002; Valegård et al., 2018). The calculations presented in this paper assume that these modifications of amino acid residues did not have a significant impact on the elemental composition of RuBisCO and that what is encoded in the genes is at least an accurate representation of the nascent or immature protein.
4.7 Quantifying RuBisCO in the modern ocean
Bar-On and Milo (2019) estimated that the ocean contains a standing stock of phytoplankton that contain approximately 0.03 Gt of RuBisCO, assuming that RuBisCO is 3% of the protein content of the cells. Both the RuBisCO and protein content of phytoplankton are not fixed, depending on genotype and how organisms respond to the environment to affect phenotype (Losh et al., 2013; Jónasdóttir, 2019). Bar-On and Milo (2019) combined 10 reports on the RuBisCO content of microalgae. The geometric mean of these values, plus an assessment of the relative biomass of different phytoplankton groups in the ocean (from Bar-On et al., 2018), was used to estimate 0.03 Gt (Bar-On and Milo, 2019). It should be acknowledged that the 0.03 Gt estimate is based on limited measurements of the cellular content of RuBisCO in phytoplankton. The molecular mass and elemental content data presented in Table 5, in addition to the estimated 0.03 Gt RuBisCO in the ocean, was used to estimate the amount of biogeochemically significant elements (C, N and S) associated with RuBisCO. There is approximately 0.016 Pg C, 5.1 Tg N, and 0.4 Tg S in the form of phytoplankton RuBisCO in the ocean. There was no significant difference between the different Types of RuBisCO in this simple calculation as there were more moles (5.71 x 10⁷ moles) of Type IAc RuBisCO in 0.03 Gt compared with Type 1B (5.16 x 10⁷ moles), thus the difference between the elemental composition of individual RuBisCO holoenzymes was counteracted by the relative amount of each enzyme in the calculation. The same method can be used to estimate the annual productivity of RuBisCO. Estimates for the annual productivity of the ocean are 45 to 55 Pg C yr−1 (Longhurst et al., 1995; Field et al., 1998; Falkowski et al., 2000; Carr et al., 2006; Westberry et al., 2008), which using the conversion of Bar-On and Milo (2019), results in 1.35 to 1.65 Gt RuBisCO yr-1. This is equivalent to 0.725 - 0.890 Pg C, 228–283 Tg N, and 16.5 - 22.5 Tg S fluxing through the RuBisCO protein each year.
Bioavailable nitrogen is a limiting nutrient in a significant proportion of the surface ocean (Moore et al., 2013; Browning and Moore, 2023), with nitrogen supply constrained by the amount of biological nitrogen fixation (a process which is often limited by the availability of iron), and the supply of bioavailable nitrogen from the land. Estimates of the amount of nitrogen fixed by cyanobacteria and other microorganisms in the ocean is 223 ± 30 Tg N yr−1 (Shao et al., 2023). Therefore, amount of bioavailable nitrogen fluxing through the pool of RuBisCO in the ocean is equivalent to, or even higher, than the total annual input of bioavailable nitrogen from nitrogen fixation. As the standing stock of nitrogen in RuBisCO is 5.1 Tg N, the turnover of the RuBisCO pool must be rapid, occurring every 6.6 to 8.2 days. This is similar to estimates of 2 to 6 days for the turnover of phytoplankton biomass (Behrenfeld and Falkowski, 1997).
Prochlorococcus is considered to be the most numerically abundant photosynthetic organism on Earth and has a significant impact on biogeochemical cycling in the ocean (Biller et al., 2015; Flombaum et al., 2013; Partensky et al., 1999; Visintini et al., 2021). The total amount of RuBisCO in Prochlorococcus was estimated using data in Table 5 and published information. The estimated abundance of Prochlorococcus is 2.8 x 1027 to 3.0 x 1027 cells in the ocean at any one time (Flombaum et al., 2013). The RuBisCo content of Prochlorococcus is 7.55 x 10⁻²² to 8.954 x 10⁻²² moles of holoenzyme (L8S8) per cell (Hopkinson et al., 2014). Therefore, the estimated amount of RuBisCO in Prochlorococcus is 2.11- 2.69 x 10⁶ mol, which amounts to 4 to 5% of the total RuBisCO pool in the ocean. This RuBisCO contains 6.0 – 7.6 x 10⁻⁴ Pg C, 0.18 – 0.24 Tg N, and 0.014 – 0.017 Tg S. Prochlorococcus fixes 4 Pg C yr-1 (Flombaum et al., 2013), or 7.3 – 8.9% of net ocean primary productivity. The relatively low proportion of RuBisCO in Prochlorococcus compared with its net productivity suggests that it is highly efficient at photosynthesis. This conclusion, based on global scale biogeochemical observations, fits with what we know about the physiology of Prochlorococcus. It has CO2 fixation rates 1.5 to 2 times higher than those of Synechococcus and photosynthetic picoeukaryotes when rates are normalized to photosynthetic pigment concentrations (Hartmann et al., 2014). This is due to adaptations such as a highly efficient carbon concentrating mechanism to elevate the concentration of CO2 around RuBisCO (Hopkinson et al., 2014).
4.8 Evolution of RuBisCO: time and marine geochemistry
The timing of the emergence and/or dominance of different groups of phytoplankton is coupled to the geochemical history of the Earth (Falkowski et al., 2004; Katz et al., 2007). Earth’s biogeochemistry has changed significantly since the emergence of oxygenic photosynthesis, with many of the changes driven by the activity of the photosynthesizers themselves. The oxygenation of the ocean and atmosphere is the obvious example (Lyons et al., 2024; Stockey et al., 2024). While RuBisCO existed before the GOE, the origin of Form I RuBisCO coincided with the GOE, so it is ~ 2.5 billion years old (Amritkar et al., 2025). RuBisCO is one of the slowest evolving enzymes on Earth, with a nucleotide substitution in the rbcL gene every 0.9 My and one amino acid mutation every 7.2 My (Bouvier et al., 2024). Since the GOE there has been time for approximately 139 amino acid substitutions, equivalent to a substitution in approximately 30% of the amino acids in the large subunit. This is sufficient to account for the observed differences between the large subunit in different major groups of phytoplankton (Figure 3).
There have been many global scale transitions and events that have influenced the evolution of phytoplankton over the last 2.5 billion years, including the ‘big five’ mass extinction events, and snowball Earth periods (Knoll, 2004; Lenton and Watson, 2011). However, there have also been several secular trends that have affected resource availability. These will have affected the evolution and dominance of different phytoplankton groups and their proteins. The Sun’s luminosity has increased by 30% over the course of Earth’s 4.6 billion year history (Lenton, 2016). The Sun’s luminosity increased by 15 – 20% over the Proterozoic Eon (2,500–541 Ma), and by a further ~ 4% over the Phanerozoic Eon (last 541 Ma) (Tajika, 2003; Basinger et al., 2024). This has resulted in significant increase in the flux of solar radiation available to drive photosynthesis at the Earth’s surface, on the order of 20 – 25% over the history of Form I RuBisCO. Phosphorus is regarded as the ultimate limiting nutrient on geological timescales (Tyrrell, 1999). There has been considerable debate over the concentrations and bioavailability of phosphorus in the Precambrian ocean, which are beyond the scope of this paper (e.g. see Robbins et al., 2016). However, there seems to have been a shift in the phosphorus cycle in the late Proterozoic (Planavsky et al., 2010, 2023; Reinhard et al., 2017), resulting in an increase in the bioavailable phosphate pool. Planavsky et al. (2023) times this shift at ~ 750 Ma in the Tonian period (1000–720 Ma). The pool of bioavailable nitrogen in the ocean has increased significantly over the last 2.5 billion years. Biological nitrogen fixation probably existed before oxygenic photosynthesis (Stüeken et al., 2015, 2024), but bioavailable nitrogen (ammonium) did not accumulate in the anoxic and Fe2+ rich ocean as it was coupled to processes such as iron-ammonium redox reactions (Feammox) that returned nitrogen to the atmospheric sink as N2 (Stüeken et al., 2024). The oxygenation of the ocean resulted in a more complex nitrogen cycle, in which nitrification played a major role, resulting in a pool of bioavailable nitrate (Stüeken et al., 2024). Nitrate availability remained low and doubled around 800 million years ago, which coincides with the shift to eukaryote dominated ecosystems (Lenton et al., 2014; Kang et al., 2023). The availability of sulphur in the ocean has been strongly affected by the oxidative state of the Earth’s surface. Over the history of life on Earth, there has been an increase in the sulfate concentrations in the ocean from µM in the Archean to concentrations in the µM to low mM after the GOE (Paleoproterozoic and Mesoproterozoic), to concentrations of 28 mM today (Fakhraee et al., 2019, 2025; Lyons et al., 2024).
These changes collectively show an increase in resources (light energy, bioavailable N and P, and S) essential for building phytoplankton. The increase in bioavailable N and P in the Tonian Period (1000 to 720 Ma) of the Neoproterozoic Era was a driver in the rise to dominance of eukaryote phytoplankton and increased productivity during the Neoproterozoic and subsequent Paleozoic Eras (1000 to 252 Ma) (Brocks et al., 2023; Kang et al., 2023; Stockey et al., 2024). The shift to eukaryote phytoplankton led to an increase in the proportion of larger proteins in the phyoplankton metaproteome that require more energy, C, N, S, and P to synthesize. Eukaryote RuBisCO contains ~ 8% more carbon, nitrogen, and energy per molecule compared with cyanobacterial. This represents a significant increase as protein contains about half of the carbon in a phytoplankton cell, and 2-23% of the protein mass is RuBisCO (Bar-On and Milo, 2019; Ellis, 1979; Losh et al., 2013). While it takes ~ 13% more sulphur to synthesize eukaryote RuBisCO compared with cyanobacterial, it is unlikely that sulphur was ever a limiting nutrient for marine phytoplankton as sulphate concentrations have probably been > 0.1 mM since the GOE (Fakhraee et al., 2025). The increase in resource availability created conditions where the competitive cost of synthesizing larger proteins became less significant for eukaryote phytoplankton competing with cyanobacteria.
The red lineages (diatoms, coccolithophores, and dinoflagellates) of eukaryote phytoplankton that dominate the modern ocean today came to prominence during the Mesozoic Era (251 to 65 Ma) (Falkowski et al., 2004). Green eukaryote phytoplankton dominated before the Mesozoic. Rickaby and Hubbard (2019) proposed that the transition from green to red eukaryote phytoplankton was driven by the different properties of Type IB and Type ID RuBisCO, and the increasing oxygenation of the ocean during the Paleozoic Era (541–252 Ma). Type IB RuBisCO, characteristic of chlorophyte phytoplankton, has relatively poor selectivity between O2 and CO2, therefore it is suited to lower oxygen oceans with lower O2 to CO2 ratios. Type 1D RuBisCO is better adapted to higher O2 to CO2 ratios and therefore more oxygenated oceans. Red lineages with Type ID RuBisCO were able to outcompete green eukaryotes as they did not need to invest as many resources in carbon concentrating mechanisms as the ratio of O2 to CO2 increased (Rickaby and Hubbard, 2019).
Data availability statement
The datasets presented in this study can be found in online repositories. The names of the repository/repositories and accession number(s) can be found below: https://doi.org/10.18738/T8/DZCV8B.
Author contributions
DT: Conceptualization, Data curation, Formal Analysis, Funding acquisition, Methodology, Project administration, Resources, Visualization, Writing – original draft, Writing – review & editing.
Funding
The author(s) declare financial support was received for the research and/or publication of this article. Financial support was provided by the National Science Foundation (NSF) Atmospheric Chemistry Program (Award AGS-2128133) to DT and Sarah D. Brooks.
Conflict of interest
The author declares that the research was conducted in the absence of any commercial or financial relationships that could be construed as a potential conflict of interest.
Generative AI statement
The author(s) declare that no Generative AI was used in the creation of this manuscript.
Any alternative text (alt text) provided alongside figures in this article has been generated by Frontiers with the support of artificial intelligence and reasonable efforts have been made to ensure accuracy, including review by the authors wherever possible. If you identify any issues, please contact us.
Publisher’s note
All claims expressed in this article are solely those of the authors and do not necessarily represent those of their affiliated organizations, or those of the publisher, the editors and the reviewers. Any product that may be evaluated in this article, or claim that may be made by its manufacturer, is not guaranteed or endorsed by the publisher.
Author disclaimer
Any opinions, findings, and conclusions or recommendations expressed in this material are those of the authors and do not necessarily reflect the views of the NSF.
Supplementary material
The Supplementary Material for this article can be found online at: https://www.frontiersin.org/articles/10.3389/fmars.2025.1653421/full#supplementary-material
References
Aigner H., Wilson R. H., Bracher A., Calisse L., Bhat J. Y., Hartl F. U., et al. (2017). Plant RuBisCo assembly in E. coli with five chloroplast chaperones including BSD2. Science 358, 1272–1278. doi: 10.1126/science.aap9221
Akashi H. and Gojobori T. (2002). Metabolic efficiency and amino acid composition in the proteomes of Escherichia coli and Bacillus subtilis. Proc. Natl. Acad. Sci. U. S. A. 99, 3695–3700. doi: 10.1073/pnas.062526999
Alberts B., Heald R., Johnson A., Morgan. D., Raff M., Roberts. K., et al. (2022). Molecular Biology of the Cell. Seventh Edition (New York: W. W. Norton & Company).
Amaral J., Lobo A. K. M., and Carmo-Silva E. (2024). Regulation of Rubisco activity in crops. New Phytol. 241, 35–51. doi: 10.1111/nph.19369
Amritkar K., Cuevas-Zuviria B., and Kacar B. (2025). Evolutionary dynamics of RuBisCO: emergence of the small subunit and its impact through time. Mol. Biol. Evol. 42, 1–13. doi: 10.1093/molbev/msae268
Amthor J. S. (2000). The McCree-de Wit-Penning de Vries-Thornley respiration paradigms: 30 years later. Ann. Bot. 86, 1–20. doi: 10.1006/anbo.2000.1175
Andersson I. (1996). Large structures at high resolution: The 1.6 angstrom crystal structure of spinach ribulose-1,5-bisphosphate carboxylase/oxygenase complexed with 2-carboxyarabinitol bisphosphate. J. Mol. Biol. 259, 160–174. doi: 10.1006/jmbi.1996.0310
Apweiler R., Bairoch A., Wu C. H., Barker W. C., Boeckmann B., Ferro S., et al. (2004). UniProt: the universal protein knowledgebase. Nucl. Acids Res. 32, D115–D119. doi: 10.1093/nar/gkh131
Bachvaroff T. R. and Place A. R. (2008). From stop to start: tandem gene arrangement, copy number and trans-splicing sites in the dinoflagellate Amphidinium carterae. PloS One 3, e2929. doi: 10.1371/journal.pone.0002929
Badger M. R. and Bek E. J. (2008). Multiple Rubisco forms in proteobacteria: their functional significance in relation to CO2 acquisition by the CBB cycle. J. Exp. Bot. 59, 1525–1541. doi: 10.1093/jxb/erm297
Bar-On Y. M. and Milo R. (2019). The global mass and average rate of rubisco. Proc. Natl. Acad. Sci. 116, 4738–4743. doi: 10.1073/pnas.1816654116
Bar-On Y. M., Phillips R., and Milo R. (2018). The biomass distribution on Earth. Proc. Natl. Acad. Sci. 115, 6506–6511. doi: 10.1073/pnas.1711842115
Basinger C., Pinsonneault M., Bastelberger S. T., Gaudi B. S., and Domagal-Goldman S. D. (2024). Constraints on the early luminosity history of the Sun: applications to the Faint Young Sun problem. Mon. Not. R. Astron. Soc 534, 2968–2985. doi: 10.1093/mnras/stae2280
Bateman A., Martin M. J., Orchard S., Magrane M., Ahmad S., Alpi E., et al. (2023). UniProt: the universal protein knowledgebase in 2023. Nucl. Acids Res. 51, D523–D531. doi: 10.1093/nar/gkac1052
Baudouin-Cornu P., Surdin-Kerjan Y., Marlière P., and Thomas D. (2001). Molecular evolution of protein atomic composition. Science 293, 297–300. doi: 10.1126/science.1061052
Beauchemin M., Roy S., Daoust P., Dagenais-Bellefeuille S., Bertomeu T., Letourneau L., et al. (2012). Dinoflagellate tandem array gene transcripts are highly conserved and not polycistronic. Proc. Natl. Acad. Sci. 109, 15793–15798. doi: 10.1073/pnas.1206683109
Behrenfeld M. J. and Falkowski P. G. (1997). Photosynthetic rates derived from satellite-based chlorophyll concentration. Limnol. Oceanogr. 42, 1–20. doi: 10.4319/lo.1997.42.1.0001
Berman H. M., Westbrook J., Feng Z., Gilliland G., Bhat T. N., Weissig H., et al. (2000). The protein data bank. Nucl. Acids Res. 28, 235–242. doi: 10.1093/nar/28.1.235
Biller S. J., Berube P. M., Lindell D., and Chisholm S. W. (2015). Prochlorococcus: the structure and function of collective diversity. Nat. Rev. Microbiol. 13, 13–27. doi: 10.1038/nrmicro3378
Bouvier J. W., Emms D. M., and Kelly S. (2024). Rubisco is evolving for improved catalytic efficiency and CO2 assimilation in plants. Proc. Natl. Acad. Sci. U. S. A. 121, 11. doi: 10.1073/pnas.2321050121
Brocchieri L. and Karlin S. (2005). Protein length in eukaryotic and prokaryotic proteomes. Nucl. Acids Res. 33, 3390–3400. doi: 10.1093/nar/gki615
Brocks J. J., Nettersheim B. J., Adam P., Schaeffer P., Jarrett A. J. M., Güneli N., et al. (2023). Lost world of complex life and the late rise of the eukaryotic crown. Nature 618, 767–773. doi: 10.1038/s41586-023-06170-w
Brown M. R. (1991). The amino-acid and sugar composition of 16 species of microalgae used in mariculture. J. Exp. Mar. Biol. Ecol. 145, 79–99. doi: 10.1016/0022-0981(91)90007-j
Browning T. J. and Moore C. M. (2023). Global analysis of ocean phytoplankton nutrient limitation reveals high prevalence of co-limitation. Nat. Commun. 14, 5014. doi: 10.1038/s41467-023-40774-0
Carr M. E., Friedrichs M., Schmeltz M., Aita M. N., Antoine D., and Arrigo K. R. (2006). A comparison of global estimates of marine primary production from ocean color. Deep-Sea Res. Part II-Top. Stud. Oceanogr. 53, 741–770. doi: 10.1016/j.dsr2.2006.01.028
Chen G. X., Cheng Q. M., Lyons T. W., Shen J., Agterberg F., Huang N., et al. (2022). Reconstructing Earth’s atmospheric oxygenation history using machine learning. Nat. Commun. 13, 13. doi: 10.1038/s41467-022-33388-5
De Clerck O., Bogaert K. A., and Leliaert F. (2012). “Diversity and evolution of algae: primary endosymbiosis,” in Genomic Insights into the Biology of Algae. Ed. Piganeau G. (Elsevier Academic Press, London), 55–86. doi: 10.1016/b978-0-12-391499-6.00002-5
Dedonder A., Rethy R., Fredericq H., Vanmontagu M., and Krebbers E. (1993). Arabidopsis rbcS genes are differentially regulated by light. Plant Physiol. 101, 801–808. doi: 10.1104/pp.101.3.801
Ellis R. J. (1979). Most abundant protein in the world. Trends Biochem. Sci. 4, 241–244. doi: 10.1016/0968-0004(79)90212-3
Elser J. J., Acquisti C., and Kumar S. (2011). Stoichiogenomics: the evolutionary ecology of macromolecular elemental composition. Trends Ecol. Evol. 26, 38–44. doi: 10.1016/j.tree.2010.10.006
Fakhraee M., Crockford P. W., Bauer K. W., Pasquier V., Sugiyama I., Katsev S., et al. (2025). The history of Earth’s sulfur cycle. Nat. Rev. Earth Environ. 6, 106–125. doi: 10.1038/s43017-024-00615-0
Fakhraee M., Hancisse O., Canfield D. E., Crowe S. A., and Katsev S. (2019). Proterozoic seawater sulfate scarcity and the evolution of ocean-atmosphere chemistry. Nat. Geosci. 12, 375–380. doi: 10.1038/s41561-019-0351-5
Falkowski P. G., Katz M. E., Knoll A. H., Quigg A., Raven J. A., Schofield O., et al. (2004). The evolution of modern eukaryotic phytoplankton. Science 305, 354–360. doi: 10.1126/science.1095964
Falkowski P., Scholes R. J., Boyle E., Canadell J., Canfield D., Elser J., et al. (2000). The global carbon cycle: A test of our knowledge of Earth as a system. Science 290, 291–296. doi: 10.1126/science.290.5490.291
Fehling J., Stoecker D., and Baldauf S. L. (2007). “Photosynthesis and the eukaryote tree of life,” in Evolution of Primary Producers in the Sea. Eds. Falkowski P. and Knoll A. H. (Elsevier Academic Press, Burlington), 75–107.
Field C. B., Behrenfeld M. J., Randerson J. T., and Falkowski P. (1998). Primary production of the biosphere: Integrating terrestrial and oceanic components. Science 281, 237–240. doi: 10.1126/science.281.5374.237
Flombaum P., Gallegos J. L., Gordillo R. A., Rincón J., Zabala L. L., Jiao N. A. Z., et al. (2013). Present and future global distributions of the marine Cyanobacteria Prochlorococcus and Synechococcus. Proc. Natl. Acad. Sci. U. S. A. 110, 9824–9829. doi: 10.1073/pnas.1307701110
Fournier G. P., Moore K. R., Rangel L. T., Payette J. G., Momper L., and Bosak T. (2021). The Archean origin of oxygenic photosynthesis and extant cyanobacterial lineages. Proc. R. Soc B-Biol. Sci. 288, 10. doi: 10.1098/rspb.2021.0675
Grabsztunowicz M., Koskela M. M., and Mulo P. (2017). Post-translational modifications in regulation of chloroplast function: recent advances. Front. Plant Sci. 8. doi: 10.3389/fpls.2017.00240
Gruber A. V. and Feiz L. (2018). Rubisco assembly in the chloroplast. Front. Mol. Biosci. 5. doi: 10.3389/fmolb.2018.00024
Gumsley A. P., Chamberlain K. R., Bleeker W., Söderlund U., Kock M. D. O., Larsson E. R., et al. (2017). Timing and tempo of the great oxidation event. Proc. Natl. Acad. Sci. U. S. A. 114, 1811–1816. doi: 10.1073/pnas.1608824114
Hamilton R. D. and Holm-Hansen O. (1967). Adenosine triphosphate content of marine bacteria. Limnol. Oceanogr. 12, 319–324. doi: 10.4319/lo.1967.12.2.0319
Hartmann M., Gomez-Pereira P., Grob C., Ostrowski M., Scanlan D. J., and Zubkov M. V. (2014). Efficient CO2 fixation by surface Prochlorococcus in the Atlantic Ocean. ISME J. 8, 2280–2289. doi: 10.1038/ismej.2014.56
He T. C., Zhu M. Y., Mills B. J. W., Wynn P. M., Zhuravlev A. Y., Tostevin R., et al. (2019). Possible links between extreme oxygen perturbations and the Cambrian radiation of animals. Nat. Geosci. 12, 468–474. doi: 10.1038/s41561-019-0357-z
Hopkinson B. M., Young J. N., Tansik A. L., and Binder B. J. (2014). The minimal CO2-concentrating mechanism of Prochlorococcus spp. MED4 is effective and efficient. Plant Physiol. 166, 2205–2217. doi: 10.1104/pp.114.247049
Inomura K., Omta A. W., Talmy D., Bragg J., Deutsch C., and Follows M. J. (2020). A mechanistic model of macromolecular allocation, elemental stoichiometry, and growth rate in phytoplankton. Front. Microbiol. 11. doi: 10.3389/fmicb.2020.00086
Jónasdóttir S. H. (2019). Fatty acids profiles and production in marine phytoplankton. Mar. Drugs 17, 151. doi: 10.3390/md17030151
Kang J. Y., Gill B., Reid R., Zhang F. F., and Xiao S. H. (2023). Nitrate limitation in early Neoproterozoic oceans delayed the ecological rise of eukaryotes. Sci. Adv. 9, eade9647. doi: 10.1126/sciadv.ade9647
Karpinets T. V., Greenwood D. J., Sams C. E., and Ammons J. T. (2006). RNA: protein ratio of the unicellular organism as a characteristic of phosphorous and nitrogen stoichiometry and of the cellular requirement of ribosomes for protein synthesis. BMC Biol. 4, 30. doi: 10.1186/1741-7007-4-30
Katz M. R., Fennel K., and Falkowski P. G. (2007). “Geochemical and biological consequences of phytoplankton evolution,” in Evolution of Primary Producers in the Sea. Eds. Falkowski P. and Knoll A. H. (Elsevier Academic Press, Burlington), 405–430.
Keeling P. J. and Burki F. (2019). Progress towards the tree of eukaryotes. Curr. Biol. 29, R808–R817. doi: 10.1016/j.cub.2019.07.031
Kessel A. and Ben-Tal N. (2018). Introduction to Proteins. 2nd ed. (New York: Chapman and Hall/CRC). doi: 10.1201/9781315113876
Leebens-Mack J. H., Barker M. S., Carpenter E. J., Deyholos M. K., Gitzendanner M. A., Graham S. W., et al. (2019). One thousand plant transcriptomes and the phylogenomics of green plants. Nature 574, 679–685. doi: 10.1038/s41586-019-1693-2
Lenton T. M. (2016). Earth System Science: A Very Short Introduction (Oxford: Oxford University Press).
Lenton T. M., Boyle R. A., Poulton S. W., Shields-Zhou G. A., and Butterfield N. J. (2014). Co-evolution of eukaryotes and ocean oxygenation in the Neoproterozoic era. Nat. Geosci. 7, 257–265. doi: 10.1038/ngeo2108
Lenton T. M., Dahl T. W., Daines S. J., Mills B. J. W., Ozaki K., Saltzman M. R., et al. (2016). Earliest land plants created modern levels of atmospheric oxygen. Proc. Natl. Acad. Sci. U. S. A. 113, 9704–9709. doi: 10.1073/pnas.1604787113
Lin S. J. (2024). A decade of dinoflagellate genomics illuminating an enigmatic eukaryote cell. BMC Genomics 25, 30. doi: 10.1186/s12864-024-10847-5
Longhurst A., Sathyendranath S., Platt T., and Caverhill C. (1995). An estimate of global primary production in the ocean from satellite radiometer data. J. Plankton Res. 17, 1245–1271. doi: 10.1093/plankt/17.6.1245
Losh J. L., Young J. N., and Morel F. M. M. (2013). Rubisco is a small fraction of total protein in marine phytoplankton. New Phytol. 198, 52–58. doi: 10.1111/nph.12143
Lyons T. W., Tino C. J., Fournier G. P., Anderson R. E., Leavitt W. D., Konhauser K. O., et al. (2024). Co-evolution of early Earth environments and microbial life. Nat. Rev. Microbiol. 22, 572–586. doi: 10.1038/s41579-024-01044-y
Mao Y. W., Catherall E., Díaz-Ramos A., Greiff G. R. L., Azinas S., Gunn L., et al. (2023). The small subunit of Rubisco and its potential as an engineering target. J. Exp. Bot. 74, 543–561. doi: 10.1093/jxb/erac309
Moore C. M., Mills M. M., Arrigo K. R., Berman-Frank I., Bopp L., Boyd P. W., et al. (2013). Processes and patterns of oceanic nutrient limitation. Nat. Geosci. 6, 701–710. doi: 10.1038/ngeo1765
Morales-Polanco F., Lee J. H., Barbosa N. M., and Frydman J. (2022). Cotranslational mechanisms of protein biogenesis and complex assembly in eukaryotes. Annu. Rev. Biomed. Data Sci. 5, 67–94. doi: 10.1146/annurev-biodatasci-121721-095858
Morse D., Salois P., Markovic P., and Hastings J. W. (1995). A nuclear-encoded form-II RuBisCO in dinoflagellates. Science 268, 1622–1624. doi: 10.1126/science.7777861
Newman J., Branden C. I., and Jones T. A. (1993). Structure determination and refinement of ribulose 1,5-bisphosphate carboxylase/oxygenase from Synechococcus PCC6301. Acta Crystallogr. Sect. D-Biol. Crystallogr. 49, 548–560. doi: 10.1107/s090744499300530x
Och L. M. and Shields-Zhou G. A. (2012). The Neoproterozoic oxygenation event: environmental perturbations and biogeochemical cycling. Earth-Sci. Rev. 110, 26–57. doi: 10.1016/j.earscirev.2011.09.004
Olejarz J., Iwasa Y., Knoll A. H., and Nowak M. A. (2021). The Great Oxygenation Event as a consequence of ecological dynamics modulated by planetary change. Nat. Commun. 12, 9. doi: 10.1038/s41467-021-23286-7
Partensky F., Hess W. R., and Vaulot D. (1999). Prochlorococcus, a marine photosynthetic prokaryote of global significance. Microbiol. Mol. Biol. Rev. 63, 106–127. doi: 10.1128/mmbr.63.1.106-127.1999
Peperzak L., Casas-Monroy O., and Bailey S. A. (2024). Validation of an adenosine triphosphate (ATP) model for 10-50 μm plankton. Mar. pollut. Bull. 200, 116066. doi: 10.1016/j.marpolbul.2024.116066
Planavsky N. J., Asael D., Rooney A. D., Robbins L. J., Gill B. C., Dehler C. M., et al. (2023). A sedimentary record of the evolution of the global marine phosphorus cycle. Geobiology 21, 168–174. doi: 10.1111/gbi.12536
Planavsky N. J., Rouxel O. J., Bekker A., Lalonde S. V., Konhauser K. O., Reinhard C. T., et al. (2010). The evolution of the marine phosphate reservoir. Nature 467, 1088–1090. doi: 10.1038/nature09485
Raines C. A. (2022). Improving plant productivity by re-tuning the regeneration of RuBP in the Calvin-Benson-Bassham cycle. New Phytol. 236, 350–356. doi: 10.1111/nph.18394
Reinhard C. T., Planavsky N. J., Gill B. C., Ozaki K., Robbins L. J., Lyons T. W., et al. (2017). Evolution of the global phosphorus cycle. Nature 541, 386–389. doi: 10.1038/nature20772
Rickaby R. E. M. and Hubbard M. R. E. (2019). Upper ocean oxygenation, evolution of RuBisCO and the Phanerozoic succession of phytoplankton. Free Radic. Biol. Med. 140, 295–304. doi: 10.1016/j.freeradbiomed.2019.05.006
Robbins L. J., Lalonde S. V., Planavsky N. J., Partin C. A., Reinhard C. T., Kendall B., et al. (2016). Trace elements at the intersection of marine biological and geochemical evolution. Earth-Sci. Rev. 163, 323–348. doi: 10.1016/j.earscirev.2016.10.013
Rowan R., Whitney S. M., Fowler A., and Yellowlees D. (1996). Rubisco in marine symbiotic dinoflagellates: Form II enzymes in eukaryotic oxygenic phototrophs encoded by a nuclear multigene family. Plant Cell 8, 539–553. doi: 10.1105/tpc.8.3.539
Rydzy M., Tracz M., Szczepaniak A., and Grzyb J. (2021). Insights into the structure of rubisco from dinoflagellates-in silico studies. Int. J. Mol. Sci. 22, 8524. doi: 10.3390/ijms22168524
Sarmiento J. L. and Gruber N. (2006). Ocean Biogeochemical Dynamics (Princeton: Princton University Press).
Shao Z. B., Xu Y. C., Wang H., Luo W. C., Wang L. C., Huang Y. H., et al. (2023). Global oceanic diazotroph database version 2 and elevated estimate of global oceanic N2 fixation. Earth Syst. Sci. Data. 15, 3673–3709. doi: 10.5194/essd-15-3673-2023
Simpson E., Cooke R. J., and Davies D. D. (1981). Measurement of protein degradation in leaves of Zea mays using [3H] acetic anhydride and tritiated water. Plant Physiol. 67, 1214–1219. doi: 10.1104/pp.67.6.1214
Spreitzer R. J., Peddi S. R., and Satagopan S. (2005). Phylogenetic engineering at an interface between large and small subunits imparts land-plant kinetic properties to algal Rubisco. Proc. Natl. Acad. Sci. 102, 17225–17230 doi: 10.1073/pnas.0508042102
Spreitzer R. J. and Salvucci M. E. (2002). Rubisco: Structure, regulatory interactions, and possibilities for a better enzyme. Annu. Rev. Plant Biol. 53, 449–475. doi: 10.1146/annurev.arplant.53.100301.135233
Stockey R. G., Cole D. B., Farrell U. C., Agic H., Boag T. H., Brocks J. J., et al. (2024). Sustained increases in atmospheric oxygen and marine productivity in the Neoproterozoic and Palaeozoic eras. Nat. Geosci. 17, 667–674. doi: 10.1038/s41561-024-01479-1
Stüeken E. E., Buick R., Guy B. M., and Koehler M. C. (2015). Isotopic evidence for biological nitrogen fixation by molybdenum-nitrogenase from 3.2 Gyr. Nature 520, 666–U178. doi: 10.1038/nature14180
Stüeken E. E., Pellerin A., Thomazo C., Johnson B. W., Duncanson S., and Schoepfer S. D. (2024). Marine biogeochemical nitrogen cycling through Earth’s history. Nat. Rev. Earth Environ. 5, 732–747. doi: 10.1038/s43017-024-00591-5
Tabita F. R. (1999). Microbial ribulose 1,5-bisphosphate carboxylase/oxygenase: A different perspective. Photosynth. Res. 60, 1–28. doi: 10.1023/a:1006211417981
Tabita F. R., Hanson T. E., Satagopan S., Witte B. H., and Kreel N. E. (2008b). Phylogenetic and evolutionary relationships of RubisCO and the RubisCO-like proteins and the functional lessons provided by diverse molecular forms. Philos. Trans. R. Soc B-Biol. Sci. 363, 2629–2640. doi: 10.1098/rstb.2008.0023
Tabita F. R., Satagopan S., Hanson T. E., Kreel N. E., and Scott S. S. (2008a). Distinct form I, II, III, and IV Rubisco proteins from the three kingdoms of life provide clues about Rubisco evolution and structure/function relationships. J. Exp. Bot. 59, 1515–1524. doi: 10.1093/jxb/erm361
Tajika E. (2003). Faint young Sun and the carbon cycle: implication for the Proterozoic global glaciations. Earth Planet. Sci. Lett. 214, 443–453. doi: 10.1016/s0012-821x(03)00396-0
Tiessen A., Pérez-Rodríguez P., and Delaye-Arredondo L. J. (2012). Mathematical modeling and comparison of protein size distribution in different plant, animal, fungal and microbial species reveals a negative correlation between protein size and protein number, thus providing insight into the evolution of proteomes. BMC Res. Notes 5, 85. doi: 10.1186/1756-0500-5-85
Tostevin R. and Mills B. J. W. (2020). Reconciling proxy records and models of Earth’s oxygenation during the Neoproterozoic and Palaeozoic. Interface Focus 10, 13. doi: 10.1098/rsfs.2019.0137
Tyrrell T. (1999). The relative influences of nitrogen and phosphorus on oceanic primary production. Nature 400, 525–531. doi: 10.1038/22941
Valegård K., Andralojc P. J., Haslam R. P., Pearce F. G., Eriksen G. K., Madgwickn P. J., et al. (2018). Structural and functional analyses of Rubisco from arctic diatom species reveal unusual posttranslational modifications. J. Biol. Chem. 293, 13033–13043. doi: 10.1074/jbc.RA118.003518
Visintini N., Martiny A. C., and Flombaum P. (2021). Prochlorococcus, Synechococcus, and picoeukaryotic phytoplankton abundances in the global ocean. Limnol. Oceanogr. Lett. 6, 207–215. doi: 10.1002/lol2.10188
Wagner A. (2005). Energy constraints on the evolution of gene expression. Mol. Biol. Evol. 22, 1365–1374. doi: 10.1093/molbev/msi126
Westberry T., Behrenfeld M. J., Siegel D. A., and Boss E. (2008). Carbon-based primary productivity modeling with vertically resolved photoacclimation. Glob. Biogeochem. Cycle 22, GB2024. doi: 10.1029/2007gb003078
Yeates T. O. and Wheatley N. M. (2017). Putting the RuBisCO pieces together Scientists find a way to build the major plant enzyme RuBisCO in bacteria. Science 358, 1253–1254. doi: 10.1126/science.aar3107
Zhang J. Z. (2000). Protein-length distributions for the three domains of life. Trends Genet. 16, 107–109. doi: 10.1016/s0168-9525(99)01922-8
Keywords: elemental stoichiometry, evolution, nitrogen cycle, Phanerozoic Eon, photosynthesis, Prochlorococcus, Proterozoic Eon, ribulose-1,5-bisphosphate oxygenase/carboxylase
Citation: Thornton DCO (2025) Biogeochemistry of phytoplankton RuBisCO in the ocean. Front. Mar. Sci. 12:1653421. doi: 10.3389/fmars.2025.1653421
Received: 25 June 2025; Accepted: 11 September 2025;
Published: 25 September 2025.
Edited by:
Sibel Bargu, Louisiana State University System, United StatesReviewed by:
Hongfei Li, Zhejiang Ocean University, ChinaPatricia M Glibert, University of Maryland, College Park, United States
Caio Cesar-Ribeiro, Rio de Janeiro State University, Brazil
Copyright © 2025 Thornton. This is an open-access article distributed under the terms of the Creative Commons Attribution License (CC BY). The use, distribution or reproduction in other forums is permitted, provided the original author(s) and the copyright owner(s) are credited and that the original publication in this journal is cited, in accordance with accepted academic practice. No use, distribution or reproduction is permitted which does not comply with these terms.
*Correspondence: Daniel C. O. Thornton, ZHRob3JudG9uQHRhbXUuZWR1