 Maria Perez Tadeo
 Joanne O’Brien
- Marine and Freshwater Research Centre, Department of Natural Resources and the Environment, Atlantic Technological University, Galway, Ireland
Snapshots of underwater sound were collected during a multidisciplinary research survey at 14 stations south of the Iberian Peninsula, including the Strait of Gibraltar, an area characterized by intense maritime traffic. Sound Pressure Levels (SPLs) were quantified at each station using 1/3-octave bands, with a focus on the 63 Hz and 125 Hz centered frequency bands, as recommended by the Marine Strategy Framework Directive (MSFD). When possible, the main noise sources were also identified. SPLs in the 63 Hz band ranged from 104.91 to 132.24 dB re 1 μPa, with an average of 113.21 dB re 1 μPa. In the 125 Hz band, SPLs ranged from 104.31 to 129.82 dB re 1 μPa, with an average of 110.27 dB re 1 μPa. The highest SPLs were recorded at the stations in the Strait of Gibraltar and the Alboran Sea. A methodology consisting of attaching a SoundTrap to the research vessel’s CTD rosette was tested and proved to be an effective approach for assessing the underwater soundscape from vessels of opportunity.
1 Introduction
In the last decades, the oceans’ soundscape has undergone a significant transformation, shifting from a predominantly natural composition of biological and geological sounds to one increasingly dominated by anthropogenic sources (Duarte et al., 2021). Anthropogenic noise in the ocean comes from different activities, including shipping, seismic surveys, active sonar, and pile driving associated with renewable energy developments (Hildebrand, 2009; Newhall et al., 2016). Among these, shipping noise, produced by tankers, cargo carriers, fishing vessels, recreational boats, and others, stands out as a continuous source, increasing ocean background noise levels, particularly in the low to mid frequencies, over the past six decades (Hildebrand, 2009; Malakoff, 2010).
Marine mammals, particularly cetaceans, rely heavily on sound for communication, navigation and prey detection (Berrow et al., 2018; Hooker et al., 2018). This acoustic reliance makes them especially vulnerable to anthropogenic ocean noise, which can impair their hearing abilities and compromise their survival (Gordon et al., 2003; Aguilar Soto et al., 2006; Southall et al., 2007). Vessel noise typically propagates mostly between 10 to 1,000 Hz (Merchant et al., 2012; 2014), overlapping significantly with both sound production and hearing frequency ranges used by baleen whales (Southall et al., 2007; Erbe et al., 2019). Consequently, mysticetes are particularly susceptible to this noise source, which may lead to masking, changes in their acoustic behavior, temporary or permanent shifts in hearing thresholds, and increased stress (Richardson et al., 1995; Erbe et al., 2019). Additionally, cavitation noise can extend into medium and high frequency bands, potentially affecting also toothed whales (Aguilar Soto et al., 2006; Jensen et al., 2009).
Being the connection between the Mediterranean Sea and the North Atlantic Ocean, the Strait of Gibraltar is one of the most important European shipping lanes in Europe (HM Government of Gibraltar, 2015; Moreno-Gutiérrez and Durán-Grados, 2023). The heavy maritime traffic in the area overlaps with the presence of both resident and migratory cetacean species, including short-beaked common, striped, and bottlenose dolphins, long-finned pilot whales (de Stephanis et al., 2008; Bearzi et al., 2021; Verborgh and Gauffier, 2021), sperm whales (Pirotta et al., 2021), killer whales (Esteban et al., 2014; 2016), fin whales (Gauffier et al., 2018) and Cuvier’s beaked whales (Cañadas and Vázquez, 2014). Additionally, humpback whales and harbor porpoises have been rarely recorded or found stranded (Rojo–Nieto et al., 2011). Of all these species, common dolphins, fin whales, and sperm whales are classified as endangered, while long-finned pilot whales and killer whales are listed as critically endangered by the IUCN Red List of Threatened Species (IUCN, 2023). All cetacean species are protected under the European Union’s Habitats Directive (92/43/EEC), and as Annex IV species, their habitats are strictly protected within the Exclusive Economic Zones (EEZs). Furthermore, disturbances caused by underwater noise must be assessed to ensure compliance with the EU Habitats Directive and the Marine Strategy Framework Directive (MSFD), under which underwater noise is addressed as Descriptor 11, stating that ‘the introduction of energy, including underwater noise, is at levels that do not adversely affect the marine environment’.
The interdisciplinary research survey AMIGOS (Acoustic Monitoring from Ireland to Gibraltar Oceanic waters Survey) served as a platform for acoustic data collection as part of the four-year STRAITS project (Strategic Infrastructure for improved animal Tracking in European Seas), funded under the EU’s Horizon research and innovation program. The survey contributed to the project’s objectives in one of its key study sites, the Strait of Gibraltar, an area of high marine biodiversity and conservation interest. This study aims to provide a snapshot of ambient noise levels south of the Iberian Peninsula, including the Strait of Gibraltar, by quantifying ambient sound levels as Sound Pressure Levels (SPLs) in 1/3-octave bands, focusing on the 63 Hz and 125 Hz-centered frequency bands, following the recommendations of Descriptor 11 of the MSFD for assessing underwater noise in European waters (Dekeling et al., 2015; Joint Research Centre, 2018). Additionally, the study presents a methodology for short-term, boat-based underwater Passive Acoustic Monitoring (PAM) that enables broad spatial coverage, in contrast to long-term monitoring at a limited number of locations.
2 Materials and methods
2.1 Study area
The study area encompassed the southwest and south of Portugal, the Gulf of Cadiz, and the Strait of Gibraltar (Figure 1).
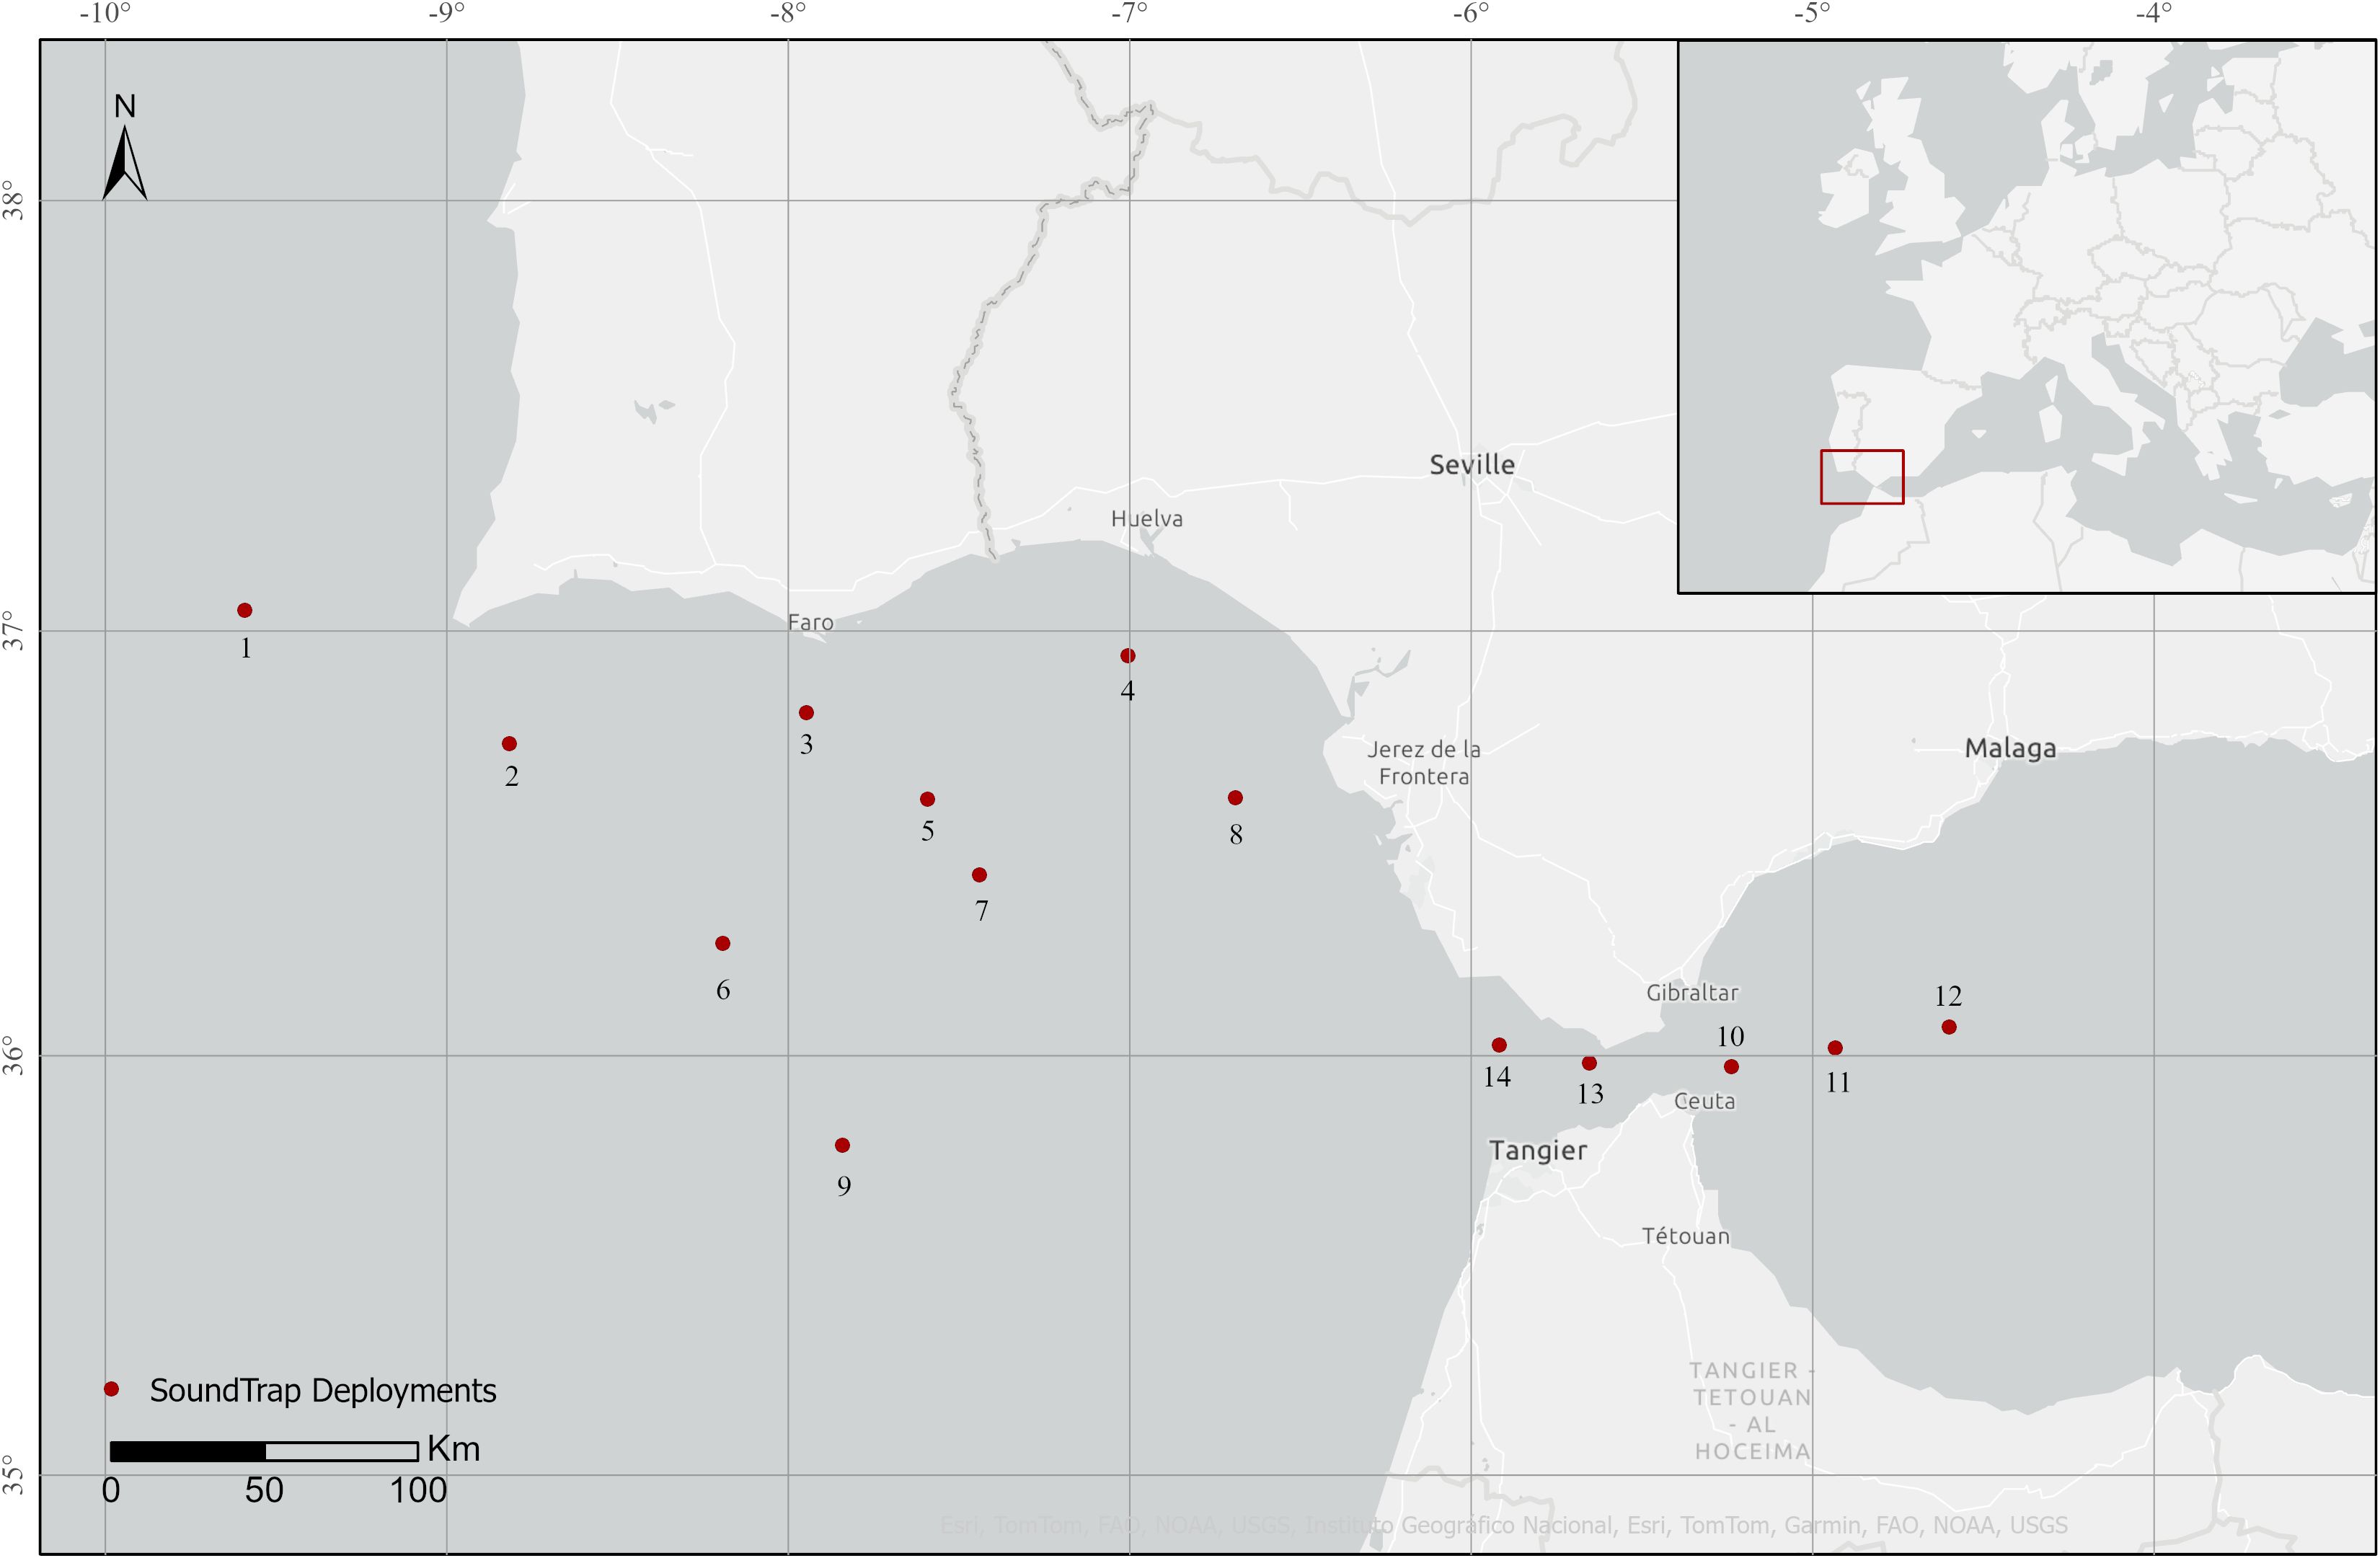
Figure 1. Acoustic monitoring stations using a SoundTrap deployed across the southwest and south of Portugal, the Gulf of Cadiz, and the Strait of Gibraltar during the AMIGOS research survey in October 2024.
2.2 Acoustic data collection
Short-term Static Acoustic Monitoring deployments were conducted during the multidisciplinary research survey AMIGOS on board the Marine Institute’s RV Celtic Explorer between October 21 and 24, 2024. A SoundTrap was attached to the CTD rosette to record the soundscape at 14 stations across the southwest and south of Portugal, the Gulf of Cadiz, and the Strait of Gibraltar (Figures 1 and 2; Table 1).
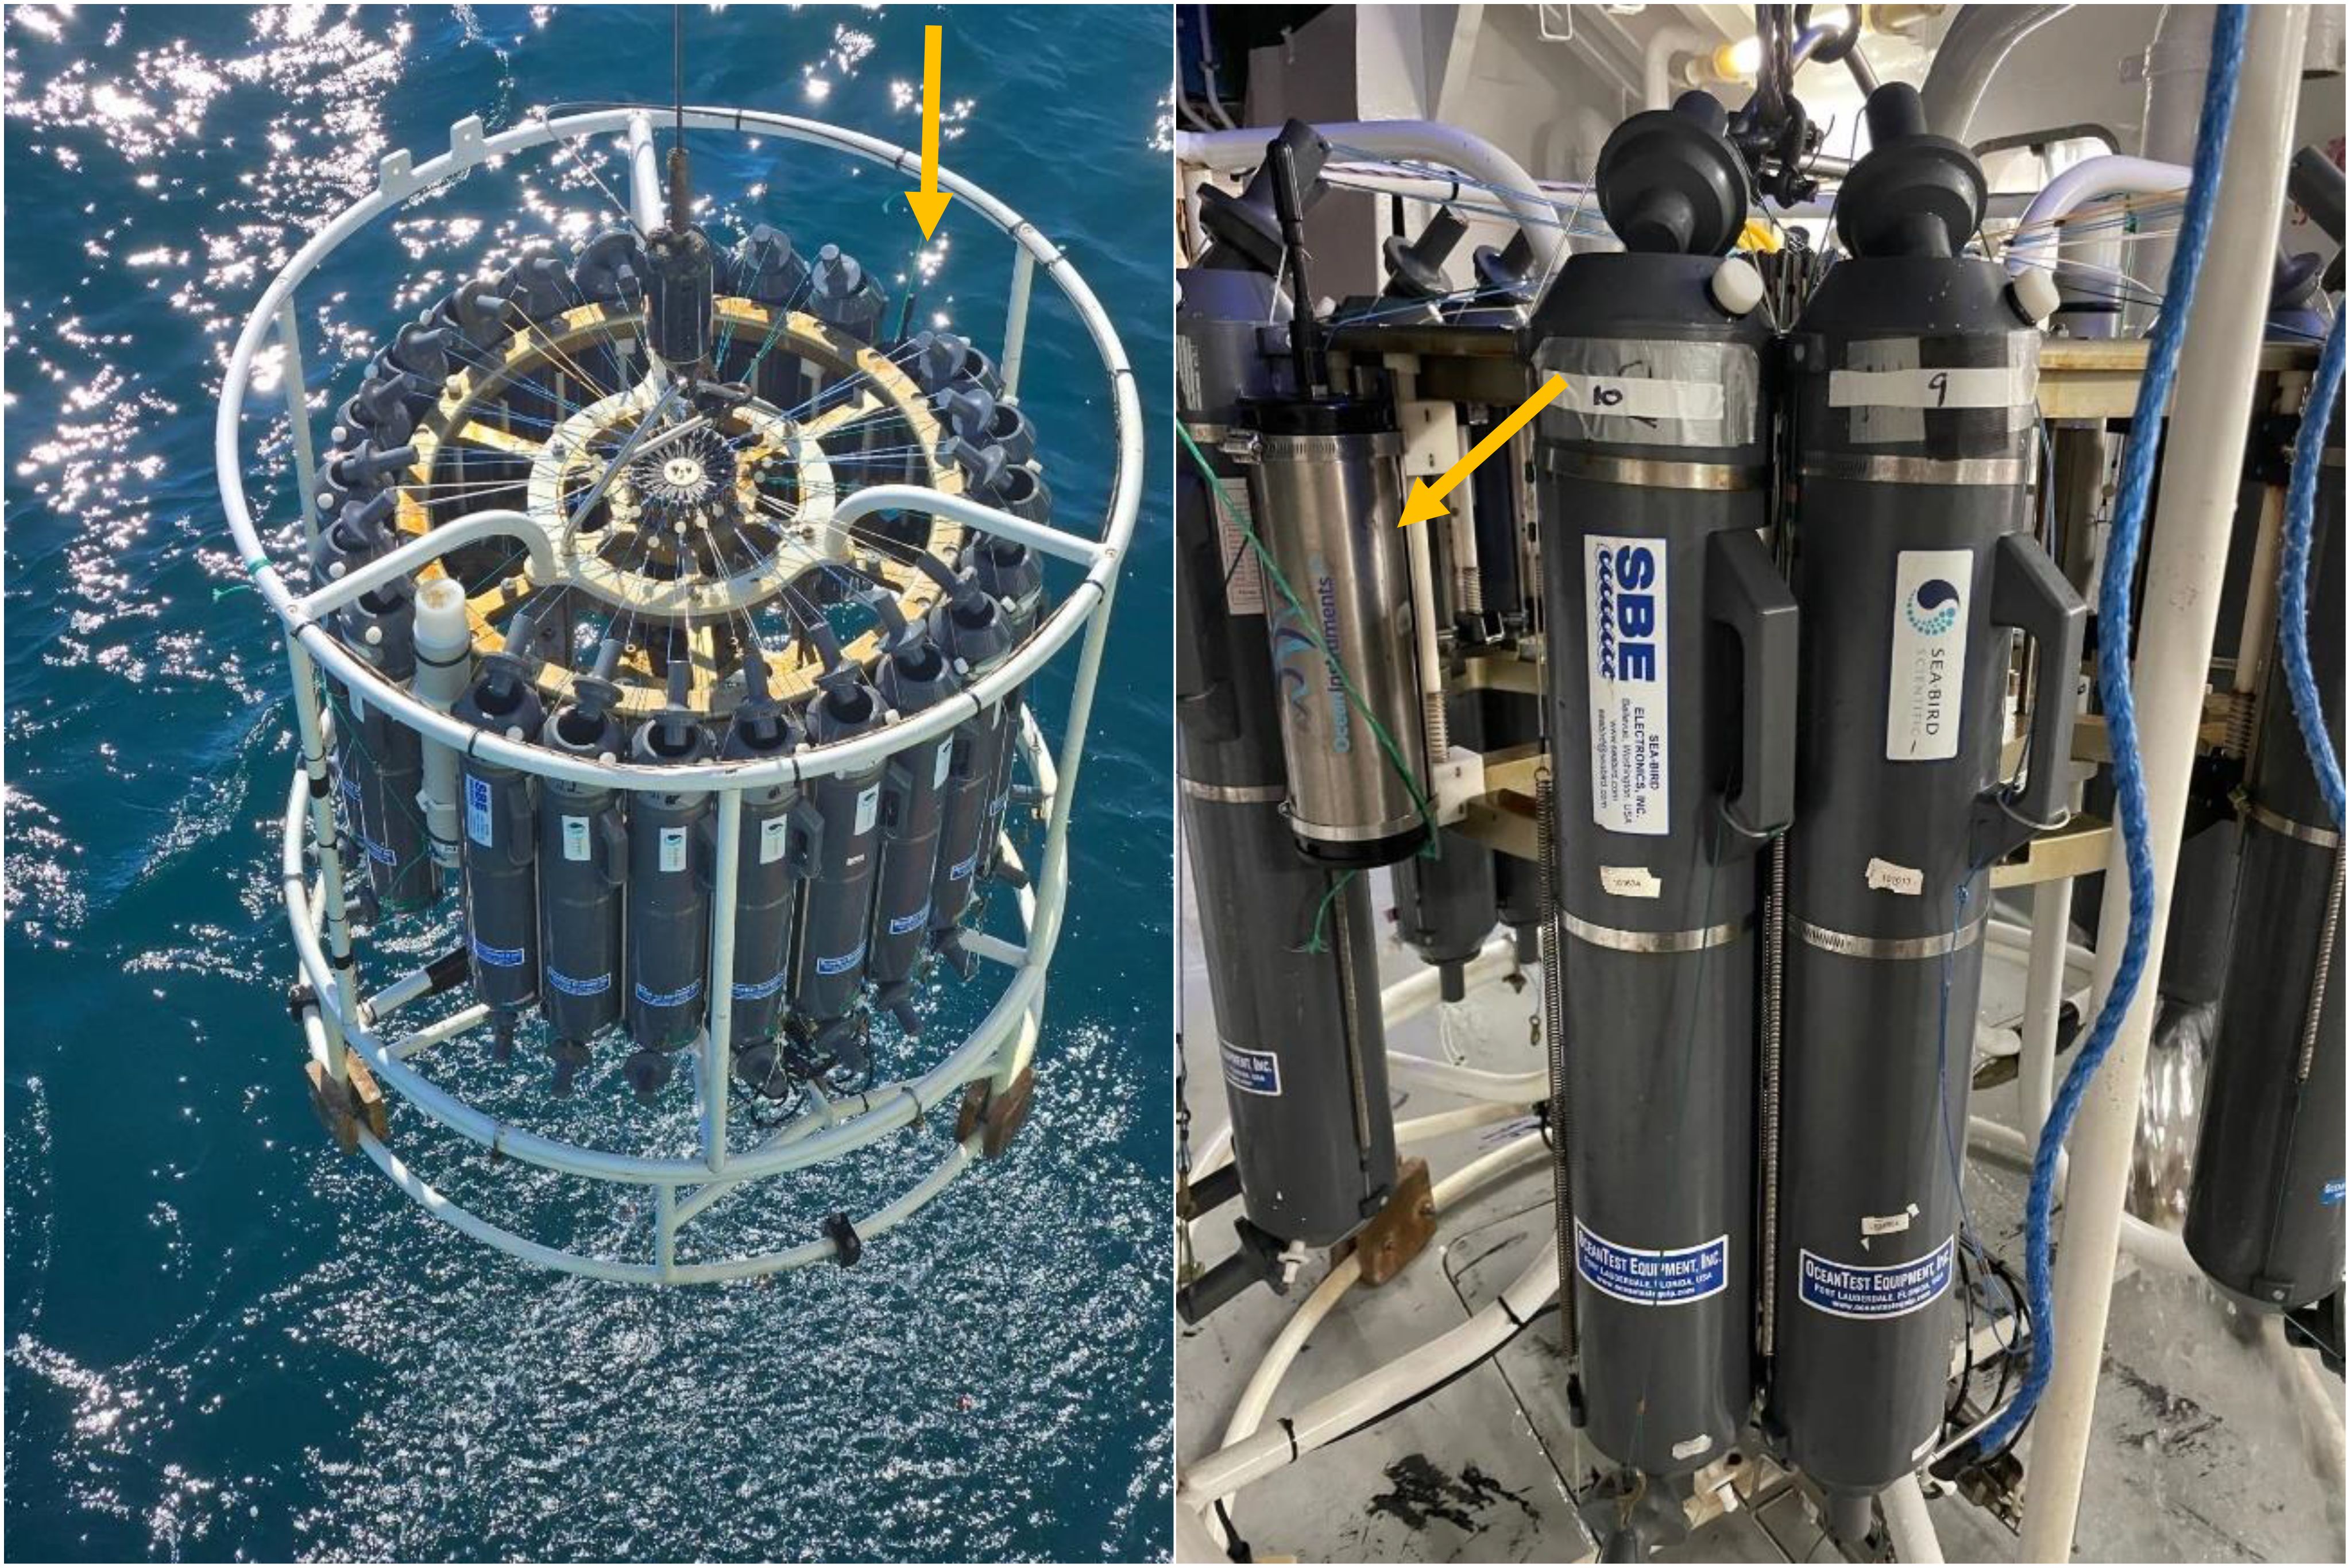
Figure 2. SoundTrap attached to the CTD rosette on board the RV Celtic Explorer. Pictures taken by Bárbara Segato Monteiro.
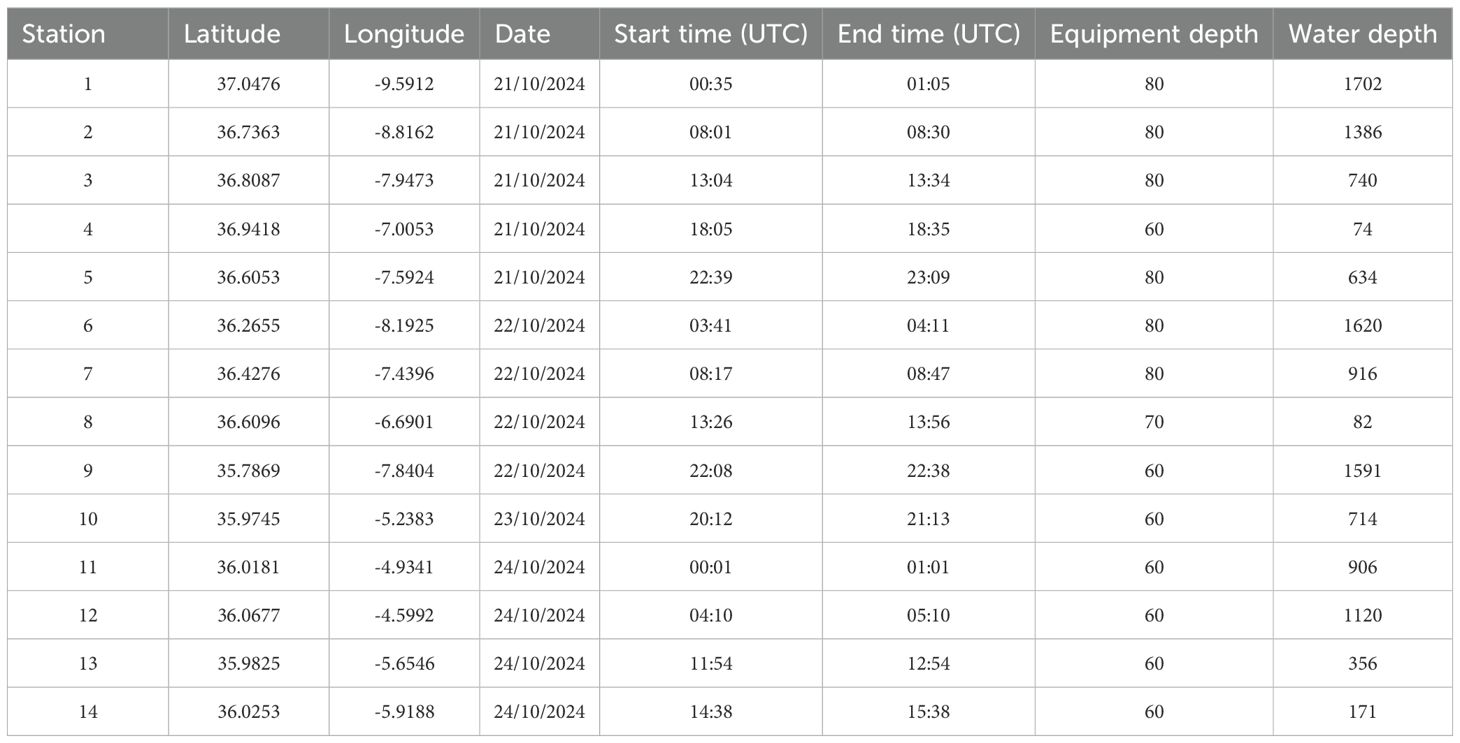
Table 1. Short-term PAM deployments using a SoundTrap during the AMIGOS survey.
The SoundTrap ST500 HF (Ocean Instruments, NZ), serial no. 5713 was paired with hydrophone no. 6089, calibrated by the manufacturer with an end-to-end sensitivity of -175 dB re. 1 V μPa. To integrate the SoundTrap into the CTD system, a Niskin bottle was removed, and the device was mounted in its place using the existing frame supports. No additional measures were taken to acoustically isolate the recorder or reduce flow-induced or mechanical noise. The device was deployed for either 30 or 60 minutes at depths of between 60 and 80 meters (Table 1), capturing broadband sound in the 0–72 kHz frequency range with a sampling rate of 144 kHz, resulting in 8.5 hours of recordings. Water depth at the recording stations ranged from 74 to 1702 m (Table 1).
2.3 Data processing and analysis
Underwater acoustic.sud files recorded by the SoundTrap were extracted as.wav files from October 21 to 24, 2024, using the SoundTrap Host software (V 4.0.23). These files were trimmed to retain only the periods when the recorder was underwater for analysis.
Ambient sound levels, expressed as Sound Pressure Levels (SPLs) in dB re 1 μPa, were quantified in 1/3-octave bands (Hanning window, 0% overlap to reduce computational time, 1-second resolution) in the statistical software RStudio (version 4.4.1, June 2024) using the third-octave level (TOL) function from the sound analysis PAMGuide package from Merchant et al. (2015) following the methodology of Van Geel et al. (2022) and similar to Laute et al. (2024).
Average SPLs were calculated for each third-octave band across the 0–48 kHz frequency range for each station (30- or 60-minute recordings). Additionally, average SPLs within the 63Hz and 125 Hz 1/3 octave bands (center frequencies) were examined further as recommended by the MSFD (Dekeling et al., 2015; Joint Research Centre, 2018). These frequency bands are commonly used to assess potential impacts on marine mammals (Merchant et al., 2012; Van Geel et al., 2022) and as a proxy for shipping noise levels (Picciulin et al., 2016; Garrett et al., 2016; Basan et al., 2021).
Spectrograms of the acoustic files were visually and aurally inspected using Raven Pro (version 1.6.5; K. Lisa Yang Center for Conservation Bioacoustics, 2016) to identify noise sources. The software settings were as follows: spectrogram brightness, contrast, and window size were set to 52, 65, and 4000, respectively, but were slightly modified when needed. The selected window type was Default 1.3 Power. Representative spectrograms for each station were generated using the R package seewave (Sueur et al., 2008), applying a window length of 4096, 90% overlap and a frequency range up to 70 kHz. Additionally, the software dBWav (version 1.3.5; Marshall Day Acoustics) was used to generate 1/3 octave band plots for selected acoustic files.
3 Results
During the AMIGOS research survey (17–31 October 2024), underwater recordings were collected at 14 stations, with 30 or 60 minutes of recordings captured at each station. Ambient sound levels were analyzed to provide short-term characterizations of the soundscape in the study area, offering initial insights into ambient noise conditions that may support future baseline assessments.
Overall, average Sound Pressure Levels (SPLs) were highest in the lower frequency bands, particularly in the 1/3 octave bands centered at between 31 and 158 Hz, with mean SPLs ranging between 107.58 and 114.54 dB re 1μPa. Similarly, high SPLs were observed in the higher frequency bands, in the 1/3 octave bands centered at 25,118 and 31,622 Hz, with mean SPLs of 111.17 and 121.53 dB re 1μPa, respectively (Figure 3).
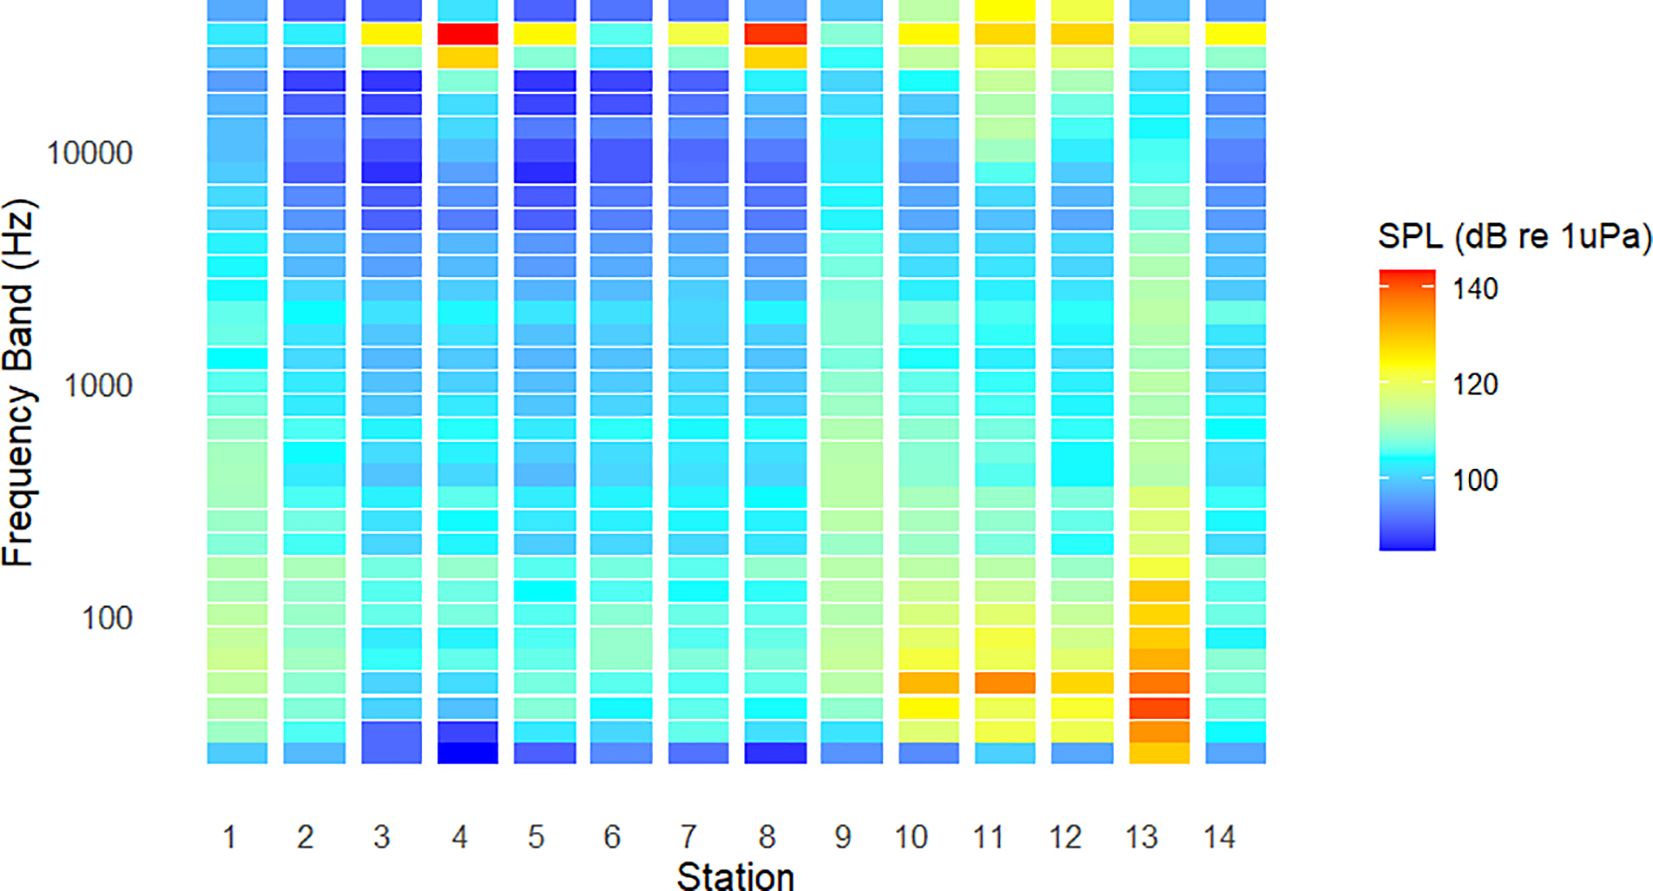
Figure 3. Spectrogram of average Sound Pressure Levels (SPLs) across 1/3 octave frequency bands per each SoundTrap recording station.
Some stations, notably Stations 9 and 13, exhibited high SPLs across most frequency bands (Figure 3). The elevated SPLs in the lower frequency rage likely correspond to shipping traffic, as the 0.01–1 kHz frequency range is commonly used for shipping noise assessments (Merchant et al., 2012; 2014).
The highest SPLs were recorded at Stations 10 to 13, located in the Strait of Gibraltar and the Alboran Sea (Figures 3 and 4).
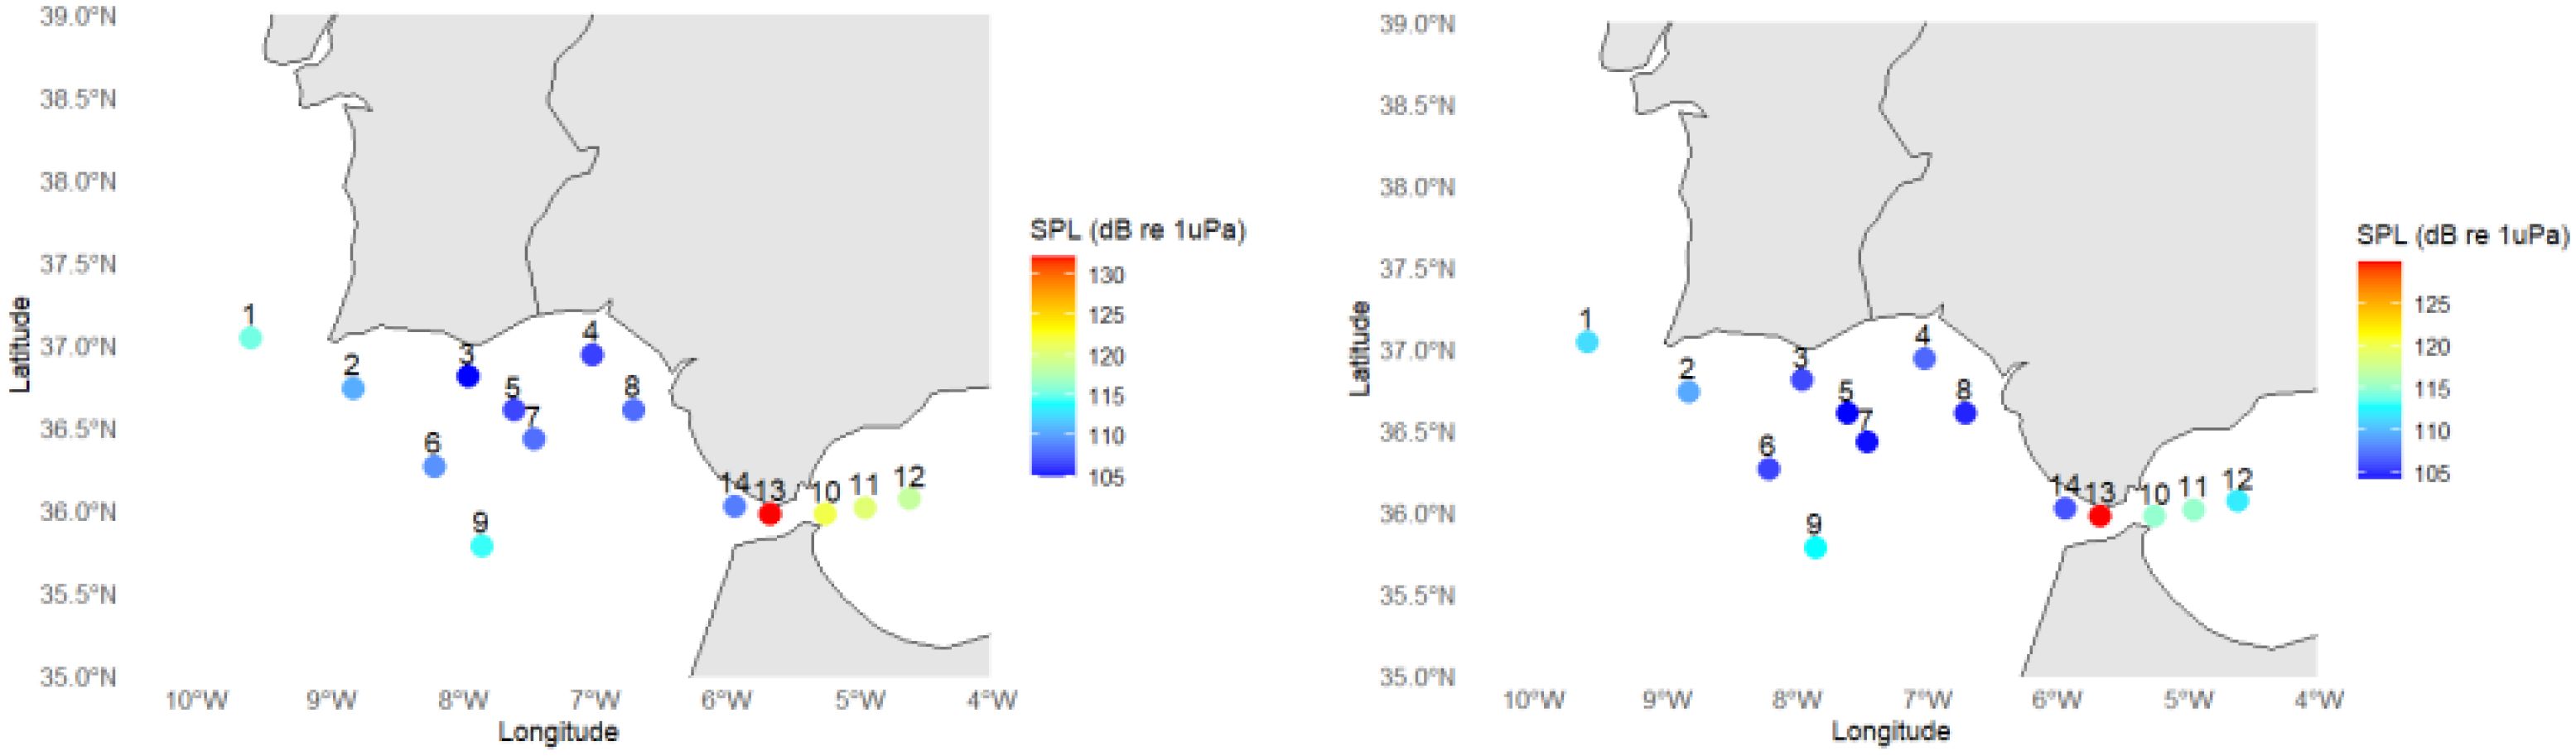
Figure 4. Maps showing average Sound Pressure Levels (SPLs) for the 63 Hz (left) and 125 Hz (right) centered frequency bands at each recording station.
Average SPLs for the 63 Hz-centered frequency band ranged from 104.91 dB re 1μPa at Station 3 to 132.24 dB re 1μPa at Station 13 (Figure 4; Table 2). Similarly, SPLs for the 125 Hz-centered frequency band ranged from 104.31 dB re 1μPa at Station 5 to 129.82 dB re 1μPa at Station 13 (Figure 4; Table 2). The highest SPLs for both 63 Hz and 125 Hz-centered 1/3 octave frequency bands were observed at Stations 10 to 13 (Figure 4; Table 2), which correspond to the section where the Strait of Gibraltar becomes narrower. This is most likely due to vessels converging as they navigate through the traffic system, intensifying the sound. Further analysis of the acoustic recordings was conducted, and frequency band statistics plots were generated for each station. These are presented as individual graphs in Appendix 1, showing the distribution of SPLs across 1/3 octave frequency bands at each of the 14 stations recorded between October 21 and 24, 2024.
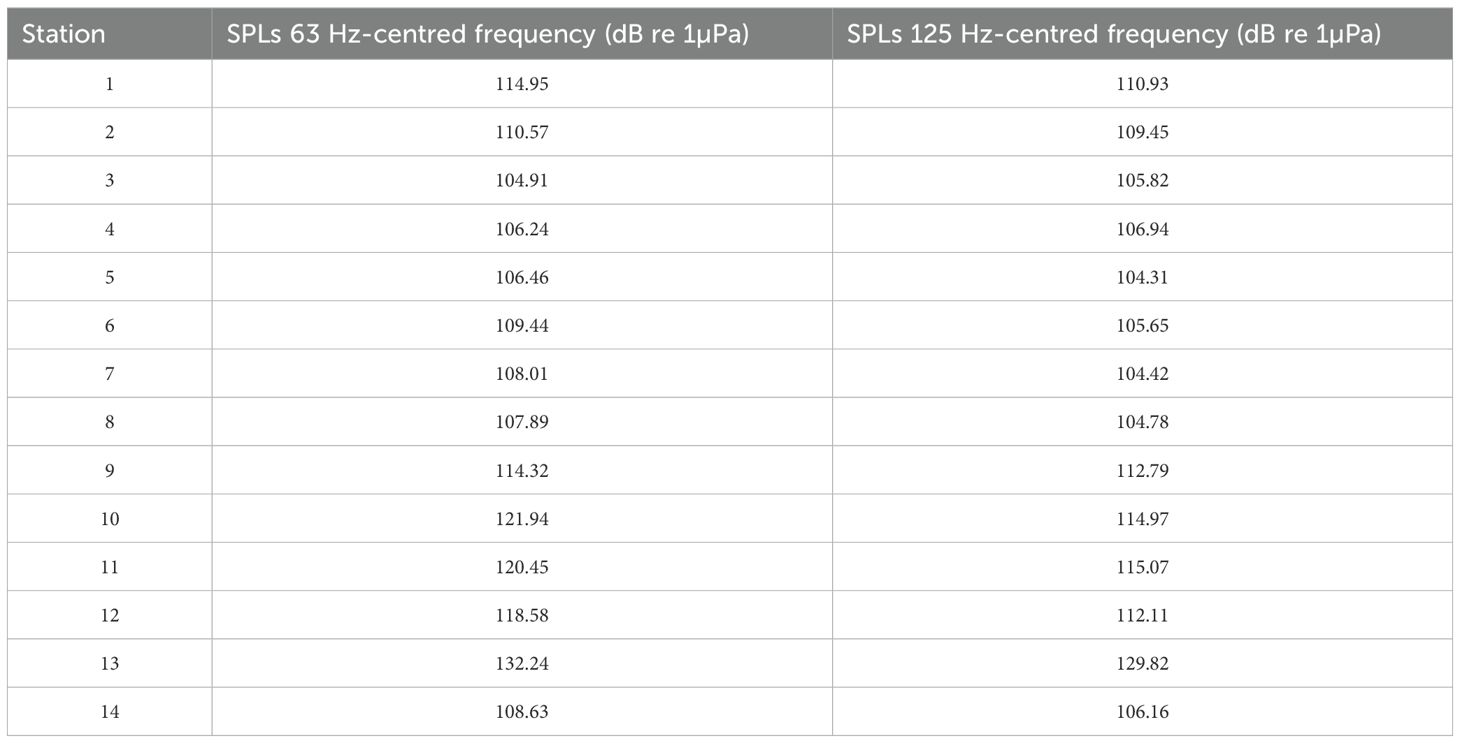
Table 2. Average Sound Pressure Levels (SPLs) for the 63 and 125 Hz-centred frequency bands at each recording station.
Manual visualization of the spectrograms for each recording station was conducted to identify noise sources and detect the presence of marine mammals (Figure 5; Table 3). The RV Celtic Explorer’s echosounders were detected at all stations, including the Kongsberg EM302 multibeam echosounder and the Skipper GDs 101 and Furuno FCV-1200l echosounders. These systems operate at a frequency of 30 kHz and 50 kHz, respectively, and appear in the spectrogram as bright, intermittent vertical streaks within these frequency ranges. The pulses are frequency-modulated chirps, with energy spreading across a narrow frequency band over time. The echosounders ping at regular intervals, which vary depending on water depth and operational settings (e.g., every 4 and 2 seconds at Station 1 and every 0.6 seconds at Station 3). While the primary energy of the 30 kHz echosounder is concentrated in the 30–34 kHz band, harmonics were also observed at higher frequencies, around 60 kHz.
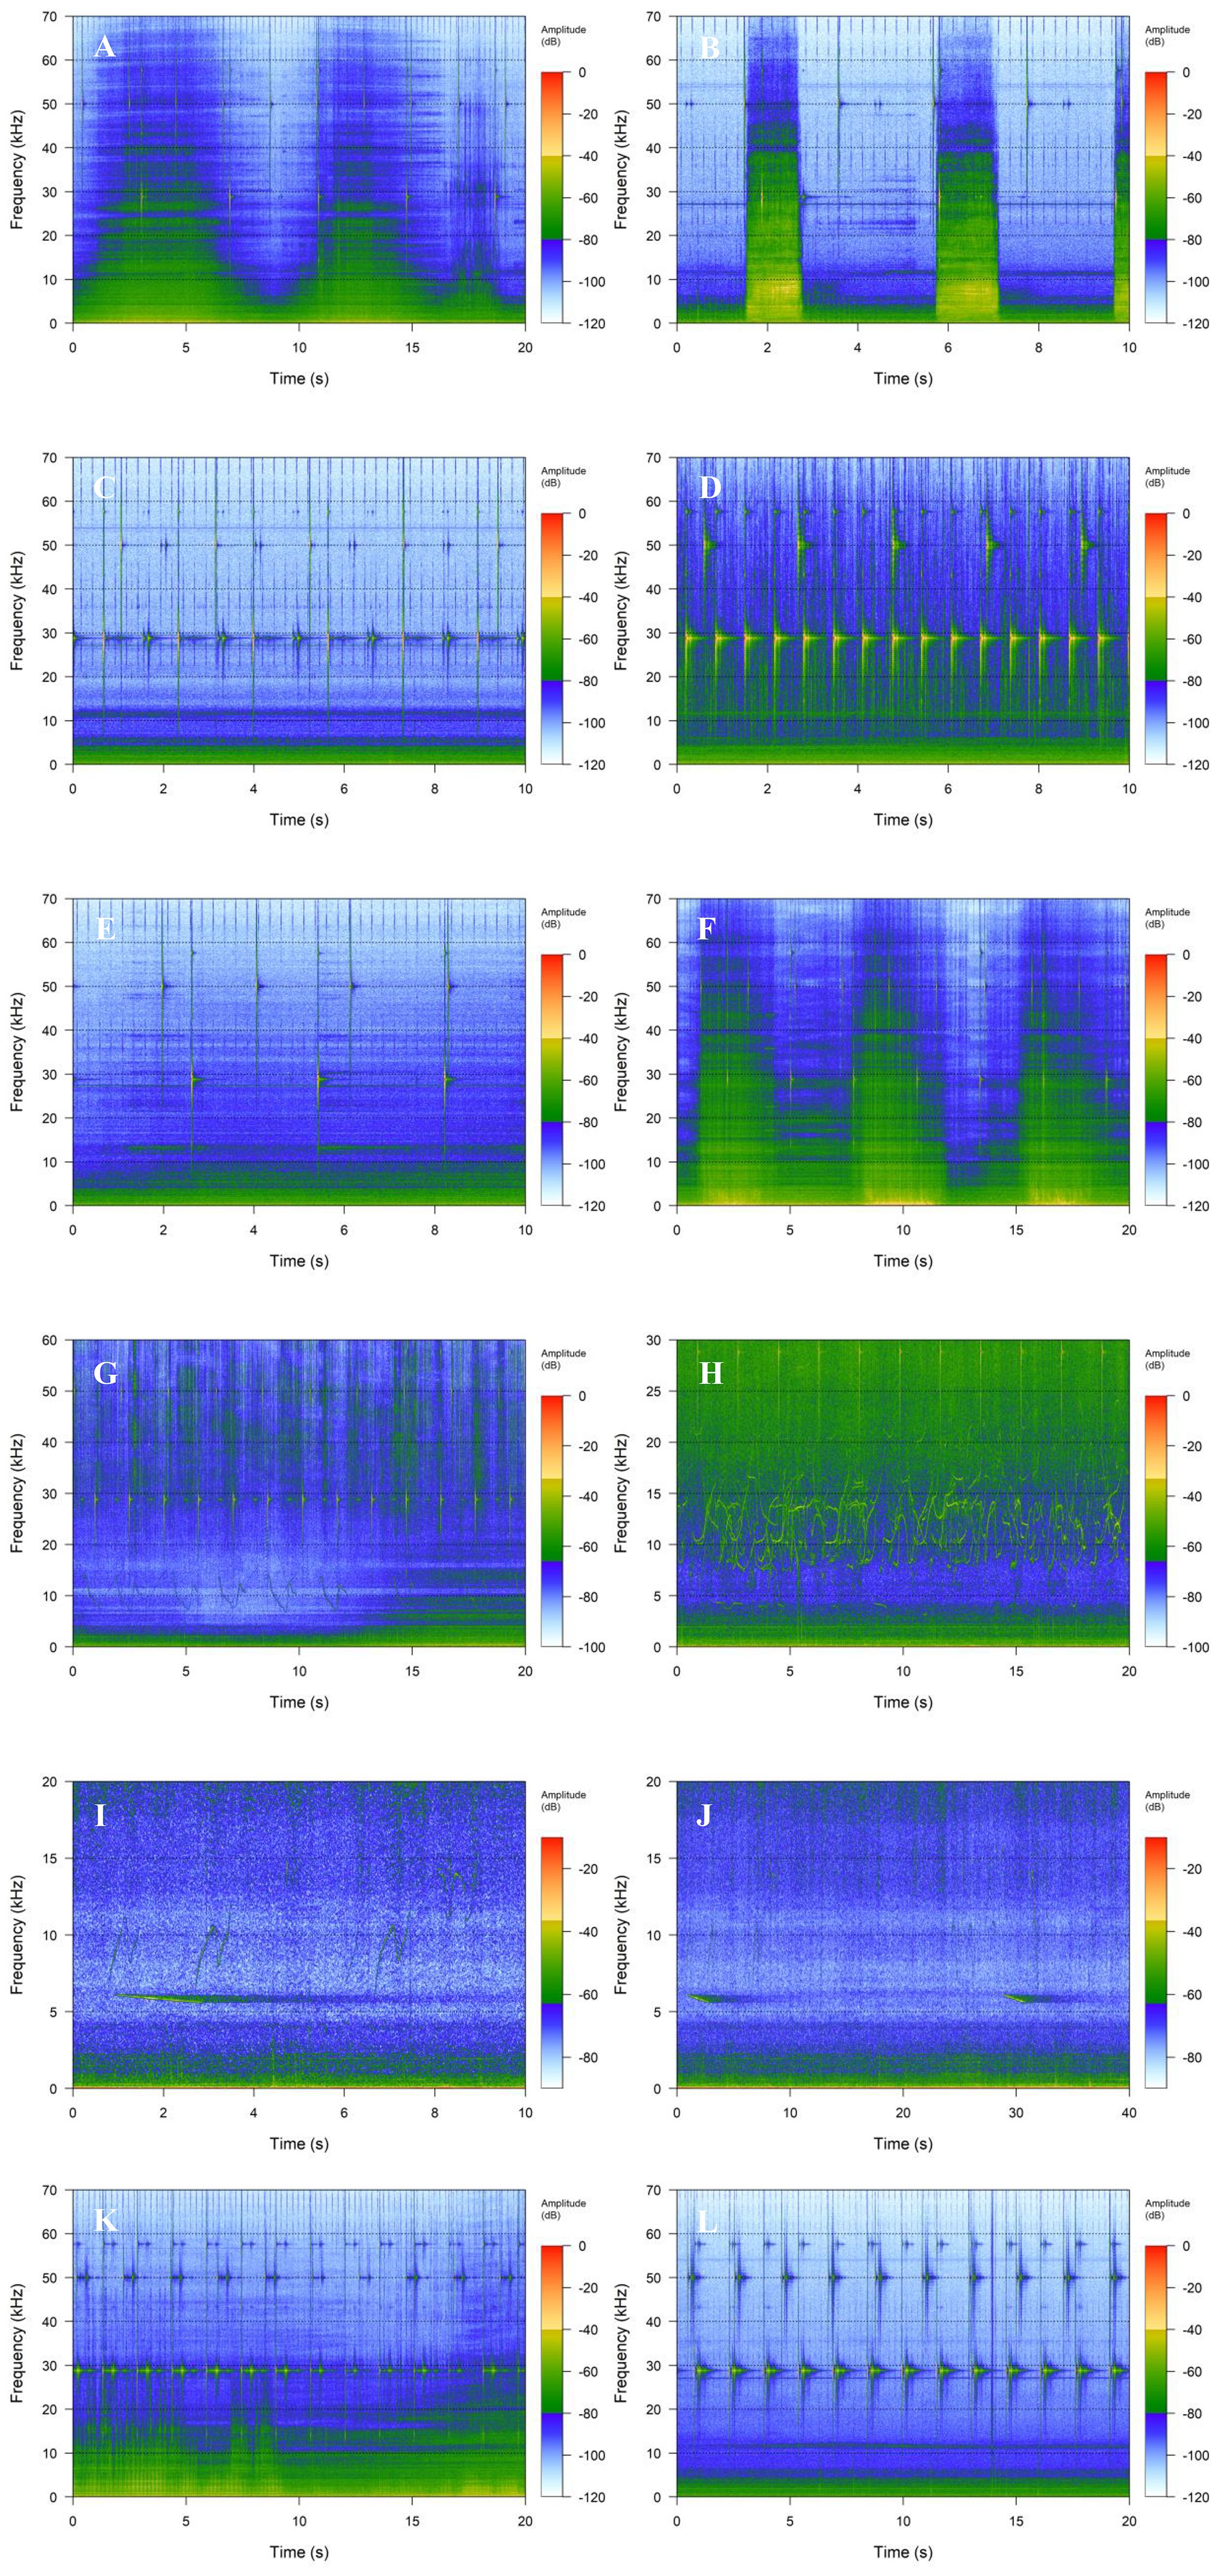
Figure 5. Examples of underwater sounds recorded at different stations in the study area, visualized using R (version 4.4.1), showing frequency in kHz over time in seconds. (A) vessel noise at Station 1; (B) unidentified anthropogenic noise at Station 2; (C), (D), and (E) vessel’s echosounders and low frequency vessel noise at Stations 3, 4, and 6; (F) unidentified broadband anthropogenic noise, likely vessel noise, at Station 9; (G) Vessel noise, vessel’s echosounders, dolphin clicks, and whistles at Station 10 (23/10/2024) during presence of common dolphins; (H) dolphin whistles at Station 11 (24/10/2024) during presence of common and striped dolphins; (I) and (J) dolphin whistles and sonar at Station 12; (K, L) vessel noise and vessel’s echosounders at Stations 13 and 14, respectively. Frequency axis may vary from picture to picture.
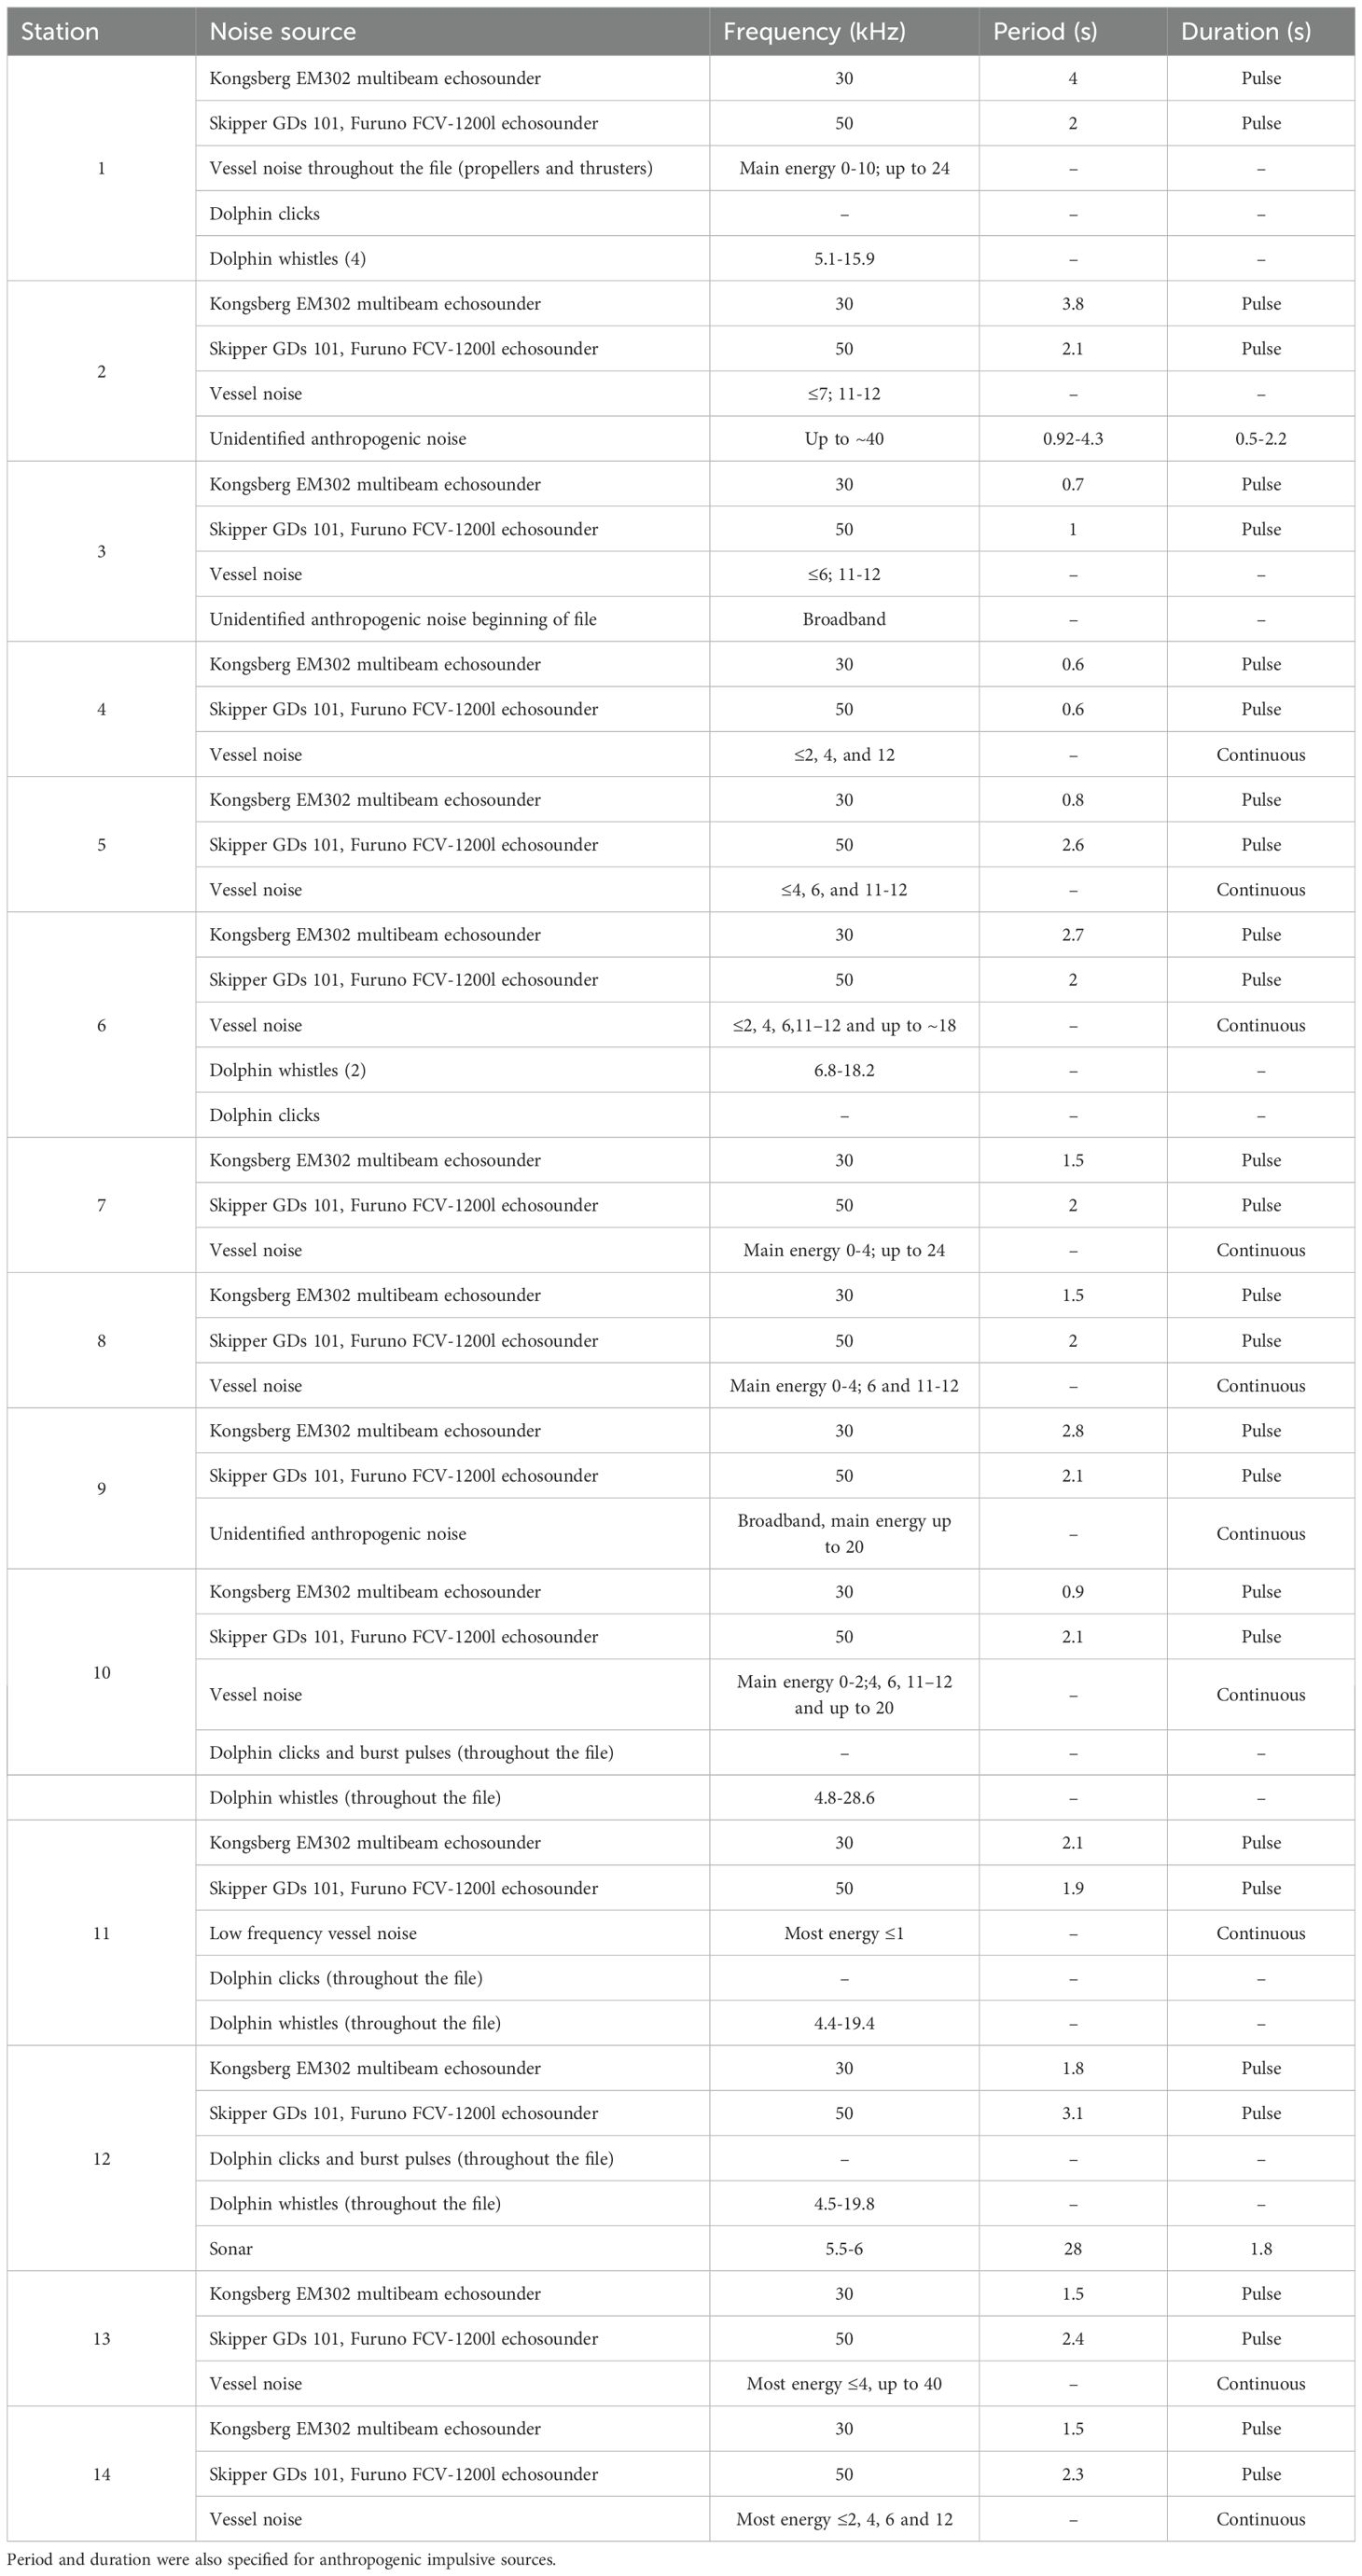
Table 3. Identified underwater noise sources at each recording station with corresponding frequency ranges.
Marine mammals were detected at 5 stations; dolphin clicks, burst pulses, and whistles were detected at Stations 1, 6, 10, 11, and 12. Visual observations confirmed the presence of common dolphins at Station 10 and both common and striped dolphins at Station 11.
Continuous vessel noise was recorded at all stations, primarily in the low-frequency range, although some extended into higher frequencies at certain stations, such as Stations 1 and 13. Additionally, mid-frequency sonar was detected at Station 12.
The soundscape at the short-term acoustic stations across the southwest and south of Portugal, the Gulf of Cadiz, and the Strait of Gibraltar was shaped by a combination of biological and anthropogenic sources. Biological sounds, including dolphin whistles, clicks, and burst pulses, were detected at 5 out of the 14 stations, often in proximity to the vessel, likely due to the animals being attracted to its presence. These signals were especially prominent and persistent throughout the recordings from Stations 11 and 12. In contrast, the dominant contributors to the soundscape at most of the other stations were anthropogenic sources, notably continuous shipping noise, as well as self-noise from the RV Celtic Explorer and its onboard echosounders. Sonar signals were also detected at Station 12. Representative spectrograms from the different stations are presented in Figure 5.
4 Discussion
This study assessed SPLs from short-term underwater acoustic recordings collected at 14 stations south of the Iberian Peninsula and identified the main noise sources. The study also assessed a methodology consisting of attaching a SoundTrap to the research vessel’s CTD rosette, which proved to be effective for capturing acoustic snapshots across a broad spatial scale during a multidisciplinary survey.
SPLs in the 63 Hz and 125 Hz-centered 1/3 octave frequency bands were computed to assess the underwater noise environment, as recommended by the MSFD Descriptor 11 (Dekeling et al., 2015; Joint Research Centre, 2018). These bands are of particular relevance because they overlap with the dominant frequencies produced by large vessel engines and propellers (Picciulin et al., 2016; Garrett et al., 2016; Basan et al., 2021). The high noise levels observed in these bands are consistent with the intense maritime traffic in the Strait of Gibraltar and adjacent areas, as previously documented (Gimeno et al., 2024), and with its designation as one of the world’s busiest maritime regions (HM Government of Gibraltar, 2015) with an average of 115,708 vessels per year (Moreno-Gutiérrez and Durán-Grados, 2023).
Average SPLs for the 63 Hz-centered frequency band varied across stations, ranging from 104.91 dB re 1μPa at Station 3 to 132.24 dB re 1μPa at Station 13 and from 104.31 dB re 1μPa at Station 5 to 129.82 dB re 1μPa at Station 13 for the 125 Hz-centered frequency band. SPLs were higher in the stations recorded in the Strait of Gibraltar and Alboran Sea, (i.e., Stations 10 to 13). These values were higher than those reported by Gimeno et al. (2024), who documented average SPLs ranging from 98.71 to 101.92 dB re 1μPa for the 63 Hz band and from 98.30 to 100.90 dB re 1μPa for the 125 Hz band. Our values are also higher than the ones reported by Castellote et al. (2012) for the Strait of Gibraltar and the Alboran Sea, where values in the 10–585 Hz range were 112.5 and 103.7 dB re 1μPa, respectively. Our values were more in accordance with Contreras Merida et al. (2024) who reported SPLs in the Bay of Gibraltar between 95 and 125 dB re 1μPa for the 63 Hz band and between 97 and 125 dB re 1μPa for the 125 Hz band. While seasonal variation in vessel traffic may partially explain the elevated levels observed during the AMIGOS survey, self-noise from the research vessel and the CTD deployment system may also have contributed to the measured SPLs. The AMIGOS survey was conducted in October, a period when good weather still prevails in the South of the Iberian Peninsula despite the end of summer. During this time, ferry traffic and recreational vessel activity remain high. Although fishing vessels in the area are most active in the winter months, their presence begins to increase in autumn (Scuderi, 2023). Given these potential sources of both anthropogenic and vessel-related noise, comparisons with long-term, autonomous monitoring efforts should be made with caution.
The intensive maritime traffic in the Strait of Gibraltar can potentially have negative effects on the cetacean species found in the area, including short-beaked common, striped, and bottlenose dolphins, long-fine pilot whales (de Stephanis et al., 2008; Bearzi et al., 2021; Verborgh and Gauffier, 2021), fin whales (Gauffier et al., 2018), sperm whales (Pirotta et al., 2021), and killer whales (Esteban et al., 2014; 2016). The first four species were detected acoustically and/or visually during this multidisciplinary survey in the Strait of Gibraltar. SPLs exceeding 120 dB re 1 μPa, which have been recorded in the Strait (Contreras Merida et al., 2024; present study), have shown to lead to behavioral changes in baleen whales (Richardson et al., 1995; Southall et al., 2007). Fin whales are known to use the Strait as a migration corridor, heading towards the Atlantic between May and July and back to the Mediterranean between November and December (Gauffier et al., 2018). Castellote et al. (2012) observed changes in the acoustic behavior of fin whales, with a reduction of their songs under shipping noise conditions in the Strait of Gibraltar. Other mysticete species, including blue, humpback, and grey whales have also been observed to alter their acoustic behavior in the presence of ship noise (Sousa-Lima et al., 2002; Melcón et al., 2012; Dahlheim and Castellote, 2016). Cavitation noise from vessels can extend to mid and high frequency bands, and some studies have shown vessel noise to mask communication delphinid species including bottlenose dolphins and short-finned pilot whales (Jensen et al., 2009), which are also present in our study area.
The soundscape at the various stations was shaped by a combination of biological and anthropogenic factors. Biological sounds, particularly dolphin whistles, clicks, and burst pulses, were detected at five of the stations, with continuous presence at Stations 10, 11, and 12. These detections suggest not only the widespread distribution of odontocetes in the area but also a potential attraction to the vessel, likely related to light or vessel activity. Despite these biological contributions, anthropogenic sources dominated the acoustic environment at most locations. Shipping noise was the most persistent and prominent, consistent with the known high maritime traffic in the region, especially through the Strait of Gibraltar. Additional anthropogenic contributions included the RV Celtic Explorer’s own self-noise and onboard echosounders, with consistent detection across all stations.
The methodological approach used in this study, deploying a SoundTrap attached to the research vessel’s CTD rosette, proved effective for the collection of short-term acoustic data and the for the assessment of the underwater soundscape. In contrast to long-term monitoring programs, which often require multiple recorders, separate missions for deployment and retrieval, licenses, and significant personnel and funding, our approach enabled rapid data collection at 14 locations within a few days of available ship-time. While this method is not suitable for long-term acoustic monitoring that captures diel and/or seasonal variability, and may not fully represent the broader acoustic environment, it provides a valuable snapshot of local soundscapes. A potential limitation of this approach is that effective PAM recordings require the vessel to remain stationary during CTD operations, typically for 30–60 minutes, which may not always be feasible depending on operational constraints. Additionally, recordings from a research vessel introduce some degree of self-noise. Nevertheless, this method offers a complementary tool for expanding spatial coverage and can be particularly useful in under-sampled or resource-constrained situations, allowing for the collection of acoustic data from platforms of opportunity. This study provides updated short-term measurements of underwater noise levels in southern Iberian waters and demonstrates the value of integrating acoustic monitoring with oceanographic operations. The findings contribute to ongoing efforts under the MSFD Descriptor 11 assessments and for broader marine spatial planning initiatives aimed at mitigating acoustic impacts on marine animals in one of Europe’s busiest maritime routes.
Data availability statement
The raw data supporting the conclusions of this article will be made available by the authors, without undue reservation.
Ethics statement
Ethical approval was not required for the study involving animals in accordance with the local legislation and institutional requirements because it was not needed. Non-invasive Passive Acoustic Monitoring techniques were used.
Author contributions
MP: Software, Methodology, Formal Analysis, Data curation, Investigation, Funding acquisition, Conceptualization, Writing – original draft. JO’B: Data curation, Conceptualization, Investigation, Methodology, Project administration, Supervision, Funding acquisition, Resources, Writing – review & editing.
Funding
The author(s) declare financial support was received for the research and/or publication of this article. Ship-time on board the RV Celtic Explorer to conduct the AMIGOS survey (Acoustic Monitoring from Ireland to Gibraltar Oceanic waters Survey) was funded under the Marine Institute’s 2024 Ship-Time Programme. The AMIGOS survey served as a platform for data collection as part of the four-year STRAITS project (Strategic Infrastructure for improved animal Tracking in European Seas), funded under the EU’s Horizon research and innovation programme (https://www.europeantrackingnetwork.org/en/straits). Publication costs were supported by the Networking & Marine Research Communication Awards, funded by the Marine Institute under the Marine Research Programme with the support of the Government of Ireland.
Acknowledgments
We would like to thank Ian Murphy (P&O Maritime), Pádraic Mac Donnacha, Bárbara Segato Monteiro, and Ankit Swaraj (University of Galway) for their technical support and assistance during the SoundTrap deployments at sea.
Conflict of interest
The authors declare that the research was conducted in the absence of any commercial or financial relationships that could be construed as a potential conflict of interest.
Generative AI statement
The author(s) declare that no Generative AI was used in the creation of this manuscript.
Any alternative text (alt text) provided alongside figures in this article has been generated by Frontiers with the support of artificial intelligence and reasonable efforts have been made to ensure accuracy, including review by the authors wherever possible. If you identify any issues, please contact us.
Publisher’s note
All claims expressed in this article are solely those of the authors and do not necessarily represent those of their affiliated organizations, or those of the publisher, the editors and the reviewers. Any product that may be evaluated in this article, or claim that may be made by its manufacturer, is not guaranteed or endorsed by the publisher.
Supplementary material
The Supplementary Material for this article can be found online at: https://www.frontiersin.org/articles/10.3389/fmars.2025.1655366/full#supplementary-material
References
Aguilar Soto N., Johnson M., Madsen P. T., Tyack P. L., Bocconcelli A., and Fabrizio Borsani J. (2006). Does intense ship noise disrupt foraging in deep-diving Cuvier’s beaked whales (Ziphius cavirostris)? Mar. Mammal. Sci. 22, 690–699. doi: 10.1111/j.1748-7692.2006.00044.x
Basan F., Fischer J. G., and Kühnel D. (2021). Soundscapes in the German Baltic Sea before and during the COVID-19 Pandemic. Front. Mar. Sci. 8. doi: 10.3389/fmars.2021.689860
Bearzi G., Genov T., Natoli A., Gonzalvo J., and Pierce G. J. (2021). Delphinus delphis (Inner Mediterranean subpopulation). The IUCN Red List of Threatened Species 2021. doi: 10.2305/IUCN.UK.2021-3.RLTS.T189865869A189865884.en
Berrow S. D., O’Brien J., Meade R., Delarue J., Kowarski K., Martin B., et al. (2018). Acoustic Surveys of Cetaceans in the Irish Atlantic Margin in 2015–2016: Occurrence, distribution and abundance. 348, Department of Communications, Climate Action & Environment and the National Parks and Wildlife Service (NPWS), Department of Culture, Heritage and the Gaeltacht, Dublin, Ireland.
Cañadas A. and Vázquez J. A. (2014). Conserving Cuvier’s beaked whales in the Alboran Sea (SW Mediterranean): Identification of high density areas to be avoided by intense man-made sound. Biol. Conserv. 178, 155–162. doi: 10.1016/j.biocon.2014.07.018
Castellote M., Clark C. W., and Lammers M. O. (2012). Acoustic and behavioural changes by fin whales (Balaenoptera physalus) in response to shipping and airgun noise. Biol. Conserv. 147, 115–122. doi: 10.1016/j.biocon.2011.12.021
Contreras Merida M. R., Merchant N. D., Warr S., and Dissanayake A. (2024). Underwater Noise in the Bay of GIBRALTAR. doi: 10.2139/ssrn.4711787
Dahlheim M. and Castellote M. (2016). Changes in the acoustic behavior of gray whales Eschrichtius robustus in response to noise. Endanger. Species Res. 31, 227–242. doi: 10.3354/esr00759
Dekeling R., Tasker M., Ainslie M., Andersson M., André M., Borsani J., et al. (2015). The european marine strategy: noise monitoring in european marine waters from 2014. Adv. Exp. Med. Biol. 875, 205–215. doi: 10.1007/978-1-4939-2981-8_24
de Stephanis R., Cornulier T., Verborgh P., Sierra J. S., Gimeno N. P., and Guinet C. (2008). Summer spatial distribution of cetaceans in the Strait of Gibraltar in relation to the oceanographic context. Mar. Ecol. Prog. Ser. 353, 275–288. doi: 10.3354/meps07164
Duarte C. M., Chapuis L., Collin S. P., Costa D. P., Devassy R. P., Eguiluz V. M., et al. (2021). The soundscape of the anthropocene ocean. Science 371, eaba4658. doi: 10.1126/science.aba4658
Erbe C., Marley S. A., Schoeman R. P., Smith J. N., Trigg L. E., and Embling C. B. (2019). The effects of ship noise on marine mammals—a review. Front. Mar. Sci. 6. doi: 10.3389/fmars.2019.00606
Esteban R., Verborgh P., Gauffier P., Alarcón D., Salazar-Sierra J. M., Giménez J., et al. (2016). Conservation status of killer whales, Orcinus orca, in the Strait of Gibraltar. Adv. Mar. Biol. 75, 141–172. doi: 10.1016/bs.amb.2016.07.001
Esteban R., Verborgh P., Gauffier P., Giménez J., Afán I., Cañadas A., et al. (2014). Identifying key habitat and seasonal patterns of a critically endangered population of killer whales. J. Mar. Biol. Assoc. UK 94, 1317–1325. doi: 10.1017/S002531541300091X
Garrett J. K., Blondel P., Godley B. J., Pikesley S. K., Witt M. J., and Johanning L. (2016). Long-term underwater sound measurements in the shipping noise indicator bands 63 Hz and 125 Hz from the port of Falmouth Bay, UK. Mar. pollut. Bull. 110, 438–448. doi: 10.1016/j.marpolbul.2016.06.021
Gauffier P., Verborgh P., Giménez J., Esteban R., Sierra J. M. S., and de Stephanis R. (2018). Contemporary migration of fin whales through the Strait of Gibraltar. Mar. Ecol. Prog. Ser. 588, 215–228. doi: 10.3354/meps12449
Gimeno N. P., Arroyo G. M., Ancela J. L. C., and de la Cruz A. (2024). CETÁCEOS Y PAISAJES SONOROS MARINOS EN EL ESTRECHO DE GIBRALTAR: RESULTADOS PRELIMINARES DEL “PROYECTO SEANIMALMOVE”/CETACEANS AND MARINE SOUNDSCAPES IN THE STRAIT OF GIBRALTAR: PRELIMINARY RESULTS OF THE “SEANIMALMOVE PROJECT”. ID106.pdf.
Gordon J., Gillespie D., Potter J., Frantzis A., Simmonds M. P., Swift R., et al. (2003). A review of the effects of seismic surveys on marine mammals. Mar. Technol. Soc. J. 37, 16–34. doi: 10.4031/002533203787536998
Hildebrand J. A. (2009). Anthropogenic and natural sources of ambient noise in the ocean. Mar. Ecol. Prog. Ser. 395, 5–20. doi: 10.3354/meps08353
HM Government of Gibraltar (2015). Monitoring Programme for British GIBRALTAR Territorial Waters: Marine Strategy Framework Directive. Available online at: https://www.Gibraltar.gov.gi/new/sites/default/files/HMGoG_Documents/MSFD_Marine_Monitoring_Programme.pdf (Accessed September 1, 2025).
Hooker S. K., Aguilar De Soto N., Baird R. W., Carroll E. L., Claridge D., Feyrer L., et al. (2018). Future directions in research on beaked whales. Front. Mar. Sci. 5. doi: 10.3389/fmars.2018.00514
IUCN (2023). The conservation status of cetaceans in the Mediterranean Sea: trends and changes after a decade of conservation efforts (Gland, Switzerland: IUCN). RL-262-005-En.pdf.
Jensen F. H., Bejder L., Wahlberg M., Soto N. A., Johnson M., and Madsen P. T. (2009). Vessel noise effects on delphinid communication. Mar. Ecol. Prog. Ser. 395, 161–175. doi: 10.3354/meps08204
Joint Research Centre (2018). Marine Strategy Framework Directive - Descriptor 11: Underwater noise. European Commission. Available online at: https://publications.jrc.ec.europa.eu/repository/bitstream/JRC124922/msfd_d11_jrc_review_ms_2018_reports_eur30676en.pdf (Accessed September 1, 2025).
K. Lisa Yang Center for Conservation Bioacoustics (2016). RavenPro: Interactive Sound Analysis Software (Ithaca, NY: The Cornell Lab of Ornithology).
Laute A., Grove T. J., Stoller A. M., Smith A., and Fournet M. E. (2024). Characterizing the underwater soundscape at the site of a proposed port in northeast Iceland. Mar. pollut. Bull. 209, 117072. doi: 10.1016/j.marpolbul.2024.117072
Malakoff D. (2010). A push for quieter ships. Science 328, 1502–1503. doi: 10.1126/science.328.5985.1502
Melcón M. L., Cummins A. J., Kerosky S. M., Roche L. K., Wiggins S. M., and Hildebrand J. A. (2012). Blue whales respond to anthropogenic noise. PloS One 7, e32681. doi: 10.1371/journal.pone.0032681
Merchant N. D., Fristrup K. M., Johnson M. P., Tyack P. L., Witt M. J., Blondel P., et al. (2015). Measuring acoustic habitats. Methods Ecol. Evol. 6, 257–265. doi: 10.1111/2041-210X.12330
Merchant N. D., Pirotta E., Barton T. R., and Thompson P. M. (2014). Monitoring ship noise to assess the impact of coastal developments on marine mammals. Mar. pollut. Bull. 78, 85–95. doi: 10.1016/j.marpolbul.2013.10.058
Merchant N. D., Witt M. J., Blondel P., Godley B. J., and Smith G. H. (2012). Assessing sound exposure from shipping in coastal waters using a single hydrophone and Automatic Identification System (AIS) data. Mar. pollut. Bull. 64, 1320–1329. doi: 10.1016/j.marpolbul.2012.05.004
Moreno-Gutiérrez J. and Durán-Grados V. (2023). Towards the declaration of the strait of Gibraltar as an environmental controlled area. Mar. pollut. Bull. 192, 115042. doi: 10.1016/j.marpolbul.2023.115042
Newhall A. E., Lin Y. T., Miller J. F., Potty G. R., Vigness-Raposa K., Frankel A., et al. (2016). Monitoring the acoustic effects of pile driving for the first offshore wind farm in the United States. J. Acoust. Soc. Am. 139, 2181–2181. doi: 10.1121/1.4950483
Picciulin M., Sebastianutto L., Fortuna C. M., Mackelworth P., Holcer D., and Gospić N. R. (2016). “Are the 1/3-octave band 63-and 125-Hz noise levels predictive of vessel activity? The case in the Cres–Lošinj archipelago (Northern Adriatic Sea, Croatia),” in The effects of noise on aquatic life II (Springer, New York), 821–828. doi: 10.1007/978-1-4939-2981-8_101
Pirotta E., Carpinelli E., Frantzis A., Gauffier P., Lanfredi C., Pace D. S., et al. (2021). Physeter macrocephalus (Mediterranean subpopulation). The IUCN Red List of Threatened Species 2021. doi: 10.2305/IUCN.UK.2021-3.RLTS.T16370739A50285671.en
Richardson W. J., Greene C. R. J., Malme C. I., and Thomson D. H. (1995). Marine Mammals and Noise (San Diego: Academic Press).
Rojo–Nieto E., Álvarez–Díaz P. D., Morote E., Burgos–Martín M., Montoto–Martínez T., Sáez–Jiménez J., et al. (2011). Strandings of cetaceans and sea turtles in the Alboran Sea and Strait of Gibraltar: a long–term glimpse at the north coast (Spain) and the south coast (Morocco). Anim. Biodivers. Conserv. 34, 151–163. doi: 10.32800/abc.2011.34.0151
Scuderi A. (2023). Integrated coastal and ocean management of areas hosting marine mammals a case study in the strait of Gibraltar (Doctoral dissertation). Available online at: https://rodin.uca.es/handle/10498/29223 (Accessed September 1, 2025).
Sousa-Lima R. S., Morete M. E., Fortes R. C., Freitas A. C., and Engel M. H. (2002). Impact of boats on the vocal behavior of humpback whales off Brazil. J. Acoust. Soc. Am. 112, 2430–2431. doi: 10.1121/1.4779974
Southall B. L., Bowles A. E., Ellison W. T., Finneran J. J., Gentry R. L., Green C. R. Jr., et al. (2007). Marine mammal noise exposure criteria: initial scientific recommendations. Aquat. Mamm. 33, 1–522. doi: 10.1080/09524622.2008.9753846
Sueur J., Aubin T., and Simonis C. (2008). Seewave, a free modular tool for sound analysis and synthesis. Bioacoustics 18, 213–226. doi: 10.1080/09524622.2008.9753600
Van Geel N. C., Risch D., Benjamins S., Brook T., Culloch R. M., Edwards E. W., et al. (2022). Monitoring cetacean occurrence and variability in ambient sound in Scottish offshore waters. Front. Remote Sens. 3. doi: 10.3389/frsen.2022.934681
Keywords: passive acoustic monitoring (PAM), sound pressure levels (SPL), soundscape, anthropogenic noise, Strait of Gibraltar
Citation: Perez Tadeo M and O’Brien J (2025) Underwater noise levels in the Strait of Gibraltar and surrounding waters: findings from the AMIGOS survey. Front. Mar. Sci. 12:1655366. doi: 10.3389/fmars.2025.1655366
Received: 27 June 2025; Accepted: 15 August 2025;
Published: 09 September 2025.
Edited by:
Tomaso Gaggero, University of Genoa, ItalyReviewed by:
Antonio Petrizzo, National Research Council (CNR), ItalyWalter Zimmer, NATO Centre for Maritime Research and Experimentation, Italy
Copyright © 2025 Perez Tadeo and O’Brien. This is an open-access article distributed under the terms of the Creative Commons Attribution License (CC BY). The use, distribution or reproduction in other forums is permitted, provided the original author(s) and the copyright owner(s) are credited and that the original publication in this journal is cited, in accordance with accepted academic practice. No use, distribution or reproduction is permitted which does not comply with these terms.
*Correspondence: Maria Perez Tadeo, bWFyaWEucGVyZXp0YWRlb0BhdHUuaWU=