 Grace Ann Tuthill-Christensen
 Michelle J. Jungbluth
 Karen D. Crow
- 1San Francisco State University, San Francisco, CA, United States
- 2Estuary and Ocean Science Center, San Francisco State University, Tiburon, CA, United States
Reef mantas (Mobula alfredi) around the Hawaiian Islands are vulnerable to extinction due to the low genetic diversity and resident populations that exhibit limited migration between islands. While known resident populations occur off Maui and Hawai’i, little is known about their occurrence or distribution around O’ahu or other islands across the archipelago, partly due to the rarity of sightings using conventional methods such as photo or drone surveys. This is the first study to characterize patterns of mobulid distribution, habitat usage, and prey assemblage around O’ahu using environmental DNA (eDNA). We employed a novel quantitative polymerase chain reaction (qPCR) approach using plankton net samples to quantify manta eDNA and detected both spatial and temporal variation in manta eDNA distribution around O’ahu, with most detections occurring off the East Shore of O’ahu, in Kane’ohe Bay. We also detected reef mantas off the West and North shores of O’ahu with no detections in the South, where human activity is the highest. We observed increased occupancy in summer/early fall and no detections from late fall to early winter across sites. There were no significant differences in plankton assemblage or abundance associated with manta presence, consistent with insights indicating that mantas primarily feed on offshore mesopelagic assemblages. Applying our plankton-net-based eDNA sampling and qPCR assay represents a non-invasive, viable, and effective approach for tracking patterns in reef manta distribution that is independent from biases associated with physical sightings of these elusive and vulnerable animals.
1 Introduction
Mobulids (Mobulidae, including manta rays and devil rays) face significant conservation challenges due to their slow reproductive rates and declining populations. These species are particularly vulnerable to extinction because of life history characteristics including slow maturation and low fecundity, making them highly susceptible to decreasing population sizes (Holden, 1974; Stevens, 2016). Females typically give birth to a single pup every 2–5 years (Marshall and Bennett, 2010; Stewart et al., 2018). As a result, mobulid rays are considered to have the lowest fecundity of any chondrichthyan (Pardo et al., 2016). They are vulnerable to anthropogenic threats including boat strikes, entanglement, and tourism (Deakos et al., 2011), as well as impacts of climate change, such as rising sea surface temperatures, which affect food availability. Climate change can alter the abundance and composition of algae (Moore et al., 2008; Okuhata et al., 2023), which disrupts plankton assemblages and abundance (Hooff and Peterson, 2006) that manta rays rely on for food, directly impacting their habitat, reproduction, and survival. We define plankton assemblage as species composition and abundance. Understanding variation in spatial and temporal distribution of manta rays is increasingly urgent, as climate change and other stressors are rapidly altering their habitat quality and availability. Climate-induced changes, such as increasing number of coral bleaching events (Ford et al., 2024), are already affecting key habitats. Therefore, to effectively protect mobulids, it is necessary to identify and conserve important habitats throughout their range (Stewart et al., 2018; Harris et al., 2020).
Mobulids that occur in nearshore environments off Hawaii are primarily considered to be the reef manta (Mobula alfredi) based on distribution, habitat preferences, and population status. Couturier et al. (2012) suggest that only three mobulid species occur in Hawaii, namely, M. alfredi, M. birostris, and M. mobular. However, the International Union for Conservation of Nature (IUCN) indicates that five mobulid species could occur in Hawaii: M. alfredi, M. birostris, M. mobular, M. tarapacana, and M. thurstoni. Importantly, all of those species except M. alfredi are listed as endangered (IUCN red list, M. birostris, M. mobular, M. tarapacana, and M. thurstoni), indicating their declining population status. Furthermore, the State of Hawai’i Division of Aquatic Resources (https://dlnr.hawaii.gov/) only lists M. alfredi and M. birostris, and of 12,411 dives conducted in Hawaiian waters over 19 years, there were only 287 manta sightings of M. alfredi/M. birostris (not differentiated) with zero sightings of M. tarapacana or M. mobular (Ward-Paige et al., 2013). Finally, there are few studies on mobulids in nearshore Hawaiian habitats, and they are focused exclusively on M. alfredi, with no reported sightings of the oceanic/pelagic manta, M. birostris, which could be attributed to their primarily pelagic distribution with long offshore migrations in deeper waters (Deakos et al., 2011; Deakos, 2012; Whitney et al., 2023). Taken together, these data suggest that the most common mobulid species occurring in nearshore Hawaiian waters is M. alfredi.
In the Hawaiian Islands, there are two well-characterized, stable aggregations of reef mantas off Maui (Deakos et al., 2011; Deakos, 2012; Whitney et al., 2023) and the big island of Hawai’i (https://www.mantapacific.org); however, it is currently unknown whether any stable populations occur off O’ahu. While there are occasional sightings of reef mantas, currently nothing is known about patterns in temporal or spatial distribution around O’ahu. While individual reef mantas could migrate between islands, they are known to maintain high site fidelity off Maui and Hawai’i Island with low inter-island migration (Deakos et al., 2011; Whitney et al., 2023). Furthermore, high level of residency was found in a population in the Maldives (Harris et al., 2024). Low migration rates and small population sizes compound existing threats from anthropogenic impacts, and of the Hawaiian Islands, O’ahu has the largest human population and greatest levels of tourism with documented negative effects on reef mantas (Deakos, 2012).
Environmental DNA (eDNA) is a relatively new technology that has the potential to detect species that are challenging to study by conventional methods. For example, cartilaginous fishes (including manta rays) do not breathe air like marine mammals or sea turtles; therefore, surface intervals occur sporadically, and visual surveys are inadequate for inferring patterns of distribution. Recent studies using eDNA have been successful in accurately detecting cartilaginous fishes including whale sharks (Sigsgaard et al., 2016), white sharks (Lafferty et al., 2018), the Chilean devil ray, and Mobula tarapacana (Gargan et al., 2017), a congener and close relative of reef mantas. These species share similar life history strategies that make them challenging to study, but tractable for detection by eDNA because they shed DNA in surrounding seawater through shedding their mucus and skin.
eDNA can exist in various forms within an ecosystem including free eDNA, unicellular or small multicellular organisms, or tissue particles (Nagler et al., 2022). It can originate from a range of biological sources such as sloughed skin cells, blood, gametes, tissue feces, or mucus.
Once released, eDNA interacts dynamically with its surrounding environment. In aquatic systems, it may settle into sediments, degrade over time due to enzymatic and microbial activity, resuspend into the water column, or be transported by currents. These diverse applications highlight the versatility of eDNA as a powerful tool for monitoring biodiversity, detecting rare or elusive species, and assessing ecosystem health across a wide range of environments.
Measurements of eDNA are valuable for studying rare, cryptic, or broadly distributed marine species and their habitat usage. Since 2008, the application of eDNA has increased exponentially in scientific studies (Beng and Corlett, 2020). Targeted eDNA methods can be used to detect the presence/absence of a particular species (Gargan et al., 2017), as well as infer relative abundance/biomass using copies per microliter (Jungbluth et al., 2013; Tillotson et al., 2018) or read depth (Mariani et al., 2021). Measurements of community eDNA from water samples can detect more fish species than traditional survey methods in marine systems (Thomsen et al., 2012) and can identify habitat-specific diversity based on the type of sample collected (e.g., plankton or water samples for pelagic species or sediment samples for benthic species; Koziol et al., 2019).
Conventional eDNA sampling is based on filtering relatively small volumes of water (typically 1–4 L); however, for highly mobile species with relatively low abundance, detection of highly dilute DNA in small collection volumes can present challenges to understanding whether a negative detection reflects absence or an artifact of limited volume sampled (e.g., Furlan et al., 2016). Plankton tows can be used to sample a much greater volume of water (thousands of liters vs. 1-L bottle sample) to concentrate the eDNA signature of mobile, rare, or elusive species (Furlan et al., 2016; Koziol et al., 2019; Schabacker et al., 2020). The use of plankton tows for eDNA has an added benefit for this study because the same collection method can be used to characterize the reef manta prey assemblages. A pilot study indicated that manta eDNA was detected from plankton tows off O’ahu while there were no detections from 1 L of filtered seawater samples taken at the same site and time (Crow, unpublished data).
In this study, we collected plankton samples from nine nearshore coastal sites around the perimeter of O’ahu, for detection and relative quantification of M. alfredi eDNA using a custom quantitative polymerase chain reaction (qPCR) assay. Our results were used to evaluate seasonal and spatial variation in the distribution of reef mantas and whether there is a relationship between M. alfredi presence and the plankton assemblages or other physical factors around O’ahu.
2 Methods
We implemented an experimental design that would capture variation in manta distribution between the North, East, South, and West regions of O’ahu (hereafter referred to as “cardinal directions”) spanning all four seasons. Nine sites were selected to represent the four cardinal directions off O’ahu, and some sites encompassed multiple patch reefs within a defined region (see Figures 1A, B). Samples were collected from July 2021 to July 2022 and were later grouped into seasons based on the traditional seasonal calendar of the Northern Hemisphere. Kane’ohe Bay has numerous patch reefs that protect it from harsh oceanic conditions and is also rich in plankton, with variation among reef patches (Jungbluth and Lenz, 2013). This bay is known for anecdotal reef manta sightings; therefore, we sampled four sites within Kane’ohe Bay because it had a high probability of establishing positive controls, and the protected conditions made sampling tractable for sampling in all four seasons. We divided Kane’ohe Bay on the East Shore of O’ahu into four distinct sampling sites, namely, the “far reef”, “near sandbar”, “intersection buoy”, and “near Hawai’i Institute of Marine Biology (HIMB)” (Figure 1B, E1–4). We included the remaining cardinal directions because they have not previously been evaluated for manta detection, and importantly, manta distribution around the Maldives switches to the lee side of the islands during the monsoons (Anderson et al., 2011) and plankton blooms (Armstrong et al., 2016). For example, reef mantas in the Maldives aggregate on the Eastern side of the islands during the Southwest monsoon season (Harris et al., 2020). In Hawai’i, anecdotal sightings are reported on the South and East shores, but it is unclear whether this is due to increased human activities or actual trends in manta distribution. Each cardinal direction was sampled two or more times per season (for five consecutive seasons, including two summers) to detect manta ray eDNA. Samples were collected during daylight hours and only in conditions safe for personnel to be on the water for collections (i.e., if the swell was too large or winds were above 25 knots, collections were not preformed), and thus, there is some variation in time of collection and tides. To confirm that the presence of manta rays would result in positive detections with plankton eDNA, we traveled to a stable aggregation off Kona, Hawai’i, where we collected a positive control plankton tow at a site where we visually confirmed the presence of eight reef manta rays. A single sample was taken using the same 80-μm plankton net from this location and used for eDNA extraction and qPCR.
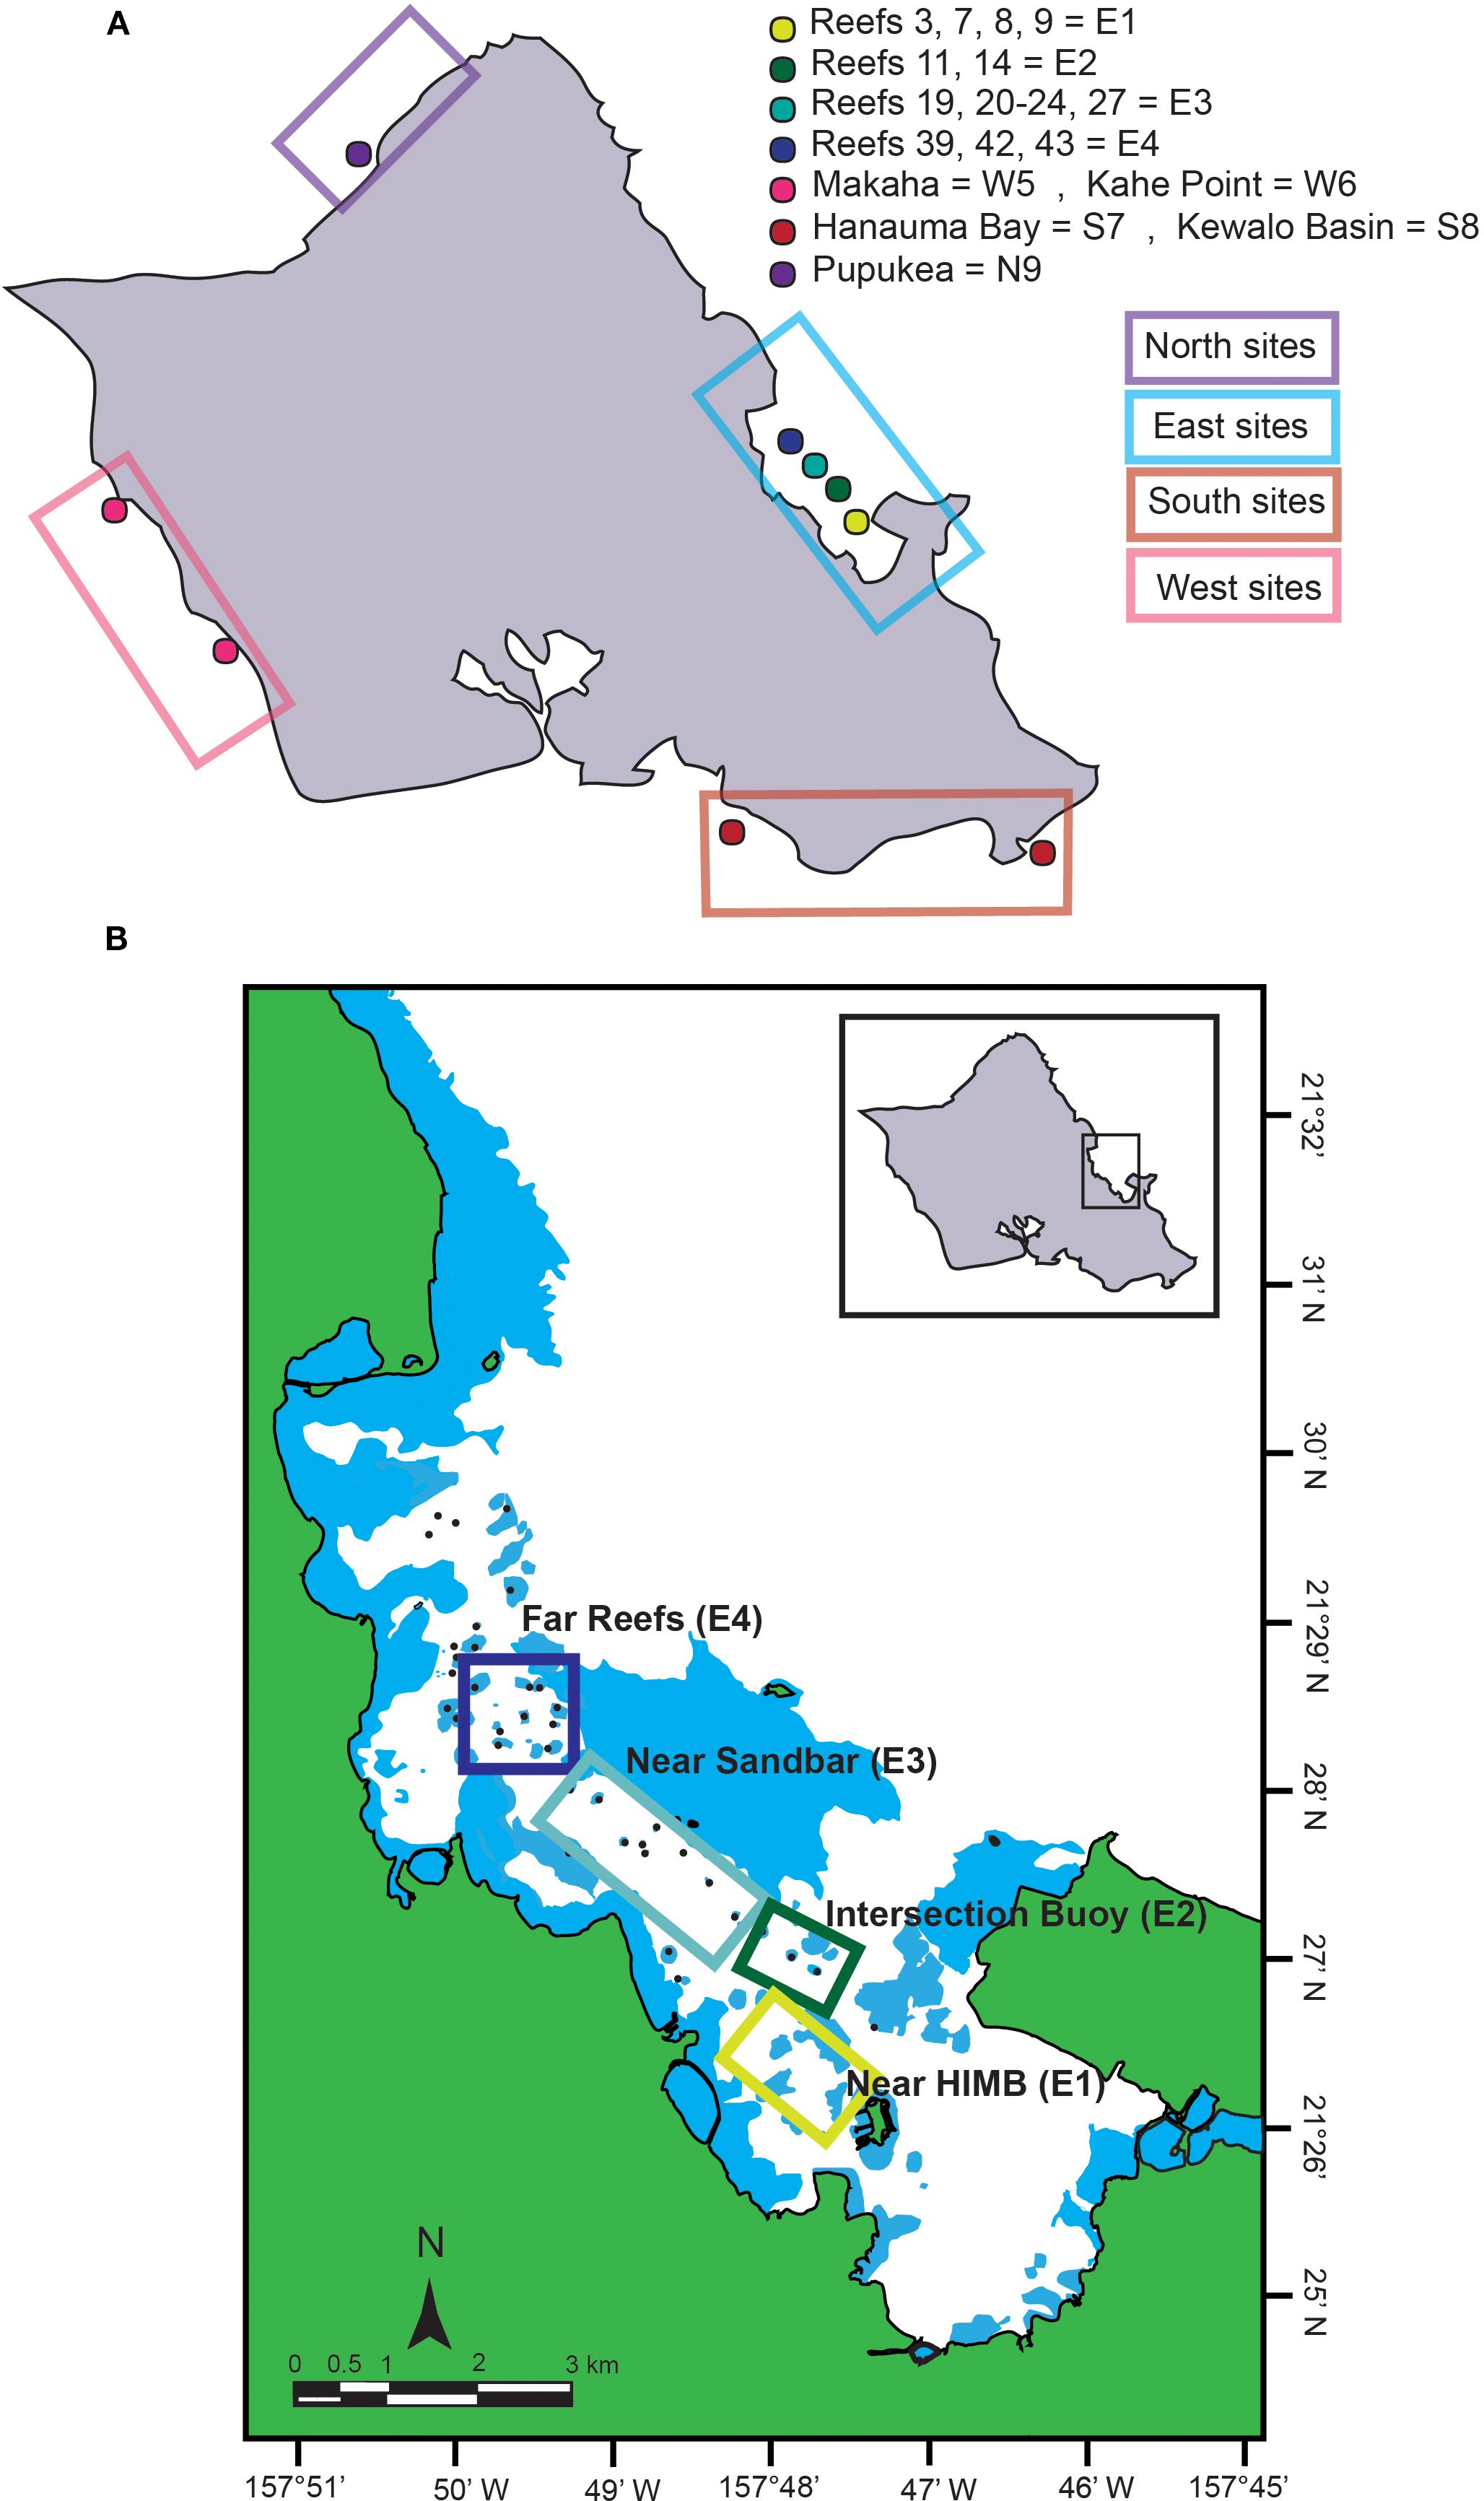
Figure 1. (A) Map of O‘ahu, Hawaii, showing sampling locations. Circles indicate the specific sites where samples were collected. Labels represent sample location names and treatment categories, with abbreviations denoting treatment type and sample number. Colored boxes around sample locations denote cardinal direction sample location. The blue box encloses the East Shore sample locations. The purple box encloses the North Shore sample location. The pink box encloses the West Shore sample locations. The red box encloses the South Shore sample locations. Map edited from the original (Coleman et al., 2023). (B) Close-up map of the East Shore sites in Kāne‘ohe Bay, O‘ahu, Hawaii. E4 (dark blue) = far reefs; E3 (light blue) = near the sandbar; E2 (dark green) = intersection buoy; E1 (light green) = near the Hawai’i Institute of Marine Biology (HIMB). Map adapted from Coleman et al. (2023).
eDNA can be detected with filters or plankton net mesh sizes ranging from 0.2 to 180 μm (Turner et al., 2014). In this study, eDNA was collected in plankton tows using a 30-cm-diameter, 80-µm mesh net fit with a flowmeter (General Oceanics low flow model), with a 10-m vertical tow followed by an additional 2-min subsurface tow at 1 m depth. This sample was then used for both eDNA detection and characterization of the plankton assemblage. Plankton, eDNA, and other suspended materials were concentrated in the cod end of the net, and immediately preserved in 100% ethanol stored on ice in the field and −20°C upon returning to the lab. Nets were dunked in a 25% bleach bucket between sites and flushed thoroughly with seawater at the subsequent sampling station to prevent contamination between sites (following Kemp and Smith, 2005). While we were not able to collect a negative control in the field (i.e., not possible to run distilled water through our plankton net at a scale comparable to actual field samples), decontamination was confirmed because nearby locations taken on the same day had intervening positive and negative detections, indicating that contamination from the previous sample was unlikely.
2.1 eDNA sample processing
Total DNA was extracted using 4.5 mL of each sample after inversion to resuspend particulate matter. Ethanol was evaporated from the sample using a Savant Speed Vac Plus® on medium for 8 h, then on low for another 12–18 h (overnight). DNeasy blood and tissue kits (Qiagen Inc.) were used for total DNA extraction with the following modifications: (1) pestles were used to homogenize organic material (in a 1.5-mL Eppendorf tube) in Buffer ATL and Proteinase K, then samples were incubated at 56 °C for 4 h; (2) after Wash Buffer 2, samples were centrifuged for an additional 3 min at 14,000 rpm; and (3) eDNA was eluted in Buffer AE but incubated at room temperature for 1 min for the first 50 µL, and for 10 min for the second 50 µL for a final elution of 100 µL, and DNA was quantified by nanodrop to verify successful extraction before proceeding.
A custom “PrimeTime™ Std qPCR assay” from Integrated DNA Technologies® (IDT) targeting 161 bp of the Cytochrome b locus (Mal_eDNA_Cytb) was rigorously tested with in-lab experiments to validate the exclusion of related taxa that commonly occur around O’ahu. Eagle rays (Aetobatus ocellatus) are abundant around O’ahu, and the most likely to be detected with a nonspecific assay, and so our assay was designed specifically to exclude A. ocellatus. Quantitative PCR was performed using the Mal_eDNA_Cytb primers (forward: 5′-AGTAACACCACCCCATATTA-3′ and reverse: 5′-TTAGACTTCGTTGTTTGGAG-3′) and a double-quenched FAM-labeled probe (5′ 6-FAM/TCGCCTACG/ZEN/CTATCCTACGTTCCA/3′ IABkFQ/) containing a ZEN internal quencher and a 3′ Iowa Black™ quencher. This assay was optimized to detect M. alfredi while excluding the detection of other taxa by maximizing the number of sequence mismatches in related taxa to increase specificity (Figure 2). This assay was further verified by sequencing qPCR amplified samples from eDNA. Of these samples, one was a positive control from Kona and the other was a field sample from O’ahu; both sequence results match Mobula sp. We note that the oceanic manta, M. birostris, has zero mismatches with M. alfredi in this assay; therefore, we could not distinguish between these sister taxa. However, M. birostris is endangered and mostly occurs in offshore pelagic environments more than M. alfredi (see Deakos et al., 2011 and Setyawan et al., 2024, and references therein). While M. birostris has been documented around Kona, it is rare, and the primary species is M. alfredi (Moy et al., 2020). Only one other congener, M. tarapacana, includes Hawai’i as part of their confirmed range, which is also endangered and has a total of six mismatches, making eDNA amplification unlikely. For clarity, we do not infer that our assay definitively distinguishes between these four mobulid species. However, for this study, we are assuming that positive detections are associated primarily with the presence of M. alfredi. This assay successfully amplified positive controls of M. alfredi tissue samples, and eDNA was extracted from the positive control plankton tow taken off Kona where eight M. alfredi individuals were sighted. Three of our eDNA amplifications were verified by sequencing as M. alfredi. The assay has 10 mismatches with A. ocellatus (which is common around O’ahu), and DNA extracted from A. ocellatus and Mobula munkiana tissue did not amplify when diluted to concentrations in the observed range of positive M. alfredi detections. It is also important to note that in species outside of the Mobulidae family, the alignment is highly dissimilar and therefore amplification is unlikely.
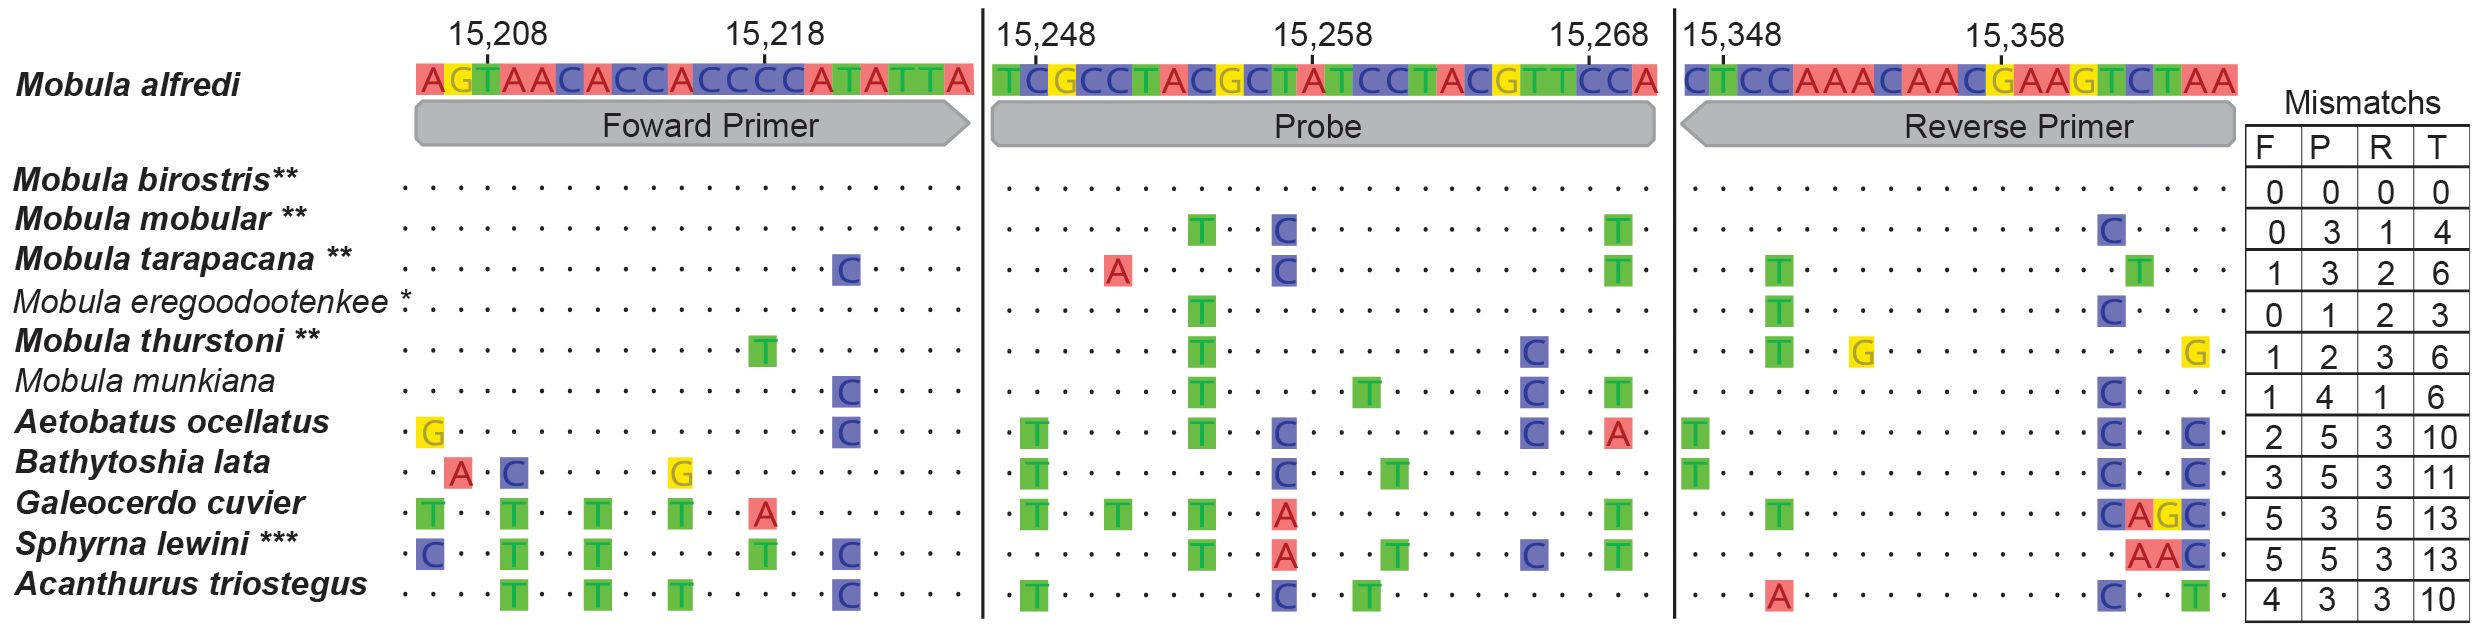
Figure 2. Multiple sequence alignment of Mobula Cytb forward primer, probe, and reverse primer areas; total amplicon is 161 bp. Topology consistent with Poortvliet et al. (2015) and Sasko et al. (2006). Species in boldface could occur in Hawaii, ** endangered and does inhabit Hawaiian waters, *** critically endangered and does inhabit Hawaiian waters. The endangered species are determined to be rare and unlikely to be in the area. The goal was to exclude A. ocellatus, the species most likely to be at sample locations. Total mismatches for each species are listed at the end of the alignment in a table, F, forward primer; P, probe; R, reverse primer; and T, total.
Criteria for positive detection include amplification plots with logistic curves, one or more of three technical replicates (Simmons et al., 2016), a CT < 40, which exceeds the threshold of 0.1 ΔRn, and no amplification of any of the triplicate NTCs (Supplementary Table S1). Samples that fell below the limit of detection (LOD) (n = 14) were counted as positive because they met all criteria for positive detections and only two samples that had CT values > 40 were counted as negative. The LOD was defined as the lowest concentration that detected 95% of serial dilution replicates (Supplementary Figure S1B, n = 21). We found variation between three different assay platforms, namely, SYBR, Applied Biosystems custom TaqMan, and IDT PrimeTime, and found that “PrimeTime™ One-Step 4X Broad-Range Master Mix” was the most consistent with the lowest CT values and the highest precision overall (Supplementary Figure S1A), which is designed to overcome low-quality DNA and reduce PCR inhibition. We also added bovine serum albumin (BSA) to reduce PCR inhibitors (following Jiang et al., 2005).
To measure manta ray eDNA, qPCRs were carried out in a 20-µL reaction volume with final concentrations of 1× “PrimeTime™ One-Step 4X Broad-Range Master Mix” (IDT), 5 nmol of each forward and reverse primer, 2.5 nmol of probe, 25,000 ng of BSA (i.e., 0.5 μL of 50 mg/mL BSA), and 3 µL of extracted DNA. Amplifications were run on an Applied Biosystems StepOnePlus™ Real-Time PCR System under the following thermocycling conditions: 10 min at 95°C completed with 50 cycles at 95°C for 10 s and 61.5°C for 1 min. We ran qPCR plates run for 50 cycles (following Murakami et al., 2019), but only counted clear amplifications that occurred in <40 cycles.
We used a synthetic double-stranded DNA fragment representing a partial sequence of the Cytb gene (a gBlock from IDT) to generate serial dilutions of the target amplicon at known concentrations in order to infer the quantity of reef manta DNA in each sample and to evaluate the LOD at various concentrations. We added tRNA to the molecular biology grade water before dilutions were made to increase the precision and detectability at lower concentrations (following Hobbs et al., 2019). A 10-fold dilution was made from a 10 ng μL−1 stock gBlock (4.4 × 10¹⁰ copies μL−1) to 1 × 10⁻¹⁰ ng μL−1 (0.44 copies μL−1). We used four of these serial dilutions on each plate ranging from 441.27 to 0.44 copies μL−1, which encompassed most concentrations observed in the experimental samples. Absolute quantification using a serial dilution makes samples directly comparable, allowing inferences of manta ray relative abundance. For example, twice the concentration infers twice the abundance of eDNA, albeit considering a window of time and space as eDNA interacts with the environment. Using the eDNA sample concentrations inferred from the serial dilution curve, we calculated manta eDNA concentration after adjusting for the actual volume of seawater filtered in the plankton tow to make samples comparable, reported as the number of copies per liter filtered.
2.2 Characterizing plankton assemblages
The composition of the plankton assemblages was characterized using a FlowCam (VS Series; Yokogawa Fluid Imaging Technologies) with a 2× objective and 1,000-μm flow cell. Similar to adjusting eDNA concentrations by volume filtering, we also adjusted FlowCam plankton counts to the number of particles per liter using the flowmeter data, making inferences of plankton abundance and assemblage comparable across plankton tows. Plankton samples were diluted in ethanol and subsamples were taken with a Hensen-Stempel pipette. Subsamples were then strained to remove ethanol and resuspended in distilled water to run through the FlowCam for characterization. After each FlowCam run, the organism images were visually analyzed by hand to remove non-planktonic particles and outliers such as diatom chains (particles with a high aspect ratio), detritus, exoskeletons, and photos with multiple organisms.
The FlowCam software was unable to automatically characterize plankton assemblages to species, and manually classifying thousands of images generated by the analysis was not feasible for this study. Therefore, we took the approach of characterizing plankton assemblages by size. Particle images were grouped into the following size categories that correspond to major plankton groups common in nearshore habitats off O’ahu (Table 1): 0–100 μm (nauplii and small copepods), 100–500 μm (calanoid copepods and medium-sized copepods), and 500–1,000 μm (large copepods, decapods, and chaetognaths) (Divi et al., 2018). The association of plankton assemblage, abundance, location, month, and season was evaluated using R studio (version 4.3.2.) with permutational multivariate analysis of variance (PERMANOVA) and analysis of variance (ANOVA), using the “phyloseq” package (McMurdie and Holmes, 2013). Multidimensional scaling (MDS) plots were created with “plot_ordination” to evaluate the effect of location on plankton assemblage. Finally, we used these size classes to evaluate whether plankton assemblage (species composition as well as abundance) was associated with the presence of mantas.
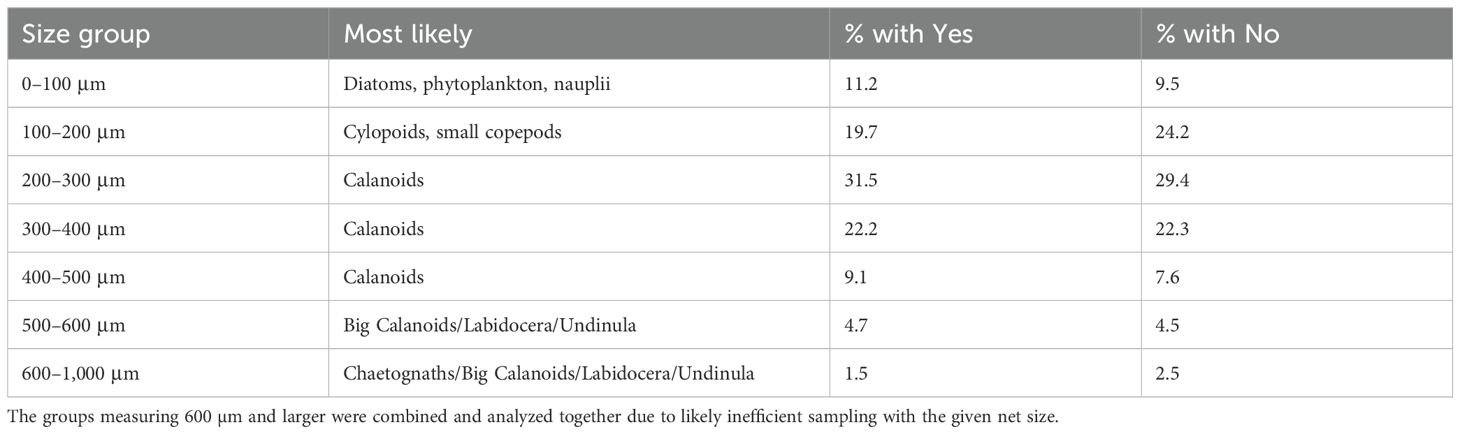
Table 1. Plankton assemblage assumptions based on size classes.
3 Results
3.1 Spatial variation in manta distribution around O’ahu
While there are stable and predictable aggregations of manta rays off Hawai’i and Maui, we were able to infer that they also occur consistently off O’ahu (13.9% positive detection rate across all samples in time and space, n = 137, Figure 3). Overall, 137 collected samples were used, 105 samples were collected on the East Shore, 14 samples were collected on the West Shore, 10 samples were collected on the South Shore, and 8 samples were collected on the North Shore. We found the highest frequency of detections on the East Shore sites within Kane’ohe Bay, with some detections in the North and West, and zero detections in the South sites throughout this study (Figures 3A–E). We only considered positive and negative detections (not eDNA concentration) for inferring spatial patterns of manta distribution. Within Kane’ohe Bay, the “far reefs” (E4) had the highest number of detections in summer, while in winter, the reefs near the “intersection buoy” (E2) had the highest number of detections. Interestingly, these two sites flank the “sandbar” and therefore have the greatest access to Kane’ohe Bay from the pelagic environment (E2 and E4, Figure 1B), suggesting seasonal transport of eDNA from offshore, or micro-patterns in seasonality within Kane’ohe Bay as a result of offshore–nearshore migration routes.
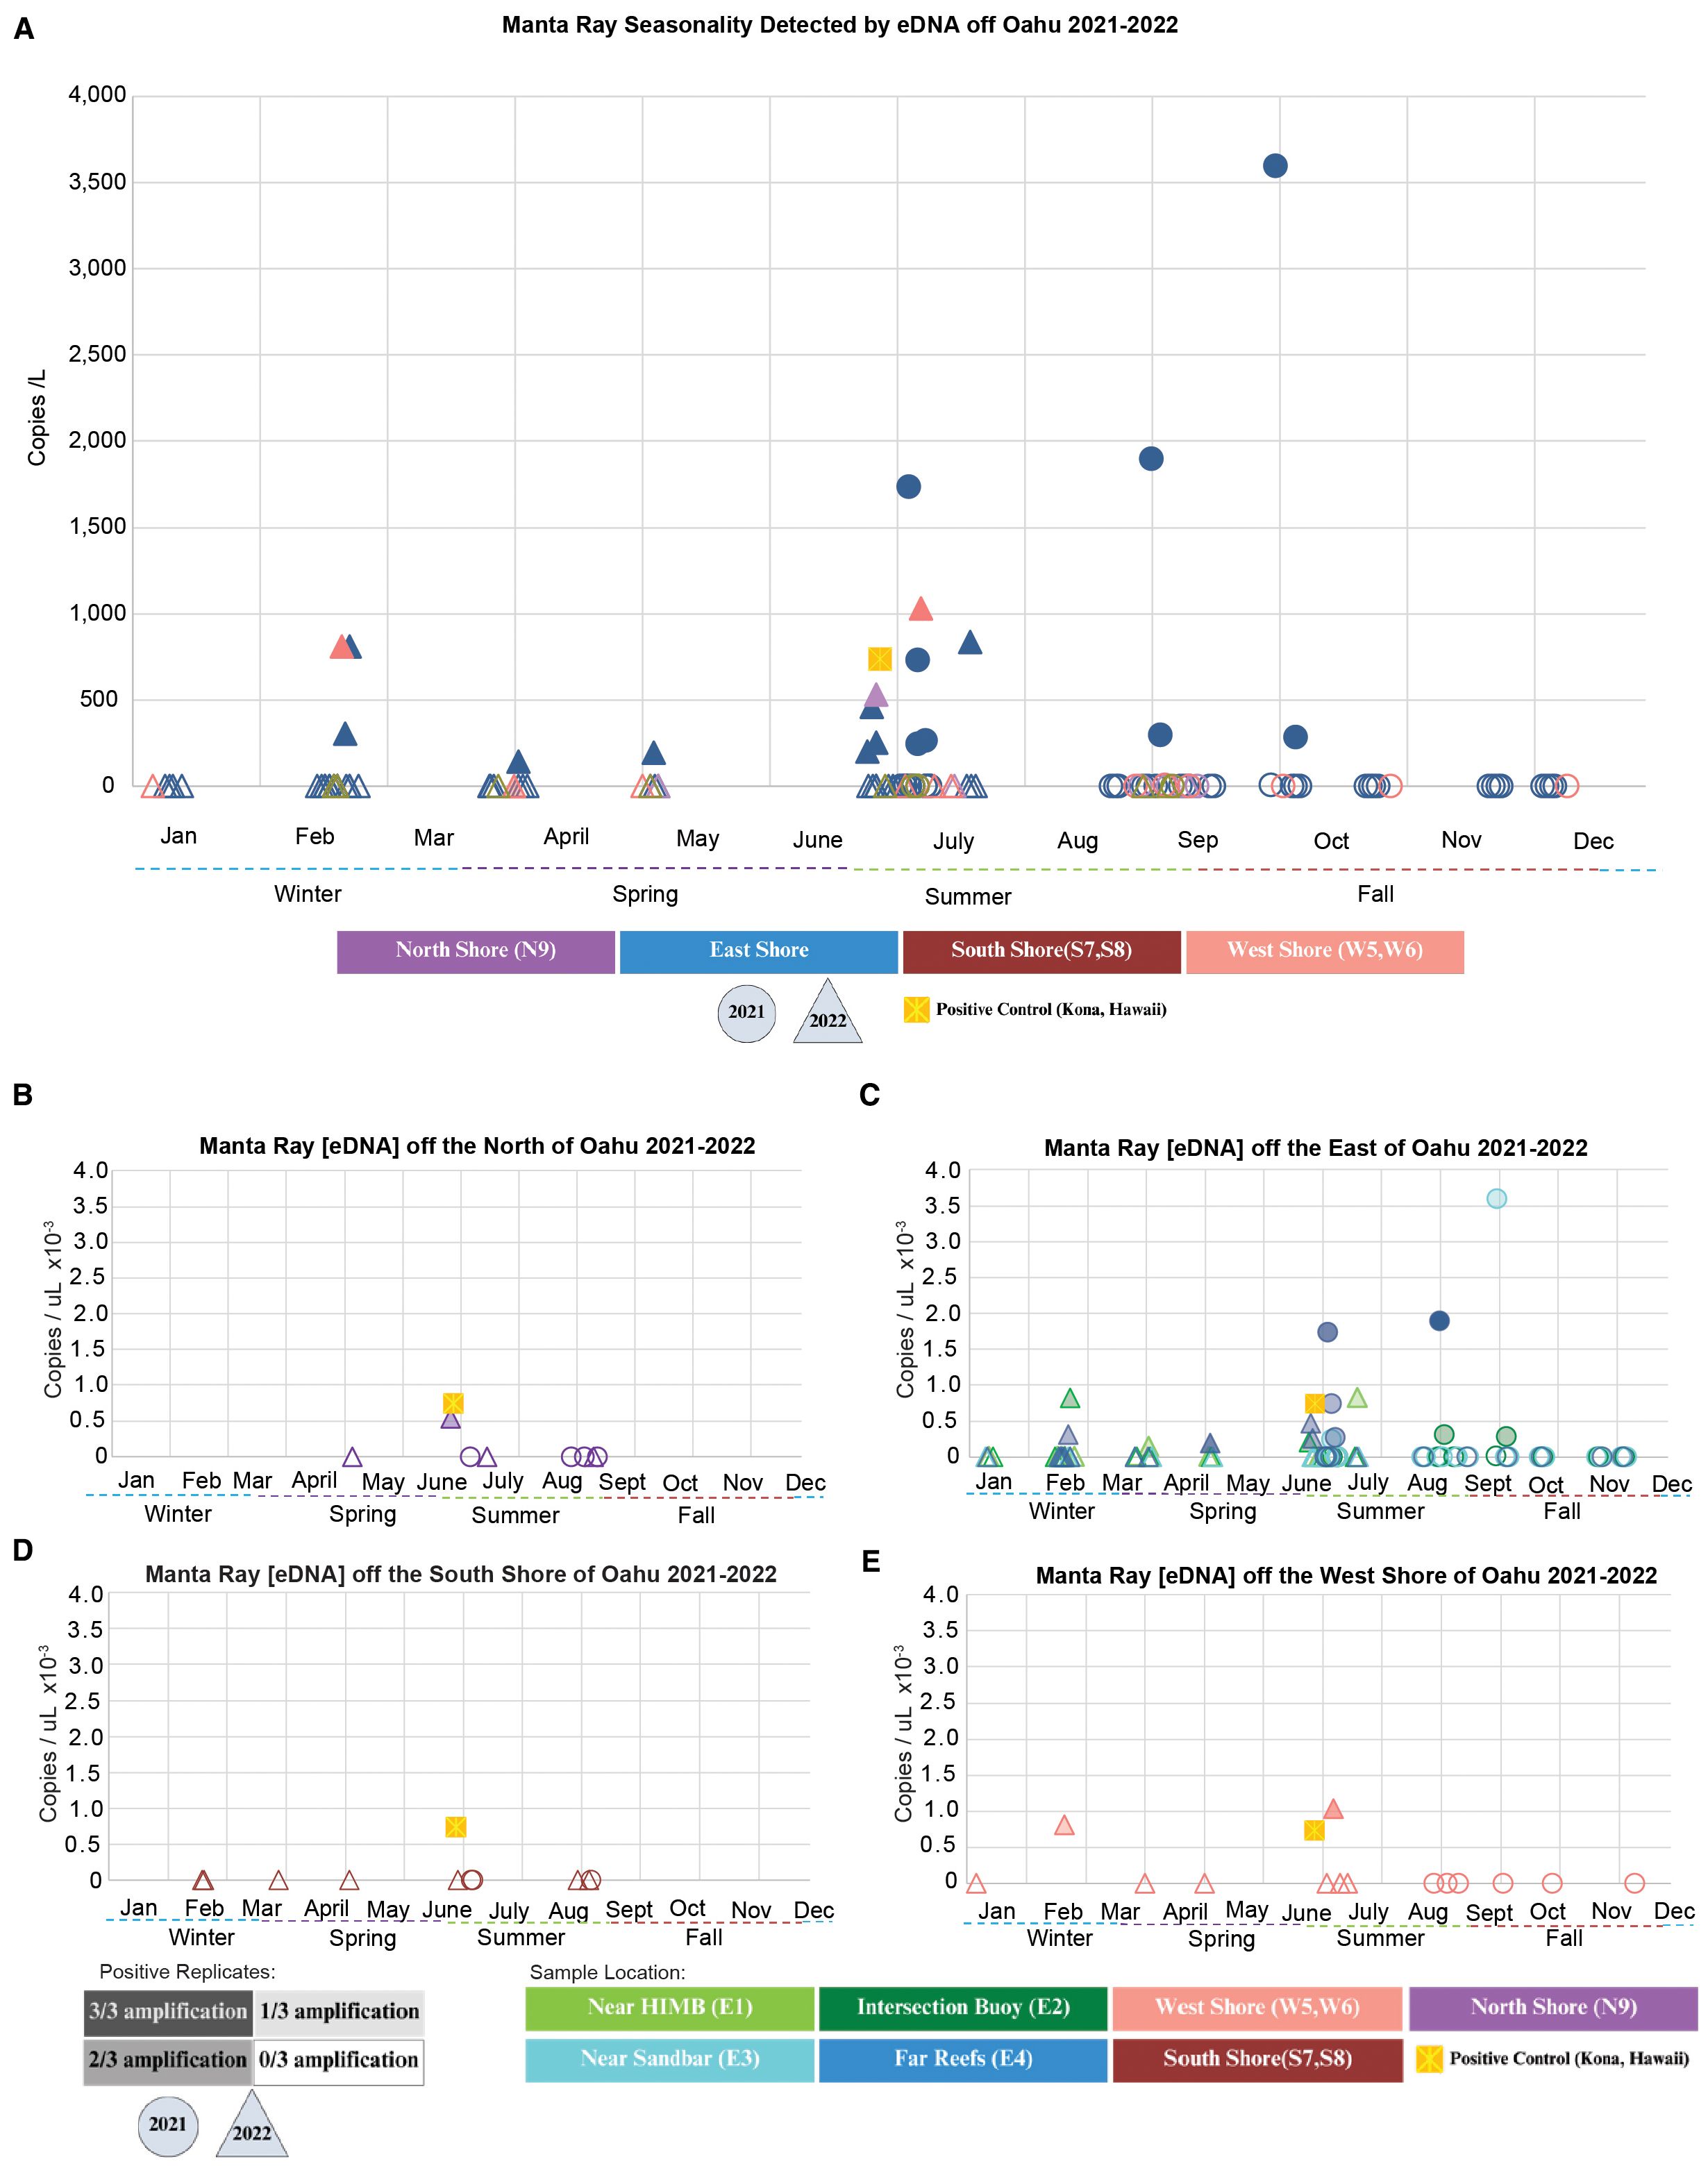
Figure 3. Manta ray eDNA detection across O‘ahu, Hawai‘i. Shape colors indicate sampling location or positive control, and shape type (circle = 2021, triangle = 2022, square = positive control from Kona) denotes sampling year or control status. Shape fill represents amplification success: in (A), filled shapes indicate samples with at least 1/3 positive technical replicates; in (B–E), shading intensity indicates the number of positive replicates (“Positive Replicates”). Copies/L were normalized using flowmeter data to account for total volume filtered. Colored symbols represent “Sample Location”. (A) Detection data from all cardinal directions of O’ahu. (B) Northern sampling locations. (C) Eastern sampling locations. (D) Southern sampling locations. (E) Western sampling locations.
It is important to note that in 68% of the positive detections (i.e., 11 of 16) within Kane’ohe Bay, adjacent sites had no detection on the same collection day, suggesting a spatial scale of detection of approximately 1 km in Kane’ohe Bay on dates collected (Figure 1B). For example, on 30 June 2022, there was no detection at E1, detection at E2, no detection at E3, and detection at E4. Therefore, we were able to make inferences about small-scale variation in the distribution of mantas between adjacent sites within Kane’ohe Bay, suggesting that manta presence at one site did not influence inferences of broader spatial patterns of detection. We had two positive detections in the West Shore (n = 14, Figure 3E) that occurred during the two peak months in the East (e.g., February and early July), suggesting consistency in seasonality. Although the North Shore was the most difficult to sample (due to increased swell and limited access, n = 8, Figure 3B), we found a single detection that also corresponded to the peak season across other sites (late June). On the South Shore, there were no positive detections throughout the entirety of this study (n = 10, Figure 3D).
3.2 Temporal variation and seasonality in manta distribution around O’ahu
We found evidence for seasonal variation in the distribution of manta rays around O’ahu based on the density of positive detections and eDNA concentration (Figure 3A). While there were non-detections in all seasons, the distribution of positive detections was most dense during July, with the highest relative concentrations of manta eDNA (and >0.44 copies/μL; our calculated LOD was based on serial dilutions) occurring during the summer, between late June and early October at the three cardinal directions where mantas were detected, with a smaller pulse during February in two of those regions (Figure 3A). Therefore, this pattern of seasonality with increased number of detections and highest concentrations during the summer was consistent in the East, North, and West. This seasonality is also supported by several detections at lower concentrations in the spring months leading up to summer, albeit at concentrations less than the LOD (from serial dilutions). Notably, we did not detect mantas at any sites around O’ahu during the late fall and early winter, from late October through January (Figure 3A), further supporting the inference of seasonal occupancy around O’ahu.
The concentration of eDNA in our samples ranged from 0.05 to 1.9 copies/μL, and all positive detections met the criteria of a logistic amplification curve (Supplementary Figure S1B) and Cq below 40 (Supplementary Table S1). However, the LOD is defined as the lowest concentration with >95% detection, which corresponded to 0.44 copies/μL in our serial dilutions (Supplementary Figure S1B, n = 21, positive detections in 20 of 21 replicates at this concentration). However, because our serial dilution concentrations varied by an order of magnitude (necessary to capture the range of sample concentrations), many of our samples that met the criteria for positive detection occurred at concentrations slightly below the LOD (e.g., <0.44 copies/μL). Therefore, we evaluated patterns of seasonality based on all samples meeting the criteria for positive detection, as well as only considering positive detections at concentrations defined by the LOD (>0.44 copies/μL) in our serial dilutions.
We also considered effects of PCR inhibition in samples with high overall DNA concentration but low mobulid concentration, as well as whether any nonspecific amplification of the Cytb locus from non-related taxa could bias our results (Supplementary Figure S1C). We compared levels of detection using Cq values between known gBlock serial dilutions with and without a background spike of plankton DNA extracted from San Francisco Bay, where no manta rays occur. We found higher Cq values, which translates to lower concentrations, in samples with the plankton DNA spike (at the lower concentrations of 0.44 and 4.4 copies/μL), indicating that our samples from Hawaii were likely inhibited by background DNA from non-mobulid species (Supplementary Figure S1C). This makes our positive detections conservative, meaning that inferences of seasonality based on positive detections were apparent despite PCR inhibition. Furthermore, we acknowledge that the amount of inhibition could vary between samples, as a function of plankton abundance.
The high number of samples taken in the summer of 2021 (n = 45) reduced the frequency of detections when considering catch per unit effort; however, both summers of 2021 and 2022 had the highest concentrations, consistent with seasonality. We also observed consistency in positive detections in late February (2022) in both the East and West. When we break down positive detections by month, there are no positive detections at any site during November 2021 (n = 5), December 2021 (n = 5), or January 2022 (n = 5), providing additional evidence for seasonality (4e). While we were not able to sample the North or the South shores during the winter, we were able to take multiple samples from the East and West (n = 19), which resulted in zero detections during the winter.
While a high proportion of negative detections was expected given the small population size and the high mobility of manta rays, the large number of zeros (i.e., non-detections) introduced a high level of variation that limited our ability to detect significant differences in our statistical analyses. As a result, we were unable to detect significant differences in manta presence by month or season using ANOVA, due to a bias associated with the high number of non-detections (i.e., zeros) across all sampling sites and dates. However, because we had the densest sampling in the East, within Kane’ohe Bay, we considered catch per unit effort by evaluating the proportion of detections divided by the number of samples taken at each site and cardinal direction (Figure 4E). When we compare the frequency of positive detections in the winter of 2022 (n = 29) with the summer of 2022 (n = 25) with nearly equal sample sizes, we found very different detection frequencies of 0.069 vs. 0.24, respectively (Figure 4C), consistent with trends observed by both season (Figure 4D) and month (Figure 4C). Non-detections were unambiguous with no amplification before 50 cycles, and non-detections were consistently observed from late October to January, providing further support for seasonality.
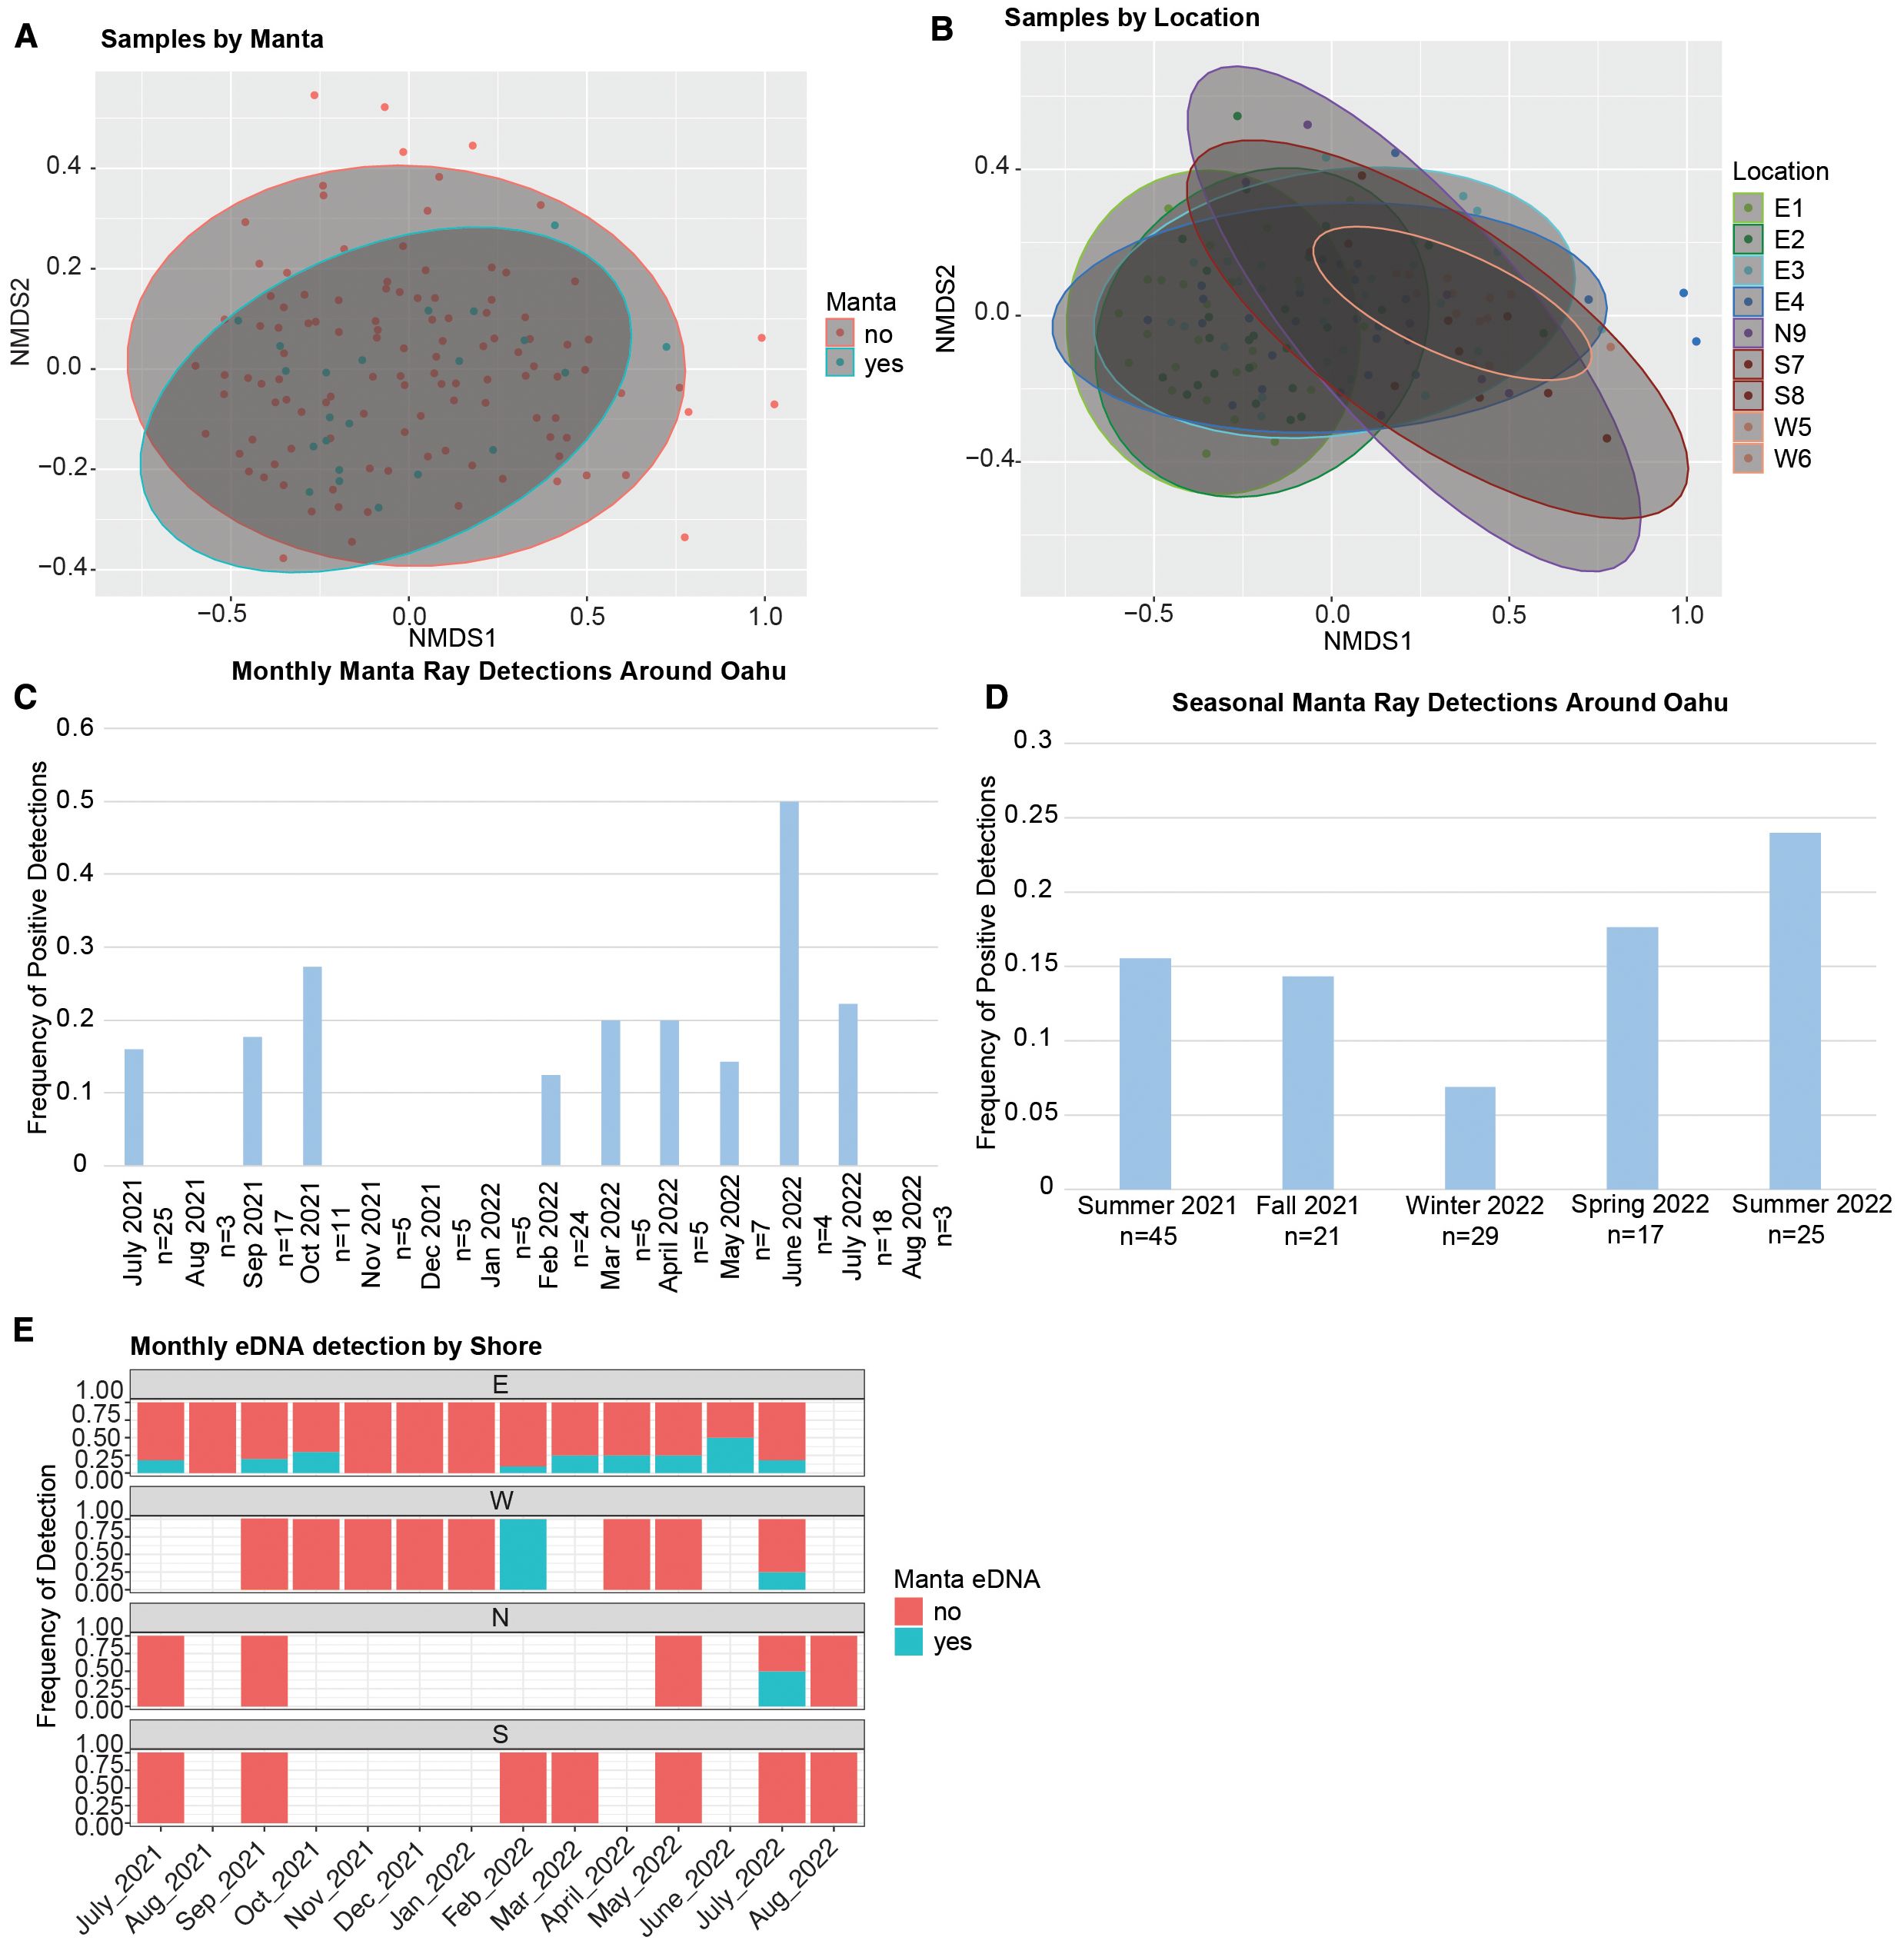
Figure 4. Environmental DNA (eDNA) detection of manta rays and plankton assemblages around O‘ahu, Hawai‘i. (A) Frequency of manta ray detections by month at cardinal sampling locations (East, West, North, South). Frequency is calculated as the number of positive detections divided by the total samples for that month. For months with detections, the number of positive samples is shown in the blue “yes” bar. (B) MDS plot of plankton assemblage vs. manta eDNA detection. Ellipses represent 95% confidence intervals. Red dots = samples without manta ray eDNA; blue dots = samples with manta ray eDNA. (C) Frequency of positive detections per sampling effort grouped by season. Winter 2022 (n = 25) had the lowest frequency, while Summer 2022 (n = 15) had the highest. (D) MDS plot of plankton assemblage vs. sampling location. Ellipses represent 95% confidence intervals. Sampling sites: E1 = near Hawai‘i Institute of Marine Biology (HIMB), E2 = intersection buoy, E3 = near sandbar, E4 = far reefs, N9 = North Shore, S7 = Hanauma Bay (South Shore), S8 = Kewalo Basin (South Shore), W5 = Makaha (West Shore), W6 = Kahe Point (West Shore). (E) Frequency of positive detections per sampling effort grouped by month. No detections occurred November–January (n = 15).
3.3 Variation in plankton assemblages
We found no significant relationship between manta ray presence and plankton assemblage. There was no relationship between assemblage similarity and manta presence when taking into account total plankton abundance (80 µm net, PERMANOVA, p > 0.05, Figure 4A; Supplementary Table S2). However, there were significant differences in plankton assemblages associated with location (Figure 4B), month, and season (PERMANOVA, Supplementary Table S2, p < 0.05), which is consistent with Jungbluth and Lenz (2013). The relationship found between assemblage similarity and location was significant even when accounting for differences in total plankton abundance (PERMANOVA, Supplementary Table S2, p = 0.001), indicating that there are consistent differences in the assemblage size classes across the different locations. However, the relationship between the assemblage and season was not significant when accounting for the differences in total plankton abundance (PERMANOVA, Supplementary Table S2, p = 0.182). The relationship between the abundance of plankton and the plankton assemblage (defined as size groups) was significant (p = 0.001), indicating that the total amount of plankton (particles) is strongly related to the assemblage size classes. When we evaluate the presence of manta rays (yes vs. no) vs. the plankton assemblage when accounting for differences in total plankton abundance, there was no significant effect (PERMANOVA, Supplementary Table S2, p = 0.064). In the East, the E4 site had lower overall plankton abundance than other sites, and interestingly, this is the site with the highest number of manta detections. In addition, there was a difference in the composition of plankton size classes by site, albeit with a high degree of overlap among most sites (Figure 4A). The sites with the greatest difference between plankton assemblages were the East (E1) and West (W5 and W6) sites (Figure 4A).
4 Discussion
To our knowledge, this is the first study to evaluate the distribution of manta rays around O’ahu, Hawai’i. Our study revealed that manta ray eDNA was more frequently detected during the summer and off the Eastern shore (Kane’ohe Bay), indicating quantifiable and predictable relative differences in manta distribution in both space and time around O’ahu. Concentrating manta eDNA using plankton tows allowed us to infer both the presence and absence of manta rays across a large geographic scale over four seasons. Notably, our results indicate that manta presence is not linked to nearshore plankton assemblages, suggesting that other factors may be structuring seasonal and geographic patterns of distribution. We conclude that mantas exhibit seasonality based on the following three lines of evidence: (1) consistency of positive detections, (2) highest eDNA concentrations during late summer/early fall, and (3) no detections during late fall/early winter.
4.1 Manta eDNA, not associated with nearshore plankton assemblages
The reef manta is a highly specialized zooplanktivore with cephalic fins that extend anteriorly to facilitate prey capture. They exhibit a highly derived filtration system in their gill rakers that represents the only known non-clogging biological filter (Divi et al., 2018). This makes them highly efficient at prey capture and are likely deliberate in choosing where/when to feed. Their diet consists of small zooplankton, microcrustaceans, and mesoplankton. Armstrong et al. (2021) found that feeding behavior is associated with the abundance of calanoid copepods and high zooplankton biomass, which is what motivated our experimental design. However, our data suggest that plankton assemblages in the nearshore environment (from an 80-µm net) are not driving manta distribution around O‘ahu. We chose the 80-µm net to maximize eDNA capture, but one caveat to these data is that the bow wave of our net could result in reduced capture of larger zooplankton (e.g., large calanoids, chaetognaths, and euphausiids), which is evident based on the primary size distribution of plankton captured being 100–400 µm shown in Table 1. That said, the trends observed in our data using the 80-µm net captured size classes broadly and matched previous trends in plankton assemblages around O’ahu (Jungbluth and Lenz, 2013).
While Armstrong et al. (2016, 2021) found that manta distribution was associated with high prey biomass during daylight, Dewar et al. (2008) and Braun et al. (2014) found that manta rays feed nocturnally in deeper offshore environments with high biomass associated with the vertical migration of deep scattering layer (DSL). Similarly, stable isotope (C13:N15) and fatty acid analysis signatures of manta diet indicate that manta rays forage primarily on mesopelagic zooplankton (i.e., from the DSL, Couturier et al., 2013; Burgess et al., 2016), consistent with the idea that daytime/nearshore manta distributions are not driven by feeding behavior or prey abundance. Deakos (2012) found low detections of reef mantas in the morning with increasing occupancy in the afternoon in a nearshore habitat off Maui, consistent with nocturnal feeding offshore and movement nearshore as the day progresses, where they documented mating behaviors, but not feeding behaviors. All our samples were taken at nearshore sites during daylight hours. Another line of evidence consistent with a dissociation between reef manta distribution and daytime/nearshore prey plankton assemblages is their repetitive dive profiles during the night (Braun et al., 2014) to feed on the DSL (Dewar et al., 2008), followed by a return to the surface to warm (Couturier et al., 2018). Interestingly, in the Maldives, manta rays’ habitat use was associated with sex and maturity (Harris and Stevens, 2021), which could be an additional factor in habitat use around O‘ahu. Finally, no feeding was observed during this study, and positive eDNA detections do not infer any type of behavior such as feeding.
4.2 Seasonality and spatial distribution of mantas off O’ahu
There have been seasonal patterns of manta ray distribution associated with habitat selection and feeding behavior in other populations around the world, consistent with the seasonal patterns we observed in reef mantas around O’ahu. Seasonal variation in mobulid distribution is associated with mating aggregations from October to January in Mozambique based on visual surveys and scarring patterns (Marshall and Bennett, 2010) and in winter off Maui (Deakos, 2012). In the Maldives, seasonality of reef mantas is associated with switching to the lee side of atolls during prevailing monsoon conditions that vary between the wet and dry seasons (Armstrong et al., 2021). While attempting to characterize variation in reef manta distribution around the island of O’ahu is ambitious, we based our sampling scheme on patterns observed in the Maldives. However, we did not detect any evidence of switching distribution associated with wet/dry seasons, but rather seasonal increase of eDNA detection in summer to early fall compared to winter at all sites.
We found seasonal variation in manta frequency of occurrence, with peak occupancy in summer/early fall followed by a remarkable decline in late fall/winter and zero detections from late October through January across all sites where samples were taken (n = 19). While there are stable feeding and cleaning stations of mantas off Hawai’i and Maui (i.e., occurring year-round), we did not detect any sites around O’ahu with consistent reef manta occupancy. When detected, we cannot infer an absolute number of individuals using eDNA; however, this is a quantitative method that allows us to make inferences about relative abundance between samples based on eDNA concentration, which has been done with other cartilaginous fishes (Mariani et al., 2021). Therefore, this study suggests that mantas are more frequently detected in nearshore areas off O’ahu in the summer/late fall and that they less frequently occur in the winter. While we are not implying that there are no manta rays off O’ahu during the winter (based on our sampling scheme), we are inferring a pattern of seasonality with far fewer detections in winter compared to summer during this study.
Interestingly, the lack of detections in the South may be associated with a high level of human activity compared to the North, East, and West sites. Anthropogenic disturbances have known detrimental effects on this population of manta rays (Deakos, 2012), and one of the most common anthropogenic injuries to mantas is fishing line entanglement (Strike et al., 2022). We found that manta occurrence and distribution off O’ahu is greatest in Kane’ohe Bay (East). Overall, the East Shore is the most protected, and warm, yet still has access to offshore pelagic feeding, which could be a driver of manta distribution. Additionally, anecdotal sightings suggest that mantas occur more often in the far reefs of Kane’ohe Bay; however, our data indicate that almost as many sightings occur in southern Kane’ohe Bay at the intersection buoy (Figure 3C, shades of green). Peak occupancy was consistently observed during the summer at all three cardinal directions where reef mantas were detected, with consistent trends of no occupancy detected in late October through January and a small uptick in February at two cardinal directions. While there were fewer detections in the North and West, those detections mirrored the seasonal peaks demonstrated in the East. One caveat in our experimental design is that variation in physical factors such as wind, weather, and swell presents challenging conditions for consistent sampling; therefore, we were not able to get as many samples from exposed compared to protected sites. However, the lack of amplifications on the East Shore from October through January (n = 22) is further evidence of seasonality with DNA concentration (Figure 3A) and frequency of positive detections (i.e., the number of positive samples divided by the number of times sampled in a month, Figure 4E).
4.3 Nearshore manta eDNA could be associated with protection and warming
The pattern of increased occupancy of reef mantas in nearshore O’ahu during the summer/early fall could be associated with predator avoidance and/or warming behaviors. During the summer, oceanic conditions around O’ahu exhibit increased stability, with consistently warmer temperatures and relatively calm conditions (Costa et al., 2016) that result from more stable weather conditions (as exhibited by low variability in barometric pressure; NOAA, 2025). Couturier et al. (2018) found that manta rays off Australia prefer nearshore areas with warm, calm conditions during the daytime for warming after nighttime foraging in deeper waters. Manta rays make deep dives up to 672 m, presumably for feeding, and return to the surface multiple times to warm in between dives, suggesting that warming is an important strategy influencing manta distribution (Braun et al., 2014; Lassauce et al., 2020; Andrzejaczek et al., 2021). Furthermore, Couturier et al. (2018) suggested that manta rays could be avoiding rough conditions, which may be linked to decreased visibility and/or predation risk from tiger sharks (Marshall and Bennett, 2010), which are pupping around the Hawaiian islands during September–October (Whitney and Crow, 2007). Interestingly, Deakos (2012) found that 33% of observed reef mantas off Maui had scarring evidence of shark attack (most likely from tiger sharks, Galeocerdo cuvier). Because these observations were of living reef mantas, this statistic represents only non-lethal predation events. Anecdotal reports from dive operators suggest that tiger sharks are more abundant around O’ahu in late summer/early fall during the same seasons when we detect the most mantas in nearshore, protected environments. Finally, killer whales (Orcinus orca) are known predators of manta rays (Terrapon et al., 2024), but they are considered extremely rare in Hawaiian waters (Mobley et al., 2001).
4.4 The temporal and spatial scale of detection of eDNA
This study is unique because it does not depend on haphazard observations of mantas by divers or boat transects that provide an instant snapshot in time and space, because eDNA allows for a sliding window of detection. This study suggests a spatial scale of detection within the East sites to be approximately 1,000 m (for this particular location and species), which is consistent with other eDNA studies that vary from 40 to 1,000 m (Port et al., 2016; Andruszkiewicz et al., 2019; Murakami et al., 2019). This also explains the high number of non-detections due to manta rays being outside the range of eDNA spatial detection. Multiple factors including wind, waves, tides, and currents will affect eDNA diffusion/dilution rates, and the directionality of the sampling site from the target source will affect the LODs (Murakami et al., 2019). To be clear, individual sources of variation were not quantified in this study, and our samples represent all sources of variation integrated in that unique time and place. That said, any diffusion/dilution due to currents and tides would have a conservative effect on our ability to detect mantas. In other words, oceanographic mixing would increase non-detections, making positive detections more conservative. In situ, eDNA experiments have indicated degradation within 2–7.5 h of a point source (Murakami et al., 2019; Ely et al., 2021). Laboratory studies have shown that rates of eDNA degradation are highly dependent on variables like water temperature, ultraviolet (UV) irradiation, and microbial activity levels (Strickler et al., 2015).
We found evidence for a temporal scale of detection that allowed us to infer a maximum window of detection by discriminating manta presence within 48–72 h after detection (Figures 3C, E). This means that a positive detection indicates the presence of mantas within the previous 3 days and is unlikely to be influenced by manta occupancy before that. For example, in the summer of 2022, four sampling events occurred within 11 days. During this time frame, there was both detection and non-detection at the same sites, which allowed us to estimate the temporal scale of eDNA viability/degradation. On 8 July 2022, there was no detection; on 12 July 2022 there was detection; and then on 15 July 2022, there was no detection (Figure 3E), suggesting an eDNA degradation rate of approximately 72 h or less. A similar degradation rate of 48 h was observed in Kane’ohe Bay during a 2019 pilot study (Crow, unpublished data).
4.5 eDNA detection, concentration, and relative abundance
Many of our samples were below the statistical LOD; however, Hobbs et al. (2019) and Klymus et al. (2020) argued that samples below the LOD should not be thrown out. In studies where target DNA is rare or ephemeral, low concentration detections can still give meaningful information. Even if we omit all detections below the LOD, we would still have clear patterns of seasonality with peak occupancy and relative concentration at the end of June/early July, two high-concentration detections in September/early October, and one detection in February. Furthermore, the nature of detecting distribution patterns of mantas in the wild is expected to be ephemeral. It is not possible to have any kind of positive control site with confirmed occupancy in 95% of samples taken at a particular place or time. Instead, we calculated the LOD from known concentrations in a 10× serial dilution, to confirm consistency in our assay.
Several factors affect eDNA, such as shedding rates (Wilcox et al., 2016; Andruszkiewicz et al., 2019), variation in decay rates (Pilliod et al., 2014), substrate (Snyder et al., 2023), currents, particle size (Barnes et al., 2021), and the eDNA source (i.e., blood, skin cells, slime, and feces). In the current study, a positive detection could be based on one manta ray that was recently nearby, or multiple manta rays that are further away and/or present less recently. While exact population counts are impossible to ascertain using eDNA (Tillotson et al., 2018), it offers a unique opportunity that yields valuable and essential information (Beng and Corlett, 2020). We used absolute quantification based on a serial dilution to make samples directly comparable, allowing inferences about the relative abundance of manta rays between samples to be considered. For example, twice the concentration in the same sampling location with otherwise consistent eDNA degradation rates could mean twice the abundance of mantas, albeit averaged across the spatial and temporal scale of detection, which is based on degradation rates of eDNA.
4.6 Conclusions
We characterized both temporal and spatial variation in manta occurrence off O’ahu using eDNA. We found seasonal patterns of nearshore manta distribution, with higher occupancy during the summer and early fall that may be associated with calm weather conditions, warming, and/or predator avoidance. We found no correlation between plankton abundance or assemblage (i.e., species diversity based on size, using an 80-μm mesh net) and the presence of mantas. However, this lack of correlation between plankton assemblage is consistent with the emerging scenario that the manta diet is primarily derived from deep, offshore environments.
These findings contribute to a growing understanding of manta ecology, movement, and variation in nearshore habitat use in the Hawaiian Islands, and to our knowledge, this is the first study to address patterns of distribution and seasonality of mantas of this scale, around the island of O’ahu. The study also highlights the importance of integrating oceanographic and behavioral data to fully understand the drivers of their distribution. Future research should explore how offshore feeding patterns, vertical movement patterns, and broader ocean conditions (e.g., temperature, upwelling, tides, and currents) influence manta abundance and distribution near coastlines.
From a conservation perspective, understanding the seasonality and environmental drivers of manta occurrences can inform the timing and location of protective measures. Locally, this informs more targeted management of human activity in key nearshore habitats during periods of higher manta occupancy. Globally, these insights emphasize the value of eDNA as a non-invasive tool for monitoring wide-ranging, vulnerable, and elusive marine species—especially in areas where traditional survey methods and data are limited.
Data availability statement
The datasets presented in this study can be found in online repositories. The names of the repository/repositories and accession number(s) can be found below: https://doi.org/10.6084/m9.figshare.26406406.
Author contributions
GT-C: Conceptualization, Data curation, Formal analysis, Funding acquisition, Investigation, Methodology, Resources, Validation, Visualization, Writing – original draft, Writing – review & editing. MJ: Conceptualization, Funding acquisition, Formal analysis, Investigation, Methodology, Supervision, Writing – original draft, Writing – review & editing. KC: Conceptualization, Funding acquisition, Investigation, Methodology, Project administration, Resources, Supervision, Validation, Visualization, Writing – original draft, Writing – review & editing.
Funding
The author(s) declare financial support was received for the research and/or publication of this article. This work was supported by Earl H. Myers & Ethel M. Myers Oceanographic & Marine Biology Trust, CSU Program for Education and Research in Biotechnology (CSUPERB), and CSU Council on Ocean Affairs, Science, and Technology (COAST). Support for this publication was provided by the National Science Foundation Grant OPP 2222558 to M. Jungbluth.
Acknowledgments
We would like to thank the following for contributing financially to the success of this project: Dr. Earl H. Myers & Ethel M. Myers Oceanographic & Marine Biology Trust, CSU Program for Education and Research in Biotechnology (CSUPERB), and CSU Council on Ocean Affairs, Science, and Technology (COAST). We would also like to thank Colleen Ingram for her qPCR expertise and assistance trouble shooting. We also thank Richard Coleman for his help creating the O’ahu and Kāneʻohe Bay map. Additionally, we would like to thank the following for providing physical and/or emotional support: Breana N. Goldman, Esprit Heestand Saucier, Corey Nevals, J Ungos, Willow Wise, Taylor Cunningham, Jason Jones, Brian Bowen, Trent and Andrea Tuthill, Mitchell Christensen, and all others who helped along the way.
Conflict of interest
The authors declare that the research was conducted in the absence of any commercial or financial relationships that could be construed as a potential conflict of interest.
The author(s) declared that they were an editorial board member of Frontiers, at the time of submission. This had no impact on the peer review process and the final decision.
Generative AI statement
The author(s) declare that no Generative AI was used in the creation of this manuscript.
Any alternative text (alt text) provided alongside figures in this article has been generated by Frontiers with the support of artificial intelligence and reasonable efforts have been made to ensure accuracy, including review by the authors wherever possible. If you identify any issues, please contact us.
Publisher’s note
All claims expressed in this article are solely those of the authors and do not necessarily represent those of their affiliated organizations, or those of the publisher, the editors and the reviewers. Any product that may be evaluated in this article, or claim that may be made by its manufacturer, is not guaranteed or endorsed by the publisher.
Supplementary material
The Supplementary Material for this article can be found online at: https://www.frontiersin.org/articles/10.3389/fmars.2025.1655518/full#supplementary-material
References
Anderson R. C., Adam M. S., and Goes J. I. (2011). From monsoons to mantas: seasonal distribution of Manta alfredi in the Maldives. Fisheries Oceanography 20, 104–113. doi: 10.1111/j.1365-2419.2011.00571.x
Andruszkiewicz E. A., Koseff J. R., Fringer O. B., Ouellette N. T., Lowe A. B., Edwards C. A., et al. (2019). Modeling environmental DNA transport in the coastal ocean using lagrangian particle tracking. Front. Mar. Sci. 6. doi: 10.3389/fmars.2019.00477
Andrzejaczek S., Schallert R. J., Forsberg K., Arnoldi N. S., Cabanillas-Torpoco M., Purizaca W., et al. (2021). Reverse diel vertical movements of oceanic manta rays off the northern coast of Peru and implications for conservation. Ecol. Sol Evidence 2, e12051. doi: 10.1002/2688-8319.12051
Armstrong A. O., Armstrong A. J., Jaine F. R. A., Couturier L. I. E., Fiora K., Uribe-Palomino J., et al. (2016). Prey density threshold and tidal influence on reef manta ray foraging at an aggregation site on the great barrier reef. PloS One 11, e0153393. doi: 10.1371/journal.pone.0153393
Armstrong A. O., Stevens G. M. W., Townsend K. A., Murray A., Bennett M. B., Armstrong A. J., et al. (2021). Reef manta rays forage on tidally driven, high density zooplankton patches in Hanifaru Bay, Maldives. PeerJ 9, e11992. doi: 10.7717/peerj.11992
Barnes M. A., Chadderton W. L., Jerde C. L., Mahon A. R., Turner C. R., and Lodge D. M. (2021). Environmental conditions influence eDNA particle size distribution in aquatic systems. Environ. DNA 3, 643–653. doi: 10.1002/edn3.160
Beng K. C. and Corlett R. T. (2020). Applications of environmental DNA (eDNA) in ecology and conservation: opportunities, challenges and prospects. Biodivers Conserv. 29, 2089–2121. doi: 10.1007/s10531-020-01980-0
Braun C. D., Skomal G. B., Thorrold S. R., and Berumen M. L. (2014). Diving behavior of the reef manta ray links coral reefs with adjacent deep pelagic habitats. PloS One 9, e88170. doi: 10.1371/journal.pone.0088170
Burgess K. B., Couturier L. I. E., Marshall A. D., Richardson A. J., Weeks S. J., and Bennett M. B. (2016). Manta birostris, predator of the deep? Insight into the diet of the giant manta ray through stable isotope analysis. R. Soc Open Sci. 3, 160717. doi: 10.1098/rsos.160717
Coleman R. R., Kraft D. W., Hoban M. L., Toonen R. J., and Bowen B. W. (2023). Genomic assessment of larval odyssey: self-recruitment and biased settlement in the Hawaiian surgeonfish Acanthurus triostegus sandvicensis. J. Fish Biol. 102, 581–595. doi: 10.1111/jfb.15294
Costa B. M., Poti M., Winship A., Miller P., and Gove J. (2016). “Chapter 2 Environmental Setting: Marine Biogeographic Assessment of the Main Hawaiian Islands,” in OCS Study BOEM 2016–035 and NOAA Technical Memorandum NOS NCCOS 214 (Silver Spring, Maryland (MD): Bureau of Ocean Energy Management and National Oceanic and Atmospheric Administration), 359.
Couturier L. I. E., Marshall A. D., Jaine F. R. A., Kashiwagi T., Pierce S. J., Townsend K. A., et al. (2012). Biology, ecology and conservation of the Mobulidae. J. Fish Biol. 80, 1075–1119. doi: 10.1111/j.1095-8649.2012.03264.x
Couturier L., Newman P., Jaine F., Bennett M., Venables W., Cagua E., et al. (2018). Variation in occupancy and habitat use of Mobula alfredi at a major aggregation site. Mar. Ecol. Prog. Ser. 599, 125–145. doi: 10.3354/meps12610
Couturier L. I. E., Rohner C. A., Richardson A. J., Marshall A. D., Jaine F. R. A., Bennett M. B., et al. (2013). Stable isotope and signature fatty acid analyses suggest reef manta rays feed on demersal zooplankton. PloS One 8, e77152. doi: 10.1371/journal.pone.0077152
Deakos M. H. (2012). The reproductive ecology of resident manta rays (Manta alfredi) off Maui, Hawaii, with an emphasis on body size. Environ. Biol. Fish 94, 443–456. doi: 10.1007/s10641-011-9953-5
Deakos M., Baker J., and Bejder L. (2011). Characteristics of a manta ray Manta alfredi population off Maui, Hawaii, and implications for management. Mar. Ecol. Prog. Ser. 429, 245–260. doi: 10.3354/meps09085
Dewar H., Mous P., Domeier M., Muljadi A., Pet J., and Whitty J. (2008). Movements and site fidelity of the giant manta ray, Manta birostris, in the Komodo Marine Park, Indonesia. Mar. Biol. 155, 121–133. doi: 10.1007/s00227-008-0988-x
Divi R. V., Strother J. A., and Paig-Tran E. W. M. (2018). Manta rays feed using ricochet separation, a novel nonclogging filtration mechanism. Sci. Adv. 4, eaat9533. doi: 10.1126/sciadv.aat9533
Ely T., Barber P. H., Man L., and Gold Z. (2021). Short-lived detection of an introduced vertebrate eDNA signal in a nearshore rocky reef environment. PloS One 16, e0245314. doi: 10.1371/journal.pone.0245314
Ford H. V., Gove J. M., Healey J. R., Davies A. J., Graham N. A. J., and Williams G. J. (2024). Recurring bleaching events disrupt the spatial properties of coral reef benthic communities across scales. Remote Sens Ecol. Conserv. 10, 39–55. doi: 10.1002/rse2.355
Furlan E. M., Gleeson D., Hardy C. M., and Duncan R. P. (2016). A framework for estimating the sensitivity of eDNA surveys. Mol. Ecol. Resour. 16, 641–654. doi: 10.1111/1755-0998.12483
Gargan L. M., Morato T., Pham C. K., Finarelli J. A., Carlsson J. E. L., and Carlsson J. (2017). Development of a sensitive detection method to survey pelagic biodiversity using eDNA and quantitative PCR: a case study of devil ray at seamounts. Mar. Biol. 164, 112. doi: 10.1007/s00227-017-3141-x
Harris J. L., Hosegood P., Embling C. B., Williamson B. J., and Stevens G. M. W. (2024). Spatiotemporal variations in reef manta ray (Mobula alfredi) residency at a remote meso-scale habitat and its importance in future spatial planning. Aquat. Conserv. 34, e4089. doi: 10.1002/aqc.4089
Harris J. L., McGregor P. K., Oates Y., and Stevens G. M. W. (2020). Gone with the wind: Seasonal distribution and habitat use by the reef manta ray (Mobula alfredi) in the Maldives, implications for conservation. Aquat. Conserv: Mar. Freshw. Ecosyst. 30, 1649–1664. doi: 10.1002/aqc.3350
Harris J. L. and Stevens G. M. W. (2021). Environmental drivers of reef manta ray (Mobula alfredi) visitation patterns to key aggregation habitats in the Maldives. PloS One 16, e0252470. doi: 10.1371/journal.pone.0252470
Hobbs J., Round J. M., Allison M. J., and Helbing C. C. (2019). Expansion of the known distribution of the coastal tailed frog, Ascaphus truei, in British Columbia, Canada, using robust eDNA detection methods. PloS One 14, e0213849. doi: 10.1371/journal.pone.0213849
Holden M. J. (1974). Problems in the Rational Explotation of Elasmobranch Population and Some Suggested Solutions. Ed. Harden-Jones F. R. (New York: John Wiley and Sons).
Hooff R. C. and Peterson W. T. (2006). Copepod biodiversity as an indicator of changes in ocean and climate conditions of the northern California current ecosystem. Limnology Oceanography 51, 2607–2620. doi: 10.4319/lo.2006.51.6.2607
Jiang J., Alderisio K. A., Singh A., and Xiao L. (2005). Development of procedures for direct extraction of cryptosporidium DNA from water concentrates and for relief of PCR inhibitors. Appl. Environ. Microbiol. 71, 1135–1141. doi: 10.1128/AEM.71.3.1135-1141.2005
Jungbluth M. J., Goetze E., and Lenz P. H. (2013). Measuring copepod naupliar abundance in a subtropical bay using quantitative PCR. Mar. Biol. 160, 3125–3141. doi: 10.1007/s00227-013-2300-y
Jungbluth M. J. and Lenz P. H. (2013). Copepod diversity in a subtropical bay based on a fragment of the mitochondrial COI gene. J. Plankton Res. 35, 630–643. doi: 10.1093/plankt/fbt015
Kemp B. M. and Smith D. G. (2005). Use of bleach to eliminate contaminating DNA from the surface of bones and teeth. Forensic Sci. Int. 154, 53–61. doi: 10.1016/j.forsciint.2004.11.017
Klymus K. E., Merkes C. M., Allison M. J., Goldberg C. S., Helbing C. C., Hunter M. E., et al. (2020). Reporting the limits of detection and quantification for environmental DNA assays. Environ. DNA 2, 271–282. doi: 10.1002/edn3.29
Koziol A., Stat M., Simpson T., Jarman S., DiBattista J. D., Harvey E. S., et al. (2019). Environmental DNA metabarcoding studies are critically affected by substrate selection. Mol. Ecol. Resour 19, 366–376. doi: 10.1111/1755-0998.12971
Lafferty K. D., Benesh K. C., Mahon A. R., Jerde C. L., and Lowe C. G. (2018). Detecting southern california’s white sharks with environmental DNA. Front. Mar. Sci. 5. doi: 10.3389/fmars.2018.00355
Lassauce H., Chateau O., Erdmann M. V., and Wantiez L. (2020). Diving behavior of the reef manta ray (Mobula alfredi) in New Caledonia: More frequent and deeper night-time diving to 672 meters. PloS One 15, e0228815. doi: 10.1371/journal.pone.0228815
Mariani S., Fernandez C., Baillie C., Magalon H., and Jaquemet S. (2021). Shark and ray diversity, abundance and temporal variation around an Indian Ocean Island, inferred by eDNA metabarcoding. Conservat Sci. Prac 3, e407. doi: 10.1111/csp2.407
Marshall A. D. and Bennett M. B. (2010). Reproductive ecology of the reef manta ray Manta alfredi in southern Mozambique. J. Fish Biol. 77, 169–190. doi: 10.1111/j.1095-8649.2010.02669.x
McMurdie P. J. and Holmes S. (2013). phyloseq: an R package for reproducible interactive analysis and graphics of microbiome census data. PloS One 8, e61217. doi: 10.1371/journal.pone.0061217
Mobley J. R., Mazzuca L., Craig A. S., Newcomer M. W., and Spitz S. S. (2001). Killer whales (Orcinus orca) sighted west of ni’ihau, hawai’i. Pacific Sci. 55, 301–303. doi: 10.1353/psc.2001.0023
Moore S. K., Trainer V. L., Mantua N. J., Parker M. S., Laws E. A., Backer L. C., et al. (2008). Impacts of climate variability and future climate change on harmful algal blooms and human health. Environ. Health 7, S4. doi: 10.1186/1476-069X-7-S2-S4
Moy K. V., Rieser A., Kelley L., Bejder L., and Wiener C. (2020). Geography and Environment. Honolulu, HI: University of Hawaiʻi at Mānoa, Department of Geography and Environment.
Murakami H., Yoon S., Kasai A., Minamoto T., Yamamoto S., Sakata M. K., et al. (2019). Dispersion and degradation of environmental DNA from caged fish in a marine environment. Fish Sci. 85, 327–337. doi: 10.1007/s12562-018-1282-6
Nagler M., Podmirseg S. M., Ascher-Jenull J., Sint D., and Traugott M. (2022). Why eDNA fractions need consideration in biomonitoring. Mol. Ecol. Resour. 22, 2458–2470. doi: 10.1111/1755-0998.13658
NOAA (2025). National data buoy Center. NOAA. Real−Time Wind, Wave, and Atmospheric Observations. Available online at: https://www.ndbc.noaa.gov/ (Accessed January 01, 2025).
Okuhata B. K., Delevaux J. M. S., Richards Donà A., Smith C. M., Gibson V. L., Dulai H., et al. (2023). Effects of multiple drivers of environmental change on native and invasive macroalgae in nearshore groundwater dependent ecosystems. Water Resour. Res. 59, e2023WR034593. doi: 10.1029/2023WR034593
Pardo S. A., Kindsvater H. K., Reynolds J. D., and Dulvy K. (2016). Maximum intrinsic rate of population increase in sharks, rays, and chimaeras: the importance of survival to maturity. Can. J. Fish. Aquat. Sci. 73, 1159–1163. doi: 10.1139/cjfas-2016-0069
Pilliod D. S., Goldberg C. S., Arkle R. S., and Waits L. P. (2014). Factors influencing detection of eDNA from a stream-dwelling amphibian. Mol. Ecol. Resour. 14, 109–116. doi: 10.1111/1755-0998.12159
Poortvliet M. (2015). Genetics of manta and devil rays: Evolution, population genetics and conservation of a group of vulnerable pelagic filter-feeders. [Thesis fully internal (DIV), University of Groningen]. University of Groningen.
Port J. A., O’Donnell J. L., Romero-Maraccini O. C., Leary P. R., Litvin S. Y., Nickols K. J., et al. (2016). Assessing vertebrate biodiversity in a kelp forest ecosystem using environmental DNA. Mol. Ecol. 25, 527–541. doi: 10.1111/mec.13481
Sasko D. E., Dean M. N., Motta P. J., and Hueter R. E. (2006). Prey capture behavior and kinematics of the Atlantic cownose ray, Rhinoptera bonasus. Zoology 109.
Schabacker J. C., Amish S. J., Ellis B. K., Gardner B., Miller D. L., Rutledge E. A., et al. (2020). Increased eDNA detection sensitivity using a novel high-volume water sampling method. Environ. DNA 2, 244–251. doi: 10.1002/edn3.63
Setyawan E., Mambrasar R., Sianipar A. B., Hasan A. W., Putra M. I. H., Mofu I., et al. (2024). Insights into the visitations of oceanic manta rays at cleaning stations on coral reefs in the Bird’s Head Seascape, eastern Indonesia. Front. Fish Sci. 2. doi: 10.3389/frish.2024.1432244
Sigsgaard E. E., Nielsen I. B., Bach S. S., Lorenzen E. D., Robinson D. P., Knudsen S. W., et al. (2016). Population characteristics of a large whale shark aggregation inferred from seawater environmental DNA. Nat. Ecol. Evol. 1, 4. doi: 10.1038/s41559-016-0004
Simmons M., Tucker A., Chadderton W. L., Jerde C. L., and Mahon A. R. (2016). Active and passive environmental DNA surveillance of aquatic invasive species. Can. J. Fish. Aquat. Sci. 73, 76–83. doi: 10.1139/cjfas-2015-0262
Snyder E. D., Tank J. L., Brandão-Dias P. F. P., Bibby K., Shogren A. J., Bivins A. W., et al. (2023). Environmental DNA (eDNA) removal rates in streams differ by particle size under varying substrate and light conditions. Sci. Total Environ. 903, 166469. doi: 10.1016/j.scitotenv.2023.166469
Stevens G. M. W. (2016). Conservation and population ecology of Manta Rays in the Maldives. PhD Thesis. York, North Yorkshire, England, United Kingdom: University of York.
Stewart J. D., Jaine F. R. A., Armstrong A. J., Armstrong A. O., Bennett M. B., Burgess K. B., et al. (2018). Research priorities to support effective manta and devil ray conservation. Front. Mar. Sci. 5. doi: 10.3389/fmars.2018.00314
Strickler K. M., Fremier A. K., and Goldberg C. S. (2015). Quantifying effects of UV-B, temperature, and pH on eDNA degradation in aquatic microcosms. Biol. Conserv. 183, 85–92. doi: 10.1016/j.biocon.2014.11.038
Strike E. M., Harris J. L., Ballard K. L., Hawkins J. P., Crockett J., and Stevens G. M. W. (2022). Sublethal Injuries and Physical Abnormalities in Maldives Manta Rays, Mobula alfredi and Mobula birostris. Front. Mar. Sci. 9. doi: 10.3389/fmars.2022.773897
Terrapon M., Venables S. K., Lokker A., Bertrand N., Hooker S. K., and Marshall A. D. (2024). Killer Whale Predation on a Giant Manta Ray (Mobula birostris), a Sicklefin Devil Ray (Mobula tarapacana ) and a Tiger Shark (Galeocerdo cuvier) in the Southwest Indian Ocean. Afr J. Ecol. 62, e13342. doi: 10.1111/aje.13342
Thomsen P. F., Kielgast J., Iversen L. L., Møller P. R., Rasmussen M., and Willerslev E. (2012). Detection of a diverse marine fish fauna using environmental DNA from seawater samples. PloS One 7, e41732. doi: 10.1371/journal.pone.0041732
Tillotson M. D., Kelly R. P., Duda J. J., Hoy M., Kralj J., and Quinn T. P. (2018). Concentrations of environmental DNA (eDNA) reflect spawning salmon abundance at fine spatial and temporal scales. Biol. Conserv. 220, 1–11. doi: 10.1016/j.biocon.2018.01.030
Turner C. R., Barnes M. A., Xu C. C. Y., Jones S. E., Jerde C. L., and Lodge D. M. (2014). Particle size distribution and optimal capture of aqueous macrobial eDNA. Methods Ecol. Evol. 5, 676–684. doi: 10.1111/2041-210X.12206
Ward-Paige C. A., Davis B., and Worm B. (2013). Global Population Trends and Human Use Patterns of Manta and Mobula Rays. PLoS One 8 (9), e74835. doi: 10.1371/journal.pone.0074835
Whitney J. L., Coleman R. R., and Deakos M. H. (2023). Genomic evidence indicates small island-resident populations and sex-biased behaviors of Hawaiian reef Manta Rays. BMC Ecol. Evo 23, 31. doi: 10.1186/s12862-023-02130-0
Whitney N. M. and Crow G. L. (2007). Reproductive biology of the tiger shark (Galeocerdo cuvier) in Hawaii. Mar. Biol. 151, 63–70. doi: 10.1007/s00227-006-0476-0
Keywords: environmental DNA, eDNA, Elasmobranchii, Mobula, Hawaii, zooplankton
Citation: Tuthill-Christensen GA, Jungbluth MJ and Crow KD (2025) Elusive and vulnerable: evaluating spatial and temporal variation in the distribution of manta rays around O’ahu using environmental DNA. Front. Mar. Sci. 12:1655518. doi: 10.3389/fmars.2025.1655518
Received: 28 June 2025; Accepted: 25 August 2025;
Published: 01 October 2025.
Edited by:
Punyasloke Bhadury, Indian Institute of Science Education and Research Kolkata, IndiaReviewed by:
Emily Lancaster, Eckerd College, United StatesHugo Lassauce, University of the Sunshine Coast, Australia
Copyright © 2025 Tuthill-Christensen, Jungbluth and Crow. This is an open-access article distributed under the terms of the Creative Commons Attribution License (CC BY). The use, distribution or reproduction in other forums is permitted, provided the original author(s) and the copyright owner(s) are credited and that the original publication in this journal is cited, in accordance with accepted academic practice. No use, distribution or reproduction is permitted which does not comply with these terms.
*Correspondence: Grace Ann Tuthill-Christensen, Zy50dXRoaWxsMjlAZ21haWwuY29t; Karen D. Crow, Y3Jvd0BzZnN1LmVkdQ==