Abstract
Introduction:
In the past, for the evaluation of multiple traits of selected varieties, variance analysis and new multiple range method analysis were generally used to make a single comparative analysis of economic traits among different varieties and traits, and qualitative text descriptions were then used to evaluate the advantages and disadvantages of the tested varieties. However, this method lacks quantitative analysis and comprehensive evaluation, and has a high level of human subjectivity.
Methods:
In order to comprehensively evaluate the high temperature tolerance and fast growth performance of turbot (Scophthalmus maximus), the grey relational analysis (GRA) and the Technique for Order of Preference by Similarity to Ideal Solution (TOPSIS) analysis of upper thermal tolerance (UTT) and body weight (BW) measurements were performed, respectively. Fifty two-trait combination breeding families including 25 UTT♂ × BW♀ families and 25 UTT♀ × BW♂ families were analyzed.
Results:
The GRA showed that the ranges of the equal relational grade and the weighted relational grade were 0.61984–0.94876 and 0.66391–0.94063, respectively. The relational gradation of the equal relational grade and the weighted relational grade of 25 UTT♂ × BW♀ families were higher than those of 25 UTT♀ × BW♂ families, except for UTT10♂ × BW10♀, UTT11♂ × BW11♀, and UTT17♂ × BW17♀ families. UTT23♂ × BW23♀ had the highest equal relational grade and weighted relational grade. TOPSIS analysis results showed that the range of Ci* of the 50 families was 0.066614–0.936093. The Ci* values of 25 UTT♂ × BW♀ families were higher than those of 25 UTT♀ × BW♂ families except for UTT10♂ × BW10♀, UTT11♂ × BW11♀, and UTT17♂ × BW17♀ families. The UTT23♂ × BW23♀ family had the highest Ci*.
Discussion:
It was obvious that, using both the GRA and TOPSIS method, the comprehensive evaluation results of heat tolerance and weight traits in UTT♂ × BW♀ families were generally better than those of UTT♀ × BW♂ families. This showed that a breeding method involving an initial cultivation of a high temperature resistant male strain and fast growing female strain, followed by hybridization between the two strains, may be a strategy worthy of consideration.
1 Introduction
The popularity of new varieties and multi-level markets has led to the breeding of new varieties of animals and plants with multiple favorable target traits, with the primary objective of genetic improvement. At present, there are two ways to achieve this breeding goal. One is traditional cross breeding, where some favorable traits of the parents can be integrated through cross-breeding between varieties (or strains), and then new varieties that meet multiple breeding objectives are selected. The second method involves a multi-trait integrated breeding program, where the aim of multi-trait breeding can be achieved by calculating the comprehensive selection index of multi-traits (Luang et al., 2008). For multi-trait integrated breeding, genetic correlation among selected traits should be considered first. Obviously, genetic improvement can be carried out by multi-trait integrated breeding technology when there is a positive genetic correlation among the improved traits. The higher the positive genetic correlation among traits, the more significant the breeding effect. When there is a negative genetic correlation between breeding traits, because of the antagonistic effect among traits, the cross-breeding method should be used for genetic improvement (Perry et al., 2005; Ma et al., 2018; Wang and Ma, 2019a; Wang et al., 2019b).
Turbot, Scophthalmus maximus, is an economically important flatfish species distributed in the Black Sea, the Mediterranean Sea, the Baltic Sea, and the northeast Atlantic Ocean (Aydin et al., 2022). Suitable water temperatures for turbot range from 16 to 24 °C. Under good water quality conditions, adult turbot can tolerate temperatures of 25 – 26 °C, but not for extended periods. The high and low growth temperature ranges were 21 – 22 °C and 7 – 8 °C, respectively (Wang et al., 2019b). Survival rates of juvenile turbot cultured for 20 days in 4 – 20 °C, 22 – 24 °C, 26 °C, and 28 °C in 20 days were 100%, 80%, 40%, and 0%, respectively (Wang et al., 2019b). Temperature essentially affects physiological, and biochemical life history processes of a fish (Beitinger et al., 2000; Wang et al., 2019b). Abnormally high temperatures would result in a stress response in fish, causing reduced disease resistance, growth rate, feed efficiency ratio, and reproductive activity (Dominguez et al., 2004; Wang et al., 2019b). Thus, the genetic improvement of the upper thermal tolerance of turbot is extremely important in promoting the sustainable and stable development of the industry (Wang et al., 2019b).
Research has shown that negative genetic correlation exists between body weight (BW) and heat tolerance traits of turbot (Ma et al., 2018). Therefore, cross-breeding should be adopted to simultaneously improve the growth rate and temperature tolerance of turbot. For multiple-trait genetic evaluation, there should be a reasonable scientific evaluation system for breeding varieties, in both cross-breeding and multi-trait integrated breeding. In the past, for the evaluation of multiple traits of selected varieties, variance analysis and new multiple range method analysis were generally used to make a single comparative analysis of economic traits among different varieties and traits, and qualitative text descriptions were then used to evaluate the advantages and disadvantages of the tested varieties. However, this method lacks quantitative analysis and comprehensive evaluation, and has a high level of human subjectivity (Song et al., 2002).
The grey relational analysis (GRA) is a multivariate statistical method. It analyses the dynamic changes of a system by quantitative description and comparison. The basic concept of this method is to evaluate the correlation level between sequences by determining the similarity of the geometric shapes of the curves between reference sequences and several comparative columns (Liu et al., 2024b; Liu et al., 2017). The correlation analysis of grey system theory differs from mathematical statistics in four aspects. First, the two methods vary in their theoretical basis. Relational analysis is based on the grey process of grey systems, while correlation analysis is based on stochastic processes of probability theory. Second, the analysis methods differ. Relational analysis is the comparison of a time series among factors, and correlation analysis is the comparison of arrays among factors. Third, the two methods vary in terms of data requirements, with relational analysis requiring relatively little data and correlation analysis requiring more data. Finally, the two methods differ in key research points. Relational analysis mainly studies dynamic processes, while correlation analysis mainly focuses on static states. Therefore, relational analysis is more adaptable and unique to the application of natural sciences. In recent years, with the continuous development of grey system theory, the GRA method has been widely used in comprehensive evaluations of soybean, rice, peanut, and other crops (Zhang et al., 2016; Li et al., 2017; Gao et al., 2018; Liu et al., 2018). However, to date, information available on the application of this method in the evaluation of selected varieties of aquatic animals is limited to that of main growth traits and BW in Japanese flounder (Paralichthys olivaceus) (Liu et al., 2014a).
The Technique for Order Performance by Similarity to Ideal Solution (TOPSIS) is another useful technique for dealing with multivariate problems (Shiha et al., 2007; Behzadian et al., 2012). It helps decision makers organize the problems to be solved, and perform analysis, comparisons, and rankings of the alternatives. Accordingly, the selection of a suitable alternative(s) will be made (Shiha et al., 2007). The basic idea of TOPSIS originates from the concept of a displaced ideal point from which the compromise solution has the shortest distance (Shiha et al., 2007). The TOPSIS method is based on the concept that the chosen alternative should have the shortest distance from the ideal alternative and the farthest distance from the worst alternative. It analyzes the relationship between an alternative and the ideal alternative by their distance relationship (Gu and Song, 2009). In the field of animal and plant breeding, the comprehensive evaluation of multiple traits based on TOPSIS quantities each individual trait as a comparable standardized standard. The positive ideal solution and negative ideal solution of each index are determined. Through the detailed comparison of the differences between the indicators and the calculation of the relative closeness of the comprehensive characteristics of each variety to the ideal solution, objective quantitative standards are provided for breeders to objectively and comprehensively reflect the advantages and disadvantages of the varieties. This method is more reasonable than only using yield analysis and therefore has wide application potential. The TOPSIS method has been widely used in comprehensive evaluations of sugarcane, tobacco, and shellfish (Lu, 2006; Yang et al., 2015; Peng and Chen, 2017). However, its application in the evaluation of selected varieties of aquatic animals has not yet been reported.
In this study, interspecific hybridization was carried out based on incomplete diallel hybridization using parents from fast growing and high temperature resistant strains of turbot (Scophthalmus maximus). Because the GRA reflects the trend relationship between an comparability sequences and the reference sequences (Liu et al., 2014b; Liu et al., 2017), and the TOPSIS method reflects the situation relationship between an alternative and the ideal alternative (Gu and Song, 2009), this study used both methods to comprehensively evaluate high temperature tolerance and fast growth performance in turbot. Relational degree and relational gradation of different families were calculated based on the GRA. The integrated evaluation index{it} C{sb}i{/it} {/sb}was calculated based on TOPSIS. The results provided a theoretical basis for screening hybrid families with dominant combinations, and breeding new turbot varieties of high quality, with high yields and stress resistance.
2 Materials and methods
2.1 Experimental material
The data used in this study were derived from a breeding program initiated in 2007 by the Yellow Sea Fisheries Research Institute, Qingdao, China. A fast-growing strain and an upper thermal tolerance (UTT) strain were obtained by selective breeding of three generations of turbot (Scophthalmus maximus) in Yantai Tianyuan Aquatic Corporation Limited, Yantai, China. Breeding of the fourth generation was carried out in April 2019. Breeding families combining the two traits were constructed based on randomly selected parents from the fast-growing strain and the UTT. One female and one male with good gonadal development were selected for each family from 25 fast-growing families and 25 UTT families. 25 females and 25 males were selected for each breeding strain. Eggs and sperm were collected to construct full-sib families with one male and one female. Eggs and sperm were then blended by stirring slowly, until well distributed. After 5 min, seawater was added while stirring continued. The fertilized eggs were separated by floating, and hatched in an incubator. The newly hatched larvae were transferred to a nursery pond for rearing. A total of 50 combined traits breeding families including 25 UTT♂ × BW♀ families and 25 UTT♀ × BW♂ families were obtained. All experimental treatments for artificially cultivated fish were per formed according to the recommendations in the Guide for the Care and Use of Laboratory Animals of the National Institutes of Health, China. The study protocol followed the recommendations of the Experimental Animal Ethics Committee, Yellow Sea Fisheries Research Institute, Chinese Academy of Fishery Sciences, China. During the experiment, the test fish were cultured in still water with aeration and automatic thermostat control. Fish activity was monitored hourly, and inactive individuals were promptly removed. When weighing the fish, they were handled gently and quickly returned to the breeding pool after measurement.
2.2 Rearing condition
To ensure uniform rearing conditions for all families during the early breeding phase, several measures were implemented to standardize both the feed quantity and the rearing environment. The number of individuals in each family was adjusted to 10,000 at 15 days, 5,000 at 30 days, and 2,000 at 45 days after spawning through random sampling. At two months post-hatching, a random sample of 1,000 fish per family was transferred to dedicated 12 m³ concrete tanks and maintained there until they were 12 months old. The environmental parameters were maintained uniformly across the various rearing phases. For the larval and juvenile stages, the conditions were as follows: water temperature ranged from 13 to 18°C, salinity between 30 and 40, light intensity from 500 to 2,000 lux, pH level of 7.8 to 8.2, and dissolved oxygen levels above 6 mg/L. During the adolescent stage, these parameters were adjusted to: temperature between 15 and 18°C, salinity of 25 to 30, light intensity ranging from 500 to 1,500 lux, pH maintained at 7.6 to 8.2, and dissolved oxygen remaining above 6 mg/L.
2.3 Challenge test and data collection
2,500 animals from 50 families were used to test the UTT (50 animals per family). Fish from each family used in the thermal tolerance challenges were reared in separate tanks for 1 week at 15°C before exposure to thermal challenge. During the entire experimental period, the temperature of fish subjected to thermal shock was increased from 13°C to 28°C. The experiment was complete when all individuals had lost activity. Fish activity was observed every h and individuals that displayed loss of activity were quickly removed. Refer to Zhang et al. (2014), the UTT was calculated as cumulative thermal exposure in degree hours as follows:
where m represents each h up to loss of activity for each individual fish, Tm is the experimental temperature at each h, and {it}T{sb}n{/it} {/sb}is the acclimation temperature. The BW was measured for each individual at the beginning of the experiment. All families were exposed to the same environmental conditions and handling procedures during the entire experimental period to ensure standardization.
2.4 GRA
2.4.1 Forming reference sequences
Sequences of the GRA include a reference sequence and a comparability sequence. The reference sequence is the standard sequence in the GRA, and was recorded as X0. UTT and BW sequences were comparability sequences. According to grey system theory, a grey system was constructed by regarding UTT, BW, and reference sequences as a whole. In the GRA, an “ideal variety” is determined as a reference sequence, X0. The criteria for determining X0 were superior to the tested traits (UTT and BW), and slightly higher than UTT and BW values. Referring to UTT and BW values of cross combination and reciprocal combination (50 families), the ideal values of X0 were given respectively. In this study, X0 values of UTT and BW formed the reference sequence.
2.4.2 Non-dimensional treatment
Because the dimensions of UTT and BW are different, it was impossible to compare them. Therefore, dimensionless treatments of these two traits were needed. That is, a new sequence with values in the range of 0 – 1 could be obtained by dividing the comparability sequence (Xi) by the reference sequence (X0). According to the formula , the absolute differences of the corresponding points of X0 and Xi (UTT and BW) were calculated, respectively.
2.4.3 Grey relational coefficient calculation
The grey relational coefficient is used for determining how close Xi(k) (UTT and BW) is to X0(k). The larger the grey relational coefficient, the closer Xi(k) and X0(k) are. The grey relational coefficient can be calculated using the following formula:
where is the grey relational coefficient between {it}X{sb}i{/it}(k){/sb} and X{sb}0(k){/sb}; and represent the absolute value of second-level minimum and maximum difference, respectively; and are the smallest and largest difference between the Xi and X0 sequence in the corresponding point difference, respectively; and is the distinguishing coefficient, ∈[0,1]. The distinguishing coefficient was set as 0.5.
2.4.4 Grey relational grade calculation
The grey relational grade includes the equal relational grade () and the weighted relational grade (). They can be calculated using the following formula (Fung, 2003; Kuo et al., 2008).
where is the grey relational coefficient; k = 1, 2 …L (number of traits evaluated); is the weight of trait k and usually depends on decision makers’ judgment, or the structure of the proposed problem. In addition, ; and are the grey relational grades between Xi and X0; they represent the level of correlation between the reference sequence and the comparability sequence. The grey relational grade indicates the degree of similarity between the comparability sequence and the reference sequence (Fung, 2003; Kuo et al., 2008). For each trait, the reference sequence represents the best performance that could be achieved among the comparability sequences. Therefore, if a comparability sequence for an alternative achieves the highest grey relational grade with the reference sequence, the comparability sequence is determined as most similar to the reference sequence, and that alternative would be the best choice (Kuo et al., 2008).
Before statistical analysis, outliers were checked using box plots.
2.5 TOPSIS
2.5.1 Non-dimensional treatment of raw data
In this study, both UTT and BW were positive indexes. The following formula can be used for dimensionless treatment of UTT and BW. Pij=Xij/{it}X{sb}j{/it}max{/sb}, [{it}X{sb}j{/it}max{/sb}=max(Xij)].
where {it}X{sb}j{/it}max {/sb}is the target value of the trait (UTT and BW) and represents the target of the jth trait (UTT or BW). Xijis the jth trait value of the ith family.
2.5.2 Normalized decision matrix construction
The normalized decision matrix was constructed using the following formula:
where {it}P{sb}ij{/it} {/sb}and Rijare original and normalized score of the decision matrix, respectively.
According to breeding objectives, the weights of UTT and BW were 0.6 and 0.4, respectively. The weighted normalized decision matrix is constructed using the following formula:
where Wj is the weight for j criterion.
2.5.3 Determining the positive ideal and negative ideal solutions
The positive and negative ideal solutions were determined as follows:
where V*= {max(Vij)}.
where V'= {min(Vij)}.
Using Euclid Norm as distance measure, the separation measures for each family are calculated based on Vn*, Vn', and Vij.
The separation from the positive ideal family is:
S i *= , where = {V1*, V2*}.
Similarly, the separation from the negative ideal family is:
S i'= , where {V1', V2'}.
2.5.4 Calculating the relative closeness to the ideal solution (Ci*)
The relative closeness was calculated using the formula of relative approach degree between families and the ideal solution.
According to the ranking of Ci*, the family with the largest Ci* should be selected.
3 Results
3.1 GRA
3.1.1 Constructing reference sequences
The purpose of this study was to breed a new turbot variety with high temperature tolerance and fast growth. The higher the values of UTT and BW, the stronger the high temperature resistance of the selected varieties, and the faster the growth rate. Therefore, the two indexes of the reference sequence should be slightly larger than the maximum value of the comparability sequence. Based on the UTT and BW measurements of 50 families, the X0 values of UTT and BW were 1,800 h and 320 g, respectively (Figure 1; Supplementary Table S1).
Figure 1
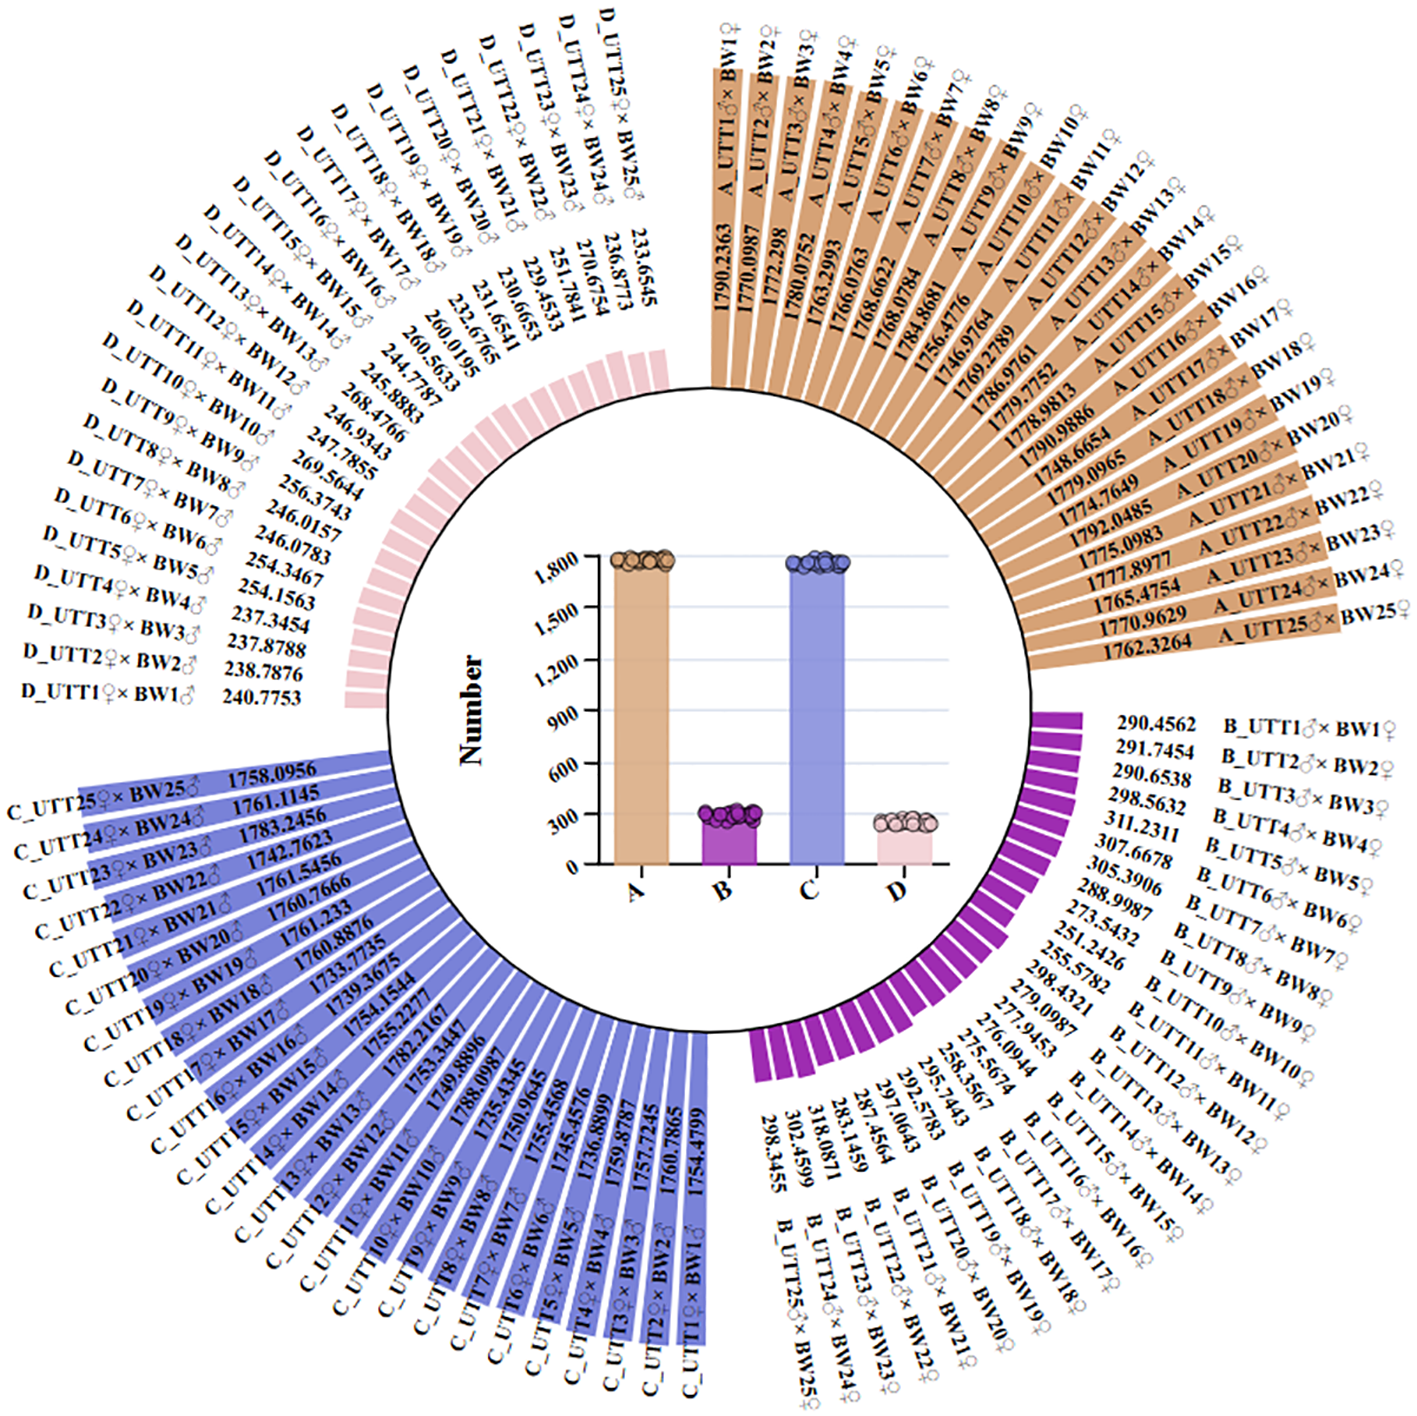
The phenotypic values for UTT/h and BW/g traits in turbot families. (A) The phenotypic values for UTT in cross combination. (B) The phenotypic values for BW in cross combination. (C) The phenotypic values for UTT in reciprocal combination. (D) The phenotypic values for BW in reciprocal combination.
3.1.2 Data processing and relational coefficient calculation
It is difficult to compare UTT with BW due to the large difference between the measured values. Therefore, the original data was transformed into comparable data through dimensionless processing. The initial value method was used. The measured values were divided by the X0 values of the reference sequence, and a new sequence of each index between 0 and 1 was obtained (Figure 2; Supplementary Table S2). A series of standard absolute deviations (△{it}{sb}i{/it}(k){/sb}) were obtained by subtracting the standardized values of the reference sequence X0, from the corresponding indicators of each family (Figure 3; Supplementary Table S3). The minimum standard absolute deviations and the maximum standard absolute deviations were:
Figure 2
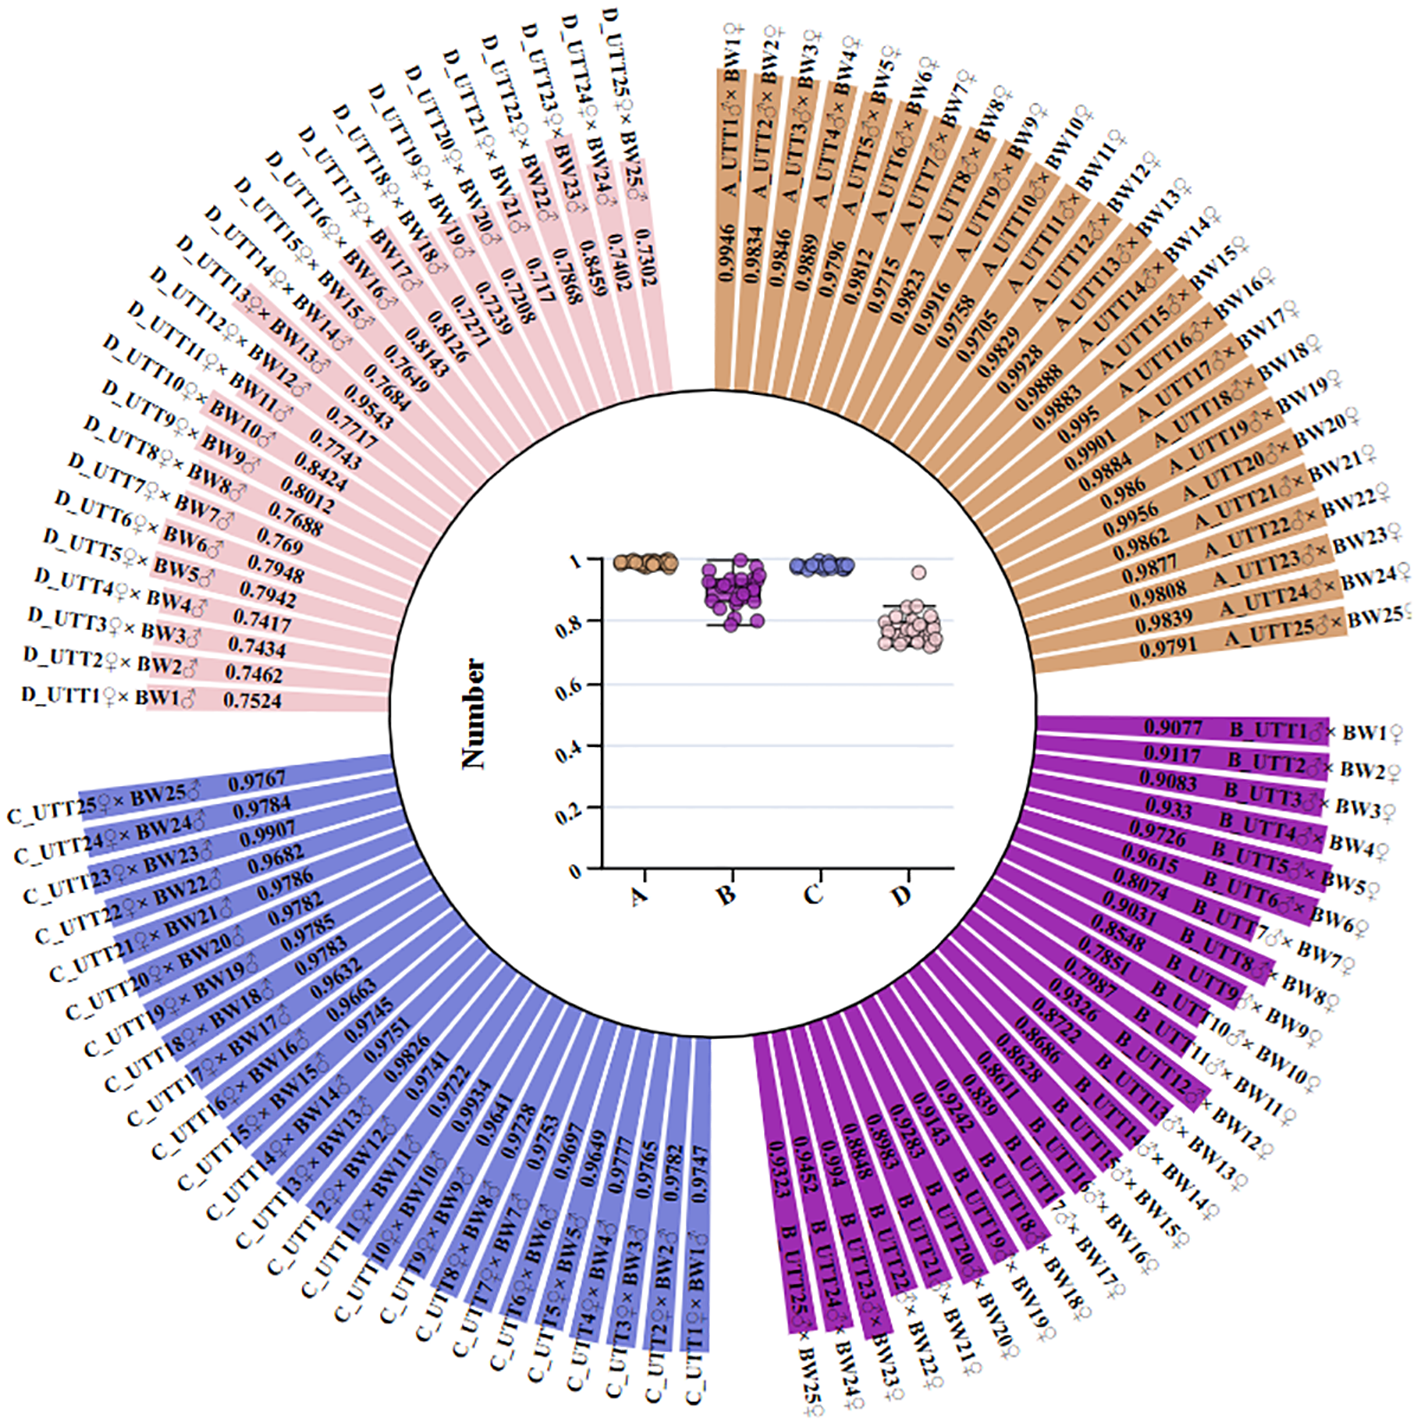
The non-dimensional UTT and BW traits of different families used in the GRA. Reference value is 1. (A) The non-dimensional UTT in cross combination. (B) The non-dimensional BW in cr oss combination. (C) The non-dimensional UTT in reciprocal combination. (D) The non-dimensional BW in reciprocal combination.
Figure 3
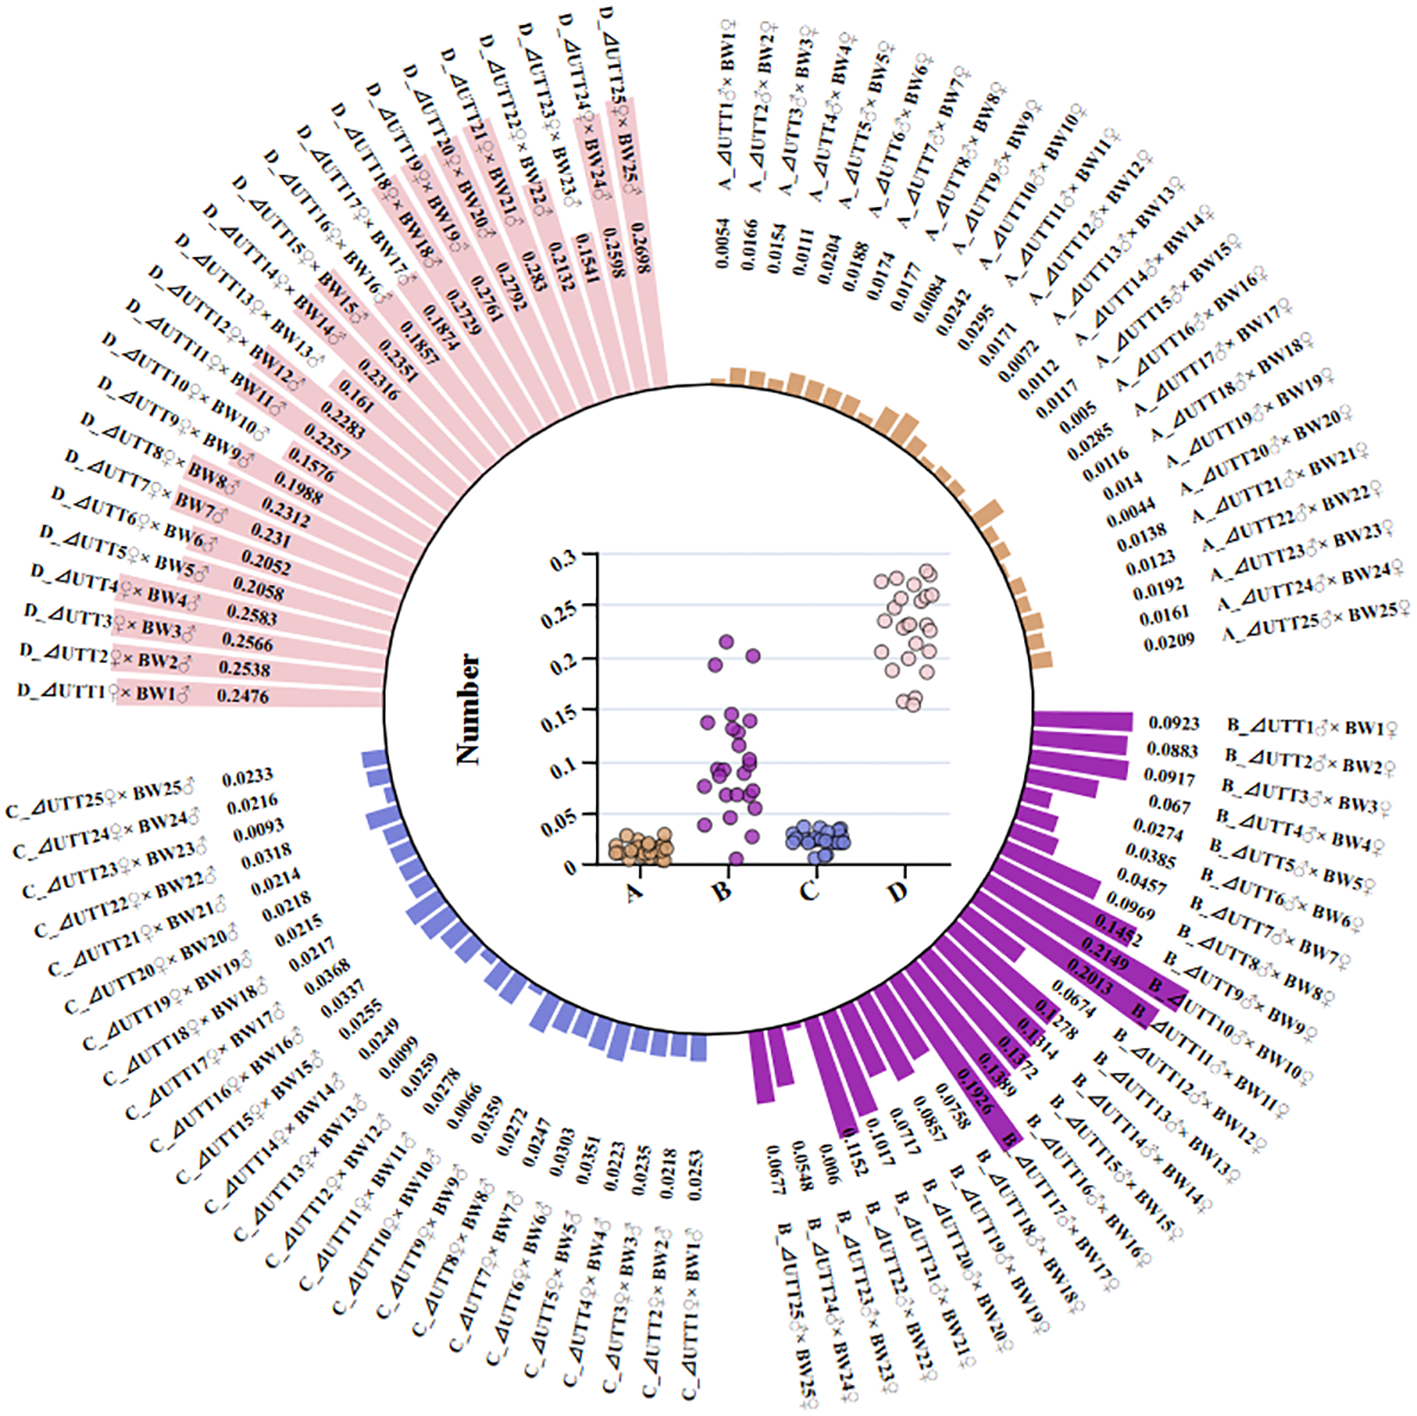
The absolute differences between the reference array and the comparative arrays of different turbot families. (A) The absolute differences in UTT among different cross combinations. (B) The absolute differences in BW among different cross combinations. (C) The absolute differences in UTT among different reciprocal combinations. (D) The absolute differences in BW among different reciprocal combinations.
After calculating △{it}{sb}i{/it}(k), {/sb} and , all grey relational coefficients can be calculated using the following equation = (0.004417 + 0.5 × 0.282958)/(△{it}{sb}i{/it}(k) +{/sb} 0.5 × 0.282958). The complete results for the grey relational coefficients of UTT and BW traits of different turbot families are shown in Figure 4 (Supplementary Table S4).
Figure 4
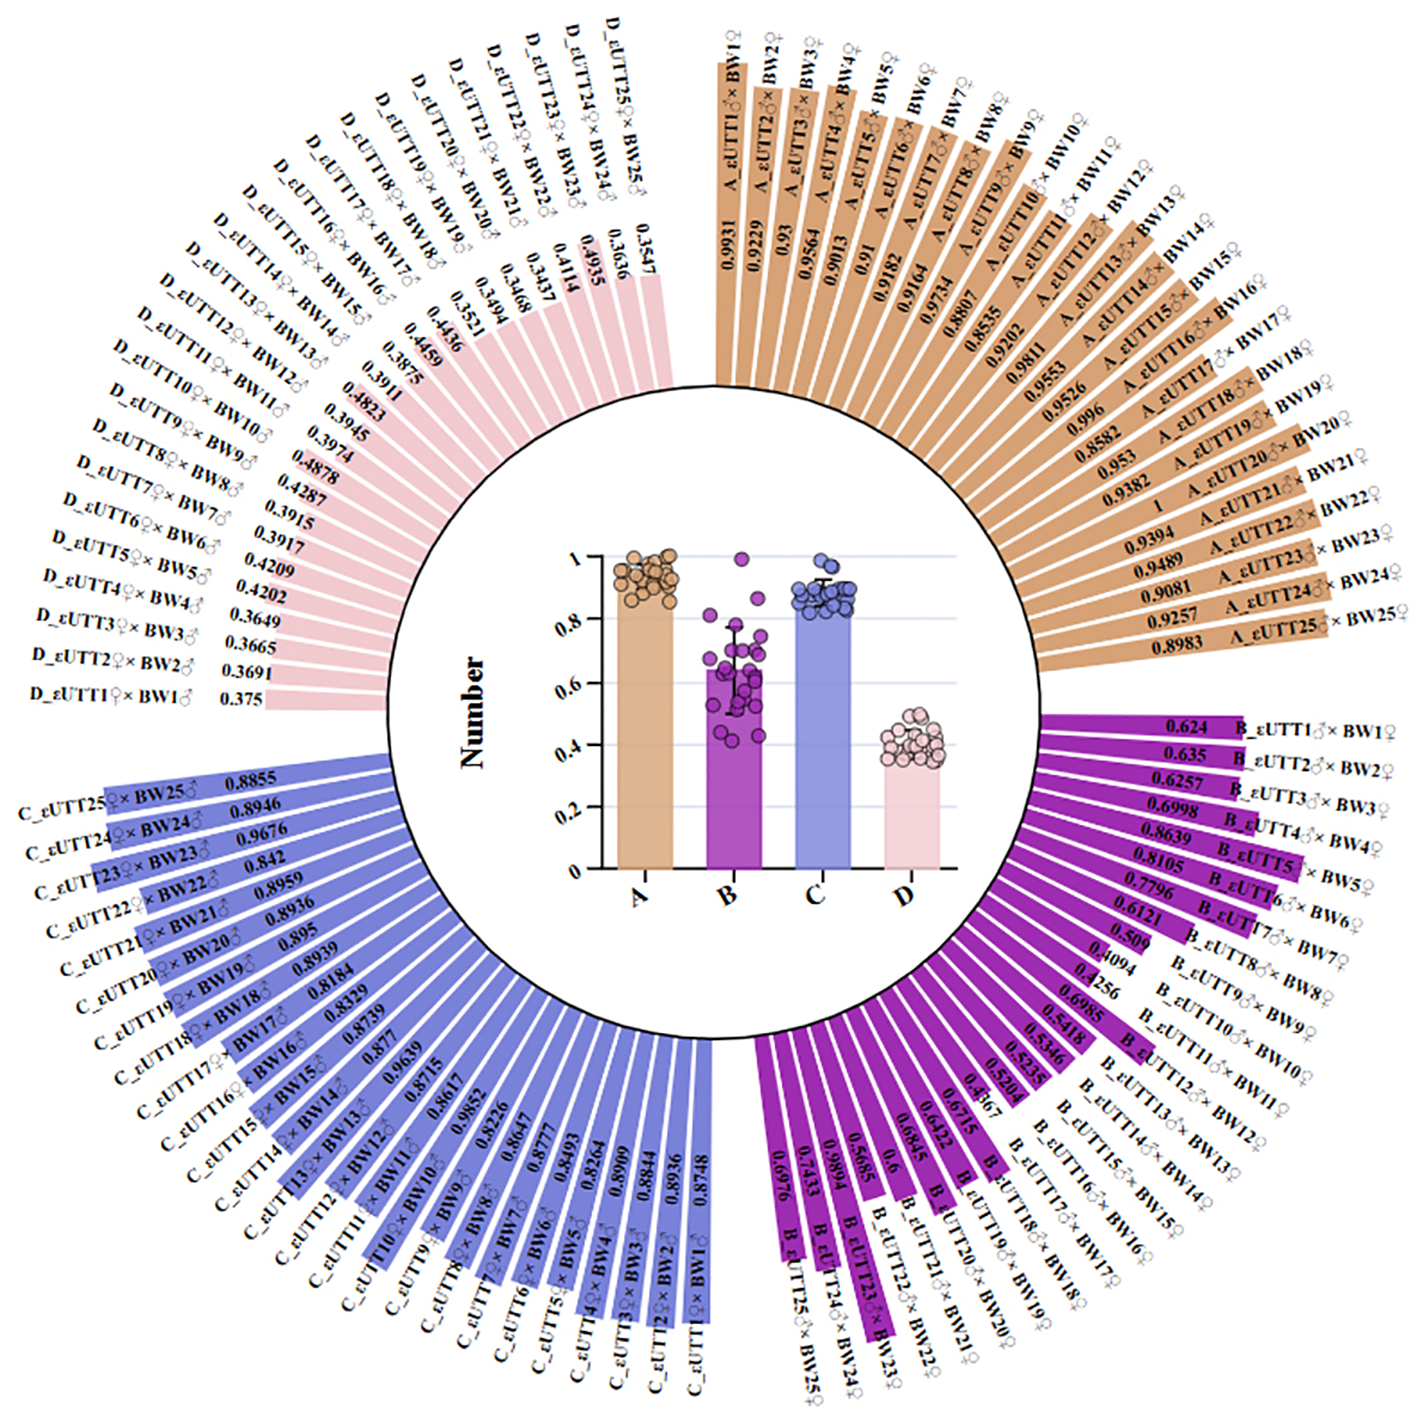
The grey relational coefficients for UTT and BW traits across different turbot families. (A) The grey relational coefficients in UTT among different cross combinations. (B) The grey relational coefficients in BW among different cross combinations. (C) The grey relational coefficients in UTT among different reciprocal combinations. (D) The grey relational coefficients in BW among different reciprocal combinations.
3.1.3 Grey relational grade calculations
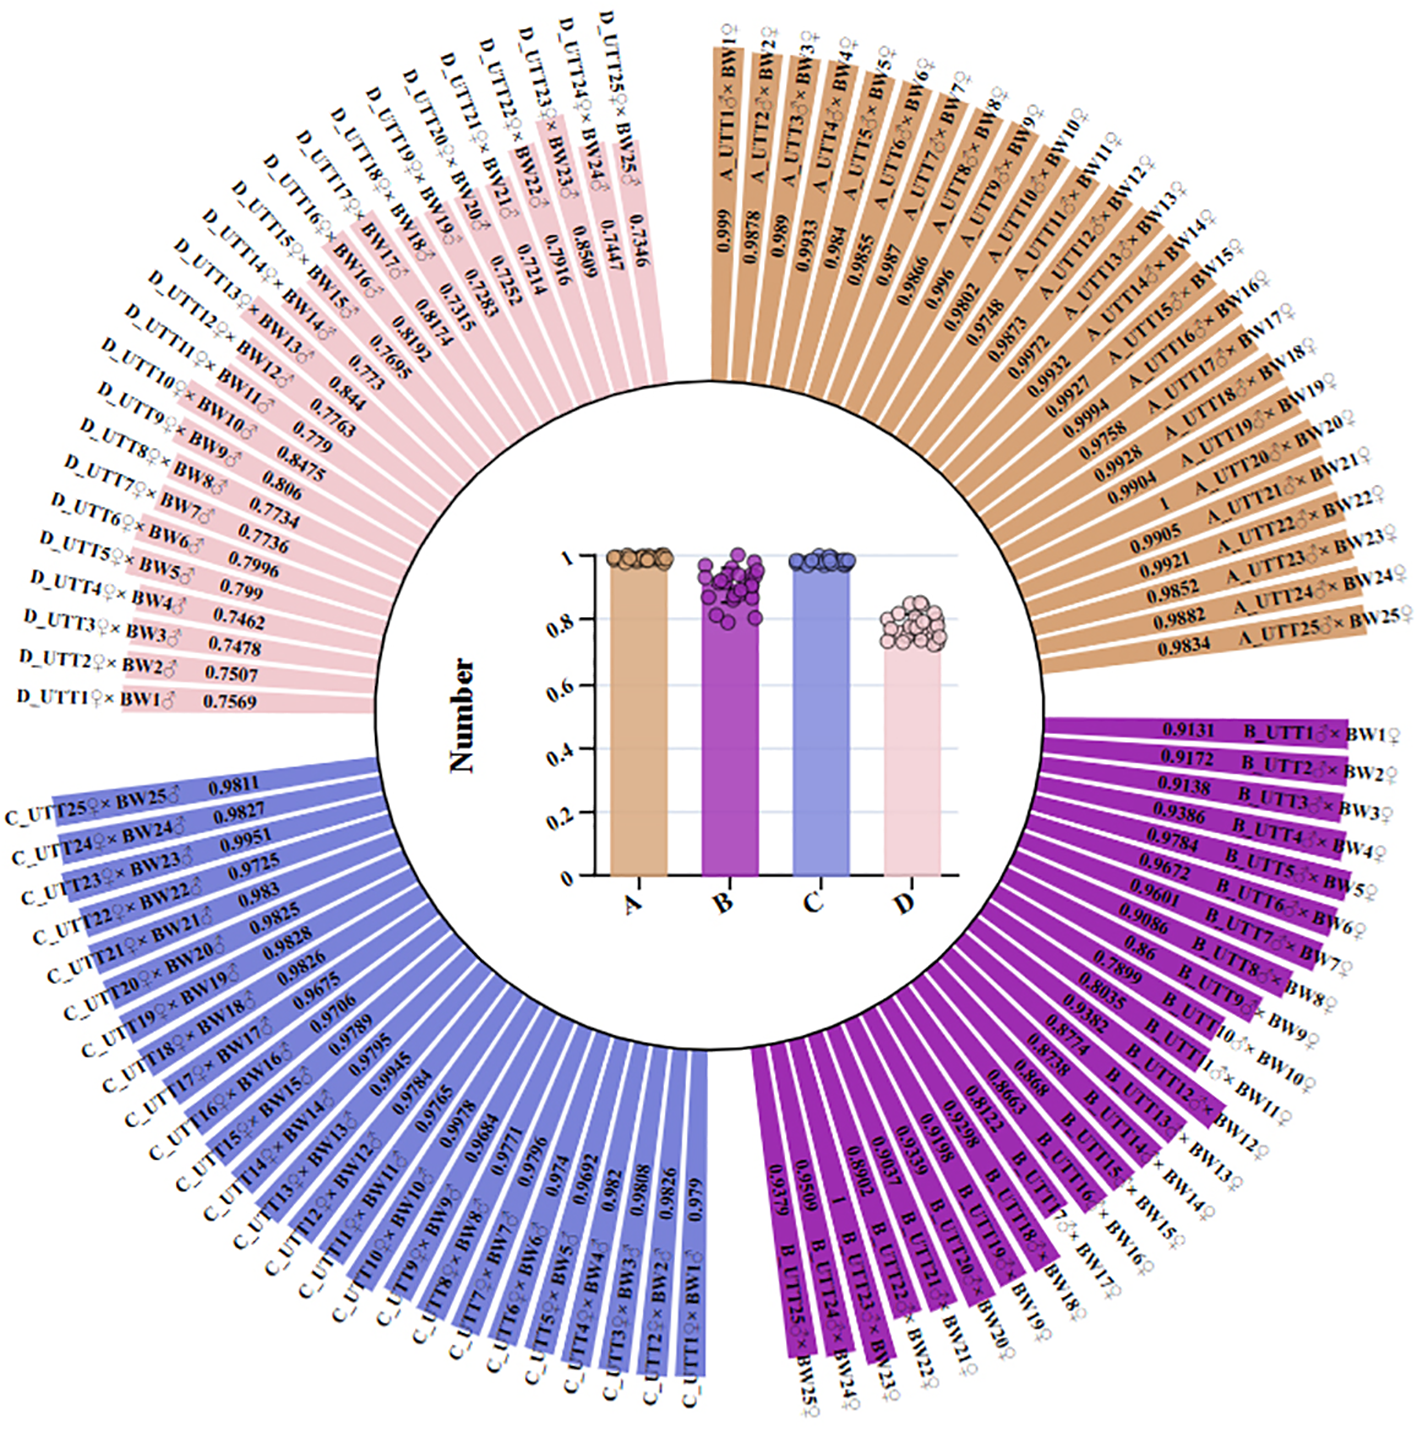
The grey relational grade includes the equal relational grade () and the weighted relational grade (). The equal relational grade is a reflection of importance, under the condition that all indicators are equally important. However, based on the integrated breeding objectives for high temperature tolerance and fast growth traits of turbot, the contribution rates of UTT and BW for a selected variety are different. Therefore, it was necessary to use the weighted relational grade, that is, to assign the weighted value according to the importance of different indicators in the selected variety, and then calculate the weighted relational grade according to the formula. According to breeding objectives, the weights of UTT and BW were 0.6 and 0.4, respectively. The equal relational grades and weighted relational grades of 50 families are shown in Figure 5 (Supplementary Table S5). The ranges of the equal relational grades and weighted relational grades were 0.61984 – 0.94876 and 0.66391 – 0.94063, respectively. The Intraclass Correlation Coefficient (ICC) value between the equal relational grade and the weighted relational grade was 0.963 (95% CI = 0.936 – 0.979), indicating a high degree of consistency between these two measures. Obviously, the relational gradation of the equal relational grade and the weighted relational grade of 50 families were very similar. The UTT23♂ × BW23♀ family had the highest relational gradation for both the equal relational grade and the weighted relational grade. Further observations revealed that the relational gradation of the equal relational grade and the weighted relational grade of 25 UTT♂ × BW♀ families were higher than those of 25 UTT♀ × BW♂ families, except for UTT10♂ × BW10♀, UTT11♂ × BW11♀, and UTT17♂ × BW17♀ families.
Figure 5
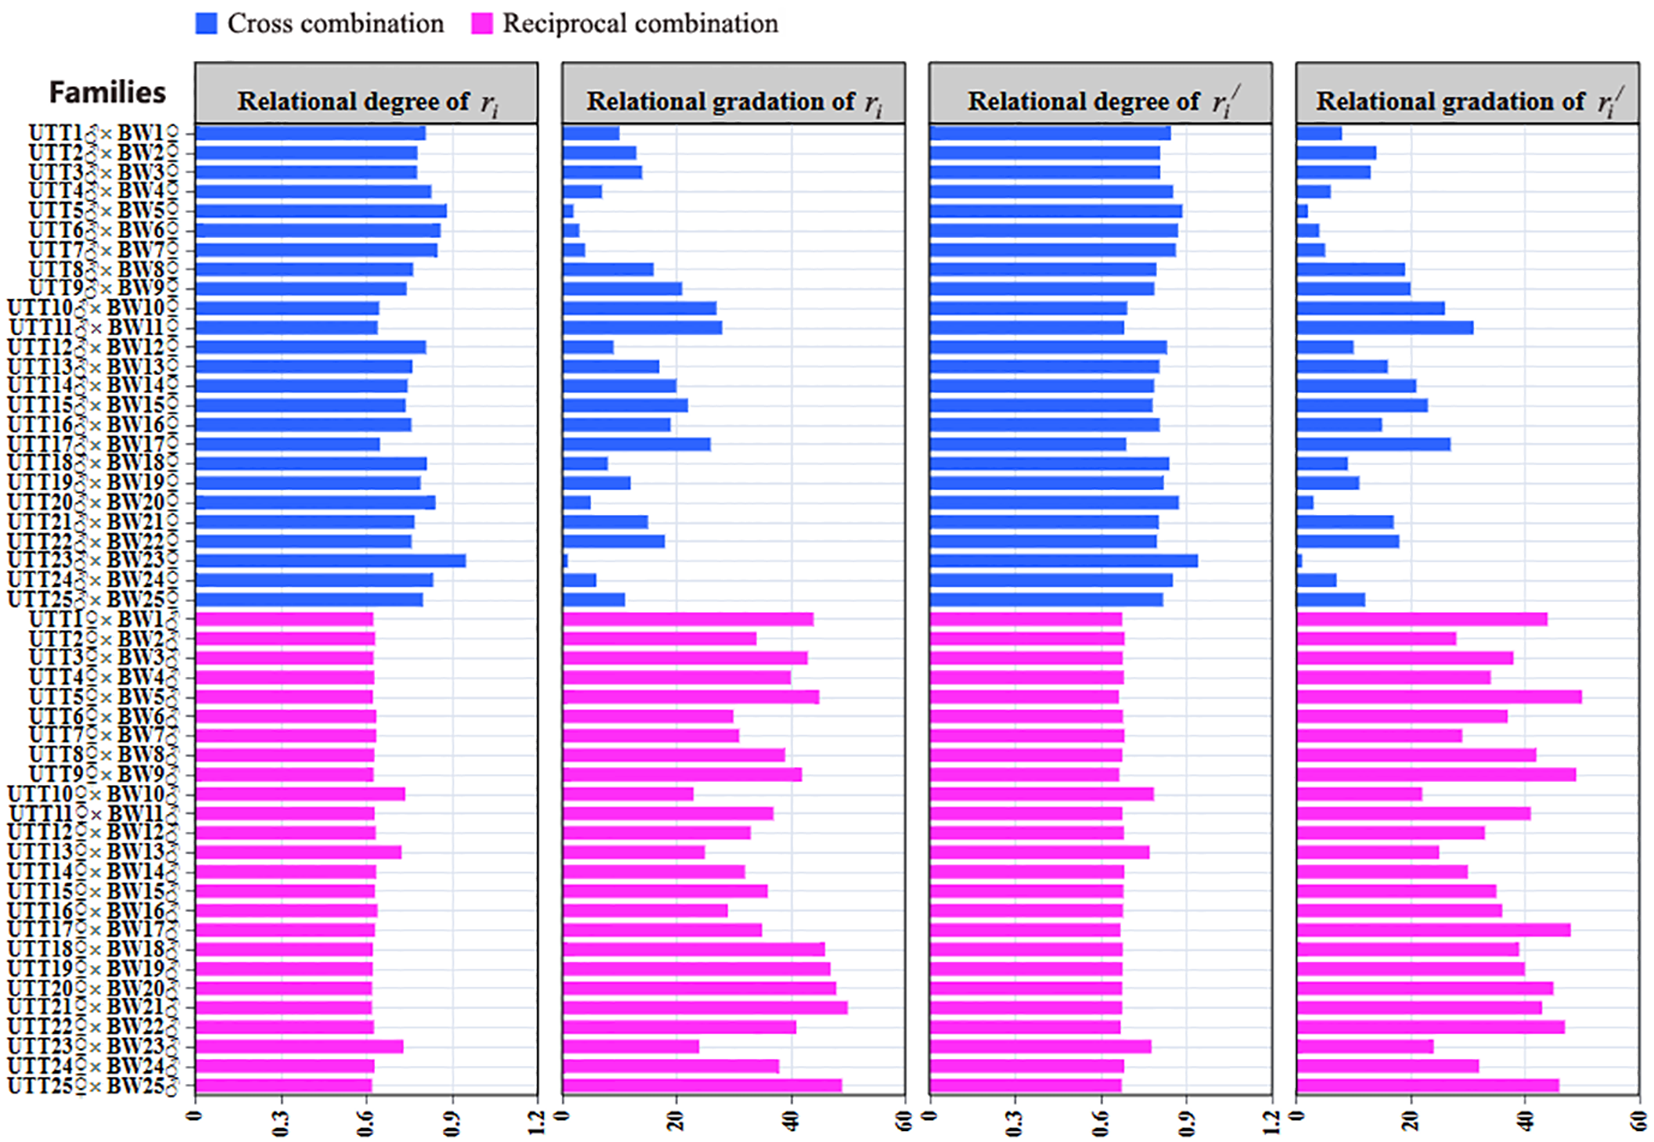
Relational degree and relational gradation of test families with the reference values. Note: ri is equal relational grade, and ri'is weighted relational grade.
3.2 TOPSIS
3.2.1 Data disposal with non-dimensional change
It was difficult to compare UTT with BW due to the large difference between the measured values. Therefore, the raw data was transformed into comparable data through dimensionless processing. In this study, both UTT and BW were positive indexes. The measured values were divided by the maximum value of the sequence, and a new sequence of each index was obtained. The non-dimensional UTT and BW of different families are shown in Figure 6 (Supplementary Table S6).
Figure 6
The non-dimensional UTT and BW of different families used in the TOPSIS. (A) The non-dimensional UTT in cross combination. (B) The non-dimensional BW in cross combination. (C) The non-dimensional UTT in reciprocal combination. (D) The non-dimensional BW in reciprocal combination.
3.2.2 Normalized decision matrix and the relative closeness calculation
The normalized decision matrix was constructed based on the dimensionless data of UTT and BW. According to breeding objectives, the weights of UTT and BW were 0.6 and 0.4, respectively. The weighted normalized decision matrix was constructed (Figure 7; Supplementary Table S7). The relative closeness (Ci*) of 50 families is shown in Supplementary Table S7. The range of Ci* was 0.066614 – 0.936093. The UTT23♂ × BW23♀ family had the highest Ci*. Further observations revealed that the Ci* values of 25 UTT♂ × BW♀ families were higher than those of 25 UTT♀ × BW♂ families, except for UTT10♂ × BW10♀, UTT11♂ × BW11♀, and UTT17♂ × BW17♀ families. The Ci* value difference between the cross combination and reciprocal combination was highly significant (P-value=2.98E-23<0.0001) by ANOVA (Supplementary Table S8).
Figure 7
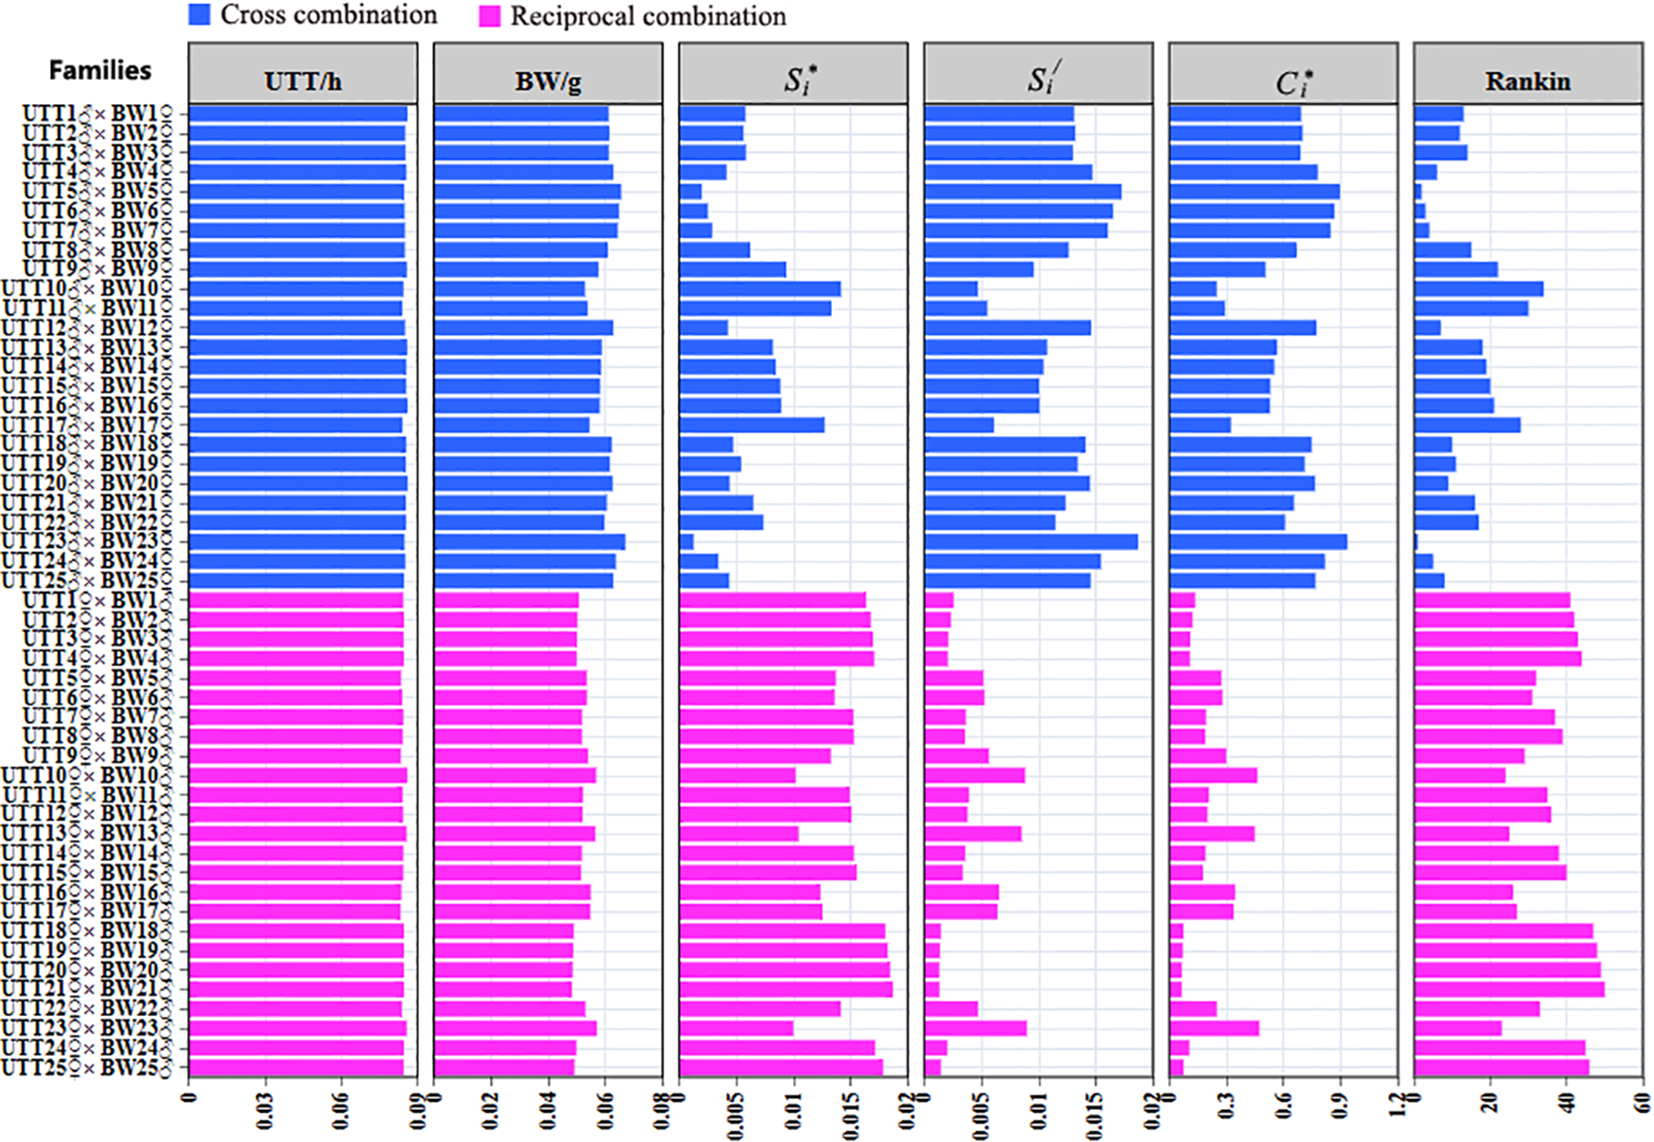
Decision matrix and the relative closeness of the families.
4 Discussion
The GRA calculates the grey relational coefficient of each variety (or strain) by constructing each trait reference sequences and providing the weight coefficient of each trait. This produces the equal relational grade and the weighted relational grade closest to the reference sequences, enabling the selection of the best variety (or strain). TOPSIS divides the breeding traits into a reverse index and forward index, and establishes the weighted normalized decision matrix. The distance between each variety (or strain) and the ideal solution is calculated. The smaller the distance, the better. The comprehensive application of two methods to the evaluation and selection of varieties (or strains) can avoid the one-sided evaluation of a single method, and produce scientifically valid and reasonable results. Compared with the GRA, TOPSIS does not require the construction of ideal varieties (or strains); however, its calculation method is more complex. The GRA requires the construction of an ideal variety (or strain), which is affected by many factors. It has a specific impact on the objectivity and scientific merit of the evaluation results, and the difference in the evaluation results is not as significant as those obtained by TOPSIS.
In the present study, the GRA of 50 families showed that although the relational gradations of the equal relational grade and the weighted relational grade were not identical, the overall trend of change was basically the same. The difference between the two relational gradations was mainly due to differences in the level of importance of each trait (i.e., weight coefficient). Therefore, the evaluation of varieties should be based mainly on the weighted relational grade. Compared with the equal relational grade analysis, the weighted grade analysis was more reliable in assessing the actual expression of the UTT and BW of the 50 cross-combinations. Based on grey system theory, the sequence with the largest relational degree is closest to the ideal sequence. i.e., the cross combination with the highest relational degrees is closest to the “ideal varieties” (Xie et al., 2017). The results of the present study showed that UTT23♂ × BW23♀ had the highest equal relational grade and weighted relational grade, and was the best cross combination for high temperature tolerance and rapid growth. Further observations revealed that the relational gradation of the equal relational grade and the weighted relational grade of 25 UTT♂ × BW♀ families were higher than those of 25 UTT♀ × BW♂ families, except for UTT10♂ × BW10♀, UTT11♂ × BW11♀, and UTT17♂ × BW17♀ families. TOPSIS analysis results showed that the Ci* range of the 50 families was 0.066614 – 0.936093. The UTT23♂ × BW23♀ family had the highest Ci*. Further observations revealed that the Ci* values of 25 UTT♂ × BW♀ families were higher than those of 25 UTT♀ × BW♂ families, except for UTT10♂ × BW10♀, UTT11♂ × BW11♀, and UTT17♂ × BW17♀ families. Whether using the GRA or the TOPSIS method, the results of the comprehensive evaluation of heat tolerance and weight traits in UTT♂ × BW♀ families were generally better than those of UTT♀ × BW♂ families. This showed that a breeding method involving the initial cultivation of a high temperature resistant male strain and a fast-growing female strain, followed by hybridization between the two strains, may be a strategy worthy of consideration. Additionally, the rankings of the four combination families including UTT23♂× BW23♀, UTT5♂× BW5♀, UTT6♂× BW6♀ and UTT7♂× BW7♀ are identical in terms of equal relational grade and Ci*. Their weighted relational grade also differs only slightly from these first two indicators. Therefore, using the UTT paternal and BW maternal parents from these four combination families for hybridization should yield better breeding results.
We employed the Intraclass Correlation Coefficient (ICC) method to evaluate the agreement between the GRA and TOPSIS results. The ICC value for the relational gradations—including the equal relational grade and the weighted relational grade from GRA analysis, as well as the Ci* ranking from TOPSIS analysis—was 0.932 (95%CI=0.894~0.958). This indicates a high degree of consistency between the conclusions of the two methods (ICC > 0.9), demonstrating that the comprehensive evaluation of varieties (or strains) using both approaches was feasible. The GRA and TOPSIS provided the technical means and theoretical basis for the comprehensive selection of new varieties (or strains) with multiple characteristics in the breeding process.
Statements
Data availability statement
The original contributions presented in the study are included in the article/Supplementary Material. Further inquiries can be directed to the corresponding author.
Ethics statement
The animal study was approved by Institutional Animal Care and Use Committee, IACUC, Yellow Sea Fisheries Research Institute, Chinese Academy of Fishery Sciences. The study was conducted in accordance with the local legislation and institutional requirements.
Author contributions
AM: Investigation, Data curation, Validation, Writing - review & editing, Project administration, Resources. MT: Writing – review & editing, Methodology, Software. XW: Data curation, Methodology, Software, Validation, Writing − original draft. ZH: Writing – review & editing, Conceptualization, Data curation, Software. ZS: Conceptualization, Data curation, Methodology, Writing - original draft. ZL: Writing – review & editing, Methodology. PY: Writing – review & editing, Software. DG: Investigation, Methodology, Validation, Writing – review & editing.
Funding
The author(s) declare financial support was received for the research and/or publication of this article. This work was supported by grants from the National Key R&D Program of China (grant numbers 2022YFD2400403); China Agriculture Research System of MOF and MARA (grant numbers CARS - 47-G01); the National Key R&D Program of China (grant numbers 2022YFE0203900); Key R&D Program of Shandong province (Grant No. 2024CXPT071 - 1); Central Public-interest Scientific Institution Basal Research Fund, CAFS (grant numbers 2023TD26).
Conflict of interest
The authors declare that the research was conducted in the absence of any commercial or financial relationships that could be construed as a potential conflict of interest.
Generative AI statement
The author(s) declare that no Generative AI was used in the creation of this manuscript.
Any alternative text (alt text) provided alongside figures in this article has been generated by Frontiers with the support of artificial intelligence and reasonable efforts have been made to ensure accuracy, including review by the authors wherever possible. If you identify any issues, please contact us.
Publisher’s note
All claims expressed in this article are solely those of the authors and do not necessarily represent those of their affiliated organizations, or those of the publisher, the editors and the reviewers. Any product that may be evaluated in this article, or claim that may be made by its manufacturer, is not guaranteed or endorsed by the publisher.
Supplementary material
The Supplementary Material for this article can be found online at: https://www.frontiersin.org/articles/10.3389/fmars.2025.1656074/full#supplementary-material
References
1
Aydin I. Terzi Y. Polat H. Küçük E. Öztürk R. C. (2022). Growth, gonadal development, and fish fillet quality in diploid and triploid turbot, Scophthalmus maximus, originated from the Black Sea. Aquaculture560, 738558. doi: 10.1016/j.aquaculture.2022.738558
2
Behzadian M. Otaghsara S. K. Yazdani M. Ignatius J. (2012). A state-of the-art survey of TOPSIS applications. Expert Syst. Appl.39, 13051–13069. doi: 10.1016/j.eswa.2012.05.056
3
Beitinger T. L. Bennett W. A. McCauley R. W. (2000). Temperature tolerances of North American freshwater fishes exposed to dynamic changes in temperature. Environ. Biol. Fish.58, 237–275. doi: 10.1023/A:1007676325825
4
Dominguez M. Takemura A. Tsuchiya M. Nakamura S. (2004). Impact of different environmental factors on the circulating immunoglobulin levels in the Nile tilapia, Oreochromis niloticus. Aquaculture241, 491–500. doi: 10.1016/j.aquaculture.2004.06.027
5
Fung C. P. (2003). Manufacturing process optimization for wear property of fiber-reinforced polybutylene terephthalate composites with grey relational analysis. Wear254, 298–306. doi: 10.1016/S0043-1648(03)00013-9
6
Gao W. Wu X. Ren H. L. (2018). Analysis of Grey Correlation degree of seed yield related Traits of soybean in winter breeding. Seed37, 89–91. doi: 10.16590/j.cnki.1001-4705.2018.04.089
7
Gu H. Song B. F. (2009). Study on effectiveness evaluation of weapon systems based on grey relational analysis and TOPSIS. J. Syst. Eng. Electron.20, 106–111. doi: 10.1016/S0959-8049(01)81536-7
8
Kuo Y. Y. Yang T. H. Huang G. W. (2008). The use of grey relational analysis in solving multiple attribute decision-making problems. Comput. Ind. Eng.55, 80–93. doi: 10.1016/j.cie.2007.12.002
9
Li X. N. Qi L. Y. He M. X. Liu H. (2017). Grey relational grade analysis on yield and main agronomic characters of peanut (Arachis hypogaea L.). J. Peanut Sci.46, 1–5. doi: 10.14001/j.issn.1002-4093.2017.03.001
10
Liu M. Bu W. Z. Yang W. Y. Wu X. L. (2018). Correlation analysis of yield and agronomic traits of soybean for intercropping in Shangdong. Chin. J. Oil Crop Sci.40, 344–351. doi: 10.7505/j.issn.1007-9084.2018.03.005
11
Liu Y. X. Liu Y. J. Zhou Q. Gao L. Fang H. Han G. et al . (2014a). Grey relational analysis between main growth traits and body weight in Japanese flounder (Paralichthys olivaceus). J. Fish. Sci. China21, 205–213. doi: 10.3724/SP.J.1118.2014.00205
12
Liu S. F. Yang Y. J. Forrest J. (2017). Grey Data Analysis: Methods, Models and Applications (Verlag, Singapore: Sringer).
13
Liu S. F. Yang Y. J. Wu L. F. (2014b). Grey Systems Theory and its Applications. 7th ed (Beijing: Science Press).
14
Lu X. P. (2006). Results comparison of evaluation of flue cured tobacco new varieties by analysis methods of grey correlation and DIOPSIS. South West China J. Agric. Sci.19, 1014–1018. doi: 10.1016/S1872-2032(06)60050-4
15
Luang S. Kong J. Wang Q. Y. Zhang X. M. Zhang Z. M. Hu H. L. et al . (2008). Development and application of an aquatic animal breeding analysis and management system. Mar. Fish. Res.29, 92–100. doi: 10.1007/s00442-006-0604-z
16
Ma A. J. Wang X. N. Huang Z. H. Liu Z. F. Cui W. X. Qu J. B. (2018). Estimation of genetic parameters for upper thermal tolerance and growth-related traits in turbot Scophthalmus maximus using the Bayesian method based on Gibbs sampling. Acta Oceanol. Sin.37, 40–46. doi: 10.1007/s13131-018-1185-5
17
Peng D. M. Chen P. D. (2017). Evaluation of Chinese marine shellfish aquaculture industry in coastal provinces Based on Grey relationship and TOPSIS. Chin. Fish. Econom.35, 78–83. doi: CNKI:SUN:ZYJJ.0.2017-03-014
18
Perry G. M. Martyniuk C. M. Ferguson M. M. Danzmann R. G. (2005). Genetic parameters for upper thermal tolerance and growth-related traits in rainbow trout (Oncorhynchus mykiss). Aquaculture250, 120–128. doi: 10.1016/j.aquaculture.2005.04.042
19
Shiha H. S. Shyurb H. S. Lee E. S. (2007). An extension of TOPSIS for group decision making. Math. Comput. Model.45, 801–813. doi: 10.1016/j.mcm.2006.03.023
20
Song X. N. Zhang G. L. Ling P. (2002). The comprehensive evaluation of kenaf new varieties by Grey Relativity Analysis method. Plant Fiber Sci. China24, 1–4. doi: 10.3969/j.issn.1671-3532.2002.02.001
21
Wang X. A. Ma A. J. (2019a). Genetic parameters for resistance against Vibrio Anguillarum in turbot Scophthalmus maximus. J. Fish. Dis.42, 713–720. doi: 10.1111/jfd.12973
22
Wang X. A. Ma A. J. Huang Z. H. Sun Z. B. Cui W. X. X. Qu J. B. et al . (2019b). Estimation of genetic parameters for upper thermal tolerances and growth-related traits in turbot Scophthalmus maximus. J. Oceanol. Limnol.37, 1736–1745. doi: 10.1007/s00343-019-7267-1
23
Xie W. J. Tang Y. W. Song J. Peng L. C. Wang J. H. Li S. F. et al . (2017). Comprehensive evaluation of Rhododendron varieties based on grey-relational grade method. J. Henan Agric. Univ.51, 513–520. doi: CNKI:SUN:NNXB.0.2017-04-011
24
Yang K. Wu C. W. Qin W. Zhao P. F. Liu J. Y. Cai Q. (2015). Comparison of comprehensive evaluation sugarcane new varieties with DTOPSIS and grey related degree. Southwest China J. Agric. Sci.28, 1542–1547. doi: 10.16213/j.cnki.scjas.2015.04.025
25
Zhang T. S. Kong J. Liu B. S. Wang Q. Y. Cao B. X. Luan S. et al . (2014). Genetic parameter estimation for juvenile growth and upper thermal tolerance in turbot (Scophthalmus maximus Linnaeus). Acta Oceanol. Sin.33, 106–110. doi: 10.1007/s13131-014-0460-3
26
Zhang J. Liu T. Bian D. P. Zhang L. Li X. B. Liu D. T. et al . (2016). Breeding and genetic stability evaluation of the new Saccharina variety “Ailunwan” with high yield. J. Appl. Phycol.28, 3413–3421. doi: 10.1007/s10811-016-0810-y
Summary
Keywords
turbot, upper thermal tolerance, body weight, GRA, TOPSIS
Citation
Ma A, Tian M, Wang X, Huang Z, Sun Z, Liu Z, Yan P and Gou D (2025) Comprehensive evaluation of turbot (Scophthalmus maximus) upper thermal tolerance and body weight based on GRA-TOPSIS analysis. Front. Mar. Sci. 12:1656074. doi: 10.3389/fmars.2025.1656074
Received
29 June 2025
Accepted
19 August 2025
Published
18 September 2025
Volume
12 - 2025
Edited by
Liang Guo, Hunan Normal University, China
Reviewed by
Sofia Priyadarsani Das, National Taiwan Ocean University, Taiwan
Ilhan Aydin, Ministry of Agriculture and Forestry of Türkiye, Türkiye
Updates
Copyright
© 2025 Ma, Tian, Wang, Huang, Sun, Liu, Yan and Gou.
This is an open-access article distributed under the terms of the Creative Commons Attribution License (CC BY). The use, distribution or reproduction in other forums is permitted, provided the original author(s) and the copyright owner(s) are credited and that the original publication in this journal is cited, in accordance with accepted academic practice. No use, distribution or reproduction is permitted which does not comply with these terms.
*Correspondence: Aijun Ma, maaj@ysfri.ac.cn
Disclaimer
All claims expressed in this article are solely those of the authors and do not necessarily represent those of their affiliated organizations, or those of the publisher, the editors and the reviewers. Any product that may be evaluated in this article or claim that may be made by its manufacturer is not guaranteed or endorsed by the publisher.