 Chen Ling1*
 Thanh Le2
- 1Nanjing Audit University JinShen College, Jiangsu, Nanjing, China
- 2Department of Environment, Vietnam Maritime University, Hai Phong, Vietnam
Introduction: Despite the benefits of smart ports development for productivity, energy saving, and environmental improvement, an intelligent investment strategy should consider potential adverse effects on marine ecosystems during the construction and operation processes. To address this issue, this study aims to examine the integration of green finance instruments with artificial intelligence (AI)-driven intelligent decision-making (IDM), utilizing data on 15 major Chinese ports.
Methods: Employing machine learning (ML) models, alongside SHapley Additive exPlanations (SHAP) analysis, the research quantifies the impact of green finance on critical environmental metrics, including total organic carbon (TOC), carbon fluxes, carbon burial rate, pollution load index (PLI), flow velocity, and erosion/deposition rate (E/DR). First, ML models are employed to estimate these indicators based on historical data. Subsequently, SHAP is utilized to interpret the impact of financial instruments on ecological indicators. This enables the identification of financial instruments that positively influence ecological indicators in specific marine regions, thereby supporting IDM to prioritize those instruments in the corresponding areas.
Results: Findings highlight green bonds as the most influential, with SHAP values of 0.24-0.30 for carbon burial rate and 0.17-0.20 for PLI, particularly in advanced ports like Shanghai and Ningbo-Zhoushan, while eXtreme gradient boosting (XGBoost) achieves superior predictive accuracy.
Discussion: This study suggests that green bonds, green leasing, and green credit should be prioritized. Policymakers should establish a dedicated framework for green bonds and green leasing, specifically targeting ports with advanced smart infrastructure (L3-L4). Green credit schemes should be promoted to support infrastructure enhancement and renewable energy projects in L1-L2 ports.
1 Introduction
Handling nearly one-third of global container throughput (UNCTAD, 2023), Chinese sea ports play key nodes in economic growth but pose significant threats to marine ecosystems, especially in sensitive areas like the Bohai Sea and Yangtze River Delta, where pollution, habitat loss, and greenhouse gas emissions are growing concerns (Yu et al., 2021). To tackle this, green finance tools like green bonds and blue bonds have poured over $10 billion into sustainable port projects in 2023, with initiatives like shore power systems at the Port of Shanghai slashing emissions by up to 90% (ADB, 2023). Concurrently, intelligent decision-making (IDM) developed based on advanced technologies like artificial intelligence (AI) and Internet of Things (IoT) has become a transformative approach to optimize port operations and environmental outcomes. We deploy this approach because it allows for the effective utilization of IDM’s strengths. First, it leverages the predictive accuracy of machine learning (ML) algorithms, which are particularly robust when handling complex distributions such as ecological indicators and financial instruments. Second, it benefits from the interpretability offered by SHapley Additive exPlanations (SHAP). Third, it helps detect and mitigate biases. Finally, the integration of ML and SHAP within IDM can help correct errors commonly associated with traditional decision-making methods. As a result, prioritizing specific financial instruments in particular regions becomes more reliable. Despite these advantages, utilizing IDM to explore how green finance can facilitate sustainable smart port development has not been fully examined.
Recent studies on smart ports are gaining traction among researchers as their potential to optimize port performance, sustainability, and resilience (Ta et al., 2025). Sustainability is measured across three dimensions: economic benefits, environmental improvements, and social impacts (Bui-Duy et al., 2023). Most studies tend to address two dimensions, economic and environmental aspects, of a decision (Le and Xuan-Thi-Thu, 2024). Li et al. (2023) systematically argued for how data-driven decision-making might improve port operations. In vibrant international trade regions like East Asian and the Pacific (Le and Xuan-Thi-Thu, 2024), the adoption of smart port technologies has been accelerated by regional policies promoting digital transformation. The IoT, AI, and blockchain are game-changers with the support of policy instruments. IDM supported by AI algorithms is believed to be effective in solving supply chain disruptions and port operations (Le, 2025; Minh et al., 2024). It allows port authorities to make educated decisions about resource management, traffic optimization, and environmental compliance. Digitization in port activities can significantly improve the sustainability of maritime shipping, especially in areas with modern technological infrastructure (Luo et al., 2023). This was further confirmed by Tabish and Chaur-Luh (2024), who proposed that intelligent design in maritime landscapes could optimize internal pathways, thus mitigating energy consumption and emissions. A prototype IDM system was designed to foster both horizontal and vertical collaboration among freight stakeholders within port logistics (Irannezhad et al., 2020). Studies argue that China’s coastal waters are critical for biodiversity and fisheries but are heavily impacted by port operations (Chen et al., 2020). Puig and Darbra (2024) indicated that insufficient monitoring of marine ecosystems points to critical gaps that need more focus and resources for effective environmental protection. Winogradow and Pempkowiak (2014) emphasized the important role of organic carbon burial rates in mediating the role of marine ecosystems within the global CO2 cycle. Building on this, they provided an estimate of organic carbon burial in the sediments of the Baltic Sea. Zhang et al. (2023) Marine sediment samples were obtained from the coastal region of Bohai Bay to assess the influence of exogenous inputs on both the content and speciation of carbon.
In response, some port authorities have launched revitalization of mangroves and artificial reef programs to improve the underwater ecosystem. Such approaches could lead to encouraging results. However, the effectiveness of these programs depends on investment allocation and requires collaborative governance. Yin et al. (2020) indicated that regulatory barriers and high implementation costs are primary challenges for China’s diverse port landscape. To overcome these barriers, green finance instruments have become crucial in promoting sustainable port development in China, a leading maritime shipping hub. Instruments, including green bonds, blue bonds, and sustainability-linked loans, are utilized to support environmentally friendly port projects (Thompson, 2022). In China, blue bonds have been issued to fund initiatives such as the electrification of port equipment and the development of offshore wind farms to power ports, including Ningbo-Zhoushan (Wang et al., 2025). For example, China’s Ministry of Finance has supported blue bond issuances to retrofit ports with low-carbon technologies, reducing greenhouse gas emissions and marine pollution (Rebelo, 2020). Green bonds and sustainability-linked loans are also integral to China’s port sustainability efforts, aligning with Environmental, Social, and Governance (ESG) frameworks. Tan et al. (2023) addressed that green financing had enabled Chinese ports to invest in shore power systems, low-sulfur fuel infrastructure, and waste management facilities. Green bonds supported the Port of Shanghai in installing shore power systems to achieve the emissions reduction target significantly (Mohite and Mathew, 2025). However, challenges involve high initial expenditures and the need for defined measurements to evaluate the environmental impact of funded initiatives. The China Banking and Insurance Regulatory Commission has introduced taxonomy-based approaches to ensure financial institutions prioritize sustainable investments in port infrastructure, but inconsistencies in regional regulations pose implementation challenges. Liu et al. (2025) reshaped the smart port concept for Tianjin Port through the lens of population ecology theory. The integration of green finance with IDM enhances its efficacy (Kai et al., 2024). There exists a research gap on how green financing for smart ports affects environmental aspects (Li et al., 2023).
To our knowledge, despite promising achievements in smart port development, there exist some research gaps, as indicated in Table 1. There is a lack of comprehensive studies on integrating IDM with green finance instruments tailored to Chinese ports. While past studies have emphasized the function of science and technology in sustainable marine operations, research on scaling these innovations across diverse financial regulatory environments for smart ports is still lacking. They have not incorporated as comprehensive a set of critical ecological indicators as those presented in this paper, nor have they employed such a diverse array of green finance instruments. Therefore, the interaction effects of green finance on marine ecosystem health are limited. Furthermore, the integration of advanced and accurate ML techniques with SHAP represents a notable methodological distinction. In this study, we aim to bridge these research gaps by firstly applying ML algorithms to predict six marine ecosystem indicators, including total organic carbon (TOC), carbon fluxes, pollution load index (PLI), carbon burial rate, flow velocity, and erosion/deposition rate (E/DR) using six financial instruments. These instruments include green bonds, green credit, green leasing, green insurance, emissions trading system (ETS), and credit guarantee funds. The next phase of IDM is deploying SHAP to quantify the impacts of financial tools on these indicators. Based on the forecasting results and quantitative interpretability, we identify which financial instruments are more effective and should be prioritized to simultaneously achieve smart port development goals while minimizing negative impacts on the surrounding ecosystem. This study addresses three core questions: (1) What is the predictive accuracy of the model for marine ecological indicators surrounding smart ports when incorporating green finance variables? (2) How much do green finance instruments affect and interact with environmental indicators? (3) Which instruments should be prioritized for specific port groups according to their smartness level?
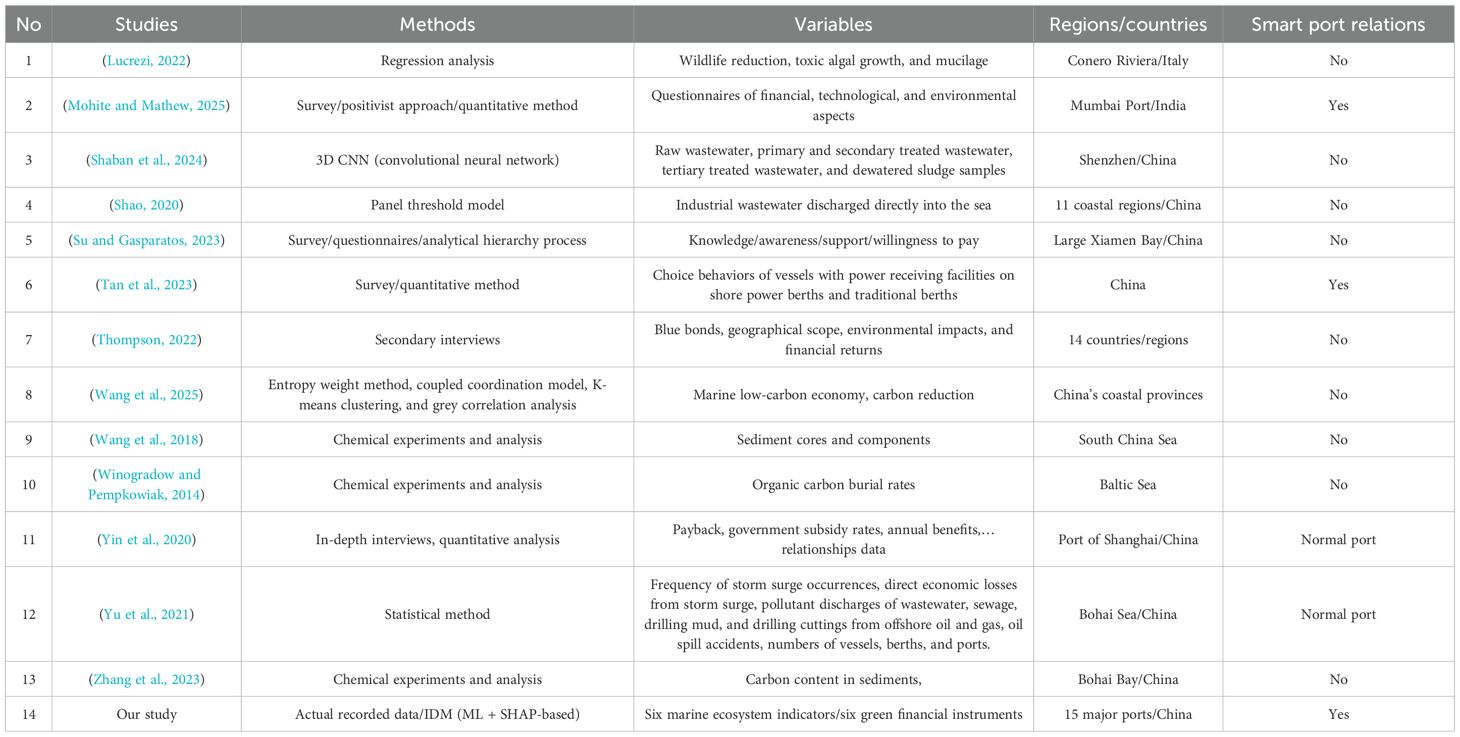
Table 1. Summary of relevant studies and research gaps.
The significance of this research lies in its potential to reconcile economic imperatives with ecological preservation in one of the world’s most critical maritime networks. Green finance has proven effective in funding projects like mangrove restoration in Xiamen (Su and Gasparatos, 2023) and ballast water treatment systems in Qingdao, which mitigate marine pollution and enhance biodiversity (Nie et al., 2023). Meanwhile, IDM, leveraging AI algorithms, enables real-time monitoring and predictive analytics, as seen in Shenzhen’s smart sensor systems for water quality management (Shaban et al., 2024). Yet, challenges persist, including the lack of standardized metrics to evaluate the ecological benefits of green finance and the uneven adoption of smart technologies across ports, with advanced hubs outperforming smaller ports in leveraging green investments. By employing ML models and SHAP analysis, this study quantifies the contributions of green finance and IDM to key environmental metrics across 15 major Chinese ports. This study addresses these challenges by providing a quantitative assessment of how green finance can mitigate marine ecosystem degradation.
The paper is structured to provide a comprehensive exploration of these issues. Section 2 outlines the methodologies, including data acquisition, preprocessing, and the application of ML models with SHAP analysis to evaluate environmental outcomes. Section 3 presents the results, highlighting the synergistic impacts of green finance and IDM across ports. Section 4 discusses recommendations and policy implications. Section 5 summarizes key findings, contributions, limitations, and future research directions.
2 Data acquisition and methodologies
2.1 Data preprocessing
The dataset is compiled from multiple sources. Marine ecosystem indicators are sourced from environmental monitoring systems maintained by the Ministry of Ecology and Environment (2024) and port-specific environmental reports published by the China Ports and Harbours Association (2024). Variables include TOC, carbon fluxes, PLI, carbon burial rate, flow velocity, and E/DR. Sediment cores were collected by vessel from depths ranging between 700 and 1,400 meters in seabed areas surrounding selected ports (within a 1,000–2,000 m radius). Sampling was conducted at a frequency of once every 10–14 days. After pore water extraction, the samples were sealed in sterile bags onboard, then freeze-dried and manually ground into powder using an agate mortar in an onshore laboratory for elemental and isotopic analysis. TOC content was measured using a Heraeus CHN-O rapid elemental analyzer at geochemical institutes located in the same city. Sedimentation rates were analyzed using radiometric dating techniques (210Pb) to determine sediment accumulation rates. Subsequently, the organic carbon content in the sediments was measured using a TOC analyzer, and the carbon burial rate was calculated using Equation 1:
Sediment cores were analyzed in combination with radiometric dating (210Pb) to determine the rate of change in sediment thickness, calculated using Equation 2:
where is the change in sediment thickness (mm), and is the time interval (days).
Carbon fluxes, PLI, and flow velocity data were obtained from the databases of the Ministry of Ecology and Environment and the Ministry of Natural Resources. Flow velocity is measured daily, while carbon fluxes and PLI are analyzed using the ICP-MS (Inductively Coupled Plasma Mass Spectrometry) method with a sampling frequency of once every 1–2 weeks. Green finance data are generated from financial reports issued by the Ministry of Finance, the reports and database from the China Banking and Insurance Regulatory Commission (CBIRC), the People’s Bank of China (PBoC), and the Asian Development Bank. The credit instruments include transactions carried out by port authorities and construction contractors, as well as energy and equipment suppliers for the port. These instruments encompass bond issuance, financial leasing, loans, carbon credit offset trading, insurance purchases, and credit guarantees. The recording frequency is based on the occurrence of transactions by all relevant units, subsidiaries, and branches involved. Figures 1 and 2 display the descriptive statistics and density distribution of environmental and financial variables.
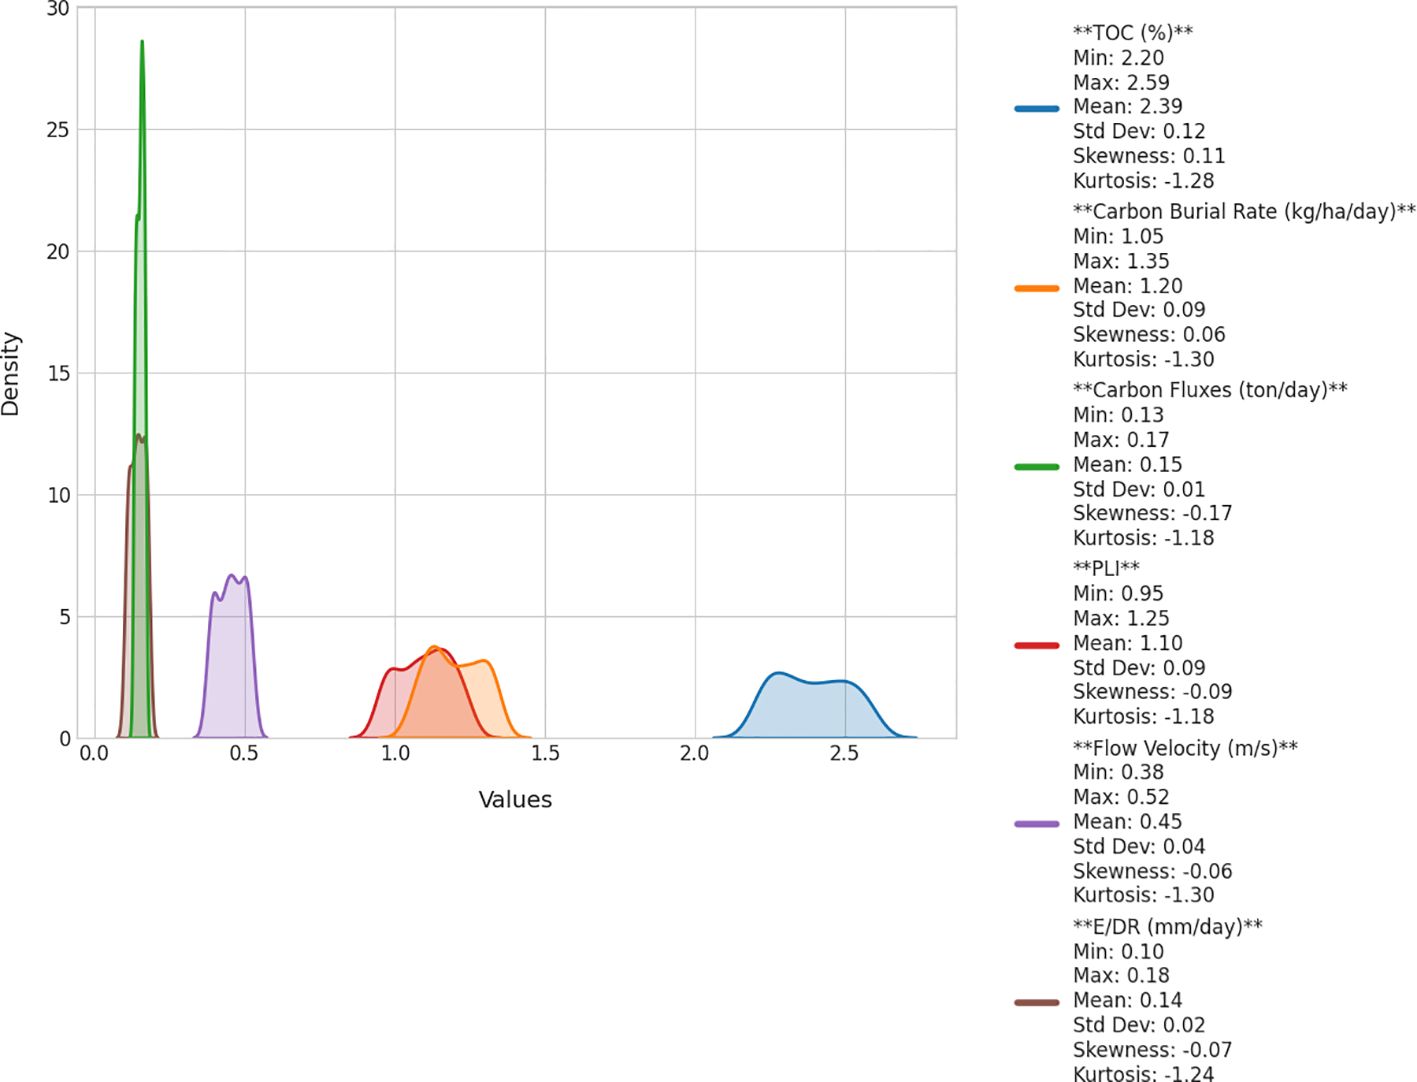
Figure 1. Descriptive statistics and density distribution of environmental variables.
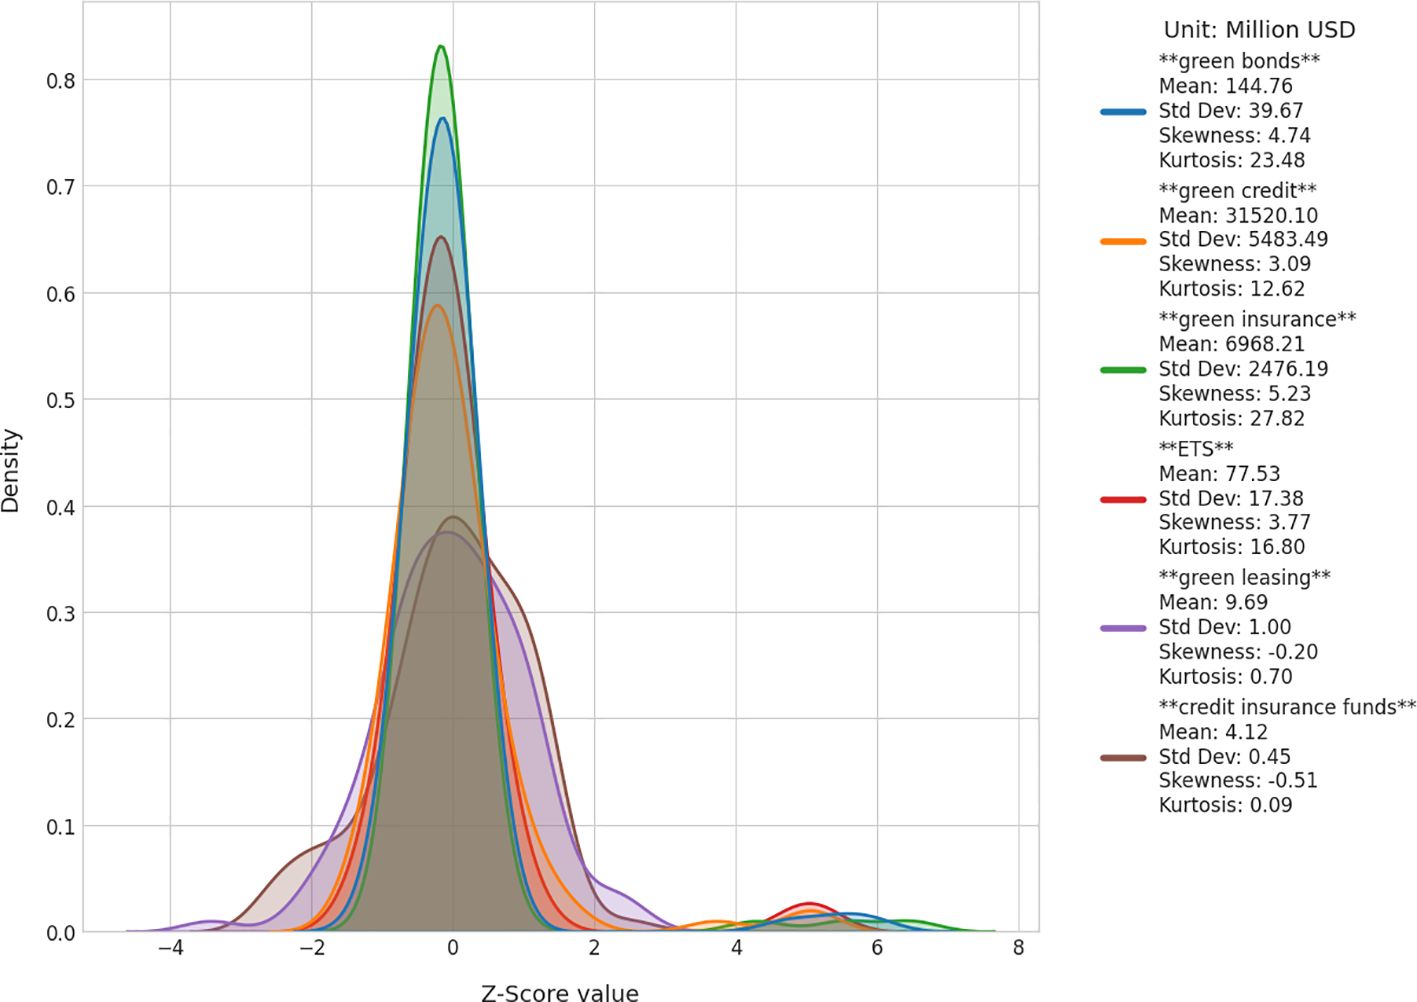
Figure 2. Descriptive statistics and density distribution of financial variables (standardized).
Additionally, port-specific and technological adoption are extracted from the annual reports of ports in China and literature (Mohite and Mathew, 2025; Huang et al., 2023). The temporal extent of the ecosystem datasets is from January 2022 to December 2024, collected through in situ measurements conducted at ports and surrounding water areas. The period during the COVID-19 pandemic is excluded due to limited and incomplete data. The resulting dataset comprises over 4,637 observations. Table 2 summarizes the levels of smartness and the application of smart technologies across major seaports in China.
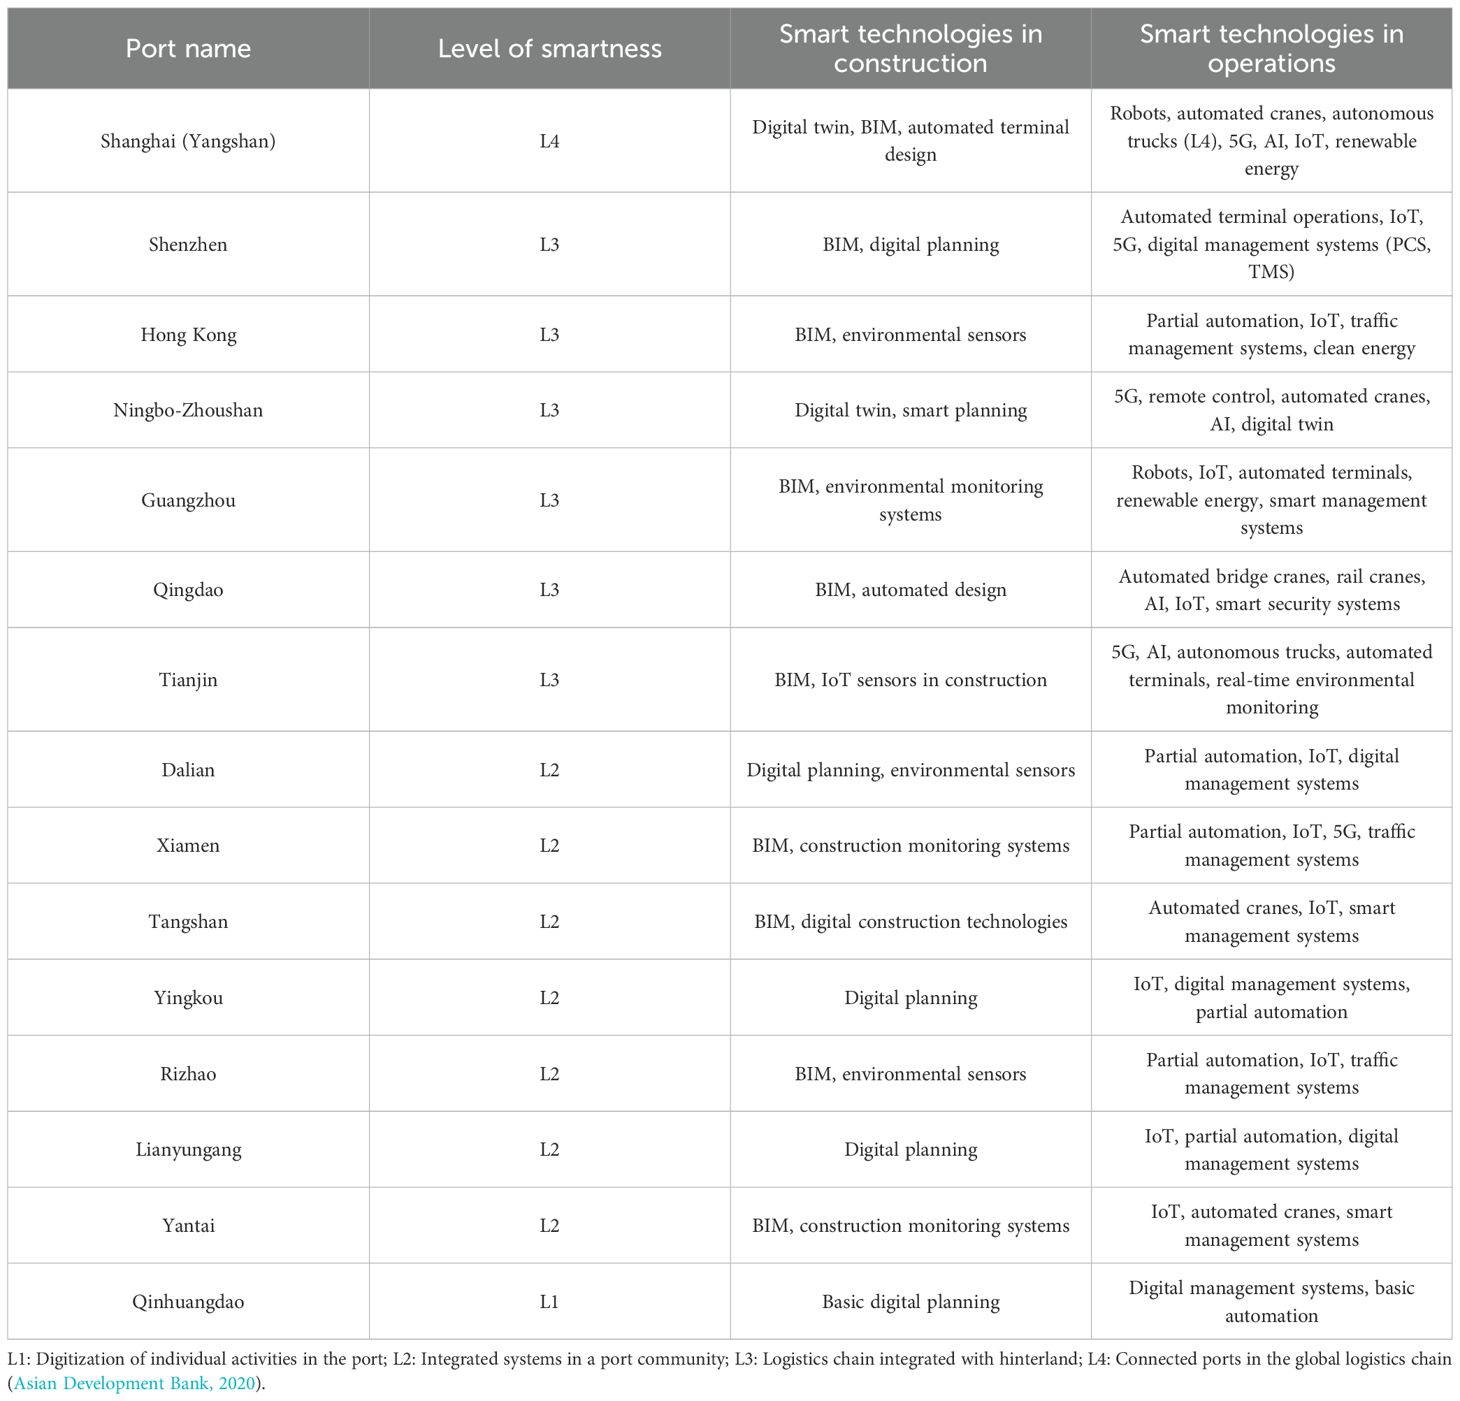
Table 2. Levels of smartness and smart technology applications in Chinese seaports.
To ensure compatibility with ML algorithms, this study deploys the following preprocessing procedures before designing models for IDM. Missing values were addressed using k-nearest neighbors (KNN) imputation (Yadav and Ahamad, 2019; Bui-Minh et al., 2025). The choice of kshould balance capturing local patterns in the data with avoiding overfitting or excessive noise. A small k focuses on the closest neighbor which is useful for capturing local patterns, but it risks overfitting to noise or outliers, increasing variance. A bigger k may potentially miss local variations and introduce bias toward the global mean or majority patterns. Therefore, with the size of our dataset, we select the value of k at an intermediate level (k = 10) to mitigate the impact of outliers while maintaining the local data structure. Then, numerical features were normalized to the [0, 1] range using min-max scaling. Outliers are detected and processed using Z-score and Mahalanobis distance (Yaro et al., 2024; Mayrhofer and Filzmoser, 2023). The preprocessed dataset was partitioned into 80% training and 20% testing sets, with 10-fold cross-validation used to optimize the model’s hyperparameters.
2.2 Interpretability-based ML model for IDM
2.2.1 Predictive ML models
In this study, the authors design three ML models, including Random Forest (RF), Support Vector Regression (SVR), and XGBoost, to predict key environmental indicators. We select these model candidates because of their respective strengths in addressing the complexities of the dataset, which features nonlinear relationships, high dimensionality, and potential interactions between variables. RF can mitigate overfitting by averaging predictions from multiple decision trees. Therefore, it is suitable for handling heterogeneous data using financial, ports, and environmental variables. Also, it performs robustly in the presence of outliers or noisy observations. SVR also perform well in regression tasks for tabular multiple-sized datasets, because it employs kernel functions to map data into higher-dimensional spaces, capturing complicated nonlinear patterns without forming a specific functional form. XGBoost is selected for its gradient boosting framework that optimizes predictive accuracy through iterative error correction and regularization techniques, offering superior scalability and efficiency in processing large datasets with multicollinear features, thus aligning well with the study’s goal of integrating real-time monitoring data. The mathematical justifications and detailed mechanisms of these models can be found in Appendices A1–A3. To validate the predictive ML model, we use metrics including Root Mean Square Error (RMSE), Mean Absolute Error (MAE), Mean Absolute Percentage Error (MAPE), and adjusted R². RMSE and MAE quantify the error magnitude; MAPE measures relative errors for scale-independent comparison and cross-indicator assessments; and adjusted R² measures the goodness-of-fit for models.
2.2.2 SHAP analysis and performance metrics
To enhance the interpretability of the ML models, SHAP is employed to quantify the contribution of each feature to the predictions of six environmental indicators. Accordingly, it provides insights into how predictors interact with port smartness levels to influence environmental outcomes (see Appendix A4). For robustness check, the SHAP explanations is evaluated by using the following metrics. The Explanation Error (EE), which measures the discrepancy between the model’s predicted output and the SHAP-based explanation, ensures the accuracy of the attribution process. A low EE (close to zero) indicates that SHAP accurately attributes the model’s output to individual features, ensuring reliable interpretations. The Feature Importance Ranking (FIR) orders predictors based on their average SHAP values to highlight their relative influence on the outcome. The Interaction Effect Strength (IES) quantifies the magnitude of pairwise interactions. The stability of these rankings is assessed using the Kendall rank correlation coefficient τ. A high τ (close to 1) indicates stable feature importance rankings, ensuring that SHAP reliably identifies key drivers for the environmental indicators. High interaction strength values indicate significant synergistic effects. Finally, the Coverage of Interaction Effects (CIE), which assesses the proportion of the model’s prediction explained by these interaction effects, provides an evaluation of the interdependencies among variables. This metric ensures that SHAP captures complex feature interactions critical for understanding sustainable port dynamics. Details on these metrics can be found in Appendix B. Figure 3 presents a schematic representation of the integration between the XGBoost (due to its higher predictive accuracy compared to RF and SVR, as shown in Section 3) and SHAP.
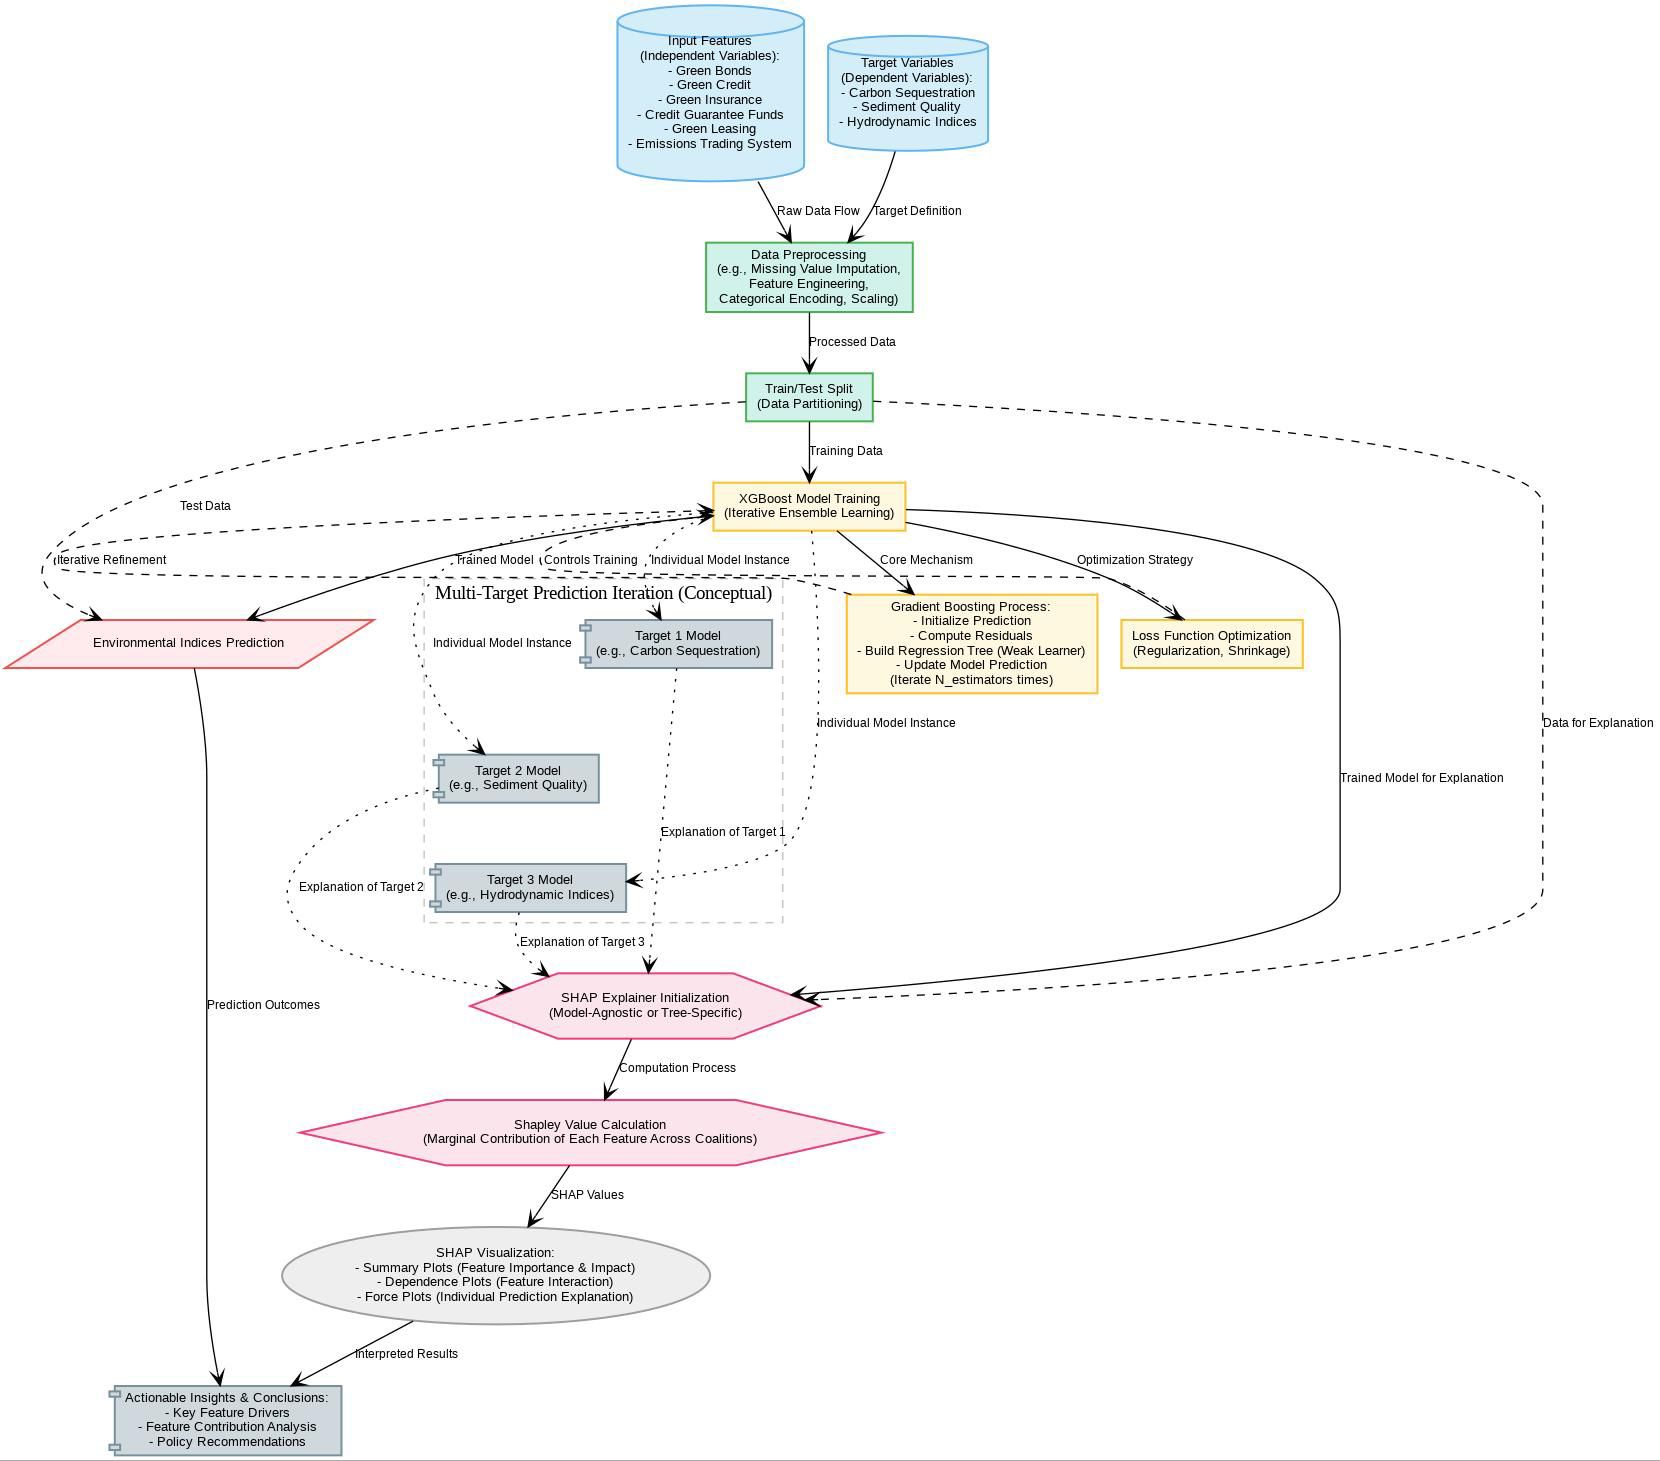
Figure 3. Workflow of environmental prediction and model interpretation using XGBoost and SHAP analysis.
3 Result analysis
3.1 Model performance evaluation across environmental indicators
The performance evaluation of the predictive models, RF, SVR, and XGBoost, for the key environmental output variables is presented in Figure 4. These heatmaps display the comparative metrics utilizing the adjusted R2, MAE, MAPE, and RMSE. For all indicators, XGBoost outperforms other ML model candidates, achieving the highest adjusted R2 values and the lowest MAE, MAPE, and RMSE. Additionally, its predictive performance achieves higher accuracy. None of the models exhibits signs of overfitting. For TOC, Xiamen exhibits the highest MAE (11.4) and RMSE (12.6). For carbon burial rate, the adjusted R2 reaches 0.95 (Shanghai) and MAE is minimal, while MAPE ranges from 4.3% (Shenzhen) to 6.2% (Qingdao) and RMSE from 6.3 (Ningbo-Zhoushan) to 12.6 (Hong Kong). RF and SVR show competitive adjusted R2 values (0.93 at Shanghai for RF), but their MAE (9.3 at Hong Kong for RF) and RMSE (12.1 at Hong Kong for RF) are consistently higher, indicating less robustness in modeling carbon sequestration processes.
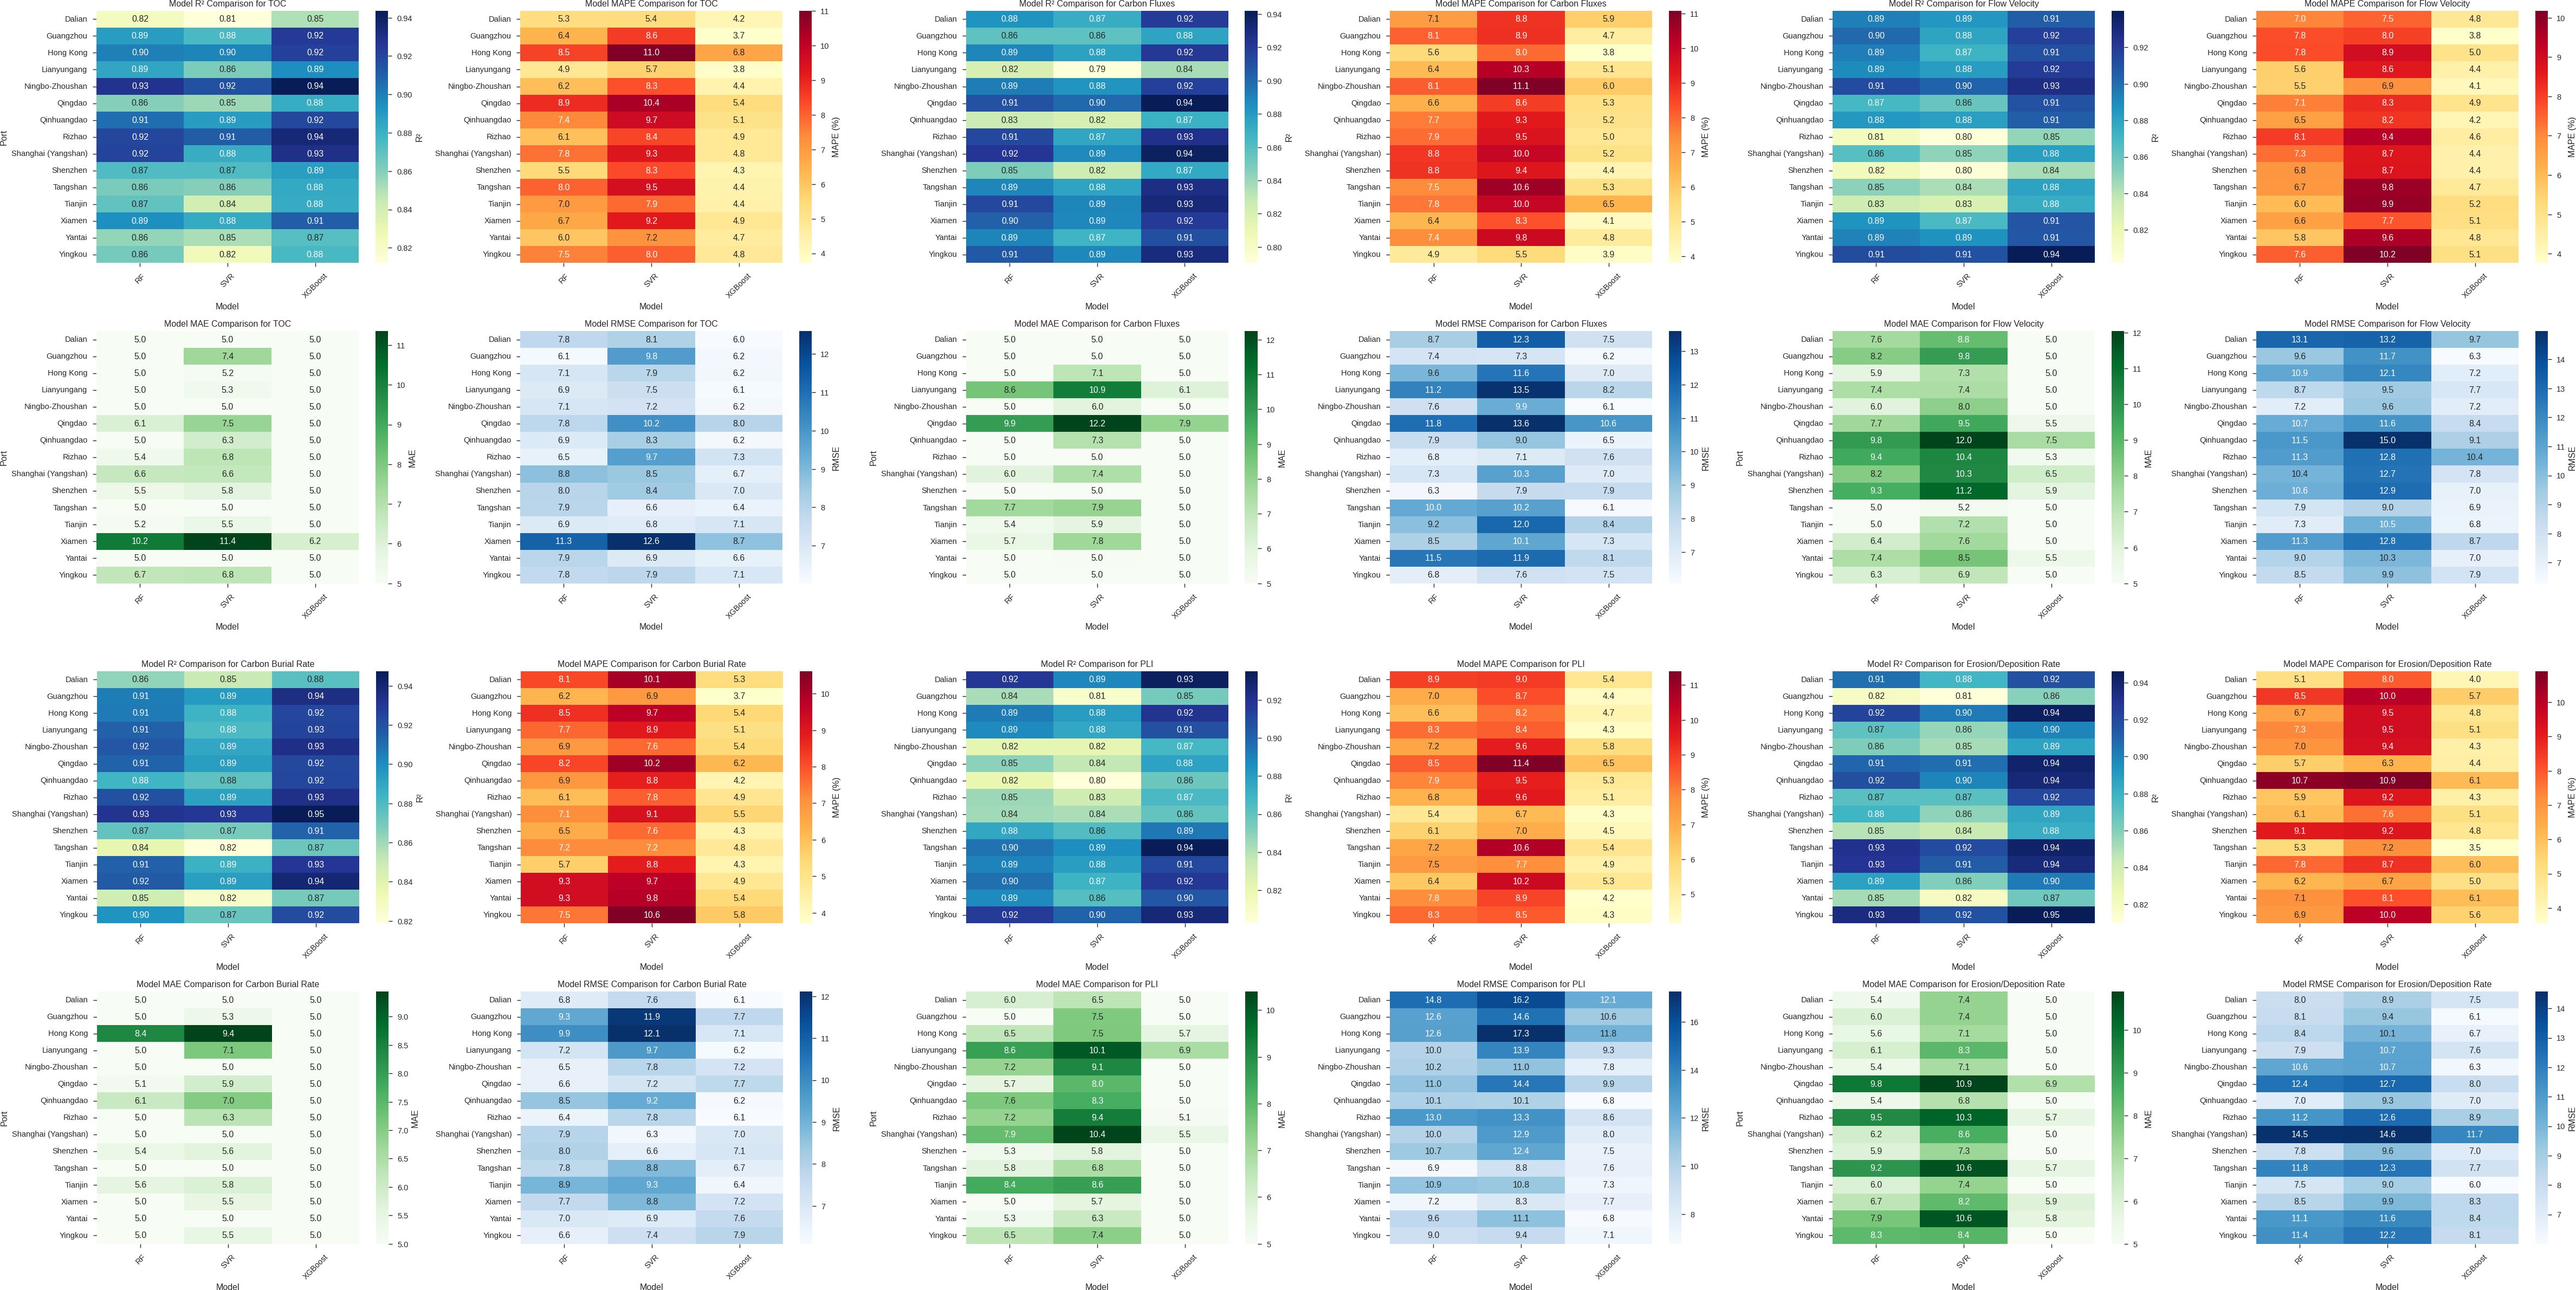
Figure 4. Predictive performance of ML models.
3.2 SHAP-based analysis across key outputs
The mean absolute SHAP values quantifying the contribution of various green finance tools to the prediction of key environmental output variables are presented in Figure 5. The SHAP values provide insights into the relative importance and impact of each financial instrument on environmental outcomes, facilitating IDM for sustainable port development. Among the suite of green finance mechanisms, green bonds (SHAP: 0.15–0.30) and green credit (0.12–0.26) demonstrate the strongest influence on improving critical environmental indicators, including TOC, carbon burial rates, carbon fluxes, PLI, flow velocity, and E/DR, across 15 leading Chinese ports. The most pronounced impacts are observed in Shanghai (0.18–0.30) and Ningbo-Zhoushan (0.26–0.27). Green insurance (0.07–0.17) and ETS (0.06–0.16) contribute supportive functions by mitigating risk and encouraging lower emissions. Credit guarantee funds (0.03-0.14) and green leasing (0.03-0.12) have little influence, especially in ports with underdeveloped infrastructure like Rizhao, Yantai, Yingkou, and Lianyungang (0.03-0.09). These variations highlight the relevance of local contextual factors, with Shanghai’s excellent performance being driven by investment in advanced technology infrastructure, whilst ports like Yingkou underperform due to limits in smart system implementation.
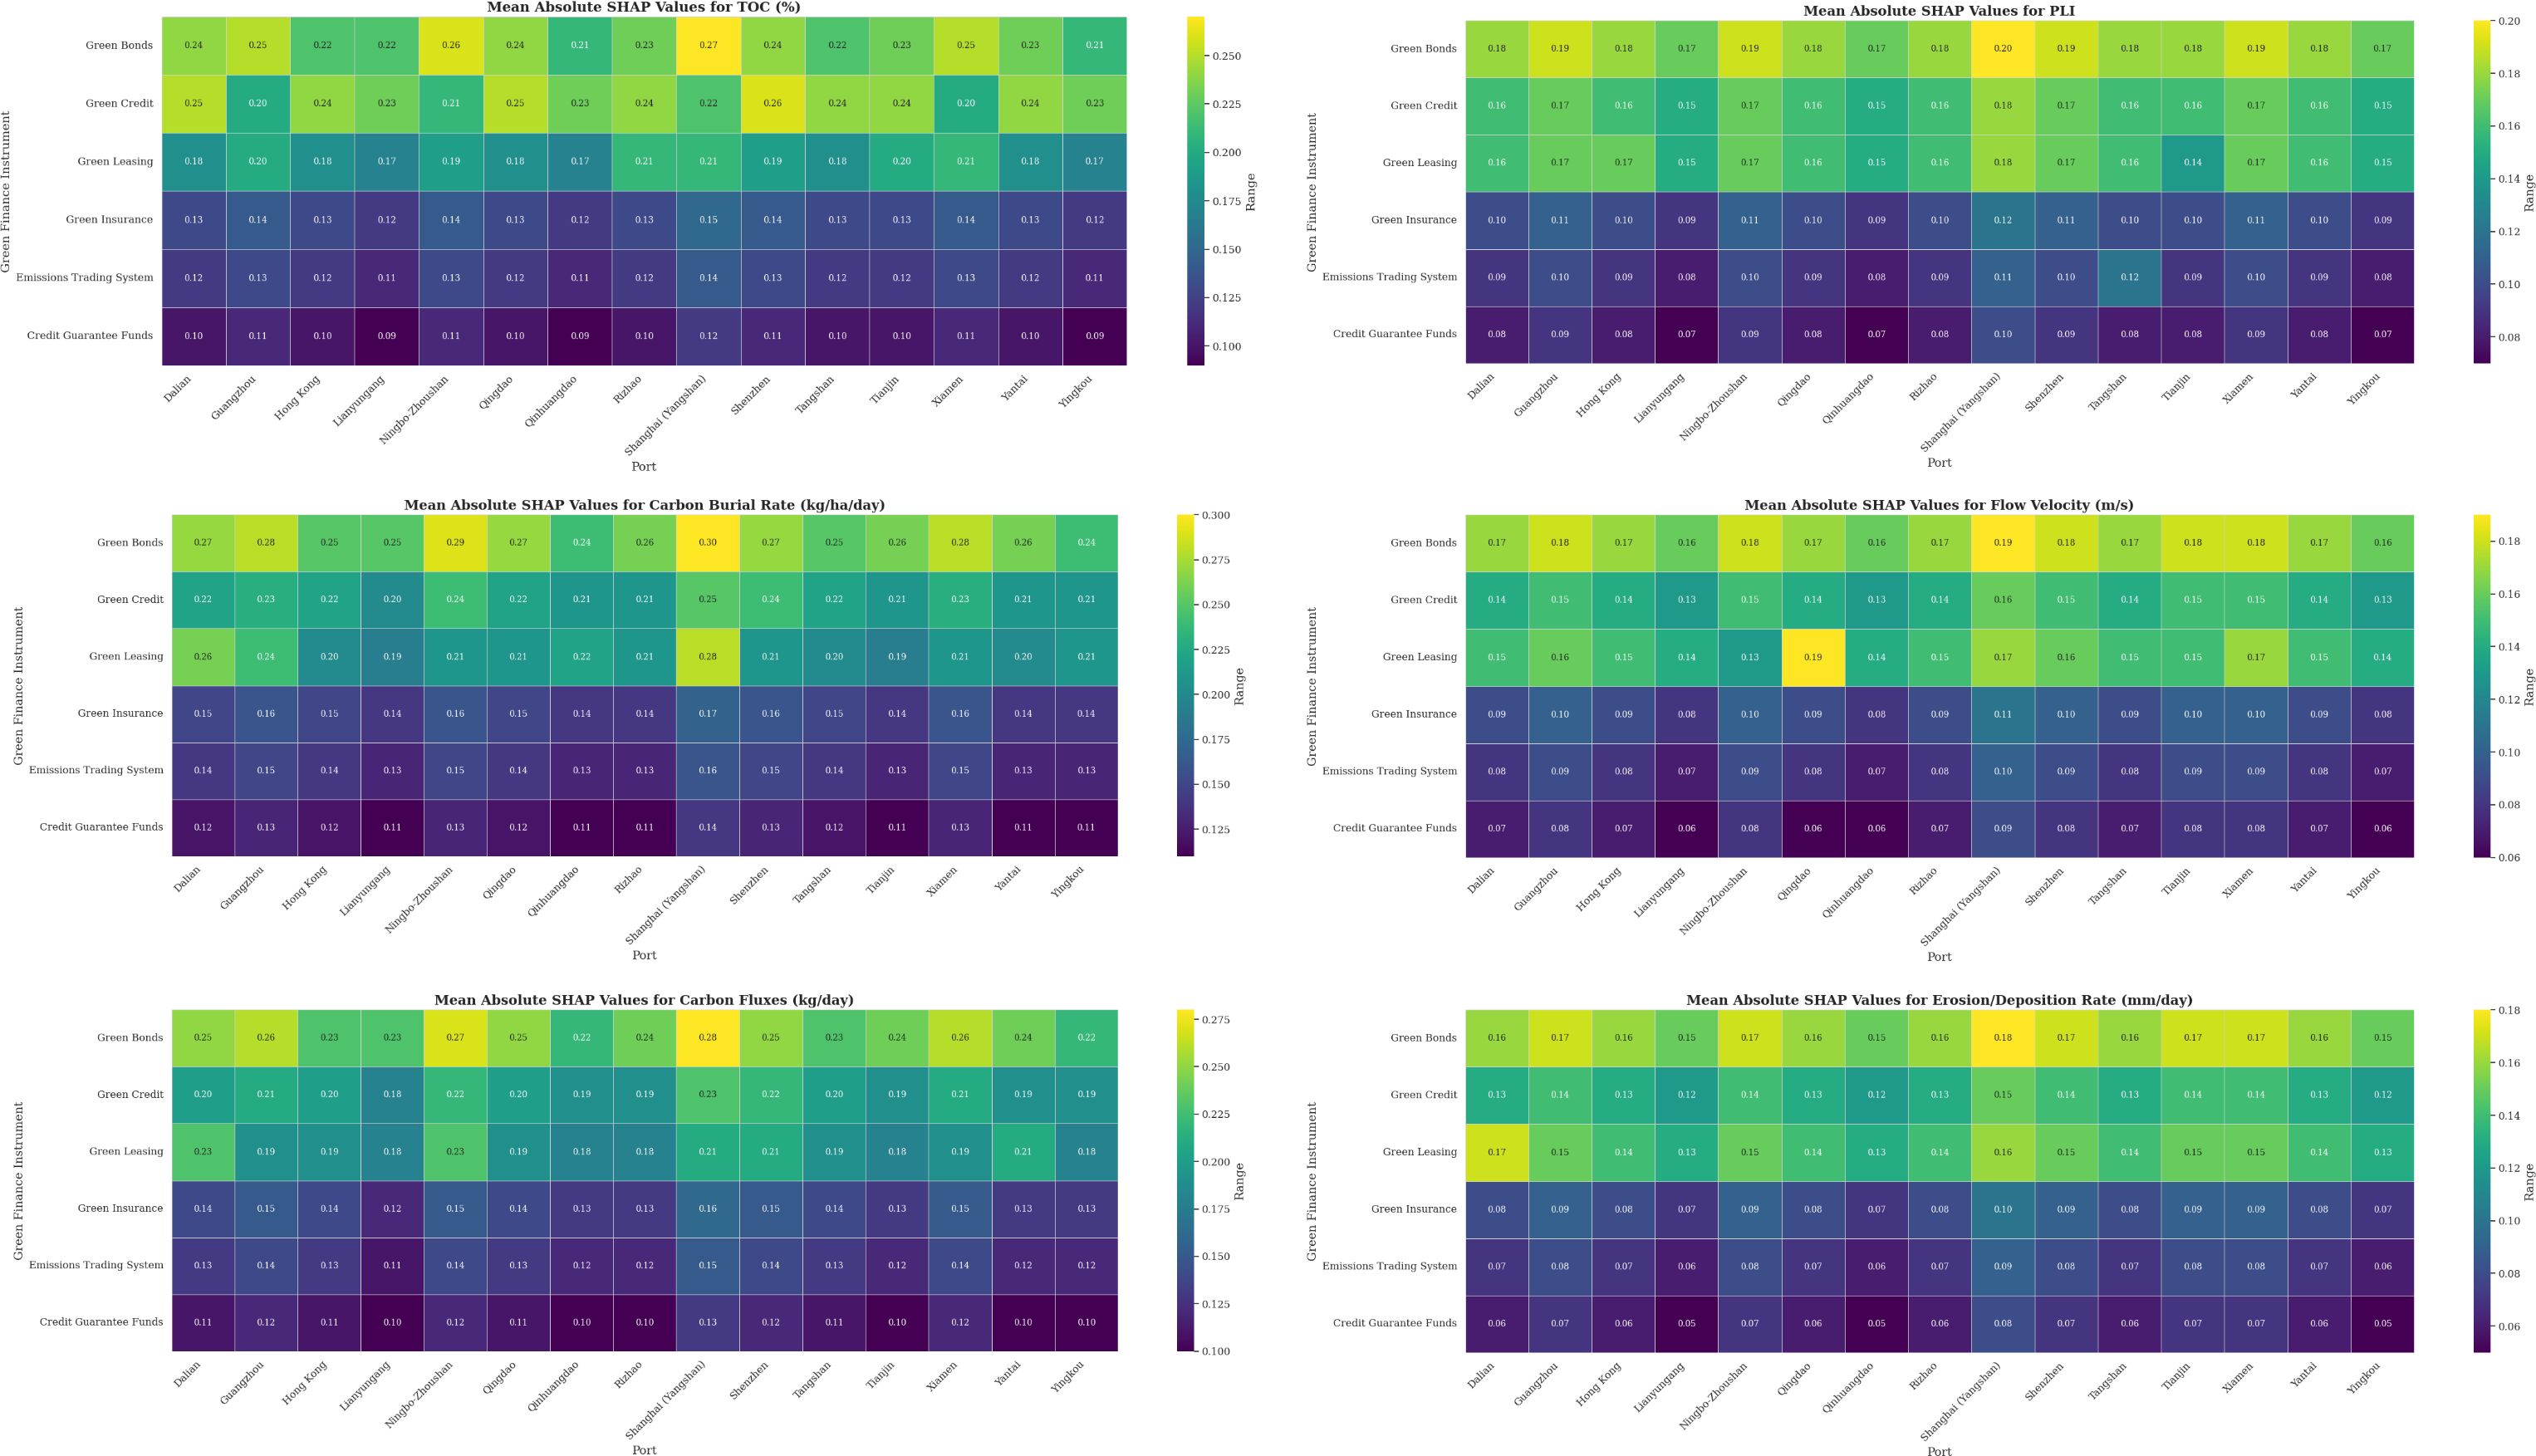
Figure 5. Mean absolute SHAP values for ecosystem indicators (The higher the value, the greater the influence of the feature on the model’s predictions).
Green bonds and green credit exhibit the highest SHAP values, suggest an essential function of driving environmental improvements through investments in renewable energy (Li et al., 2024; Ran et al., 2024), pollution control, and smart technologies, with peak values at Shanghai across all metrics (TOC: 0.27, carbon burial rate: 0.30, carbon fluxes: 0.28, PLI: 0.20, flow velocity: 0.19, E/DR: 0.18), reflecting its advanced smart port infrastructure and substantial green financing. Ports with lower smartness levels (L1-L2) show reduced SHAP values, suggesting a correlation between technological advancement and financial instrument efficacy. The lower contributions of credit guarantee funds and green leasing highlight the need for targeted policy support to enhance their impact. These findings are consistent with the literature (Kai et al., 2024), which emphasizes the use of green finance and IDM to accomplish sustainable port development in China.
The parallel coordinates plots for the performance of RF, SVR, and XGBoost models, as depicted in Figure 6, provide a normalized visualization of predictive accuracy across key environmental metrics, based on adjusted R2, MAPE, MAE, and RMSE inverted for consistency. XGBoost performs the highest normalized performance scores, approaching 1.0 across all evaluation metrics. This reflects its superior ability to model complex, nonlinear relationships while minimizing prediction errors, as evidenced by the tight clustering of red lines near the upper boundary. RF and SVR have lower and more variable scores, ranging between 0.2 and 0.6, for MAPE and RMSE, indicating greater relative error and reduced robustness, particularly when predicting carbon fluxes and E/DR. XGBoost’s strong performance in modified R² and inverted error metrics demonstrates its ability to model diverse, port-specific environmental information. Meanwhile, the heterogeneity found in RF and SVR implies a greater sensitivity to data quality and hyperparameter setups, indicating the need for more optimization to improve generalizability across varied ecological situations.
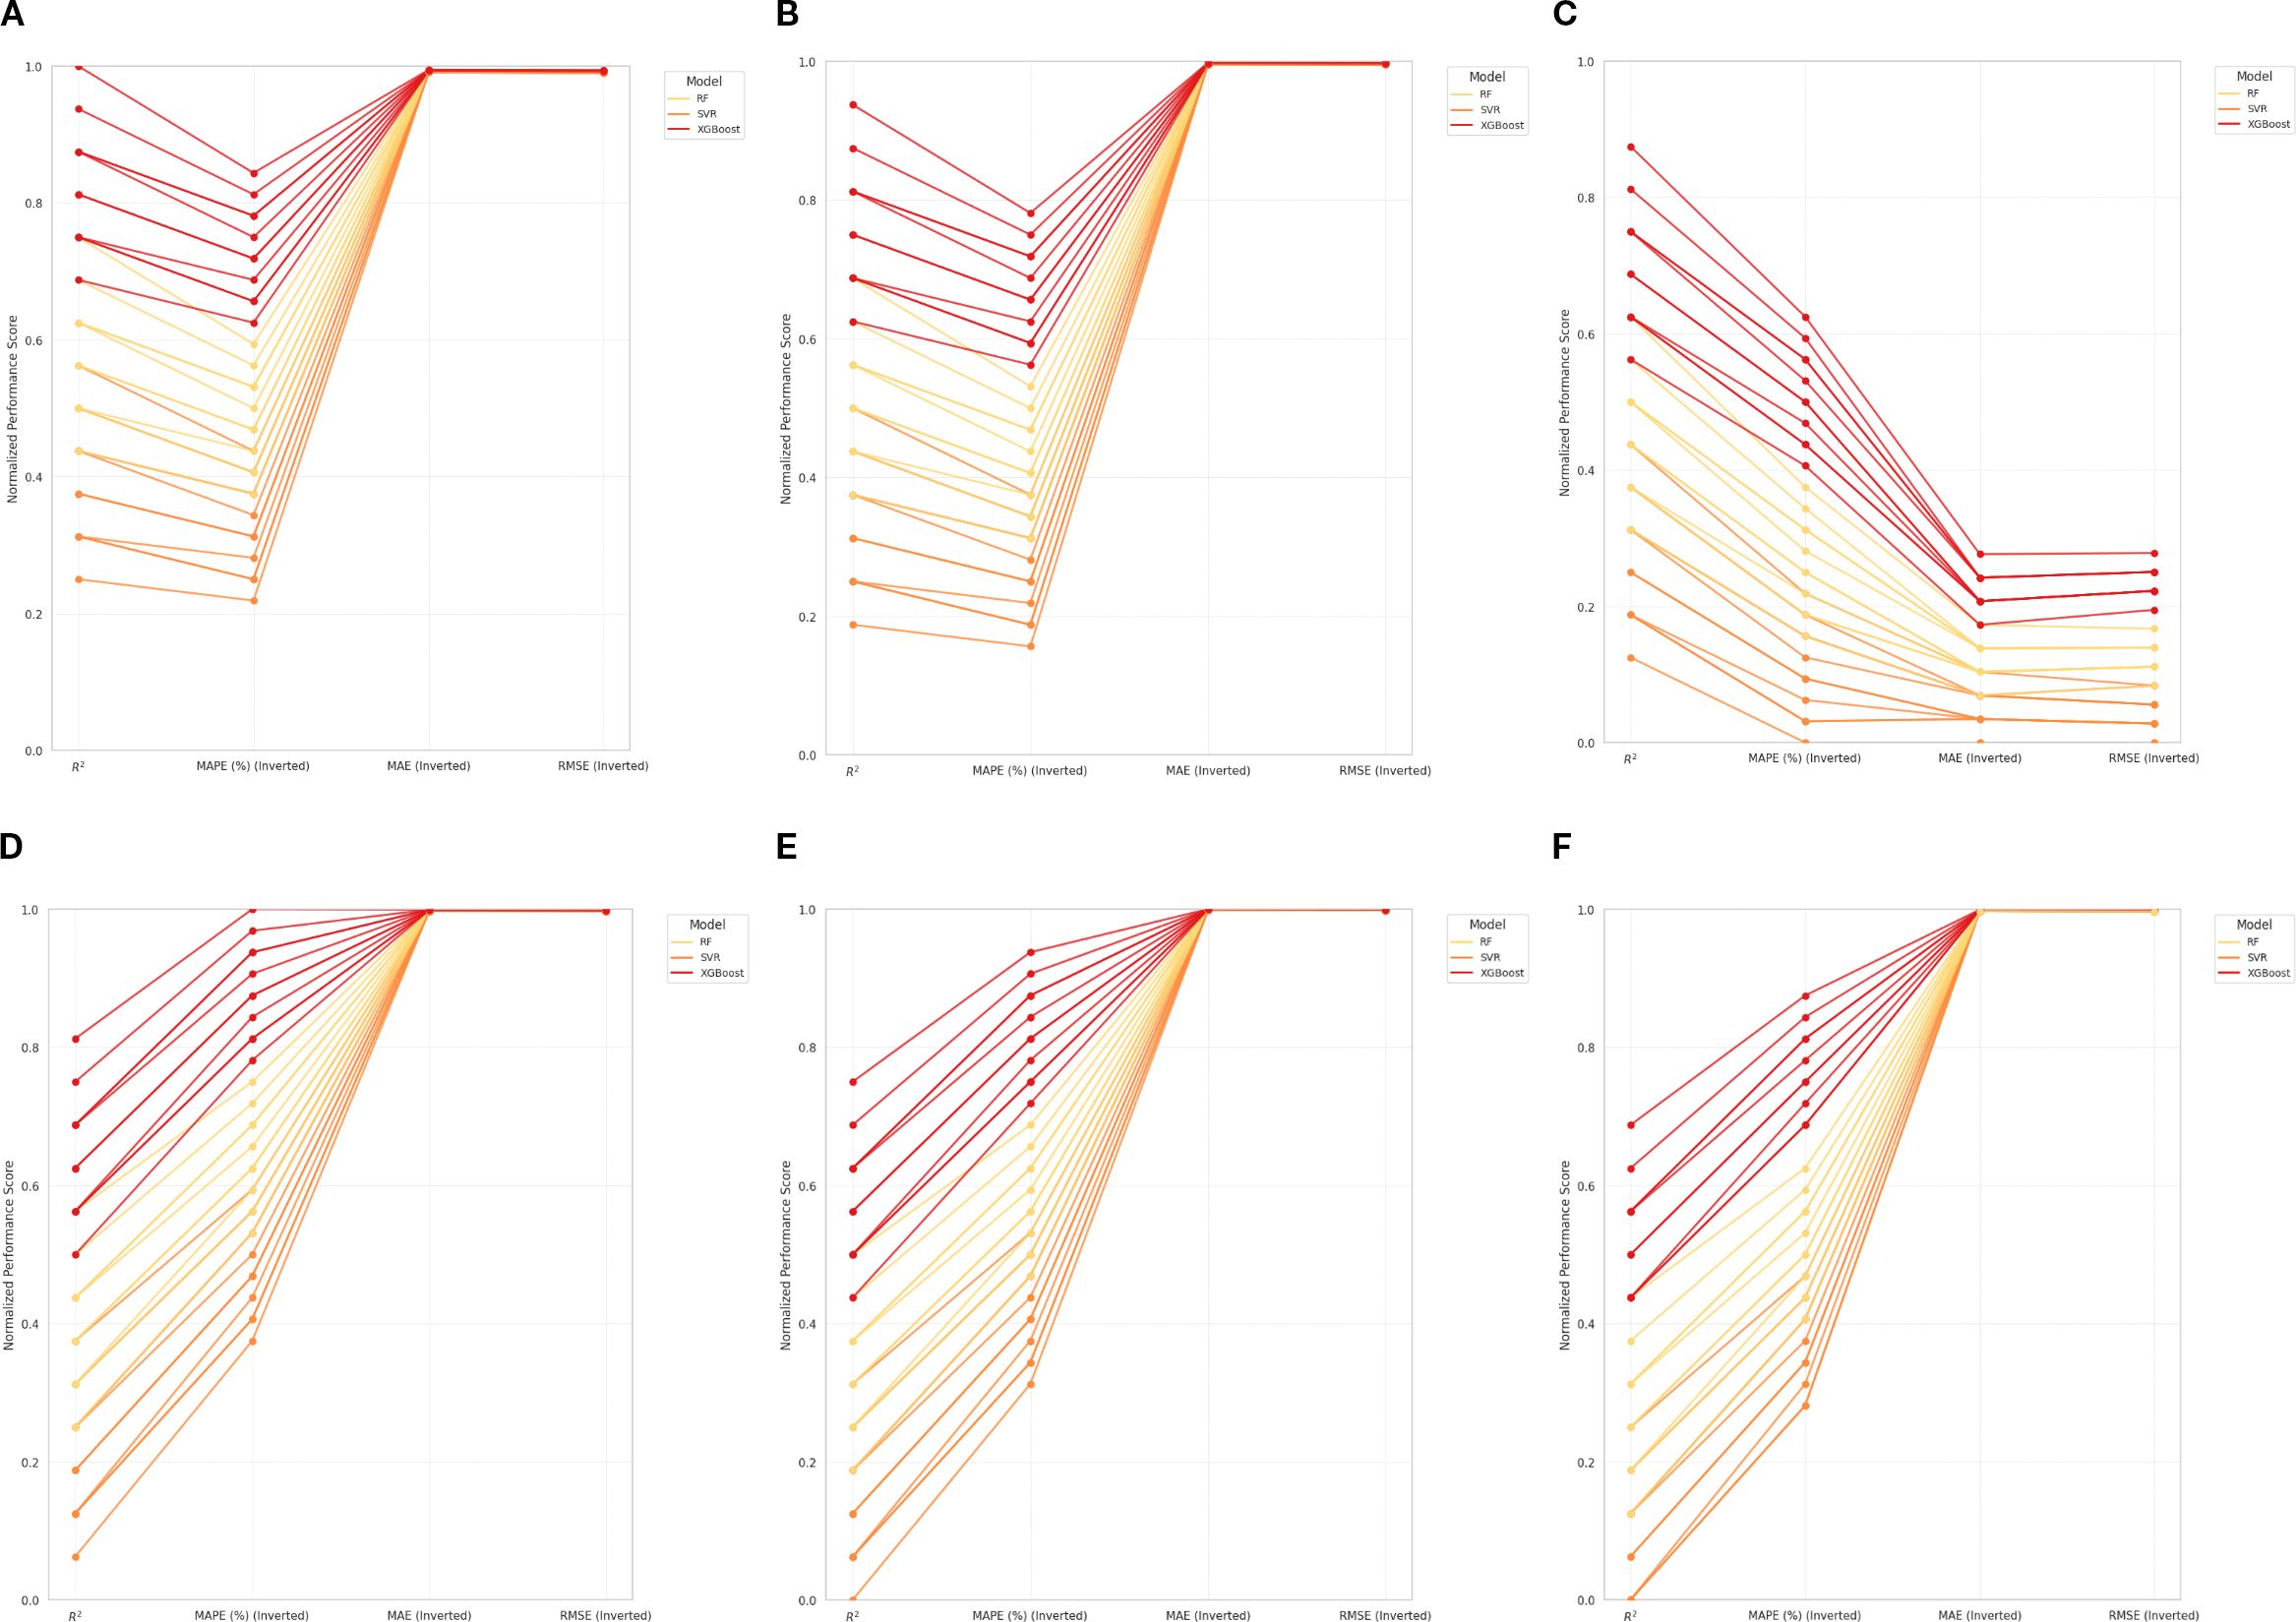
Figure 6. (A-F) Parallel coordinates plot performance (normalized).
3.3 Dependence analysis across environmental metrics
The SHAP analysis delineated in Figure 7 evaluates the relative contributions and intricate interaction effects of green finance instruments on the prediction of critical environmental output variables. The SHAP Summary Plots offer a global perspective on feature importance, employing a kernel density estimation to visualize the distribution of SHAP values, which quantify the marginal contribution of each feature to the model’s output. Green bonds emerge as the most influential predictor across multiple metrics, exhibiting the broadest SHAP value distributions (from -0.04 to 0.04 for TOC and carbon burial rate), indicative of their substantial role in modulating environmental outcomes through large-scale investments in low-carbon infrastructure and carbon sequestration technologies. Green credit follows with a moderate impact, characterized by a narrower SHAP value spread (-0.02 to 0.02), while other instruments such as ETS, green insurance, credit guarantee funds, and green leasing display progressively tighter clusters around zero, suggesting their marginal influence in the predictive framework, likely due to limited deployment or indirect effects on the modeled variables.
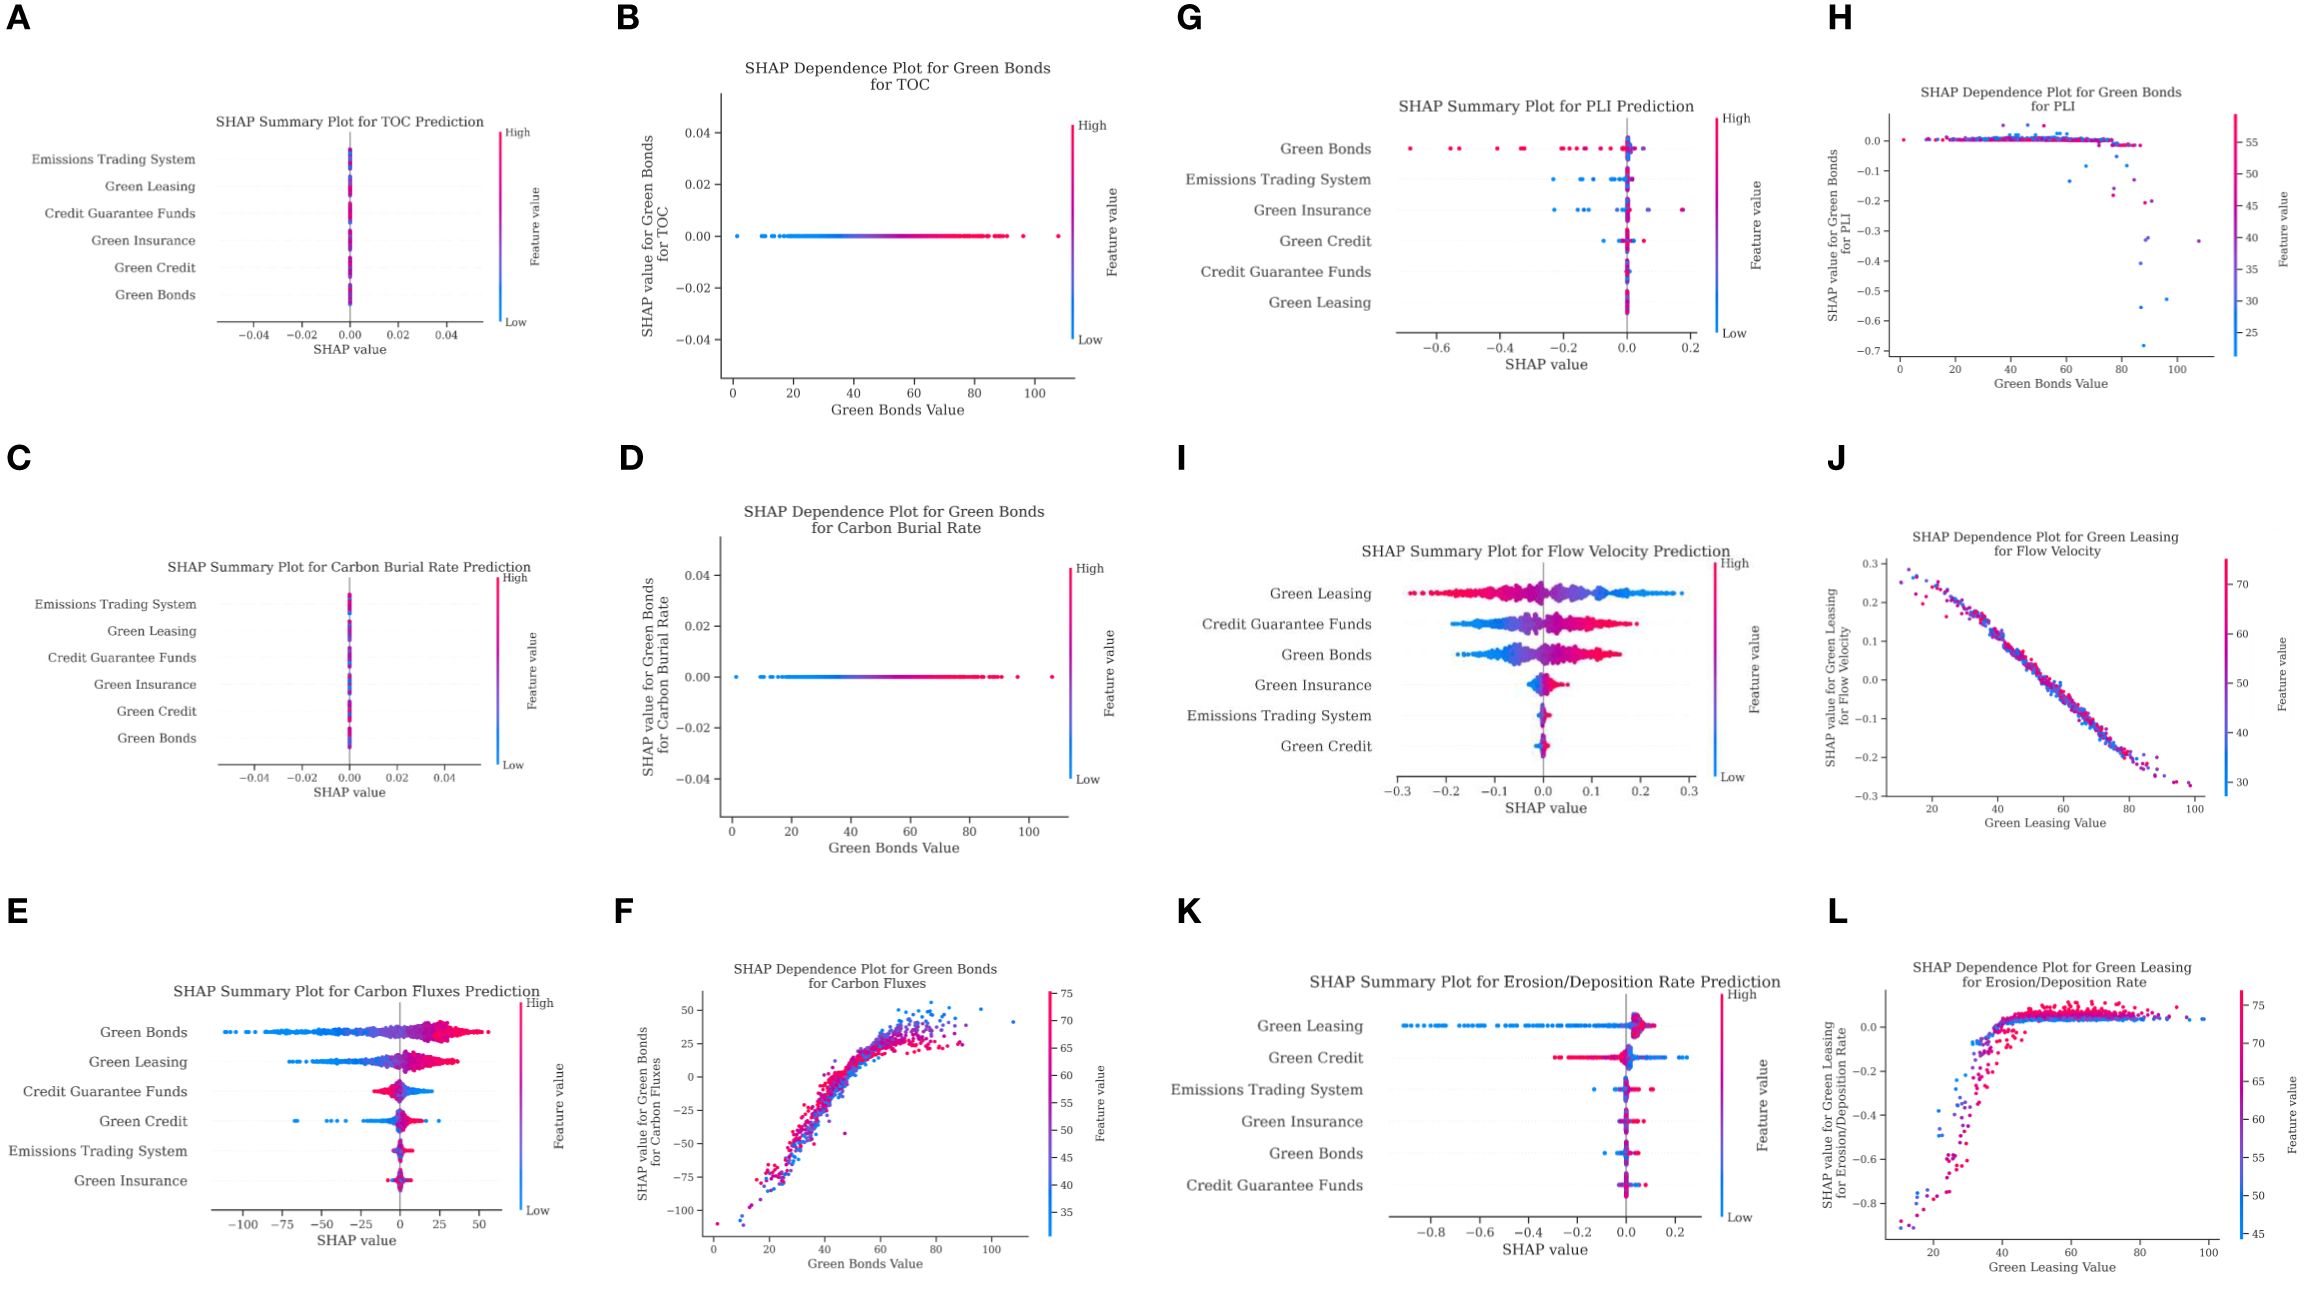
Figure 7. (A-L) SHAP summary plot and SHAP dependence across indicators.
The corresponding SHAP dependence plots provide a granular, instance-level analysis by illustrating how SHAP values vary as a function of feature values, incorporating auto-detected interaction effects to capture nonlinear dependencies and contextual influences. For TOC (%) and carbon burial rate, a stable positive SHAP value trajectory, ranging from approximately 0.02 to 0.04 across the feature value spectrum, is potentially linked to port-specific technological adoption rates, enhancing this effect, suggesting a robust correlation with increased carbon sequestration efficiency in sediment layers. It also indicates a consistent positive impact on marine carbon sink enhancement, though the effect plateaus at higher investment levels, hinting at diminishing marginal returns. This is a common phenomenon, meaning that once investment reaches a certain threshold, the positive environmental impact per additional unit of investment will no longer be as significant as before and will progressively diminish (Simões and Marques, 2010). In the case of carbon fluxes, the SHAP dependence plot for green bonds exhibits a more dynamic range (-25 to 75), with a pronounced positive trend as green bonds values increase, reflecting a nonlinear relationship potentially driven by the deployment of emission reduction technologies and renewable energy systems, though the wide scatter suggests variability across ports with differing operational scales.
For the PLI, the SHAP dependence plot for green bonds indicates a declining trend, with SHAP values shifting from near 0.0 to approximately -0.5 as green bond values rise from 0 to 100, implying a saturation effect where additional investments may not proportionally reduce pollution loads. In contrast, the flow velocity analysis highlights green leasing as a significant driver, with SHAP values decreasing from 0.3 to -0.3 as leasing values increase, suggesting that beyond a certain threshold, leasing-based investments may not further optimize hydrodynamic conditions, potentially due to diminishing returns in smart port automation or flow management systems. For E/DR, the SHAP dependence plot for green leasing shows a positive gradient, with SHAP values escalating from -0.2 to 0.6 across the leasing value range, underscoring its efficacy in stabilizing sediment dynamics through targeted investments in erosion control infrastructure, with notable impacts observed in sediment-heavy ports of Shanghai and Dalian. The differential impact across metrics underscores the need for a stratified policy approach, optimizing the allocation of green bonds for carbon-related outcomes and green leasing for sediment management.
Table 3 assesses the regional heterogeneity and prediction reliability of major environmental parameters. The mean TOC value of 2.40% demonstrates a relatively stable organic carbon distribution, with Shanghai (Yangshan) achieving the maximum (2.60%) due to its advanced carbon capture infrastructure, and Hong Kong registering the minimum (2.20%). Carbon burial rate averages 1.20, with Ningbo-Zhoushan peaking at 1.35 due to strong sediment management practices and Yantai troughing at 1.05, indicating lower carbon sink efficiency in less industrialized settings. Carbon fluxes, with a mean of 150.5 kg/day, reveal significant variability driven by port activity levels, where Guangzhou’s maximum correlates with high trade volumes. The PLI, averaging 1.10, approximates a unity pollution threshold, with Shenzhen’s maximum (1.25) reflecting effective pollution mitigation strategies. E/DR, exhibiting the highest variability with a mean of 0.14 mm/day, highlights geomorphological sensitivity, with Dalian’s maximum (0.18 mm/day) linked to active sediment management. It also exhibits the highest coefficient of variation (CV) of 21.43%, while other environmental indicators have CV values below 10, indicating that the forecasted outputs are relatively stable and not highly dispersed. This indicates a relatively good level of reliability in the results. However, for this particular indicator, policymakers should take into account regional disparities when implementing green financial instruments.
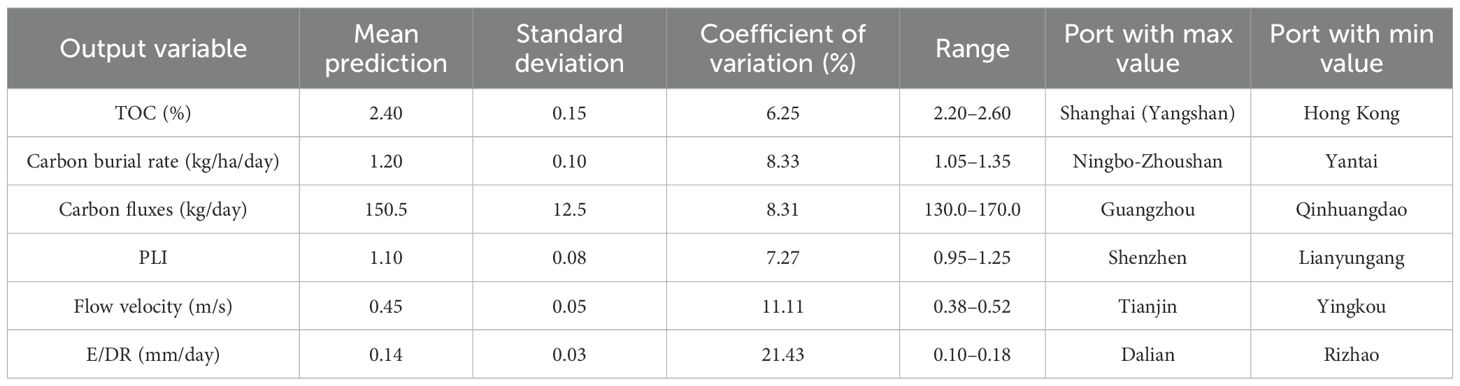
Table 3. Spatial variability of predicted output variables.
Table 4 presents Pearson correlation coefficients that highlight the linear relationships between green finance instruments and environmental outcomes. Green bonds show the strongest positive correlations, with 0.65 for TOC, 0.72 for carbon burial rate, and 0.58 for carbon fluxes, indicating a strong link to carbon sequestration at major ports. A moderate negative correlation with PLI (-0.45) suggests pollution reduction effects, while weaker correlations with flow velocity (0.35) and E/DR (-0.30) imply limited hydrodynamic influence. Green credit follows a similar trend, with slightly lower correlations, reinforcing its impact on carbon-related metrics but showing narrower influence on pollution and sediment dynamics. Green insurance and credit guarantee funds display weaker correlations across all indicators, underscoring their more limited role in environmental outcomes. Green leasing, with the lowest correlations, shows a weak negative PLI correlation (-0.25) and minimal effects on flow velocity (0.20) and E/DR (-0.15). The ETS exhibits a moderate negative PLI correlation (-0.38) and weak influences on flow velocity (0.30) and E/DR (-0.22), reflecting its targeted impact on emission regulation. The robustness checks are outlined in Table 5 using a 10-fold cross-validation with reported standard errors (σ). The performance of XGBoost is also better than RF and SVR. The tighter standard errors and higher adjusted R2 values for XGBoost across all metrics highlight its enhanced predictive and statistical power, likely attributable to its adaptive learning rate and tree-based ensemble structure, though the elevated MAPE variability (± 20 to ±46) suggests potential sensitivity to outliers, warranting further data preprocessing or model tuning for optimal ecological forecasting accuracy.

Table 4. Pearson correlation between input and output variables.

Table 5. Cross-validated performance metrics of ML models.
Figure 8 illustrates the validation outcomes across different folds. The low degree of variation indicates that the model performs stably and is not overly sensitive to data partitioning. It can be observed that the interaction effects of financial instruments increase following higher levels of smart port development (see Figure 9). Green bonds and green leasing exhibit the strongest interaction effects. At level L4, green leasing shows a particularly rapid increase, as indicated by the steep slope from L3 to L4. Although ETS has the lowest interaction effect overall, it demonstrates a notable upward trend from L2 to L4, suggesting that in the long term, it could become a financial mechanism worth considering in port development, especially during the advanced stages of smart port implementation.
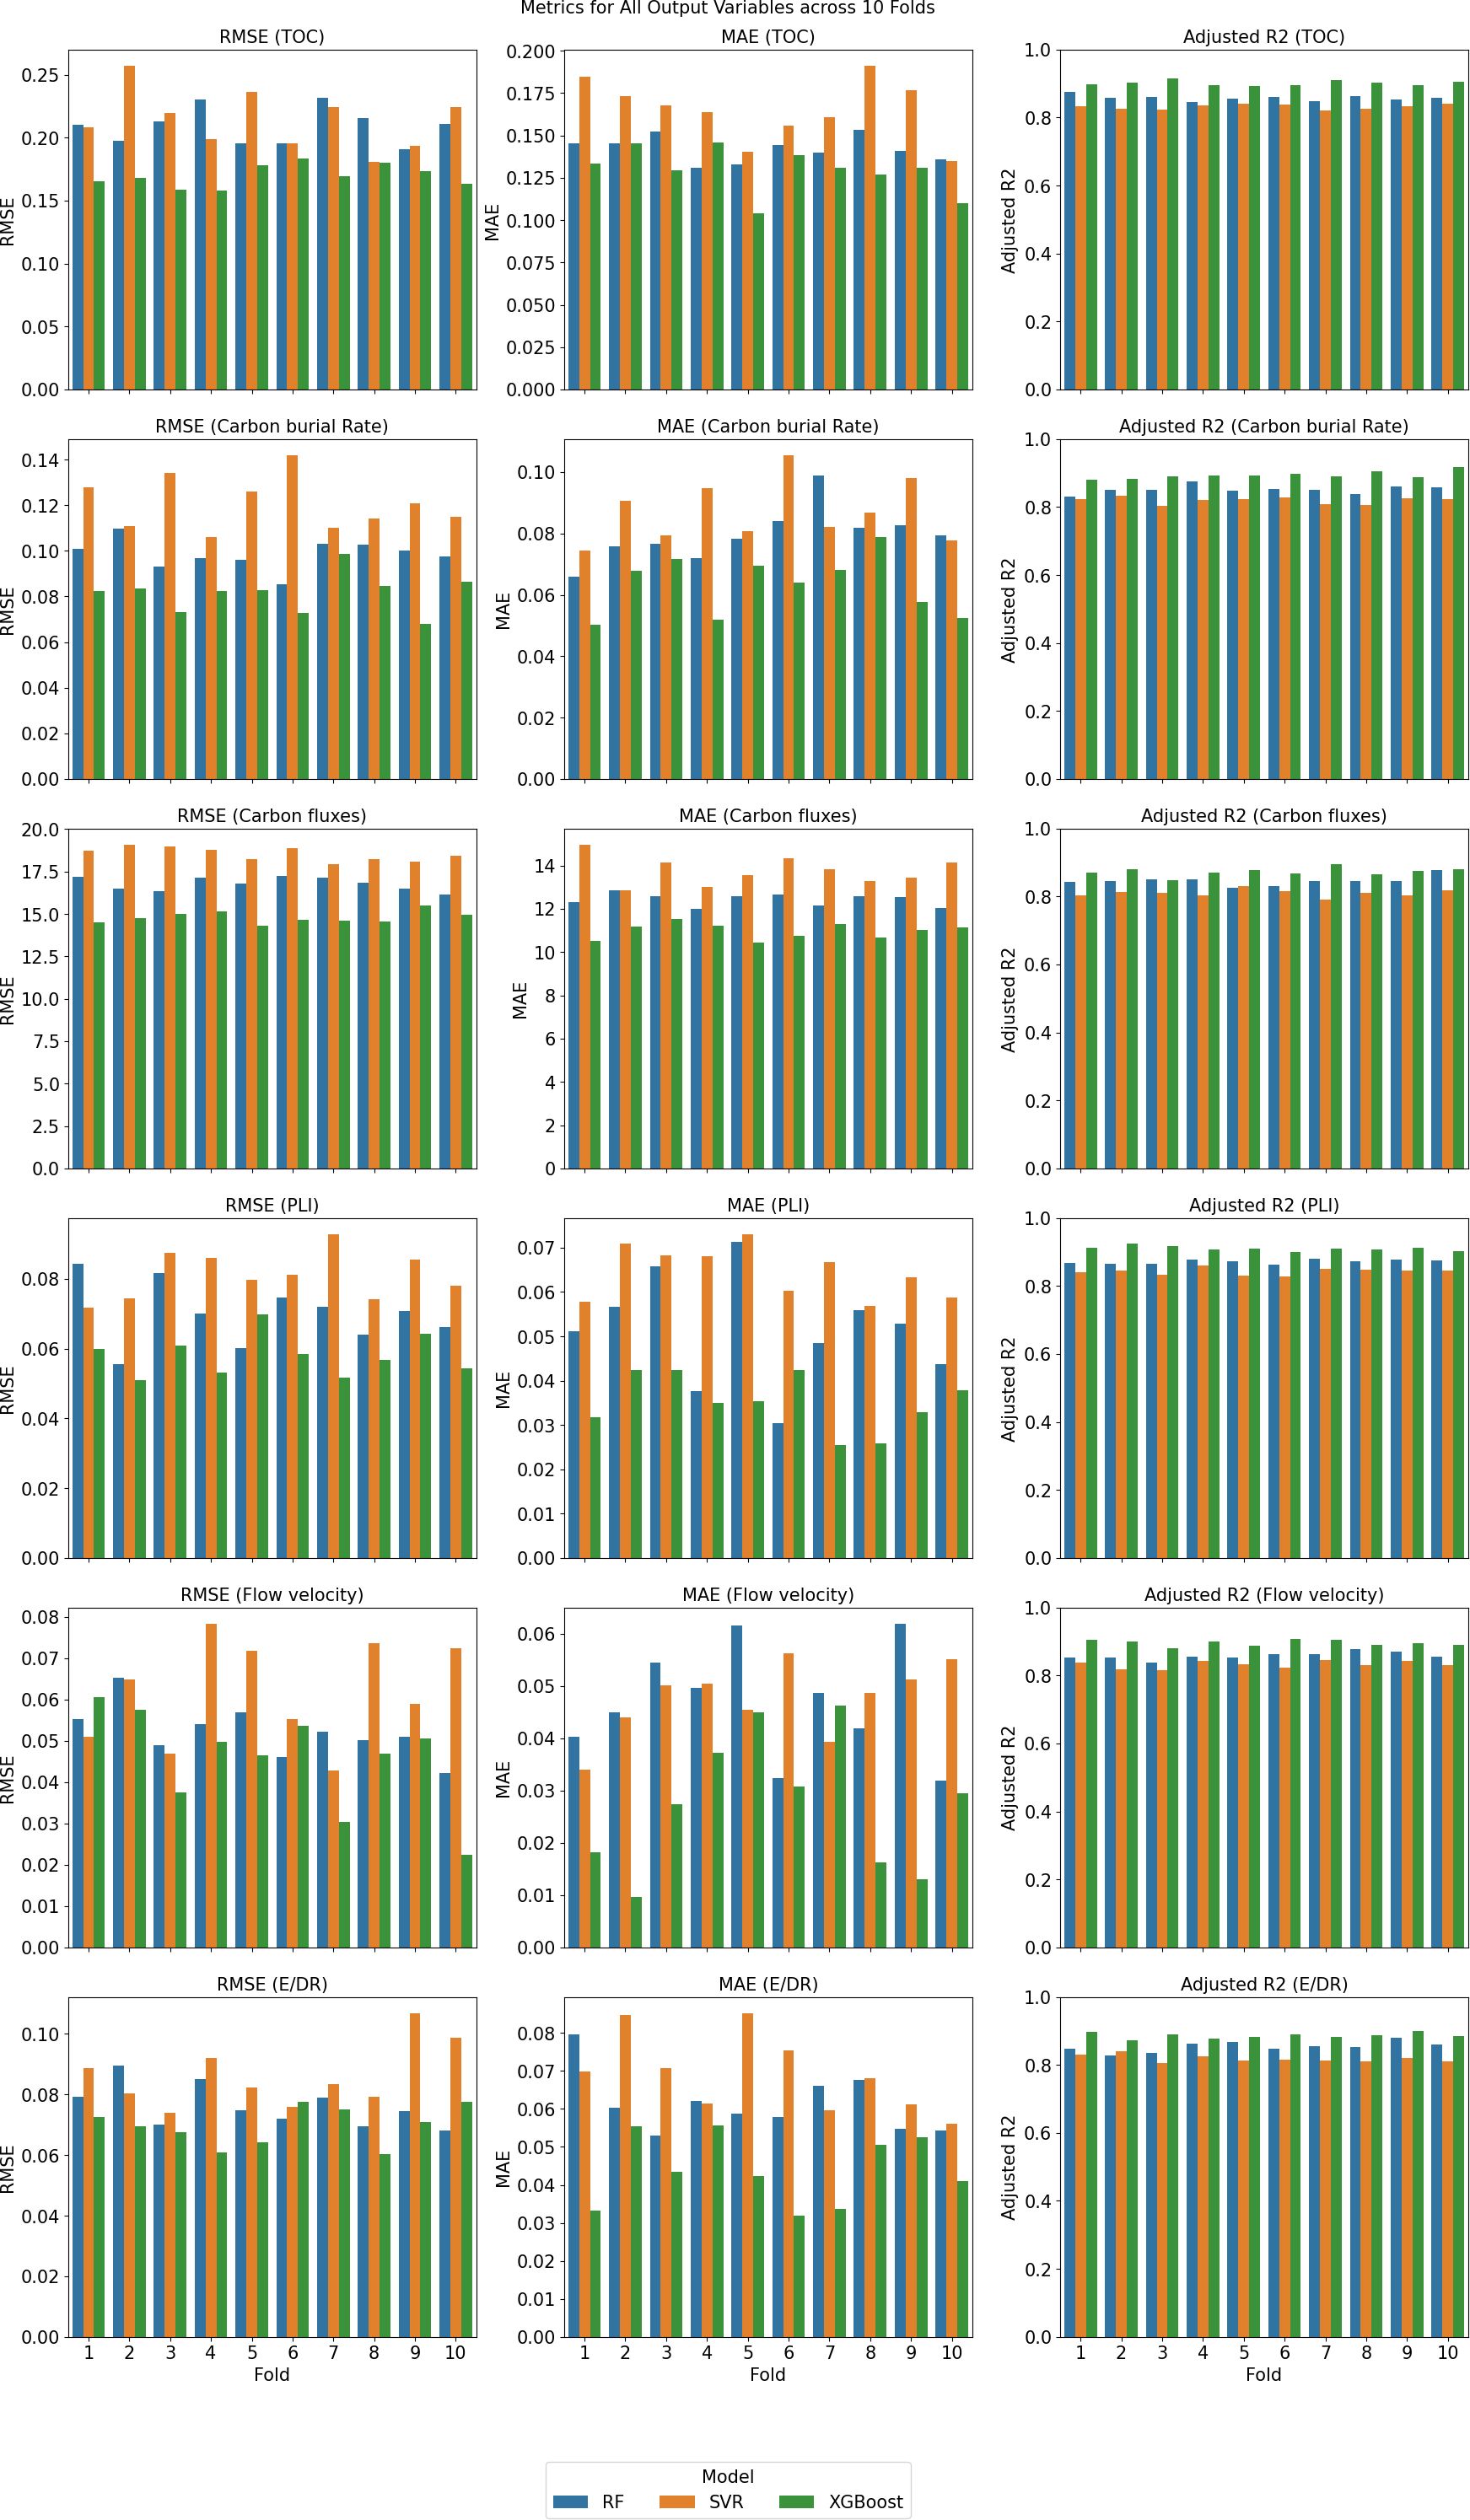
Figure 8. Validation metrics for marine ecosystem indicators by fold.
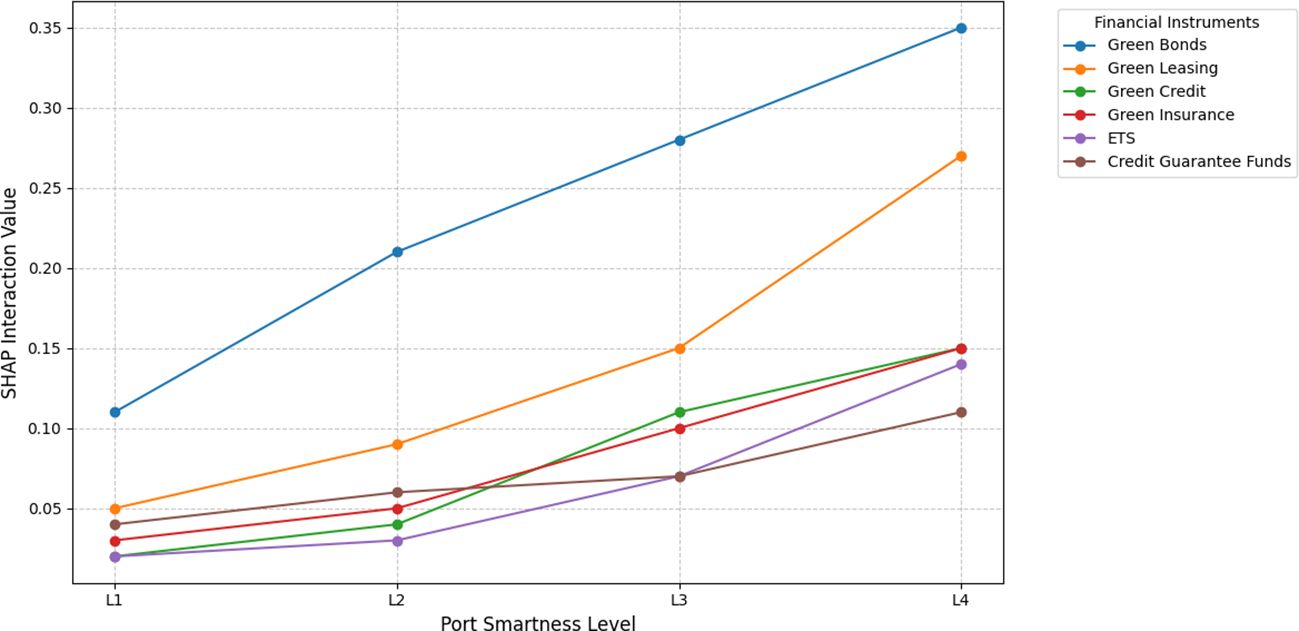
Figure 9. Interaction effects between financial instruments and port smartness level.
4 Recommendations and policy implications
Based on the findings of the IDM framework, we propose the following policy implications. Firstly, the SHAP analysis shows green bonds as the most influential predictor for TOC, carbon burial rate, and PLI. Port authorities should allocate green bond funding to high-impact projects like shore power systems and ballast water treatment to mitigate marine pollution. A dedicated green bond framework should be established, targeting ports with advanced smart infrastructure (L3–L4) to maximize carbon sequestration and pollution reduction. Second, green credit has a strong link with carbon-related outcomes and significant SHAP values. Financial institutions could develop green financing programs to support and scale up renewable energy projects (Bui-Duy et al., 2023), such as solar-powered cranes and offshore wind farms. Incentives such as interest rate subsidies for green credit loans can encourage smaller ports (Rizhao, Yingkou) to use renewable energy, addressing the reduced efficacy of green finance in L1-L2 ports. Thirdly, the study notes the use of blue bonds for marine-based projects like coastal restoration. Given the high variability in E/DR (CV: 21.43%), blue bonds should be prioritized for ecosystem restoration projects, such as mangrove restoration and artificial reefs. The Ministry of Finance should issue standardized blue bond guidelines, ensuring funds are directed to ports with high ecological vulnerability, like those in the Bohai Sea, to enhance marine biodiversity. Also, port authorities should deploy AI tools to monitor the real-time environmental impact of financed projects. For instance, smart sensors can be paired with green finance to track PLI and ensure compliance with sustainability goals, enhancing accountability and effectiveness. Finally, ports with lower smartness (L1-L2) have lower SHAP values for green finance instruments (green bonds: 0.03-0.04 for E/DR). To close this gap, specific funding models, such as micro-green loans or public-private partnerships, should be devised to help smaller ports deploy smart technologies. These models can fund IoT sensors and automated systems, enabling ports like Lianyungang to improve environmental performance.
Additionally, the IDM results highlight the dominant influence of green bonds, green leasing, and green credit on environmental outcomes, which brings a strategic framework for sustainable smart port development in China. National legislation should mandate that at least 20% of port development budgets be channeled through green finance instruments, with a focus on green bonds to fund transformative projects. Those centralized projects supported by AI-driven models should be designed to allocate funds based on port-specific environmental priorities, thereby boosting carbon sequestration and pollution reduction by an estimated 15–20% in advanced L3–L4 ports while enhancing scalability in smaller L1–L2 ports. Addressing the high upfront costs of smart infrastructure requires the introduction of tax exemptions for green bond issuances targeting low-carbon initiatives, alongside interest rate subsidies of 1–2% for green credit loans to support projects. Also, the national green finance fund should prioritize covering 30–50% of initial costs for smart technology adoption, potentially increasing green finance uptake by 25% and reducing PLI by 10–15%. To address transboundary ecosystem issues in areas such as the Yellow Sea, there should be funds for conservation initiatives with an emphasis on projects such as artificial reef development in Dalian and Qingdao using AI-enabled monitoring tools to lower cross-border pollution by 15–20% and achieve hydrodynamic indicators. Lastly, in order to offset the lower effectiveness of green finance in smaller ports such as Rizhao and Lianyungang, a public-private partnership model ought to catalyze private investment by risk-mitigating instruments such as credit guarantee funds in tandem with matching funds in order to increase the usage of smart technology by 30%, enhance environmental performance by 10% and reduce regional imbalances.
Based on the sensitivity analyses presented in Figure 10, the following policy implications can be proposed to arrange financial tools. Policymakers should prioritize a 25-30% increase in green bond allocations in the short term, which could boost carbon burial rate, TOC, and carbon fluxes by 38%, 28%, and 22%, respectively. The moderate impact on flow velocity and E/DR necessitates integrating green bonds with sediment control projects, ensuring a holistic environmental strategy backed by cost-benefit analyses showing a return on investment within 3–5 years. Also, the green leasing is expected to increase by around 20%. This arrangement, in the short term, can lead to a rise in TOC, carbon fluxes, and carbon burial rates by approximately 13%, 9%, and 8%, respectively. These investments are feasible, potentially offering a low-risk entry point to green technology adoption. The synergy between green bonds and green leasing justifies a dual-financing policy. The focus on incremental increases mitigates financial strain on port authorities, while the emphasis on advanced ports maximizes immediate impact. Regular reviews, mandated quarterly, will adjust allocations based on SHAP-driven impact assessments, ensuring alignment with carbon neutrality goals and fostering a resilient, eco-friendly maritime sector. However, the analysis also indicates that increased investments might temporarily exacerbate pollution and sediment instability. Policy response should involve a phased increase to monitor these adverse effects. To limit the negative variation of PLI and E/DR, equipping advanced water treatment systems with IoT monitoring for real-time adjustments, and integrating sediment stabilization projects should be considered.
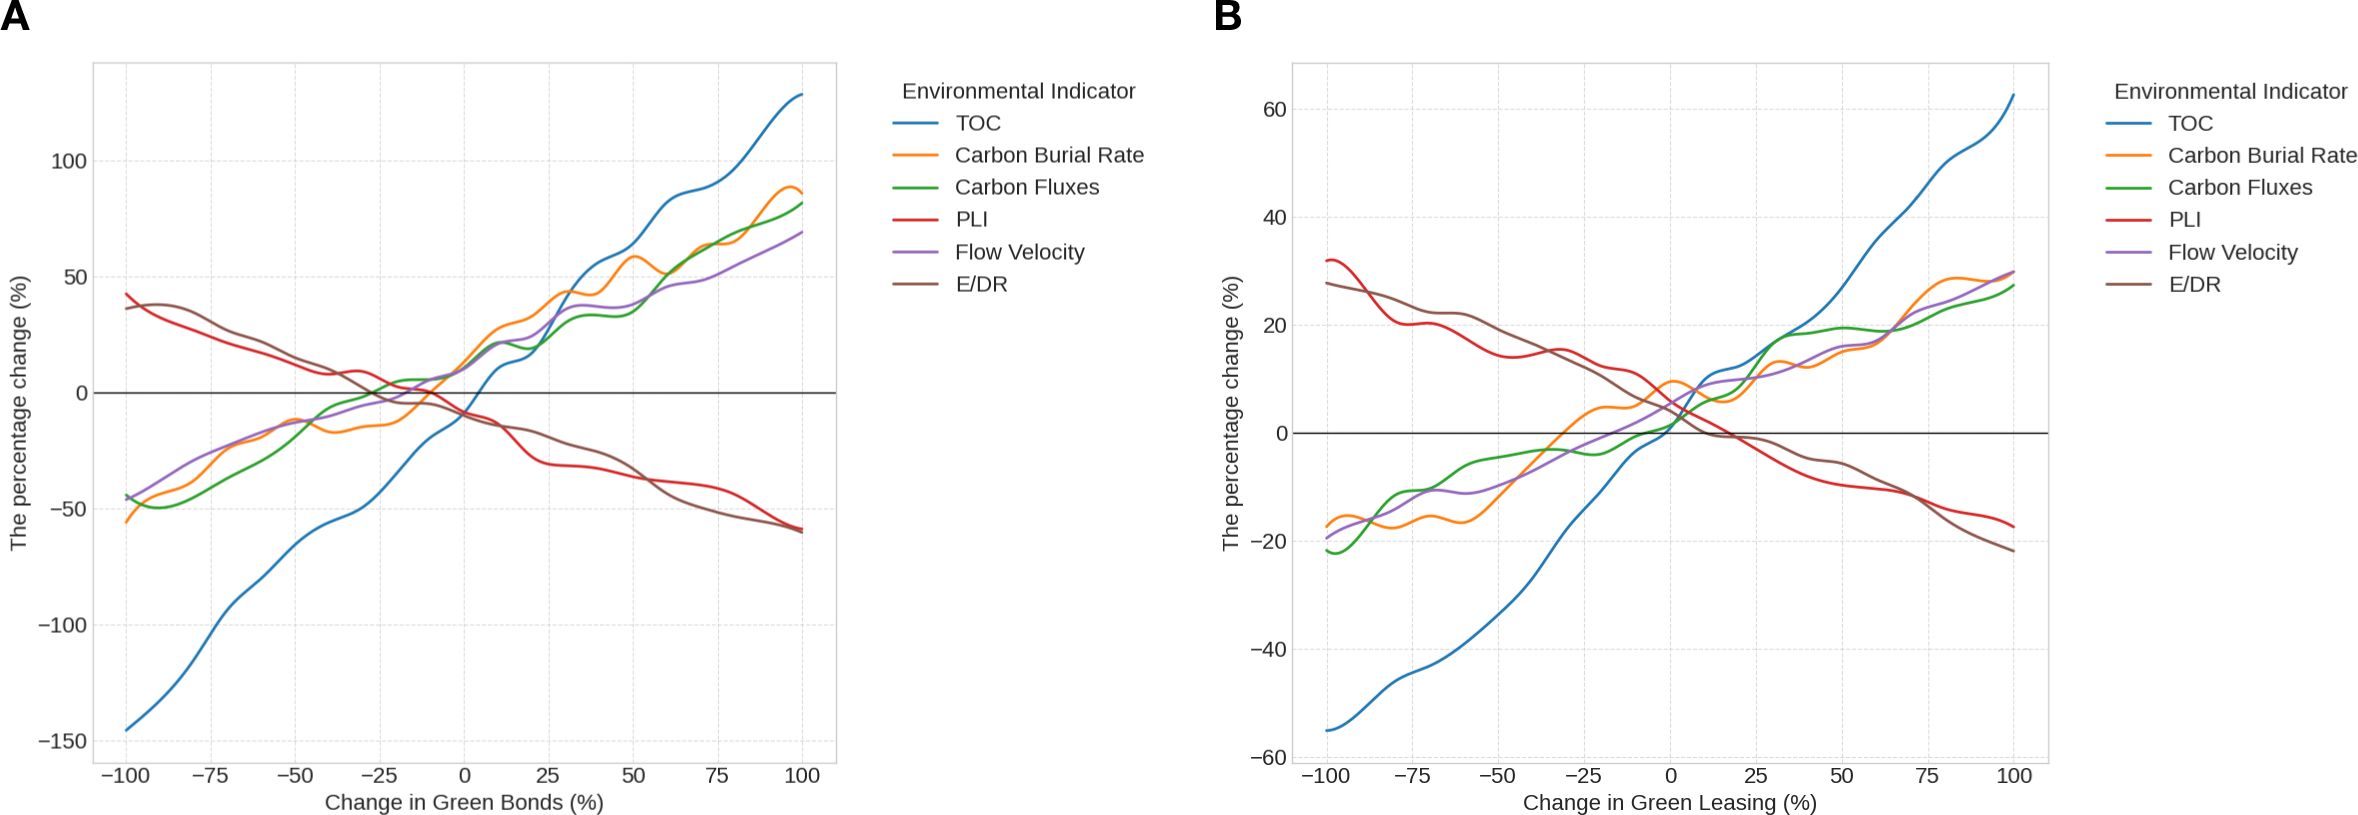
Figure 10. (A, B) Sensitivity analysis of the change in two dominant tools on the reduction of ecosystem pollution.
From a technical perspective, the model can be readily scaled up and applied in other advanced economies where datasets are relatively complete and where smart port systems are well-equipped with data acquisition, measurement, and monitoring capabilities. This would facilitate more effective decision-making in allocating financial resources toward green objectives. In several European countries, the results may differ from those observed in China, with a tendency to prioritize ETS, given the continent’s early and widespread adoption of ETS mechanisms. Conversely, in countries with strong seaport infrastructure but limited smart port maturity, where data, as well as financial and environmental monitoring systems, remain fragmented and lack standardization, the application of this research would be considerably challenging. Therefore, wastefulness in the allocation of financial instruments is difficult to avoid. In such cases, the IDM technique can be adjusted to serve as an intermediary step, a guiding framework for port authorities and local governments to place greater emphasis on enhancing the deployment of equipment for monitoring, measurement, and data acquisition. This would help establish the necessary and sufficient conditions for applying advanced techniques aimed at reducing resource allocation inefficiencies and improving the port area’s ecological environment.
5 Conclusions
This study provides a comprehensive analysis of IDM and green finance instruments in advancing sustainable smart port development in China, with a focus on their impact on marine ecosystem conservation. The IDM framework utilizes ML models to predict environmental indicators based on financial variables and the SHAP technique to quantify the interactive effects between explanatory and response variables. The most important results illustrate the prominent role of green finance, particularly green bonds, green leasing, and green credit, in generating positive environmental effects across 15 major Chinese ports. The SHAP analysis indicates that green bonds are the leading factor of influence, with numbers oscillating between 0.24–0.30 for carbon burial rate and 0.17–0.20 for PLI, thus showing their efficiency in not only increasing carbon storage but also in decreasing water pollution, especially in the most developed ports like Shanghai and Ningbo-Zhoushan. Green credit is next in sequence, with very tight correlations (0.60 for TOC, 0.68 for carbon burial rate), and it fosters the use of renewable energy and the fight against pollution. The XGBoost model outperforms RF and SVR; it gets adjusted R² numbers of 0.88–0.91 for environmental indicators such as TOC, carbon fluxes, and flow velocity, being the most reliable to detect intricate, non-linear relationships and instruct the distribution of resources. Spatial variability analysis highlights glaring differences in environmental outcomes, with Shanghai leading in TOC (2.60%) and Ningbo-Zhoushan topping the carbon burial rate (1.35 kg/ha/day), while quite a few smaller ports like Qinhuangdao and Yingkou show poorer performance due to their fragmented smart infrastructure. These results are significant as they attest to the interplay of IDM, green finance, and sustainable port operations that are well in accord with China’s carbon neutrality and peak carbon targets.
The study makes three significant contributions to the literature. First, it quantifies the impact of green finance instruments on environmental outcomes using SHAP analysis, identifying green bonds and green credit as primary drivers of carbon sequestration and pollution reduction, thus providing a data-driven framework for prioritizing financial tools in port sustainability. Second, it demonstrates the superior predictive accuracy of XGBoost in modeling complex port-specific environmental dynamics, offering a scalable approach for IDM in smart port development. Third, it highlights regional disparities in green finance efficacy, particularly the lower impact in L1–L2 ports (SHAP values of 0.03–0.05 for E/DR in Rizhao), informing targeted policy interventions to bridge these gaps.
Even though the study shows some good things, the research is not without issues. In terms of research scope, this study focuses solely on the analysis of marine environmental ecological indicators in the surrounding areas, without considering air quality and its dispersion during the development of smart ports. This scope can be expanded in future studies once comprehensive air quality data becomes available. Second, due to incomplete archival records of baseline sediment indicators from the period before port construction, a thorough assessment of the effectiveness of financial instruments in smart port development may be subject to certain inaccuracies. Future research can be based on this study’s suggestion to conduct systematic data collection and storage in other regions or territories. From a methodological perspective, the current process of data collection and analysis remains time-consuming due to the reliance on traditional approaches. Moreover, the frequency of measurements and data acquisition has yet to achieve continuity. Equipping more advanced sediment monitoring systems and data collection devices that enable real-time recording of ecosystem changes multiple times per day is crucial. Then it can further enhance the accuracy of the model and provide a more robust basis for evidence-based policy planning. Finally, future studies could offer a more comprehensive analysis by conducting a comparative assessment of the effectiveness of financial instruments between smart port areas and other civilian zones within the same city, thereby further clarifying the rationale for allocating these green financial instruments.
Data availability statement
The original contributions presented in the study are included in the article/supplementary material. Further inquiries can be directed to the corresponding author/s.
Author contributions
CL: Software, Funding acquisition, Resources, Writing – review & editing, Formal Analysis, Writing – original draft, Data curation, Methodology, Project administration, Investigation, Validation, Conceptualization. TL: Validation, Methodology, Writing – review & editing, Visualization, Investigation, Writing – original draft.
Funding
The author(s) declare financial support was received for the research and/or publication of this article. This work was supported by Research Project of Green Finance and Sustainable Development Research Institute, Nanjing Audit University Jinshen College “In-depth Research on Green Finance Advancement under Carbon Neutrality and Peak Carbon Targets (Grant No. ZXYB2311).
Conflict of interest
The authors declare that the research was conducted in the absence of any commercial or financial relationships that could be construed as a potential conflict of interest.
Generative AI statement
The author(s) declare that no Generative AI was used in the creation of this manuscript.
Any alternative text (alt text) provided alongside figures in this article has been generated by Frontiers with the support of artificial intelligence and reasonable efforts have been made to ensure accuracy, including review by the authors wherever possible. If you identify any issues, please contact us.
Publisher’s note
All claims expressed in this article are solely those of the authors and do not necessarily represent those of their affiliated organizations, or those of the publisher, the editors and the reviewers. Any product that may be evaluated in this article, or claim that may be made by its manufacturer, is not guaranteed or endorsed by the publisher.
References
ADB (2023). ADB Green and Blue Bonds Newsletter. Available online at: https://www.adb.org/sites/default/files/publication/297141/adb-green-blue-bonds-newsletter-2024.pdf (Accessed March 13, 2025).
Asian Development Bank (2020). Smart Ports in the Pacific. Available online at: https://www.adb.org/sites/default/files/publication/646401/smarts-ports-pacific.pdf (Accessed April 25, 2025).
Bui-Duy L., Le L. T., Vu-Thi-Minh N., Hoang-Huong G., Bui-Thi-Thanh N., and Nguyen P. N. (2023). Economic and environmental analysis of biomass pellet supply chain using simulation-based approach. Asia Pac. Manage. Rev. 28, 470–486. doi: 10.1016/j.apmrv.2023.02.002
Bui-Minh T., Giang N. L., and Le L. T. (2025). Efficient method for trademark image retrieval: leveraging siamese and triplet networks with examination-informed loss adjustment. Comput. Mater. Contin. 84, 1203–1226. doi: 10.32604/cmc.2025.064403
Chen T., Wang Y., Gardner C., and Wu F. (2020). Threats and protection policies of the aquatic biodiversity in the Yangtze River. J. Nat. Conserv. 58, 125931. doi: 10.1016/j.jnc.2020.125931
China Ports and Harbours Association (2024). Data collaboration. Available online at: https://www.iaphworldports.org/iaph-md/directory/port_details/195 (Accessed May 26, 2025).
Huang W., Yu M., Li H., and Tai N. (2023). “Optimization configuration of renewable energies and energy storages in port microgrids,” in Energy Management of Integrated Energy System in Large Ports (Springer, Singapore), 33–55. doi: 10.1007/978-981-99-8795-5_2
Irannezhad E., Prato C. G., and Hickman M. (2020). An intelligent decision support system prototype for hinterland port logistics. Decis. Support Syst. 130, 113227. doi: 10.1016/j.dss.2019.113227
Kai Z., Sharaf M., Wei S. Y., Shraah A. A., Le L. T., Arvind Bedekar D. A., et al. (2024). Exploring the asymmetric relationship between natural resources, fintech, remittance and environmental pollution for BRICS nations: New insights from MMQR approach. Resour. Policy 90, 104693. doi: 10.1016/j.resourpol.2024.104693
Le L. T. (2025). Uncovering import document fraud: leveraging the deep learning approach. Glob. Trade Cust. J. 20, 3–10. doi: 10.54648/gtcj2025002
Le L. T. and Xuan-Thi-Thu T. (2024). Discovering supply chain operation towards sustainability using machine learning and DES techniques: a case study in Vietnam seafood. Marit. Bus. Rev. 9, 243–262. doi: 10.1108/MABR-10-2023-0074
Li X., Abed A. M., Shaban M., Le L. T., Zhou X., Abdullaev S., et al. (2024). Artificial intelligence application for assessment/optimization of a cost-efficient energy system: Double-flash geothermal scheme tailored combined heat/power plant. Energy 313, 133594. doi: 10.1016/j.energy.2024.133594
Li K. X., Li M., Zhu Y., Yuen K. F., Tong H., and Zhou H. (2023). Smart port: A bibliometric review and future research directions. Transp. Res. E. Logist. Transp. Rev. 174, 103098. doi: 10.1016/j.tre.2023.103098
Liu M., Lai K., Wong C. W. Y., Xin X., and Lun V. Y. H. (2025). Smart ports for sustainable shipping: concept and practices revisited through the case study of China’s Tianjin port. Marit. Econ. Logist. 27, 50–95. doi: 10.1057/s41278-024-00291-3
Lucrezi S. (2022). Public perceptions of marine environmental issues: A case study of coastal recreational users in Italy. J. Coast. Conserv. 26, 52. doi: 10.1007/s11852-022-00900-4
Luo S., Yimamu N., Li Y., Wu H., Irfan M., and Hao Y. (2023). Digitalization and sustainable development: How could digital economy development improve green innovation in China? Bus. Strategy Environ. 32, 1847–1871. doi: 10.1002/bse.3223
Mayrhofer M. and Filzmoser P. (2023). Multivariate outlier explanations using Shapley values and Mahalanobis distances. Econom. Stat. doi: 10.1016/j.ecosta.2023.04.003
Minh N. V. T., Duy L. B., Le L. T., Huong G. H., and Anh S. T. (2024). Supply chain disruption for crude oil due to the effect of COVID-19 pandemic: evidence from Vietnam. Int. J. Logist. Manage. 48, 326–349. doi: 10.1504/IJLSM.2024.140061
Ministry of Ecology and Environment People’s Republic of China (2024). Biodiversity conservation in China. Available online at: https://english.mee.gov.cn/ (Accessed May 23, 2025).
Mohite A. A. and Mathew E. (2025). Exploring the necessary upgrades in port infrastructure to accommodate and support the operation of the next-generation green ships. Mar. Syst. Ocean Technol. 20, 26. doi: 10.1007/s40868-025-00171-2
Nie A., Wan Z., Shi Z. F., and Wang Z. (2023). Cost-benefit analysis of ballast water treatment for three major port clusters in China: evaluation of different scenario strategies. Front. Mar. Sci. 10. doi: 10.3389/fmars.2023.1174550
Puig M. and Darbra R. M. (2024). Innovations and insights in environmental monitoring and assessment in port areas. Curr. Opin. Environ. Sustain. 70, 101472. doi: 10.1016/j.cosust.2024.101472
Ran L., Yan G., Goyal V., Abdullaev S., Alhomayani F. M., Le L. T., et al. (2024). Advancing solar thermal utilization by optimization of phase change material thermal storage systems: A hybrid approach of artificial neural network (ANN)/Genetic algorithm (GA). Case Stud. Therm. Eng. 64, 105513. doi: 10.1016/j.csite.2024.105513
Rebelo P. (2020). Green finance for a sustainable maritime transport system: developing a universal vernacular for green shipping. A&NZ. Mar. L. J. 34, 16–30. Available online at: https://openaccess.city.ac.uk/id/eprint/28815/ (Accessed June 6, 2025).
Shaban W. M., Xie D., Elbaz K., and Shen S.-L. (2024). Real-time water quality prediction of wastewater treatment plants using advanced deep learning networks. J. Water Process. Eng. 65, 105775. doi: 10.1016/j.jwpe.2024.105775
Shao Q. (2020). Nonlinear effects of marine economic growth and technological innovation on marine pollution: Panel threshold analysis for China’s 11 coastal regions. Mar. Policy 121, 104110. doi: 10.1016/j.marpol.2020.104110
Simões P. and Marques R. C. (2010). Influence of congestion efficiency on the european seaports performance: Does it matter? Transp. Rev. 30, 517–539. doi: 10.1080/01441640903175592
Su J. and Gasparatos A. (2023). Perceptions about mangrove restoration and ecosystem services to inform ecosystem-based restoration in Large Xiamen Bay, China. Landsc. Urban Plan. 235, 104763. doi: 10.1016/j.landurbplan.2023.104763
Ta A. S., Le L. T., and Bui-Duy L. (2025). Advanced vehicle monitoring in smart port utilizing deep denoising real-time object detectors integrated multi-resolution attention-augmented CRNN. Ain Shams Eng. J. 16, 103483. doi: 10.1016/j.asej.2025.103483
Tabish N. and Chaur-Luh T. (2024). Maritime autonomous surface ships: A review of cybersecurity challenges, countermeasures, and future perspectives. IEEE Access 12, 17114–17136. doi: 10.1109/ACCESS.2024.3357082
Tan Z., Zeng X., Wang T., Wang Y., and Chen J. (2023). Capacity investment of shore power berths for a container port: Environmental incentive and infrastructure subsidy policies. Ocean Coast. Manage. 239, 106582. doi: 10.1016/j.ocecoaman.2023.106582
Thompson B. S. (2022). Blue bonds for marine conservation and a sustainable ocean economy: Status, trends, and insights from green bonds. Mar. Policy 144, 105219. doi: 10.1016/j.marpol.2022.105219
UNCTAD (2023). Container port throughput, annual. Available online at: https://unctadstat.unctad.org/datacentre/dataviewer/US.ContPortThroughput (Accessed May 10, 2025).
Wang X., Li N., Feng D., Hu Y., Bayon G., Liang Q., et al. (2018). Using chemical compositions of sediments to constrain methane seepage dynamics: A case study from Haima cold seeps of the South China Sea. J. Asian Earth Sci. 168, 137–144. doi: 10.1016/j.jseaes.2018.11.011
Wang C., Liao S., Wu X., Liu D., and Yu Y. (2025). Coupling coordination analysis of the marine low-carbon economy and carbon emission reduction from the perspective of China’s dual carbon goals. Sustainability 17, 4100. doi: 10.3390/su17094100
Winogradow A. and Pempkowiak J. (2014). Organic carbon burial rates in the Baltic Sea sediments. Estuar. Coast. Shelf. Sci. 138, 27–36. doi: 10.1016/j.ecss.2013.12.001
Yadav M. S. and Ahamad S. (2019). Outlier detection in wireless sensor networks data by entropy based K-NN predictor. Int. J. Innov. Res. Sci. Eng. Technol. 8, 5483–5489. doi: 10.35940/ijitee.K2290.1081219
Yaro A. S., Maly F., Prazak P., and Maly K. (2024). Outlier detection performance of a modified Z-score method in time-series RSS observation with hybrid scale estimators. IEEE Access 12, 12785–12796. doi: 10.1109/ACCESS.2024.3356731
Yin M., Wang Y., and Zhang Q. (2020). Policy implementation barriers and economic analysis of shore power promotion in China. Transp. Res. D: Transp. Environ. 87, 102506. doi: 10.1016/j.trd.2020.102506
Yu J., Zhou D., Yu M., Yang J., Li Y., Guan B., et al. (2021). Environmental threats induced heavy ecological burdens on the coastal zone of the Bohai Sea, China. Sci. Total. Environ. 765, 142694. doi: 10.1016/j.scitotenv.2020.142694
Keywords: intelligent decision system, smart port, green finance, marine ecosystem, machinelearning, port environmental performance, SHAP value, China
Citation: Ling C and Le T (2025) Intelligent decision-making in smart port development in China through green finance instruments: a sustainable approach to the marine ecosystem. Front. Mar. Sci. 12:1656454. doi: 10.3389/fmars.2025.1656454
Received: 02 July 2025; Accepted: 27 August 2025;
Published: 11 September 2025.
Edited by:
Mario Lebrato, Bazaruto Center for Scientific Studies (BCSS), MozambiqueReviewed by:
Paola B Reyna, Universal Plastic, SpainMd Mostafa Aziz Shaheen, Bangabandhu Sheikh Mujibur Rahman Maritime University, Bangladesh
Copyright © 2025 Ling and Le. This is an open-access article distributed under the terms of the Creative Commons Attribution License (CC BY). The use, distribution or reproduction in other forums is permitted, provided the original author(s) and the copyright owner(s) are credited and that the original publication in this journal is cited, in accordance with accepted academic practice. No use, distribution or reproduction is permitted which does not comply with these terms.
*Correspondence: Chen Ling, MTUwNTE4OTIyNDhAMTYzLmNvbQ==; Y3N1bjIyOTBAZ21haWwuY29t