 Jie Wang
 Yan Zhang2
- 1Merchant Marine College, Shanghai Maritime University, Shanghai, China
- 2College of Foreign Languages, Shanghai Maritime University, Shanghai, China
- 3The 1st Pilotage Department, Tangshan Pilot Station, Tangshan, China
Since the last round of government-led provincial port reforms, China’s port clusters have developed rapidly. Despite being China’s most significant port cluster, the Yangtze River Delta (YRD) port cluster faces certain constraints in its development process, which hinder it from fully realizing its potential. This paper aims to clarify the advantages and constraints of the Yangtze River Delta port cluster development through a comprehensive and systematic evaluation, which is crucial for optimizing the cluster’s collective efficiency and effectiveness. Therefore, further deepening of reform is needed, which requires a comprehensive evaluation of the development performance of the port cluster. This study develops a port cluster evaluation model (S = P × k), where S = score, P = competitiveness (hard power), and k = harmony coefficient (system coordination). The framework follows three principles: functional differentiation, hierarchical decomposition (macro to micro), and dynamic equilibrium. The indicator system includes two Level-1 metrics—Overall competitiveness (4 sub-indicators, e.g., economic scale) and System harmony (2 sub-indicators, e.g., cooperation-competition balance)—plus 10 Level-3 operational indicators (e.g., cargo throughput). Weights are determined via AHP, combining objective and subjective methods. Subsequently, the developmental level and overall performance of the Yangtze River Delta port cluster are assessed with the evaluation model. The evaluation results show a clear performance hierarchy: Shanghai port cluster leads (0.230), preceding Zhejiang (0.178) and Jiangsu (0.127), whereas Anhui (0.020) occupies the lowest position. The evaluation results reveal three significant findings. First, the harmony coefficient (k) demonstrates a particularly strong influence on the comprehensive scores. Second, the 0.230-0.020 performance range across provincial clusters quantitatively validates the YRD’s development imbalances. Third, our three-tier indicator system successfully identifies under performing dimensions at different levels (e.g., Anhui’s weak Level-3 operational indicators). In light of the evaluation outcomes and the actual development status, optimization strategies (such as enhance planning and coordination, promote port cooperation, clarify port positioning and division of labor) are proposed to address the existing problems in this large port cluster.
1 Introduction
China, currently the world’s top trading nation in terms of goods volume, has developed five major port clusters along its coastline, from south to north, namely the Southwestern Coast port cluster, the Pearl River Delta port cluster, the Southeastern Coast port cluster, the Yangtze River Delta port cluster, and the Bohai Rim port cluster (Xu et al., 2021), as shown in Figure 1. Most of China’s maritime trade is conducted through these five port clusters. As a vital component of marine economy, port clusters not only play an important part in improving international trade (Lu, 2024; Xie et al., 2025) and enhancing local economic development (Nguyen et al., 2020; Lu, 2024), but also hold prime importance in ecological conservation and sustainability initiatives (Nie et al., 2023). However, as port economies continue to grow, problematic trends have emerged, particularly phenomena of redundant construction, chaotic spatial expansion, and intense inter-port rivalry within geographical clusters (Lu, 2023). At present, China’s ports face the problem of overcapacity amid global economic downturn and weakening growth drivers in port cities (Cong et al., 2020). In particular, the global COVID-19 pandemic in previous years, coupled with the Russia-Ukraine conflict and regional tensions in the Middle East in recent years, has further exacerbated this situation. Therefore, China’s ports are confronting many challenges like overstock of port assets and poor utilization rate of terminals (Guo et al., 2021; Wang et al., 2022a).
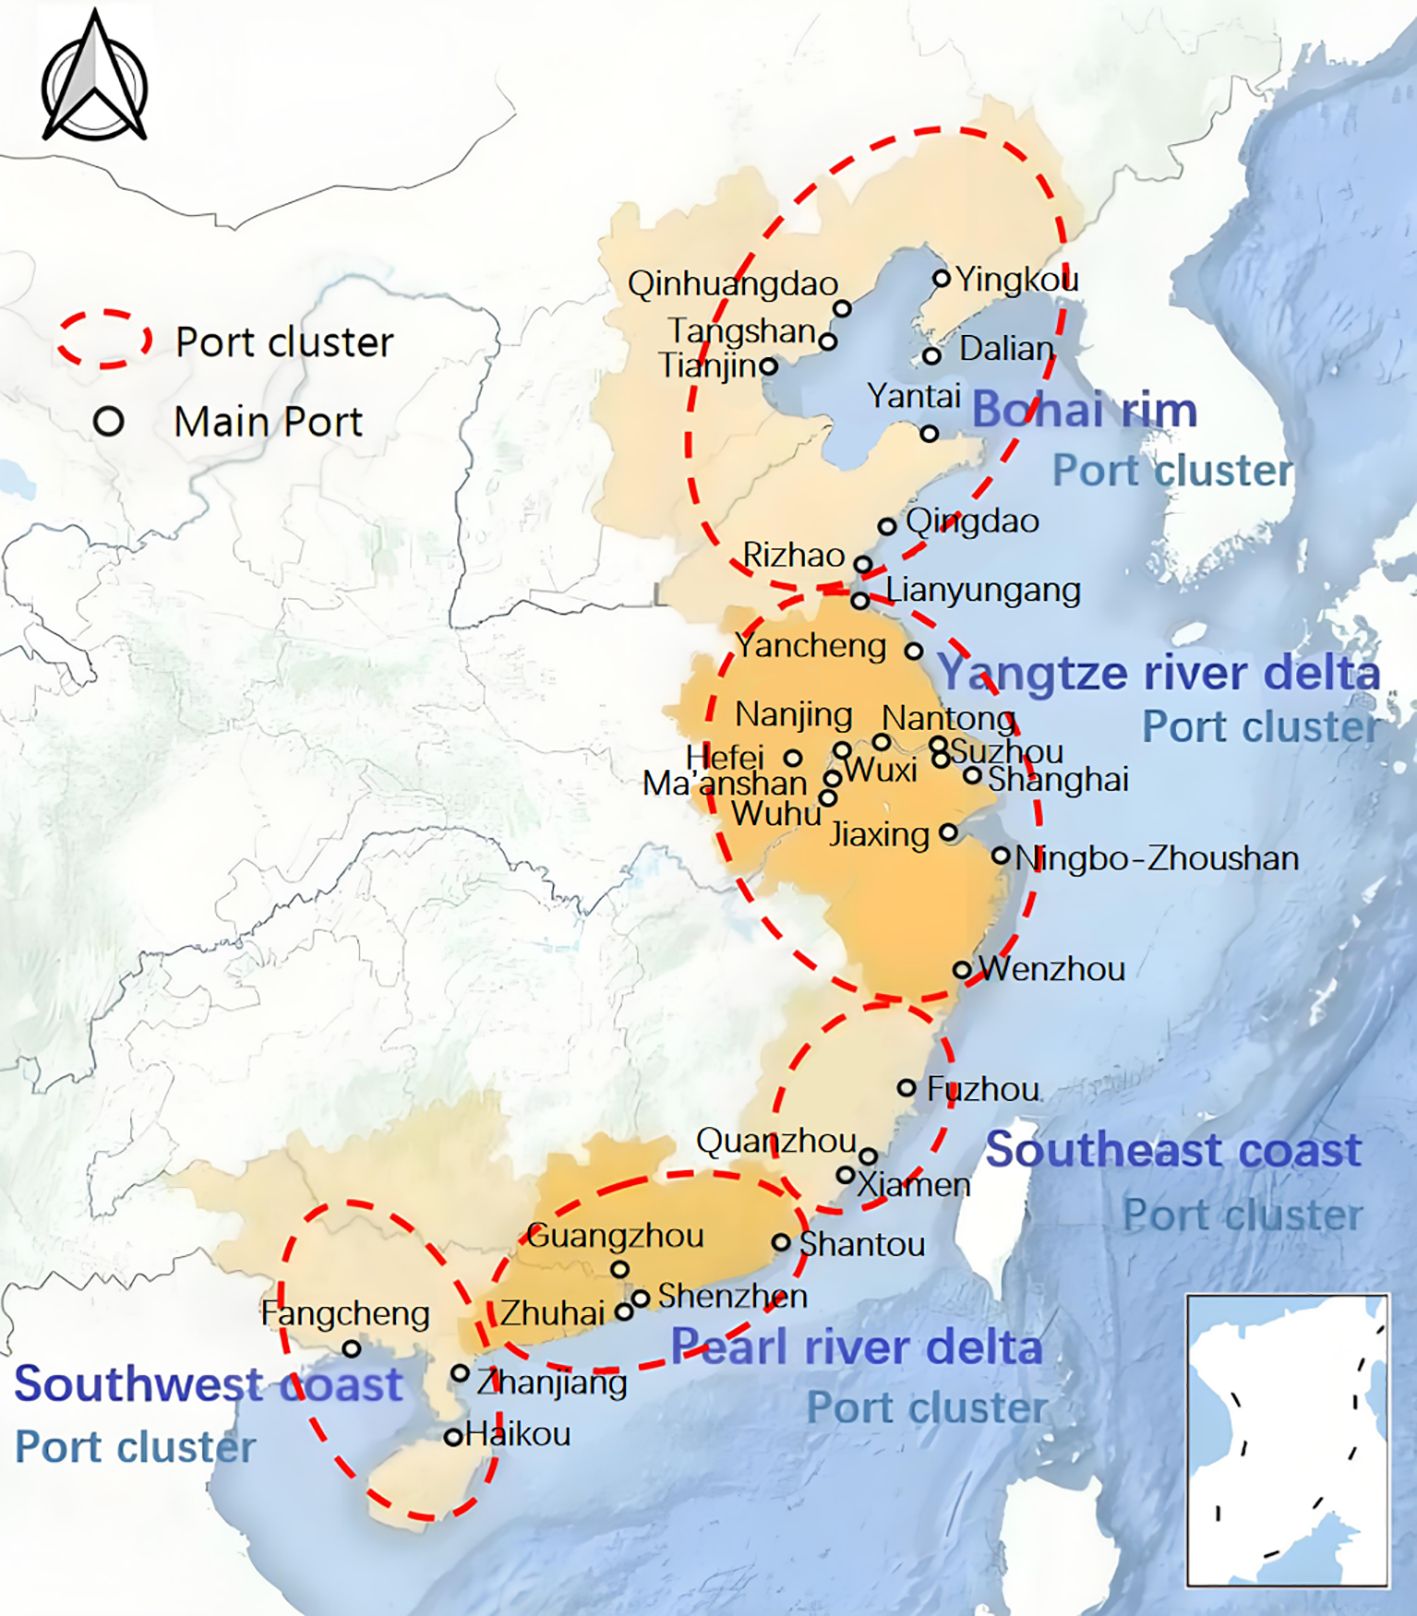
Figure 1. Diagram of the port clusters along China’s coast.
In response to the aforementioned challenges, the YRD port cluster has implemented a series of integrated governance measures. However, the current state of cross-regional governance integration within the YRD port system shows noticeable shortcomings (Li et al., 2023a), and these challenges persist. Some problems, such as the rivalry between Shanghai and Ningbo-Zhoushan for recognition as premier international shipping hubs, have even intensified. Therefore, further integrated governance is imperative for the YRD port cluster.
Effective governance of a port cluster requires: systematic analysis of the cluster’s integration in conjunction with the regional economy, rational planning and positioning of both the cluster and its constituent ports, and implementation of resource integration measures to reduce problems caused by excessive intra-cluster competition and enhance overall competitiveness. Nevertheless, due to the division of national administration, the development and governance of each port are primarily dominated by its provincial government. Currently, China’s port governance is evolving toward provincial port groups (Fu et al., 2023). Therefore, while the combination of all ports in the YRD can be regarded as a single port cluster, ports within each province (or municipality) in the YRD are also considered as individual port clusters in this study to facilitate a more nuanced analysis and evaluation of the YRD port cluster development and governance.
In this study, a comprehensive evaluation model and indicator system for the port cluster are constructed using port competitiveness theory and system science theory. Then, the weights of the port cluster evaluation indicators are determined by AHP, which combines objective and subjective methods. Based on the development status of these provincial port clusters (e.g., port cluster scale, competitiveness of key ports, competition/cooperation relationships between ports, etc.), the evaluation model is subsequently used to assess their strengths and weaknesses across different resource dimensions.
The subsequent sections of this study are structured accordingly: Section 2 undertakes a comprehensive literature review, establishes the investigation’s motivation, and reveals understudied aspects of the subject matter. Section 3 describes the research methods and details the sources of materials used to conduct a comprehensive evaluation of the YRD port cluster. Section 4 presents the evaluation results. Section 5 analyzes the results, clarifies the problems identified in the YRD port cluster, and proposes recommendations. The final section provides a summative recapitulation of the research outcomes and outlines prospective directions for further academic inquiry.
2 Literature review
2.1 Port cluster development
As port clusters develop and assume growing importance in international trade, the study of port clusters has gradually become a focal point of academic research. Zhang et al. (2022) conducted a comprehensive analysis of port system dynamics across both space and time within the Maritime Silk Road economic corridor, revealing spatial disparities among port clusters and a shift in the system’s center of gravity from Europe to Asia. Lupi et al. (2021) studied Deep Sea Shipping (DSS) and Short Sea Shipping (SSS) container routes in Italian port clusters, finding that Genoa’s container traffic grew steadily, while SSS routes experienced reduced frequencies but increased lengths and port calls. Serra et al. (2022) explored LNG supply management in Mediterranean port clusters, finding that organized networks enhance bargaining power, reduce transport costs, and secure favorable import prices through guaranteed purchase volumes. Glavinović et al. (2023) determined the optimal standards and management model for regional sea port clusters in the Republic of Croatia, favoring a coordinated decentralized approach for Croatian regional seaports. De Vicente-Lama et al. (2023) analyzed Spain’s port cluster, emphasizing the need to enhance social and environmental reporting to address the ecological impacts of port operations. Mohd Rozar et al. (2023) studied the performance of Malaysian ports through hierarchical cluster analysis and highlighted the significance of port clusters in enhancing regional logistics efficiency and competitiveness. Huang et al. (2023) investigated the Gulf of Guinea port cluster’s hinterland, revealing intense coastal-to-inland competition and a “funnel effect” in spatial morphology, with remote inland areas offering significant expansion potential. Moretti (2025) explored port clusterization impacts through a case study of Italian port clusters, emphasizing spatial reconceptualization and regional collaborations enabled by transformative design projects.
Meanwhile, given the significant position of China’s ports in the global port economy, scholars have also conducted extensive research on port cluster development in China. Xu et al. (2021) analyzed China’s coastal ports (2001-2018) using the rank-size rule, finding that cargo throughput was decentralized while container throughput was centralized, with macroeconomic, technological, and policy factors significantly influencing port evolution. Pan (2022) studied five major coastal port clusters in China, revealing issues such as polarization, excessive competition, insufficient cooperation, and low-quality development. Wang et al. (2022b) used a dynamic spatial panel model to study competition and cooperation in China’s coastal and inland port clusters, identifying influencing factors like supply-demand, scale, function, and management structures. Lu (2023) focused on the collaborative operation of port clusters and conducted an in-depth analysis of their high-quality collaborative mechanisms. He et al. (2024) examined the foreland structure variations of China’s five port clusters in 2019 and 2022, revealing the impacts of geopolitical and bilateral factors, while global supply chain demands drove alternative transport strategies. Qiu and Zhang (2024) measured the spatial spillover effects of Chinese ports from the perspective of port clusters and found negative spatial spillovers in China’s coastal ports, indicating competition. Yu et al. (2021) explored the spatio-temporal evolution of the Bohai Rim port cluster, revealing staged development with significant port disparities but high potential. Jin et al. (2022) studied the Bohai Rim port cluster, finding that national strategies like industrial revitalization boosted Dalian and Qingdao ports but weakened Tianjin’s competitiveness. The Guangdong-Hong Kong-Macao port cluster was examined through two distinct studies: Su and Lan (2022) applied synergetic theory to revealed unbalanced development and proposed government-led and enterprise-led collaborative models for regional improvement, while Ding et al. (2022) forecasted trends in inter-port relationships, waterway networks, and river-sea intermodal transport hubs based on the regional development plan. Tang and Lin (2023) empirically examined the Pearl River Delta port cluster, revealing a complementary relationship between port development and port city economies. Geng (2024) studied Guangdong’s port clusters, revealing significant disparities in port development, with intra-cluster differences exceeding inter-cluster gaps. Yu et al. (2022) used three-stage DEA and Malmquist models to analyze the efficiency of the YRD coastal port cluster, revealing mid-high static efficiency hindered by scale inefficiency and a 3.6% productivity rise driven by technological progress. Utilizing niche theory as an analytical framework, Li et al. (2023a) enabled systematic examination of integrative administration practices across the YRD port cluster, finding Shanghai superior in economic impact and sustainability, while Ningbo-Zhoushan excelled in natural resources and growth potential. Liu et al. (2024) analyzed the processes and mechanisms of the evolution of the container port system in the YRD, noting incomplete regionalization and low synergy in the YRD region. Leng et al. (2024) analyzed port service coordination sustainability in the YRD, revealing stronger central potential for Shanghai and Ningbo-Zhoushan Ports, distinct port distribution disparities, and a dense semi-circular zone of spatial gravity with weak participation from marginal ports. Wang et al. (2024) suggested that policymakers should consider the YRD as a whole to position the ports functionally and manage them hierarchically, and then tilt the resources towards Anhui.
2.2 Evaluation of port cluster
Evaluation methods have proven effective in quantifying performance indicators and identifying weaknesses, enabling targeted improvements across various fields. In transportation research, applications range from highway lane-changing behavior (Chen et al., 2023a) and port truck emissions (Li et al., 2023b) to ship detection (Chen et al., 2023b), waterway safety analysis (Wu et al., 2015a), NUC ship management (Wu et al., 2015b), collision risk assessment (Wang and Jing, 2025), and intelligent maritime shipping (Zou et al., 2025). Port-related research has explored various aspects, including case studies of individual ports (e.g., Ningbo-Zhoushan by Zeng et al., 2022; Liu et al., 2023a; Suzhou by Chen et al., 2023c) and specific port dimensions such as port distance measurement (Chen et al., 2025), policy impacts on emissions (e.g., MSR policies on SO2 emissions in Chinese ports, Wang et al., 2025; ECA policies on sulfur emissions in major U.S. ports, Xiao et al., 2025). Additionally, scholars have tried to employ various methods to evaluate port clusters from different perspectives. Wang et al. (2022a) introduced an enhanced coupling coordination model to assess the coupling coordination degree between port clusters and their hinterland economic systems across three integration patterns, showing short-term disruptions but long-term improvements in coordination, with variations based on integration purposes and patterns. Xiao et al. (2023) assessed Chinese port clusters using an entropy-TOPSIS method, revealing weak competitiveness in the Bohai Bay and polarized competitiveness in the Yangtze and Pearl River Delta clusters. Zhu et al. (2024) evaluated the spatial suitability of coastal port cluster planning and found that the suitability for port reclamation is relatively high in Shanghai, Jiangsu, and Guangdong. Yu and Sun (2021) focused on the YRD region to assess the coordinated level of port cluster and urban agglomeration using gravity, coupling, and coordination models, showing that initial coordination is progressing toward higher levels, with port cooperation enhancing integrated development. Liu et al. (2023b) constructed a port cluster coupling measurement model to assess the coordination degree of Anhui port cluster, finding high coupling but moderate coordination, indicating a need for faster development toward balanced integration.
2.3 Research gap
Throughout the aforementioned literature, each study has contributed to the development of port clusters both theoretically and practically from different perspectives, such as management models (Glavinović et al., 2023), spatial spillover effects (Qiu and Zhang, 2024), integrated governance (Li et al., 2023a), and so on. However, the evaluation of port clusters is still relatively lacking, as studies focusing on individual ports or specific port dimensions cannot reflect the overall situation of a port cluster. Regarding the existing port cluster evaluation literature, studies merely assess specific dimensions of port clusters, such as competitiveness (Xiao et al., 2023), spatial suitability (Zhu et al., 2024), coordination levels (Yu and Sun, 2021; Liu et al., 2023b), etc. Few scholars have employed quantitative methods to explore and evaluate the comprehensive development of entire port clusters. Furthermore, most scholars who study port clusters focus only on individual clusters without conducting in-depth comparisons among different sub-port clusters within the same region, and they also fail to incorporate parameters such as local government management to construct an evaluation indicator system.
To bridge these research gaps, this paper selects the YRD port cluster as a case study and adopts a broader perspective to study port clusters. The development status of the YRD port cluster is evaluated both quantitatively and qualitatively using a comprehensive evaluation mathematical model. This paper also discusses various problems in its development and provides valuable insights for its comprehensive governance.
3 Materials and methods
3.1 Case description
Geographically, the YRD encompasses Jiangsu, Zhejiang, and Anhui provinces, along with Shanghai, which holds provincial-level administrative status. The YRD port cluster examined in this study comprises every port situated in the region (Figure 2). Occupying a central position in China’s coastal geography and benefiting from the geographical advantage of the intersection of the Yangtze River trunk line and China’s North-South waterway trunk line, it has grown into the most port-dense and route-dense port cluster in the world (Wang, 2022), as well as a key node of the Maritime Silk Road (Li et al., 2023a).
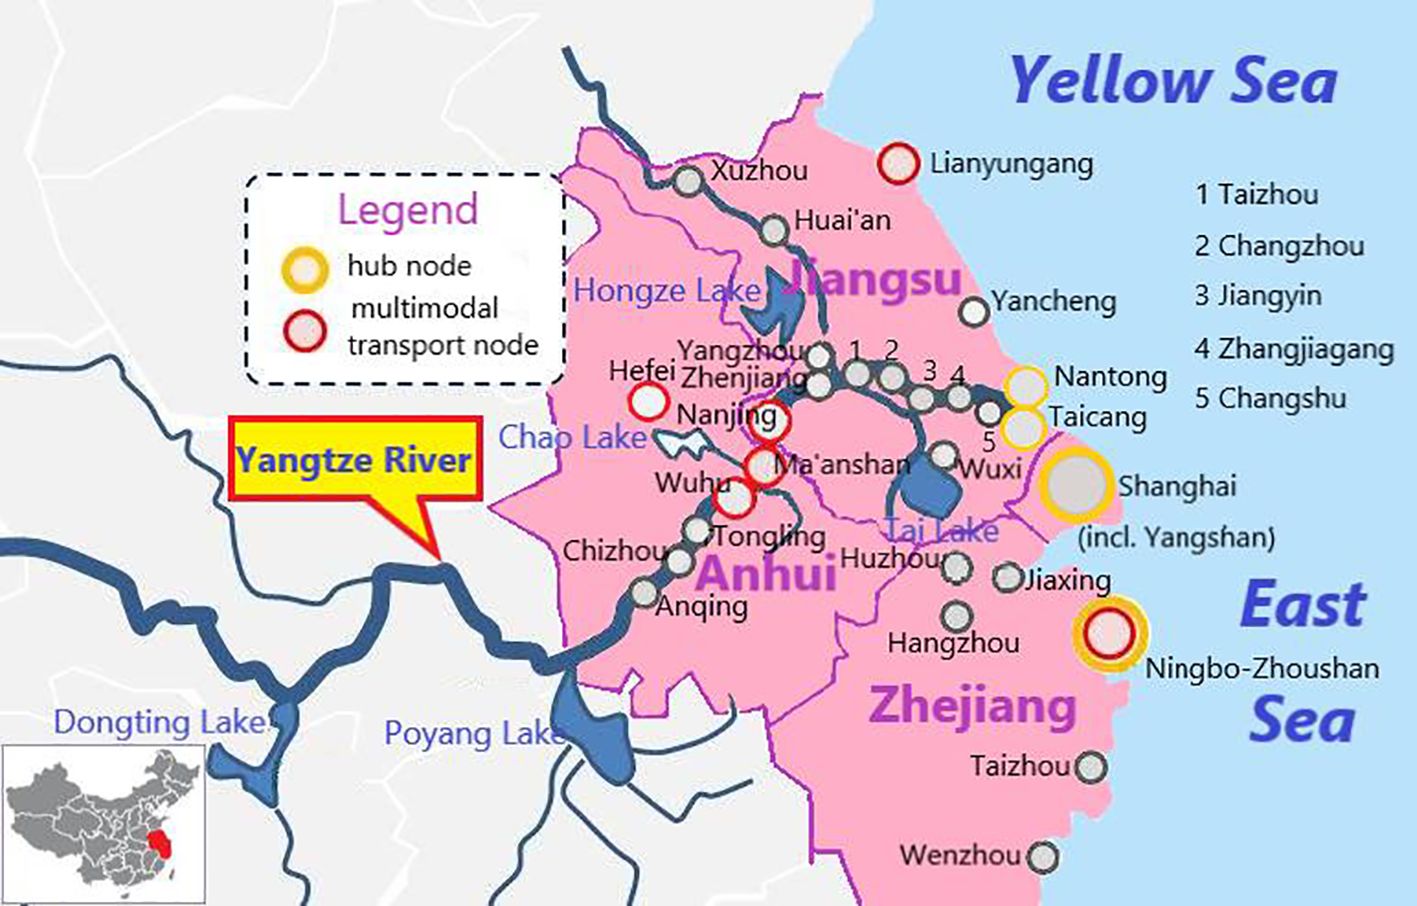
Figure 2. Diagram of the YRD port cluster (Wang, 2022).
3.2 Establishment of the comprehensive evaluation model
Port cluster exists and functions as a unified system. The comprehensive evaluation of a port cluster is essentially an assessment of its overall performance, which is reflected not only by its overall competitiveness but also by the harmony among its ports. This study evaluates each provincial port cluster in the YRD by analyzing their overall competitiveness and harmony, thereby achieving a comprehensive evaluation of the overall YRD port cluster. Comprehensive evaluation is the precondition of decision-making, providing a fundamental basis. Combined with the port cluster harmony mechanism to improve the traditional linear weighted model, a weighted comprehensive evaluation model is applied to evaluate port clusters. The evaluation model is illustrated in Figure 3, whose mathematical expression is as Equation 1:
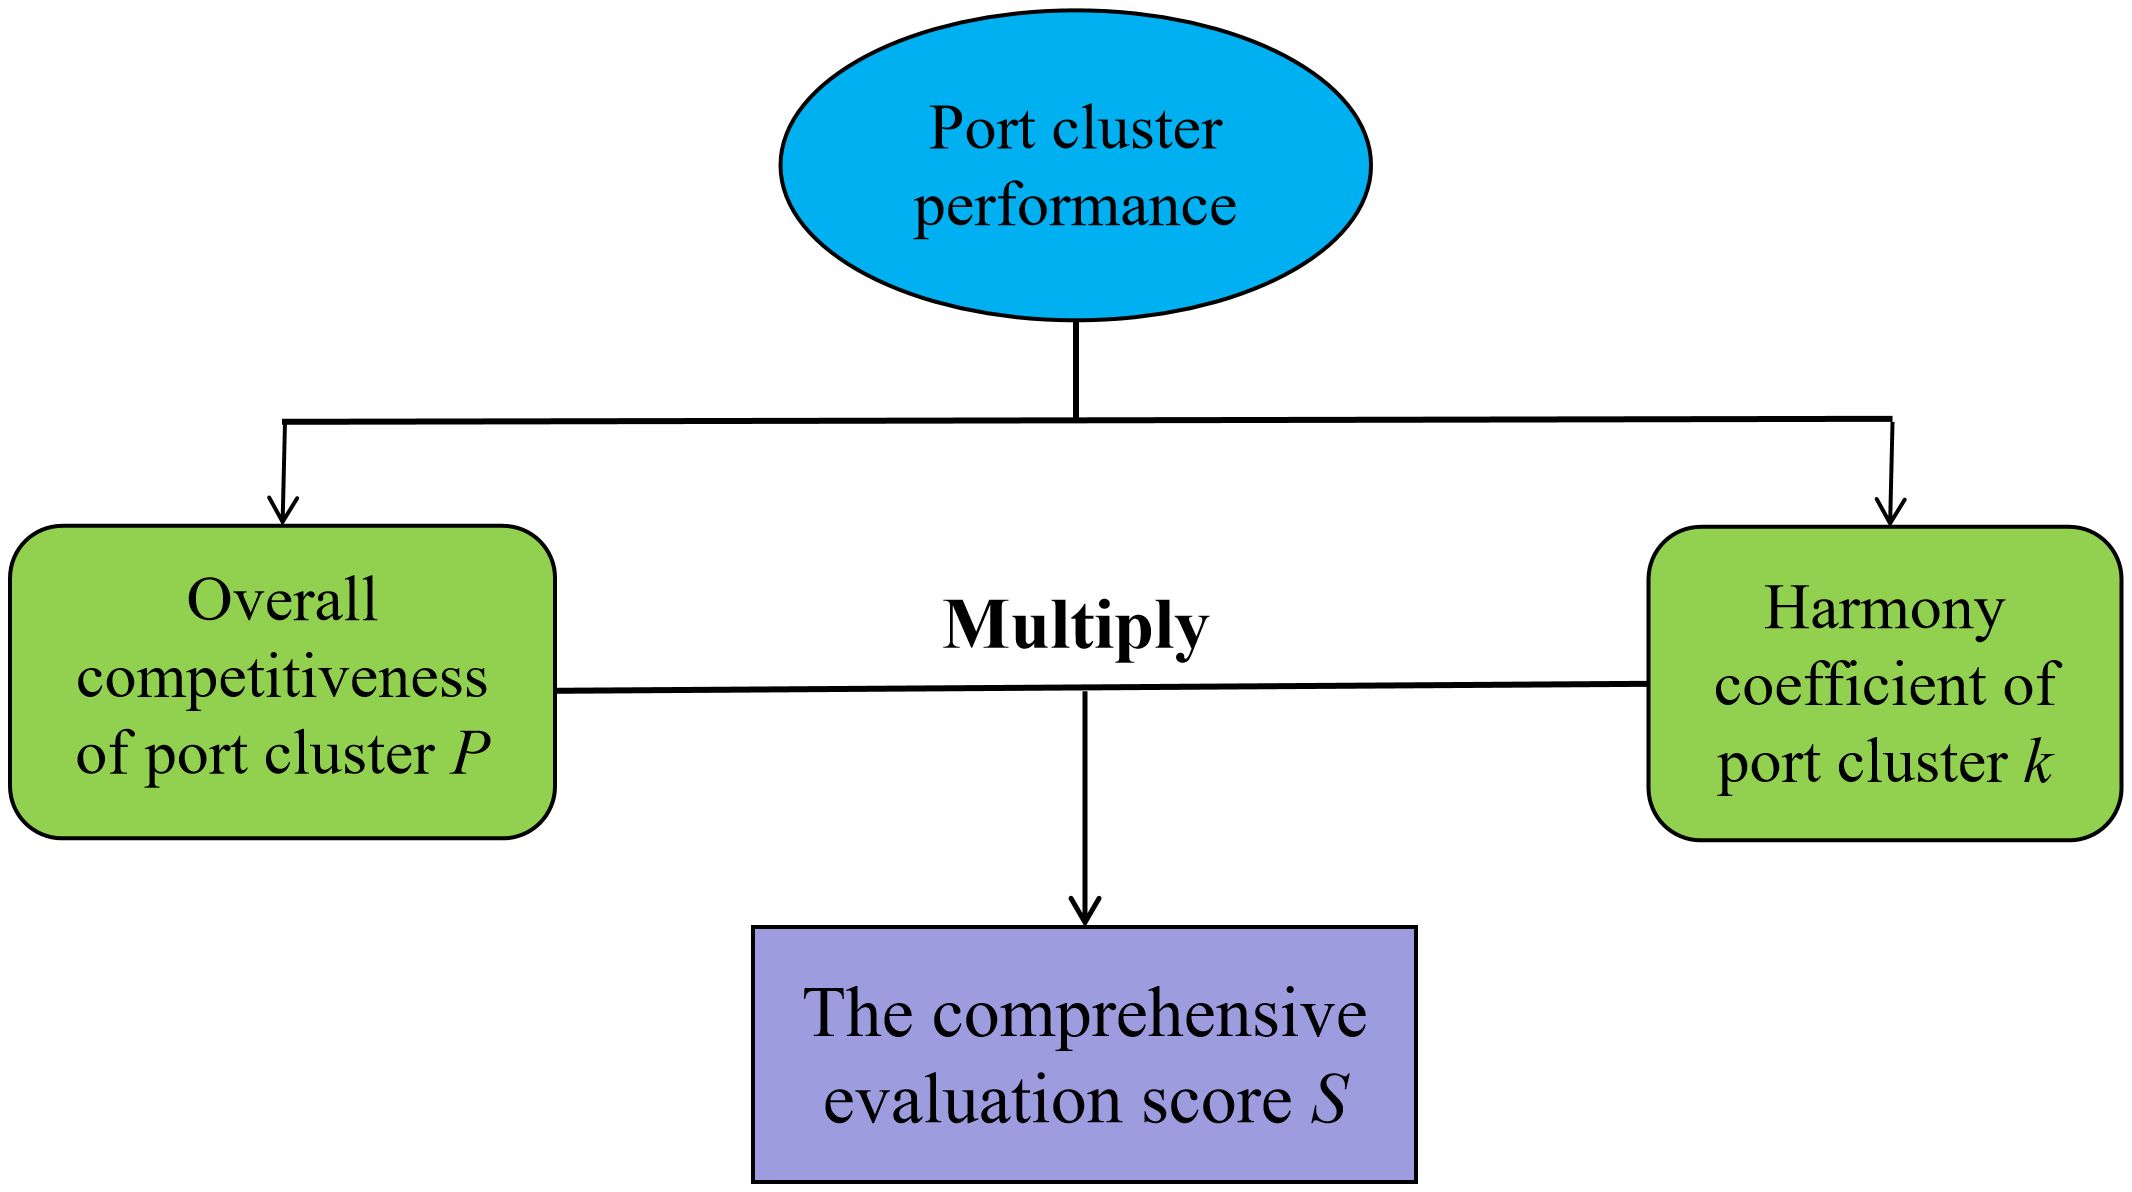
Figure 3. Diagram of the comprehensive evaluation model.
where S, P, and k represent the comprehensive evaluation score, the overall competitiveness, and the harmony coefficient of a port cluster, respectively. This model underscores the significance of both the individual strengths of the port cluster and the harmonious interplay among its components, thereby providing a nuanced and holistic evaluation of the port cluster’s performance.
3.3 Construction of comprehensive evaluation indicator system
A comprehensive evaluation indicator system should be developed as a prerequisite for evaluating a port cluster on the basis of the comprehensive evaluation model established above. This system must consider not only the overall competitiveness, which is determined by diverse influencing elements, but also the system harmony, which accounts for competition and cooperation among the constituent ports. It involves a systematic analysis of the interrelationships between these elements, followed by a thorough and stratified evaluation of the port cluster. Additionally, to ensure the indicator system provides an objective assessment of the port cluster’s status, it is essential to utilize quantitative indicators and, wherever possible, to quantify qualitative indicators.
Based on the model established above and considering the factors affecting the development of port clusters, evaluation indicators were selected at each level. The comprehensive evaluation indicator system is established as shown in Figure 4, providing a structured and detailed framework for evaluating the performance of the YRD port cluster. For the purpose of making the statistics clearer, these indicators are summarized in Table 1.
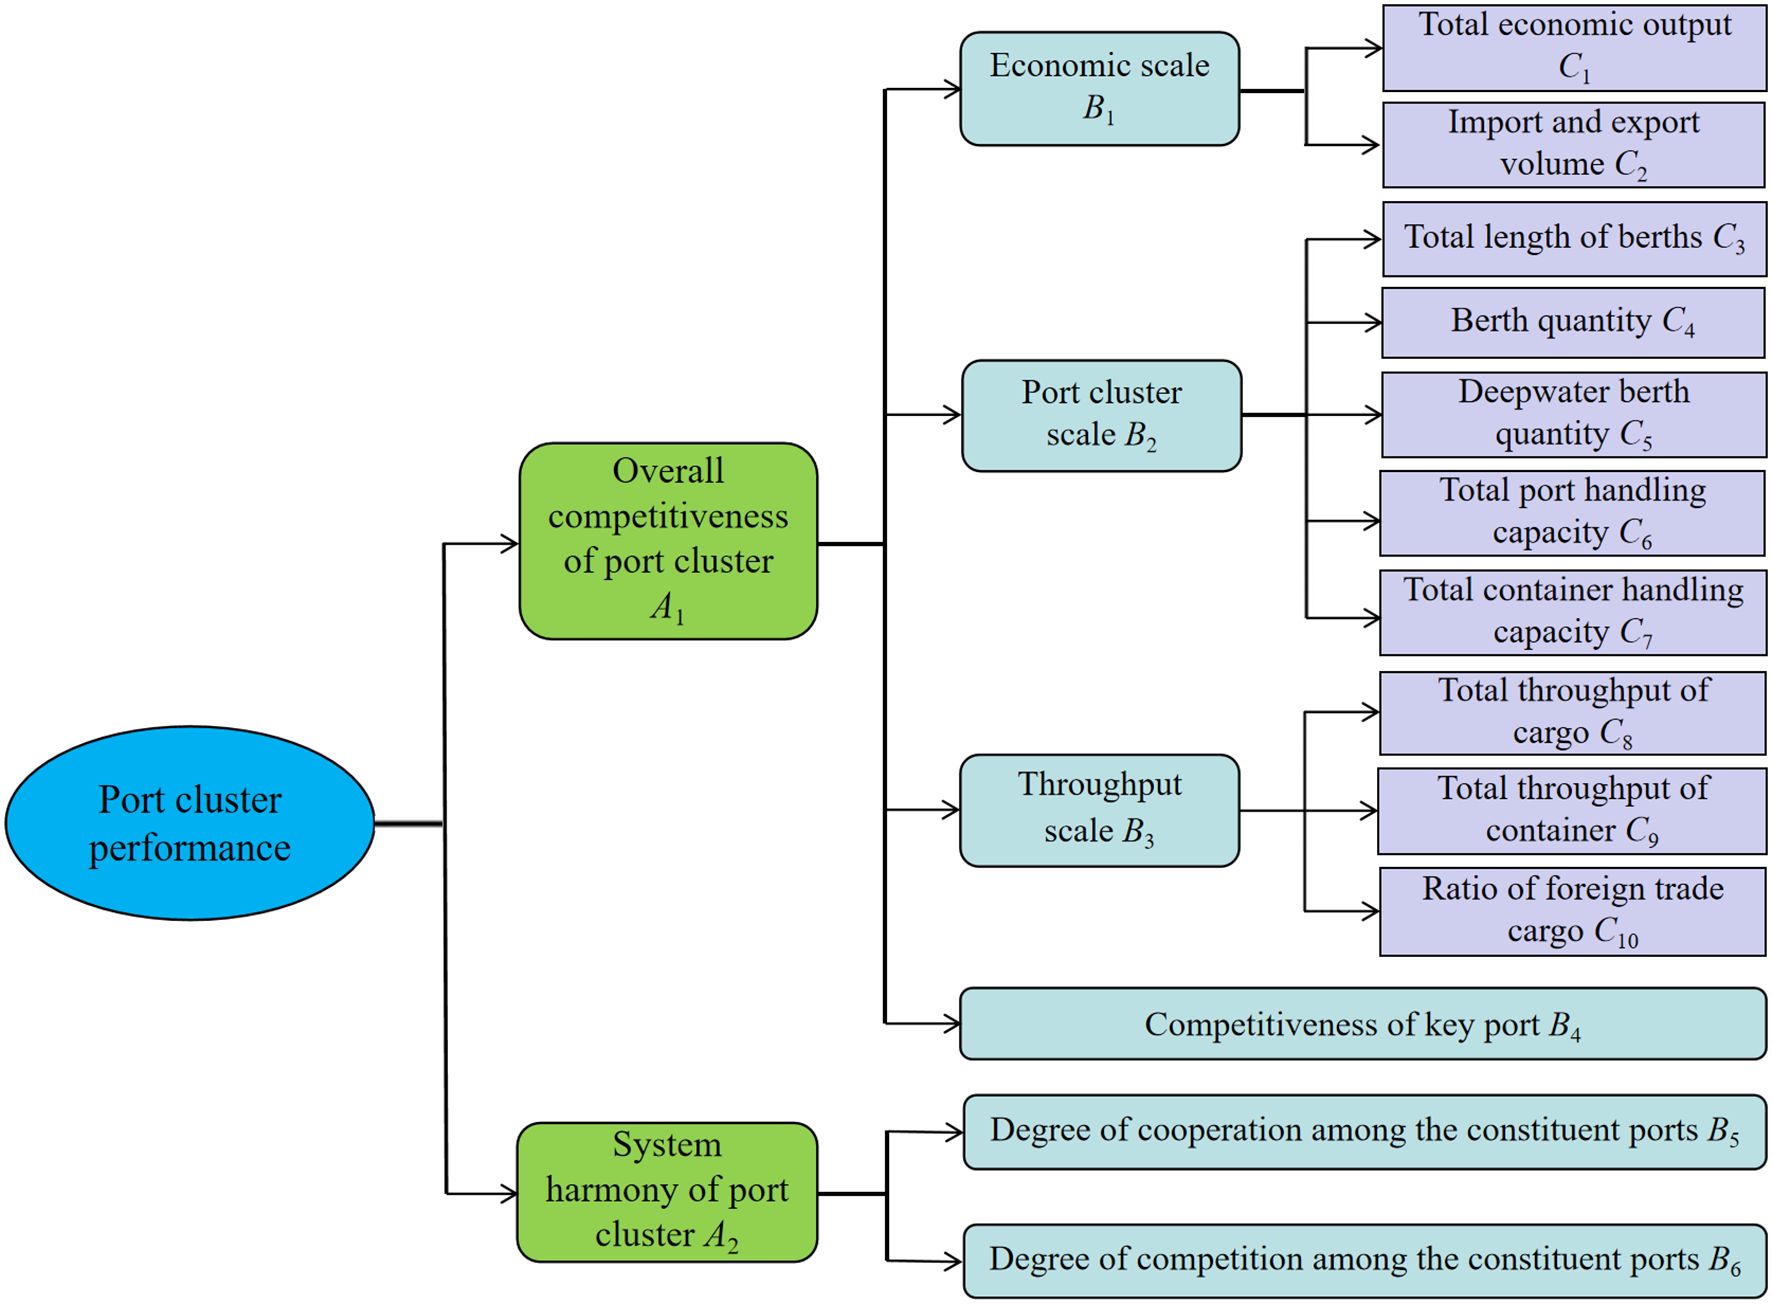
Figure 4. Diagram of the comprehensive evaluation indicator system for port clusters.
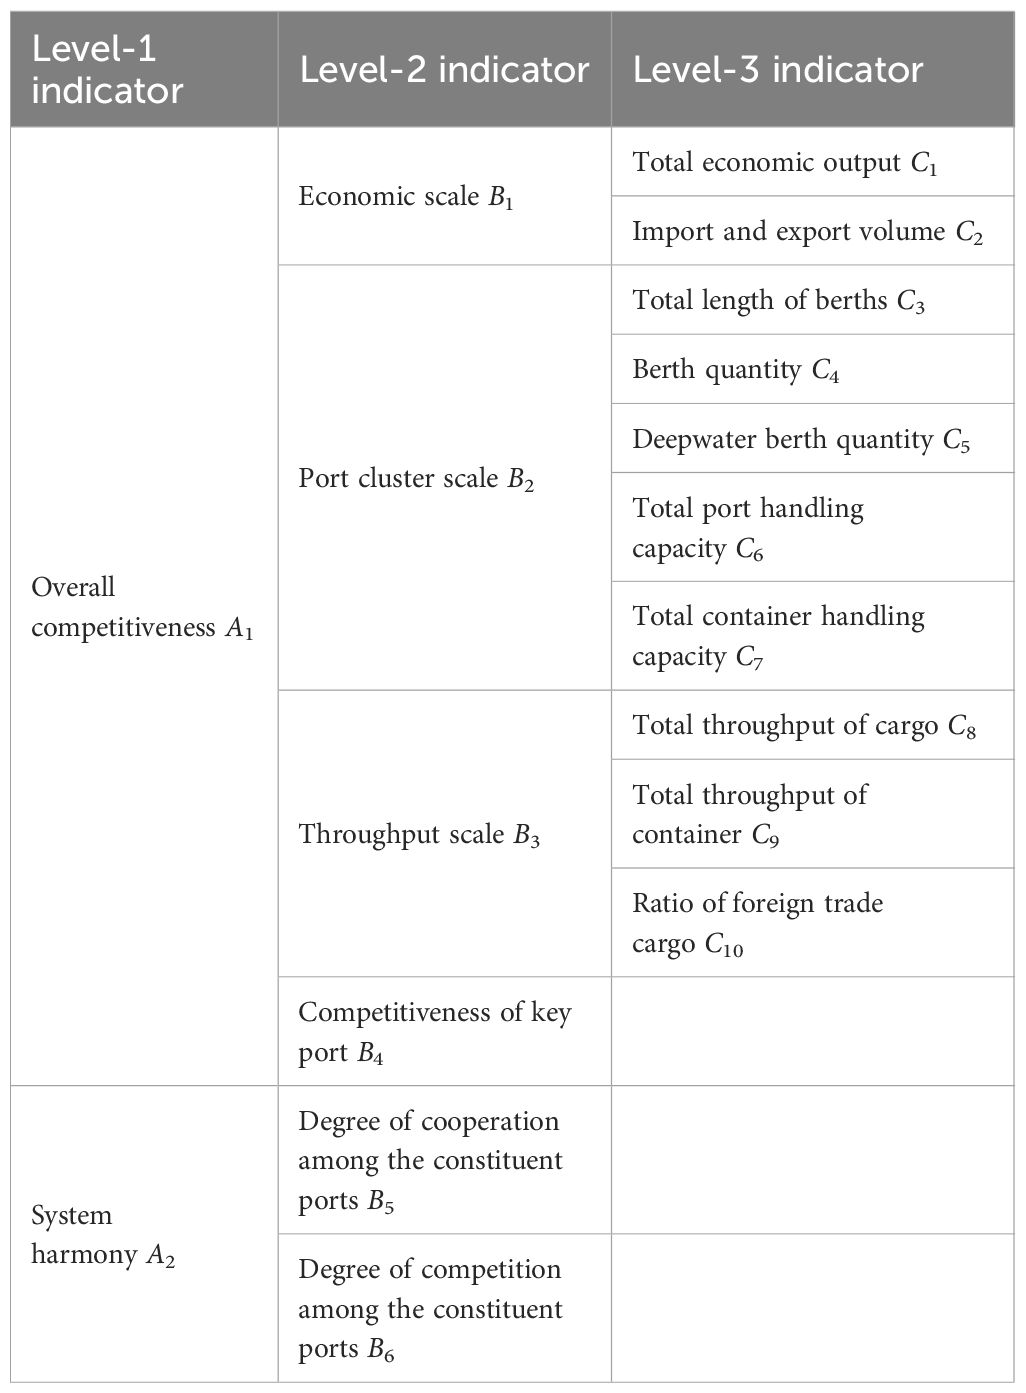
Table 1. Indicators for comprehensive evaluation of port clusters.
3.4 Method for determining the indicator weights
This study applies the Analytic Hierarchy Process (AHP) to determine the relative weights of indicators for evaluating the overall competitiveness of the provincial port clusters in the YRD (A1). By structuring indicators hierarchically and using pairwise comparisons to assess criteria and alternatives, AHP transforms subjective judgments into quantifiable data (Bugingo et al., 2024). The procedural flow of the AHP methodology is depicted in Figure 5.
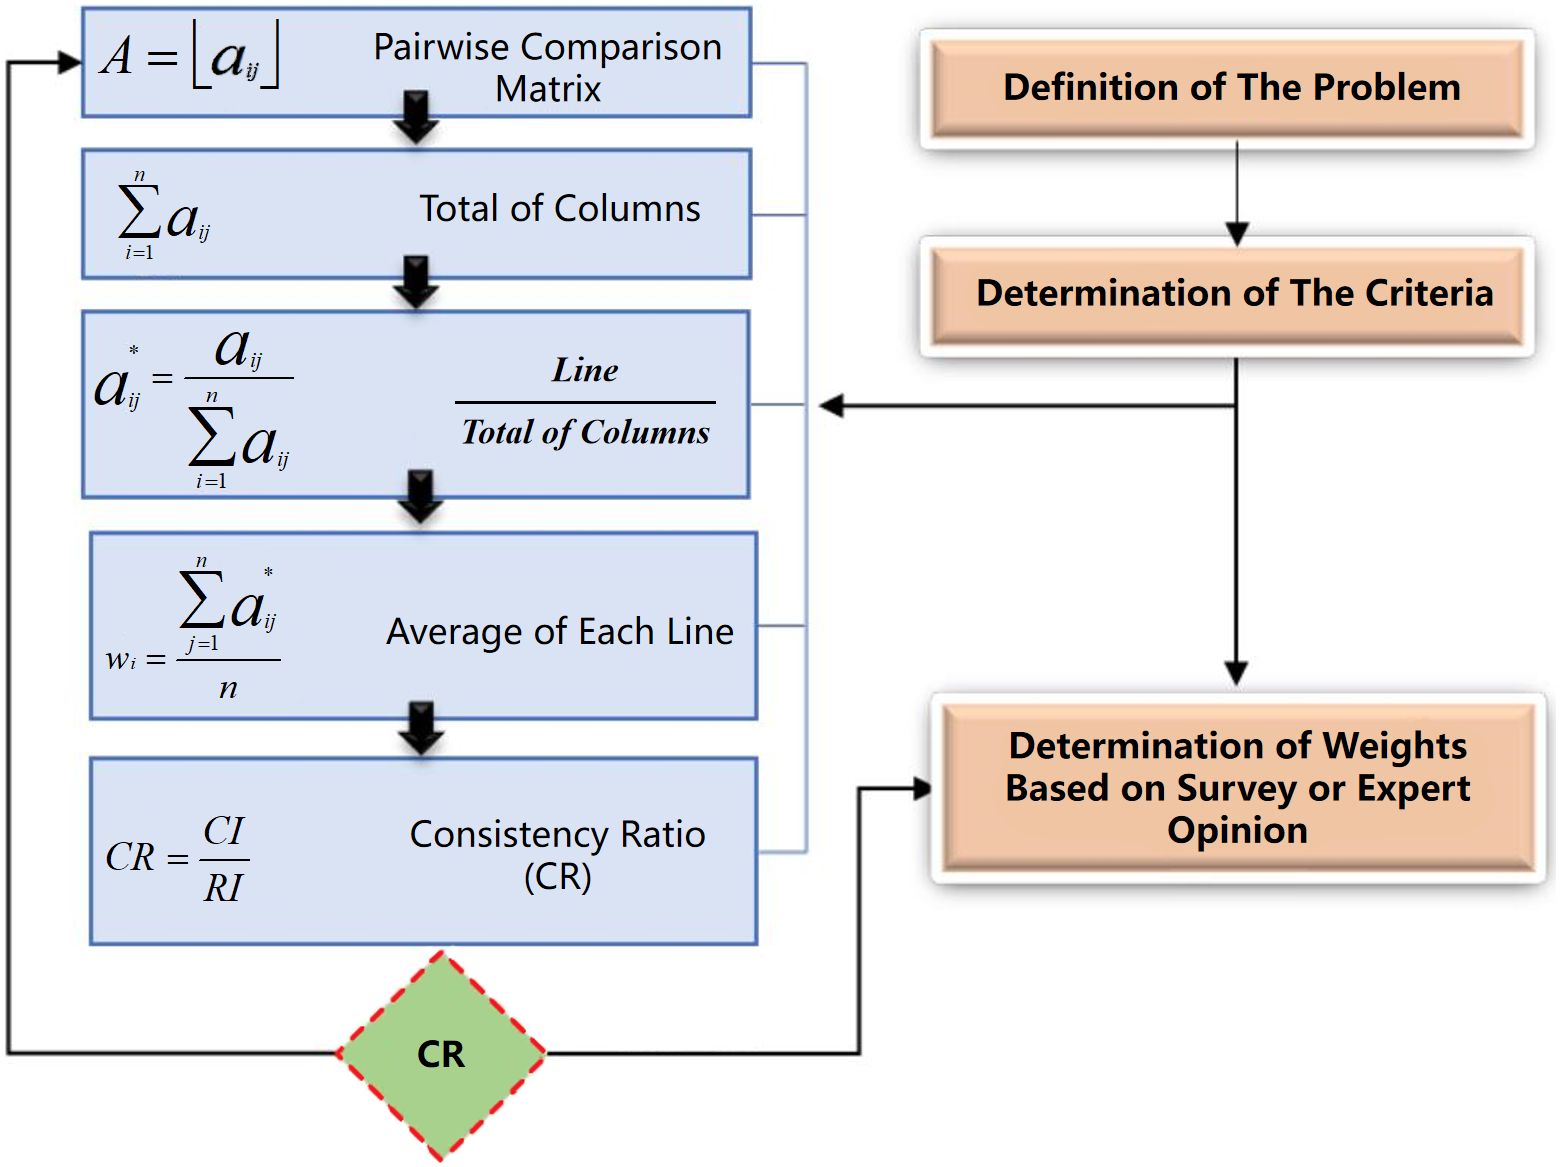
Figure 5. AHP process flow diagram (Sisman and Aydinoglu, 2020).
The primary operational stages of the AHP method are shown as follows.
Step 1: Creation of a pairwise comparison matrix.
The AHP method compares alternatives and determines priorities based on predefined criteria (Vukić et al., 2024). According to Table 2, experts are invited to conduct pairwise comparisons of homogeneous-level indicators to determine their relative importance within each hierarchical tier, thereby constructing a pairwise comparison matrix A as expressed in Equation 2.
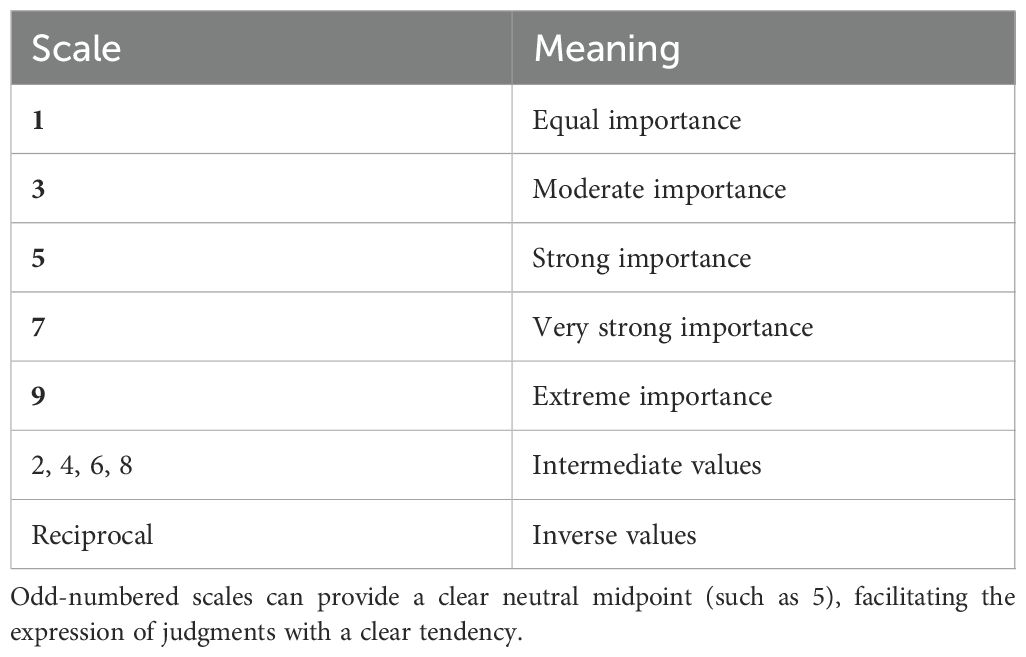
Table 2. Comparison matrix scale.
Step 2: Computation of eigenvalues and eigenvectors.
Performing matrix multiplication between the matrix A and the weight vector w = (w1, w2,…, wn)T produced from the indicator weights yields the eigenvalues and eigenvectors (Aw), as shown in Equation 3.
Step 3: Examination of consistency.
Check the consistency index (CI) and the consistency ratio (CR) for consistency using Equation 4 and Equation 5, respectively:
where RI refers to the random index presented in Table 3, determined by the corresponding matrix order (n).
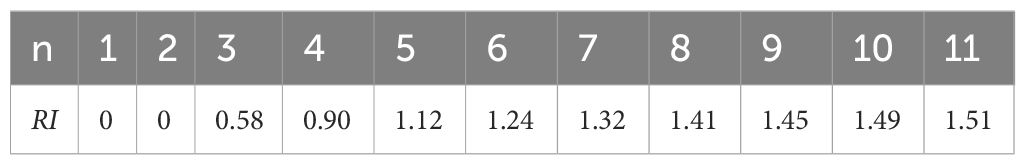
Table 3. Random index (RI) (Saaty, 1980).
Acceptable consistency is achieved if CR ≤ 0.1, failing which the comparative judgments should be adjusted accordingly (Saaty, 1980).
3.5 Determination of port cluster harmony coefficient
To assess the system harmony of a port cluster (A2), the function of port cluster harmony coefficient (k) is constructed using the method of undetermined coefficients in this study. This coefficient is directly proportional to the degree of cooperation among the constituent ports (B5) and inversely proportional to the degree of competition among the constituent ports (B6), as shown in Equation 6:
For ease of calculation, assume B5 + B6 = 1, where B5, B6 (0,1). Based on the established comprehensive evaluation model (Equation 1), the comprehensive evaluation score S exhibits direct proportionality to k, which itself shows a positive correlation with the B5/B6 ratio according to Equation 6. Therefore, the final evaluation score S demonstrates a positive dependence on the B5/B6 ratio value. Although the setting of the k value to some extent affects the size of the S value of the comprehensive evaluation score of each provincial port cluster, it does not change its ranking and does not affect the evaluation and analysis of each provincial port cluster. Drawing upon practical circumstances and port cluster characteristics, only healthy cooperation and competition can maximize their overall performance, while neither excessive cooperation nor excessive competition is conducive to their progress. However, excessive cooperation exists only in theory and rarely occurs. If it did occur, Equation 6 would fail. Whereas, within the same port cluster, even if there is excessive competition among the constituent ports, there will still be a certain degree of cooperation, that is, the k value is always a value greater than 0. Theoretically, there exists an optimal model for the competitive and cooperative relationship. Although there is no upper limit to the value of k theoretically, for the convenience of calculation, it can be assumed that the maximum value of k is 1, and at the same time, it can be assumed that the minimum value of k is 0.2, that is, 0.2 ≤ k ≤1. Let f (0.55, 0.45) = 0.5 and f (0.75, 0.25) = 1, the calculated values of a and b are 0.16 and 0.28, respectively. As a result, Equation 6 can be transformed to:
3.6 Data sources
The raw indicator data collected for the comprehensive evaluation of port clusters are clearly shown in Table 4. In this study, the selection of data sources has been meticulously tailored to align with the unique characteristics of each indicator within the evaluation system. Additionally, careful consideration has been given to the accuracy and usability of the collected data. The data sources utilized in this study primarily encompass the following aspects:
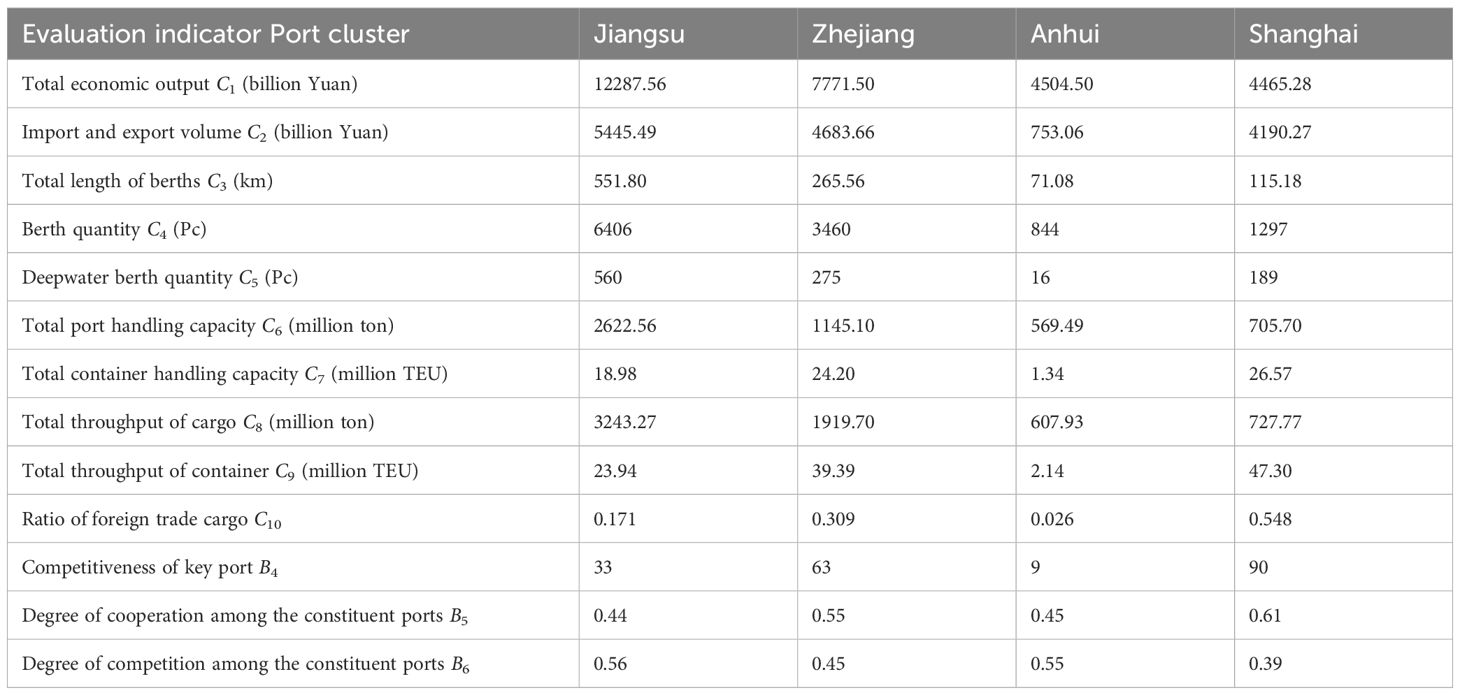
Table 4. Raw indicator data collected for the comprehensive evaluation of port clusters.
1. Public data statistics. To ensure data consistency over time, this study uniformly collected data up to the end of 2022. These data were obtained from the official websites of the National Bureau of Statistics and the Ministry of transport, PRC, as well as the latest edition of the China Ports Yearbook (2023), including all the Level-3 indicators in Table 1, such as total economic output, berth quantity, total throughput of container, etc.
2. Other relevant data were obtained through consultations with representative experts. Drawing upon the evaluation indicator system constructed before, we meticulously designed a questionnaire to establish comparative weights among different evaluation indicators and construct the judgment matrix. Thirty experts with extensive experience in shipping and ports participated in the survey, including 9 port operators (30%), 9 port corporation management personnel (30%), 6 port office commissioners (20%), 4 scholars specializing in this field (13%), and 2 experts from Shanghai International Shipping Institute (7%). The three Level-2 indicators—namely, the competitiveness of key ports, the degree of cooperation and the degree of competition among the constituent ports—were also derived from the feedback of the valid questionnaires. Hsu et al. (2023) suggested that the number of experts required to address a group decision issue should not be fewer than five. Therefore, the feedback from the 30 experts involved in this survey is highly representative.
4 Results
Building upon the collected data and the AHP approach described above, the indicator weight vectors for the overall competitiveness evaluation of port clusters are obtained by standardizing the corresponding eigenvectors, as follows:
For overall competitiveness of port clusters (A1), T = (0.152, 0.283, 0.489, 0.076)T;
For economic scale (B1), T = (0.333, 0.667)T;
For port cluster scale (B2), T = (0.049, 0.102, 0.182, 0.283, 0.383)T;
For throughput scale (B3), T = (0.312, 0.490, 0.198)T;
For competitiveness of key port (B4), = 1.
Consistency is examined according to Table 3 and Equation 5. For the indicator weight vectors and , no consistency examination is required because the quantity of their sub-vectors are 2 and 0, respectively, both less than 3. For , and , the values of CR are 0.0038, 0.0182 and 0.0463, respectively, all of which are less than 0.1. Therefore, the above results are satisfied with the requirements and valid. The weights of Level-3 indicators are normalized, and the final weight of each indicator is obtained, as illustrated in Table 5.
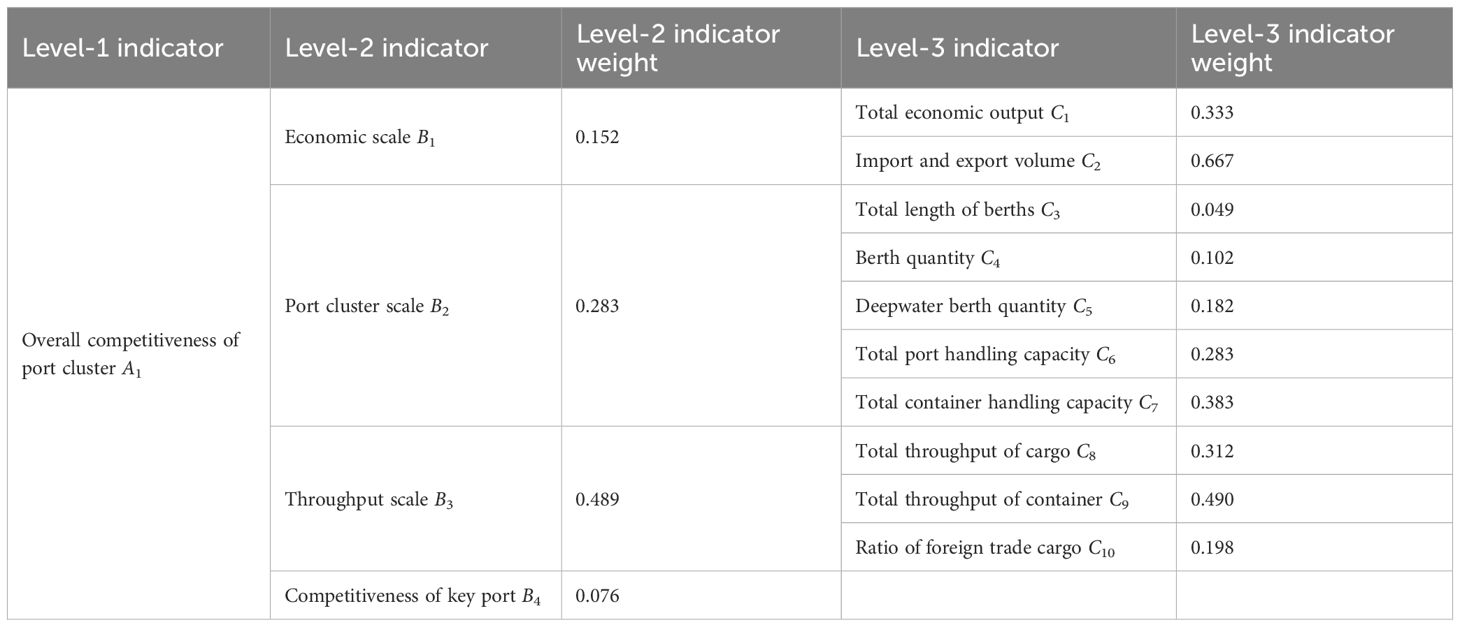
Table 5. Weights for evaluation indicators of overall competitiveness.
Each raw indicator value in Table 4 is normalized to obtain its normalized value, which is then multiplied by its corresponding indicator weight to calculate the weighted value of each indicator. By summing the weighted values, the overall competitiveness score (P) of port cluster is finally obtained, representing its weighted evaluation value. These can be illustrated in Table 6.
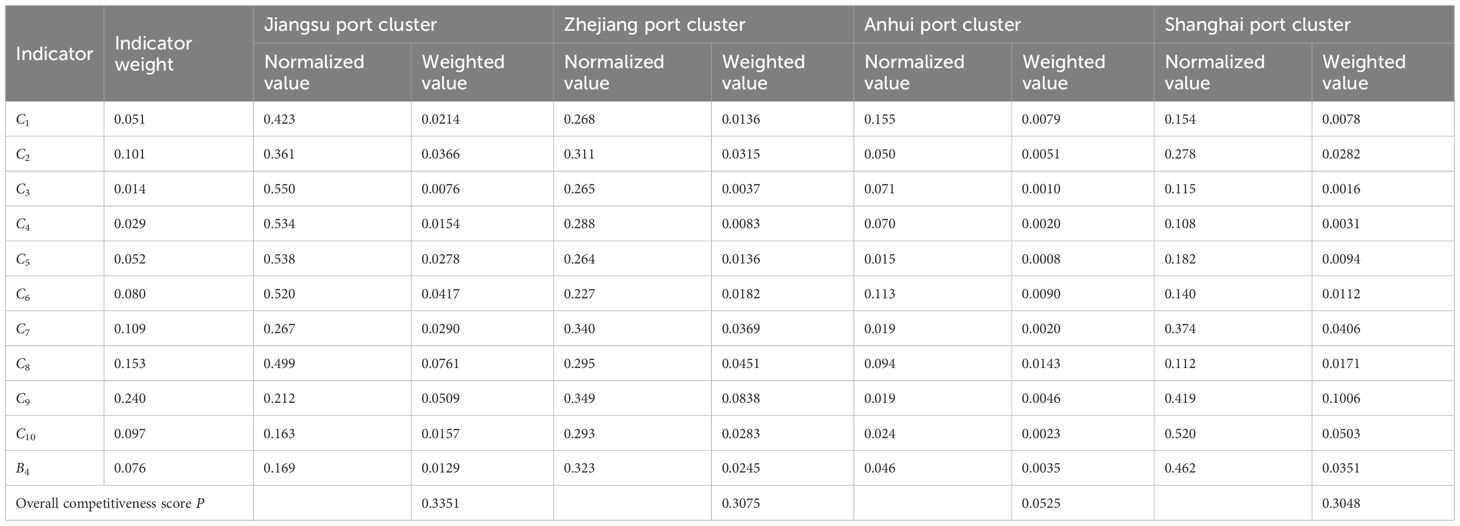
Table 6. Calculation of the overall competitiveness score.
By substituting the degree of cooperation (B5) and competition (B6) among the constituent ports obtained through the expert questionnaire survey into Equation 7, all port cluster harmony coefficients (k) are calculated. Based on the port cluster comprehensive evaluation model (Equation 1) established earlier, the overall competitiveness score (P) of each provincial port cluster in the YRD is multiplied by its corresponding harmony coefficient (k), resulting in their comprehensive evaluation scores (S), see Table 7.
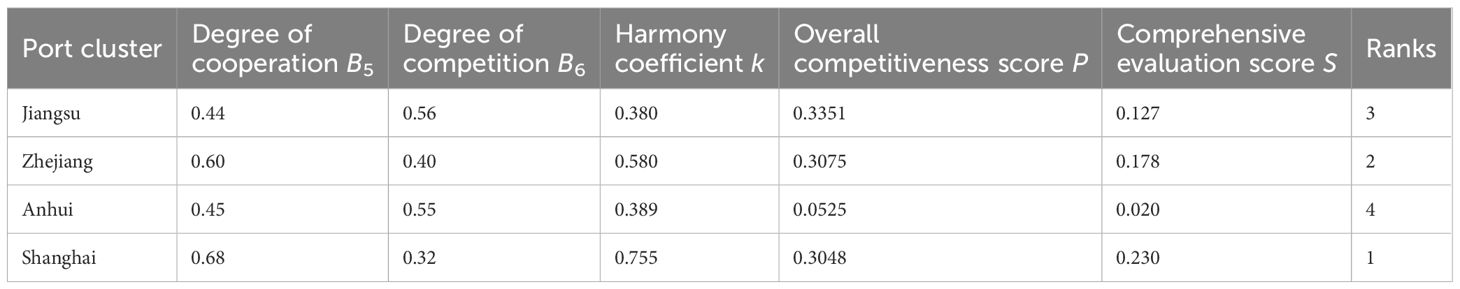
Table 7. Calculation of the comprehensive evaluation score.
5 Discussion
5.1 Result analysis
The development performance of a port cluster correlates positively with the comprehensive evaluation score, where higher comprehensive evaluation score (S) correspond to superior cluster performance. As shown in Table 7, the Shanghai port cluster attains top evaluating value, preceding Zhejiang and Jiangsu in ranking order, while Anhui trails significantly behind.
Shanghai port cluster achieves premier status in the comprehensive evaluation, securing a 0.052-point advantage against second-ranked Zhejiang. The primary reason is that its harmony coefficient (k) significantly exceeds that of each rest port cluster, which is the result of a top level of integration achieved by integrating Yangshan Port into Shanghai Port (Wang, 2020, 2022), so that the degree of cooperation (B5) surpasses the degree of competition (B6) among the constituent ports within the port cluster to a significant extent. Additionally, even though Shanghai is in a weak position as for economic scale (B1) and port cluster scale (B2), it significantly outperforms the other three provinces as for total throughput of container (C9) and ratio of foreign trade cargo (C10), two critical indicators for quality measurement of port cluster. Moreover, in the survey score on competitiveness of key port (B4), Shanghai has far more advantages compared to the other provinces, outperforming other cities in the YRD in nearly all aspects. It is not only the most developed port city but also the leading comprehensive transportation hub in China. Currently, a significant challenge for this port cluster is that the insufficient deepwater shoreline severely limits its container handling capacity (C6) (26.57 million TEU), which is just over half of its total container throughput (C9) (47.30 million TEU). This natural disadvantage results in severe port congestion and limited room for further integration of this busiest port cluster.
Zhejiang port cluster takes second place in the comprehensive evaluation. Though lagging behind Shanghai port cluster by a significant margin, it performs considerably better than the other two port clusters. The primary reason is that it has achieved a higher level of integration by effectively combining port administration and enterprise operation (Wang, 2020, 2022), so that the degree of cooperation(B5) surpasses the degree of competition (B6) among the constituent ports within the port cluster. Consequently, its harmony coefficient (k) exceeds those of the rest two provincial port clusters a lot, though still lower than that of Shanghai port cluster. Additionally, compared with the port clusters of Jiangsu and Anhui, it holds a notable advantage in competitiveness of key port (B4) and total throughput of container (C9). In particular, regarding the competitiveness of key port (B4), leveraging its natural deep-water advantages, Ningbo-Zhoushan Port has grown into the world’s biggest port in terms of cargo throughput and a significant hub port in Northeast Asia. Owing to its rapid development momentum, Ningbo-Zhoushan Port has consistently narrowed the gap with Shanghai Port while widening the gap against other ports in the YRD region. Similar to Shanghai port cluster, Zhejiang port cluster also has the problem on port congestion. Compared to its huge throughput of container (C9) (39.39 million TEU), its container handling capacity (C6) (24.20 million TEU) appears insufficient and must be improved through the development of new berths.
The performance of Jiangsu port cluster in the comprehensive evaluation is not only significantly inferior to that of the Shanghai port cluster, but also lags behind Zhejiang port cluster to a certain extent. The primary reason can be attribute to its much smaller port cluster harmony coefficient (k) compared to the two aforementioned port clusters. Owing to the lack of reform in port administration and only partial enterprise-level integration, its integration level falls far behind that of the Shanghai and Zhejiang port clusters (Wang, 2020, 2022). This has resulted in the degree of cooperation (B5) remaining lower than the degree of competition (B6) among its constituent ports. However, its overall competitiveness (P) ranks highest among the four provincial port clusters, primarily due to its advantages in economic scale (B1) and port cluster scale (B2), especially its total throughput of cargo (C8) which ranks first. Nevertheless, its competitiveness of key port (B4) is notably weaker compared to the two aforementioned clusters. Even Suzhou Port, the most powerful port in this cluster, remains far behind Ningbo-Zhoushan Port and lags even further behind Shanghai Port. This also prevents the formation of a regional hub port within the Jiangsu port cluster and results in relatively lower container throughput (C9) and a lower ratio of foreign trade cargo (C10). Overall, despite its significant integration potential, particularly in port administration, the reintegration of the Jiangsu port cluster is more challenging compared to the other three port clusters, as its main ports are relatively balanced in strength and have similar endowments.
The Anhui port cluster registers minimal scores in the comprehensive evaluation, significantly below the other provincial port clusters discussed above. The primary reason is that it is at a disadvantage in every indicator for evaluating the overall competitiveness of port clusters (P), resulting in its complete inferior position in the evaluation of this item. Similar to the Jiangsu port cluster, moreover, the integration level of Anhui port cluster is very low (Wang, 2020, 2022), causing its harmony coefficient (k) nearly as small as that of the Jiangsu port cluster. In general, due to its inherent weaknesses in natural endowments, the development potential of Anhui port cluster is limited. However, its reintegration is still promising, as its reform started later.
5.2 Problem finding
Although the provincial port clusters in the YRD have achieved some development through previous integration reforms, each one still has its own deficiencies, as revealed by the evaluation results and development status discussed above. Particularly from a broader perspective of the YRD port cluster, several prominent problems persist within the cluster, as outlined below:
Firstly, the spatial layout of ports in some provinces is monotonous and lacks hierarchy, leading to disorderly competition. Ports within a port cluster often share the same economic hinterland, meanwhile, engage in redundant construction due to their geographical proximity and functional substitutability (Lu, 2024; Su et al., 2024; Zhang et al., 2025). Among the main ports in each province, the lack of significant differences in port scale has prevented the emergence of clear hub ports or feeder ports. Intense competition exists, but none of these ports has the capacity to become the hub port of the YRD. This makes the key ports lack of competitiveness and difficult to participate in international competition. This phenomenon is particularly severe in Jiangsu and also notable in Anhui.
Secondly, the unclear positioning of ports within the YRD region leads to intensified internal competition, which weakens the overall performance of the port cluster. As different ports fall under distinct provincial jurisdictions but share the same economic hinterland while being functionally substitutable, competition between hub ports within the cluster is inevitable (Li et al., 2023a). Particularly, as the two most significant ports in the YRD region (Zheng et al., 2021), Shanghai Port and Ningbo-Zhoushan Port compete fiercely not only for cargo supply from the Yangtze River valley provinces but also for the status of an international shipping center, which significantly undermines the overall performance of the YRD port cluster.
Moreover, the management system is decentralized. The most favorable management model for a port cluster is widely believed to be the coordinated decentralized model (Glavinović et al., 2023). However, in the YRD port cluster, there is neither a strong port administration responsible for planning and coordinating port development nor a unified enterprise association or large port group company formed to manage and operate all the ports within the cluster. These factors result in disordered competition rather than effective cooperation among the ports in the cluster.
5.3 Strategy suggestions
Combined with the reality and based on the evaluation results of the YRD port cluster, the following measures are proposed to address the aforementioned problems:
First, establish a cross-provincial port planning coordination mechanism to plan and coordinate the development of the entire port cluster. The Chinese government has designated the YRD regional integration as a strategic priority at the national level, necessitating enhanced cooperation among local governments and the removal of administrative barriers (Li et al., 2023a). For the sake of rationally planning the entire YRD port cluster and ensuring the effective implementation of the plan, thereby avoiding redundant construction projects and the waste of port resources, the central government should break down administrative barriers between provinces and establish a port management agency with ultimate administrative authority to to systematically organize and harmonize the growth of the entire port cluster. In addition, from the perspective of competing with other port clusters both domestically and internationally, port enterprises within this region should be encouraged to form a unified strategic alliance or establish a large port group company to manage and operate the port cluster as a whole, thereby enhancing its overall competitiveness.
Second, promote port cooperation. In addition to cooperation through enterprise mergers and equity investment (Leng et al., 2024), internal competition can be reduced and cooperation between adjacent ports can be enhanced by establishing combined ports or joint port authorities. Shanghai Port should adopt this mode with Ningbo-Zhoushan Port, while other ports can adopt a feeder-to-hub port cooperation model in relation to the above two ports to achieve rational division of labor and resource sharing. In addition, the model of cross-shareholdings among port enterprises is suitable for cooperation between any two or more ports. Through capital joint ventures, ports can effectively prevent issues such as vicious price competition and achieve a balanced state of shared benefits and risks.
Third, clarify port positioning and division of labor. A high-efficiency port cluster should achieve differentiated development, reasonable functional positioning, and clear hierarchical levels (Li et al., 2023a). The spatial layout of the port cluster should emphasize functional division of labor to avoid repeated construction and vicious competition (He and Xu, 2023; Moretti, 2023). Shanghai Port, positioned as an international shipping center by the national government, should focus on international container transportation, adjust its cargo structure, and significantly enhance high-end shipping services like shipping finance, ship trading and management, and customized shipping data information services, etc. As a regional comprehensive hub port, Ningbo-Zhoushan Port needs to continue strengthening its role as a comprehensive cargo distribution center, consolidating its standing as the planet’s foremost port in terms of cargo throughput, while coordinating container transportation development with Shanghai Port. Other branch and feeder ports should optimize resource allocation and operational strategies based on their functional positioning.
6 Conclusions
This study makes three key contributions to port cluster evaluation and development policy. First, we innovatively integrate port competitiveness theory with system science theory to develop a novel evaluation framework (S = P × k) that captures both hard competitiveness factors (P) and systemic harmony effects (k) - an advancement beyond conventional linear weighting approaches. Second, our dimension partitioning methodology establishes new guidelines for port cluster assessment through three key approaches: differentiating quantitative and qualitative dimensions, implementing hierarchical decomposition, and incorporating dynamic equilibrium analysis - collectively providing a more nuanced understanding of cluster performance drivers.
The evaluation results indicate that, among the provincial port clusters, Shanghai ranks first (0.230), followed by Zhejiang (0.178) and Jiangsu (0.127), with Anhui at the bottom (0.020). The evaluation results reveal three significant findings. First, the harmony coefficient (k) demonstrates a particularly strong influence on the comprehensive scores, confirming that systemic harmony is as critical as traditional competitiveness factors in port cluster development. Second, the 0.230-0.020 performance range across provincial clusters quantitatively validates the YRD’s development imbalances, with Shanghai’s lead attributable to superior system harmony (cooperation-competition balance) alongside expected economic factors. Finally, our three-tier indicator system successfully identifies underperforming dimensions at different levels (e.g., Anhui’s weak Level-3 operational indicators).
Additionally, the study identifies significant challenges facing the YRD port cluster in spatial layout, functional orientation, and management systems. To address these, we propose three evidence-based strategies: enhanced planning and coordination through model-driven performance monitoring; targeted cooperation programs to remedy identified harmony deficiencies; and precise functional positioning guided by hierarchical indicator analysis.
Our model serves as a decision-support tool for testing reform scenarios, future research could apply this framework to other major port clusters and incorporate real-time data for dynamic assessment. As an extension of this study, further research is needed on how to align the local governments in the YRD with the arrangements of the central port administration agency to integrate the port resources of the entire YRD port cluster. Additionally, the optimal allocation of governmental and market roles in cross-provincial port resource consolidation warrants deeper exploration.
Data availability statement
The original contributions presented in the study are included in the article/supplementary material, further inquiries can be directed to the corresponding author/s.
Author contributions
JW: Data curation, Software, Visualization, Conceptualization, Writing – original draft, Methodology, Writing – review & editing. YZ: Writing – review & editing, Validation, Supervision, Resources, Project administration, Funding acquisition. XL: Investigation, Writing – review & editing, Formal Analysis.
Funding
The author(s) declare financial support was received for the research and/or publication of this article. The authors would like to express their gratitude for the support provided by the National Social Science Foundation of China (grant number 21BBY017).
Conflict of interest
The authors declare that the research was conducted in the absence of any commercial or financial relationships that could be construed as a potential conflict of interest.
Generative AI statement
The author(s) declare that no Generative AI was used in the creation of this manuscript.
Any alternative text (alt text) provided alongside figures in this article has been generated by Frontiers with the support of artificial intelligence and reasonable efforts have been made to ensure accuracy, including review by the authors wherever possible. If you identify any issues, please contact us.
Publisher’s note
All claims expressed in this article are solely those of the authors and do not necessarily represent those of their affiliated organizations, or those of the publisher, the editors and the reviewers. Any product that may be evaluated in this article, or claim that may be made by its manufacturer, is not guaranteed or endorsed by the publisher.
References
Bugingo E., Leone Ndimubenshi E., Tshimanga Kamanga C., Xavier Rugema F., Habimana O., and Batamuliza J. (2024). Application of AHP in Decision-Making: Case Studies and Practical Implementation (United Kingdom: IntechOpen). doi: 10.5772/intechopen.1006966
Chen X., Ma F., Wu Y., Han B., Luo L., and Biancardo S. A. (2025). MFMDepth: MetaFormer-based monocular metric depth estimation for distance measurement in ports. Comput. Ind. Eng. 207, 111325. doi: 10.1016/j.cie.2025.111325
Chen S., Piao L., Zang X., Luo Q., Li J., Yang J., et al. (2023a). Analyzing differences of highway lane-changing behavior using vehicle trajectory data. Physica A 624, 128980. doi: 10.1016/j.physa.2023.128980
Chen X., Wei C., Xin Z., Zhao J., and Xian J. (2023b). Ship Detection under Low-Visibility Weather Interference via an Ensemble Generative Adversarial Network. J. Mar. Sci. Eng. 11, 1–17. doi: 10.3390/jmse11112065
Chen X., Xu S., Zhang N., Sun Z., and Han B. (2023c). “Study on the evaluation system of green port development in Suzhou**,” in Advances in Traffic Transportation and Civil Architecture, 1st ed. Eds. Liu R., Qi C., and Law T.-H. (CRC Press, London, UK). doi: 10.1201/9781003402220
Cong L., Zhang D., Wang M., Xu H., and Li L. (2020). The role of ports in the economic development of port cities: Panel evidence from China. Transp. Policy 90, 13–21. doi: 10.1016/j.tranpol.2020.02.003
De Vicente-Lama M., Tirado-Valencia P., Ruiz-Lozano M., and Cordobés-Madueo M. (2023). The impact of sectoral guidelines on sustainability reporting in ports: the case of the Spanish ports. Marit. Econ. Logist. 25, 499–519. doi: 10.1057/s41278-021-00199-2
Ding W., Chen Z., Wang R., Xue T., and Yao H. (2022). “The review and prospect of the development of guangdong-hong kong-macao greater bay area port cluster and its river-sea intermodal transport system,” in Proceedings of PIANC Smart Rivers 2022. Lecture Notes in Civil Engineering, vol. 264 . Eds. Li Y., Hu Y., Rigo P., Lefler F. E., and Zhao G. (Springer, Singapore). doi: 10.1007/978-981-19-6138-0_139
Fu Y., Lin Q., Grifoll M., Lam J. S. L., and Feng H. (2023). Investigating the evolution of the Guangdong-Hong Kong-Macao Greater Bay Area (GBA) multi-port system: The multi-faced perspectives. Ocean Coast. Manage. 233, 106450. doi: 10.1016/j.ocecoaman.2022.106450
Geng Y. (2024). A study on the development difference of port clusters in Guangdong Province. China Water Transport 05, 34–36. doi: 10.13646/j.cnki.42-1395/u.2024.05.012
Glavinović R., Vukić L., and Peronja I. (2023). Analysis of management models of regional ports in the republic of Croatia. J. Mar. Sci. Eng. 11, 332. doi: 10.3390/jmse11020332
Guo L., Ng A. K., Jiang C., and Long J. (2021). Stepwise capacity integration in port cluster under uncertainty and congestion. Transp. Policy 112, 94–113. doi: 10.1016/j.tranpol.2021.08.011
He Y. and Xu X. (2023). Spatial correlation network structure of port performance and its drivers: A case study of Chinese coastal ports. Ocean Coast. Manage. 244, 106780. doi: 10.1016/j.ocecoaman.2023.106780
He Z., Zhao P., Zhang S., Li Z., Huang G., Zhang Ca., et al. (2024). Analyzing foreland dynamics in China’s port clusters under global major events, (2019–2022) by AIS trajectory data. Ocean Coast. Manage. 255, 107269. doi: 10.1016/j.ocecoaman.2024.107269
Hsu C.-T., Chou M.-T., and Ding J.-F. (2023). Key factors for the success of smart ports during the post-pandemic era. Ocean Coast. Manage. 233, 106455. doi: 10.1016/j.ocecoaman.2022.106455
Huang G., Wang G., Fen X., Yu T., and Jiang L. (2023). Research on hinterland spatial structure of port group in Gulf of Guinea based on spatial interaction model and GIS technology. China Harbour Eng. 43, 1–6. doi: 10.7640/zggwjs202302001
Jin L., Chen J., Sheu J.-B., Zhou H., Jian Y., and Yu B. (2022). Impacts of national strategies on gateway ports: An empirical study in the Bohai Rim. Transp. Policy 117, 1–11. doi: 10.1016/j.tranpol.2021.12.022
Leng Z., Yuan K., and Chen X. (2024). Port service coordination sustainability in the Yangtze River delta in China based on spatial effects. Sustainability 16, 10117. doi: 10.3390/su162210117
Li S., Wu W., Ma X., Zhong M., and Safdar M. (2023b). Modelling medium-and long-term purchasing plans for environment-orientated container trucks:a case study of Yangtze River port. Transportation Saf. Environ. 5, 58–67. doi: 10.1093/tse/tdac043
Li D., Xin X., and Zhou S. (2023a). Integrated governance of the Yangtze River Delta port cluster using niche theory: A case study of Shanghai Port and Ningbo-Zhoushan Port. Ocean Coast. Manage. 234, 106474. doi: 10.1016/j.ocecoaman.2022.106474
Liu W., Cao Y., Wu W., and Guo J. (2024). Processes and mechanisms of the evolution of container port system in the Yangtze River Delta: An analysis from spatial and network perspectives. Res. Transp. Bus. Manage. 56, 101189. doi: 10.1016/j.rtbm.2024.101189
Liu B., Wang X., and Liang X. (2023a). Neural network-based prediction system for port throughput: A case study of Ningbo-Zhoushan Port. Res. Transp. Bus. Manage. 51, 101067. doi: 10.1016/j.rtbm.2023.101067
Liu L., Zhou G., and Zhang T. (2023b). Evaluation of coordinated development of Anhui port cluster based on coupling degree. Logistics Technol. 42, 61–65 + 108. doi: 10.3969/j.issn.1005-152X.2023.04.011
Lu B. (2023). Cooperative Operation Optimization for Port Groups (Singapore: Springer Nature Singapore). doi: 10.1007/978-981-99-5277-9
Lu B. (2024). The Sustainable Development of Port Group (Singapore: Springer Nature Singapore). doi: 10.1007/978-981-97-2378-2
Lupi M., Pratelli A., Seminara L., and Farina A. (2021). The development of deep and short sea shipping container routes departing from Italian ports. Naše More 68, 83–92. doi: 10.17818/NM/2021/2.4
Mohd Rozar N., Sidik M. H., Razik M. A., Ahmad Kamaruddin S., Rozar M. K. A. M., and Usman I. (2023). A hierarchical cluster analysis of port performance in Malaysia. Maritime Business Rev. 8, 194–208. doi: 10.1108/MABR-07-2020-0040
Moretti B. (2023). Technical land-sea spaces: impacts of the port clusterization phenomenon on coasts, cities and architectures. J. Contemp. Urban Affairs 7, 208–223. doi: 10.25034/ijcua.2023.v7n1-14
Moretti B. (2025). Investigating port spatiality: tools for a spatial approach to port clusters. Ocean Soc. 2, 9285. doi: 10.17645/oas.9285
Nguyen P. N., Woo S.-H., Beresford A., and Pettit S. (2020). Competition, market concentration, and relative efficiency of major container ports in Southeast Asia. J. Transport Geogr. 83, 102653. doi: 10.1016/j.jtrangeo.2020.102653
Nie A., Wan Z., Shi Z., and Wang Z. (2023). Cost-benefit analysis of ballast water treatment for three major port clusters in China: evaluation of different scenario strategies. Front. Mar. Sci. 10. doi: 10.3389/fmars.2023.1174550
Pan Q. (2022). Evaluation of the Competitiveness of China’s Major Coastal Ports from the Perspective of High-Quality Development (Jinan, China: MA thesis, Shandong University of Finance and Economics). doi: 10.27274/d.cnki.gsdjc.2022.001088
Qiu Y. and Zhang Q. (2024). Spillover effects of Chinese ports based on spatial Durbin panel model. J. Shanghai Marit. Univ. 45, 1–12. doi: 10.13340/j.jsmu.202307190165
Saaty T. L. (1980). The Analytic Hierarchy Process: Planning, Priority Setting, Resources Allocation (New York: McGraw-Hill).
Serra P., Mancini S., Fancello G., Sollai F., and Fadda P. (2022). “Port clusters as an opportunity for optimizing small-scale LNG distribution chains: an application to the mediterranean case,” in Communication Systems and Applications – ICCSA 2022 Workshops, vol. LNCS 13381 . Eds. Gervasi O., Murgante B., Misra S., Rocha A. M. A. C., and Garau C. (Springer, Cham, Switzerland), 140–155. doi: 10.1007/978-3-031-10548-7_11
Sisman S. and Aydinoglu A. C. (2020). Using GIS-based multi-criteria decision analysis techniques in the smart cities. Int. Arch. Photogramm. Remote Sens. Spatial Inf. Sci. XLIV-4/W3, 383–389. doi: 10.5194/isprs-archives-xliv-4-w3-2020-383-2020
Su W. and Lan Y. (2022). Research on the coordinated development of port clusters under the background of GD-HK-MAC greater bay area. Sustain. Dev. 12, 766–772. doi: 10.12677/SD.2022.123085
Su J., Liu J., and Zhang A. (2024). Promoting regional coordinated and sustainable development of port, economy, and environment in archipelago - A case study of Zhoushan Port in China. Ocean Coast. Manage. 257, 107324. doi: 10.1016/j.ocecoaman.2024.107324
Tang J. and Lin B. (2023). Ports and economic development of port cities in Pearl River Delta based on panel vector autoregressive model. Int. J. Innov. Comput. I. 19, 835–843. doi: 10.24507/ijicic.19.03.835
Vukić L., Vidov J., and Karin I. (2024). Method in selecting vehicles for interventions and surveillance of navigation safety at sea. J. Mar. Sci. Eng. 12, 979. doi: 10.3390/jmse12060979
Wang J. (2020). Port integration in the Yangtze River Delta area: practice and policy analysis (Malm, Sweden: MA thesis, World Maritime University). Available online at: https://commons.wmu.se/all_dissertations/1596/ (Accessed August 22, 2020).
Wang J. (2022). Port integration in the Yangtze River delta area: practice and policy analysis. Am. J. Traffic Transp. Eng. 7, 1–13. doi: 10.11648/j.ajtte.20220701.11
Wang W., Ji Y., and Jin F. (2022b). The competition and cooperation relationship of Chinese ports based on dynamic spatial panel model. Geographical Res. 41, 616–632. doi: 10.11821/dlyj020210052
Wang D. and Jing Y. (2025). Ship collision risk analysis in port waters integrating GRA algorithm and BPNN. Transportation Saf. Environ. 2025, 1–8. doi: 10.1093/tse/tdaf012
Wang M., Lan Y., Li H., Jing X., Lu S., and Deng K. (2024). Spatial-temporal differentiation and trend prediction of coupling coordination degree of port environmental efficiency and urban economy: A case study of the Yangtze River delta. Land 13, 374. doi: 10.3390/land13030374
Wang T., Xiao G., and Biancardo S. A. (2025). The impact of the 21st-Century Maritime Silk Road on sulfur dioxide emissions in Chinese ports: based on the difference-in-difference model. Front. Mar. Sci. 12. doi: 10.3389/fmars.2025.1608803
Wang C., Yang Q., and Wu S. (2022a). Coordinated development relationship between port cluster and its hinterland economic system based on improved coupling coordination degree model: empirical study from China’s port integration. Sustainability 14, 4963. doi: 10.3390/su14094963
Wu B., Wang Y., Zhang J., Savan E. E., and Yan X. (2015a). Effectiveness of maritime safety control in different navigation zones using a spatial sequential DEA model: Yangtze River case. Accident Anal. Prev. 81, 232–242. doi: 10.1016/j.aap.2014.12.024
Wu B., Yan X., and Wang Y. (2015b). A modified decision-making method with multidivisional cooperation for disposal of NUC ships. J. Transportation Syst. Eng. Inf. Technol. 15, 16–23. doi: 10.16097/j.cnki.1009-6744.2015.05.003
Xiao G., Caleb A., Wang T., and Biancardo S. A. (2025). Evaluating the impact of ECA policy on sulfur emissions from the five busiest ports in America based on difference in difference model. Front. Mar. Sci. 12. doi: 10.3389/fmars.2025.1609261
Xiao R., Liu S., Wu L., Luo M., Ma R., and Li J. (2023). Regional classification and competitiveness of port cluster: a case study of China’s coastal ports. Int. J. Logist. Res. Appl. 28 (7), 745–762. doi: 10.1080/13675567.2023.2189693
Xie F., Zhang L., Zheng S., Xu A., Li Z., Dai J., et al. (2025). SOM neural network-based port function analysis: a case study in 21st-century Maritime Silk Road. Front. Mar. Sci. 11. doi: 10.3389/fmars.2024.1522071
Xu Q., Huang T., Chen J., Wan Z., Qin Q., and Song L. (2021). Port rank-size rule evolution: Case study of Chinese coastal ports. Ocean Coast. Manage. 221, 105803. doi: 10.1016/j.ocecoaman.2021.105803
Yu S., Gong L., and Qi M. (2022). Efficiency analysis of the coastal port group in the Yangtze River delta. J. Mar. Sci. Eng. 10, 1575. doi: 10.3390/jmse10111575
Yu S., Song X., and Chen K. (2021). Spatio-temporal evolution and influencing factors of the development of the Bohai rim port group. J. Dalian Marit. Univ. 47, 39–48. doi: 10.16411/j.cnki.issn1006-7736.2021.03.006
Yu S. and Sun J. (2021). Analysis on coordinated development of port cluster and urban agglomeration in Yangtze River Delta. J. Tongji Univ. 49, 1335–1344. doi: 10.11908/j.issn.0253-374x.21096
Zeng S., Fang Z., He Y., and Huang L. (2022). An integrated entropy-COPRAS framework for Ningbo-Zhoushan port logistics development from the perspective of dual circulation. Systems 10, 131. doi: 10.3390/systems10050131
Zhang Q., Hu X., Li Z., Zhou Y., and Qi X. (2025). Port’s industry ecosystem construction: Empirical evidence from China. Transp. Policy 163, 42–60. doi: 10.1016/j.tranpol.2025.01.005
Zhang X., Lu J., and Peng Y. (2022). Spatio-temporal evolution of the container port system along the 21st-century maritime silk road. Marit. Policy Manage. 50, 668–691. doi: 10.1080/03088839.2021.2017038
Zheng J., Ma Y., Ji X., and Chen J. (2021). Is the weekly service frequency constraint tight when optimizing ship speeds and fleet size for a liner shipping service? Ocean Coast. Manage. 212, 105815. doi: 10.1016/j.ocecoaman.2021.105815
Zhu G., Zhao P., Zhang L., Li X., Ding W., Yu H., et al. (2024). Territorial spatial suitability assessment and optimization of coastal port reclamation in China. Ocean Coast. Manage. 254, 107189. doi: 10.1016/j.ocecoaman.2024.107189
Keywords: port cluster, port performance, comprehensive evaluation, port development, AHP, overall competitiveness
Citation: Wang J, Zhang Y and Lu X (2025) Evaluation of development performance of port cluster: the case of Yangtze River Delta port cluster. Front. Mar. Sci. 12:1656657. doi: 10.3389/fmars.2025.1656657
Received: 30 June 2025; Accepted: 05 August 2025;
Published: 01 September 2025.
Edited by:
Zhaotong Lian, University of Macau, ChinaReviewed by:
Yanguo Huang, Jiangxi University of Science and Technology, ChinaQiang Luo, Guangzhou University, China
Copyright © 2025 Wang, Zhang and Lu. This is an open-access article distributed under the terms of the Creative Commons Attribution License (CC BY). The use, distribution or reproduction in other forums is permitted, provided the original author(s) and the copyright owner(s) are credited and that the original publication in this journal is cited, in accordance with accepted academic practice. No use, distribution or reproduction is permitted which does not comply with these terms.
*Correspondence: Jie Wang, d2FuZ2ppZTFAc2htdHUuZWR1LmNu