 Mbaye Tine
 Modou Thiaw
 Moussa Ngom1
- 1UFR des Sciences Agronomiques, de l’Aquaculture et des Technologies Alimentaires (UFR S2ATA), Université Gaston Berger (UGB), Saint-Louis, Senegal
- 2Université Amadou Mahtar Mbow (UAM), UFR des Sciences et Technologies Avancées (STA), Diamniadio, Dakar, Senegal
- 3Département de Biologie Animale, Faculté des Sciences et Techniques, Université Cheikh Anta Diop de Dakar (UCAD), Dakar, Senegal
Shellfish harvesting in Saloum Islands is crucial for economic and socio-cultural income, particularly for women. However, the industry is facing decline in stocks and harvested individuals, necessitating urgent shellfish assessment and mapping in the Saloum Delta. This study aimed to characterize and assess the distribution, diversity and abundance of mollusc species of commercial interest in the Saloum delta. The species collected were identified using determination keys available in the literature. Their spatial distribution was also studied using principal component analysis (PCA) and their abundance and diversity were assessed using conventional ecological indices. Sampling at 17 stations across five villages (Dionewar, Niodior, Palmarin, Falia, and Sangomar) during both harvesting and biological rest periods in 2019–2020 revealed 21 species from 19 families. Notable findings indicated higher species richness in Niodior and Sangomar than in Falia, Dionewar and Palmarin, based on data from both harvesting and biological rest periods. Diversity metrics, including Hill’s N1 (1.61), Shannon’s H’ (1.77), and Shannon-Weaver (0.47), indicated a high overall diversity with a few dominant species (Simpson’s index: 0.564; equitability index: 0.16), emphasizing the critical role of biological rest in sustaining shellfish populations. Senilia senilis, the most commercialized species, emerged as the dominant species across all localities, followed by the less exploited Diplodonta rotundata. Spatial and temporal variations correlated with environmental factors, including bathymetric distribution and delta hydrology, suggesting the need for effective management strategies alongside existing conservation measures. These results, combined with conservation measures already in place such as biological rest, could lead to better management of shellfish stocks in the Saloum Islands.
Introduction
Global climate change has significantly altered temperature and precipitation regimes, contributing to the salinization and alkalinization of terrestrial and aquatic ecosystems (Hallett et al., 2018; Kaushal et al., 2018; López-Alonso et al., 2022; Mohamed Moctar et al., 2023). These impacts are especially pronounced in estuarine systems, where they are driven by reduced freshwater inflows and increased evaporation rates. One of the notable consequences is the emergence of “inverted” estuaries - systems in which salinity levels are higher upstream than downstream, often surpassing seawater salinity. This phenomenon is notably present in the Senegal-Gambia region, which includes two inverted estuaries (Saloum and Casamance) and the more traditionally structured Gambia River estuary. During the dry season, salinity in the upper reaches of the Saloum and Casamance can reach two to three times that of seawater. This shift, that began during the Sahelian drought of the late 1960s (Pagès and Citeau, 1990), has intensified due to ongoing climate change, significantly impacting aquatic communities through changes in species composition, endemism, and functional diversity (Kantoussan et al., 2012). In extreme cases, salinity levels of up to 70 psu have been recorded, limiting biological communities to highly specialized taxa (Panfili et al., 2006).
Organisms inhabiting estuarine and coastal systems, especially molluscs, are sensitive to fluctuations in salinity, temperature, and dissolved oxygen (Kaushal et al., 2018; López-Alonso et al., 2022; Mohamed Moctar et al., 2023), as well as anthropogenic pressures. Shellfish are widely distributed in the Saloum Islands and are central to the local economy, particularly in coastal villages where shellfish harvesting constitutes a vital livelihood for women (Dahou, 2010; Ndoye and Moity-Maizi, 2010). Due to socio-economic dynamics, including poverty and male emigration, women increasingly assume dominant roles in collection and commercialization (de Morais, 2011). However, the sector faces declines in both stock abundance and individual size, likely due to overexploitation and environmental stressors (Ndoye and Moity-Maizi, 2010). Given these challenges, there is an urgent need for shallow-water stock assessments and spatial mapping of mollusc populations in the Saloum Delta. These assessments are crucial for sustainable resource management and contribute to economic development, livelihood security, and ecosystem preservation.
A critical first step in such stock assessments is the accurate identification of commercially important species (Albert et al., 2022; Lapègue et al., 2016; Liu et al., 2021; Mohamed Moctar et al., 2023). Coastal bivalves, which are heavily exploited, have been the focus of numerous studies on systematics and economic significance (Albert et al., 2022; Cormier-Salem et al., 2010; Koutsoubas et al., 2007; Kreeger et al., 2018; López-Alonso et al., 2022; Van Der Schatte Olivier et al., 2020; Wijsman et al., 2019; Voultsiadou et al., 2010). Recent research has focused on assessing the composition, diversity, and abundance of molluscs, while others have examined how their distribution is affected by environmental characteristics such as temperature, salinity, pH, and sentiment (Lewin et al., 2024; Malahayati, 2024; Mohamed Moctar et al., 2023; Nel et al., 2012; Sousa, 2024). In the past few years, a number of studies on mollusc as bio-indicators for environmental health assessment have been carried out in many countries (Chahouri et al., 2023; Moraitis et al., 2018; Sidoumou et al., 2006; Yap et al., 2025, 2025).Although being important and fundamental to conservation efforts, such research has not yet been carried out in the Saloum Delta, where shellfish species are not well studied. In the Saloum Delta the exploitation targets primarily bivalves and gastropods, such as oysters, ark clams, volutes, Pugilina morio (black melon), Donax spp., and Conus geographus (cone snails). Overharvesting in this area combined with the adverse impacts of other human activities and climate change may have led to the depletion of some species and altered the diversity of molluscs, despite the area’s status as a biosphere reserve (SDBR).
This study aimed to assess the distribution, diversity, and abundance of shallow-water mollusc species in the Saloum Delta, focusing on species inhabiting depths of 0–30 cm. Species such as the oyster Crossostrea spp., which anchor to mangrove roots and are among the most exploited, were excluded. Sampling was conducted over an eight-month period (June 2019-February 2020) encompassing both the harvesting and biological rest periods. The study also sought to determine the spatial structuring and relative abundance of key species in relation to environmental gradients within the delta.
2 Materials and methods
2.1 Study area
The Saloum Delta region faces environmental and socioeconomic challenges, including soil and estuary salinization, overexploitation of fishery ecosystems, demographic pressure, and the impacts of drought (Dieye et al., 2013; Ndiaye, 1992). This study aimed to understand the dynamics of shellfish harvesting and associated environmental variations in the Saloum Delta area. This information is crucial for sustainable fishery management practices in the region. It focused on the Saloum Islands, specifically examining shellfish harvesting in areas such as Dionewar, Niodior, Sangomar Island, Falia, and Palmarin. These areas are particularly important in terms of shellfish landings, with the “Gandoules” containing the second largest mass of shellfish after “Diorom Bumack.” The accessibility of these areas and the intensity of shellfish harvesting contribute to their importance. The methodology of this study involved selecting mudflats for sampling, focusing on areas where shellfish harvesting was most intense. In localities with a large number of mudflats, only the most frequented areas by fishermen were sampled, whereas in areas with few mudflats, all available mudflats were selected.
2.2 Sample collection
The methodology for the field survey used a quadrat to sample substrates containing mollusc species across multiple mudflats. This quadrat, which has dimensions of 50 cm length, 50 cm width, and 30 cm height, was designed specifically for sampling substrates containing mollusc species and other benthic marine organisms (annelids, crustaceans, etc.). The geographical coordinates of each sampling station were recorded using a GPS device (Supplementary Table 1). These coordinates served as references for thematic maps and for extracting information related to the sampling sites or stations.
At each sampling site, three samples were taken using the quadrat to cover all species present in the area. The location of the first quadrat is randomly selected, sunk into the sediment, and its contents were sampled (Supplementary Figure S1). Sediment from the quadrat was then sieved using a 2 mm mesh sieve. Once sieving is complete, the contents of the sieve are collected in plastic bags labeled with the village or Island name, the sampling station name, and the sample number. These samples were then stored in plastic bags containing a 14% formalin solution and labeled with sampling and collection site information. To minimize errors, the same sample was taken twice from each mudflat, resulting in triplicates. This enables extrapolation with a minimal risk of error.
A total of 96 samples were collected along 102 radials in the study area across 17 stations in five villages (Figure 1). This methodology ensured thorough and systematic sampling across the study area, while minimizing errors and providing robust data for analysis. All 17 stations’ GPS coordinates are provided in Supplementary Table S1. Quadrat placement followed a hybrid design: initial randomization within mudflats, stratified by high-activity zones (fishermen-frequented areas) to align with exploitation patterns.
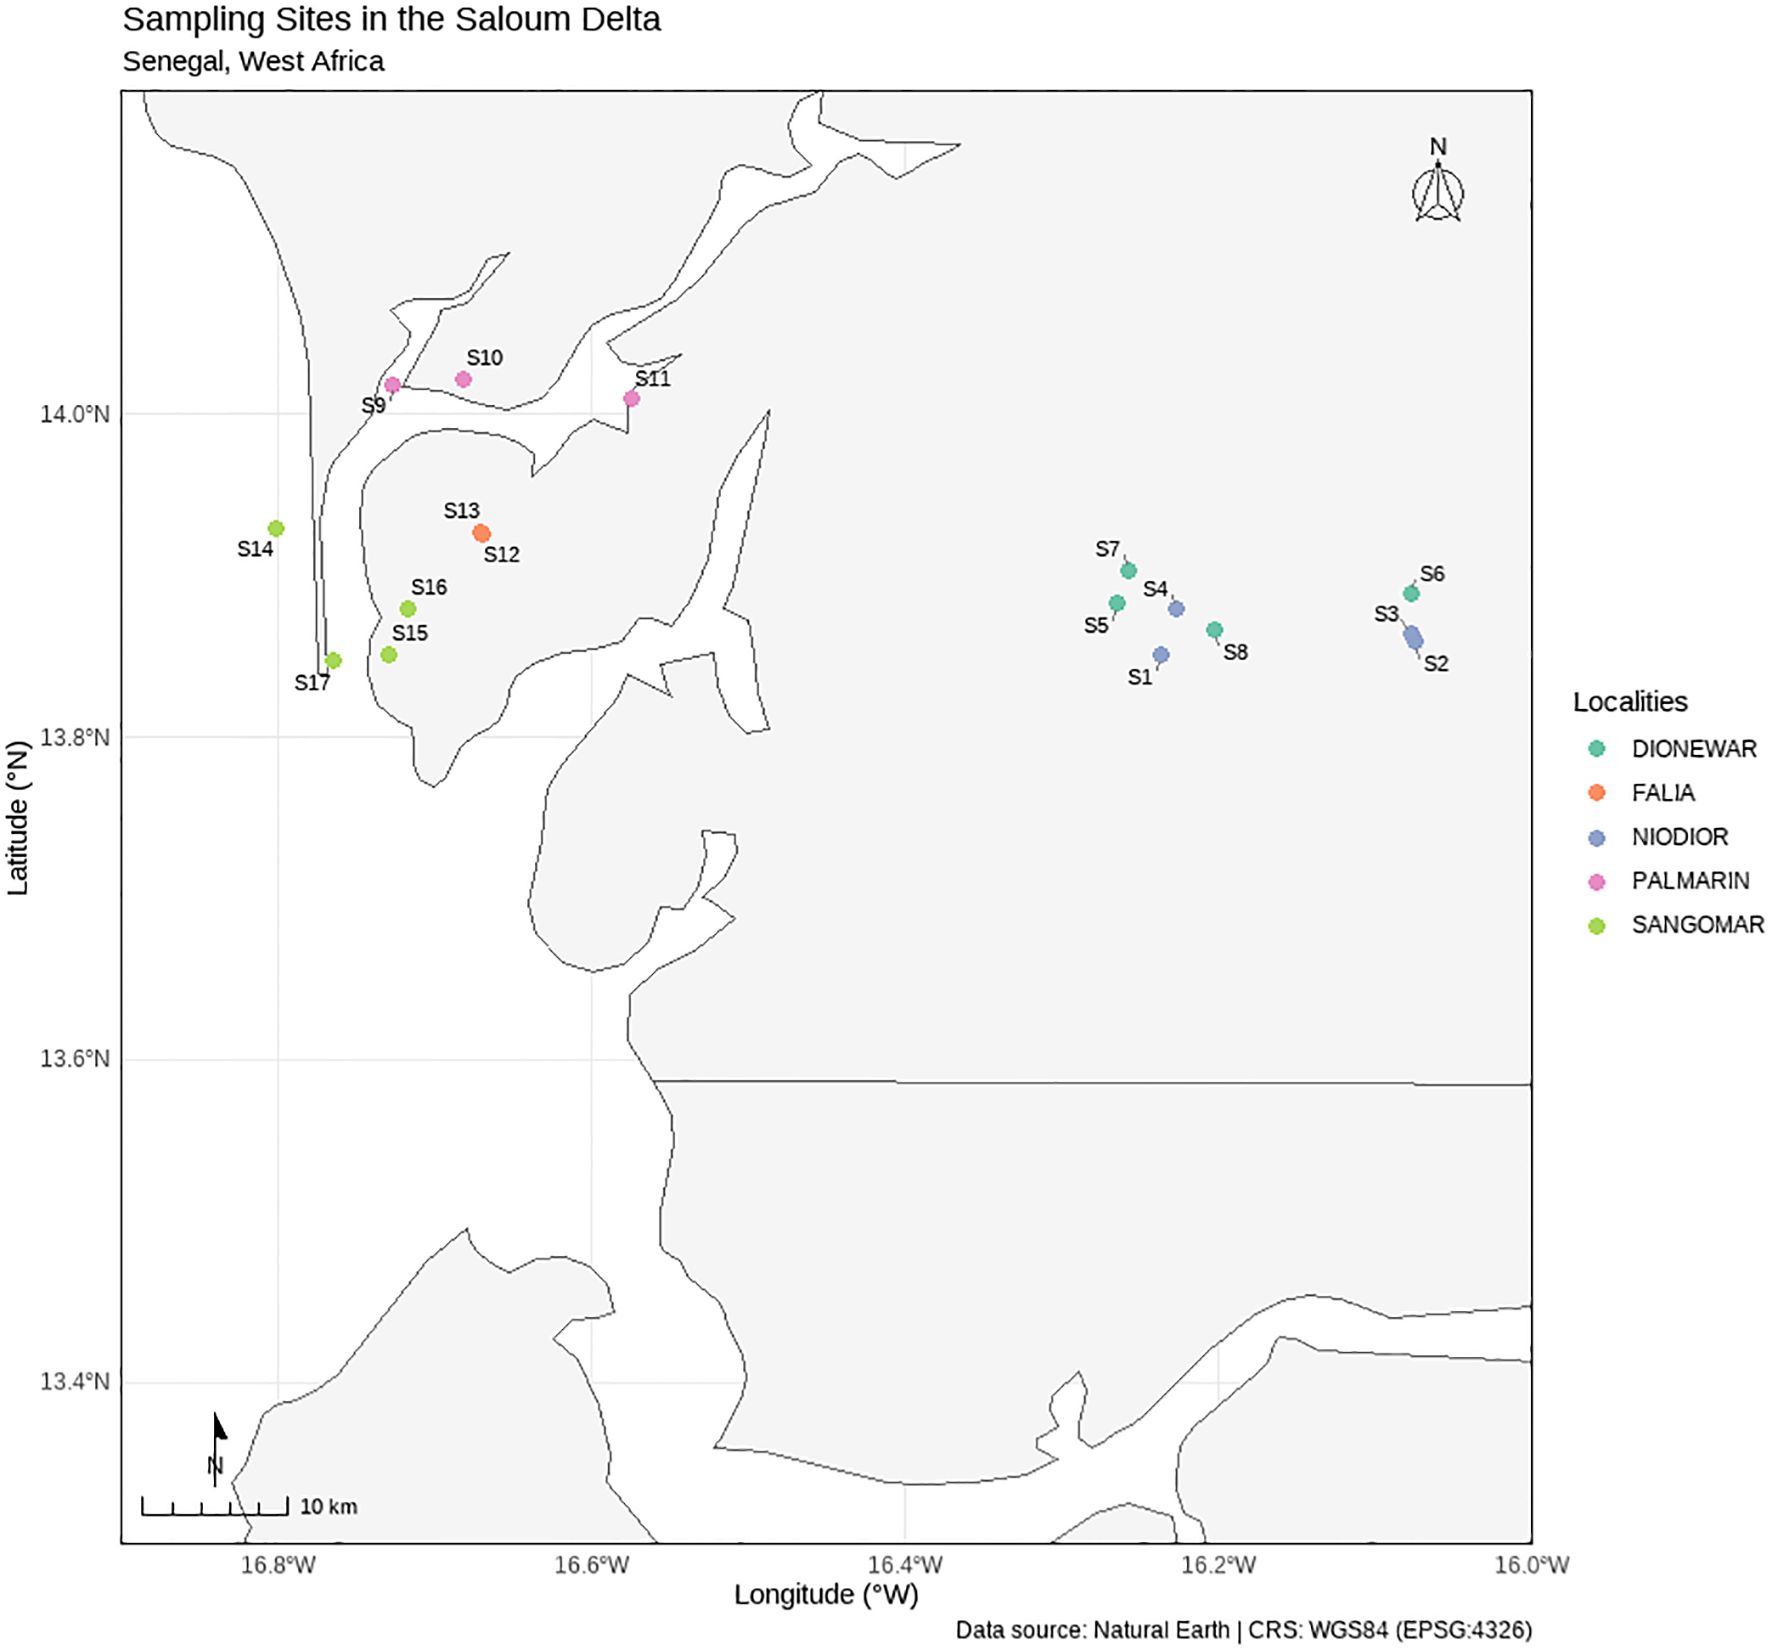
Figure 1. Sampling map showing the station studied in each village.
2.3 Sample preparation and cleaning for laboratory analysis
The samples were initially stored in the field, as described above to preserve them in their original state over an extended period. Upon arrival at the laboratory, they were transferred from plastic bags to a bucket and rinsed with water to prepare them for analysis. The cleaning process removes excess sediment, sand, silt, algae, clots, debris, and formaldehyde odor, ensuring that only the organisms of interest remain for further analyses. This process ensures that the samples are properly prepared and free from contaminants before analysis, allowing for the accurate identification and analysis of the species present. After being rinsed, the samples were sorted to separate living species from shellfish, plant debris, and other impurities. This step requires careful handling, particularly for samples containing small organisms. Once cleaned and sorted by species, organisms are identified using personal documentation or established methods for mollusc species identification. After this steep, all identified species were separated from each other for further analyses.
2.4 Measurements
Various parameters of the samples were measured. This includes:
- Total Weight (PT): This refers to the total weight of the sample measured with an electronic balance to the nearest 0.1 g (Supplementary Figure 2A).
- Total Length (L): This corresponds to the distance separating the front edge from the rear edge of the shell. It was measured using a digital caliper graduated electronically to the nearest hundredth of a millimeter (Supplementary Figure 2B).
- Height (H): For bivalves, this parameter extends from the dorsal hinge to the ventral edge of the shell. It was measured to the nearest hundredth of a millimeter using an electronically graduated caliper (Supplementary Figure 2C).
- Width (W): This is the maximum length of the convexity of the two combined valves. It was measured in the same way as length and height (Supplementary Figure 2D).
2.5 Diversity and evenness indices
Simpson’s Diversity Index (Simpson, 1949) was used to quantify the dominance within the shellfish species collected in this study by considering both abundance and richness. This index was particularly sensitive to the abundance of the most common species in samples.
Simpson’s Diversity Index was calculated using the following formula:
Where D is Simpson’s Diversity Index, ni the number of individuals of the ith species, N the total number of individuals in the sample, and S is the total number of species in the sample.
Simpson’s Diversity Index ranges from 0 to 1, where 0 indicates no diversity (all individuals belong to one species) and 1 indicates maximum diversity (all species are equally abundant). The Simpson’s Dominance Index was inversely related to the Simpson’s Diversity Index. It is often preferred in certain situations because it varies in the same direction as the specific diversity index.
Hill’s diversity indices are derived from Shannon’s and Simpson’s diversity indices offering complementary perspectives on species diversity. Hill’s diversity index N1 is a transformation of Shannon’s diversity index, where each proportion is weighted by its logarithm, whereas Hill’s N2 diversity index (Hill, 1973) is the reciprocal of Simpson’s diversity index. These indices were calculated as follows:
where pi is the proportion of species i in terms of abundance.
Species diversity comprises two components: the number of species (S) in the sample and the evenness (E) of their frequency distribution, which characterizes the shape of the distribution. E was calculated using the following formula:
When all species are equally represented, E = 1.
2.6 Abundance indices
Both absolute and relative abundances (Caughley and Sinclair, 1994; Hopkins and Kennedy, 2004) are important metrics in ecological studies, providing insights into the distribution and importance of species within ecosystems. Absolute abundance indicates the average number of individuals of a species per quadrat. Absolute abundance was defined as the number of individuals of a species in quadrat. Relative abundance is the probability of a species’ presence in a given habitat relative to other species. It was calculated as the number of individuals of a species divided by the total number of individuals of all species.
2.7 Statistical analysis
Principal Component Analysis (PCA) uses a global approach to detect correlations between different variables measured and to identify groups of individuals based on their distribution on a two-dimensional factorial plane (Hopkins and Kennedy, 2004; Jolliffe, 2002). PCA is a powerful statistical technique that is commonly used for dimensionality reduction and data visualization. In this study, PCA was used to identify patterns (spatial groups) and relationships between shellfish species based on their presence and abundance in the study area. PCA was selected for its effectiveness in reducing dimensionality while preserving variance in the abundance data (Jolliffe, 2002). PCA assumptions (linearity, correlation adequacy) were validated via Kaiser-Meyer-Olkin (> 0.6) and Bartlett’s sphericity tests (p < 0.001). Variables were standardized (z-scores) to address scale differences. NMDS/CCA were considered but deemed less optimal for the dataset’s linear gradients (Hopkins and Kennedy, 2004).
The data used for PCA included information on all sampled species at different locations in the study area. Individuals of each shellfish species and location (villages) are represented on a two-dimensional factorial plane, where the axes represent the principal components. The spatial groups identified using this representation on the factorial plan indicated the ecological relationships between shellfish species.
3 Results
3.1 Shellfish species composition
A total of 21 shellfish species were identified, including 10 bivalves, 10 gastropods, and one unidentified species which processes gastropod characteristics. Pictures of all species described in the following section are shown in Supplementary Figure S3. The names of all species were listed below with a short description.
3.1.1 Bivalve species
1. Senilia senilis: This is a bivalve of the Arcidae family, with a shell 3 to 4 cm long, but in some cases, up to 10 cm. The valves are thick and heavy and are marked externally by radiating ribs and fine growth ridges. The weight of the animal’s flesh never exceeded 10% of the weight of the shell.
2. Diplodonta rotundata is a small bivalve (Unguelimidae) with a white shell covered by a grayish periostracum (outer layer of mollusc shell). It has irregular concentric growth streaks that are difficult to distinguish from one another. The species measured a maximum of 2.5 cm in length.
3. Tellina sp.: Tellina are bivalve mollusks (Tellinidae) with a smooth, flat, elongated shells and a tentacled mantles. The periostracum is most commonly pink. However, individuals with white or yellow shells were also observed.
4. Lucine sp.: A bivalve of Lucinidae is small in size, with a shiny milky-white outer shell. The periostracum is very thin and translucent. The ligament is mostly horny brown.
5. Pharus legumen (Lunnaeus, 1758): it is a bivalve mollusc (Solenidae) with a rectilinear, elongated shell. The valves are more or less solid and open at both ends. The grayish-white shell was covered with a brown periostracum.
6. Abra alba (W. Wood, 1802): This species of bivalve (Semelidae) has a white, fragile shell. Its size could reach 25 mm but averages 15 mm.
7. Venus verrucosa: Praire is a species of bivalve mollusc (Veneridae) with a thick, even shell and pronounced concentric striations ranging in color from yellowish-white to grayish-white.
8. Dosinia lupinus (Lunnaeus, 1758): It is a shiny bivalve (Veneridas) with a discoid, symmetrical, flattened, thick shell and strongly marked concentric growth streaks.
9. Donax trucunlus (Lunnaeus, 1758): A bean-shaped bivalve (Donacidae) with a virtually smooth outer surface. The periostracum is adherent, pale yellow to olive-beige, translucent and shiny.
10. Mytilus edulis (Lunnaeus, 1758): Mussel is a bivalve (Mytilidae) with a bluish-black, sometimes brown or brown, oblongshell. The valves are symmetrical and the shell is elongated, pointed at the front and widened at the back. The shell is covered by a thick, robust periostracum.
3.1.2 Gastropod species
11. Tritia reticulata (Lunnaeus, 1758): This is a gastropod (Nassariidae) with a pointed conical shell, brown, greenish-brown, yellowish-brown and gray in color. It has spiral ribs and ridges. The shell has several turns.
12. Turritella communis (Risso, 1826): It is a gastropod (Turritellidae) with a very narrow, conical shell that resembles the end of a tendril with up to 19 turns. Each turn has growth ridges. Shell color ranges from white to all shades of brown. It is rarely found intact, as its tapered tip is very fragile.
13. Cymbium olla (Linnaeus, 1758) (volute): The species is a gastropod (Volutidae) with a medium-sized (up to 200 mm high), rolled, cylindroid shell and a relatively solid, thick test. Pale or ivory-cream colored, darker inside the opening, except along the labre. The pleated part of the columella is light orange, more rarely pinkish.
14. Conus sp (Cones): Cones are medium to large, cone-shaped gastropods (Conidae) with spectacular shell ornamentation. The shell apex may be rounded, flat, domed, pointed or have several points.
15. Pugilani morio: This gastropod (Melongenidae) has a strongly marked posterior siphonal canal, which can sometimes be tubular or spiny. The shell is generally thick and highly ornamented with nodules, warts and nodosities. The teleoconch is brown or black and without periostracum.
16. Gibbela cineraria: This species of gastropod (Trochidae) has a cone-shaped shell, with 5 to 6 turns and a maximum height of 15 mm. It has a smooth, yellowish surface with brown, purple or brown streaks covering the entire shell, even the underside.
17. Bursa crumena: This is a species of mollusc (Bursidae) with a strongly marked posterior siphonal canal, which can sometimes be tubular or spiny. Their shells are highly ornamented with nodules, warts and nodosities. The teleoconch is brown or white and without periostracum.
18. Murex trucunlus: This gastropod (Muricidae) measureds up to 5 cm. Its shell was brown, yellow or greenish, with prominent angular spires. The oval opening has a fairly long siphonal edge.
19. Euspira catena: this gastropod of the Naticidae has a globular shell about 20 mm high. The shell is smooth, with fine, uniform cream-gray accretion streaks, decorated with a spiral row of small brown to violet oblique grooves or flames on the first turns of the spiral.
20. Tereba anomala: A gastropod (Terebridae) long and wide, more ventrally shaped than average (the base is sometimes almost ovoid), but always tapering. It is white with dark brown spots in 2 sub-sutural rows (alternating one thick and one thin), and paler spots underneath.
21. Undefined species: This species is a medium-sized gastropod covered with a yellowish periostracum. All the identification keys at our disposal did not allow us to clearly identify this species.
3.2 Spatial distribution of species and villages during harvesting
Assumptions of the PCA as the linearity and the correlation adequacy were validated via Kaiser-Meyer-Olkin (Overall MSA>0.6) and Bartlett’s sphericity tests (p-value < 0.001). To address scale differences, variables were standardized (z-scores). Axes 1 and 2 of the PCA accounted for 15% and 19% of the observed variance, respectively, totaling 34% (Figure 2A). The sampling sites were projected onto a two-dimensional factorial plane based on the PCA results. Some sites (S3, S16, S17 and S2) were well represented on axes 1 and 2, while others were fairly or poorly represented (Figure 3A).
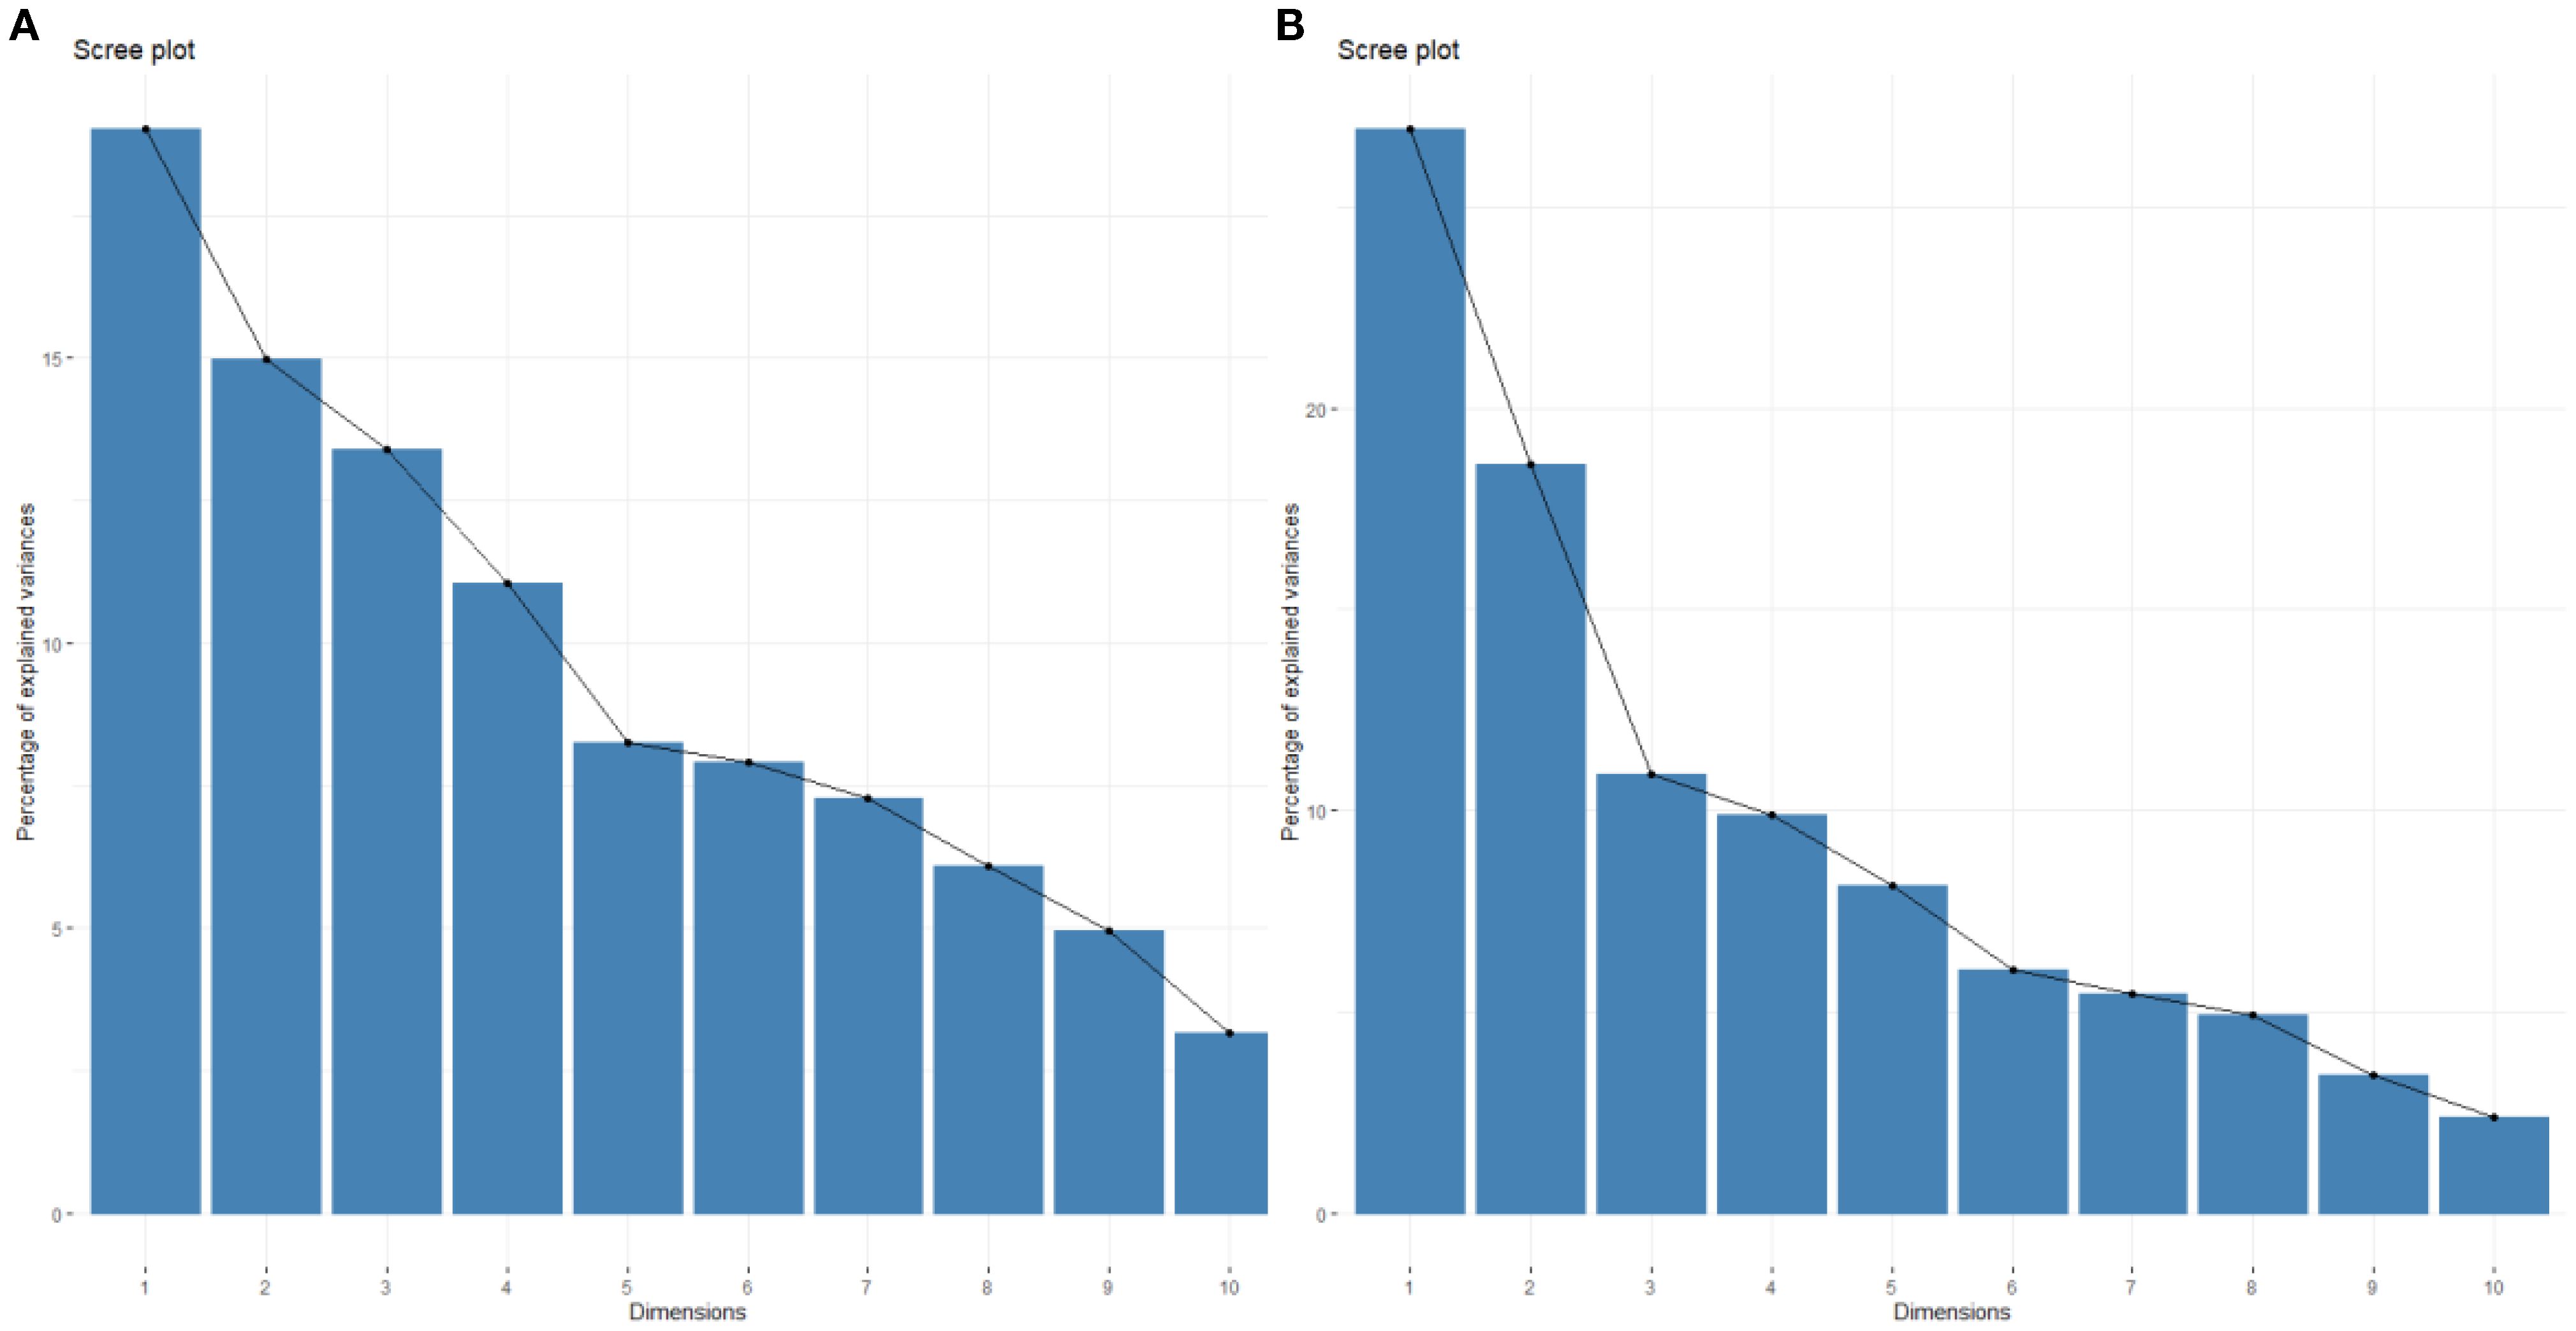
Figure 2. Percentage of variance explained by the different axes of the Principal Component Analysis of the results for the harvesting period (A) and the biological recovery period (B).
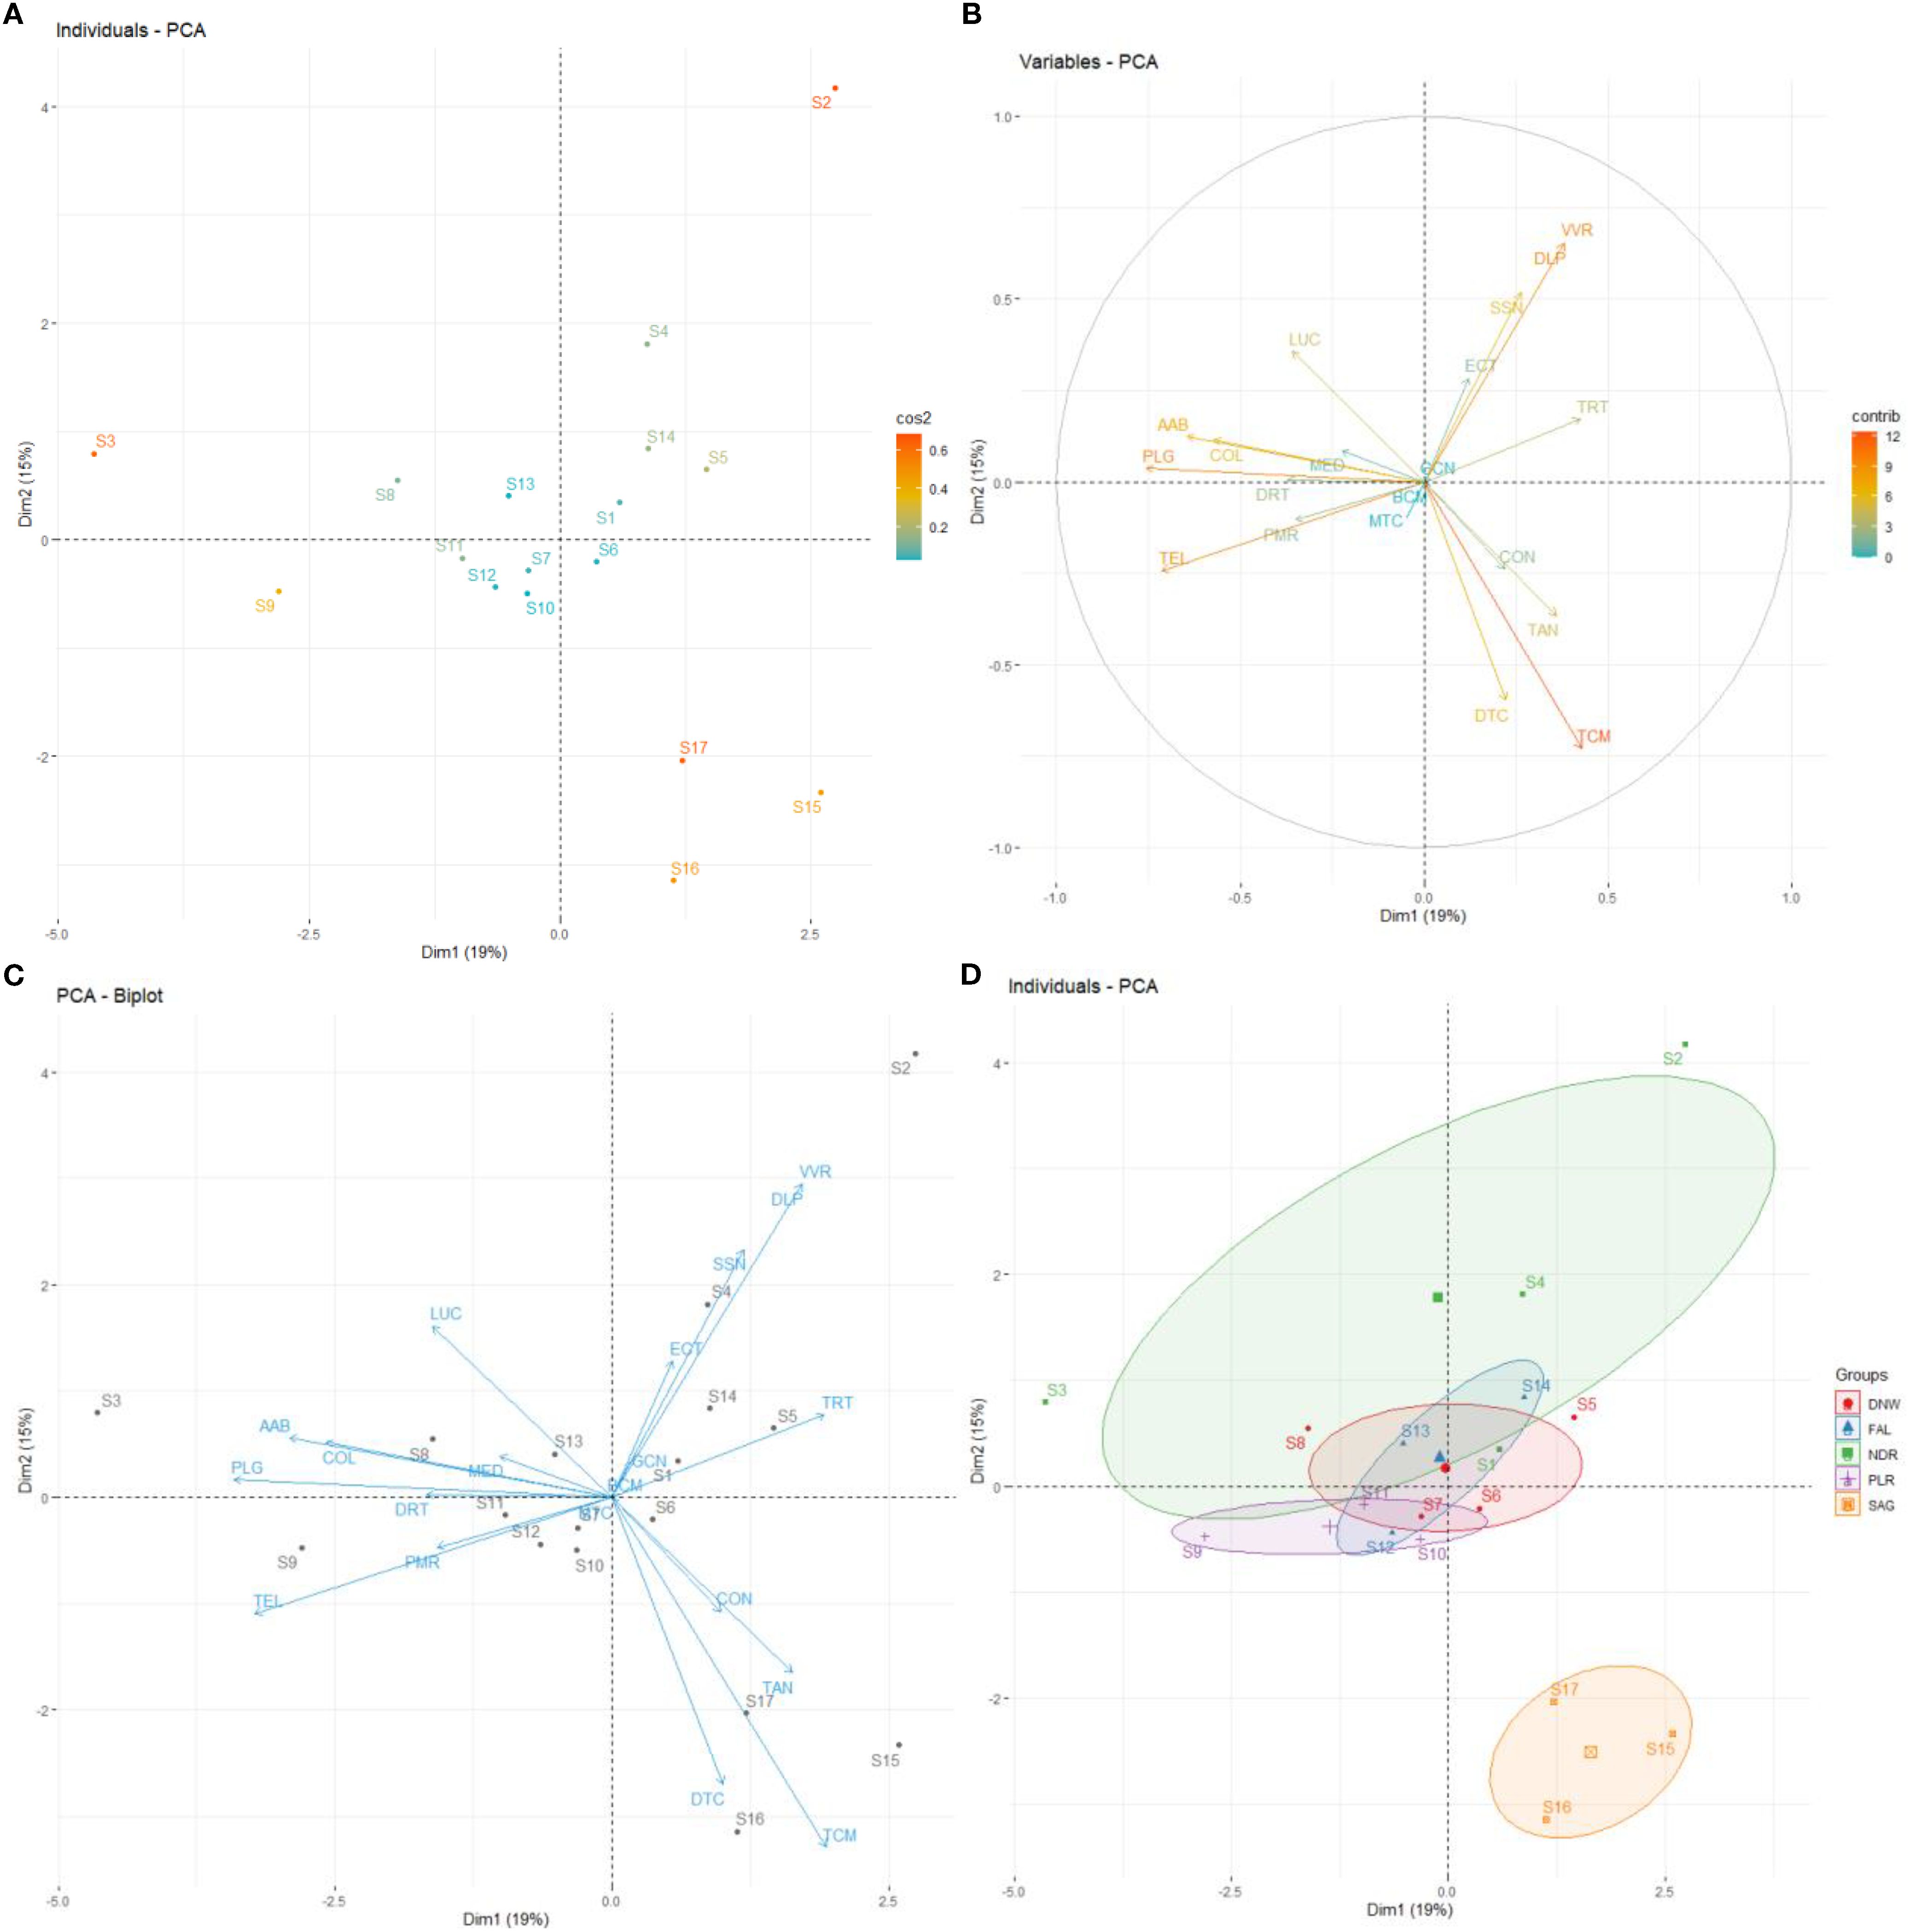
Figure 3. PCA on a two-dimensional factorial design for mollusc data from the harvesting phase. The PCA shows the distribution of the different sites sampled (A), and the species identified according to their abundance (B, C). NDR: Niodior; DNW: Dionewar; PLR: Palmarin; FAL: Falia; SAG: Sangomar. SSN: Senilia senilis; DRT: Diplodonta rotundata; TEL: Telline sp; LUC: Lucine sp; PLG: Pharus legumen; AAB: Abra alba; VVR: Venus verrucosa; DLP: Dosinia lupines; DTC: Donax trucuntus; MED: Mytilus edulis; TRT: Tritia reticulata; TCM: Turritella communis; COL: Cymbium olla; CON: Conus sp; PMR: Pugilani morio; GCN: Gibbela cineraria; BCM: Bursa cremena; MTC: Murex trucunlus; ECT: Euspira catena; TAN: Tereba anómala. The PCA shows also the clustering of species into groups (D).
Certain species, such as Turritelle commune (TCM), Donace trucunlus (DTC), Tellina sp. (TEL) were well represented on axes 1 and 2, while others are less represented (Figure 3B). The distribution of species across the sampling stations indicated that the position of certain stations (e.g. S3) was mainly explained by specific species (e.g. PLG, AAB), while other stations (e.g. S9) are associated with different species (e.g., TEL, PMR) (Figure 3C).
Villages, like Dionewar, Falia and Palmarin, formed a unique sub-group in the center of the two-dimensional factorial plane, while Niodior and Sangomar formed two distinct groups (Figure 3D). There were slight differences between the villages within the central group, and Niodior partially overlapped with Falia and Dionewar. Sangomar was well isolated from the other groups. The shellfish species composition in the villages reflected similarities in species distribution and abundance across the area.
3.3 Species and village distribution during biological rest period
The axis 1 explained 18.6% of the observed variance, while axis 2 explained 26.9%. Together, they account for 45.5% of the variance (Figure 2B).
Most stations were poorly represented and clustered around the origin of the graph. However, stations S15 and S4 stood out as well-represented, being separated from the others by axis 1 (Figure 4A).
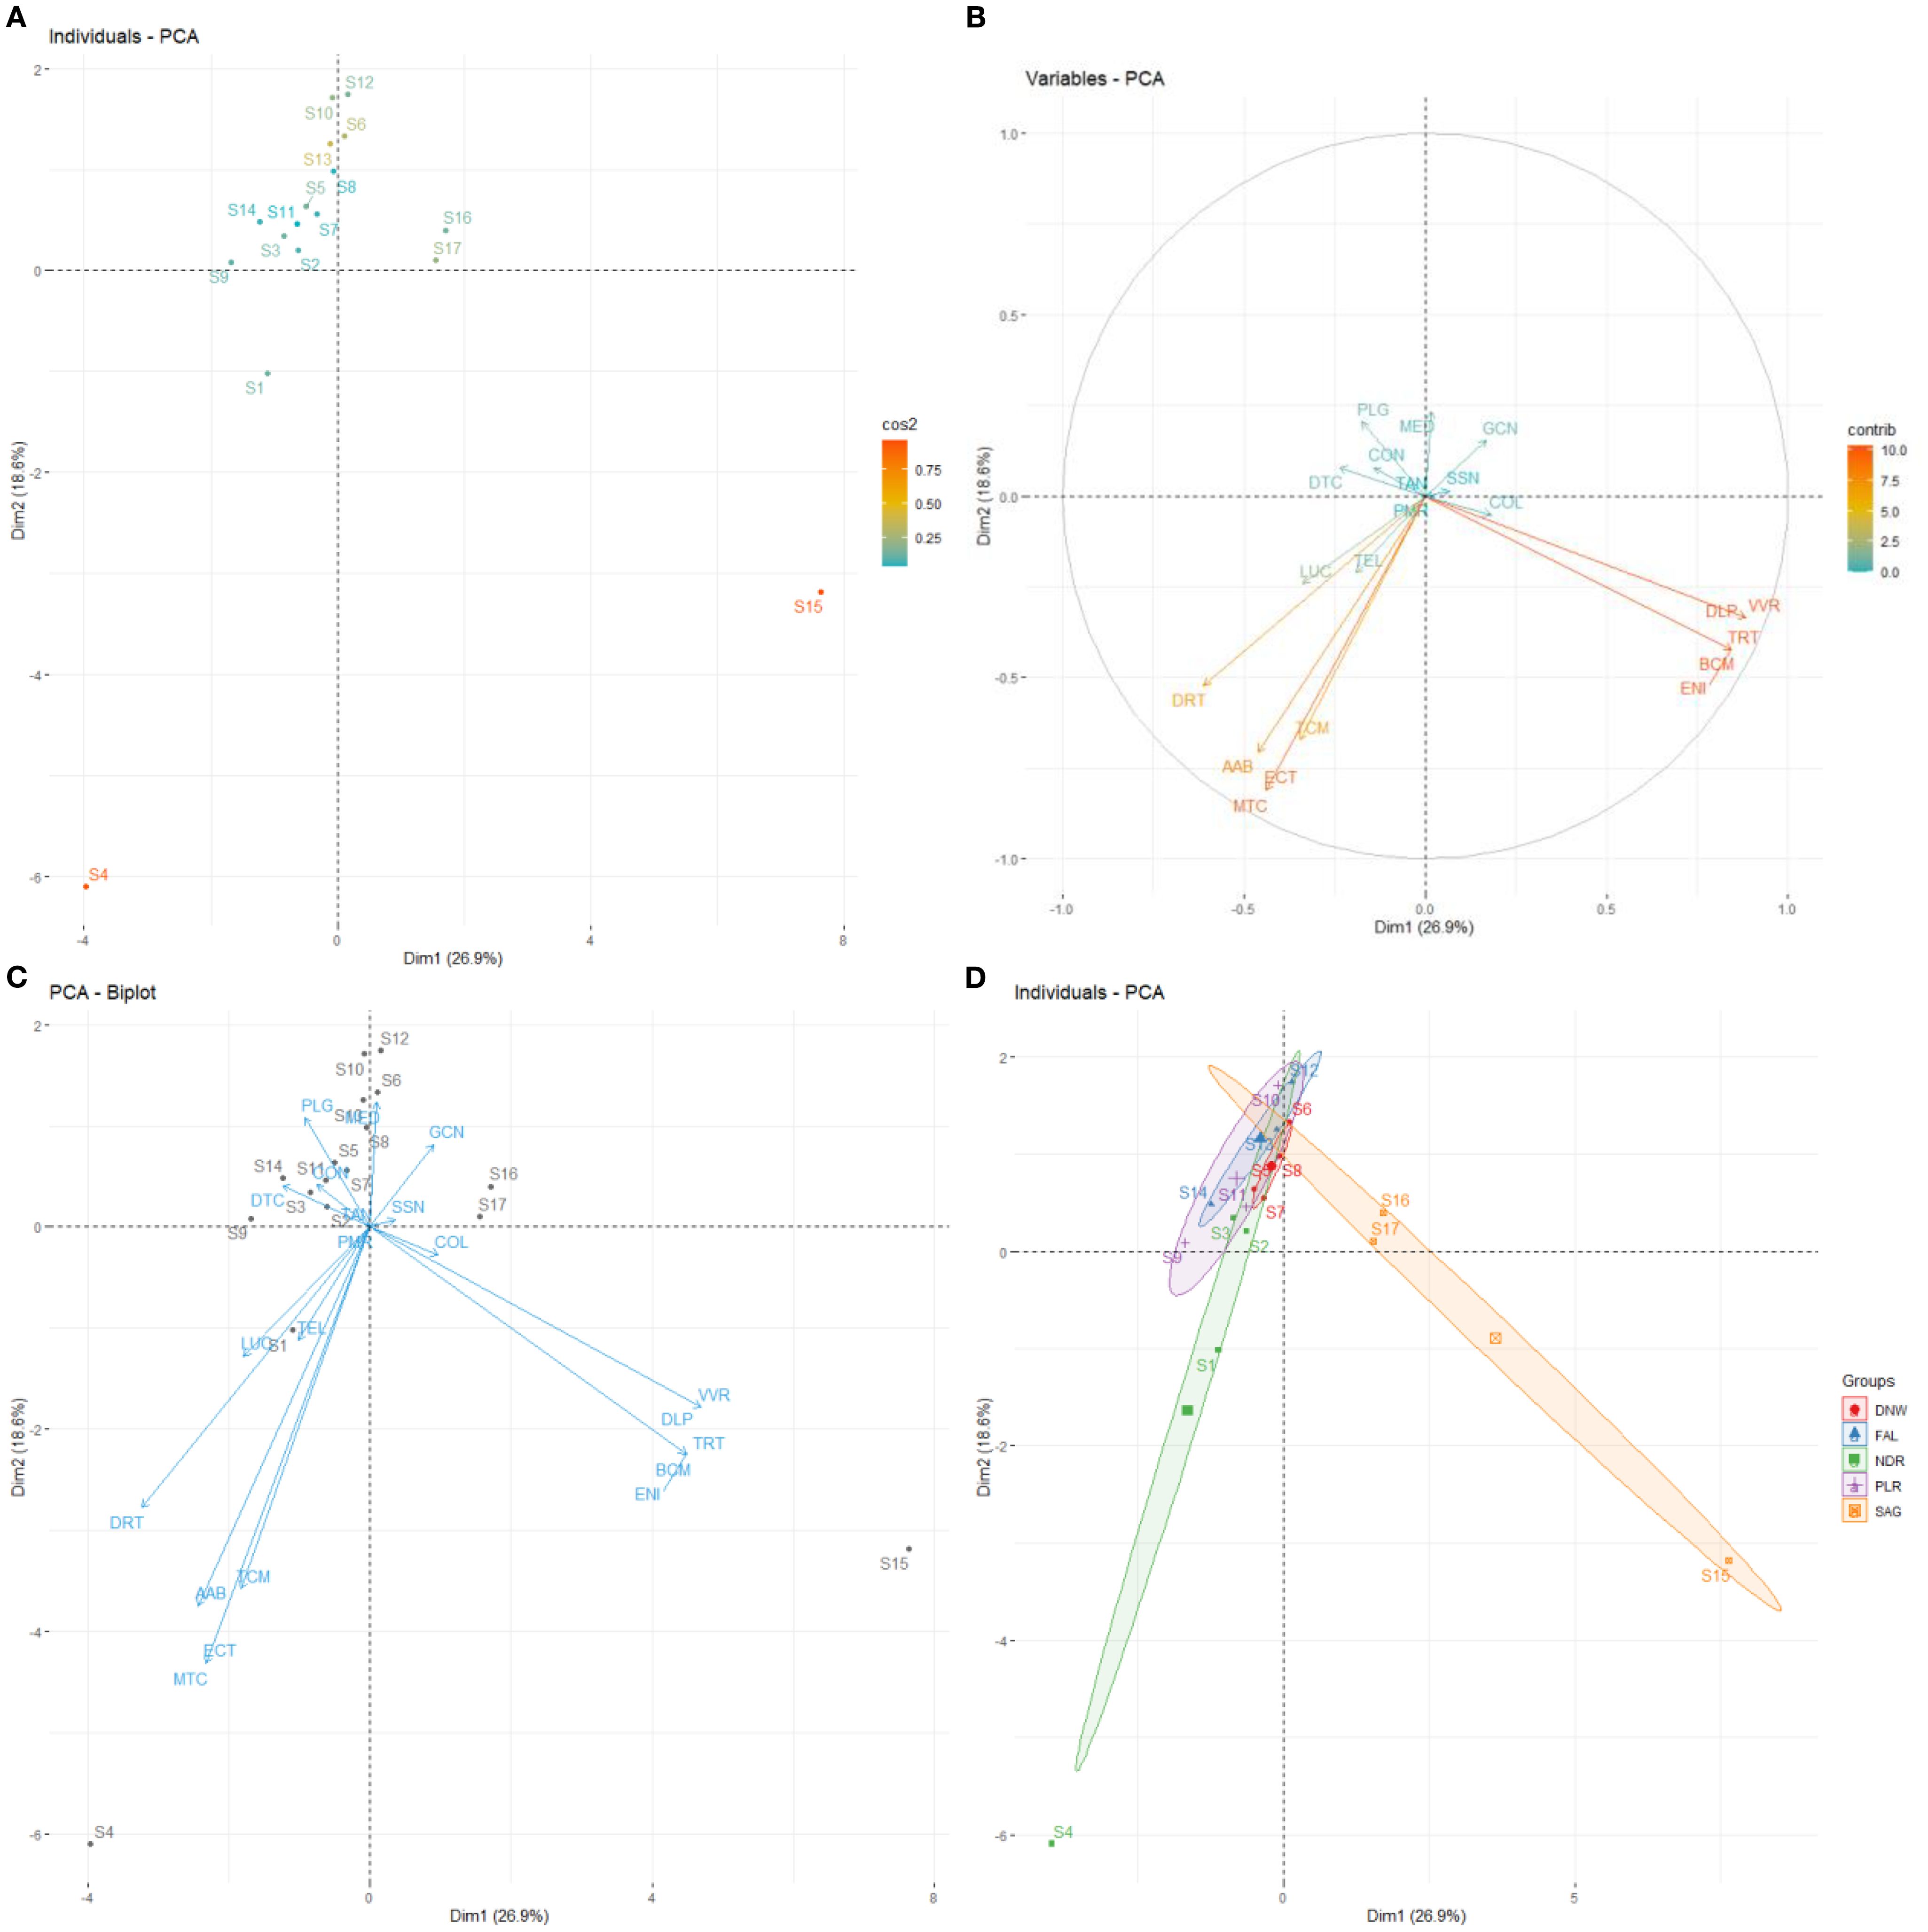
Figure 4. PCA on a two-dimensional factorial plane (axis 1 and axis 2) for mollusc data from the biological rest period. The PCA shows the distribution of the different sites sampled (A), and of the species identified according to their abundance. (B, C). NDR: Niodior; DNW: Dionewar; PLR: Palmarin; FAL: Falia; SAG: Sangomar. SSN: Senilia senilis; DRT: Diplodonta rotundata; TEL: Telline sp; LUC: Lucine sp; PLG: Pharus legumen; AAB: Abra alba; VVR: Venus verrucosa; DLP: Dosinia lupines; DTC: Donax trucuntus; MED: Mytilus edulis; TRT: Tritia reticulata; TCM: Turritella communis; COL: Cymbium olla; CON: Conus sp; PMR: Pugilani morio; GCN: Gibbela cineraria; BCM: Bursa cremena; MTC: Murex trucunlus; ECT: Euspira catena; TAN: Tereba anómala; ENI: Undefined species. The PCA reveals the categorization of species into groups (D).
Some species (VVR, DLP, ENI, BCM and TRT) were separated from others (MTC, ECT, TMC, AAB and DRT) by axis 2 (Figure 4B). These species were associated with specific stations. Stations S15, S16 and S17 were associated with some species, while stations S4 and S1 are associated with different species (Figure 4C). Villages like Sangomar and Niodior formed distinct groups, but some stations within Niodior overlapped with those of the central villages (Figure 4D). Other villages formed less distinguished groups close to the origin.
When all data from both harvesting and rest periods are combined, villages Dionewar, Falia, and Palmarin formed a central group, while Niodior and Sangomar each formed distinct groups (Figure 5). Part of Niodior overlapped with the central villages, and Sangomar was well isolated from the others.
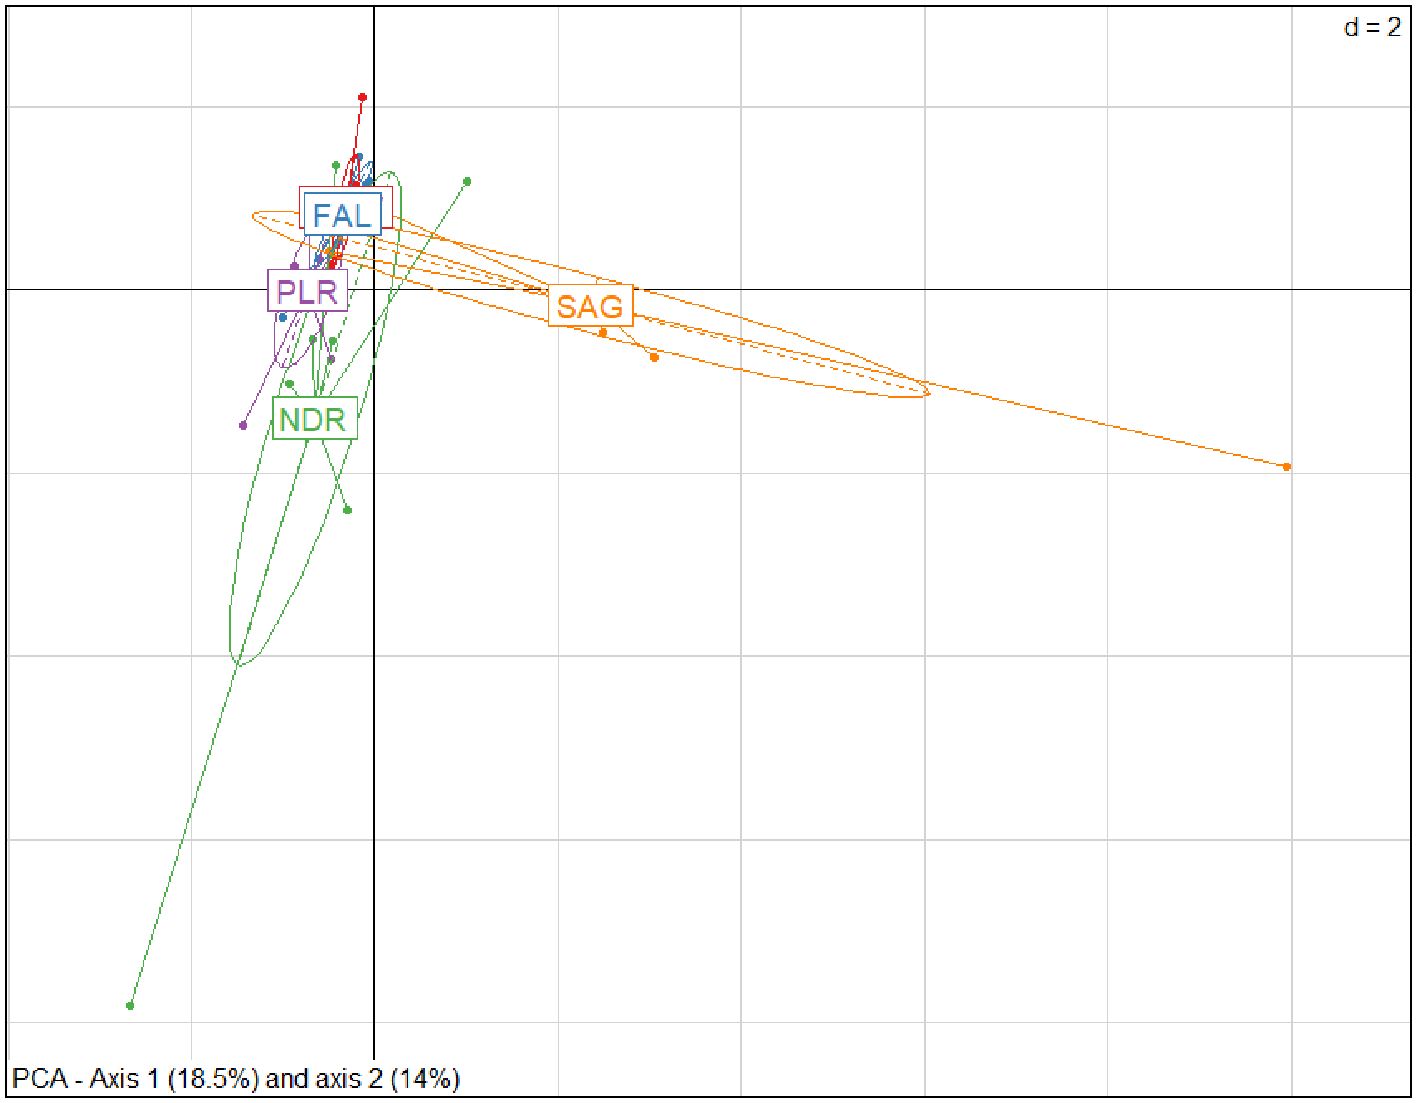
Figure 5. PCA on a two-dimensional factorial plane (axis 1/horizontal and axis 2/vertical) of molluscs data (exploitation and biological rest phases combined) showing the geographical groups identified as a function of species abundance.
3.4 Ecological indicators
A total of 21 species were recorded during the sampling campaigns. Interestingly, the number of species recorded was slightly higher during the harvesting phase (21 species) compared to the biological rest period (19 species). Species richness varied among different sampling stations. Station S15 stood out with the highest species richness, recording 12 species. It is followed by stations S4, S12, and S16 followed closely with 9 species each and then by stations S1, S2, S8, S13 and S17 (8 species each). Conversely, stations S6 had the lowest species richness, with only 2 species.
When comparing species richness between villages using all data from both harvesting and rest periods combined, we found that Niodior, Sangomar had higher specific richness compared to Palmarin, Falia and Dionewar. Specifically, the total number of species in Sangomar and Niodior was 15, with Falia and Dionewar recording 10, and Palmarin having 12.
3.4.1 Species occurrence and abundance
Table 1 showed the distribution of species collected during the harvesting period and the biological rest phase in the villages that were studied. Overall, the distribution and abundance of species vary across different villages and between the harvesting phase and the biological rest phase. S. senilis exhibits strong dominance throughout both phases, being most abundant during the harvesting phase, especially in Falia, and during the biological rest period in Dionewar (Figure 6). D. rotundata is also abundant but moderately present during both phases, with higher abundance in Palmarin and Niodior during harvesting and more abundant in Niodior during biological rest period (Figure 6). Species like Tellina sp (Figure 6), Conus sp and Cymbium olla have a moderate Abundance. Tellina sp, found in all target villages during both phases, is more abundant in Niodior and Palmarin, while Conus sp and Cymbium olla have a wide distribution, being present in all locations during either the harvesting season, the biological rest period, or both. Several species including A. alba, P. legumen, Lucine sp, Tellina sp, D. lipinus, D. trucunlus, M. edulis, T. reticulata, V. verrucosa, T. communis 6), Conus sp, C. olla, P. morio, E. catena and T. anomala have a low abundance (Figure 6). They are poorly represented or not recorded at all. Some species like T. communis, B. crumena, T. anomala, and an unidentified species ENE (Figure 6) were not recorded at all.
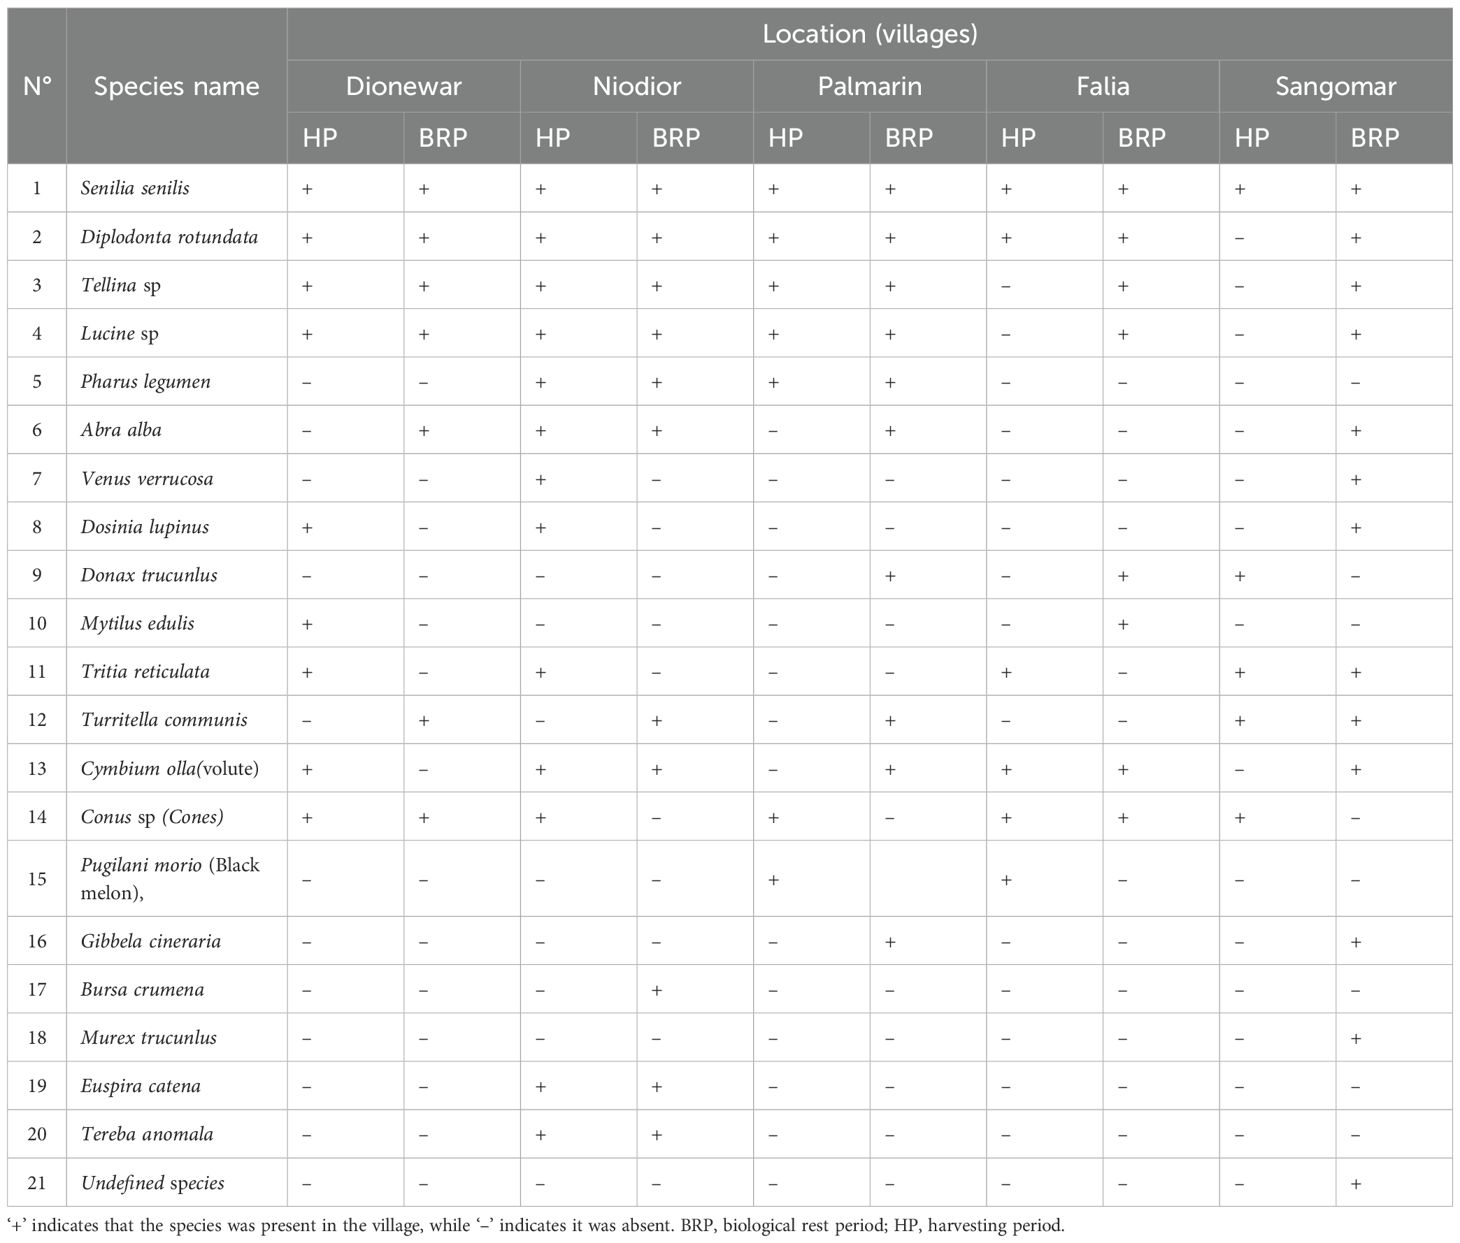
Table 1. Species present in the villages studied during the harvesting and biological rest period.
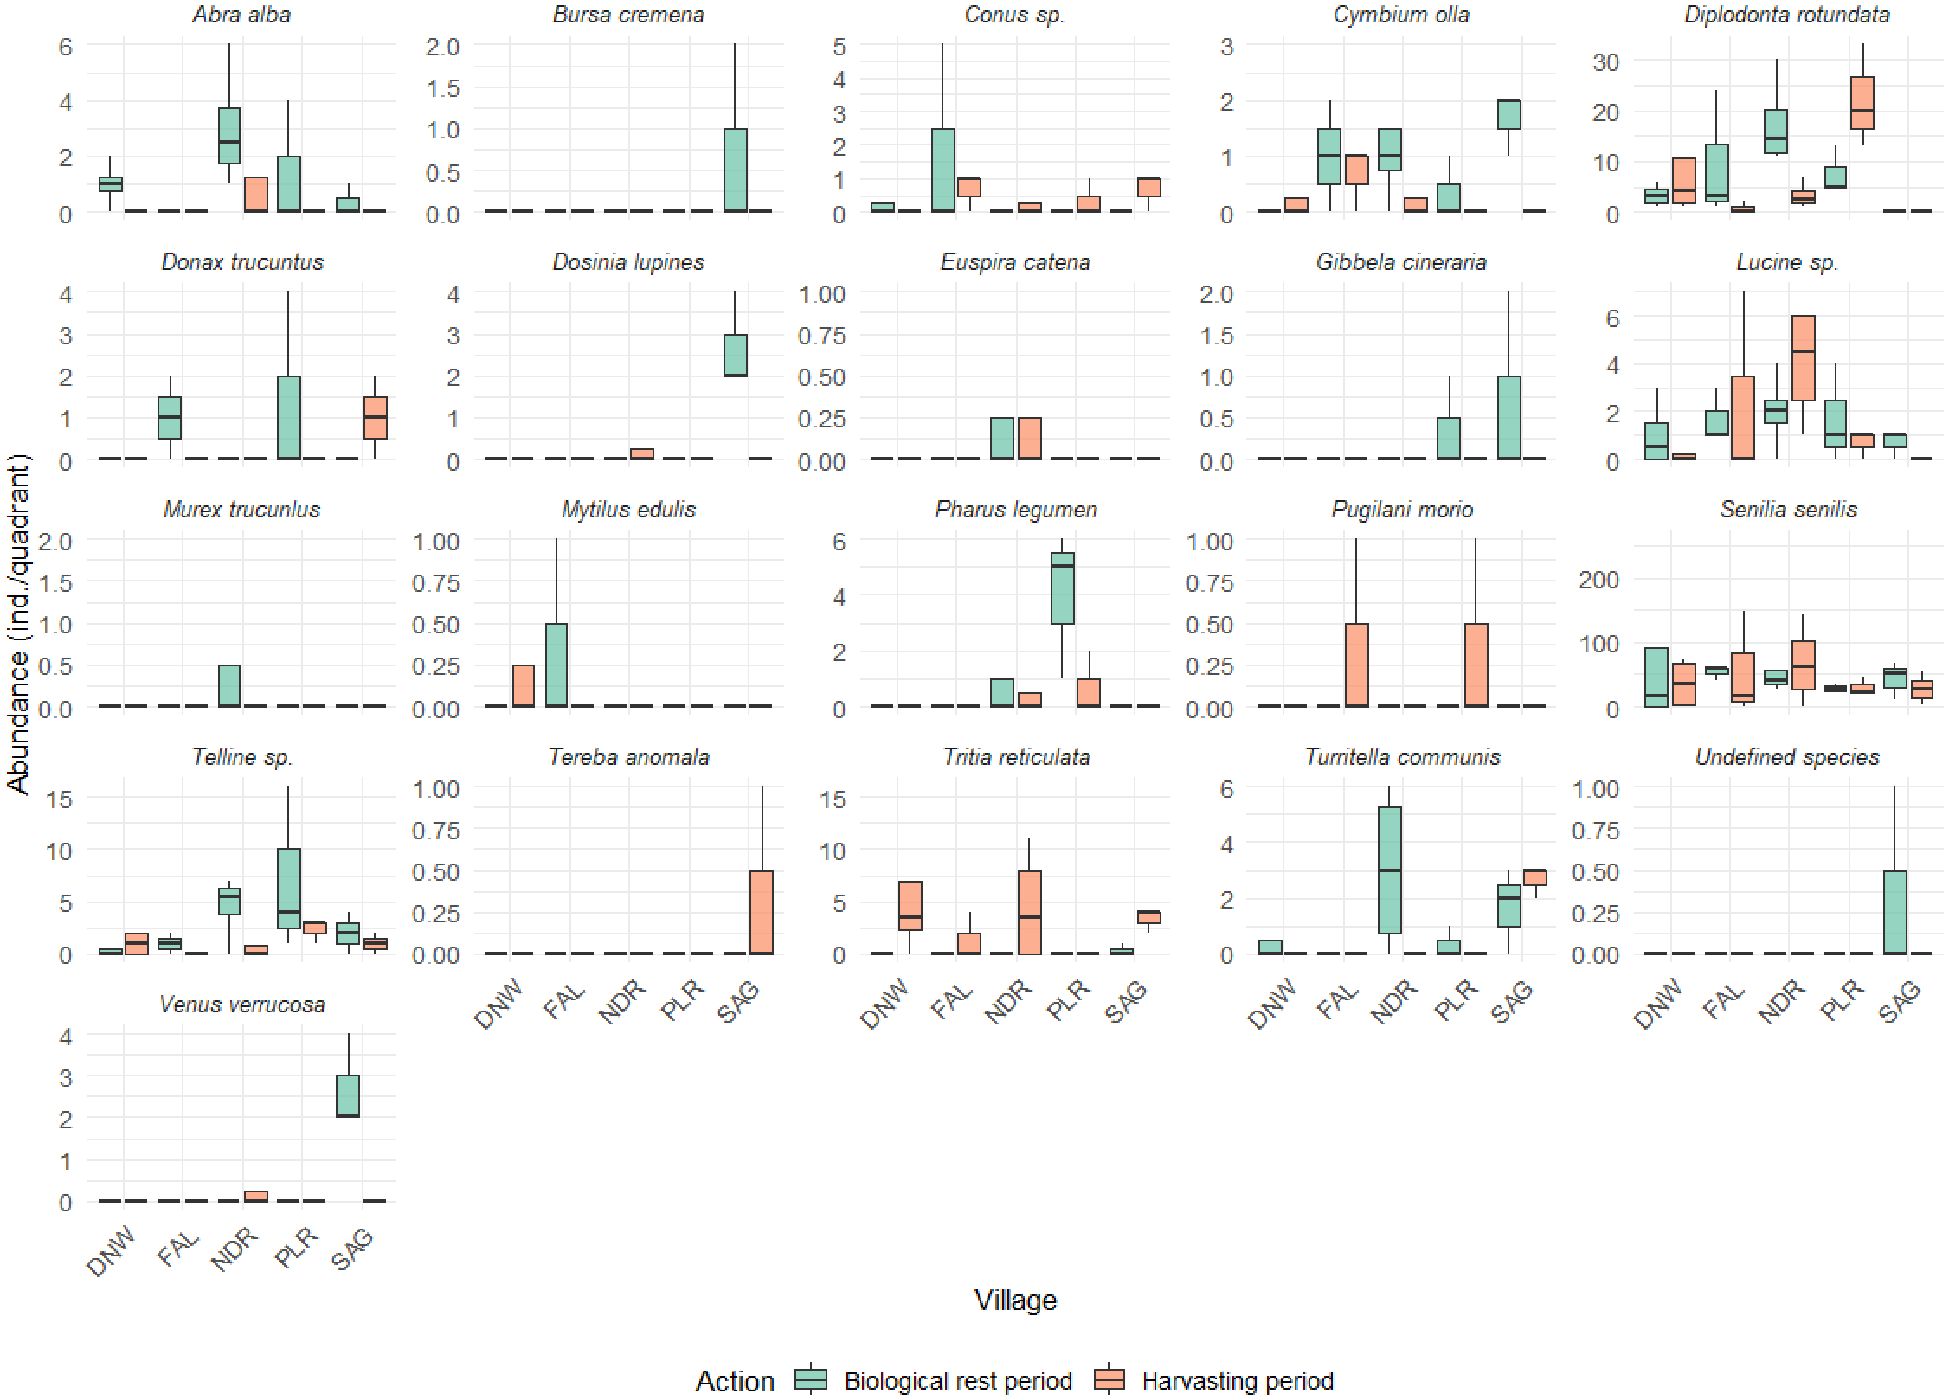
Figure 6. Abundance of species sampled in the five villages during the biological rest period and the harvesting period.
The results also show seasonal variation in species abundance, with certain species being present only in the harvesting season and other only during the biological rest period or during both phases. For example, Tellina sp. and Lucine sp. are present in all locations but are found in Falia and Sangomar only during the biological rest period. Bursa crumena, Euspira catena, and Tereba anomala are only found in Niodior, while Murex trucunlus and an undefined species are only present in Sangomar (Figure 6).
3.4.2 Simpson dominance and evenness indices
Simpson’s dominance index was higher when diversity was lower. In this case, the calculated Simpson’s diversity index is 0.564, which is slightly above 0.5. This value suggested a diversity of stands with a dominance of some species. Specifically, S. senilis is identified as the dominant species, followed by D. rotundata. Other species are poorly represented and distributed more or less evenly. Frequency analyses indicated S. senilis and D. rotundata were more abundant. The evenness index calculated for all data, covering both sampling and campaigns, was 0.16. This low value of the evenness index reflected high dominance. Overall, the comparisons between villages and seasons showed that the Simpson’s dominance and evenness indices were slightly higher in Niodior and Palmarin (Table 2). They were also moderately higher during the biological rest period (BRP) compared to the harvesting period (HP).
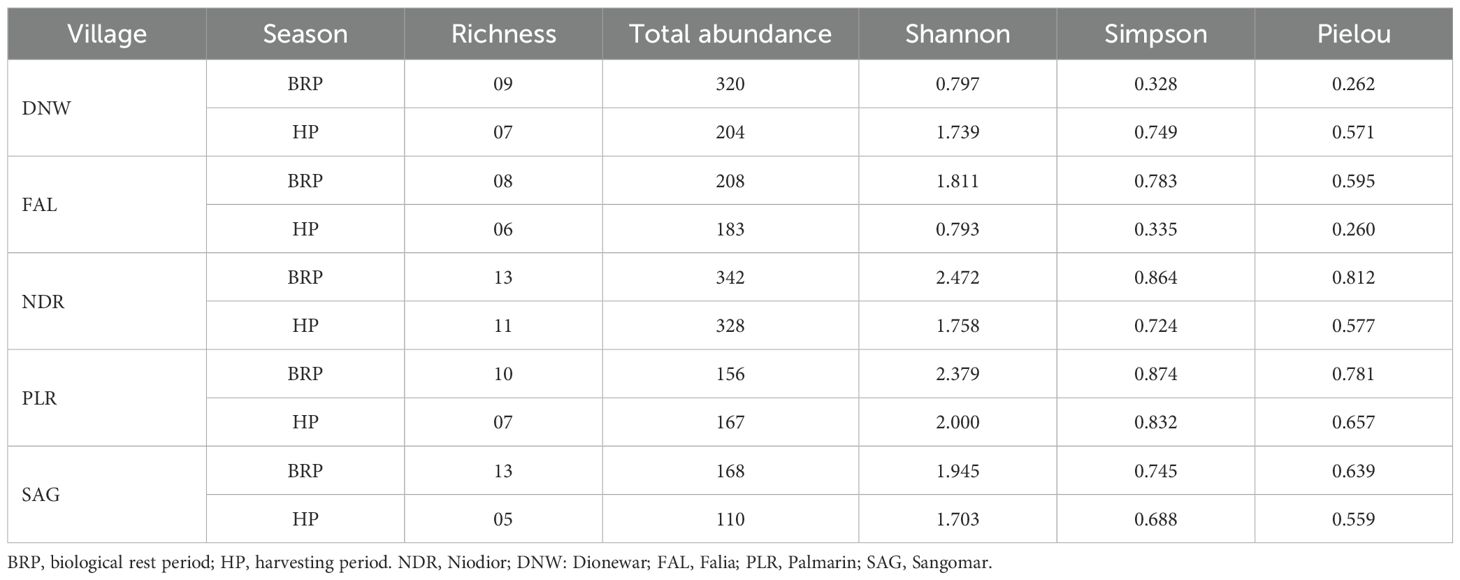
Table 2. Diversity indices by village and season.
3.4.3 Hill and Shannon diversity indices
This index, which is an exponential transformation of Shannon’s diversity index (H’), has a value of 1.61 across the two sampling campaigns. It reflects the overall diversity within the study area. The reciprocal of Simpson’s index and Shannon-Weaver index also yielded a value of 1.77 over the two campaigns, similarly indicating population diversity. The most diverse stations – each hosting 12 species – are S1, S2, S4, S8, S12, S13, S15, S16, and S17, with S15 standing out as the richest in species. Overall, comparisons between village showed that Niodior (NDR) and Palmarin (PLR) have the highest species diversity than Falia (FAL), Dionewar (DNW), and Sangomar (SAG). The BRP has higher species diversity compared to the HP, except in the DNW where it is lower than the HP (Table 2).
Discussion
Overall, the results of this study highlight the complexity of factors influencing the distribution and abundance of mollusk species in the Saloum Delta and emphasizes the need for further investigation to fully understand these dynamics. The Saloum Delta displays spatial heterogeneity (Sadio, 1991), which influences the distribution of aquatic species, especially bivalve mollusks and gastropods. The study observed fluctuations in the abundance and distribution of mollusks both spatially (across different stations and villages) and temporally (during harvesting and biological rest phases). The Delta is identified as a highly productive environment for bivalve mollusks, particularly S. sinelis. This productivity is attributed to favorable environmental conditions for the establishment and proliferation of these species. The nature of the seabed (substrate) plays a significant role in the distribution of mollusk populations in the estuaries of the Sine-Saloum. Different substrates influence their occupation patterns. The 21 species identified in this study are structured into three groups based on geographic locations (Sangomar, Dionewar-Falia-Palmarin, and Niodior). This structure into three groups likely reflects differences in species richness and abundance among these locations rather than just distances between them. The variations in species distribution and abundance, as well as their grouping into geographic clusters, may be influenced by physico-chemical factors, bathymetric distribution, and hydrology of the delta.
Bivalves
Many bivalve species found in this study, especially those with higher market value or those more accessible to collectors (like S. senilis and Tellina sp), face high exploitation pressures. Our results show that overfishing of larger individuals is particularly pronounced during the harvesting season, which can lead to size-class imbalances and threaten the sustainability of populations. Some species show signs of resilience to exploitation, likely due to either their low environmental requirements or the absence of major predators.
Species such as S. senilis (“arch”) show resilience to adverse environmental conditions like dewatering, deoxygenation, and wide variations of temperatures and salinities (10-28‰, up to 50‰) in the Saloum Delta (Benga, 2006; Emerit, 2005). The spawning eurythermal and euryhaline species occurs in June-July, aligning with the rainy season (Debenay et al., 1994; Diouf et al., 2010; Le Loeuff and Zabi, 1993), and larvae settle at depths less than 3 m (Lavaud et al., 2013). Over-exploitation, particularly near villages, leads to significant population pressures. Despite this, S. senilis remains abundant, possibly due to a lack of major predators aside from Trygon margarita. Another highly exploited species is Tellina sp, a species that prefers fine sand and gravel bottoms. It is more concentrated in remote areas, avoiding human settlements. Indeed, individuals found during the harvesting phase tend to be smaller, reflecting intensive exploitation of larger individuals. However, this intensive exploitation during the harvesting period does not significantly impact the species’ overall abundance, likely due to its low environmental requirements. In contrast, D. rotundata, which is not heavily exploited, is therefore abundant. Its reproduction occurs during the harvesting season. The species is widely distributed throughout the delta, except for Sangomar Island, where it thrives on sandy-muddy bottoms. Compared to D. rotundata, Lucine sp is widely distributed, though sparse in Sangomar. Likewise, D. trucunlus is more concentrated in specific areas like Sangomar but also Falia. Both species show signs of exploitation, with smaller individuals collected during the harvesting phase. However, D. trucunlus is more adapted to dissipative beaches and hydrodynamic forces (Bayed, 1998), which may explain its sparse distribution.
In other species such as Abra alba, the heaviest exploitation specifically at the start of the season does not significantly affect size distribution. This tolerant vascolous species that tolerate environment overloaded with organic matters (Bakalem and Romano Isma, 1988; Dauvin, 1998) is found mainly in muddy and sandy-muddy bottoms. A. alba is more concentrated during the resting phase and shows larger individuals during this period. Alongside these abundant and intensively exploited species, some species fluctuate in abundance. This is the case of P. lugumen found only at Niodior fluctuates in abundance, which may be due to its poor adaptation to estuarine conditions. Larger individuals are typically found during the biological rest phase, coinciding with reproduction. The same apply to V. verrucosa which has low abundance probably because it is poorly adapted to the environmental conditions of the delta, especially in areas of human exploitation. Its slow reproduction and late sexual maturity may also contribute to its low presence. Dosinia lipinus rarely found in the studied area also has low population density. The intensive collection during the harvesting season likely contributes to the low abundance of this rare species, which inhabits coarse sands in deeper areas and mainly concentrated on specific mudflats like Mbossndokh. Another rarely found species is Mytilus edulis. Preferring firm surfaces like rocks and boat hulls, M. edulis rarely settles on muddy bottoms. Its distribution is influenced by spawning triggers related to temperature and food availability. The species was found in low concentrations during the harvesting phase, with only a few large individuals. Similarly, the ENI species was found exclusively in Sangomar with low concentrations and small size variation, indicating poor adaptation to the environmental conditions of the area.
Gastropods
Several gastropod species, including T. reticulata and C. olla, experience intra-specific competition, particularly in areas with high exploitation. This competition, combined with intense harvesting pressure, can lead to a decline in the population of larger individuals. Indeed, many species are heavily exploited during the harvesting period, which coincides with their reproductive cycles. This exploitation, especially of larger individuals, can significantly affect their population structure and long-term viability. The distribution of gastropod species is also influenced by geographical position and environmental conditions specific to each mudflat. For example, species like Conus sp. are absent from certain areas (e.g., Dionwar) but thrive in others due to better environmental conditions. Similarly, species like E. catena are restricted to certain locations, possibly due to bathymetric preferences or environmental tolerance.
T. reticulata is the most abundant gastropod in the delta, found on all mudflats. The species has low environmental requirements and is adaptable to various substrates, including sandy bottoms, cobbles, and rocky areas. Its population fluctuates with locality and season, peaking during the biological resting period where individuals result from summer reproduction. However, larger individuals are less abundant in remote mudflats due to overexploitation on nearby sites and intra-specific competition.
Other gastropod species such as T. communis, C. olla, and P. morio exhibit low abundance and a relatively uniform distribution across mudflats. Larger individuals are more likely to be found during the biological resting phase, possibly due to surface collection and exploitation by female collectors. C. olla is particularly sought after for local consumption, leading to its population collapse by the end of the season. Small individuals are more prevalent during the biological resting period, with intra-specific competition observed at specific sites like Ndiatiaré and Sas.
M. trucunlus, T. anomala, B. crumena, and G. cineraria are poorly distributed. They are found only at Niodior and Sangomar, likely due to their poor adaptation to the environmental conditions of the delta. These species prefer deeper habitats, with a bathymetric distribution extending to depths over 30 m. They reproduce towards the close of the season (May-June for M. trucunlus, June-September for T. anomala), and may be intensively collected during the harvesting period. However, they were absent from samples during the exploitation phase, suggesting that they are not heavily targeted during this time.
E. catena was not sampled during the biological rest period but was present in low numbers during the harvesting season. Its reproduction occurs at the end of March, coinciding with the exploitation period. E. catena has a limited distribution, possibly due to poor adaptation to local environmental conditions and its preference for bathymetric depths of up to 120 m. In contrast, Conus sp. is well-distributed across the delta, except for Dionwar, suggesting it is highly adapted to the local environment. Despite its wide distribution, it is rare in samples, with only one individual collected per site, likely due to its high demand among collectors for both commercial and scientific purposes. Conus sp. also inhabits bathymetric depths of up to 20 m.
The main drawback of this study is the taxonomic uncertainty, particularly for the ENI collected in this study. While species discrimination based on morphology using existing keys in the literature allowed identification of all except one of the species collected, a molecular characterisation study is required for species validation, including the ENI. Integrating molecular characterisation using DNA barcoding with morphological identification will enable more accurate taxonomy and species identification, which is essential for the conservation and management of mollusc stocks in the Saloum Delta. Such studies are necessary because mollusc species can display great plasticity, leading to a differential response to different local environmental conditions. Moreover, further studies involving measurements of environmental parameter and sediment characteristics are required that to statically assess their links to PCA grouping. Although it is well known that salinity levels are higher in the upstream than in the downstream parts of the inverse Saloum estuary, this parameter was not measured, which can be considered as a limitation of this study. The same applies for other physicochemical variables such as temperature, pH and dissolved oxygen as well as sediment characteristics, which should be statically evaluated for their links with biodiversity indices.
Conclusion
This study reveals that the spatial distribution of mollusc species in the Saloum Delta varies significantly across different zones and is influenced by a combination of factors, including physico-chemical parameters, bathymetry, hydrology, and species-specific ecological behaviors. Although the Saloum Delta constitutes a highly productive environment for both bivalves and gastropods, certain species exhibit low densities on the foreshore, likely due to limited adaptation to prevailing environmental conditions.
Despite their high abundance, species such as Donax rotundatus, Tellina sp., and Tivela reticulata remain underexploited along the Senegalese coast - particularly in the Saloum Delta - primarily due to their low economic value and the corresponding lack of scientific attention. In contrast, species such as Venus verrucosa, Timoclea anomala, Tellina communis, and an unidentified species (ENI) are subject to harvesting pressure by female shellfish gatherers, despite their relative rarity and low abundance.
Given the evidence of exploitation pressure, especially on vulnerable species, there is an urgent need to develop and implement species-specific management plans. These plans should include measures to address the overexploitation of key taxa such as ark clams and cockles, notably by introducing minimum size limits for harvesting (e.g., banning collection of ark clams smaller than 25 mm and cockles under 20 mm), and restricting the sale and consumption of undersized individuals.
Additionally, the collection of other ecologically important but rare species—such as Mactra truncata, Pitar morio, and Callista chione - should be limited or temporarily suspended to prevent further population decline. Conservation strategies should also promote the valorization of currently underutilized species such as T. reticulata and T. communis, thereby encouraging sustainable exploitation and enhancing their economic value.
Lastly, existing management measures - such as biological rest periods and gear selectivity - should be updated and reinforced to ensure their continued effectiveness in conserving mollusc populations. With these targeted actions and forward-looking strategies, future research and co-management initiatives can contribute significantly to the sustainable use and long-term conservation of molluscan resources in the Saloum Delta. Such a co-management should be implemented and conducted with local communities and authorities. However, the stakeholders need to be involved in defining and discussing the terms and feasibility of this co-management, including adaptive quotas and awareness campaigns.
Data availability statement
The original contributions presented in the study are included in the article/Supplementary Material. Further inquiries can be directed to the corresponding author.
Ethics statement
The manuscript presents research on animals that do not require ethical approval for their study.
Author contributions
MTi: Conceptualization, Supervision, Methodology, Resources, Validation, Writing – original draft. MTh: Writing – review & editing, Methodology, Formal analysis. MN: Writing – review & editing, Methodology, Investigation. SF: Supervision, Writing – review & editing. MS: Supervision, Writing – review & editing, Validation.
Funding
The author(s) declare financial support was received for the research and/or publication of this article. The authors thank the Gaston Berger University for the financial support that allowed to conduct this study.
Conflict of interest
The authors declare that the research was conducted in the absence of any commercial or financial relationships that could be construed as a potential conflict of interest.
Generative AI statement
The author(s) declare that no Generative AI was used in the creation of this manuscript.
Any alternative text (alt text) provided alongside figures in this article has been generated by Frontiers with the support of artificial intelligence and reasonable efforts have been made to ensure accuracy, including review by the authors wherever possible. If you identify any issues, please contact us.
Publisher’s note
All claims expressed in this article are solely those of the authors and do not necessarily represent those of their affiliated organizations, or those of the publisher, the editors and the reviewers. Any product that may be evaluated in this article, or claim that may be made by its manufacturer, is not guaranteed or endorsed by the publisher.
Supplementary material
The Supplementary Material for this article can be found online at: https://www.frontiersin.org/articles/10.3389/fmars.2025.1657130/full#supplementary-material
References
Albert D. D. A., Bujeng V., and Chia S. (2022). Identification of mollusc remains (Bivalve and gastropod) from archaeological sites in semporna, sabah. TLSR 33, 197–237. doi: 10.21315/tlsr2022.33.2.10
Bakalem A. and Romano Isma J. C. (1988). Les peuplements benthiques du port d’Aiger 1 - les Mollusques (Athens: CIESM Congress 1988).
Diéye El. B., Diaw A., Sané T., and Ndour N. (2013). Dynamique de la mangrove de l’estuaire du Saloum (Sénégal) entre 1972 et 2010 ». Cybergeo: European Journal of Geography [En ligne], Environnement, Nature, Paysage, document 629, mis en ligne le 09 janvier 2013, consulté le 05 septembre 2025. doi: 10.4000/cybergeo.25671
Bayed A. (1998). “Variabilité de la croissance de Donax trunculus sur le littoral marocain,” in Dynamique des populations marines Zaragoza. Ed. Lleonart J. (CIHEAM Cahiers Options Méditerranéennes, Maroc), 35.
Benga A. G. F. (2006). “Anadara senilis (L. 1758) dans la réserve de biosphère du delta du Saloum,” in Perspectives d’exploitation rationnelle (Thèse de Doctorat 3ème cycle UCAD, Dakar, Senegal), 371p.
Caughley G. and Sinclair A. R. E. (1994). Wildlife ecology and management. J.O. Wolff, G. Caughley, A.R.E. Sinclair. Blackwell Sci. 64, 420.
Chahouri A., Yacoubi B., Moukrim A., and Banaoui A. (2023). Bivalve molluscs as bioindicators of multiple stressors in the marine environment: Recent advances. Continent Shelf Res. 264, 105056. doi: 10.1016/j.csr.2023.105056
Cormier-Salem M. C., Bernatets C., and Sarr O. (2010). “Mangrove system sustainability: public incentives and local strategies in West Africa,” in Tropical Deltas and Coastal Zones: Food Production, Communities and Environment at the Land and Water Interface. Eds. Hoanh C. T., Szuster B., Kam S., Ismail A., and Noble A. (CABI, UK), 409–421. doi: 10.1079/9781845936181.0409
Dahou T. (2010). Gérer l’espace sans gouverner les hommes : le dilemme des Aires marines protégées (Anthropologie et sociétés hal-02281146, Saloum, Senegal).
Dauvin J.-C. (1998). The fine sand Abra alba community of the bay of morlaix twenty years after the Amoco Cadiz oil spill. Mar. pollut. Bull. 36, 669–676. doi: 10.1016/S0025-326X(98)00058-7
Debenay J.-P., Pages J., and Guillou J.-J. (1994). Transformation of a subtropical river into a hyperhaline estuary: The Casamance River (Senegal) - palaeogeographical implications. Palaeogeogr Palaeoclimatol Palaeoecol. 107, 103–119. doi: 10.1016/0031-0182(94)90167-8
de Morais L. T. (2011). Convention de recherche entre l’IRD et la FIBA - Programme “Femmes et Co- quillages”, volet Recherche/Écologie ([Rapport de recherche] IRD Dakar, Senegal), 38. hal-01483078.
Diouf M., Allain G., Sarr A., and Cadot N. (2010). Guide de suivi participatif des coquillages exploités en Afrique de l’Ouest (FIBA, FFEM et AFC, UCAD, Dakar, Senegal).
Emerit P. (2005). “Etude préliminaire d’un plan de gestion des coquillages au sein d’une aire marine protégée dans le Sine-Salou, Sénégal,” in Mémoire de master (Ecolé supérieur d’Agro-Développement International, Cergy-Pontoise, France). 86p.
Hallett C., Hobday A., Tweedley J., Thompson P., Mcmahon K., and Valesini F. (2018). Observed and predicted impacts of climate change on the estuaries of south-western Australia, a Mediterranean climate region. Reg. Environ. Change 18. doi: 10.1007/s10113-017-1264-8
Hill M. O. (1973). Diversity and evenness : A unifying notation and its consequences. Ecology 54, 427–432. doi: 10.2307/1934352
Hopkins H. L. and Kennedy M. L. (2004). An assessment of indices of relative and absolute abundance for monitoring populations of small mammals. Wildlife Soc. Bull. 32, 1289–1296. doi: 10.2193/0091-7648(2004)032[1289:AAOIOR]2.0.CO;2
Jolliffe I. T. (2002). Principal Component Analysis, second edition (New York: Springer-Verlag New York, Inc).
Kantoussan J., Ecoutin J. M., Simier M., de Morais L. T., and Laë R. (2012). Effects of salinity on fish assemblage structure: An evaluation based on taxonomic and functional approaches in the Casamance estuary (Senegal, West Africa). Estuarine Coast. Shelf Sci. 113, 152–162. doi: 10.1016/j.ecss.2012.07.018
Kaushal S. S., Likens G. E., Pace M. L., Utz R. M., Haq S., Gorman J., et al. (2018). Freshwater salinization syndrome on a continental scale. Proc. Natl. Acad. Sci. U. S. A. 115, E574–E583. doi: 10.1073/pnas.1711234115
Koutsoubas D., Galinou-Mitsoudi S., Katsanevakis S., Leontarakis P., Metaxatos A., and Zenetos A. (2007). Bivalve and gastropod molluscs of commercial interest for human consumption in the Hellenic Seas. In Papaconstantinou C., Zenetos A., Tserpes G., and Vassilopoulou V. (eds) State of the Hellenic Fisheries. (Athens: HCMR Publ).
Kreeger D. A., Gatenby C. M., and Bergstrom P. W. (2018). Restoration potential of several native species of bivalve molluscs for water quality improvement in mid-atlantic watersheds. J. Shellfish Res. 37, 1121. doi: 10.2983/035.037.0524
Lapègue S., Renault T., Béchemin C., Soizick L. G., Stavrakakis C., and Rivet F. (2016). RAPPORT D’ACTIVITES 2015 de l’Unité SG2M Santé, Génétique et Microbiologie des Mollusques (Département RBE – Ressources Biologiques et Environnement Unité SG2M – Santé, Génétique et Microbiologie des Mollusques, IFREMER, France) 77.
Lavaud R., Thébault J., Lorrain A., van der Geest M., and Chauvaud L. (2013). Senilia senilis (Linnaeus 1758), a biogenic archive of environmental conditions on the Banc d’Arguin (Mauritania). J. Sea Res. 76, 61–72. doi: 10.1016/j.seares.2012.11.003
Le Loeuff P. and Zabi G. S. F. (1993). Revue des connaissances sur la faune benthique des milieux margina-littoraux d’Afrique de l’Ouest Troisième partie : discussion et conclusions. Reo. Hydrobiol Trop. 26, 127–137.
Lewin I., Tarkowski A., Sugier P., Płaska W., Buczyńska E., and Buczyński P. (2024). Drivers for the diversity of mollusc communities in unique calcareous fen habitats. Diversity 16, 350. doi: 10.3390/d16060350
Liu S., Xue Q., Xu H., and Lin Z. (2021). Identification of main oyster species and comparison of their genetic diversity in zhejiang coast, south of yangtze river estuary. Front. Mar. Sci. 8. doi: 10.3389/fmars.2021.662515
López-Alonso R., Sánchez O., Fernández-Rodríguez I., and Arias A. (2022). Diversity and distribution of bivalve molluscs in the Central Cantabrian Sea and the Avilés Canyons System (Bay of Biscay). Estuarine Coast. Shelf Sci. 273, 107907. doi: 10.1016/j.ecss.2022.107907
Malahayati E. (2024). Diversity, evenness, and richness of mollusc on the peh pulo beach, blitar regency. EduMatSains 9, 246–257. doi: 10.33541/edumatsains.v9i1.5983
Mohamed Moctar S. M., Ramos A., Castillo S., and Ramil F. (2023). Biodiversity and assemblages of molluscs (Gastropoda and Bivalvia) from coastal and deep-sea soft-bottoms off Mauritania. Deep Sea Res. Part I: Oceanog Res. Papers 195, 103985. doi: 10.1016/j.dsr.2023.103985
Moraitis M. L., Tsikopoulou I., Geropoulos A., Dimitriou P. D., Papageorgiou N., Giannoulaki M., et al. (2018). Molluscan indicator species and their potential use in ecological status assessment using species distribution modeling. Mar. Environ. Res. 140, 10–17. doi: 10.1016/j.marenvres.2018.05.020
Ndiaye H. G. (1992). “Application à la télédétection à l’étude de l’évolution des écosystèmes,” in Des bassins des fleuves Saloum et Casamance (Rapport. Chercheur Associé, ORSTOM, Dakar, Senegal), 36.
Ndoye F. and Moity-Maizi P. (2010). “Femmes et Coquillages” pour une gestion durable des ressources conchylicoles dans le Delta du Saloum au Sénégal,”. 116th Seminar, October 27-30, 2010 (Parma, Italy 95207: European Association of Agricultural Economists).
Nel H. A., Perissinotto R., and Taylor R. H. (2012). Diversity of bivalve molluscs in the st lucia estuary, with an annotated and illustrated checklist. Afr. Inverteb 53, 503–525. doi: 10.5733/afin.053.0210
Pagès J. and Citeau J. (1990). Rainfall and salinity of a Sahelian estuary between 1927 and 1987. J. Hydrol, 325–341. doi: 10.1016/0022-1694(90)90182-W
Panfili J., Thior D., Ecoutin J. M., Ndiaye P., and Albaret J. J. (2006). Influence of salinity on the size at maturity for fish species reproducing in contrasting West African estuaries. J. Fish Biol. 69, 95–113. doi: 10.1111/j.1095-8649.2006.01069.x
Sidoumou Z., Gnassia-Barelli M., Siau Y., Morton V., and Roméo M. (2006). Heavy metal concentrations in molluscs from the Senegal coast. Environ. Int. 32, 384–387. doi: 10.1016/j.envint.2005.09.001
Sadio S. (1991). Pédogenèse et potentialités forestières des sols sulfatés acides salés des tannes du Sine Saloum, Sénégal. Paris: ORSTOM, 283 p. Th. Doc. : Landbouwetenschaffen, Wageningen.
Sousa R. (2024). A brief global agenda for advancing the study of molluscs. Front. Ecol. Evol. 12. doi: 10.3389/fevo.2024.1176380
Van Der Schatte Olivier A., Jones L., Vay L. L., Christie M., Wilson J., and Malham S. K. (2020). A global review of the ecosystem services provided by bivalve aquaculture. Rev. Aquacult 12, 3–25. doi: 10.1111/raq.12301
Voultsiadou E., Koutsoubas D., and Achparaki M. (2010). Bivalve mollusc exploitation in Mediterranean coastal communities: An historical approach. J. Biol. Res. 13, 35–45.
Wijsman J. W. M., Troost K., Fang J., and Roncarati A. (2019). “. Global production of marine bivalves. Trends and challenges,” in Goods and services of marine bivalves. Eds. Smaal A. C., Ferreira J. G., Grant J., Petersen J. K., and Strand Ø. (Springer International Publishing, Cham), 7–26. doi: 10.1007/978-3-319-96776-9_2
Keywords: biological rest, diversity, estuary, harvesting, mollusc, Saloum of delta
Citation: Tine M, Thiaw M, Ngom M, Faye SMBD and Sembene M (2025) Distribution and diversity of commercial mollusc species at shallow depths in the Saloum delta, Senegal. Front. Mar. Sci. 12:1657130. doi: 10.3389/fmars.2025.1657130
Received: 01 July 2025; Accepted: 18 August 2025;
Published: 12 September 2025.
Edited by:
Kerstin Johannesson, University of Gothenburg, SwedenReviewed by:
Guogui Chen, Xiamen University, ChinaIzzati Adilah Azmir, Universiti Teknologi MARA, Malaysia
Copyright © 2025 Tine, Thiaw, Ngom, Faye and Sembene. This is an open-access article distributed under the terms of the Creative Commons Attribution License (CC BY). The use, distribution or reproduction in other forums is permitted, provided the original author(s) and the copyright owner(s) are credited and that the original publication in this journal is cited, in accordance with accepted academic practice. No use, distribution or reproduction is permitted which does not comply with these terms.
*Correspondence: Mbaye Tine, bWJheWUudGluZUB1Z2IuZWR1LnNu