 Michelle Barreto-Bailet1,2
 Salvador Jerez1
 José M. García-Beltrán3,4
 Beatriz C. Felipe1Ana Galindo1,2
 Elena Chaves-Pozo3
 M. Virginia Martín1*
- 1Physiology and Welfare of Marine Species Group (PHYSIS), Centro Oceanográfico de Canarias (COC-IEO), CSIC, Santa Cruz de Tenerife, Spain
- 2Departamento de Biología Animal, Edafología y Geología, Universidad de La Laguna, La Laguna, Spain
- 3Physiology and Welfare of Marine Species Group (PHYSIS), Centro Oceanográfico de Murcia (COMU-IEO), CSIC, Murcia, Spain
- 4Immunobiology for Aquaculture Group, Department of Cell Biology and Histology, Faculty of Biology, University of Murcia, Murcia, Spain
Seriola dumerili is a fast-growing species under culture conditions with significant potential for diversification of marine aquaculture. The interest in this species raises new challenges for its culture, such as the design of suitable procedures and appropriate conditions in order to determine the adequate operational parameters for animal welfare, which will also allow the generation of management protocols that guarantee these conditions. These parameters include stocking density and photoperiod, which can be decisive in the welfare of the farmed fish. Therefore, the overall objective of this study was to investigate the combined effect of different culture conditions (stocking density and photoperiod) on different biochemical indicators of stress, including plasma and skin mucus parameters, immune response, oxidative damage and antioxidant response in S. dumerili. Adult specimens were divided into four groups and maintained under two stocking densities (2.5 kg m-³ and 5.0 kg m-³) and two photoperiods (12L:12D and 16L:8D) (n=9 for each condition). The results showed that after 30 days, there were no negative effects on the growth performance of fish stocked at higher density or long photoperiod. There were also no changes in plasma stress markers or immune parameters. However, under long photoperiod, higher cortisol levels were found in skin mucus, along with alterations in antioxidant activities in key tissues such as liver or gills, as well as, lipid peroxidation in liver, brain and muscle, indicating some degree of oxidative stress. In contrast, variations in different stocking densities did not lead to significant alterations in these parameters. This study offers new insights into the mechanisms involved in the stress response of S. dumerili, aiming to evaluate different culture conditions and determine stress-inducing factors for this species.
1 Introduction
Greater amberjack (Seriola dumerili, Risso 1810) is a promising candidate for marine aquaculture development due to its high-quality meat, high market price and rapid growth (normally reaching more than 6 kg after 2.5 years of culture) (Mazzola et al., 2000). Despite the encouraging qualities shown by amberjack, there is still limited research available on the stress-inducing factors affecting this species. This includes the effects of diverse culture conditions, such as temperature, photoperiod, stocking density, and water quality, all of which can influence the health and welfare of this species. In this context, it is essential to provide suitable rearing conditions, particularly regarding stocking density and photoperiod, to promote their overall welfare.
Each teleost species has a specific response to a given stressor, which can also vary significantly depending on its intensity and duration (Schreck, 2010). Light influences the entire life cycle of teleost fishes, as it does for most living organisms in a rhythmic environment shaped by the Earth’s rotation and its orbit around the Sun (Villamizar et al., 2011; Wei et al., 2019). Internal clocks have evolved in almost all organisms as an adaptative response to environmental cycles. When external rhythms synchronize with the internal clocks of animals, their behavior, growth performance, and health status significantly improve (Reebs, 2011). These fundamental rhythms provide an internal representation of day length and optimize physiology and behavior to meet the demands of photoperiod (Boeuf and Le Bail, 1999).
In an artificial aquaculture system, the photoperiod is crucial for aquatic species, as it plays an important role in a variety of biological processes, including survival, growth performance, metamorphosis, foraging behavior, and gonadal development (Puvanendran and Brown, 2002; Blanco-Vives et al., 2010; Imsland et al., 2018). Moreover, photoperiod can influence the ability to visualize food, the utilization of energy derived from feeding, and even the social behavior of farmed fish, which in turn affects both growth and survival (Al-Emran et al., 2024). The effect of seasonal cycles on fish physiology has been widely demonstrated (Bowden et al., 2007), and an imbalance in it can cause chronic stress. In general, an optimal photoperiod must be provided for normal development and growth, which should be specific for each fish species in accordance with its habits (Wei et al., 2019). Additionally, manipulating photoperiod regimes such as short days (6L:18D) and long days (18L:6D) has been used to control growth, and stress responses in various fish species (Al-Emran et al., 2024).
Additionally, factors as fish stocking density have been shown to influence fish physiology and welfare (Ellis et al., 2002; Conte, 2004; Mylonas et al., 2010). The importance of stocking density as a critical husbandry factor in intensive aquaculture is widely acknowledged. The optimal stocking density for a given species varies, with both high and low densities negatively impacting the physiological responses of fish (Roy et al., 2021). Excessive stocking densities can lead to crowding stress, which negatively influences the growth performance, physiology, and welfare of many farmed fish (Liu et al., 2016; Datta et al., 2017). High stocking density has been found to result in growth inhibition, reduced flesh quality and disturbance of several serum biochemical parameters in tilapia (Oreochromis niloticus) (Wu et al., 2018). Also, elevated stocking densities inhibited the activity of metabolic and antioxidant enzymes in rainbow trout (Oncorhynchus mykiss) (Aksakal et al., 2011). In contrast, low stocking densities did not fully utilize the available culture space and therefore did not result in higher production and economic benefits (Zhu et al., 2011; Badiola et al., 2012; Hoseini et al., 2019, Hoseini et al., 2019; Wang et al., 2020). Thus, identifying the optimal stocking density for a specific farmed species is crucial.
Both, photoperiod and stocking density, have been identified as potential sources of chronic stress, which can impact multiple physiological functions such as metabolism, growth (Ellis et al., 2002; Portz et al., 2006), reproduction (Rodríguez-Barreto et al., 2014), immune response (Sneddon et al., 2016; Barreto et al., 2022) or the antioxidant system (Schreck and Tort, 2016), leading to disrupt homeostasis, diseases or even mortalities. However, the effects of stocking density and photoperiod have been scarcely studied in S. dumerili. A few previous studies have reported that lower stocking densities and longer photoperiod may enhance reproductive performance and hormonal regulation (Rodríguez-Barreto et al., 2017; Nyuji et al., 2018). Specifically, stocking densities of 5 kg m3 have been shown to negatively impact patterns of body lipid deposition (Rodríguez-Barreto et al., 2017). Also, high stocking densities can lead to increased aggression and reduce survival in S. dumerili juveniles (Miki et al., 2011). Otherwise, long photoperiods (18 hours light: 6 hours dark) have been shown to stimulate ovarian development in previtellogenic S. dumerili (Nyuji et al., 2018). In larvae, an 18L:6D photoperiod during the first 15–20 days resulted in improved survival and growth compared to shorter light periods (Hashimoto et al., 2013). However, there is currently a notable absence of direct studies investigating the synergistic effects of stocking density and photoperiod on this species.
In this context, the aim of this study was to evaluate the combined effect of stocking density and photoperiod on the welfare of S. dumerili specimens, in order to identify stress-inducing factors related to the rearing conditions in this species. To this end, we tested two photoperiod regimes (natural vs. 18L:6D) and two stocking densities (2.5 vs. 5 kg/m³). We assessed different stress biomarkers from skin mucus and plasma, humoral immune response in serum and oxidative stress in various tissues.
2 Materials and methods
2.1 Fish and experimental design
For this study, a group of 42 greater amberjacks (S. dumerili) fish (9.5 ± 1.6kg and 74.9 ± 4.3 cm) born in captivity in the experimental culture facilities of the Centro Oceanográfico de Canarias (COC-IEO), CSIC (28°29’56.1”N 16°11’44.2”W), were used. The fish were born and raised in captivity in an outdoor 500 m³ tank, which was supplied with seawater at an ambient temperature and photoperiod (10 renewals per day-1) until the start of the experiments in the experimental culture facilities. Each fish was individually identified with Passive Integrated Transponder (PIT) tags, and randomly distributed in 12 indoor tanks (3.0×3.0×1.0m; usable capacity 10 m3), with 3 fish per tank.
Four treatments (combination of two conditions for stocking density and two conditions for photoperiod) were evaluated with three replicates per treatment. Half of the fish were kept under a natural photoperiod (NP) regime increasing according to latitude, from 11 to 12 hours of daylight between the beginning and end of the study, while the other half were exposed to a long photoperiod (LP) regime with 18 h of light and 6 h of dark (18L:6D). The photoperiod was regulated by light sources that were programmed at the corresponding times and switched on and off progressively. To establish a 30-day experimental duration, the photoperiod was adjusted prior to the initiation of the experiment. In the long photoperiod (LP) treatment, the daylight duration was gradually increased by 20 minutes each day over a 15-day period, ultimately achieving the target photoperiod of 16 hours. Regarding stocking density, half of the fish were maintained at a density of 2.5 kg m-3 (lower density, LD), and the others at a density of 5.0 kg m-3 (higher density, HD). In all four treatments, there was no alteration in water temperature despite changes in photoperiod.
The tanks were maintained with a continuous seawater supply (100% renewal per hour). During the experiment (30 days), fish were fed to apparent satiety with commercial pellets, and daily fed intake (0.77 ± 0.14% biomass day-1), seawater temperature (19.4 ± 0.2°C) and dissolved oxygen (6.5 ± 0.1 mg L-1) were recorded once a day.
All experimental procedures were performed according to the EU Directive 2010/63/EU for animal experiments and the Spanish Executive Order 53/2013 for the protection of animals for experimentation or other scientific purposes. The experimental design was previously approved by the CSIC Ethical Committee (1208/2022) and authorized by the National Competent Authority.
2.2 Sampling collection
All fish were sampled four times within a month (n=9 for each condition). Before sampling, the fish were subjected to a 24-hour fast. At baseline (day 0) and at days 10, 20 and 30, fish were anaesthetized with chlorobutanol (0.3 mL L−1). Thereafter, total length and weight were measured, and blood was drawn from the caudal vessels using heparinized syringes and centrifuged at 12,000 rpm for 5 min to get rid of blood cells. Aliquots of the plasma samples were stored at -80°C until needed for hematological and biochemical analysis.
At the end of the experiment (day 30), all fish were sacrificed and samples of gills, brain, liver and muscle tissue were rapidly frozen in liquid nitrogen, and subsequently stored at -80°C until analysis.
2.3 Growth performance
During the study, the specific growth rate (SGR, % day-1), coefficient of variation for weight (CV, %), condition factor (CF, g cm-3) and hepatosomatic index (HSI, %) were determined as follows:
2.4 Stress biomarkers
The plasma biochemical parameters selected for the study were the most indicative of chronic stress and health status of fish, so changes in their levels will indicate an acute or chronic stress response (Barton et al., 2002; Schreck and Tort, 2016). Therefore, cortisol, glucose, lactate levels in plasma and skin mucus, the antioxidant activity levels, together with some activities related to the humoral immune response (bactericide, peroxidase, antiprotease and lysozyme activity) in plasma and the antioxidant response in tissues were analyzed.
2.4.1 Stress plasma and skin mucus parameters
Cortisol level in plasma and skin mucus was determined by using the cortisol competitive human ELISA kit (Invitrogen, Thermo Fisher Scientific, Frederick, MD, USA) and following the manufacturer’s instructions as previously described (García-Beltrán et al., 2024). Briefly, 5 µL of plasma or 20 µL of skin mucus were used together with a standard curve of cortisol made of serial dilutions from an initial concentration of 3,200 pg mL-1. After the reaction, the optical density (OD) was measured at 450 nm using a plate reader (MultiskanGo, Thermo Fisher Scientific, Waltham, MA, USA). Wells with assay buffer instead of sample and without cortisol antibody were used as blanks, and results were expressed as ng mL-1.
Glucose level in plasma and skin mucus samples was determined by using the Glucose-HK enzymatic kit (Spinreact, Girona, Spain) in accordance with the manufacturer’s instructions following García-Beltrán et al. (2024). For that, 4 µL of either plasma, skin mucus or glucose standard (100 mg dL-1) were used for sample analysis or as a positive control in the case of glucose. The data were corrected with the blank levels performed using only the working reagent, and results were expressed as mg dL-1.
Lactate level in plasma and skin mucus samples was determined by using the Lactate LO-POD enzymatic kit (Spinreact), adhering to the manufacturer’s instructions as stated by García-Beltrán et al. (2024). Thus, 4 µL of plasma or skin mucus were used for each analysis, while a lactate standard (10 mg dL-1) instead of a sample was used as a positive control. The blanks were performed using only working buffer, and results were expressed as mg dL-1.
Total antioxidant activity of plasma samples was analyzed by the 2,2’-azino-bis-3-(ethylbenzothiazoline-6-sulphonic acid) (ABTS) method described by Arnao et al. (1999). The assay is based on the ability of the antioxidants in the sample to reduce the radical cation of ABTS, as determined by the decoloration of ABTS·+, and measuring the quenching of the absorbance at 730 nm. Samples of 10 µL of plasma each were run in duplicates. Activity is calculated by comparing the values of the sample with a standard curve of ascorbic acid and expressed as ascorbic acid equivalents (mmol) mg-1 protein.
2.4.2 Immune response in plasma
The lysozyme activity of plasma was spectrophotometrically analyzed based on a turbidimetric method that uses the lysis of Micrococcus lysodeikticus for the determination of the lysozyme activity using hen egg-white lysozyme as a standard (Parry et al., 1965; Valero et al., 2014). Samples of 100 µL of plasma each were run in duplicates. One unit (U) of lysozyme activity was defined as a reduction in the absorbance of 0.001 min-1. The results were expressed as U mL-1 of plasma.
Antiprotease activity in plasma samples was determined as the ability of samples to inhibit the hydrolysis of azocasein by the same volume of 2 mg mL-1 proteinase K using a modified protocol previously published (Charney and Tomarelli, 1947; Chaves-Pozo et al., 2019). 10 μL of plasma was used. The activity was determined by measuring the amount of free amino acid released in the different reactions and compared to a blank (no protease activity) and a negative control (100% of activity). Phosphate-buffered saline (PBS) replaced both the plasma samples and the proteinase K in the blank, or only the plasma samples in the negative control. The percentage of inhibition of protease activity for each sample was calculated as [100-(% of protease activity)]. Results were expressed as % of activity.
Plasmatic antibacterial activity was determined by evaluating the inhibition on the bacterial growth of Vibrio harveyi curves with a method previously published (Sunyer and Tort, 1995) and slightly modified (Cervera et al., 2024). 10 µL of plasma was used. Bactericide activity was expressed as [100-(% of bacterial growth)]. Results were corrected with absorbance measured in each sample at the initial time point and expressed as % of plasma.
The peroxidase activity in greater amberjack plasma was measured according to a protocol previously published (Quade and Roth, 1997; Chaves-Pozo et al., 2019). The reactive oxygen species (ROS) produced by the peroxidase reaction in the presence of H2O2 transform the 3,3’, 5,5’-tetramethylbenzidine solution into a detectable chromogen. Samples of 5 µL of plasma or 10 µL of skin mucus each were run in triplicate. One U was defined as the amount of activity producing an absorbance change of 1, and the activity was expressed as U mL-1 plasma.
2.4.3 Antioxidant response
For the analysis of thiobarbituric acid reactive substances (TBARS), and antioxidant enzymes, gills and brain samples (200 mg) were diluted 1:5 (w/v) and homogenized in an ice-cold 20 mM Tris HCl (w/v) buffer (pH 7.6) with protease inhibitors (Complete®, Sigma, Madrid, Spain). Nevertheless, liver and muscle samples (200 mg) were diluted 1:5 and 1:4 (w/v), respectively, and homogenized in an ice-cold 100 mM Tris HCl buffer (pH 7.8) containing 0.1% (v/v) Triton X-100 with protease inhibitors (Complete®, Sigma, Madrid, Spain). Homogenates were centrifuged at 15,000× g for 30 min at 4°C and the resulting supernatants were separated into aliquots and stored at -80°C for further assays. All the assays were performed with a BioTek Synergy HT microplate reader (Winooski, VT, USA) in triplicate.
For the analysis of antioxidant response enzymes, catalase (CAT; EC 1.11.1.6) activity was determined using 52.4 mM H2O2 as substrate according to Aebi (1984). The decrease in hydrogen peroxide concentration was measured at 240 nm. The molar extinction coefficient (Ɛ) of H2O2 used was 40 M-1cm-1. One unit of enzyme activity (U) of CAT was defined as the amount of enzyme required to transform 1 µmol of substrate per minute (µmol min-1) under the assay conditions.
Superoxide dismutase (SOD; EC 1.15.1.1) activity was determined using 30 mM pyrogallol as substrate following Mesa-Herrera et al. (2019). One U of SOD activity was defined as the equivalency to the amount of enzyme that provides a 50% inhibition of the auto-oxidation of pyrogallol. The increase in absorbance min-1 was measured at 320 nm.
The glutathione-S-transferase (GST; EC 2.5.1.18) reaction was determined with 1 mM reduced glutathione (GSH), and 1 mM 1-chloro-2,4-dinitrobenzene (CDNB) as substrates (Habdous et al., 2002). Absorbance was read at 340 nm, and the activity was quantified using the molar extinction coefficient of Mesenheimer complex (Ɛ = 9.6 mM-1cm-1). One U was defined as the amount of enzyme required to transform 1 nmol of substrate per minute (nmol min-1) under the assay conditions.
2.4.4 Oxidative damage
The lipid peroxidation levels were determined as the content of malondialdehyde (MDA), evaluated by the TBARS (thiobarbituric acid reactive substances) assay following Ohkawa et al. (1979). Samples were measured fluorometrically with excitation at 485 nm and emission at 535 nm and MDA content (nmol MDA mg-1 protein) was calculated using a standard curve of 1,1,3,3-tetramethoxipropane (TMP), as defined by Galindo et al. (2022).
Protein concentration of plasma, skin mucus and tissue samples homogenizes was analyzed according to Bradford (1976) using bovine serum albumin (BSA) as standard to report the activities per mg of protein.
2.5 Statistical analysis
The results are shown as means ± standard error (SEM). Normality and homogeneity of variances were analyzed using Shapiro-Wilk´s test and Levene´s test, respectively. Data were logarithmically transformed when necessary to normalize variances prior to analysis. A nested two-way ANOVA was also carried out to test for significant differences between groups, with photoperiod (natural and long), stocking density (lower and higher), and tank (as the nested variable) as the factors of variance. Also, differences between groups for plasmatic variables were tested using nested repeated-measures ANOVA with photoperiod (natural and long), stocking density (lower and higher), time (repeated measures at 10, 20, and 30 days) and tank (as the nested variable) as the factors of variance. Pairwise differences between means were also tested using Student’s t-tests. Statistical significance was set at p< 0.05. Statistical analysis was performed using the SPSS statistical package (Version 25.0) software for Windows.
3 Results
3.1 Growth parameters and body indexes
Regardless of the different conditions assessed, survival at the end of the experiment was 100% for each group. Moreover, the different photoperiod and stocking density conditions did not affect fish growth parameters or body indexes (Table 1).
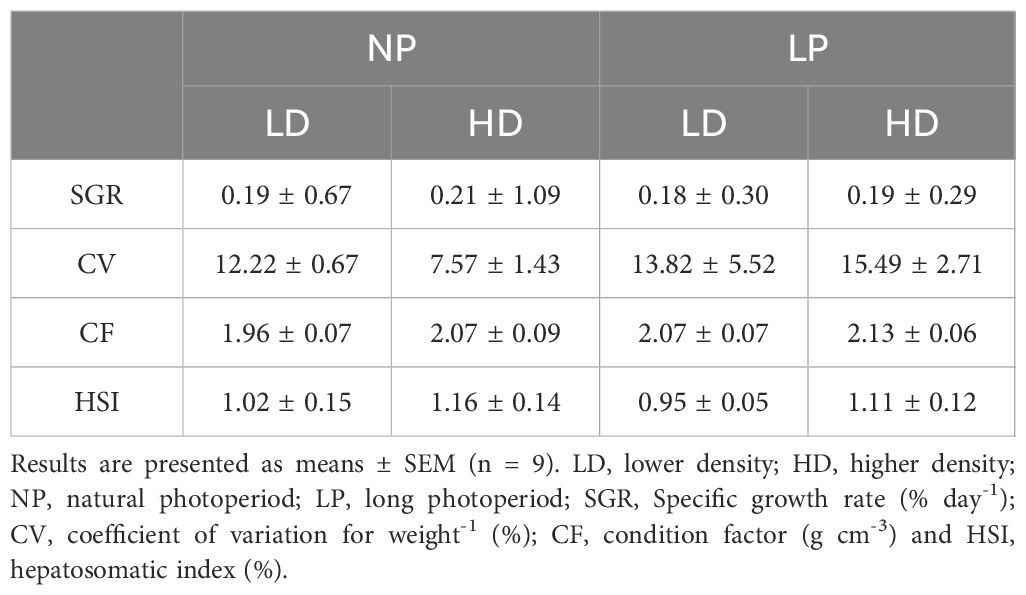
Table 1. Growth parameters and body indexes of S. dumerili reared under the different treatments at the end of the study.
3.2 Stress plasma and skin mucus parameters
To investigate the impact of stocking density and manipulated photoperiod on fish welfare and health, several plasma and skin mucus parameters that serve as stress biomarkers were analyzed. Regarding plasma parameters, lower cortisol levels were recorded under the long photoperiod for both stocking densities on day 10 (p< 0.05) (Figure 1A, Supplementary Table S1). However, no significant differences (p > 0.05) were detected at 20 and 30 days. As for secondary stress parameters such as glucose and lactate, no significant differences were detected related to either photoperiod or stocking density (Figures 1B, C). Instead, a significant increase in glucose and lactate levels was observed over time, with higher values recorded at the end of the experiment (p = 0.002 and 0.000, respectively; nested repeated-measures ANOVA) (Supplementary Table S2). Concerning the total antioxidant activity (ABTS), only a significant interaction between stocking density and photoperiod was observed on day 20 (p< 0.05), with slightly higher values noted under the natural photoperiod at high stocking densities (t-test, p = 0.019) (Figure 1D; Supplementary Table S1).
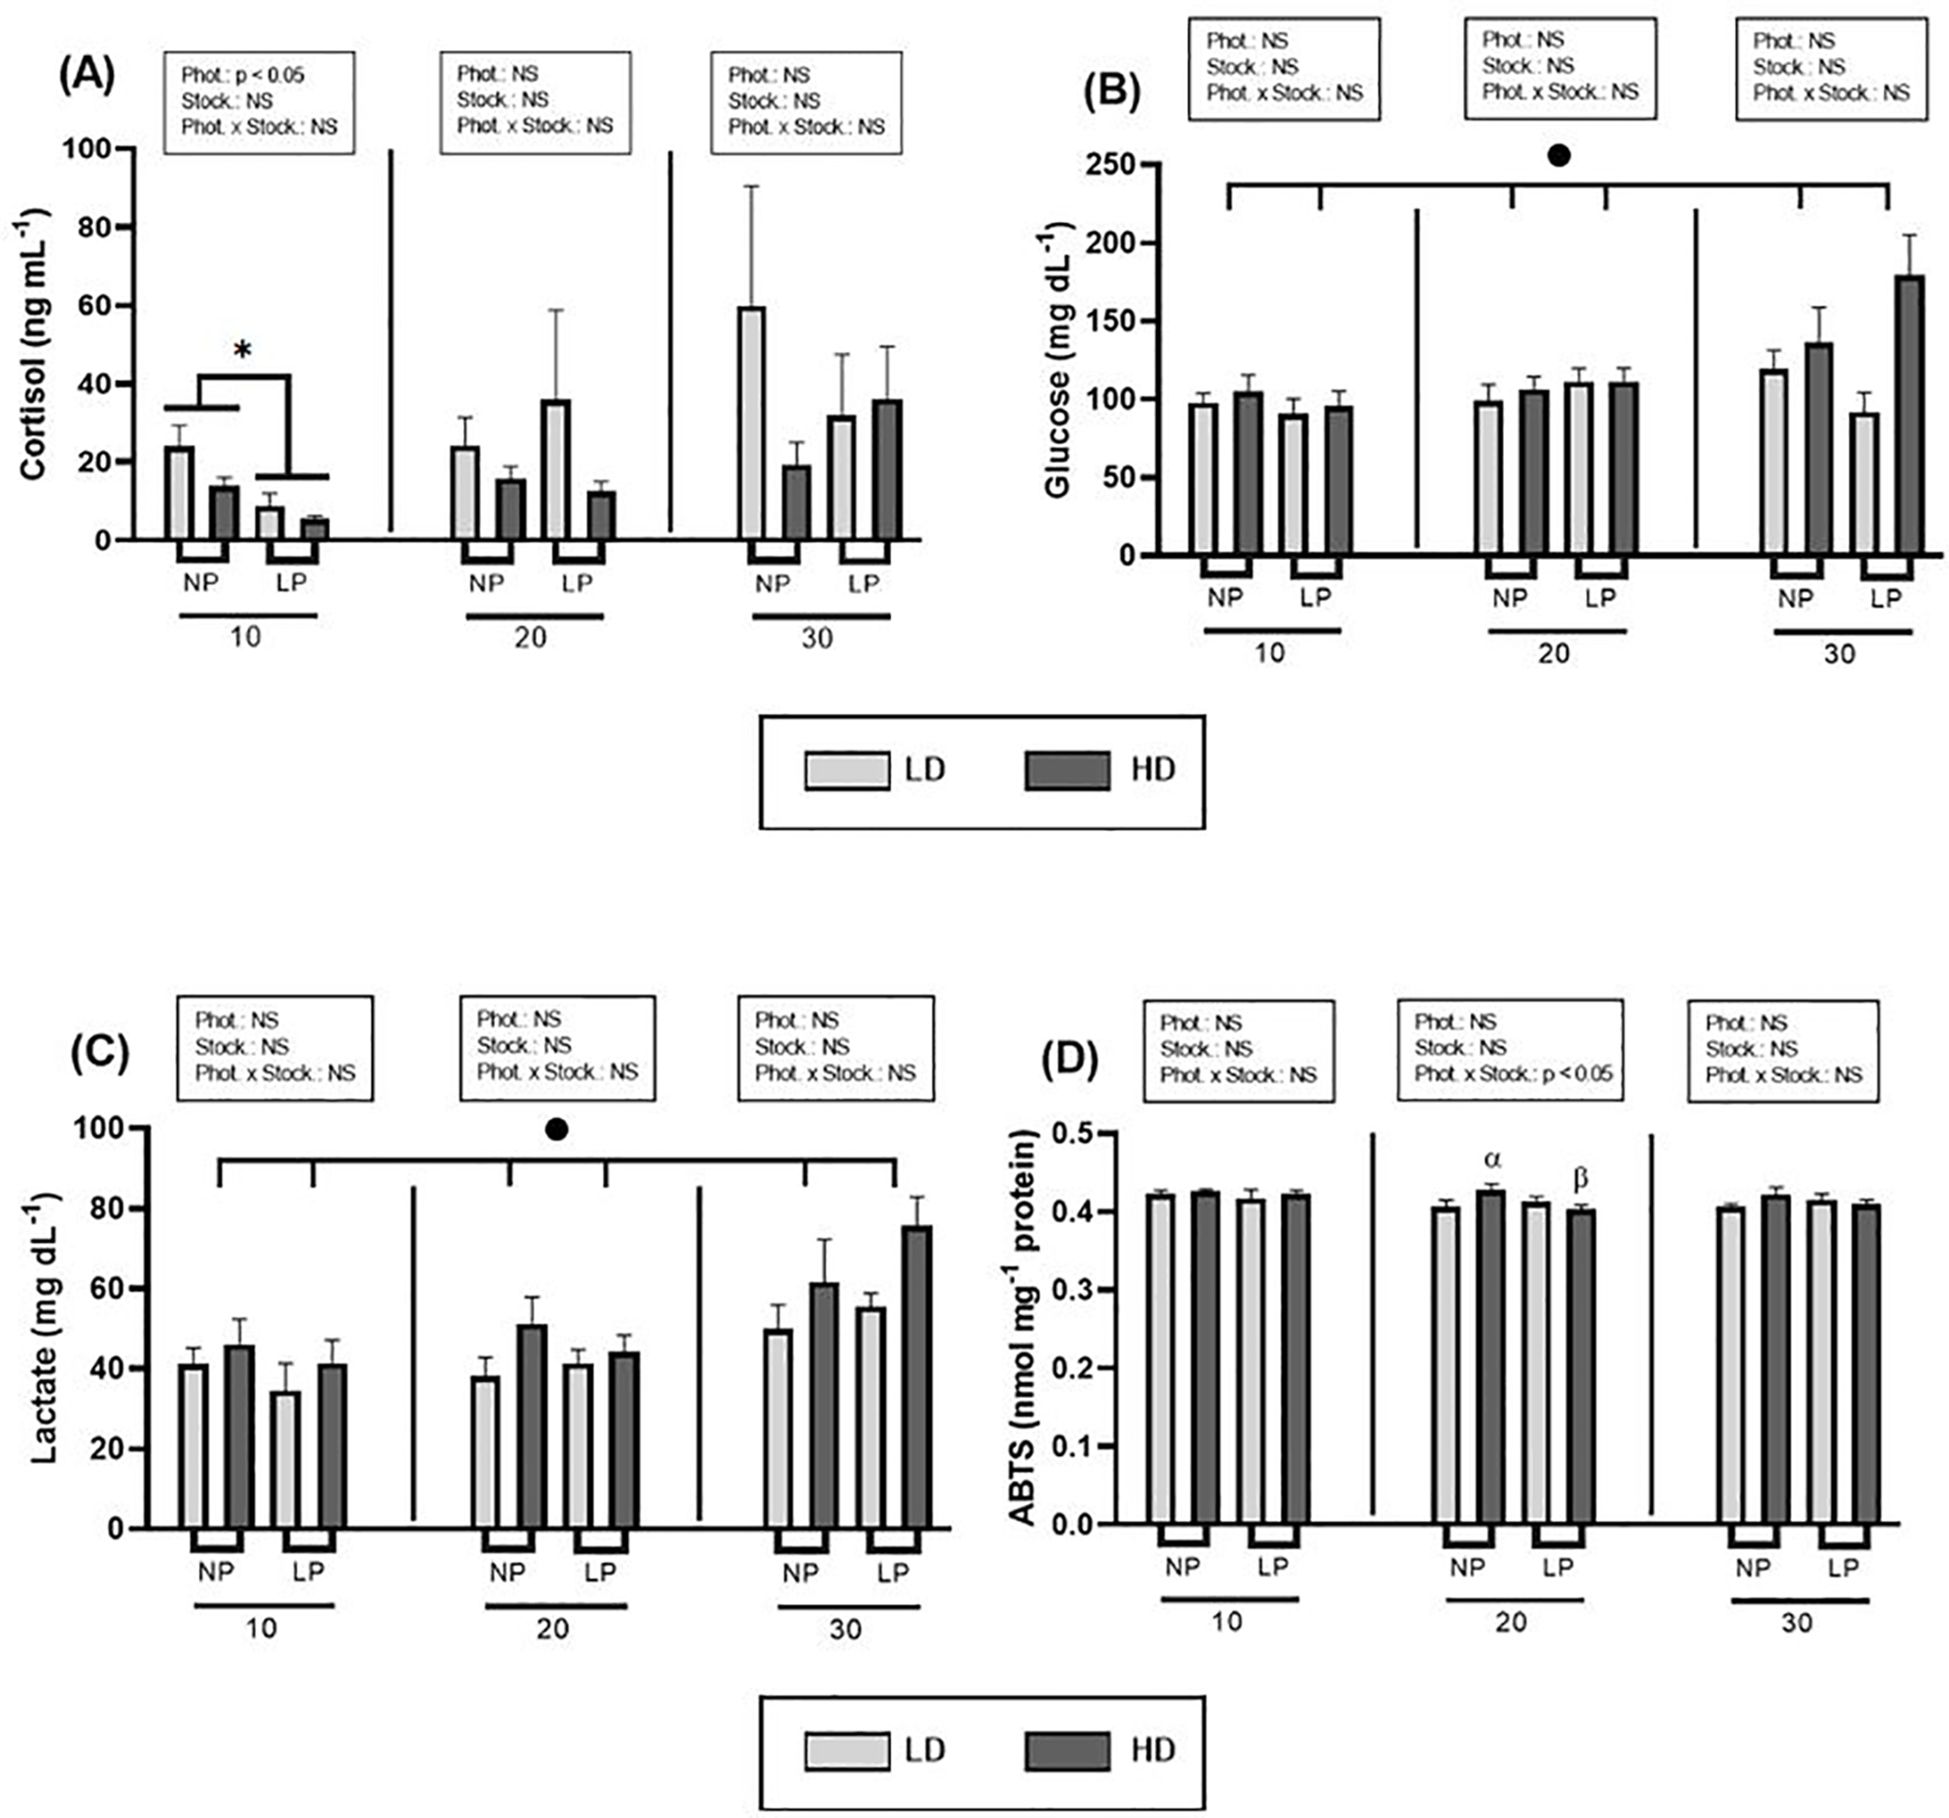
Figure 1. Effect of different photoperiods (NP, natural photoperiod, and LP, long photoperiod) and stocking densities (LD, lower density and HD, higher density) on plasma. (A) Cortisol (ng mL-1), (B) glucose (mg dL-1), (C) lactate (mg dL-1) and (D) ABTS (nmol mg-1 protein) levels of S. dumerili over time (10, 20 and 30 days). Values are expressed as group mean ± SEM; n=9. The significant difference due to photoperiod is denoted by asterisk (*) (Two-way nested ANOVA, p< 0.05). The α and β symbols above the histogram bars indicate the differences observed due to photoperiod for the same stocking density (t-test, p< 0.05). (Phot, photoperiod effect; Stock, stocking density; NS, non-significant - Two-way nested ANOVA). The significant difference due to time is denoted by black dot (•) (Nested repeated-measures ANOVA, p< 0.05).
The analysis of stress response mucus parameters revealed distinct patterns in the responses of cortisol, glucose and lactate (Figure 2). Significant differences were observed in cortisol levels (Figure 2A; Supplementary Table S1) due to photoperiod and stocking density at day 30 (p< 0.05), with the longer photoperiod and lower stocking density associated with higher mucus cortisol levels. Concerning glucose levels (Figure 2B), significant alterations attributable to photoperiod were observed at days 10 and 20, with a notable interaction between both factors at day 20 (p< 0.05) (Supplementary Table S1). Lactate levels demonstrated differences due to stocking density at time 30 (p< 0.05), with elevated levels observed at lower density (Figure 2C; Supplementary Table S1). Although the data showed high variability, lower levels were detected for high density group compared to lower density under both natural and long photoperiod (t-test, p = 0.034 and p = 0.029 for natural and long photoperiod respectively).
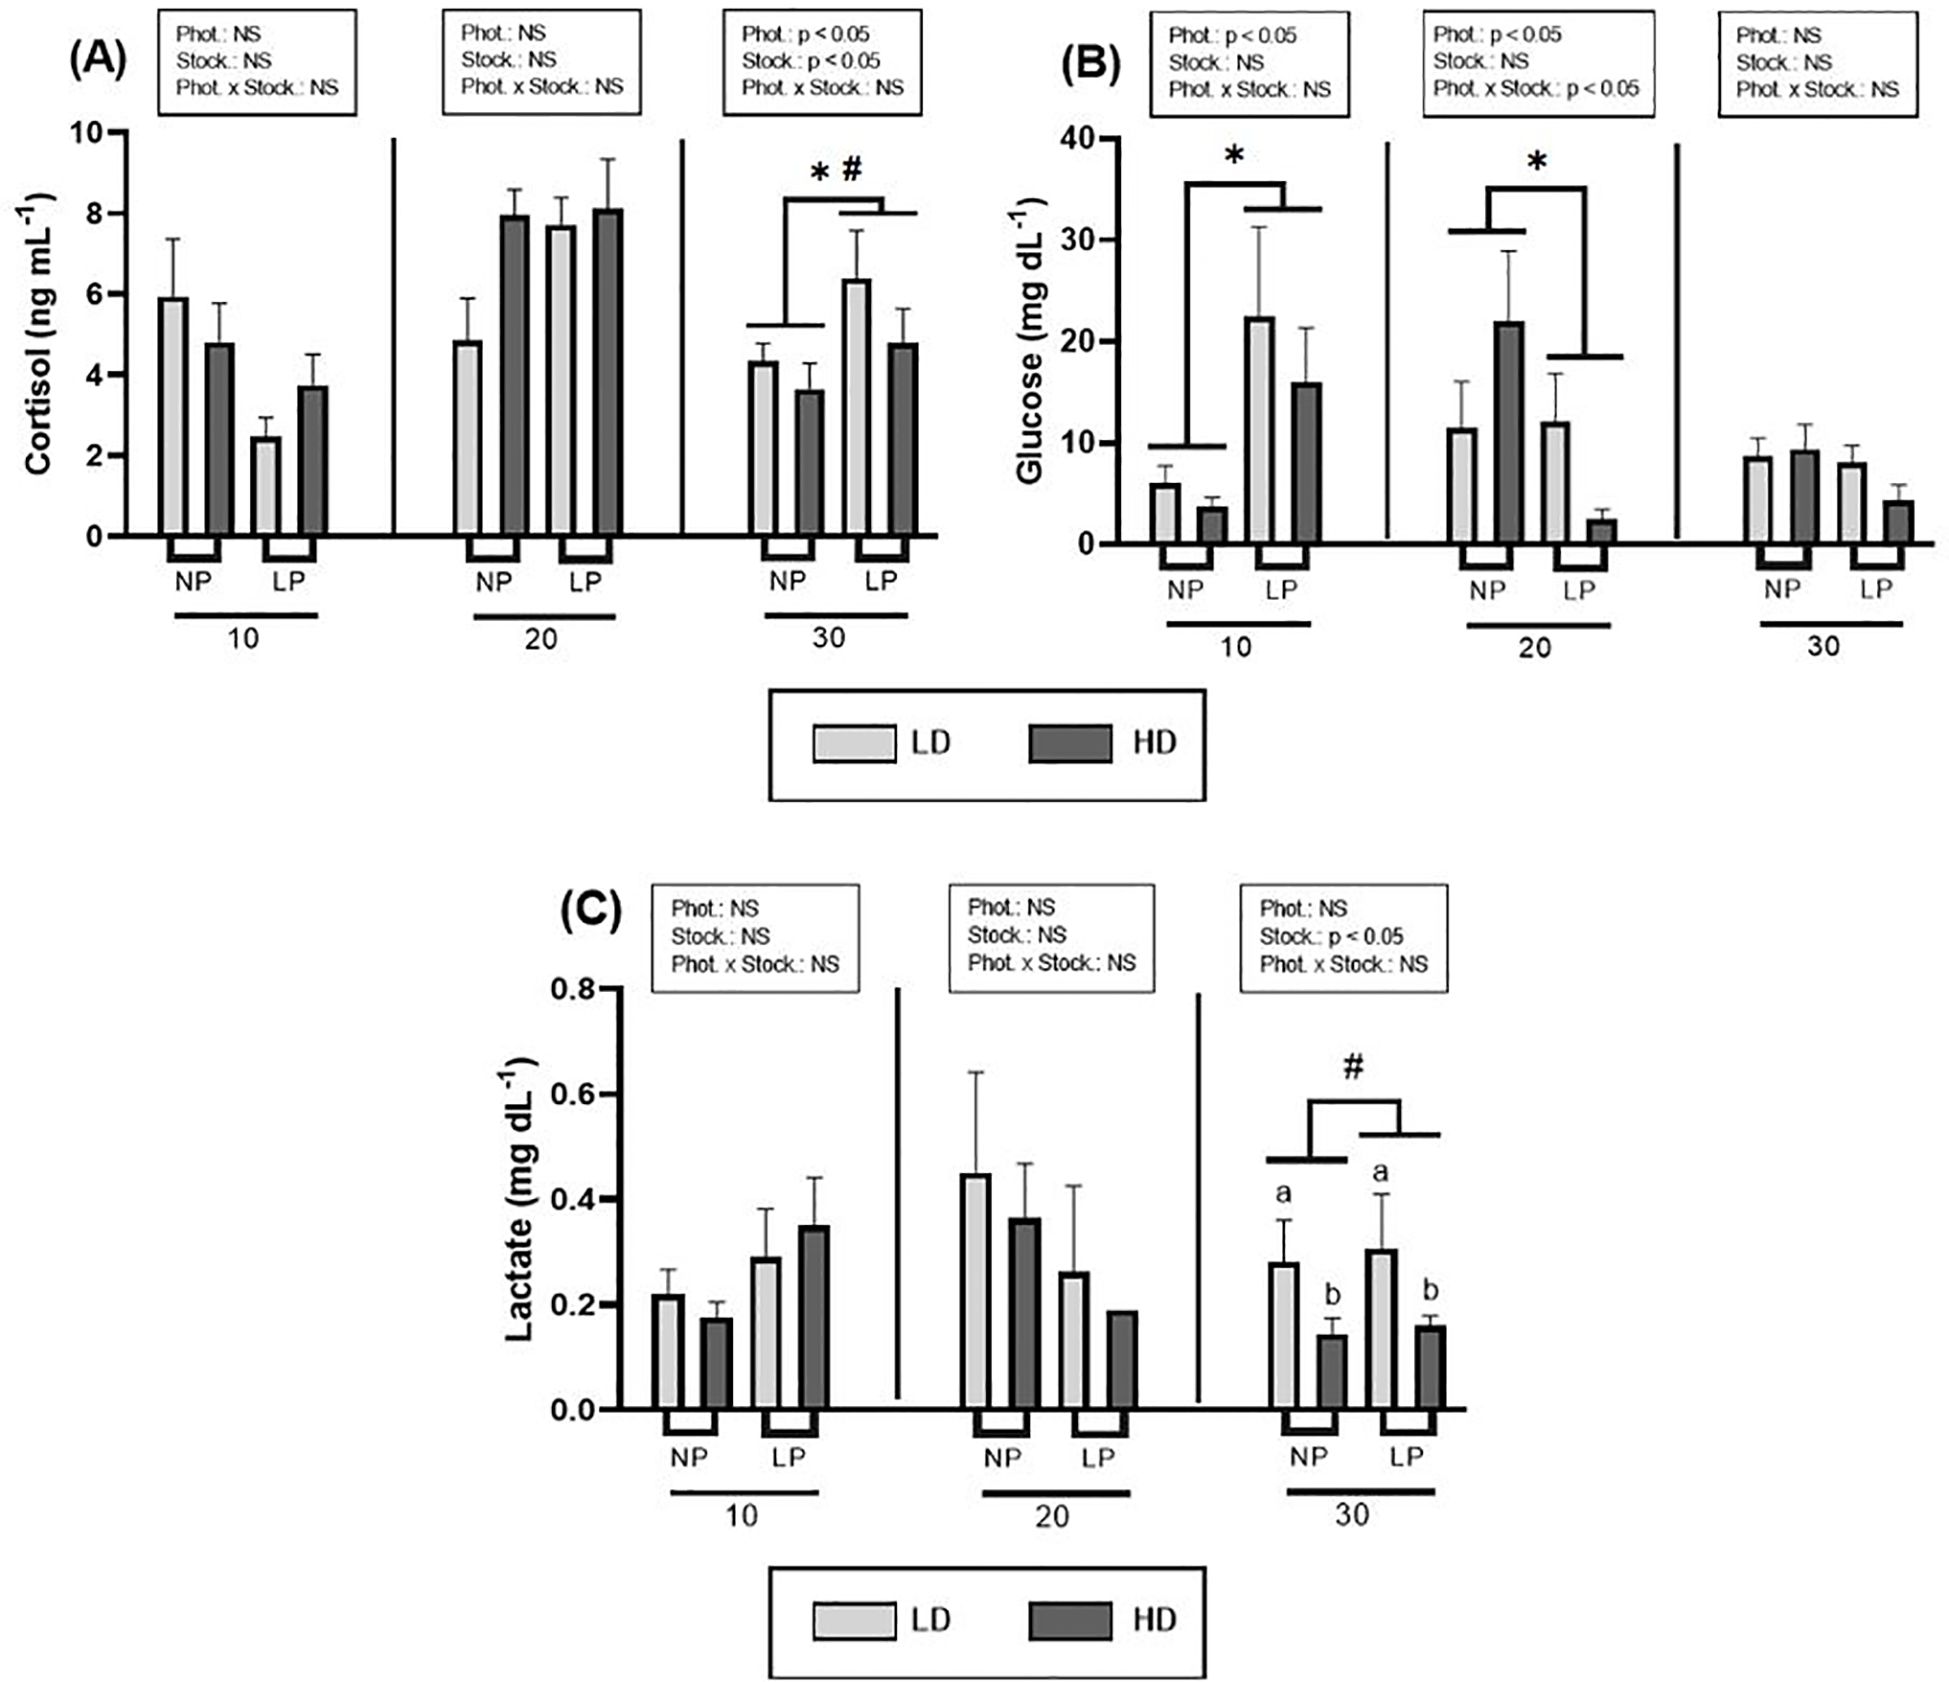
Figure 2. Effect of different photoperiods (NP, natural photoperiod, and LP, long photoperiod) and stocking densities (LD, lower density and HD, higher density) on mucus. (A) Cortisol (ng mL-1), (B) glucose (mg dL-1) and (C) lactate (mg dL-1) levels of S. dumerili over time (10, 20 and 30 days). Values are expressed as group mean ± SEM; n=9. The significant difference due to photoperiod is denoted by asterisk (*) (Two-way nested ANOVA, p< 0.05). The significant difference due to stocking density is denoted by hash (#) (Two-way nested ANOVA, p< 0.05). The a and b letters above the histogram bars indicate significant differences between the stocking density groups (t-test, p< 0.05). (Phot, photoperiod effect; Stock, stocking density; NS, non-significant - Two-way nested ANOVA).
3.3 Immune response
Concerning humoral immune activities, the results revealed that there was no consistent pattern in most of them in response to the photoperiod and stocking density conditions studied (Figure 3). Nevertheless, a significant variation of bactericide activity over the time was detected, showing a decreasing trend throughout the trial (p = 0.001) and a significant interaction with photoperiod (p = 0.033) (nested repeated-measures ANOVA, Supplementary Table S2).
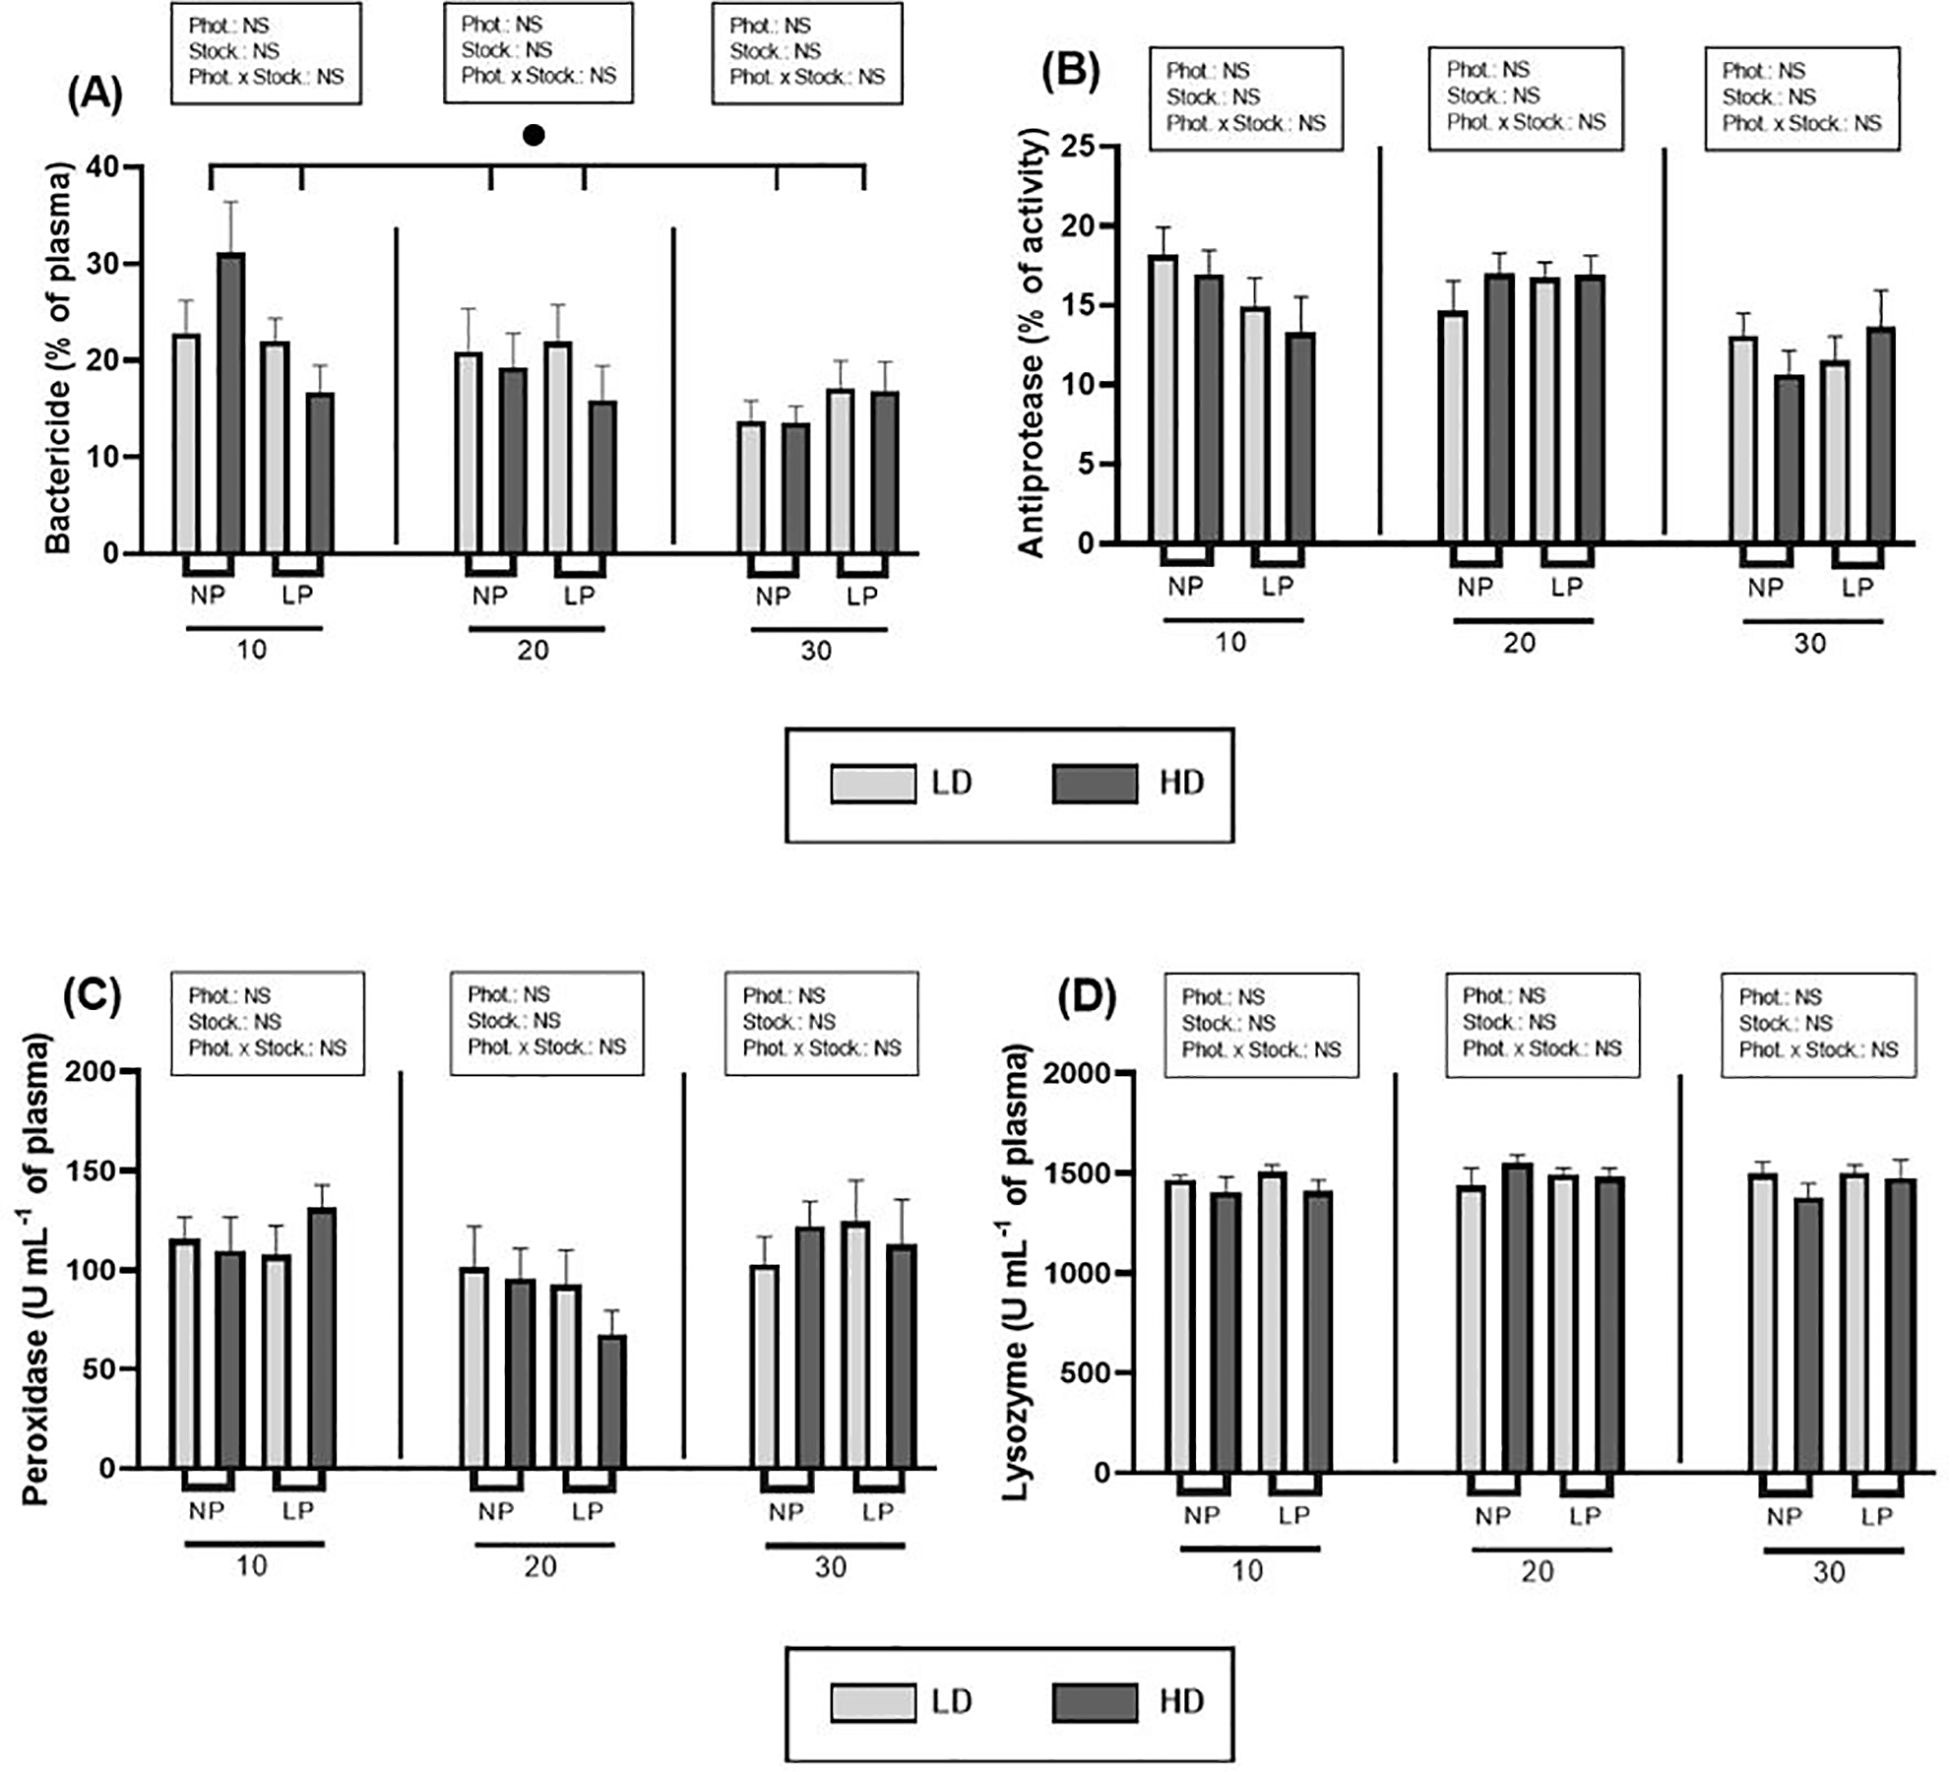
Figure 3. Effect of different photoperiods (NP, natural photoperiod and LP, long photoperiod) and stocking densities (LD, lower density and HD, higher density) on (A) bactericide activity (% of plasma), (B) plasma antiprotease (% of activity), (C) peroxidase (U mL-1 plasma) and (D) lysozyme (U mL-1 plasma) levels of S. dumerili with over time (10, 20 and 30 days). Values are expressed as group mean ± SEM; n=9. (Phot, photoperiod effect; Stock, stocking density; NS, non-significant - Two-way nested ANOVA). The significant difference due to time is denoted by black dot (•) (Nested repeated-measures ANOVA, p< 0.05).
3.4 Antioxidant response
The activity of the antioxidant response enzyme CAT was significantly influenced by the photoperiod in both gills and liver (Figure 4; Supplementary Table S3). Specifically, individuals under a long photoperiod showed a decrease in CAT activity in the liver (Figure 4A), while an increase was observed in the gills (Figure 4B) compared to those under a normal photoperiod. No significant differences were observed in brain (Figure 4C) and muscle (Figure 4D), where activity values remained relatively constant for the different conditions. Concerning stocking densities, CAT activity remained stable in all tissues under both HD and LD conditions (Figure 4).
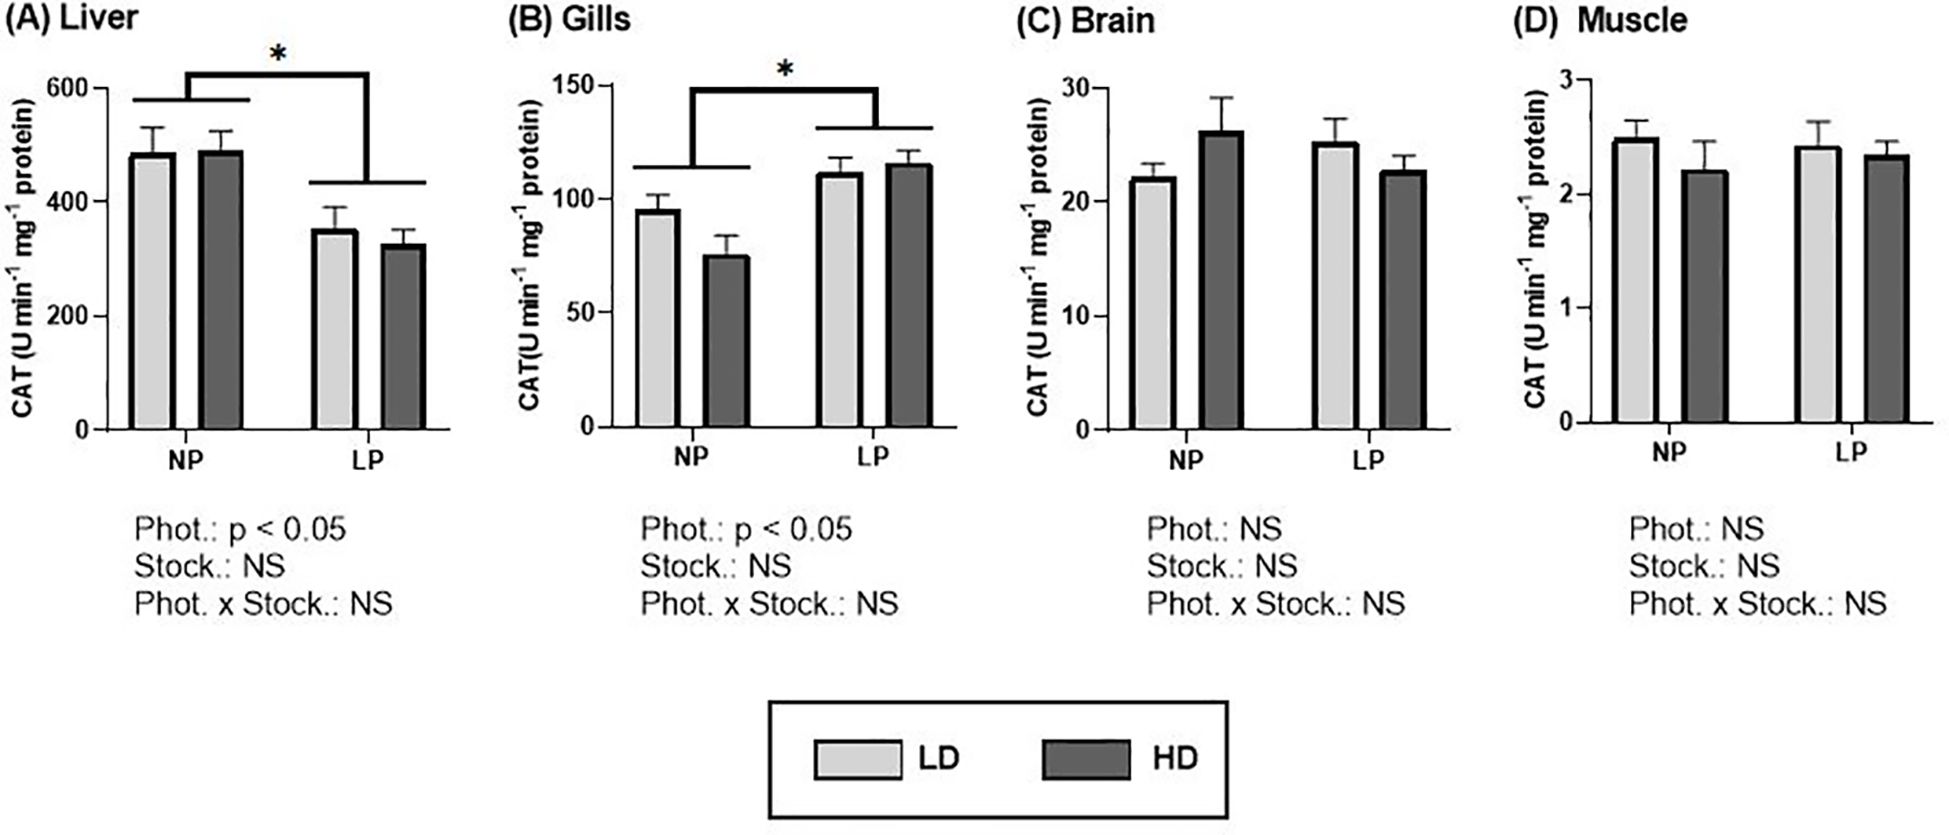
Figure 4. Catalase activity (U min-1 mg-1 protein) of S. dumerili reared at different photoperiods (NP, natural photoperiod and LP, long photoperiod) and stocking densities (LD, lower density and HD, higher density). (A) Liver, (B) gills, (C) brain, and (D) muscle. Values are expressed as group mean ± SEM; n=9. The significant differences due to photoperiod are denoted by an asterisk (*). (Phot, photoperiod effect; Stock, stocking density; NS, non-significant - Two-way nested ANOVA).
For SOD, no significant differences were found concerning photoperiod or stocking density in any of the tissues analyzed (Figure 5; Supplementary Table S3). However, a trend observed in liver and muscle of the LD group, with higher values under long photoperiod (Figures 5A, C). Regarding stocking densities, a trend was observed in the muscle (Figure 5C), where higher SOD enzyme activity appeared to be associated with the LD condition.
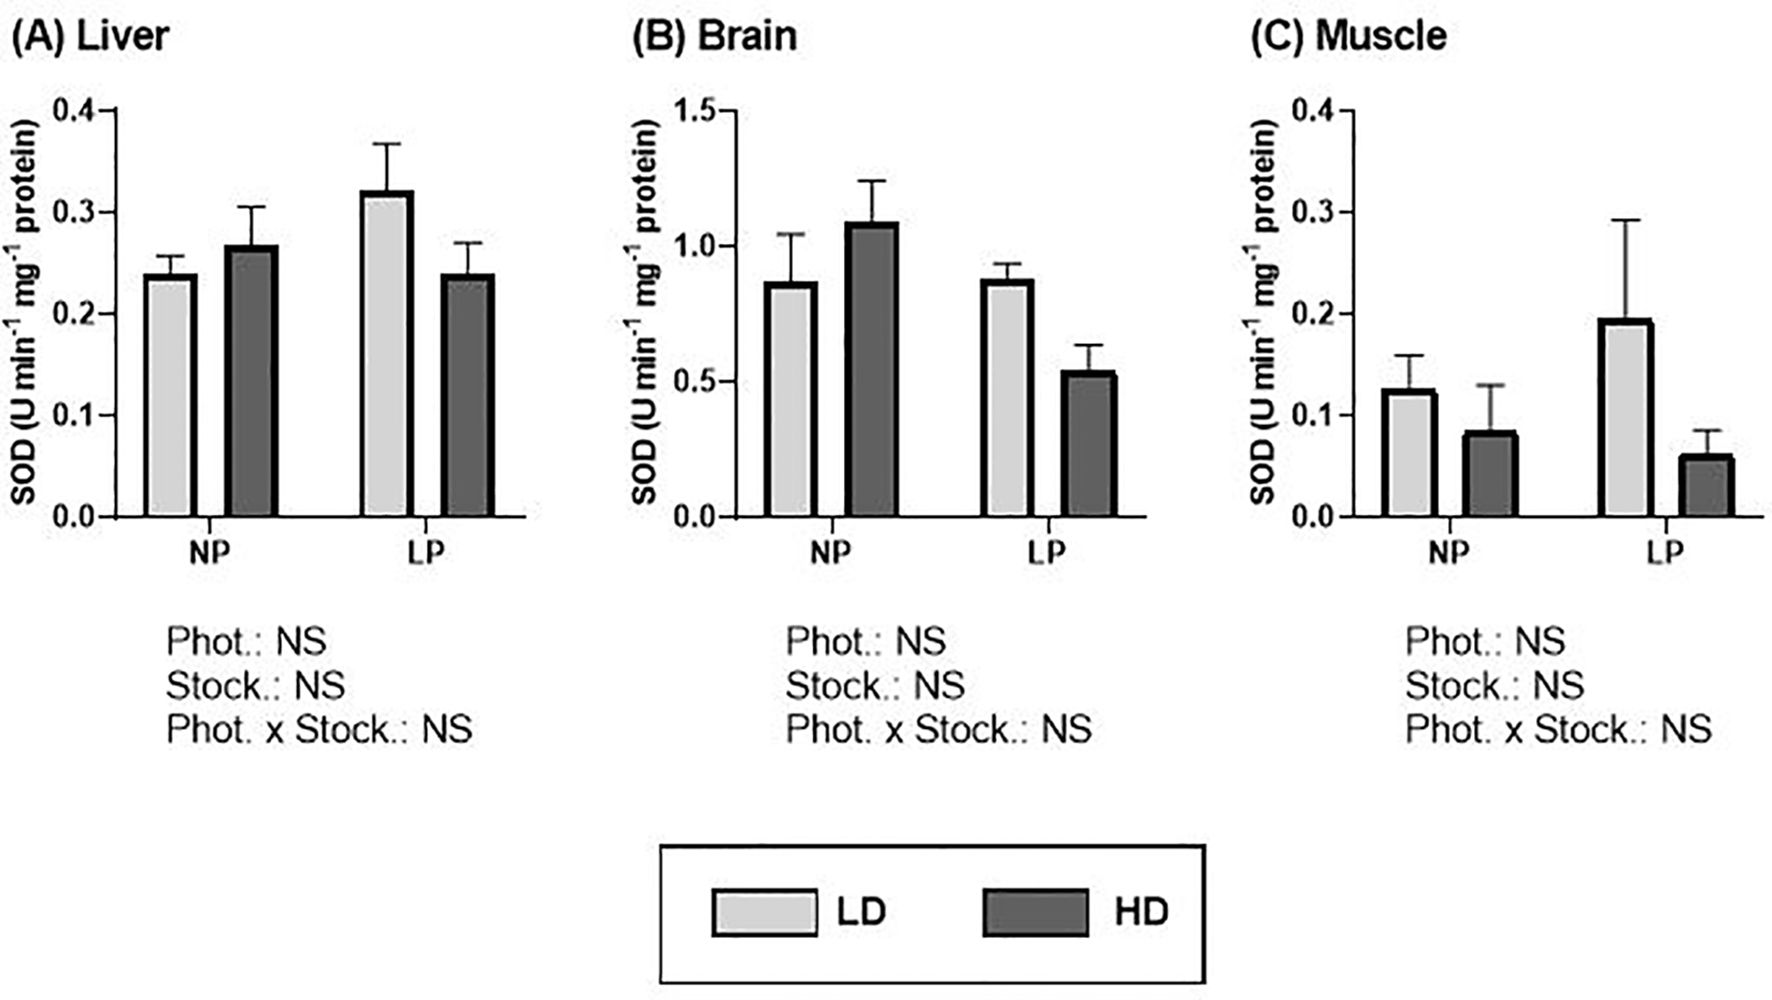
Figure 5. Superoxide dismutase activity (U min-1 mg-1 protein) of S. dumerili reared at different photoperiods (NP, natural photoperiod and LP, long photoperiod) and stocking densities (LD, lower density and HD, higher density). (A) Liver, (B) brain, and (C) muscle. Values are expressed as group mean ± SEM; n=9. (Phot, photoperiod effect; Stock, stocking density; NS, non-significant - Two-way nested ANOVA).
The results of the GST assays showed significant differences between groups under different photoperiods in the liver and gills (Figures 6A, B; Supplementary Table S3). Similar to the patterns observed for CAT activity, a longer photoperiod resulted in a significant decrease in GST activity in the liver for both stocking densities, compared to natural photoperiod (Figure 6A). In contrast, the gills exhibited an increase in activity under the same conditions (p< 0.05) (Figure 6B). No significant differences were observed in any of the tissues when comparing stocking densities under the same photoperiod condition (Figures 6A–D).
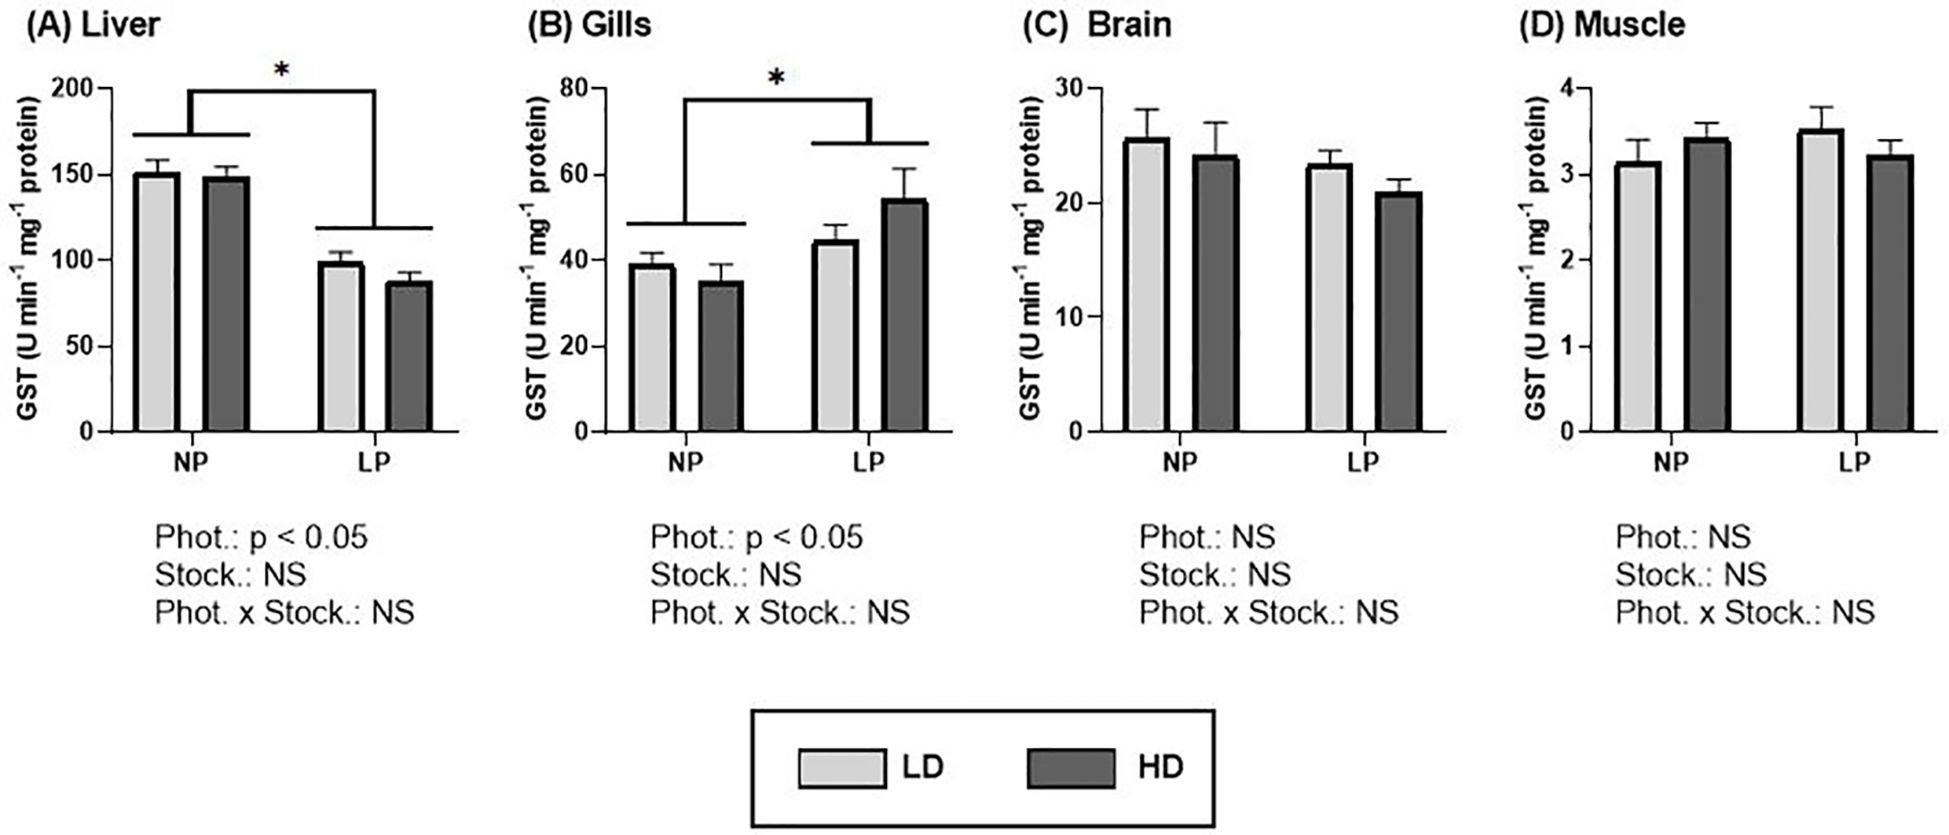
Figure 6. Glutathione-S-Transferase (U min-1 mg-1 protein) of S. dumerili reared at different photoperiods (NP, natural photoperiod and LP, long photoperiod) and stocking densities (LD, lower density and HD, higher density). (A) Liver, (B) gills, (C) brain, and (D) muscle. Values are expressed as group mean ± SEM; n=9. Significant differences due to photoperiod are denoted by an asterisk (*). (Phot, photoperiod effect; Stock, stocking density; NS, non-significant - Two-way nested ANOVA).
3.5 Oxidative damage
A notable increasing trend in lipid peroxidation (MDA content) can be observed in response to the long photoperiod, with higher values observed in all tissues (Figure 7; Supplementary Table S3). Specifically, in the liver (Figure 7A), brain (Figure 7C) and muscle (Figure 7D), these values were significantly higher (p< 0.05) compared to those obtained under natural photoperiod. However, a higher stocking density (5.0 kg/m3) did not result in significant effects on oxidative damage in any of the tissues.
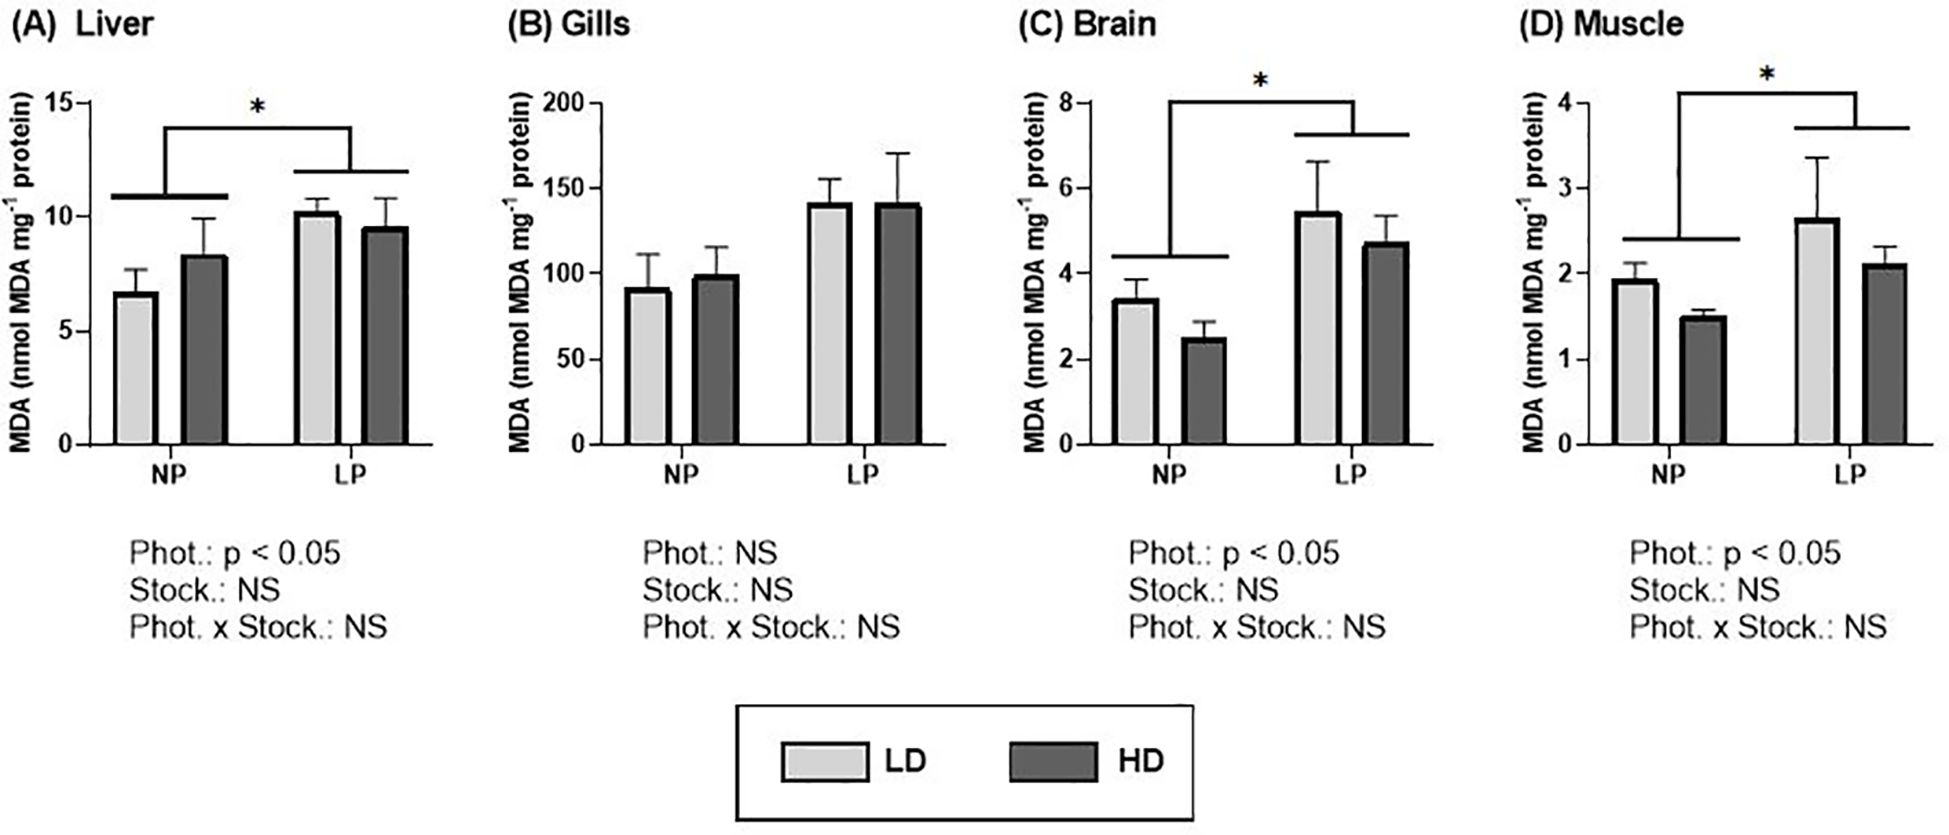
Figure 7. Content of malondialdehyde (MDA) (nmol MDA mg-1 protein) of S. dumerili reared at different photoperiods (NP, natural photoperiod and LP, long photoperiod) and stocking densities (LD, lower density and HD, higher density). (A) Liver, (B) gills, (C) brain, and (D) muscle. Values are expressed as group mean ± SEM; n=9. Significant differences due to photoperiod are denoted by an asterisk (*). (Phot, photoperiod effect; Stock, Stocking density; NS, non-significant - Two-way nested ANOVA).
4 Discussion
The increasing interest in farming greater amberjack presents new challenges in designing optimal procedures and conditions that guarantee animal welfare. Establishing the right operational parameters will enable the development of management protocols to ensure the welfare of this farmed species.
Very few studies have addressed the effect of culture conditions on the growth-out of S. dumerili. Most research on this species has primarily focused on nutritional aspects (Sato et al., 2016; Monge-Ortiz et al., 2018; Navarro-Guillén et al., 2022). Additionally, only a limited number of studies have examined zootechnical parameters, specifically the effects of temperature (Fernández-Montero et al., 2020) and aggressive behavior due to multiple factors (Miki et al., 2011).
Other factors, such as photoperiod, can have a significant impact on the welfare of this species. Photoperiod regulates biological rhythms, which play a key role in maintaining physiological equilibrium (Shahjahan et al., 2022). Additionally, in the aquaculture industry, stocking density is an important factor influencing fish health responses and growth performance (Roy et al., 2021). High stocking densities give rise to chronic stress, which affects the animal’s metabolism and impairs its growth performance. In the present study, the combination of these two factors did not affect biometric parameters or survival in this species under the assayed conditions. Previous studies on photoperiod in greater amberjack have been limited to broodstock and larval culture (Hashimoto et al., 2013; Nyuji et al., 2018). For larvae, survival and growth tended to improve in the tanks under a long photoperiod, as used in the present study (18L:6D) (Hashimoto et al., 2013). In other species, it has also been shown that manipulation of photoperiod can, in most cases, significantly enhance growth (Al-Emran et al., 2024). However, it is important to note that most of these studies tested a long-day photoperiod (24L:0D) and involved significantly longer exposure periods. Regarding stocking density, there are limited studies on this parameter in S. dumerili. Only Fernández-Montero et al. (2020) observed a significant (p< 0.05) reduction in the growth performance of juvenile greater amberjack at high stocking density. However, this occurred at nearly twice the density tested in this study (8.8 kg/m3) and during a 90-day trial. As previously mentioned and in contrast to the studies in when only one factor (photoperiod or density) is modifying, our data showed no effects on growth performance of S. dumerili under the present experimental conditions.
Although growth and growth rates have long been used as welfare indicators, other physiological stress biomarkers provide more comprehensive insights into physiological homeostasis in response to environmental changes. Haemato-biochemical parameters in farmed fish are particularly effective indicators of their physiological state and overall health (Fazio, 2019). In particular, plasma cortisol levels are commonly used as a diagnostic tool to assess stress (Sadoul and Geffroy, 2019; Al-Emran et al., 2024). Various hematological and enzymatic assessments have been carried out to identify potential stress in relation to photomanipulation (Al-Emran et al., 2024) and stocking density (Ellis et al., 2002; North et al., 2006) in several farmed fish species. There is extensive literature on the influence of photoperiod on corticosteroid levels, but the responses observed are quite variable (Akhtar et al., 2020). For example, both increased plasma cortisol levels during the dark phase and increased cortisol levels under long photoperiods have been reported (Biswas et al., 2005; Almazán-Rueda et al., 2005; Zou et al., 2016). On the other hand, evidences of an increase in cortisol have been observed in different species due to the effects of high stocking density (North et al., 2006; Laiz-Carrión et al., 2012).
In the present study, no significant effects of photoperiod or stocking density on plasma cortisol levels were observed after 30 days of the experiment, although concentrations were highly variable and slight differences in photoperiod were observed at the beginning of the trial. In contrast, skin mucus cortisol levels increased in response to the long photoperiod, suggesting a stress response that could potentially compromise fish welfare. The determination of cortisol levels in skin mucus has been proposed as a minimally invasive alternative to blood sampling for assessing stress (Guardiola et al., 2016). Although there is no evidence of local cortisol production in fish skin (Gozdowska et al., 2022), studies have demonstrated that cortisol levels in skin mucus can reflect acute stress responses in fish subjected to various stressors (De Mercado et al., 2018). Furthermore, some studies indicate that higher plasma cortisol levels may be linked to an increase in mucus cortisol (Guardiola et al., 2016; Lemos et al., 2023). In fish, plasma cortisol levels peak approximately 1 to 4 hours after a stress event and then decline. In contrast, mucus cortisol peaks later, typically between 12 to 24 hours, and remains elevated for a longer period, indicating a slower clearance and a longer half-life in mucus compared to plasma (Fanjara et al., 2024). Therefore, cortisol levels in mucus and plasma are significantly correlated, but mucus shows delayed and prolonged elevation. While plasma cortisol reflects immediate, acute stress, mucus cortisol can provide a longer-term integrated measure of stress, potentially reflecting chronic or cumulative stress exposure (Carbajal et al., 2019). To the best of our knowledge, there are no published studies analyzing the effect of photoperiod on plasma and skin mucus cortisol in S. dumerili. Although the lack of increase in plasma cortisol levels after 30 days could suggest that the seriola may have the ability to habituate to such stressors, the increase in mucus cortisol might indicate that the specimens were subjected to some kind of chronic stress under the long photoperiod condition. While the cortisol response depends on the intensity of the stressor and the length of the habituation period (Schreck, 2010), the stress response is also influenced by the predictability and controllability of the stressor (Schreck and Tort, 2016). On the other hand, although there is a well-established link between high plasma cortisol levels and increased stress, it’s important to note that plasma cortisol levels do not always accurately reflect tissue stress responses. In instances of chronic stress, as in the present experiment, plasma cortisol levels can normalize even though the individual is still experiencing stress (Mommsen et al., 1999).
Other secondary stress parameters include blood glucose and lactate, whose levels are subject to change in response to chronic stress or repeated acute stress (Cnaani et al., 2004; McDonald and Milligan, 1997). Acute stress has been shown to induce an increase in energy demand, resulting in the release of glucose from body stores and the subsequent production of lactate through anaerobic pathways. The results of this study demonstrate that no statistically significant changes in plasma levels of these parameters were observed in response to variations in photoperiods and stocking density tested. This finding aligns with expectations, as cortisol levels are known to partially regulate glucose and lactate levels (Iwama et al., 2006). Additionally, no significant changes in plasma antioxidant activity were identified. Nevertheless, a few significant differences were detected in glucose and lactate levels of skin mucus although the data exhibited significant variability, particularly in glucose levels, which prevented clear conclusions from being drawn. Taken together, these findings suggest that the potential chronic stress associated with photomanipulations and increased stocking density did not affect plasma stress biomarkers, even though it did impact skin mucus stress biomarkers.
Stress-induced immunosuppression has been reported as a consequence of artificial photoperiods (Leonardi and Klempau, 2003; Valenzuela et al., 2006) and varying stocking densities (Costas et al., 2013; Yarahmadi et al., 2015) in fish. Fish exhibit circadian rhythms that regulate various biological functions, including immune responses. Changes in photoperiod can disrupt these rhythms, affecting immune cell production and cytokine release (Esteban et al., 2006). Moreover, investigations at the molecular level have shown that high stocking density affects the expression of genes involved in the innate immune system, such as interleukin 1β, g-LZM, and hepcidin (Yarahmadi et al., 2015), significantly reducing the levels of immune-related proteins across different species. Lysozyme is frequently used as an indicator of immune status and stress conditions (Murray and Fletcher, 1976). A substantial body of literature exists regarding the influence of photoperiod and stocking density on lysozyme activity; however, results are often species-specific (Esteban et al., 2013). In the present study, seriola plasmatic lysozyme activity levels did not vary with changes in photoperiod or stocking density, which aligns with previous findings in Atlantic halibut (Hippoglossus hippoglossus), European sea bass (Dicentrarchus labrax), and Nile tilapia (Atwood et al., 2003; Bowden et al., 2007; Esteban et al., 2006). Similarly, the release of peroxidase into the bloodstream has been employed as an indicator of the active immune status of circulating leukocytes (Esteban et al., 2013). In this study, S. dumerili did not exhibit significant variations in plasma peroxidase activity in response to alterations in photoperiod or stocking density, consistent with observations made in other fish species (Esteban et al., 2013). Also, bactericidal activity displayed no clear trends, indicating that it may remain constant regardless of environmental conditions. Therefore, our study found that humoral innate immune activities were unaffected by photoperiod or stocking density.
Nevertheless, we observed changes over time in plasma lactate, glucose, peroxidase, and bactericidal activities throughout the experiment, independent of photoperiod and stocking density. These variations may be attributed to the presence of a seasonal rhythm influencing immune parameters in this species. Seasonal changes in the non-specific humoral immunity have been documented in rainbow trout and European sea bass, reporting an increase in leukocyte counts and lysozyme activities between May and June (Morgan et al., 2008; Pascoli et al., 2011). However, other factors could also account for these temporal effects. For instance, it is possible that sampling procedures—such as handling—may have induced acute stress in the subjects. Furthermore, since stocking density increased gradually throughout the experiment as animals grew, this gradual change could have naturally led to temporary physiological effects.
As discussed above, it is important to note that plasma stress biomarkers and immune parameters do not always accurately reflect tissue stress responses. In cases of chronic stress, as in the present experiment, plasma levels may normalize even though the individual continues to experience stress (Mommsen et al., 1999).
Aerobic organisms naturally produce ROS, and their production and elimination remain balanced under normal cellular conditions. Reactive oxygen species have been shown to cause damage to cellular components such as lipids, proteins, and nucleic acids, which can lead to physiological dysfunction, cell death, and ageing (Wei et al., 2019). Oxidative stress occurs when there is an increase in free radicals or a decrease in the mechanisms that manage these substances (Song et al., 2023). Cellular defense mechanisms, which include both enzymatic and non-enzymatic systems, play a crucial role in repairing damage caused by these compounds in tissues (Birnie-Gauvin et al., 2017). Aquatic organisms use antioxidant enzymes such as SOD and CAT, as well as detoxification enzymes such as GST, to combat the harmful effects of ROS and prevent oxidative damage (Mates, 2000; Martínez-Álvarez et al., 2005).
The findings of the present study indicate a notable influence of photoperiod on antioxidant enzyme activities. Specifically, specimens subjected to a long photoperiod exhibited a reduction in CAT and GST activities in the liver, whereas they increased in the gills. Our data are similar to those previously published in other fish species, where photoperiodic manipulations have been shown to influence stress-related enzyme activities (Al-Emran et al., 2024). Extended photoperiods can deplete intracellular antioxidants and reduce the activity of key antioxidant enzymes, making fish more vulnerable to oxidative damage (Yin et al., 2023). Decreases in catalase activity under long photoperiods have been observed in various species, including rainbow trout (Xu et al., 2022), European sea bass (Li et al., 2021), and black sea bass (Micropterus salmoides) (Malinovskyi et al., 2021). Regarding lipid peroxidation (LPO), the present study also revealed that the long photoperiod resulted in elevated levels of lipid peroxidation, particularly in the liver, muscle and brain, with significantly higher values than those observed under a natural photoperiod. It is well known that lipid peroxidation is a consequence of oxidative stress that results in the deterioration of cellular function (Del Rio et al., 2005). In fact, MDA has been extensively employed as a biomarker of lipid peroxidation in response to external stressors (Lushchak, 2016). Longer photoperiod can stimulate metabolic activity and growth, which increase oxygen consumption resulting in higher ROS generation in tissues such as the liver and muscle (Yin et al., 2023). While fish upregulate antioxidant enzymes in response to increased ROS, long photoperiod can deplete antioxidant reserves, leading to accumulation of oxidative damage markers like MDA (Malinovskyi et al., 2021; Yin et al., 2023). In conclusion, the present study indicates that a long photoperiod may alter the antioxidant defense system and cause oxidative stress, ultimately compromising the welfare of S. dumerili. Thus, while some long photoperiods may initially promote growth, prolonged exposure leads to negative health consequences, including lower stress resilience, and poorer overall physiological status.
On the contrary, the current study did not reveal any significant differences in the various oxidative stress parameters concerning stocking density. Our data showed that lower stocking densities did not have impact on chronic stress, consistent with findings in other species cultured under similar lower stocking densities (Sadhu et al., 2014; Yarahmadi et al., 2015; Lee et al., 2022). Additionally, a stocking density of 5.0 kg m-³ did not result in significant effects on the oxidative stress parameters quantified. Previous studies on S. dumerili also found no evidence of adverse effects on stress at a density of 4.2 kg m-³, but higher stocking density (8 kg m-3) induced an elevation of plasma cortisol and a reduction of weight gain (Fernández-Montero et al., 2020). Therefore, higher stocking densities, which are common in commercial aquaculture, could lead to alterations in growth and welfare.
In summary, the present study did not observe any negative effects on the growth of fish stocked at 5 kg m-3 and long photoperiod after 30 days. The absence of changes for plasma stress markers and immune parameters could be interpreted as evidence that the fish were not subjected to chronic stress under the tested conditions. However, the higher levels of cortisol in skin mucus, along with alterations in antioxidant activities in key tissues such as liver or gills, as well as the lipid peroxidation detected in the liver, brain and muscle under long photoperiod, indicate a certain degree of acute and oxidative stress. Although the use of photoperiod manipulation in aquaculture has been shown to be effective in the regulation of reproductive cycles, the oxidative stress could impair the antioxidant defense system and potentially affect the welfare of S. dumerili. Further in-depth studies are required to explore the relationships between external factors, such as photoperiod, and internal factors, including stress responses, physiological homeostasis, growth, immune function, and reproductive processes. However, based on these findings, it is recommended to maintain stocking densities up to 5 kg m³ and to limit exposure to prolonged photoperiods to minimize physiological stress in S. dumerili culture.
Data availability statement
The original contributions presented in the study are included in the article/Supplementary Material. Further inquiries can be directed to the corresponding author/s.
Ethics statement
The animal studies were approved by CSIC Ethical Committee (1208/2022). The studies were conducted in accordance with the local legislation and institutional requirements. Written informed consent was obtained from the owners for the participation of their animals in this study.
Author contributions
MB-B: Writing – original draft, Data curation, Formal analysis, Investigation, Writing – review & editing, Methodology, Visualization. SJ: Resources, Methodology, Writing – review & editing, Validation, Conceptualization, Investigation, Supervision. JG-B: Writing – review & editing, Formal analysis, Data curation, Methodology, Investigation, Visualization. BF: Formal analysis, Writing – review & editing, Methodology, Data curation, Resources, Visualization. AG: Data curation, Visualization, Writing – review & editing, Formal analysis, Methodology. EC-P: Validation, Visualization, Conceptualization, Funding acquisition, Investigation, Supervision, Writing – review & editing. MM: Methodology, Investigation, Supervision, Writing – review & editing, Funding acquisition, Conceptualization, Project administration, Visualization, Data curation, Writing – original draft, Validation.
Funding
The author(s) declare financial support was received for the research and/or publication of this article. This study has received funding from the project ‘Identifications of OWIs (Operational welfare indicators) in two aquaculture spp (OWI-TWO)’ FEMP NTS-ES-161088 v.1, 17-12-2021; and from the programme ThinkInAzul (Spanish Ministerio de Ciencia e Innovación with funding from European Union NextGeneration EU (PRTR-C17.I1) and Gobierno de Canarias). AG is sponsored by Catalina Ruiz Programme, funded by Consejería de Economía, Conocimiento y Empleo, and FSE and JG-B by Ministry of Universities. We acknowledge support of the publication fee by the CSIC Open Access Publication Support Initiative (PROA) through its Unit of Information Resources for Research (URICI).
Acknowledgments
We thank the staff of the COC-IEO, CSIC for their technical assistance in fish management.
Conflict of interest
The authors declare that the research was conducted in the absence of any commercial or financial relationships that could be construed as a potential conflict of interest.
Generative AI statement
The author(s) declare that no Generative AI was used in the creation of this manuscript.
Any alternative text (alt text) provided alongside figures in this article has been generated by Frontiers with the support of artificial intelligence and reasonable efforts have been made to ensure accuracy, including review by the authors wherever possible. If you identify any issues, please contact us.
Publisher’s note
All claims expressed in this article are solely those of the authors and do not necessarily represent those of their affiliated organizations, or those of the publisher, the editors and the reviewers. Any product that may be evaluated in this article, or claim that may be made by its manufacturer, is not guaranteed or endorsed by the publisher.
Supplementary material
The Supplementary Material for this article can be found online at: https://www.frontiersin.org/articles/10.3389/fmars.2025.1657602/full#supplementary-material
References
Aebi H. (1984). Catalase in vitro. Methods Enzymol. 105, 121–126. doi: 10.1016/S0076-6879(84)05016-3
Akhtar M. S., Rajesh M., Kamalam B. S., and Ciji A. (2020). Effect of photoperiod and temperature on indicators of immunity and wellbeing of endangered golden mahseer (Tor putitora) broodstock. J. Therm. Biol. 93, 102694. doi: 10.1016/j.jtherbio.2020.102694
Aksakal E., Ekinci D., Erdoğan O., Beydemir Ş., Alım Z., and Ceyhun S. B. (2011). Increasing stocking density causes inhibition of metabolic–antioxidant enzymes and elevates mRNA levels of heat shock protein 70 in rainbow trout. Livest. Sci. 141, 69–75. doi: 10.1016/j.livsci.2011.07.006
Al-Emran M., Zahangir M. M., Badruzzaman M., and Shahjahan M. (2024). Influences of photoperiod on growth and reproduction of farmed fishes - prospects in aquaculture. Aquac. Rep. 35, 101978. doi: 10.1016/j.aqrep.2024.101978
Almazán-Rueda P., Van Helmond A. T. M., Verreth J. A. J., and Schrama J. W. (2005). Photoperiod affects growth, behavior and stress variables in Clarias gariepinus. J. Fish. Biol. 67, 1029–1039. doi: 10.1111/j.0022-1112.2005.00806.x
Arnao M. B., Cano A., and Acosta M. (1999). Methods to measure the antioxidant activity in plant material. A comparative discussion. Free Radic. Res. 31, 89–96. doi: 10.1080/10715769900301371
Atwood H. L., Tomasso J. R., Webb K., and Gatlin D. M. (2003). Low-temperature tolerance of Nile tilapia, Oreochromis niloticus: Effects of environmental and dietary factors. Aquac. Res. 34, 241–251. doi: 10.1046/j.1365-2109.2003.00811.x
Badiola M., Mendiola D., and Bostock J. (2012). Recirculating Aquaculture Systems (RAS) analysis: Main issues on management and future challenges. Aquac. Eng. 51, 26–35. doi: 10.1016/j.aquaeng.2012.07.004
Barreto M. O., Rey Planellas S., Yang Y., Phillips C., and Descovich K. (2022). Emerging indicators of fish welfare in aquaculture. Rev. Aquac. 14, 343–361. doi: 10.1111/raq.12601
Barton B. A., Morgan J. D., and Vijayan M. M. (2002). “Biological indicators of aquatic ecosystem stress,” in Physiological and Condition-Related Indicators of Environmental Stress in Fish. Ed. Adams S. M. (American Fisheries Society, Bethesda, USA), 111–148.
Birnie-Gauvin K., Costantini D., Cooke S. J., and Willmore W. G. (2017). A comparative and evolutionary approach to oxidative stress in fish: a review. Fish. Fish. 18, 928–942. doi: 10.1111/faf.12215
Biswas A. K., Morita T., Yoshizaki G., Maita M., and Takeuchi T. (2005). Control of reproduction in Nile tilapia Oreochromis niloticus (L.) by photoperiod manipulation. Aquaculture 243, 229–239. doi: 10.1016/j.aquaculture.2004.10.008
Blanco-Vives B., Villamizar N., Ramos J., Bayarri M. J., Chereguini O., and Sánchez-Vázquez F. J. (2010). Effect of daily thermo- and photo-cycles of different light spectrum on the development of Senegal sole (Solea Senegalensis) larvae. Aquaculture 306, 137–145. doi: 10.1016/j.aquaculture.2010.05.034
Boeuf G. and Le Bail P.-Y. (1999). Does light have an influence on fish growth? Aquaculture 177, 129–152. doi: 10.1016/S0044-8486(99)00074-5
Bowden T. J., Thompson K. D., Morgan A. L., Gratacap R. M. L., and Nikoskelainen S. (2007). Seasonal variation and the immune response: A fish perspective. Fish. Shellfish. Immunol. 22, 695–706. doi: 10.1016/j.fsi.2006.08.016
Bradford M. M. (1976). A rapid and sensitive method for quantitation of microgram quantities of protein utilizaing the principle of protein-dye binding. Anal. Biochem. 72, 248–254. doi: 10.1016/j.cj.2017.04.003
Carbajal A., Reyes-López F. E., Tallo-Parra O., Lopez-Bejar M., and Tort L. (2019). Comparative assessment of cortisol in plasma, skin mucus and scales as a measure of the hypothalamic-pituitary-interrenal axis activity in fish. Aquaculture 506, 410–416. doi: 10.1016/j.aquaculture.2019.04.005
Cervera L., Arizcun M., Mercado L., Chaves-Pozo E., and Cuesta A. (2024). Synthetic antimicrobial Nkl and Dic peptides are immunomodulatory but only Dic peptide can be therapeutic against nodavirus infection. Fish. Shellfish. Immunol. 152, 109772. doi: 10.1016/j.fsi.2024.109772
Charney J. and Tomarelli R. M. (1947). A colonmetric method for the determination of the proteolytic activity of duodenal juice. J. Biol. Chem. 171, 501–505. doi: 10.1016/S0021-9258(17)41059-3
Chaves-Pozo E., Abellán E., Baixauli P., and Arizcun M. (2019). An overview of the reproductive cycle of cultured specimens of a potential candidate for Mediterranean aquaculture, Umbrina cirrosa. Aquaculture 505, 137–149. doi: 10.1016/j.aquaculture.2019.02.039
Cnaani A., Tinman S., Avidar Y., Ron M., and Hulata G. (2004). Comparative study of biochemical parameters in response to stress in Oreochromis aureus, O. mossambicus and two strains of O. niloticus. Aquac. Res. 35, 1434–1440. doi: 10.1111/j.1365-2109.2004.01167.x
Conte F. S. (2004). Stress and the welfare of cultured fish. Appl. Anim. Behav. Sci. 86, 205–223. doi: 10.1016/j.applanim.2004.02.003
Costas B., Aragão C., Dias J., Afonso A., and Conceição L. E. C. (2013). Interactive effects of a high-quality protein diet and high stocking density on the stress response and some innate immune parameters of Senegalese sole Solea Senegalensis. Fish. Physiol. Biochem. 39, 1141–1151. doi: 10.1007/s10695-013-9770-1
Datta S. N., Dhawan A., and Singh A. (2017). Trends of fish marketing strategy and trade in Punjab-A survey. Indian J. Ecol. 44, 637–643.
De Mercado E., Larrán A. M., Pinedo J., and Tomás-Almenar C. (2018). Skin mucous: a new approach to assess stress in rainbow trout. Aquaculture 484, 90–97. doi: 10.1016/j.aquaculture.2017.10.031
Del Rio D., Stewart A. J., and Pellegrini N. (2005). A review of recent studies on malondialdehyde as toxic molecule and biological marker of oxidative stress. Nutr. Metab. Cardiovasc. Dis. 15, 316–328. doi: 10.1016/j.numecd.2005.05.003
Ellis T., North B., Scott A. P., Bromage N. R., Porter M., and Gadd D. (2002). The relationships between stocking density and welfare in farmed rainbow trout. J. Fish. Biol. 61, 493–531. doi: 10.1006/jfbi.2002.2057
Esteban M. A., Cuesta A., Chaves-Pozo E., and Meseguer J. (2013). Influence of melatonin on the immune system of fish: A review. Int. J. Mol. Sci. 14, 7979–7999. doi: 10.3390/ijms14047979
Esteban M. A., Cuesta A., Rodríguez A., and Meseguer J. (2006). Effect of photoperiod on the fish innate immune system: A link between fish pineal gland and the immune system. J. Pineal. Res. 41, 261–266. doi: 10.1111/j.1600-079X.2006.00362.x
Fanjara E., Aas G., Cao Y., Kristinova V., Sæbø A., and Stene A. (2024). Sampling time for different matrices in stress assessment of farmed Atlantic salmon post-smolt. J. Steroid Biochem. Mol. Biol. 242, 106542. doi: 10.1016/j.jsbmb.2024.106542
Fazio F. (2019). Fish hematology analysis as an important tool of aquaculture: A review. Aquaculture 500, 237–242. doi: 10.1016/j.aquaculture.2018.10.030
Fernández-Montero A., Torrecillas S., Tort L., Ginés R., Acosta F., Izquierdo M. S., et al. (2020). Stress response and skin mucus production of greater amberjack (Seriola dumerili) under different rearing conditions. Aquaculture 520, 735005. doi: 10.1016/j.aquaculture.2020.735005
Galindo A., Rodríguez C., Reis D. B., Marrero M., Acosta N. G., Barreto M. C., and Pérez J. A. (2022). Valorization of seaweed wracks: Inclusion as additive in diets for grass carp (Ctenopharyngodon idella). Aquac. Nutr. 2022, 6992682 doi: 10.1155/2022/6992682
García-Beltrán J. M., Johnstone C., Arizcun M., Cuesta A., Pérez M., and Chaves-Pozo E. (2024). The susceptibility of shi drum juveniles to betanodavirus increases with rearing densities in a process mediated by neuroactive ligand-receptor interaction. Front. Immunol. 15. doi: 10.3389/fimmu.2024.1304603
Gozdowska M., Sokołowska E., Pomianowski K., and Kulczykowska E. (2022). Melatonin and cortisol as components of the cutaneous stress response system in fish: Response to oxidative stress. Comp. Biochem. Physiol. A. Mol. Integr. Physiol. 268, 111207. doi: 10.1016/j.cbpa.2022.111207
Guardiola F. A., Cuesta A., and Esteban M. Á. (2016). Using skin mucus to evaluate stress in gilthead seabream (Sparus aurata L.). Fish. Shellfish. Immunol. 59, 323–330. doi: 10.1016/j.fsi.2016.11.005
Habdous M., Vincent-Viry M., Visvikis S., and Siest G. (2002). Rapid spectrophotometric method for serum glutathione S-transferases activity. Clin. Chim. Acta 326, 131–142. doi: 10.1016/S0009-8981(02)00329-7
Hashimoto H., Matsuda K., Masuda Y., Jinbo T., Imaizumi H., Teruya K., et al. (2013). Optimal photoperiod condition for culturing early larvae of greater amberjack Seriola dumerili inferred from diurnal rhythm of feeding activity and mass seed production. Aquac. Sci. 61, 95–102. doi: 10.11233/aquaculturesci.61.095
Hoseini S. M., Pérez-Jiménez A., Costas B., Azeredo R., and Gesto M. (2019). Physiological roles of tryptophan in teleosts: current knowledge and perspectives for future studies. Rev. Aquac. 11, 3–24. doi: 10.1111/raq.12223
Imsland A. K., Jonassen T. M., Hangstad T. A., Stefansson S. O., Elvegård T. A., Lemmens S. C. A., et al. (2018). The effect of continuous light and compressed photoperiods on growth and maturation in lumpfish Cyclopterus lumpus. Aquaculture 485, 166–172. doi: 10.1016/j.aquaculture.2017.11.053
Iwama G. K., Aonso L. O. B., and Vijayan M. M. (2006). “Stress in fishes,” in The Physiology of Fishes. Eds. Evans D. H. and Claiborne J. B. (CRC Press, Florida, USA), 319–342.
Laiz-Carrión R., Viana I. R., Cejas J. R., Ruiz-Jarabo I., Jerez S., Martos J. A., et al. (2012). Influence of food deprivation and high stocking density on energetic metabolism and stress response in red porgy, Pagrus pagrus L. Aquac. Int. 20, 585–599. doi: 10.1007/s10499-011-9488-y
Lee J. W., Min B. H., Lee B., Kim K., and Yoon M. (2022). Effects of stocking density on stress, hematological responses, and growth of black rockfish Sebastes schlegelii. J. Aquat. Anim. Health 34, 82–91. doi: 10.1002/aah.10151
Lemos L. S., Angarica L. M., Hauser-Davis R. A., and Quinete N. (2023). Cortisol as a stress indicator in fish: sampling methods, analytical techniques, and organic pollutant exposure assessments. Int. J. Environ. Res. Public Health 20, 6237. doi: 10.3390/ijerph20136237
Leonardi M. O. and Klempau A. E. (2003). Artificial photoperiod influence on the immune system of juvenile rainbow trout (Oncorhynchus mykiss) in the Southern Hemisphere. Aquaculture 221, 581–591. doi: 10.1016/S0044-8486(03)00032-2
Li X., Wei P. P., Liu S. T., Tian Y., Ma H., and Liu Y. (2021). Photoperiods affect growth, food intake and physiological metabolism of juvenile European Sea bass (Dicentrachus labrax l.). Aquacult. Rep. 20, 100656. doi: 10.1016/j.aqrep.2021.100656
Liu Q., Hou Z., Wen H., Li J., He F., Wang J., et al. (2016). Effect of stocking density on water quality and (Growth, Body Composition and Plasma Cortisol Content) performance of pen-reared rainbow trout (Oncorhynchus mykiss). J. Ocean. Univ. China 15, 667–675. doi: 10.1007/s11802-016-2956-2
Lushchak V. I. (2016). Contaminant-induced oxidative stress in fish: a mechanistic approach. Fish. Physiol. Biochem. 42, 711–747. doi: 10.1007/s10695-015-0171-5
Malinovskyi O., Rahimnejad S., Stejskal V., Boňko D., Stara A., and Velíšek J. (2021). Effects of different photoperiods on growth performance and health status of largemouth bass (Micropterus salmoides) juveniles. Aquaculture 548, 737631. doi: 10.1016/j.aquaculture.2021.737631
Martínez-Álvarez R. M., Morales A. E., and Sanz A. (2005). Antioxidant defenses in fish: Biotic and abiotic factors. Rev. Fish. Biol. Fish. 15, 75–88. doi: 10.1007/s11160-005-7846-4
Mates J. M. (2000). Effects of antioxidant enzymes in the molecular control of reactive oxygen species toxicology. Toxicol 153, 83–104. doi: 10.1016/S0300-483X(00)00306-1
Mazzola A., Favaloro E., and Sarà G. (2000). Cultivation of the Mediterranean amberjack, Seriola dumerili (Risso 1810), in submerged cages in the Western Mediterranean Sea. Aquaculture 181, 257–268. doi: 10.1016/S0044-8486(99)00243-4
McDonald G. and Milligan L. (1997). “Ionic, osmotic and acid-base regulation in stress,” in Fish Stress and Health in Aquaculture. Eds. Iwama G. K., Pickering A. D., Sumpter J. P., and Schreck C. B. (Cambridge University Press, Cambridge), 119–145.
Mesa-Herrera F., Taoro-González L., Valdés-Baizabal C., Diaz M., and Marín R. (2019). Lipid and lipid raft alteration in aging and neurodegenerative diseases: A window for the development of new biomarkers. Int. J. Mol. Sci. 20, 3810. doi: 10.3390/ijms20153810
Miki T., Nakatsukasa H., Takahashi N., Murata O., and Ishibashi Y. (2011). Aggressive behavior and cannibalism in greater amberjack, Seriola dumerili: Effects of stocking density, feeding conditions and size differences. Aquac. Res. 42, 1339–1349. doi: 10.1111/j.1365-2109.2010.02722.x
Mommsen T. P., Vijayan M. M., and Moon T. W. (1999). Cortisol in teleosts: Dynamics, mechanisms of action, and metabolic regulation. Rev. Fish. Biol. Fish. 9, 211–268. doi: 10.1023/A:1008924418720
Monge-Ortiz R., Tomás-Vidal A., Rodriguez-Barreto D., Martínez-Llorens S., Pérez J. A., Jover-Cerdá M., et al. (2018). Replacement of fish oil with vegetable oil blends in feeds for greater amberjack (Seriola dumerili) juveniles: Effect on growth performance, feed efficiency, tissue fatty acid composition and flesh nutritional value. Aquac. Nutr. 24, 605–615. doi: 10.1111/anu.12595
Morgan A. L., Thompson K. D., AuChinachie N. A., and Migaud H. (2008). The effect of seasonality on normal hematological and innate immune parameters of rainbow trout Oncorhynchus mykiss L. Fish. Shellfish. Immunol. 25, 791–799. doi: 10.1016/j.fsi.2008.05.011
Murray C. K. and Fletcher T. C. (1976). The immunohistochemical localization of lysozyme in plaice (Pleuronectes platessa L.) tissues. J. Fish. Biol. 9, 329–324. doi: 10.1111/j.1095-8649.1976.tb04681.x
Mylonas C. C., Fostier A., and Zanuy S. (2010). Broodstock management and hormonal manipulations of fish reproduction. Gen. Comp. Endocrinol. 165, 516–534. doi: 10.1016/j.ygcen.2009.03.007
Navarro-Guillén C., Yúfera M., and Perera E. (2022). Biochemical features and modulation of digestive enzymes by environmental temperature in the greater amberjack, Seriola dumerili. Front. Mar. Sci. 9. doi: 10.3389/fmars.2022.960746
North B. P., Turnbull J. F., Ellis T., Porter M. J., Migaud H., Bron J., et al. (2006). The impact of stocking density on the welfare of rainbow trout (Oncorhynchus mykiss). Aquaculture 255, 466–479. doi: 10.1016/j.aquaculture.2006.01.004
Nyuji M., Hamada K., Kazeto Y., Mekuchi M., Gen K., Soyano K., et al. (2018). Photoperiodic regulation of plasma gonadotropin levels in previtellogenic greater amberjack (Seriola dumerili). Gen. Comp. Endocrinol. 269, 149–155. doi: 10.1016/j.ygcen.2018.09.007
Ohkawa H., Ohishi N., and Yagi K. (1979). Assay for lipid peroxides in animal tissues by thiobarbituric acid reaction. Anal. Biochem. 95, 351–358. doi: 10.1016/0003-2697(79)90738-3
Parry J. R. M., Chandan R. C., and Shahani K. M. (1965). A rapid and sensitive assay of muramidase. Proc. Soc Exp. Biol. Med. 119, 384–386. doi: 10.3181/00379727-119-30188
Pascoli F., Lanzano G. S., Negrato E., Poltronieri C., Trocino A., Radaelli G., et al. (2011). Seasonal effects on hematological and innate immune parameters in sea bass Dicentrarchus labrax. Fish. Shellfish. Immunol. 31, 1081–1087. doi: 10.1016/j.fsi.2011.09.014
Portz D. E., Woodley C. M., and Cech J. J. (2006). Stress-associated impacts of short-term holding on fishes. Rev. Fish. Biol. Fish. 16, 125–170. doi: 10.1007/s11160-006-9012-z
Puvanendran V. and Brown J. A. (2002). Foraging, growth and survival of Atlantic cod larvae reared in different light intensities and photoperiods. Aquaculture 214, 131–151. doi: 10.1016/S0044-8486(02)00045-5
Quade M. J. and Roth J. A. (1997). A rapid, direct assay to measure degranulation of bovine neutrophil primary granules. Vet. Immunol. Immunopathol. 58, 239–248. doi: 10.1016/S0165-2427(97)00048-2
Reebs S. G. (2011). “Sensory systems, perception, and learning|Circadian rhythms in fish,” in Encyclopedia of Fish Physiology. Ed. Farrel A. P. (Academic Press, San Diego, CA, USA), 736–743.
Rodríguez-Barreto D., Jerez S., Cejas J. R., Martin M. V., Acosta N. G., Bolaños A., et al. (2014). Ovary and egg fatty acid composition of greater amberjack broodstock (Seriola dumerili) fed different dietary fatty acids profiles. Eur. J. Lipid Sci. Technol. 116, 584–595. doi: 10.1002/ejlt.201300462
Rodríguez-Barreto D., Jérez S., Cejas J., Martín M., Acosta N., Bolaños A., et al. (2017). Effect of different rearing conditions on body lipid composition of greater amberjack broodstock (Seriola dumerili). Aquac. Res. 48, 505–520. doi: 10.1111/ARE.12898
Roy J., Terrier F., Marchand M., Herman A., Heraud C., Surget A., et al. (2021). Effects of low stocking densities on zootechnical parameters and physiological responses of rainbow trout (Oncorhynchus mykiss) juveniles. Biol 10 (10), 1040. doi: 10.3390/biology10101040
Sadhu N., Sharma S. K., Joseph S., Dube P., and Philipose K. K. (2014). Chronic stress due to high stocking density in open sea cage farming induces variation in biochemical and immunological functions in Asian seabass (Lates calcarifer, Bloch). Fish. Physiol. Biochem. 40, 1105–1113. doi: 10.1007/s10695-014-9909-8
Sadoul B. and Geffroy B. (2019). Measuring cortisol, the major stress hormone in fishes. J. Fish. Biol. 94, 540–555. doi: 10.1111/jfb.13904
Sato H., Yokoyama S., Yu Y., Koshio S., Ohno T., Ohno Y., et al. (2016). Growth performance of juvenile amberjack Seriola dumerili fed a low-fish meal diet under cage culture conditions. Aquac. Sci. 64, 1–12.
Schreck C. B. (2010). Stress and fish reproduction: The roles of allostasis and hormesis. Gen. Comp. Endocrinol. 165, 549–556. doi: 10.1016/j.ygcen.2009.07.004
Schreck C. B. and Tort L. (2016). The concept of stress in fish. Fish. Physiol. 35, 1–34. doi: 10.1016/B978-0-12-802728-8.00001-1
Shahjahan M., Islam M. J., Hossain M. T., Mishu M. A., Hasan J., and Brown C. (2022). Blood biomarkers as diagnostic tools: An overview of climate-driven stress responses in fish. Sci. Total. Environ. 843, 156910. doi: 10.1016/j.scitotenv.2022.156910
Sneddon L. U., Wolfenden D. C. C., and Thomson J. S. (2016). Stress management and welfare. Fish. Physiol. 35, 463–539. doi: 10.1016/B978-0-12-802728-8.00012-6
Song C., Sun C., Liu B., and Xu P. (2023). Oxidative stress in aquatic organisms. Antioxid. (Basel). 12, 1223. doi: 10.3390/antiox12061223
Sunyer J. O. and Tort L. (1995). Natural hemolytic and bactericidal activities of sea bream Sparus aurata serum are effected by the alternative complement pathway. Vet. Immunol. Immunopathol. 45, 333–345. doi: 10.1016/0165-2427(94)05430-Z
Valenzuela A. E., Silva V. M., and Klempau A. E. (2006). Effects of constant light on hematological parameters of cultured rainbow trout (Oncorhynchus mykiss) in the Southern Hemisphere. Fish. Physiol. Biochem. 32, 113–120. doi: 10.1007/s10695-006-9103-8
Valero Y., García-Alcázar A., Esteban M. Á., Cuesta A., and Chaves-Pozo E. (2014). Seasonal variations of the humoral immune parameters of European sea bass (Dicentrarchus labrax L.). Fish. Shellfish. Immunol. 39, 185–187. doi: 10.1016/j.fsi.2014.05.011
Villamizar N., Blanco-Vives B., Migaud H., Davie A., Carboni S., and Sánchez-Vázquez F. J. (2011). Effects of light during early larval development of some aquacultured teleosts: A review. Aquaculture 315, 86–94. doi: 10.1016/j.aquaculture.2010.10.036
Wang Y., Ni J., Nie Z., Gao J., Sun Y., Shao N., et al. (2020). Effects of stocking density on growth, serum parameters, antioxidant status, liver and intestine histology and gene expression of largemouth bass (Micropterus salmoides) farmed in the in-pond raceway system. Aquac. Res. 51, 5228–5240. doi: 10.1111/are.14862
Wei H., Cai W.-J., Liu H.-K., Han D., Zhu X.-M., Yang Y.-X., et al. (2019). Effects of photoperiod on growth, lipid metabolism and oxidative stress of juvenile gibel carp (Carassius auratus). J. Photochem. Photobiol. B. Biol. 198, 111552. doi: 10.1016/j.jphotobiol.2019.111552
Wu F., Wen H., Tian J., Jiang M., Liu W., Yang C., et al. (2018). Effect of stocking density on growth performance, serum biochemical parameters, and muscle texture properties of genetically improved farm tilapia, Oreochromis niloticus. Aquac. Int. 26, 1247–1259. doi: 10.1007/s10499-018-0281-z
Xu H., Shi C., Ye Y., Mu C., and Wang C. (2022). Effects of different photoperiods and feeding regimes on immune response, oxidative status, and tissue damage in juvenile rainbow trout (Oncorhynchus mykiss). Front. Mar. Sci. 9, 1036289. doi: 10.3389/fmars.2022.1036289
Yarahmadi P., Miandare H. K., Hoseinifar S. H., Gheysvandi N., and Akbarzadeh A. (2015). The effects of stocking density on hemato-immunological and serum biochemical parameters of rainbow trout (Oncorhynchus mykiss). Aquac. Int. 23, 55–63. doi: 10.1007/s10499-014-9797-z
Yin P., Saito T., Fjelldal P., Björnsson B., Remø S., Hansen T., et al. (2023). Seasonal changes in photoperiod: effects on growth and redox signaling patterns in atlantic salmon postsmolts. Antioxidants 12, 1546. doi: 10.3390/antiox12081546
Zhu Y. J., Yang D. G., Chen J. W., Yi J. F., Liu W. C., and Zhao J. H. (2011). An evaluation of stocking density in the cage culture efficiency of Amur sturgeon Acipenser schrenckii. J. Appl. Ichthyol. 27, 545–549. doi: 10.1111/j.1439-0426.2011.01675.x
Keywords: Seriola dumerili, photoperiod, stocking density, welfare, stress biomarker
Citation: Barreto-Bailet M, Jerez S, García-Beltrán JM, Felipe BC, Galindo A, Chaves-Pozo E and Martín MV (2025) Combined effect of photoperiod and stocking density on the welfare of greater amberjack (Seriola dumerili). Front. Mar. Sci. 12:1657602. doi: 10.3389/fmars.2025.1657602
Received: 01 July 2025; Accepted: 13 August 2025;
Published: 02 September 2025.
Edited by:
Benjamin Costas, University of Porto, PortugalCopyright © 2025 Barreto-Bailet, Jerez, García-Beltrán, Felipe, Galindo, Chaves-Pozo and Martín. This is an open-access article distributed under the terms of the Creative Commons Attribution License (CC BY). The use, distribution or reproduction in other forums is permitted, provided the original author(s) and the copyright owner(s) are credited and that the original publication in this journal is cited, in accordance with accepted academic practice. No use, distribution or reproduction is permitted which does not comply with these terms.
*Correspondence: M. Virginia Martín, dmlyZ2luaWEubWFydGluQGllby5jc2ljLmVz