Abstract
Introduction:
Fishmeal is beneficial to the growth performance of grass carp. However, it remains unclear whether fishmeal can enhance the flavor of muscle, and contribute to the regulatory mechanisms involved in its interaction with the intestinal microbiome.
Methods:
In this study, grass carp (70.01 ± 5.34 g) were fed with diets containing 0% (FL), 3% (FM), and 6% (FH) fishmeal for 60 days. The growth performance, intestinal and muscle histomorphology, intestinal microflora, and muscle volatile compounds (VOCs) were evaluated.
Results:
The results showed that compared with the FL group, the final body weight (FBW), weight gain rate (WGR), specific growth rate (SGR), and intestinal villus height of grass carp in the FM and FH groups were significantly increased. Compared with the FL and FM groups, the muscle fiber density in the FH group was significantly increased, and the muscle fiber diameter was significantly reduced. Microbial data analysis found that the three treatment groups were well separated in the NMDS plot, and different levels of fishmeal had a significant impact on microbial community composition (Stress = 0.084). In the LefSe analysis (LDA value > 3.0), Actinobacteria in the FL group, Petrimonas in the FM group, Bacteroides paurosaccharolyticus, and Erysipelatostridiaceae in the FH group all showed significant responses. The intestinal microbiota composition was closer in the FM and FH groups compared with the FL group. GC-IMS analysis indicated that 53 VOCs were detected in the muscle. The FL group had fewer VOCs, and most of the VOCs had lower contents than those in the FH group. Spearman correlation analysis showed that aldehydes were significantly positively correlated with Corynebacterium, Bacteroides, Cetobacterium, Erysipelatoclostridium, Aeromonas, Shewanella, and Vibrio.
Discussion:
Based on the evaluation of growth performance, intestinal morphology, and microflora, the diet containing 3% fishmeal is suitable. However, the muscle fiber characteristics and VOCs profile of grass carp fed with 6% fishmeal diet is superior to that of the 3% fishmeal group.
1 Introduction
The grass carp (Ctenopharyngodon idellus) belongs to the carp and minnow family (Cyprinidae) (Cudmore and Mandrak, 2004) and is the most productive freshwater fish species in aquaculture in China. It is reported that the annual production of grass carp exceeded 5.94 million tons in 2023 (China Fishery Statistical Yearbook, 2024). In its natural habitat, grass carp primarily feeds on riparian and aquatic plants (Zhang et al., 2022). Plant proteins such as soybean meal, rapeseed meal, and cottonseed meal are widely used in grass carp feed. However, the anti-nutritional factors in rapeseed meal and cottonseed meal have negative impacts on the health of grass carp, such as reducing growth performance and impairing intestinal function (Choi et al., 2020; Han et al., 2024). The addition of an appropriate level of fishmeal has been proven to enhance the growth performance of grass carp (Peng et al., 2020). Fishmeal is a valuable source of animal protein and is widely used in aquaculture feed due to its balanced amino acid profile, high crude protein content, and good digestibility. The inclusion of fishmeal in feed has been shown to promote grass carp growth by improving feed conversion efficiency, increasing palatability, and facilitating the digestion and absorption of nutrients (Hodar et al., 2020). Nonetheless, the impact of increased levels of fishmeal in the feed on muscle flavor in farmed grass carp remains unclear.
The interaction between the intestine and the endogenous microbiota contributes to the growth, maintaining intestinal homeostasis, enhancing immunity, and disease resistance in aquatic animals (Nayak, 2010). The intestinal microbiota of fish is involved in the synthesis of vitamins, digestive enzymes, and metabolic products (Rimoldi et al., 2018). The absence of probiotics such as Lactobacillus (Aghamohammad et al., 2022) and Bacteroides may lead to the host suffering from inflammatory bowel disease (Zhang et al., 2024). Dietary factors have been proven to affect the composition of the gut microbiota (Nayak, 2010; Wu et al., 2012). Ringø et al. observed that the dominance of Gram-positive bacteria belonging to Brochothrix and Carnobacterium species in the gastrointestinal tract of Atlantic cod (Gadus morhua L.) fed with fishmeal, while Chryseobacterium spp, Psychrobacter glacincola and Gram-positive bacteria belonging to Carnobacterium dominated the gastrointestinal tract when fed with soybean meal. In the context of grass carp farming, replacing fishmeal with rapeseed meal has been found to decreased the relative abundance of Proteobacteria while increased the relative abundance of Firmicutes and Actinobacteria in the fish intestine, potentially causing enteritis and inhibiting growth (Ringø et al., 2006). Replacing fishmeal with rapeseed meal reduces the relative abundance of Proteobacteria in the gut of grass carp, while increasing the relative abundance of Firmicutes and Actinobacteria, and may lead to enteritis and growth inhibition (Yao et al., 2019).
Volatile compounds (VOCs) play a key role in determining the aroma of fish products (Mu et al., 2017). Dietary components, such as fishmeal and meat meal, have been proven to affect the composition of VOCs in fish muscle, thereby influencing the overall flavor profile of the meat (Williams et al., 2003). For instance, a low-fishmeal diet has been shown to reduce the content of certain categories of VOCs in the muscle tissue of large yellow croaker (Larimichthys crocea) (Mu et al., 2017). Gas chromatography-ion mobility spectrometry (GC-IMS) leverages the separation characteristics of GC, the advantages of fast response and high sensitivity of IMS, and is capable of detecting a large number of compounds with different chemical groups (Zhang et al., 2020). The application of GC-IMS enables more complex analysis of VOCs in fish products (Zhang et al., 2020). Moreover, GC-IMS requires a lower injection temperature, which can retain the original flavor information of the sample, making the analytical results more authentic and convincing (Lin et al., 2022). In this study, GC-IMS was employed to investigate the effects of fishmeal levels on the variations of VOCs in grass carp muscle and to establish distinct flavor profiles.
Typically, fishmeal is included at a 3% level in grass carp feeds. Building on this, we therefore investigated the effects of zero supplementation and excessive supplementation on muscle flavor and the intestinal microbiota of grass carp through application of GC-IMS to analyze VOCs profiles, and high-throughput sequencing (HTS) in grass carp. Ultimately, the central question is not merely how much fishmeal can be omitted or added, but how these low-, standard- and high-fishmeal treatments will translate into consumer acceptance. By deliberately designing this gradient, we seek to pinpoint the exact formulation that best elevates flesh texture, flavour and overall sensory appeal—turning grass carp from a routine staple into a product that shoppers actively reach for. Additionally, a Spearman correlation analysis was conducted to investigate the relationship between the predominant microbiome and VOCs.
2 Materials and methods
2.1 Experiment diets
The experiment utilized soybean meal, cottonseed meal, and rapeseed meal as primary protein sources, soybean oil and fish oil as primary lipid sources. The composition and formulation of the experimental diets are detailed in Table 1. The feed fishmeal-free (FL) is used as the basal diet. Experimental diets are prepared by adding 3% (medium level) fishmeal (referred to as FM) and 6% (high level) fishmeal (referred to as FH) to the basal diet. All diets ingredients were ground and filtered through a 40-mesh screen, and then pelletized using a twin screw extruder (TSE65, Modern Yanggong Machinery Technology Development Co., Ltd, Beijing, China) (2 mm × 2 mm). The pellets are subsequently dried in a dryer at 60°C and stored in sealed bags at room temperature until feeding.
Table 1
| Ingredients (%) | Treatments | ||
|---|---|---|---|
| FL | FM | FH | |
| Fish meal | 0.00 | 3.00 | 6.00 |
| Soybean meal | 24.00 | 24.00 | 24.00 |
| Cottonseed meal | 14.00 | 14.00 | 14.00 |
| Rapeseed meal | 35.00 | 29.00 | 25.00 |
| DL-Met (98.5%) | 0.05 | 0.05 | 0.05 |
| Wheat flour | 17.9 | 20.90 | 21.9 |
| Ca (H2PO4)2 | 2.00 | 2.00 | 2.00 |
| Fish oil | 2.50 | 2.50 | 2.50 |
| Soybean oil | 1.25 | 1.25 | 1.25 |
| Vitamin premixa | 1.00 | 1.00 | 1.00 |
| Mineral premixa | 2.00 | 2.00 | 2.00 |
| Choline chlorideb | 0.25 | 0.25 | 0.25 |
| Ethoxyquinb | 0.05 | 0.05 | 0.05 |
| Total | 100 | 100 | 100 |
| Nutrient contents | |||
| Crude proteinc | 37.58 | 37.72 | 37.89 |
| Crude lipidc | 4.92 | 5.12 | 5.04 |
| Water contentd,% | 10 | 10 | 10 |
| Crude fiberd,% | 7.7 | 7.6 | 7.5 |
| Ashd,% | 9.2 | 9.1 | 9.0 |
| Nitrogen-free extractd,% | 34.9 | 35.4 | 35.9 |
| Digestible energyd, MJ/kg | 12.8 | 13.0 | 13.0 |
Formulation and proximate composition of the experimental diets (% dry matter).
Vitamin premix (g/kg): retinyl acetate (500,000 IU g-1), 0.386; cholecalciferol (500,000 IU g-1), 0.40; D, L-a-tocopherol acetate (50%), 23.23; menadione (22.9%), 0.83; cyanocobalamin (1%), 0.94; D-biotin (2%), 0.75; folic acid (95%), 0.42; thiamine nitrate (98%), 0.09; ascorhyl acetate (95%), 9.77; niacin (99%), 4.04; meso-inositol (98%), 19.39; calcium-D-pantothenate (98%), 3.85; riboflavin (80%), 0.73; pyridoxine hydrochloride (98%), 0.62. All ingredients were diluted with maize starch to 1 kg; Mineral premix (g/kg): MnSO4·H2O (31.8% Mn), 2.6590; MgSO4·H2O (15.0% Mg), 200.0000; FeSO4·H2O (30.0% Fe), 12.2500; ZnSO4·H2O (34.5% Zn), 8.2460; CuSO4·5H2O (25.0% Cu), 0.9560; KI (76.9% I), 0.0650; Na2SeO3 (44.7% Se), 0.0168. All ingredients were diluted with maize starch to 1 kg.
Choline chloride with a purity of 50%; Ethoxyquin with a purity of 30%.
Nutrient contents were actual values.
Nutrient levels were theoretical values.
2.2 Experimental fish and feeding trial
The experiment was carried out in a fish farm in Xidongting district (Changde, Hunan, China). Grass carps were obtained from a commercial farm (Changde, Hunan, China). The grass carp are acclimated in cages for two weeks. The grass carps were subjected to a 24-hour fasting period before the formal experiment. A total of 270 healthy grass carps (average weight 70.01 ± 5.34 g) were selected and randomly divided into nine floating cages (2.0 × 1.5 × 1.5 m). The experiment was divided into three treatment groups, each with three replicates (n = 30). After the experiment begins, the fish are fed three times a day (at 7:00, 12:00, and 17:00). During the 60-day experimental period, the mortality and feeding conditions of the grass carp are recorded daily. Culture unit: 20-hectare earthen pond, average depth 2 m. Water volume: ~400,000 m³. Water exchange: 10% of pond volume per day via continuous inflow/outflow. Throughout the experiment, water quality parameters are monitored: water temperature ranges from 24.5 to 30.3°C, pH values range from 7.3 to 7.8, and dissolved oxygen levels range from 6.5 to 7.5 mg/L.
2.3 Sample collection
At the end of the experiment, grass carp were fasted for 8 h. Then, three fish were randomly selected from each cage. Their body weight was measured, and samples of the posterior intestine contents were collected. These samples are rapidly frozen in liquid nitrogen and then stored in a -80°C freezer. The samples from three fish in the same net cage were pooled into one sample for further analysis of the intestinal microbial community. The remained grass carp are then fasted for another 16h, and the total number and body weight in each cage were recorded. Additionally, three fish from each cage were randomly selected and anesthetized, and then the body length, body weight, visceral, and liver weight were measured. The section of posterior intestine (1 cm×1 cm) and the left dorsal muscle samples (1 cm×1 cm×1 cm) were collected for histomorphology analysis. The right dorsal muscle samples were collected. The samples from the three fish in the same cage are mixed into one sample, rapidly frozen in liquid nitrogen, and stored at -80°C, and stored in a -80°C freezer for the subsequent measurement of VOCs.
The growth performance of the grass carp was determined as follows:
2.4 Histomorphology analysis
Intestinal and muscle sections are prepared according to the method of T. Tang (Tang et al., 2021). Sections are photographed using a fluorescence microscopy (Olympus, Tokyo, Japan). The complete intestinal villus height and villus width are measured by ImageJ software. The number of intact myofibers in various regions of the transected muscle is measured, and the fiber density was calculated as the number of fibers per square millimeter (fibers/mm (Zhang et al., 2022)), and the fiber diameter (≥ 10 µm) is calculated based on the area = π × r².
2.5 Intestinal microflora analysis
Total DNA is extracted from intestinal contents using the sodium dodecyl sulfate method according to the manufacturer’s instructions. Next-generation HTS is employed to analyze the composition of the gut microbiota. The V4 hypervariable region of the bacterial 16S rRNA gene is amplified using specific primers with barcodes, 515F (5’-GTGCCAGCMGCCGCGGTAA-3’) and 806R (5’-GGACTACHVGGGTWTCTAAT-3’), followed by sequencing on the NovaSeq 6000 platform. Samples are annotated using the SILVA database and the Mothur method. After dereplication of valid tags, singletons are removed based on abundance, and then clustering at 97% similarity. Weighted UniFrac distance is used to calculate the sample distance matrix to investigate similarities among different samples. The UPGMA clustering tree is generated using the QIIME software (version 1.9.1). A species abundance clustering heatmap (top 30) is created based on species annotation and abundance information at the genus level using R software (version 3.1.0). Non-Metric Multi-Dimensional Scaling (NMDS) analysis is conducted using the vegan package in R software. LEfSe (LDA Effect Size) analysis is performed using LEfSe software (version 1.0) to identify species with significant differences among groups (Wen et al., 2021). Sequencing and routine data analysis were conducted by Novogen Co., Ltd. (Novogen, Beijing, China).
2.6 Muscle gas chromatography-ion mobility spectrometry analysis
VOCs in muscle samples are analyzed using an integrated system composed of an Agilent 490 Gas Chromatograph (Agilent Technologies, Palo Alto, CA, USA) and IMS instrument (FlavorSpec®, Gesellschaft für Analytische Sensorsysteme mbH, Dortmund, Germany). The detection method follows the protocol outlined by Zhang Q et al (Granato et al., 2018; Zhang et al., 2020). N-Ketones C4-C9 (Sigma-Aldrich, St. Louis, MO, USA) are used as external references to calculate the retention indices (RI) of aromatic compounds. Aromatic compounds in muscle samples are identified by comparing their RI values with standards in the GC-IMS library. Quantification of each VOC in muscle samples is performed using established calibration curves, with results expressed as the relative content of each VOC relative to the total aroma content (n=3) (Song et al., 2021). For downstream analysis, individual VOCs were grouped into chemical classes (aldehydes, alcohols, ketones, etc.). The abundance of each class was calculated as the sum of the peak areas of all compounds belonging to that class.
2.7 Statistical analysis
Statistical analyses were performed using the Statistical Package for the Social Sciences (SPSS) 23 software (IBM, Armonk, USA). Data were presented as mean ± standard deviation (SD), the analysis was conducted using one-way ANOVA, with a significance threshold level set at P< 0.05. Laboratory Analytical Viewer (LAV, G.A.S., Dortmund, Germany) software and GC-IMS Library Search were used to analyzed the aroma profiles “Fingerprint” gallery plots and principal component analysis (PCA) of muscle samples are analyzed using laboratory analytical viewer (LAV, G.A.S., Dortmund, Germany) software and GC-IMS Library Search. In R software, Spearman correlation is used to calculate the correlation between the top 30 bacterial genera in gut microbiota abundance and VOCs with statistical differences.
3 Results and discussion
3.1 Growth performance
The growth performance results of grass carp are shown in Table 2. Compared with the FL group, the FBW, WGR, and SGR of the FM and FH groups are significantly increased (P<0.05). This is similar to the results obtained by Peng, K.-S. et al. regarding the impact of fish meal substitution for soybean meal on the growth performance of grass carp (Peng et al., 2020). Fishmeal is a widely used feed ingredient which contains a higher percentage of protein, energy, minerals, and vitamins (Cho and Kim, 2011). Fishmeal applied with other animal and vegetable proteins in the diet had synergistic effects which could balance the amino acid composition, promote fast growth of fish, and reduce feeding costs (Cho and Kim, 2011). Therefore, completely or partially replacing plant protein with fishmeal can positively impact the growth performance of grass carp.
Table 2
| Parameters | Treatments | ||
|---|---|---|---|
| FL | FM | FH | |
|
70.09 ± 0.07 | 70.00 ± 0.32 | 69.95 ± 0.18 |
|
209.15 ± 7.48a | 236.72 ± 10.47b | 238.18 ± 11.25b |
|
198.39 ± 10.94a | 238.22 ± 15.87b | 240.52 ± 16.96b |
|
1.73 ± 0.06a | 1.93 ± 0.08b | 1.94 ± 0.08b |
|
3.22 ± 0.13 | 2.85 ± 0.34 | 2.59 ± 0.32 |
|
1.94 ± 0.16 | 2.27 ± 0.57 | 1.83 ± 0.17 |
|
12.20 ± 0.22 | 13.23 ± 1.09 | 12.15 ± 0.25 |
|
2.10 ± 0.18 | 2.10 ± 0.12 | 2.06 ± 0.13 |
Effect of dietary fishmeal on growth performance of grass carp.
IBW, initial body weight; FBW, final body weight; WGR, weight gain rate; SGR, specific growth rate; FCR, feed conversion ratio; HSI, hepatosomatic index; VSI, viscerosomatic index; CF, condition factor. FL: grass carp fed diet without fishmeal; FM: grass carp fed diet with 3% fishmeal; FH: grass carp fed diet with 6% fishmeal. Data are expressed as means ± SD. Value with different superscripts are significantly different (P< 0.05, n ≥ 3).
This experiment adopts a stepwise feed formulation: fishmeal increases from 0% to 6% while rapeseed meal decreases from 35% to 25%. Rapeseed meal contains several known antinutritional factors—such as glucosinolates, tannins, and phytates—that suppress fish growth and disturb the gut microbiota. Hence, part of the observed improvements in growth performance and gut microbiota cannot be ruled out as arising from the reduction of rapeseed meal rather than from the increase in fishmeal, and the overall feed effect may concurrently benefit from the lower rapeseed meal level.
Ethoxyquin was included at 0.05% of the diet as a necessary antioxidant to ensure feed stability during storage. Ethoxyquin was added only as an antioxidant. However, published data indicate that even this level can transiently suppress respiratory burst and lysozyme activity in tilapia (Yamashita et al., 2009) and accumulate as dimer residues in salmonid tissues (Ørnsrud et al., 2011). Such mild immunomodulation could have dampened diet-related inflammatory responses, although growth performance remained unaffected (Wang et al., 2015). At current ingredient prices, the 6% formulation increases feed cost by approximately 8%–10% per tonne compared with the 3% formulation. Therefore, based on the effect–cost trade-off, 3% fishmeal represents the economically optimal recommendation; a 6% fishmeal formulation is considered only if the market offers a premium for “flavour” that exceeds 10%. Subsequent studies quantify the actual revenue gain from this flavour improvement through consumer sensory tests and economic modelling to confirm the strategy’s feasibility.
3.2 Tissue morphology
The morphological results of grass carp intestines and muscles are shown in Figures 1A and 1B. The results in Figure 1C indicate that, compared with the FL group, the intestinal villus height of the FM and FH groups is significantly increased (p< 0.05). The intestine is the primary site for the digestion and absorption of nutrients, and the height of intestinal villi is positively correlated with nutrient absorption (Zhu et al., 2012). Therefore, the addition of 3% and 6% fishmeal may enhance the intestinal digestive and absorptive capacity of grass carp, thereby promoting their growth, by increasing the height of intestinal villi to expand the intestinal absorptive surface area. The results in Figures 1E and 1F show that, compared to the FL and FM group, the fiber diameter of the FH group significantly decreased while the fiber density significantly increased (p< 0.05). Changes in muscle fiber size are achieved through the balance between protein synthesis and degradation (Yu et al., 2017). Nutritional status is mirrored in the muscle fibers’ characteristics, including their size, shape, and classification (Rodriguez-Torres et al., 2020). An increase in fiber density and a decrease in fiber diameter can improve meat tenderness (Kopač and Ručigaj, 2024). Therefore, a fishmeal level of 6% may elevate the quality of grass carp by improving the morphology of muscle fibers.
Figure 1
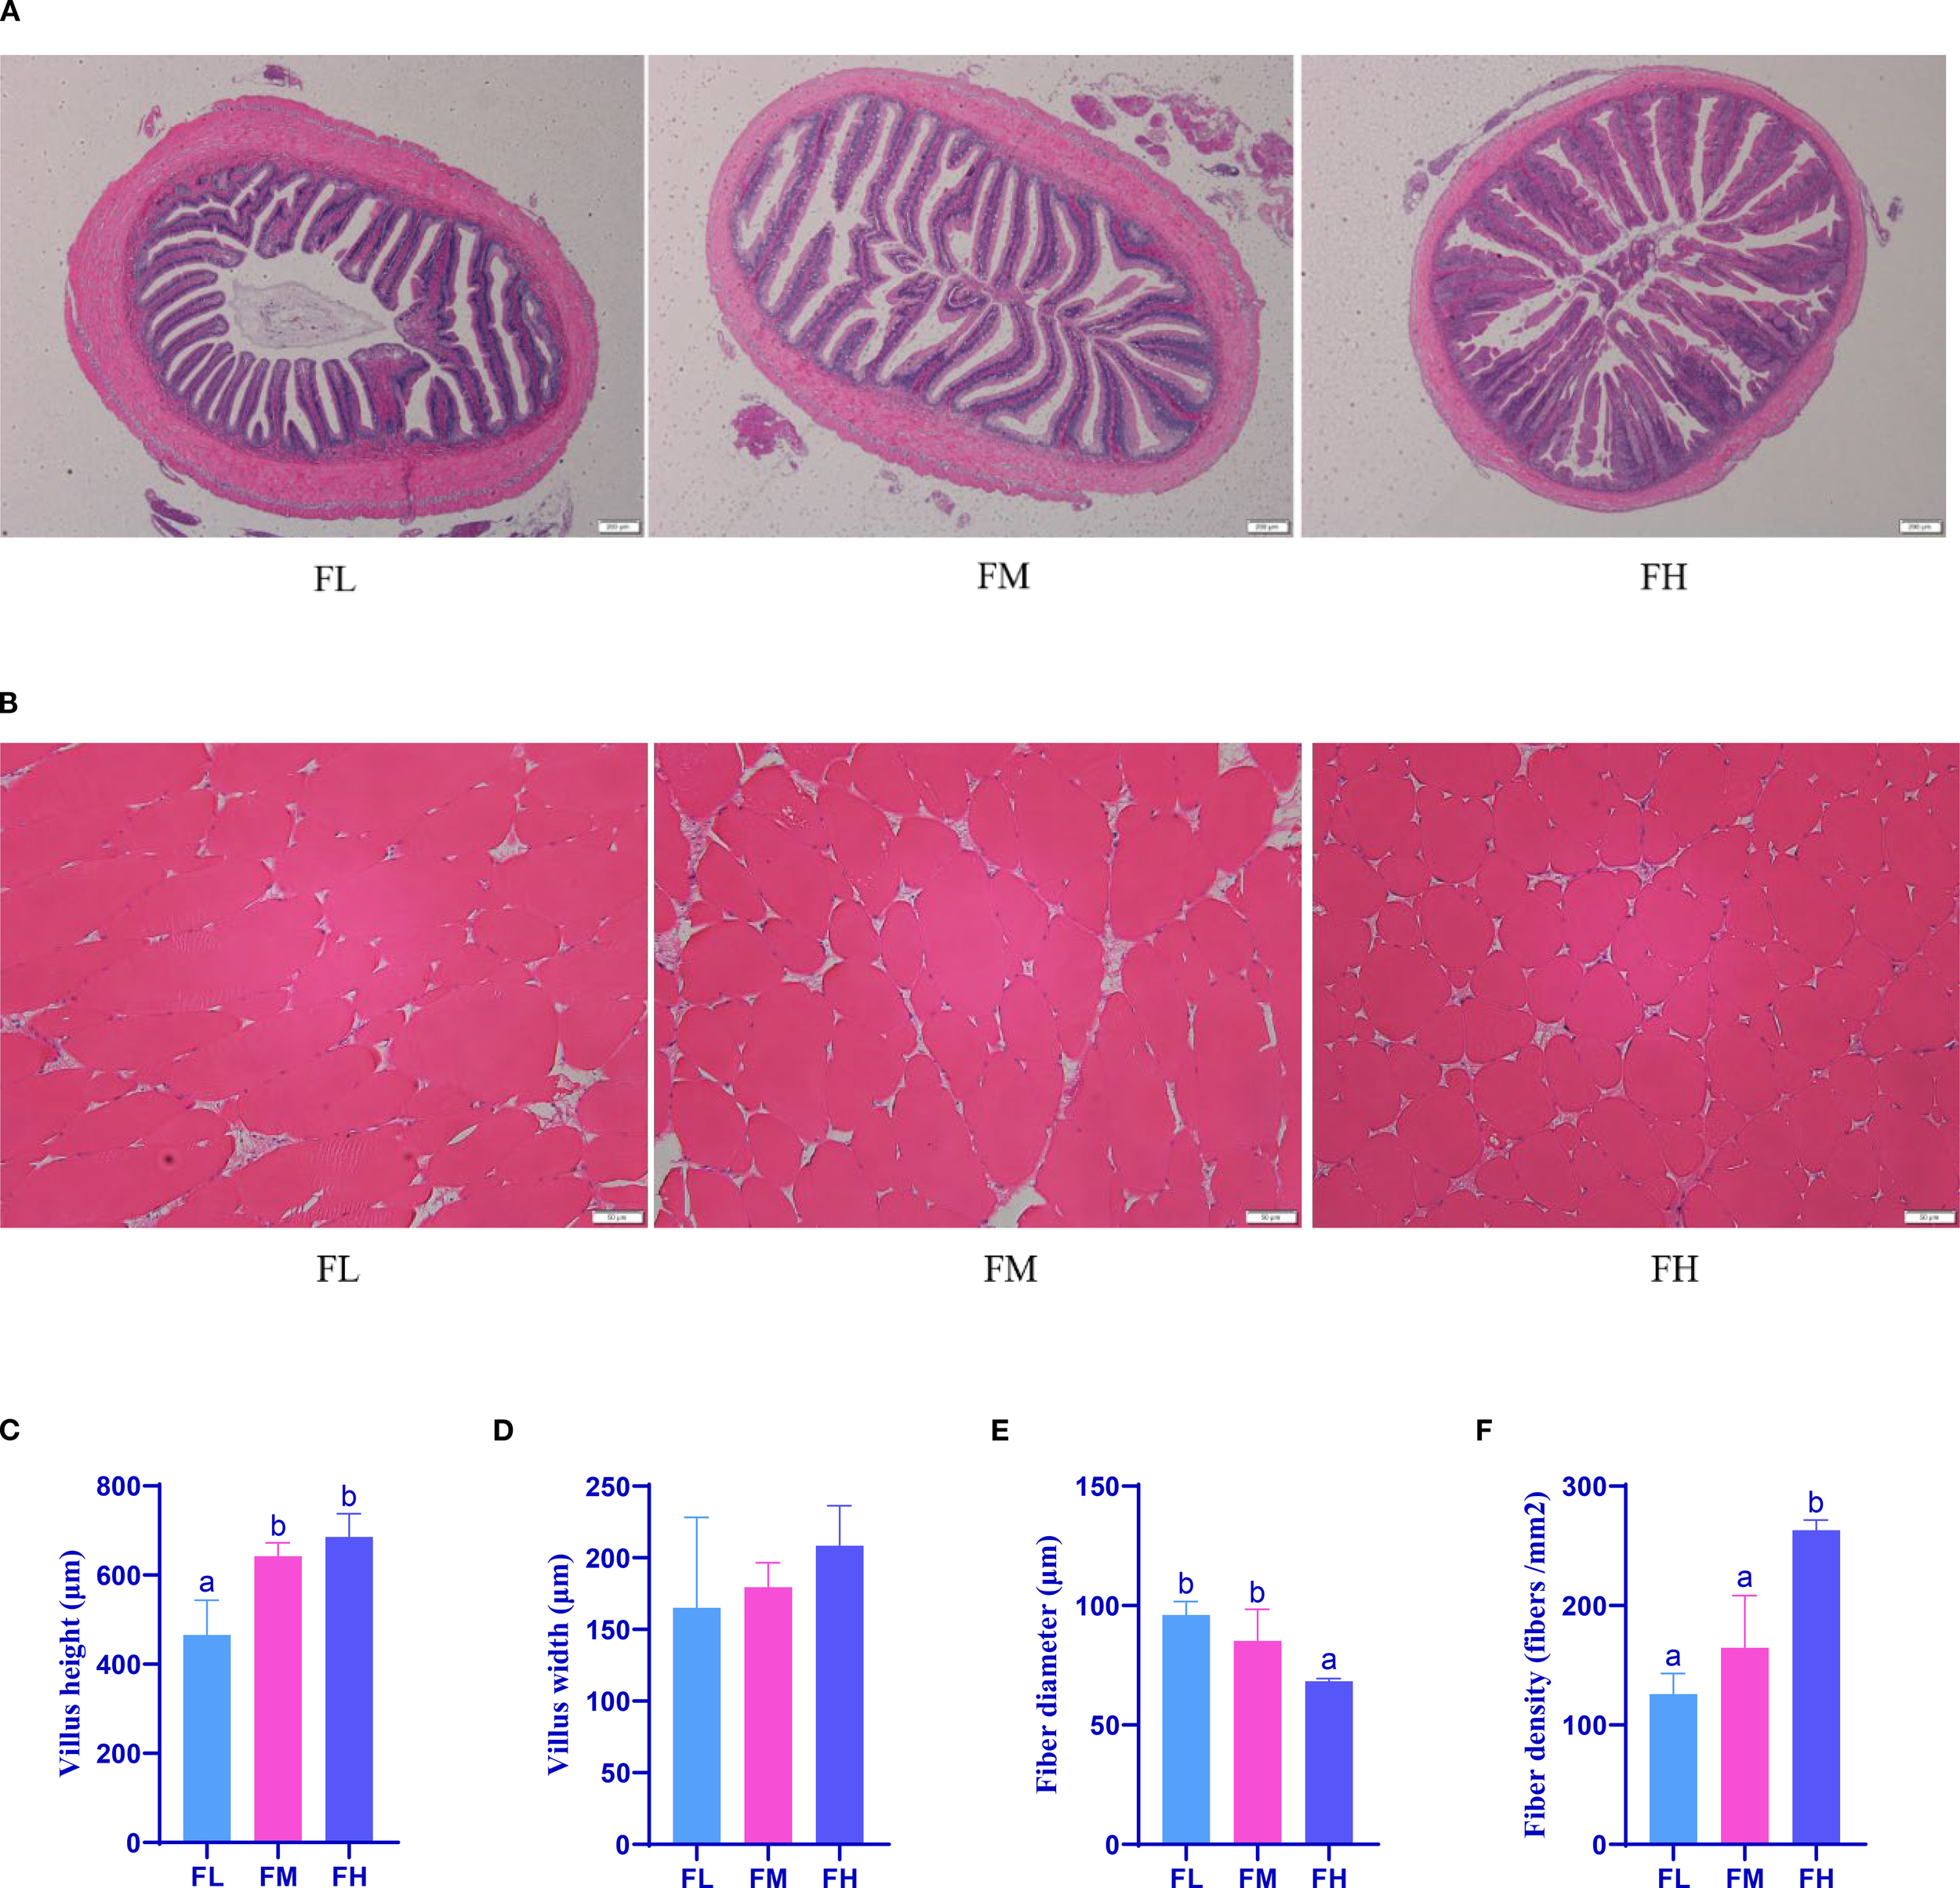
Effect of dietary fishmeal on tissue morphology of grass carp. Note: (A) Images of hematoxylin and eosin-stained sections of the posterior intestines of grass carp. (B) Images of hematoxylin and eosin-stained sections of the dorsal muscle of grass carp. (C) Effect of dietary fishmeal on grass carp villus height. (D) Effect of dietary fishmeal on grass carp villus width. (E) Effect of dietary fishmeal on grass carp dorsal muscle fiber diameter. (F) Effect of dietary fishmeal on grass carp dorsal muscle fiber density. FL: grass carp fed diet without fishmeal; FM: grass carp fed diet with 3% fishmeal; FH: grass carp fed diet with 6% fishmeal. Value with different superscripts are significantly different (P< 0.05, n ≥ 3).
3.3 Intestinal microflora
The sequencing result of the intestinal microbiome is shown in Figure 2. The results of the UPGMA phylogenetic tree analysis indicate that Firmicutes, Actinobacteria, Bacteroidota, and Fusobactariota were the predominant bacteria at the phylum and species level in all groups (Figures 2A, B). This is consistent with the findings of Wu, S. and Zhang, X. et al (Wu et al., 2012; Zhang et al., 2014). Furthermore, the composition of bacterial phyla in the FM and FH groups was closer to each other than to the FL group. Intestinal Firmicutes possess genes responsible for fermenting dietary fiber and interact with the intestinal mucosa to help maintain host homeostasis (Sun et al., 2023). Actinobacteria, especially Bifidobacteria, are crucial for gut homeostasis and widely used as probiotic with beneficial effects in various pathological conditions (Binda et al., 2018). Bacteroidetes play an important role in gut health by producing butyrate, which is the end product of colonic fermentation and is considered to have antineoplastic properties (Kim and Milner, 2007). Fusobacteria activate the host’s inflammatory response to prevent pathogens from promoting tumor growth (Kelly et al., 2018). Dysbiosis, characterized by an imbalance in the taxonomic composition, often manifests as an increase in Firmicutes relative to Bacteroidetes in metabolic disorders (Shin et al., 2015). Studies have shown that an increase in Firmicutes and Actinobacteria, and a decrease in Bacteroidetes and Fusobacteria, are similar to the microbial patterns of diseased fish (Tran et al., 2018). Compared with the FM and FH groups, we observed this disease-like microbial pattern in the FL group. The gut microbiota may indirectly affect intestinal inflammatory pathways and the synthesis and catabolism of nutrients (Przewłócka et al., 2020). There are complex interactions among different groups within the gut microbial community, including competition and symbiosis (Przewłócka et al., 2020). Changes in fishmeal levels may disrupt the balance of these interactions, leading to changes in the relative abundance of certain groups. In the absence of fish meal, certain microbial populations may become more prominent. For example, Photobacterium was highly represented in gilthead seabream (Sparus aurata) fed with a fishmeal-free diet (Kelly et al., 2018). Some studies have also found that when fishmeal is used to replace cottonseed protein, the proportion of the relative abundance of the phylum Proteobacteria, which encompasses both pathogenic and beneficial symbionts in the gut of juvenile golden pompano (Trachinotus ovatus) gradually decreased with the increase in fish meal levels (Thomas et al., 2011). Proteobacteria is a metabolically diverse phylum that includes not only opportunistic pathogens but also beneficial commensals such as Vibrio alginolyticus, which can act as a probiotic and reduce mortalities caused by Aeromonas and Vibrio spp (Spring et al., 1995). Similarly, with the increasement of fishmeal levels, probiotic bacteria (Lactococcus) increase while pathogenic bacteria (Enterococcus) decrease in the common carp (Cyprinus carpio) intestine (Shin et al., 2015). Therefore, increasing fishmeal levels can balance the gut microbiota and maintain intestinal health.
Figure 2
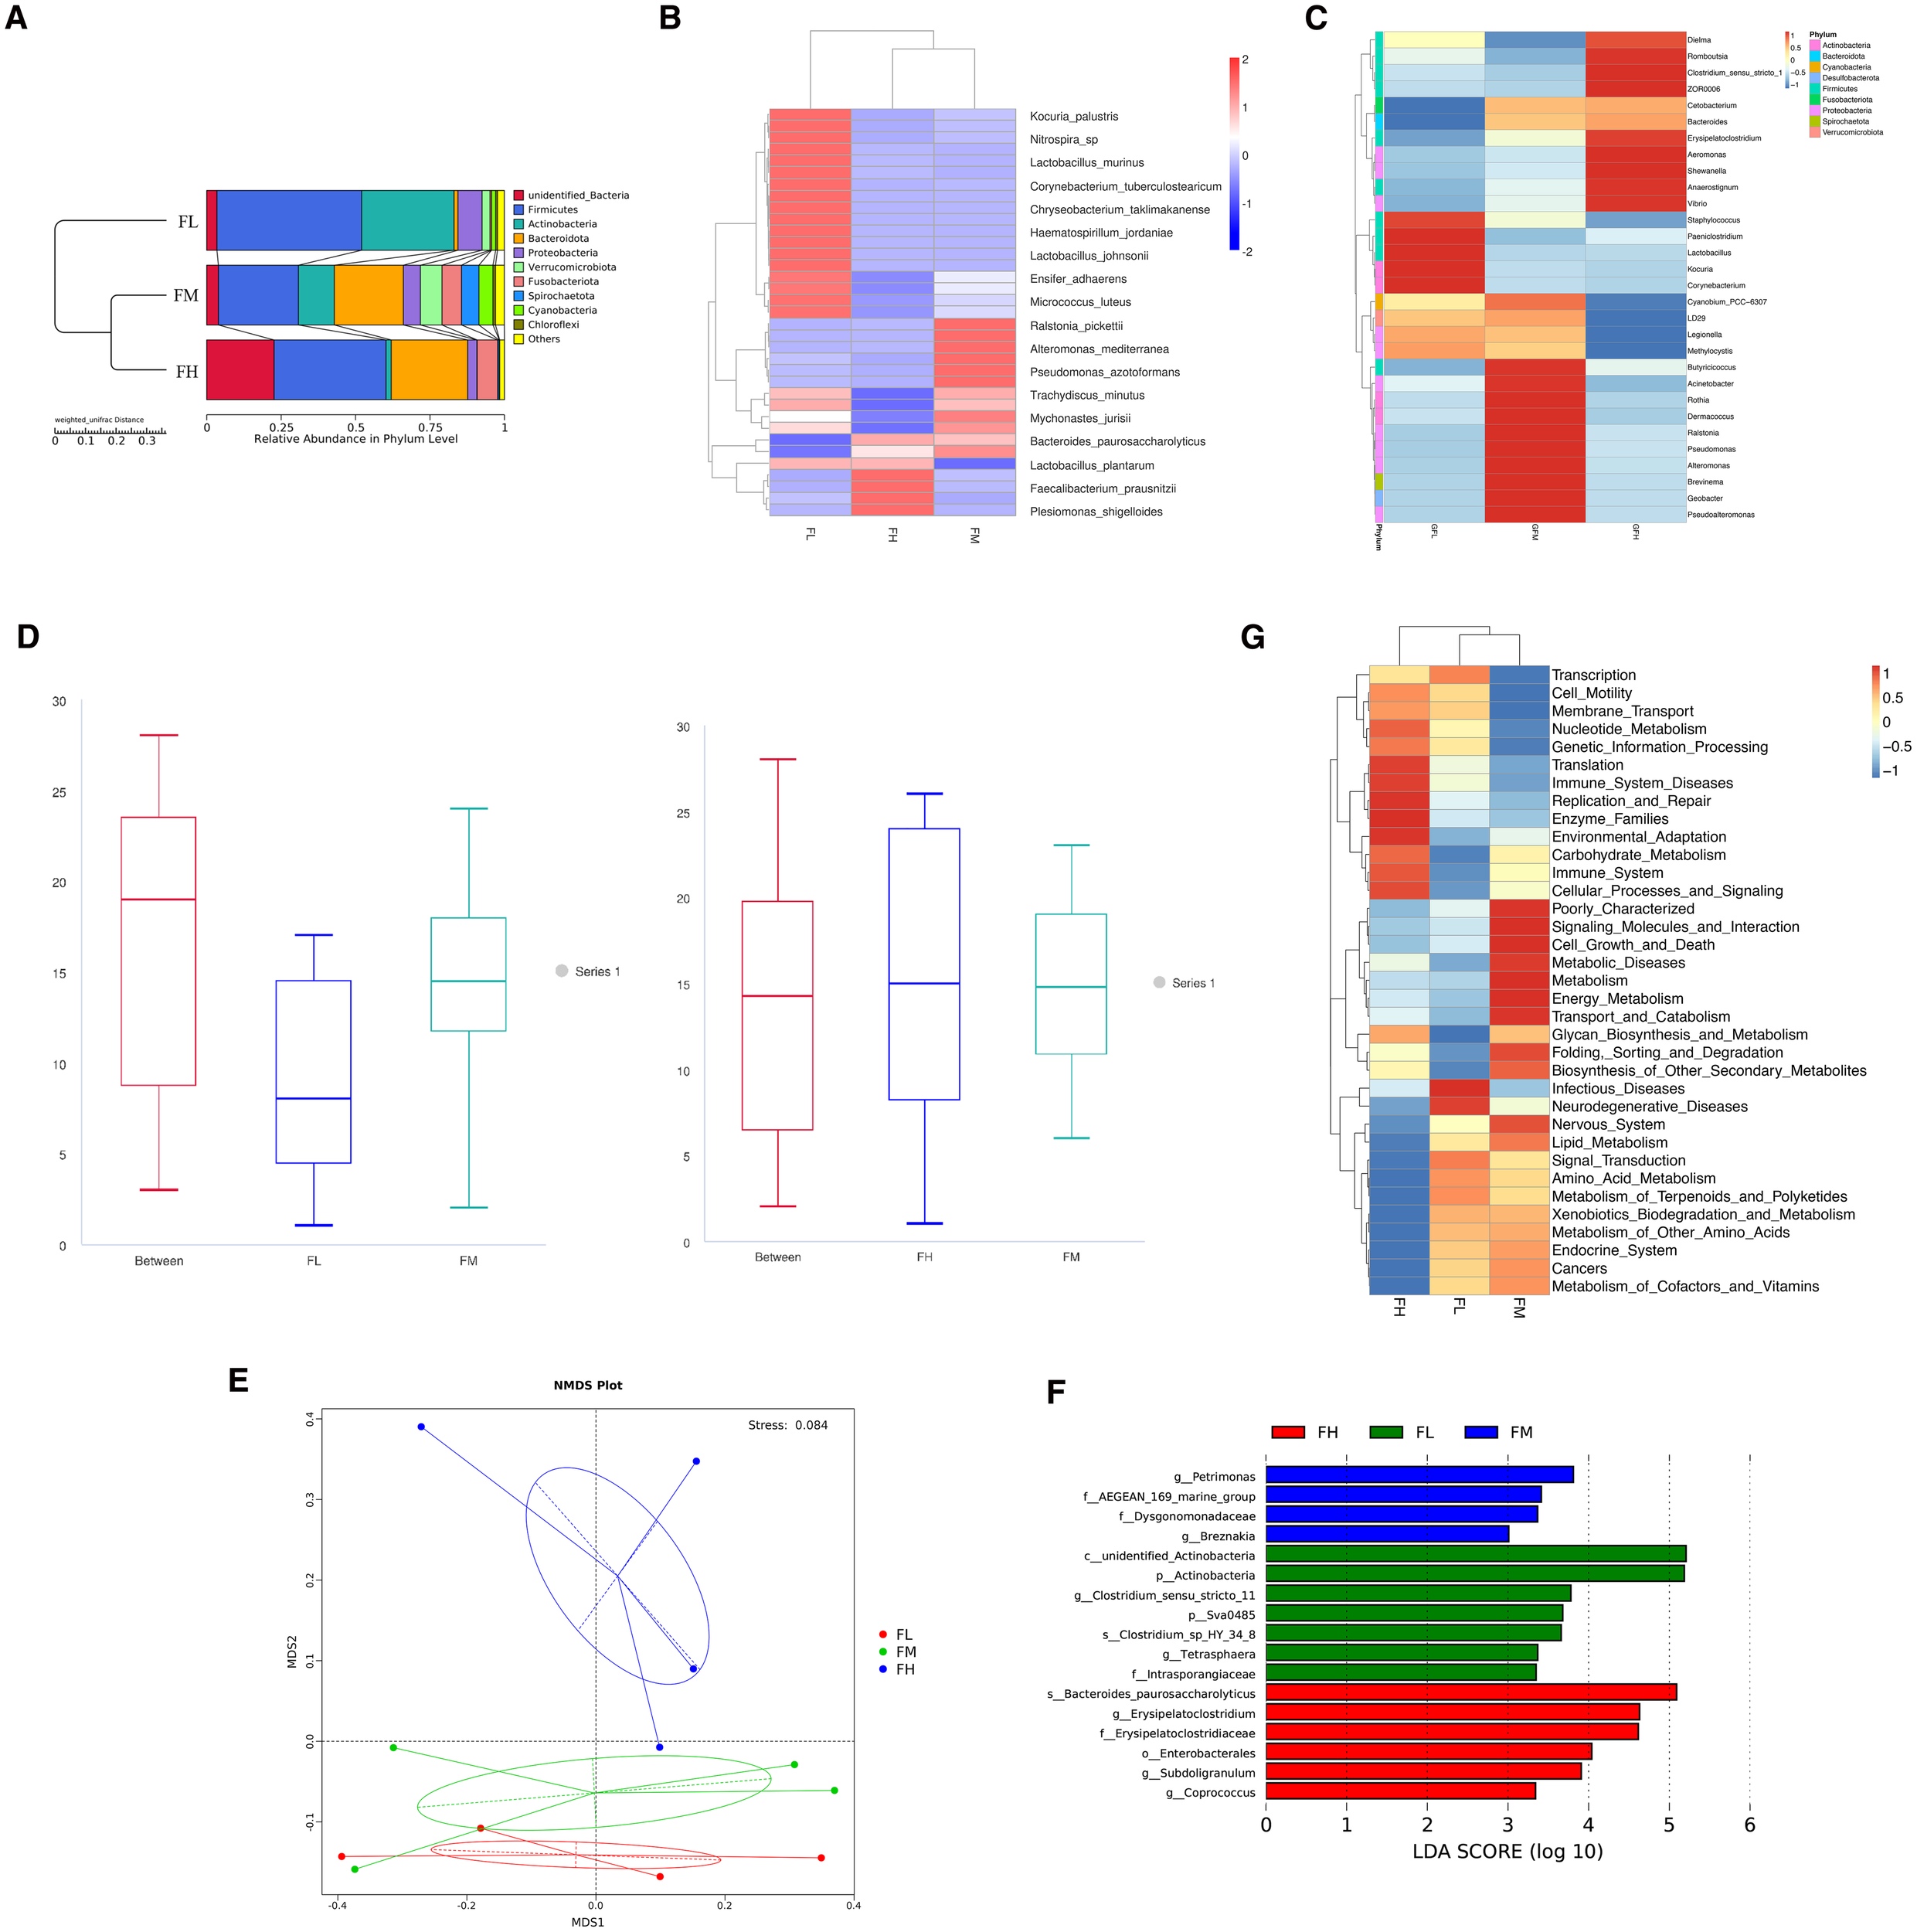
Effect of dietary fishmeal on intestinal microflora of grass carp. Note: (A) UPGMA clustering tree depicting all intestinal microbiome samples. Only the top 10 most abundant (based on relative abundance) bacterial phyla are displayed in the figures. (B) Heatmap of relative abundance (top 10 species at the species level). (C) heatmap of species abundance clustering. Only the top 30 most abundant bacterial genera (based on relative abundance) are shown in the figures. (D) ANOSIM analysis of dietary fishmeal on intestinal microflora of grass carp: FL vs. FM (left) and FM vs. FH (right). (E) NMDS analysis of dietary fishmeal on intestinal microflora of grass carp. (F) LEfSe analysis of dietary fishmeal on intestinal microflora of grass carp. (G) PICRUST (level2) analysis of dietary fishmeal on intestinal microflora of grass carp (Top 35). FL: grass carp fed diet without fishmeal; FM: grass carp fed diet with 3% fishmeal; FH: grass carp fed diet with 6% fishmeal.
The clustering heatmap based on the top 30 bacterial genera with relative abundance is shown in Figure 2C. ANOSIM analysis of dietary fishmeal on intestinal microflora of grass carp: FL vs. FM and FM vs. FH were showed in Figure 2D. The FL group is dominated by Staphylococcus, Paeniclostridium, Lactobacillus, Kocuria, and Corynebacterium. In contrast, Butyricicoccus, Acinetobacter, Rothia, Dermacoccus, Ralstonia, Pseudomonas, Alteromonas, Brevinema, Geobacter, and Pseudoalteromonas are enriched in the FM group. The dominant genera in the FH group include Dielma, Romboutsia, Clostridium sensu stricto 1, Erysipelatoclostridium, Aeromonas, Shewanella, Anaerostignum, and Vibrio. Recent studies have identified various pathogenic microorganisms (Staphylococcus (Surana and Kasper, 2014), Paeniclostridium (Li et al., 2022), Acinetobacter (Joly-Guillou, 2005), Corynebacterium (Bernard and Funke, 2015), and Brevinema (Paster, 2015)) and beneficial microorganisms (such as Dermacoccus (Rangseekaew et al., 2022)) in the intestines of different species. In our study, the three pathogenic microorganisms Staphylococcus, Paeniclostridium, and Corynebacterium accumulate in the FL group. Additionally, the butyrate-producing genera Butyricicoccus and Rothia are enriched in the FM group. Pseudomonas (lipase) (Gong et al., 2021), Alteromonas (Ivanova et al., 2005), and Pseudoalteromonas (amylase and chitinase) (Parrilli et al., 2021) known for their vigorous metabolic capabilities, are more abundant in the FM group. Clostridium_sensu_stricto_1 (Gong et al., 2021) and Romboutsia (Gerritsen et al., 2019) are important for amino acid utilization in animal protein diets, displaying a range of metabolic capabilities, including carbohydrate utilization, fermentation of single amino acids, anaerobic respiration, and production of metabolic end products. Clostridium can induce regulatory T cells in the colonic lamina propria of mice, thereby providing protective effects in mouse models of colitis and allergies (Li et al., 2022). Clostridium and Romboutsia can enhance the digestion of cellulose (Wu et al., 2012), and they are enriched in the FH group.
Through non-metric multidimensional scaling (NMDS) analysis, as shown in Figure 2E, we visualized the structure of microbial communities fed with different levels of fish meal. The results indicate that the three treatment groups are well separated in the NMDS plot, with a Stress value of 0.084. This demonstrates that different levels of fish meal significantly affect the composition of microbial communities and that our two-dimensional ordination plot effectively represents the original distances between samples, ensuring high reliability of the results (Zha et al., 2018).
In the LefSe analysis (Figure 2F), different levels of fish meal exert significant effects on microbial community structure. The LDA value, used to assess the impact of microbial groups that show significant differences between groups, indicates that an LDA value greater than 3 is generally considered to represent biomarkers with high credibility (Ma et al., 2020). In the FL group, Actinobacteria, Clostridium_sensu_stricto_11,Sva0485,Clostridium_sp_HY_34_8,Tetrasphaera, and Intrasporangiaceae; in the FM group, Petrimonas, AEGEAN_169_marine_group, Dysgonomonadaceae, and Breznakia; and in the FH group, Bacteroides paurosaccharolyticus, Erysipelatostridiaceae, Enterobacterales,Subdoligranulum, and Coprococcus all exhibit significant responses, with LDA values exceeding the threshold. This highlights the clear response of these microbial groups to different levels of fish meal feeding.
PICRUSt2-level-2 functional profiling revealed that the 3% fish-meal group was significantly enriched in pathways related to metabolism, energy metabolism, lipid metabolism, and cell growth and death (Figure 2G). These enriched functions provide mechanistic insight into the improved growth performance and enhanced muscle flavour observed with fish-meal supplementation, thereby furnishing more direct evidence for the hypothesis that gut-microbiota modulation mediates flavour development.
3.4 Muscle volatile compounds
In Figure 3A, the PCA model is selected as the separation model. Samples with similar aroma characteristics overlap or are closely positioned in their respective figures (Song et al., 2020). The cumulative variance contribution rate of PC1 (57.9%) and PC2 (25.28%) is 83.18%, indicating that these two PCs essentially cover the sample information and can characterize the odor composition of grass carp muscle at different fish meal levels (Pan et al., 2022). A distinct separation is observed between the samples of the FH group and the other samples along PC1 (57.9%), indicating that the odor changes in muscle samples with a high level of fish meal are more pronounced.
Figure 3
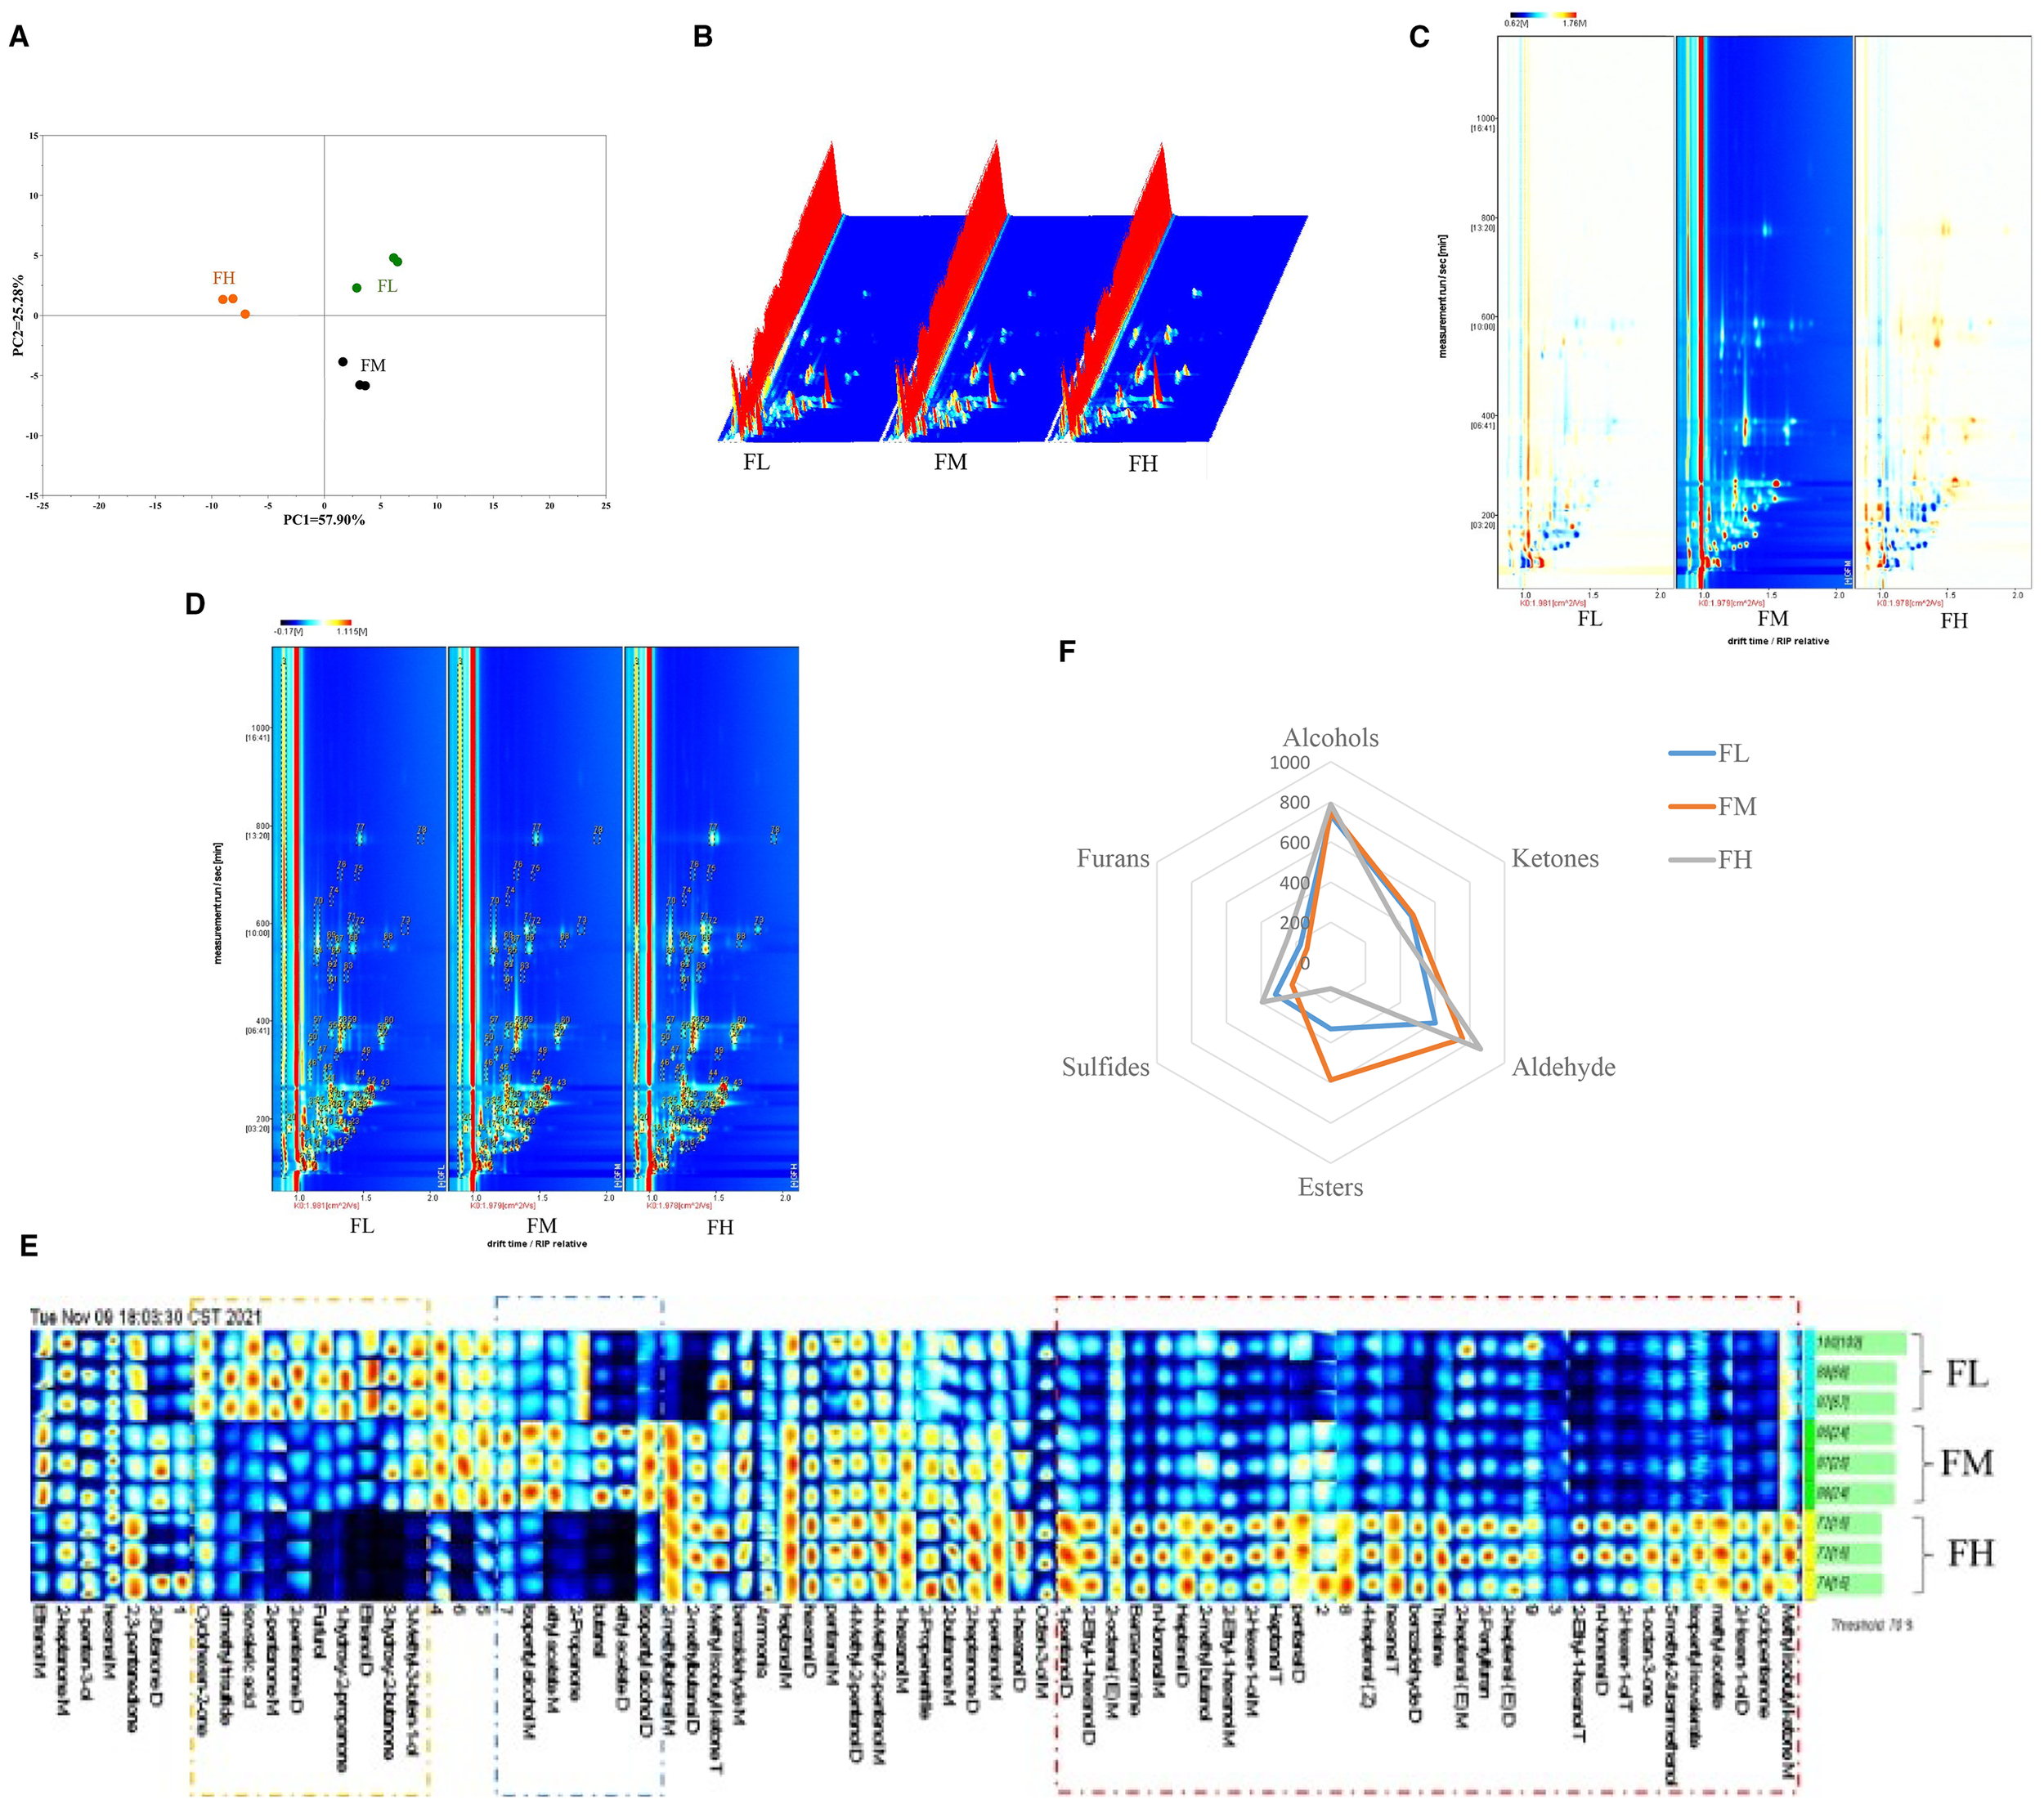
Effect of dietary fishmeal on muscle volatile compounds of grass carp. Note: (A) Principal Component Analysis (PCA) of GC-IMS. (B) 3D topographic plots of VOCs in muscle. (C) 2D topographic plots of volatile compounds in muscle; the x-axis and y-axis represent ion-relative drift time and retention time, respectively. The background color of the figure is blue, with a red vertical line at the abscissa 1.0 indicating the reactive ion peak. The entire spectrum represents the total volatile compounds in the samples; signal intensity is shown in different colors, where darker colors indicate higher intensity (white for lower intensity and red for higher intensity). (D) Topographic plots of GC-IMS spectra with identification of individual volatile compounds labeled 1-78 (as listed in Table 3); using FM as the reference, white corresponds to the same concentration of volatiles, with colors closer to red indicating higher concentration (blue corresponds to lower concentration). (E) Gallery plot of grass carp samples with different treatments; each row represents a sample and each column represents a signal peak. (F) Radar map of VOCs with statistically significant differences. VOC categories (aldehydes, alcohols, ketones, etc.) correspond to the summed peak areas of all compounds within each class. FL: grass carp fed diet without fishmeal; FM: grass carp fed diet with 3% fishmeal; FH: grass carp fed diet with 6% fishmeal. Value with different superscripts are significantly different (n=3).
The muscle VOCs of FL, FM, and FH are analyzed using GC-IMS. VOCs are significant determinants of meat flavor (Liu et al., 2009), and they serve as an important basis for consumers to evaluate meat quality (Chen et al., 2022). Intensity variations in different muscles are represented as a 3D topographical model in Figure 3B. The 2D topographical visualization of the VOCs is depicted in Figure 3C. Most signals are observed to be located in the retention time range of 100–400 s and a drift time of 1–1.5 s. The results in Table 3 show that 53 VOCs are detected in the samples, including 10 aldehydes, 12 alcohols, 9 ketones, 2 nitrogen compounds, 3 sulfides, and 3 esters. In addition, there are nine unknown compounds. Aldehydes, alcohols, ketones, acids, and hydrocarbons are the primary VOCs in fish and fish products (Liu et al., 2009). When compared to the FM group as the background, the FL and FH groups display varying degrees of blue and red spots. The FL group has more blue spots, indicating that more VOCs and their content are lower than in the FM group; the FH group has many red spots, indicating that more VOCs and their content are higher than in the FM group (Figure 3D; Table 3).
Table 3
| Count | Compound | CAS# | MW | RI | Rt (sec) | Dt (a.u.) | Integral volume | ||
|---|---|---|---|---|---|---|---|---|---|
| FL | FM | FH | |||||||
| 1 | ethanol M | C64175 | 46.1 | 485.7 | 99.39 | 1.05 | 2166 ± 428c | 2777 ± 46b | 1399 ± 91a |
| 2 | ethanol D | C64175 | 46.1 | 482 | 98.39 | 1.13 | 1609 ± 206c | 644 ± 26b | 83 ± 22a |
| 3 | ammonia | C7664417 | 17 | 499.6 | 103.24 | 0.91 | 42625 ± 1389a | 44561 ± 690a | 57250 ± 3429b |
| 4 | 2-propanone | C67641 | 58.1 | 510.5 | 106.34 | 1.12 | 1587 ± 102b | 1451 ± 50b | 421 ± 26a |
| 5 | 2-propenenitrile | C107131 | 53.1 | 510.8 | 106.44 | 1.09 | 593 ± 82a | 833 ± 25b | 825 ± 76b |
| 6 | methyl acetate | C79209 | 74.1 | 522.8 | 109.99 | 1.04 | * | * | 1037 ± 73 |
| 7 | 2-butanone M | C78933 | 72.1 | 604.1 | 137.29 | 1.07 | 823 ± 120a | 923 ± 76ab | 1133 ± 92b |
| 8 | 2-butanone D | C78933 | 72.1 | 600.7 | 136.03 | 1.24 | 390 ± 181 | 794 ± 122 | 469 ± 319 |
| 9 | 1 | unidentified | 0 | 602.7 | 136.77 | 1.16 | 287 ± 49 | 298 ± 37 | 323 ± 161 |
| 10 | butanal | C123728 | 72.1 | 608.1 | 138.79 | 1.29 | 284 ± 34b | 754 ± 57c | 90 ± 36a |
| 11 | ethyl acetate M | C141786 | 88.1 | 619.9 | 143.31 | 1.1 | 331 ± 13b | 585 ± 71c | 130 ± 27a |
| 12 | ethyl acetate D | C141786 | 88.1 | 619.2 | 143.06 | 1.33 | 167 ± 15 | 724 ± 231 | * |
| 13 | 2-methylbutanal M | C96173 | 86.1 | 663.7 | 161.51 | 1.18 | 210 ± 89a | 668 ± 27c | 526 ± 32b |
| 14 | 2-methylbutanal D | C96173 | 86.1 | 663.2 | 161.3 | 1.4 | 79 ± 57a | 731 ± 29b | 877 ± 36c |
| 16 | 1-hydroxy-2-propanone | C116096 | 74.1 | 684.4 | 170.88 | 1.04 | 1015 ± 141 | 526 ± 25 | * |
| 17 | 2-pentanone M | C107879 | 86.1 | 692.8 | 175.67 | 1.12 | 449 ± 73c | 272 ± 8b | 127 ± 5a |
| 18 | 2-pentanone D | C107879 | 86.1 | 696.6 | 178.21 | 1.37 | 1220 ± 157 | 509 ± 95 | * |
| 19 | 2,3-pentanedione | C600146 | 100.1 | 698.8 | 179.67 | 1.22 | 377 ± 18b | 268 ± 38a | 474 ± 39c |
| 20 | 1-penten-3-ol | C616251 | 86.1 | 700.1 | 180.6 | 0.94 | 975 ± 4a | 1126 ± 9b | 1405 ± 46c |
| 21 | 2 | unidentified | 0 | 701.4 | 181.46 | 1.33 | * | 211 ± 12 | 223 ± 42 |
| 22 | pentanal M | C110623 | 86.1 | 704.4 | 183.57 | 1.18 | 415 ± 170 | 596 ± 21 | 552 ± 54 |
| 23 | pentanal D | C110623 | 86.1 | 705.3 | 184.16 | 1.42 | 97 ± 70 | 174 ± 13 | 189 ± 20 |
| 24 | 3 | unidentified | 0 | 708.2 | 186.21 | 1.30 | * | 125 ± 6 | 182 ± 15 |
| 25 | 4 | unidentified | 0 | 746.2 | 215.09 | 1.16 | 598 ± 53b | 502 ± 54ab | 489 ± 10a |
| 26 | 5 | unidentified | 0 | 741.9 | 211.6 | 1.28 | 441 ± 37ab | 500 ± 117b | 299 ± 26a |
| 27 | 3-hydroxy-2-butanone | C513860 | 88.1 | 743.5 | 212.96 | 1.33 | 1778 ± 35 | 1237 ± 90 | * |
| 28 | methyl isobutyl ketone M | C108101 | 100.2 | 744.7 | 213.87 | 1.18 | 110 ± 4a | 106 ± 4a | 149 ± 12b |
| 29 | methyl isobutyl ketone T | C108101 | 100.2 | 743.7 | 213.11 | 1.48 | 91 ± 18 | 83 ± 25 | 85 ± 23 |
| 30 | 6 | unidentified | 0 | 748.4 | 216.89 | 1.40 | 827 ± 81b | 944 ± 157c | 134 ± 22a |
| 31 | isopentyl alcohol M | C123513 | 88.1 | 751.6 | 219.54 | 1.24 | 248 ± 32a | 440 ± 51b | 294 ± 31a |
| 32 | isopentyl alcohol D | C123513 | 88.1 | 752.3 | 220.13 | 1.49 | * | 152 ± 4 | * |
| 33 | cyclopentanone | C120923 | 84.1 | 757.2 | 224.25 | 1.11 | * | * | 86 ± 17 |
| 34 | 2-methyl butanol | C137326 | 88.1 | 763.6 | 229.84 | 1.47 | 159 ± 13b | 96 ± 17a | 201 ± 10c |
| 35 | thiolane | C110010 | 88.2 | 765.4 | 231.37 | 1.32 | 267 ± 30a | 275 ± 59a | 635 ± 17b |
| 36 | 3-methyl-3-buten-1-ol | C763326 | 86.1 | 767.5 | 233.22 | 1.43 | 737 ± 22c | 658 ± 44b | 158 ± 7a |
| 37 | 4-methyl-2-pentanol M | C108112 | 102.2 | 768.7 | 234.28 | 1.26 | 459 ± 17a | 505 ± 18a | 606 ± 27b |
| 38 | 4-methyl-2-pentanol D | C108112 | 102.2 | 767.7 | 233.37 | 1.55 | 1290 ± 19a | 1287 ± 53a | 1458 ± 120b |
| 39 | 1-pentanol M | C71410 | 88.1 | 782.8 | 247.18 | 1.25 | 333 ± 28a | 430 ± 27b | 405 ± 32b |
| 40 | 1-pentanol D | C71410 | 88.1 | 782.6 | 247 | 1.51 | 235 ± 33a | 273 ± 7a | 378 ± 14b |
| 41 | hexanal M | C66251 | 100.2 | 802.8 | 265.74 | 1.25 | 1957 ± 33b | 1995 ± 60ab | 1714 ± 122a |
| 42 | hexanal D | C66251 | 100.2 | 800.8 | 263.86 | 1.56 | 4418 ± 640a | 4895 ± 257a | 6280 ± 134b |
| 43 | hexanal T | C66251 | 100.2 | 799.4 | 262.52 | 1.65 | 107 ± 26a | 124 ± 6a | 247 ± 13b |
| 44 | 7 | unidentified | 0 | 818 | 280.74 | 1.46 | 74 ± 5a | 104 ± 15b | 66 ± 3a |
| 45 | isovaleric acid | C503742 | 102.1 | 822.7 | 285.49 | 1.21 | 195 ± 23 | 98 ± 6 | * |
| 46 | furfurol | C98011 | 96.1 | 825.6 | 288.52 | 1.10 | 396 ± 44 | 232 ± 14 | * |
| 47 | 2-hexen-1-ol M | C2305217 | 100.2 | 859.4 | 325.91 | 1.18 | 137 ± 26a | 174 ± 32a | 344 ± 20b |
| 48 | 2-hexen-1-ol D | C2305217 | 100.2 | 859.2 | 325.58 | 1.30 | 67 ± 4a | 70 ± 3a | 209 ± 12b |
| 49 | 2-hexen-1-ol T | C2305217 | 100.2 | 859.7 | 326.23 | 1.51 | * | * | 112 ± 9 |
| 50 | cyclohexen-2-one | C930687 | 96.1 | 884.4 | 356.6 | 1.11 | 63 ± 10b | 48 ± 5a | 68 ± 3b |
| 51 | 1-hexanol M | C111273 | 102.2 | 889 | 362.61 | 1.32 | 1087 ± 144 | 1188 ± 170 | 1032 ± 177 |
| 52 | 1-hexanol D | C111273 | 102.2 | 887.3 | 360.34 | 1.64 | 479 ± 49a | 596 ± 31ab | 805 ± 183b |
| 53 | 1-hexanol T | C111273 | 102.2 | 887.5 | 360.66 | 1.99 | * | * | * |
| 54 | 8 | unidentified | 0 | 896.9 | 373.49 | 1.35 | 256 ± 16a | 295 ± 20a | 522 ± 24b |
| 55 | 2-heptanone M | C110430 | 114.2 | 899.2 | 376.93 | 1.26 | 303 ± 5b | 240 ± 27a | 280 ± 10b |
| 56 | 2-heptanone D | C110430 | 114.2 | 897.7 | 374.69 | 1.63 | 434 ± 45a | 553 ± 53b | 604 ± 19b |
| 57 | 4-heptenal (Z) | C6728310 | 112.2 | 904.1 | 384.10 | 1.15 | 123 ± 30a | 150 ± 16a | 201 ± 3b |
| 58 | heptanal M | C111717 | 114.2 | 908.1 | 390.15 | 1.33 | 626 ± 133 | 676 ± 32 | 610 ± 103 |
| 59 | heptanal D | C111717 | 114.2 | 908.3 | 390.4 | 1.40 | 167 ± 5a | 181 ± 13a | 263 ± 33b |
| 60 | heptanal T | C111717 | 114.2 | 908.4 | 390.55 | 1.68 | 357 ± 138a | 493 ± 50a | 745 ± 111b |
| 61 | 5-methyl-2-furanmethanol | C3857258 | 112.1 | 955.6 | 469.22 | 1.26 | 50 ± 7a | 44 ± 10a | 87 ± 10b |
| 62 | 2-heptenal (E) M | C18829555 | 112.2 | 968 | 492.29 | 1.25 | 272 ± 55ab | 195 ± 57a | 333 ± 48b |
| 63 | 2-heptenal (E) D | C18829555 | 112.2 | 967.8 | 491.96 | 1.38 | 126 ± 19a | 119 ± 25a | 257 ± 17b |
| 64 | benzaldehyde M | C100527 | 106.1 | 983.9 | 523.73 | 1.15 | 450 ± 66a | 708 ± 105b | 730 ± 69b |
| 65 | benzaldehyde D | C100527 | 106.1 | 984.1 | 524.14 | 1.28 | 118 ± 50a | 236 ± 25b | 360 ± 15c |
| 66 | benzeneamine | C62533 | 93.1 | 993.5 | 543.49 | 1.43 | 865 ± 162a | 944 ± 62a | 2225 ± 57b |
| 67 | dimethyl trisulfide | C3658808 | 126.3 | 996.7 | 550.22 | 1.31 | 370 ± 93b | 170 ± 26a | 154 ± 9a |
| 68 | 1-octen-3-one | C4312996 | 126.2 | 1001.8 | 559.03 | 1.68 | * | * | 118 ± 11 |
| 69 | 2-pentylfuran | C3777693 | 138.2 | 1002 | 559.32 | 1.25 | 175 ± 15a | 137 ± 31a | 246 ± 24b |
| 70 | octen-3-ol M | C3391864 | 128.2 | 1008.8 | 571.38 | 1.16 | 2764 ± 226a | 2606 ± 291a | 3678 ± 62b |
| 71 | 2-ethyl-1-hexanol M | C104767 | 130.2 | 1019.7 | 590.97 | 1.4 | 832 ± 354a | 1020 ± 125a | 1542 ± 132b |
| 72 | 2-ethyl-1-hexanol D | C104767 | 130.2 | 1018.2 | 588.27 | 1.46 | 182 ± 83a | 226 ± 30a | 469 ± 39b |
| 73 | 2-ethyl-1-hexanol T | C104767 | 130.2 | 1018.5 | 588.71 | 1.81 | 134 ± 95a | 170 ± 27a | 403 ± 85b |
| 74 | 9 | unidentified | 0 | 1049.8 | 648.85 | 1.26 | 83 ± 25 | 72 ± 7 | 83 ± 9 |
| 75 | isopentyl isovalerate | C659701 | 172.3 | 1073.1 | 697.37 | 1.45 | * | * | 55 ± 9 |
| 76 | 2-octenal (E) M | C2548870 | 126.2 | 1073.8 | 699.03 | 1.33 | 147 ± 14 | 130 ± 21 | 160 ± 15 |
| 77 | n-nonanal M | C124196 | 142.2 | 1107.4 | 775.66 | 1.47 | 874 ± 158a | 829 ± 41a | 1396 ± 153b |
| 78 | n-nonanal D | C124196 | 142.2 | 1107 | 774.64 | 1.94 | * | * | 180 ± 50 |
Identification of muscle volatile compounds based on GC-IMS.
MW, formula weight; GI, gas chromatography retention index; Rt, gas chromatography retention time; Dt, drift-time. M, D, and T after the substance represented an aggregation state of monomer and dimer, respectively. FL, grass carp fed diet without fishmeal; FM, grass carp fed diet with 3% fishmeal; FH, grass carp fed diet with 6% fishmeal. Data are expressed as means ± SD. Value with different superscripts are significantly different (P< 0.05, n ≥ 3).
The comparison of VOC fingerprints among the three groups is shown in Figure 3E. The VOCs with significant differences are roughly categorized into aldehydes, alcohols, ketones, esters, sulfur compounds, and furans, and a radar chart is created as shown in Figure 3F. Compared with the FL and FM groups, a large number of aldehydes are significantly increased in the FH group, including 2-methylbutanal D, hexanal D, T, 4-heptenal (Z), heptanal, 2-heptenal (E) D, benzaldehyde D, and n-nonanal M (P< 0.05); the content of butanal and 2-methylbutanal M is highest in the FM group (P< 0.05). Aldehydes are highly volatile and have a robust fatty aroma (Lorenzo et al., 2013). They are crucial to the flavor of fish due to their diversity and low odor thresholds (Pan et al., 2022). It has been reported that butanal, hexanal, heptanal, and benzaldehyde are the key aroma compounds in Hypophthalmichthys molitrix, Aristichthys nobilis, Lateolabrax japonicus, and Parabramis pekinensis (Chen et al., 2022). Most linear aldehydes are produced through autoxidation reactions initiated by enzymes or microorganisms present in fish (Fu et al., 2015; Zhang et al., 2020). Genomic and transcriptomic data have confirmed that the cecal microbial community affects the VOCs of duck meat, especially pentanal, hexanal, and heptanal, by modulating metabolic pathways related to fatty acid synthesis and degradation (Xu et al., 2024). Hexanal has been recognized as a unique aroma-active component in fresh tuna (Pan et al., 2022) and raw red seabream (Chen et al., 2022), and it exerts a major influence on flavor perception in silver carp samples (Liu et al., 2009). Previous research has indicated that (Z)-4-heptenal is present in extracts from turbot, characterized by a fishy or potato-like odor (Sérot et al., 2001). These aldehydes, which significantly contribute to the aroma of fish meat, impart a pleasant nutty, grassy, and fruity fragrance to the fish.
Compared to the FL and FM groups, the content of many alcohols is significantly increased in the FH group, including 1-penten-3-ol, 4-methyl-2-pentanol, 1-pentanol, 2-hexen-1-ol, 5-methyl-2-furanmethanol, octen-3-ol, and 2-ethyl-1-hexanol (P< 0.05). Alcohols are primarily derived from the oxidative decomposition of lipids or the reduction synthesis of carbonyl groups. They have higher thresholds compared to aldehydes and are closely related to the characteristic fatty flavor of meat (Zhang et al., 2020; Pan et al., 2022). Alcohols generally impart fruity, floral, and grassy notes to fish (Liu et al., 2009). Unsaturated alcohols typically have much lower thresholds than saturated alcohols and can significantly influence the flavor of food (Lorenzo et al., 2013). In our study, the content of ethanol is highest in the FL group, and the content of isopentyl alcohol M is highest in the FM group (P< 0.05). The elevated content of ethanol in the FL group suggests that it may not be conducive to preservation and can lead to the generation of unpleasant odors (Pan et al., 2022). High concentrations of 1-hexanol and 1-pentanol have been detected in mature cod roe, and they may play a critical role in the product’s aroma (Purrinos et al., 2011). The compound 1-octen-3-ol, originating from the hydroperoxide degradation product of linoleic acid, has been identified as one of the most important aroma-active compounds in fish samples (Salum et al., 2017; Pan et al., 2022). This may be one of the reasons why fish flavor compounds are affected.
Compared with the FL group, the content of many ketone compounds is significantly increased in the FH group, including 2-butanone M, 2,3-pentanedione, methyl isobutyl ketone M, and 2-heptanone D (P< 0.05); compared with the FH group, the content of 2-propanone and 2-pentanone M is significantly increased in the FL and FM groups (P< 0.05). Ketones may originate from the thermal oxidation of unsaturated fatty acids, the degradation of amino acids, or microbial oxidation (Zhang et al., 2019). Ketones have a unique buttery and fruity flavor (Pan et al., 2022). 2-Heptanone, primarily produced by the oxidation of linoleic acid, has been identified as a compound that can modulate the flavor of meat and meat products (Han et al., 2020). Studies have shown that 2-heptanone helps enhance the aromatic characteristics of silver carp (Liu et al., 2009). In addition, among the esters, the content of ethyl acetate M is highest in the FM group, and the content of thiolane is highest in the FH group (P< 0.05). Esters are well-known for their significant contribution to fruity flavors (Peng et al., 2020) and play a crucial role in the unique aroma of fish (Liu et al., 2009). Ethyl acetate, with its slight fruity aroma, is considered a VOC that can enhance the aroma of fish (Mansur et al., 2003). The content of the sulfur compound dimethyl trisulfide is highest in the FL group (P< 0.05). Sulfur compounds, with their low thresholds, play an important role in the overall flavor of food, and thiols are generated from the Strecker degradation of methionine. Furans are one of the important compounds that produce meaty flavors (Pan et al., 2024). The content of the furan compound 2-pentylfuran is highest in the FH group (P< 0.05), and it makes a positive contribution to the flavor of grass carp. The diet-induced shifts in key volatile compounds are known to enhance the fresh, sweet, and umami notes while reducing ‘fishy’ odours. Consequently, fillets from fish fed the higher-fish-meal diets are expected to command better market prices and broader consumer acceptance, providing a clear economic incentive for producers.
3.5 Correlation analysis of microflora and muscular VOCs
Studies have proven that microbial communities are associated with muscle metabolic characteristics (Feng et al., 2022). Changes in the gut microbiota can regulate muscle fiber diameter (Lei et al., 2022). Short-chain fatty acids are produced during the fermentation process of gut microbiota, which promote the formation of oxidative muscle fibers (Sérot et al., 2001). Studies have shown that fecal microbiota transplantation is beneficial for the muscle growth and development of germ-free piglets (Qi et al., 2021). The microbial communities in the animal gut are diverse and play an important role in meat quality (Chen et al., 2022). VOCs with significant differences are categorized into aldehydes, alcohols, ketones, esters, sulfur compounds, and furans. Spearman correlation analysis is performed with the top 30 bacterial genera of the gut microbiota. The results are shown in Figure 4. Ketones and esters show no significant correlation with various bacterial genera (P > 0.05); sulfur compounds are extremely significantly correlated with Dielma (P< 0.01); furans are significantly positively correlated with Aeromonas (P< 0.05); alcohols are significantly positively correlated with Clostridium-sense-stricto-1 and Geobacter (P< 0.05). Some gut microbes can catalyze the production of acids, thereby affecting the formation of flavor compounds in fish. For example, supplementing ducks with lactic acid bacteria has been shown to significantly increase the content of many VOCs in duck meat, including 1-octen-3-ol (Qi et al., 2021). Clostridium-sense-stricto-1 can produce butyric acid through the butyrate kinase pathway (Chai et al., 2019). Aldehydes show significant positive correlations with multiple bacterial genera, including a significant positive correlation with Bacteroides (P< 0.05) and extremely significant positive correlations with Erysipelatoclostridium, Aeromonas, Shewanella, Cetobacterium, and Vibrio (P< 0.01). As a halophilic bacterium, Vibrio can produce a variety of flavor compounds, thereby providing different flavors to the final product (Liu et al., 2021). Therefore, we speculate that the gut microbiota of grass carp shows a significant correlation with muscle VOCs.
Figure 4
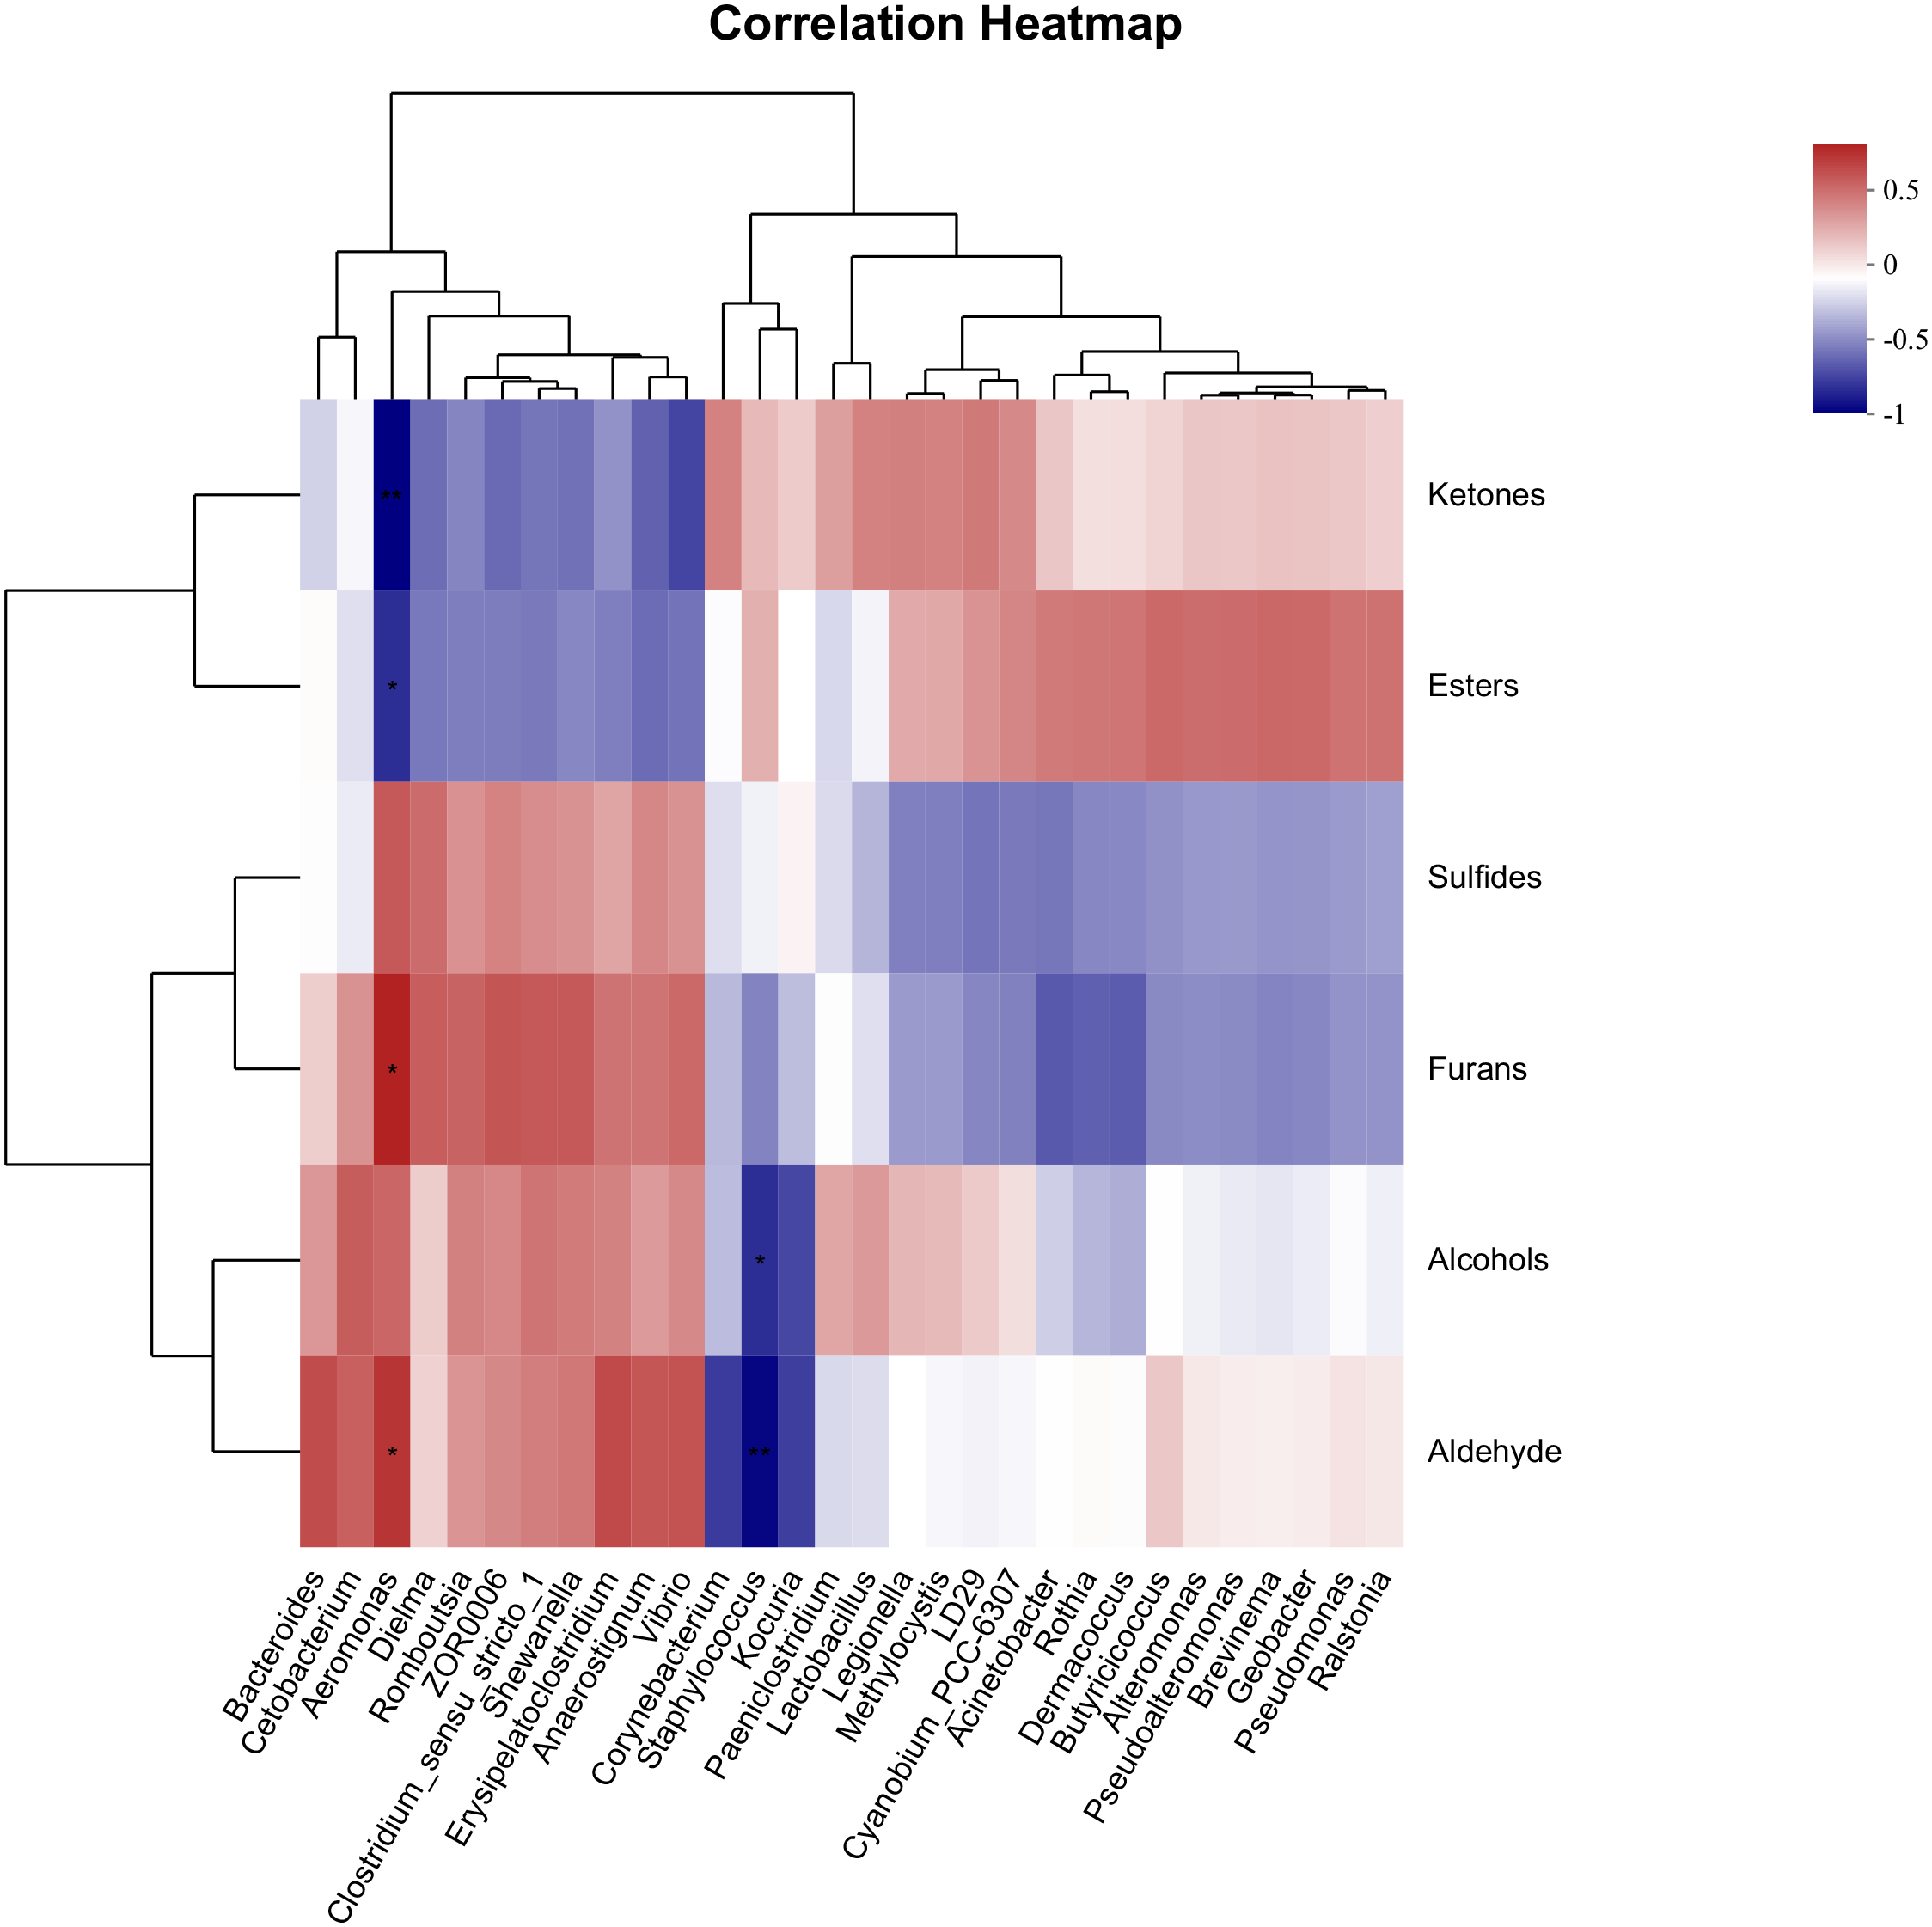
The correlation of top 30 genera and muscle volatile compounds in grass carp. Note: Firstly, classify the detected VOCs with statistically significant differences and calculate the total signal intensity for each VOC class. Then, based on the top 30 most abundant bacterial genera, perform a correlation analysis between the VOCs and the microbial community. Significant difference (p< 0.05 or p< 0.01) is indicated by * or **.
4 Conclusion
Integrating growth performance, intestinal morphology, microbiota and muscle quality, the 3% fish-meal diet already fulfils production targets at the lowest cost. Raising fish-meal to 6% yields only marginal VOC increments (<15% for individual aldehydes and alcohols) without improving growth, and its 8–10% higher feed cost is economically justified only if a market flavour premium exceeds this margin. Although gut microbiota and VOCs correlate, causality remains unproven; thus, sensory tests and economic modelling are needed to verify consumer willingness-to-pay for any flavour advantage.
Statements
Data availability statement
The original contributions presented in the study are included in the article/supplementary material. Further inquiries can be directed to the corresponding author.
Ethics statement
The animal study was approved by Hunan Normal University Ethics Committee. The study was conducted in accordance with the local legislation and institutional requirements.
Author contributions
WG: Writing – original draft. WEL: Formal Analysis, Methodology, Writing – original draft. XZ: Investigation, Writing – original draft. GS: Methodology, Writing – original draft. FT: Methodology, Writing – original draft. ZW: Conceptualization, Project administration, Resources, Supervision, Visualization, Writing – review & editing. WLU: Data curation, Investigation, Methodology, Writing – original draft, Writing – review & editing.
Funding
The author(s) declare that no financial support was received for the research and/or publication of this article.
Acknowledgments
We are grateful to the “Engineering Research Center of Polyploid Fish Reproduction and Breeding of the State Education Ministry” for providing the laboratory facilities and resources that were essential for this research.
Conflict of interest
The authors declare that the research was conducted in the absence of any commercial or financial relationships that could be construed as a potential conflict of interest.
Generative AI statement
The author(s) declare that no Generative AI was used in the creation of this manuscript.
Any alternative text (alt text) provided alongside figures in this article has been generated by Frontiers with the support of artificial intelligence and reasonable efforts have been made to ensure accuracy, including review by the authors wherever possible. If you identify any issues, please contact us.
Publisher’s note
All claims expressed in this article are solely those of the authors and do not necessarily represent those of their affiliated organizations, or those of the publisher, the editors and the reviewers. Any product that may be evaluated in this article, or claim that may be made by its manufacturer, is not guaranteed or endorsed by the publisher.
References
1
Aghamohammad S. Sepehr A. Miri S. T. Najafi S. Pourshafie M. R. Rohani M. J. (2022). Inflammation and Disease, Anti-inflammatory and immunomodulatory effects of Lactobacillus spp. as a preservative and therapeutic agent for IBD control. Immunity Inflammation Dis.10, e635. doi: 10.1002/iid3.635
2
Bernard K. A. Funke G. J. (2015). Corynebacterium. Bergey's Manual Systematics Archaea Bacteria, 1–70. doi: 10.1002/9781118960608
3
Binda C. Lopetuso L. R. Rizzatti G. Gibiino G. Cennamo V. Gasbarrini A. J. et al . (2018). Actinobacteria: A relevant minority for the maintenance of gut homeostasis. Digestive Liver Dis.50, 421–428. doi: 10.1016/j.dld.2018.02.012
4
Chai L. J. Xu P. X. Qian W. Zhang X. J. Ma J. Lu Z. M. et al . (2019). Profiling the Clostridia with butyrate-producing potential in the mud of Chinese liquor fermentation cellar. Int. J. Food Microbiol.297, 41–50. doi: 10.1016/j.ijfoodmicro.2019.02.023
5
Chen Y. P. Cai D. Li W. Blank I. Liu Y. J. (2022). Application of gas chromatography-ion mobility spectrometry (GC-IMS) and ultrafast gas chromatography electronic-nose (uf-GC E-nose) to distinguish four Chinese freshwater fishes at both raw and cooked status. J. Food Biochem.46, e13840. doi: 10.1111/jfbc.13840
6
Chen B. Li D. Leng D. Kui H. Bai X. Wang T. J. (2022). Gut microbiota and meat quality. Front. Microbiol.13, 951726. doi: 10.3389/fmicb.2022.951726
7
Cho J. Kim I. J. (2011). A. Nutrition, Fish meal–nutritive value. J. Anim. Physiol. Anim. Nutr.95, 685–692. doi: 10.1111/j.1439-0396.2010.01109.x
8
Choi D. G. He M. Fang H. Wang X. L. Li X. Q. Leng X. (2020). Replacement of fish meal with two fermented soybean meals in diets for rainbow trout (Oncorhynchus mykiss). Aquaculture Nutr.26, 37–46. doi: 10.1111/anu.12965
9
Cudmore B. Mandrak N. E. (2004). Sciences, Biological synopsis of grass carp (Ctenopharyngodon idella). Can. Manuscript Rep. Fisheries Aquat. Sci.2705, 1–44.
10
Feng Y. Liu D. Liu Y. Yang X. Zhang M. Wei F. et al . (2022). Host-genotype-dependent cecal microbes are linked to breast muscle metabolites in Chinese chickens. Iscience25. doi: 10.1016/j.isci.2022.104469
11
Fu X. Lin Q. Xu S. Wang Z. J. L.-F. S. (2015). Technology, Effect of drying methods and antioxidants on the flavor and lipid oxidation of silver carp slices. LWT-Food Sci61, 251–257. doi: 10.1016/j.lwt.2014.10.035
12
Gerritsen J. Hornung B. Ritari J. Paulin L. Rijkers G. T. Schaap P. J. et al . (2019). A comparative and functional genomics analysis of the genus Romboutsia provides insight into adaptation to an intestinal lifestyle. BioRxiv, 845511. doi: 10.1101/845511
13
Gong L. Liu B. Wu H. Feng J. Jiang T. J. (2021). Seasonal dietary shifts alter the gut microbiota of avivorous bats: implication for adaptation to energy harvest and nutritional utilization. Msphere6, e0046721. doi: 10.1128/msphere.00467-00421
14
Granato D. Santos J. S. Escher G. B. Ferreira B. L. Maggio R. M. (2018). Technology, Use of principal component analysis (PCA) and hierarchical cluster analysis (HCA) for multivariate association between bioactive compounds and functional properties in foods: A critical perspective. Trends Food Sci Technol.72, 83–90. doi: 10.1016/j.tifs.2017.12.006
15
Han Q. Hu J. Pan W. Yu J. Ying X. Weng J. et al . (2024). Effects of rewilding aquaculture time on nutritional quality and flavor characteristics of grass carp (Ctenopharyngodon idellus). Fishes9, 275. doi: 10.3390/fishes9070275
16
Han G. Zhang L. Li Q. Wang Y. Chen Q. Kong B. J. (2020). Impacts of different altitudes and natural drying times on lipolysis, lipid oxidation and flavour profile of traditional Tibetan yak jerky. Meat Sci162, 108030. doi: 10.1016/j.meatsci.2019.108030
17
Hodar A. Vasava R. Mahavadiya D. Joshi N. J. (2020). Fish meal and fish oil replacement for aqua feed formulation by using alternative sources: a review. J. Exp. Zoology India23.
18
Ivanova E. P. Bowman J. P. Lysenko A. M. Zhukova N. V. Gorshkova N. M. Sergeev A. F. et al . (2005). Alteromonas addita sp. nov. Int. J. Systematic Evolutionary Microbiol.55, 1065–1068. doi: 10.1099/ijs.0.63521-0
19
Joly-Guillou M. L. (2005). Clinical impact and pathogenicity of Acinetobacter. Clin. Microbiol.11, 868–873. doi: 10.1111/j.1469-0691.2005.01227.x
20
Kelly D. Yang L. Pei Z. J. (2018). Gut microbiota, fusobacteria, and colorectal cancer. Diseases6, 109. doi: 10.3390/diseases6040109
21
Kim Y. S. Milner J. A. (2007). Dietary modulation of colon cancer risk. J. Nutr.137, 2576S–2579S. doi: 10.1093/jn/137.11.2576S
22
Kopač T. Ručigaj A. J. (2024). Impact of fiber diameter and surface substituents on the mechanical and flow properties of sonicated cellulose dispersions. Int. J. Biol. Macromolecules281, 136210. doi: 10.1016/j.ijbiomac.2024.136210
23
Lei J. Dong Y. Hou Q. He Y. Lai Y. Liao C. et al . (2022). Intestinal microbiota regulate certain meat quality parameters in chicken. Front. Nutr.9, 747705. doi: 10.3389/fnut.2022.747705
24
Li X. He L. Luo J. Zheng Y. Zhou Y. Li D. et al . (2022). Paeniclostridium sordellii hemorrhagic toxin targets TMPRSS2 to induce colonic epithelial lesions. Nat. Commun.13, 4331. doi: 10.1038/s41467-022-31994-x
25
Lin L. J. Zeng J. Tian Q. M. Ding X. Q. Zhang X. Y. Gao X. Y. J. F. (2022). Effect of the bacterial community on the volatile flavour profile of a Chinese fermented condiment–Red sour soup–During fermentation. Food Res. Int.155, 111059. doi: 10.1016/j.foodres.2022.111059
26
Liu D. Zhang C. Zhang J. Xin X. Liao X. J. (2021). Metagenomics reveals the formation mechanism of flavor metabolites during the spontaneous fermentation of potherb mustard (Brassica juncea var. multiceps). Food Res. Int.148, 110622. doi: 10.1016/j.foodres.2021.110622
27
Liu J. K. Zhao S. M. Xiong S. B. Zhang S. H. (2009). Influence of recooking on volatile and non-volatile compounds found in silver carp. Hypophthalmichthys molitrix Fisheries Sci75, 1067–1075. doi: 10.1007/s12562-009-0116-y
28
Lorenzo J. M. Carballo J. Franco D. J. (2013). Effect of the inclusion of chestnut in the finishing diet on volatile compounds of dry-cured ham from Celta pig breed. J. Integr. Agric.12, 2002–2012. doi: 10.1016/S2095-3119(13)60638-3
29
Ma Y. Qu Z. L. Liu B. Tan J. J. Asiegbu F. O. Sun H. J. (2020). Bacterial community structure of Pinus thunbergii naturally infected by the nematode Bursaphelenchus xylophilus. Microorganisms8, 307. doi: 10.3390/microorganisms8020307
30
Mansur M. A. Bhadra A. Takamura H. Matoba T. J. (2003). Volatile flavor compounds of some sea fish and prawn species. Fisheries Sci69, 864–866. doi: 10.1046/j.1444-2906.2003.00700.x
31
Mu H. Wei Z. Yi L. Shentu J. Zhang W. Mai K. J. (2017). Effects of low dietary fish meal on the volatile compounds in muscle of large yellow croaker Larimichthys crocea. Aquaculture Res.48, 5179–5191. doi: 10.1111/are.13265
32
Nayak S. K. (2010). Role of gastrointestinal microbiota in fish. Aquaculture Res.41, 1553–1573. doi: 10.1111/j.1365-2109.2010.02546.x
33
Ørnsrud R. Arukwe A. Bohne V. Pavlikova N. Lundebye A. K. (2011). Investigations on the metabolism and potentially adverse effects of ethoxyquin dimer, a major metabolite of the synthetic antioxidant ethoxyquin in salmon muscle. J. Food Prot.74, 1574–1580. doi: 10.4315/0362-028X.JFP-10-547
34
Pan W. Benjakul S. Sanmartin C. Guidi A. Ying X. Ma L. et al . (2022). Characterization of the flavor profile of bigeye tuna slices treated by cold plasma using E-Nose and GC-IMS. Fishes7, 13. doi: 10.3390/fishes7010013
35
Pan N. Shi P. Zhu Q. Wang C. Ouyang Q. Huang X. et al . (2024). Machine learning reveals the interplay between muscle fatty acids and the gut microbiota: implications for high-quality pork. doi: 10.21203/rs.3.rs-4023681/v1
36
Parrilli E. Tedesco P. Fondi M. Tutino M. L. Giudice A. L. de Pascale D. et al . (2021). The art of adapting to extreme environments: the model system. Pseudoalteromonas Phys. Life Rev.36, 137–161. doi: 10.1016/j.plrev.2019.04.003
37
Paster B. J. (2015). Brevinema. Bergey's Manual Systematics Archaea Bacteria, 1–2. doi: 10.1002/9781118960608
38
Peng K. S. Wu N. Cui Z. W. Zhang X. Y. Lu X. B. Wang Z. X. et al . (2020). Effect of the complete replacement of dietary fish meal by soybean meal on histopathology and immune response of the hindgut in grass carp (Ctenopharyngodon idellus). Veterinary Immunol. Immunopathology221, 110009. doi: 10.1016/j.vetimm.2020.110009
39
Przewłócka K. Folwarski M. Kaźmierczak-Siedlecka K. Skonieczna-Żydecka K. Kaczor J. J. (2020). Gut-muscle axis exists and may affect skeletal muscle adaptation to training. Nutrients12, 1451. doi: 10.3390/nu12051451
40
Purrinos L. Bermúdez R. Franco D. Carballo J. Lorenzo J. M. (2011). Development of volatile compounds during the manufacture of dry-cured “Lacón,” a Spanish traditional meat product. J. Food Sci76, C89–C97. doi: 10.1111/j.1750-3841.2010.01955.x
41
Qi R. Sun J. Qiu X. Zhang Y. Wang J. Wang Q. et al . (2021). The intestinal microbiota contributes to the growth and physiological state of muscle tissue in piglets. Sci. Rep.11, 11237. doi: 10.1038/s41598-021-90881-5
42
Rangseekaew P. Barros-Rodríguez A. Pathom-Aree W. Manzanera M. J. (2022). Plant beneficial deep-sea actinobacterium, Dermacoccus abyssi MT1. 1T promote growth of tomato (Solanum lycopersicum) under salinity stress. Biology11, 191. doi: 10.3390/biology11020191
43
Rimoldi S. Terova G. Ascione C. Giannico R. Brambilla F. (2018). Next generation sequencing for gut microbiome characterization in rainbow trout (Oncorhynchus mykiss) fed animal by-product meals as an alternative to fishmeal protein sources. PloS One13, e0193652. doi: 10.1371/journal.pone.0193652
44
Ringø E. Sperstad S. Myklebust R. Refstie S. Krogdahl Å.J.A. (2006). Characterisation of the microbiota associated with intestine of Atlantic cod (Gadus morhua L.): the effect of fish meal, standard soybean meal and a bioprocessed soybean meal. Aquaculture261, 829–841. doi: 10.1016/j.aquaculture.2006.06.030
45
Rodriguez-Torres E. E. Viveros-Rogel J. López-García K. Vázquez-Mendoza E. Chávez-Fragoso G. Quiroz-González S. et al . (2020). Chronic undernutrition differentially changes muscle fiber types organization and distribution in the EDL muscle fascicles. Front. Physiol.11, 777. doi: 10.3389/fphys.2020.00777
46
Salum P. Guclu G. Selli S. J. Chemistry F. (2017). Comparative evaluation of key aroma-active compounds in raw and cooked red mullet (Mullus barbatus) by aroma extract dilution analysis. J. Agric. Food Chem.65, 8402–8408. doi: 10.1021/acs.jafc.7b02756
47
Sérot T. Regost C. Prost C. Robin J. Arzel J. J. (2001). Effect of dietary lipid sources on odour-active compounds in muscle of turbot (Psetta maxima). J. Sci Food Agric.81, 1339–1346. doi: 10.1002/jsfa.950
48
Shin N. R. Whon T. W. Bae J. W. J. (2015). Proteobacteria: microbial signature of dysbiosis in gut microbiota. Trends Biotechnol.33, 496–503. doi: 10.1016/j.tibtech.2015.06.011
49
Song J. Chen Q. Bi J. Meng X. Wu X. Qiao Y. et al . (2020). GC/MS coupled with MOS e-nose and flash GC e-nose for volatile characterization of Chinese jujubes as affected by different drying methods. Food Chem.331, 127201. doi: 10.1016/j.foodchem.2020.127201
50
Song J. Shao Y. Yan Y. Li X. Peng J. Guo L. J. (2021). Characterization of volatile profiles of three colored quinoas based on GC-IMS and PCA. LWT - Food Sci Technol.146, 111292. doi: 10.1016/j.lwt.2021.111292
51
Spring S. Amann R. Ludwig W. Schleifer K. H. Schüler D. Poralla K. et al . (1995). Phylogenetic analysis of uncultured magnetotactic bacteria from the alpha-subclass of Proteobacteria. Systematic Appl. Microbiol.17, 501–508. doi: 10.1016/S0723-2020(11)80068-8
52
Sun Y. Zhang S. Nie Q. He H. Tan H. Geng F. et al . (2023). Gut firmicutes: Relationship with dietary fiber and role in host homeostasis. Crit. Rev. Food Sci Nutr.63, 12073–12088. doi: 10.1080/10408398.2022.2098249
53
Surana N. K. Kasper D. L. (2014). Deciphering the tête-à-tête between the microbiota and the immune system. J. Clin. Invest.124, 4197–4203. doi: 10.1172/JCI72332
54
Tang T. Bai J. Ao Z. Wei Z. Hu Y. Liu S. J. (2021). Effects of dietary paper mulberry (Broussonetia papyrifera) on growth performance and muscle quality of grass carp (Ctenopharyngodon idella). Animals11, 1655. doi: 10.3390/ani11061655
55
Thomas F. Hehemann J. H. Rebuffet E. Czjzek M. Michel G. J. (2011). Environmental and gut bacteroidetes: the food connection. Front. Microbiol.2, 93. doi: 10.3389/fmicb.2011.00093
56
Tran N. T. Zhang J. Xiong F. Wang G. T. Li W. X. Wu S. G. (2018). Altered gut microbiota associated with intestinal disease in grass carp (Ctenopharyngodon idellus). World J. Microbiol. Biotechnol.34, 1–9. doi: 10.1007/s11274-018-2447-2
57
Wang J. Ai Q. Mai K. Xu H. Zuo R. Xu W. et al . (2015). Effects of dietary ethoxyquin on growth, feed utilization and residue in the muscle of juvenile Japanese seabass. Lateolabrax japonicus Aquaculture Res.46, 2656–2664. doi: 10.1111/are.12420
58
Wen C. Li S. Wang J. Zhu Y. Zong X. Wang Y. et al . (2021). Heat stress alters the intestinal microbiota and metabolomic profiles in mice. Front. Microbiol.12, 706772. doi: 10.3389/fmicb.2021.706772
59
Williams K. C. Paterson B. D. Barlow C. G. Ford A. Roberts R. J. (2003). Potential of meat meal to replace fish meal in extruded dry diets for barramundi, Lates calcarifer (Bloch). II. Organoleptic characteristics and fatty acid composition. Aquaculture Res.34, 33–42. doi: 10.1046/j.1365-2109.2003.00786.x
60
Wu S. Wang G. Angert E. R. Wang W. Li W. Zou H. J. (2012). Composition, diversity, and origin of the bacterial community in grass carp intestine. PloS One7, e30440. doi: 10.1371/journal.pone.0030440
61
Xu L. Mao T. Xia M. Wu W. Chen J. Jiang C. et al . (2024). New evidence for gut-muscle axis: lactic acid bacteria-induced gut microbiota regulates duck meat flavor. Food Chem.450, 139354. doi: 10.1016/j.foodchem.2024.139354
62
Yamashita Y. Katagiri T. Pirarat N. Futami K. Endo M. Maita M. (2009). The synthetic antioxidant, ethoxyquin, adversely affects immunity in tilapia (Oreochromis niloticus). Aquaculture Nutr.15, 144–151. doi: 10.1111/j.1365-2095.2008.00577.x
63
Yao J. Chen P. Ringø E. Zhang G. Huang Z. Hua X. J. (2019). Effect of diet supplemented with rapeseed meal or hydrolysable tannins on the growth, nutrition, and intestinal microbiota in grass carp (Ctenopharyngodon idellus). Front. Nutr.6, 154. doi: 10.3389/fnut.2019.00154
64
Yu E. M. Zhang H. F. Li Z. F. Wang G. J. Wu H. K. Xie J. et al . (2017). Proteomic signature of muscle fibre hyperplasia in response to faba bean intake in grass carp. Sci. Rep.7, 45950. doi: 10.1038/srep45950
65
Zha Y. Eiler A. Johansson F. Svanbäck R. J. (2018). Effects of predation stress and food ration on perch gut microbiota. Microbiome6, 1–12. doi: 10.1186/s40168-018-0400-0
66
Zhang J. Cao J. Pei Z. Wei P. Xiang D. Cao X. et al . (2019). Volatile flavour components and the mechanisms underlying their production in golden pompano (Trachinotus blochii) fillets subjected to different drying methods: A comparative study using an electronic nose, an electronic tongue and SDE-GC-MS. Food Res. Int.123, 217–225. doi: 10.1016/j.foodres.2019.04.069
67
Zhang Q. Ding Y. Gu S. Zhu S. Zhou X. Ding Y. J. (2020). Identification of changes in volatile compounds in dry-cured fish during storage using HS-GC-IMS. Food Res. Int.137, 109339. doi: 10.1016/j.foodres.2020.109339
68
Zhang S. Nie Q. Sun Y. Zuo S. Chen C. Li S. et al . (2024). Bacteroides uniformis degrades β-glucan to promote Lactobacillus johnsonii improving indole-3-lactic acid levels in alleviating colitis. Microbiome12, 177. doi: 10.1186/s40168-024-01896-9
69
Zhang X. Shu M. Wang Y. Fu L. Li W. Deng B. et al . (2014). Effect of photosynthetic bacteria on water quality and microbiota in grass carp culture. World J. Microbiol. Biotechnol.30, 2523–2531. doi: 10.1007/s11274-014-1677-1
70
Zhang Y. Yu Z. Xu Q. Li X. Zhu S. Li J. (2022). Regionally divergent patterns of grass carp relative abundance, feeding habits and trophic niches in the subtropical Pearl River basin. Aquat. Ecol., 1–17. doi: 10.1007/s10452-021-09923-9
71
Zhu H. Liu H. Yan J. Wang R. Liu L. (2012). Liu and biochemistry, Effect of yeast polysaccharide on some hematologic parameter and gut morphology in channel catfish (Ictalurus punctatus). Fish Physiol. Biochem.38, 1441–1447. doi: 10.1007/s10695-012-9631-3
Summary
Keywords
fish meal, grass carp, growth performance, intestinal microflora, volatile compounds
Citation
Wang G, Luo W, Zhang X, Sun G, Tong F, Wei Z and Luo W (2025) Effect of different fishmeal levels in diets on growth performance, tissue morphology, intestinal microflora, and muscle volatile compounds of grass carp. Front. Mar. Sci. 12:1659376. doi: 10.3389/fmars.2025.1659376
Received
14 July 2025
Accepted
03 September 2025
Published
22 September 2025
Volume
12 - 2025
Edited by
Luca Parma, University of Bologna, Italy
Reviewed by
Yuwen Dong, University of Pennsylvania, United States
Ercüment Genç, Ankara University, Türkiye
Updates
Copyright
© 2025 Wang, Luo, Zhang, Sun, Tong, Wei and Luo.
This is an open-access article distributed under the terms of the Creative Commons Attribution License (CC BY). The use, distribution or reproduction in other forums is permitted, provided the original author(s) and the copyright owner(s) are credited and that the original publication in this journal is cited, in accordance with accepted academic practice. No use, distribution or reproduction is permitted which does not comply with these terms.
*Correspondence: Wenjie Luo, 18874241882@163.com
Disclaimer
All claims expressed in this article are solely those of the authors and do not necessarily represent those of their affiliated organizations, or those of the publisher, the editors and the reviewers. Any product that may be evaluated in this article or claim that may be made by its manufacturer is not guaranteed or endorsed by the publisher.