Abstract
Marine coral sand-clay mixtures (MCCM) are widely used in marine engineering, with their mechanical behavior strongly influenced by clay content. This study investigates the effects of 3D-printed triaxial geogrid reinforcement on MCCM through triaxial testing. Based on the experimental results, a dataset was established, while a novel machine learning model named GP-BPNN was proposed, integrating genetic algorithm (GA), particle swarm optimization (PSO), and backpropagation neural network (BPNN). This model was applied for the first time to predict the strength of MCCM. Results show that lower clay content, more reinforcement layers, and higher confining pressure significantly enhance the strength and cohesion of MCCM, with little effect on the internal friction angle. The strength first decreases, then increases, and finally decreases again with increasing water content. Particle breakage is influenced by clay content and water content; moreover, fractal analysis reveals a linear relationship between the breakage rate and the fractal dimension. SEM images reveal the interaction between MCCM and the geogrid. Additional stress and matrix suction analyses highlight the effects of reinforcement layers and water content on the strength. These findings offer insight into triaxial geogrid-reinforced MCCM behavior and provide guidance for marine engineering construction.
1 Introduction
Marine coral sand is predominantly distributed in tropical and subtropical marine regions near the equator, including the South China Sea, the Coral Triangle, and the shallow continental platforms of the Caribbean Sea (Qi et al., 2022; Shahnazari and Rezvani, 2013). It originates from the long-term geological accumulation of biogenic debris such as corals and shells, and as a result, it exhibits distinctive physical properties such as high porosity, irregular particle morphology, low particle strength, and high calcium content (Chao et al., 2025; Ding et al., 2022a; Wu et al., 2021b). These characteristics make marine coral sand a widely used material in hydraulic reclamation and land fill projects (Ding et al., 2022b; Wang et al., 2011). However, when common seabed dredging operations such as mechanical grab dredging and suction pipeline extraction are carried out, low-density marine clay is readily entrained into the marine coral sand due to water-induced turbulence (Prakasha and Chandrasekaran, 2005). In addition, tidal flows and bottom currents promote the fragmentation and dispersion of clay aggregates into the sand matrix (Xu et al., 2020). As a result, the fill material used in practice typically forms a marine coral sand–clay mixture (MCCM) (Chen et al., 2024b). The presence of marine clay further exacerbates the intrinsic drawbacks of marine coral sand, such as its low strength and high compressibility, which in turn results in a substantial reduction in the overall bearing capacity and long-term stability of marine infrastructure founded on MCCM (Chao et al., 2021; Lv et al., 2021; Peng et al., 2022; Wu et al., 2021a). To mitigate these limitations, reinforcement with geosynthetic materials has been explored as a viable solution (Abdelaal and Solanki, 2022; Ahmadi and Chen, 2019; Bacas et al., 2011; King et al., 2017; Rowe and Fan, 2021, 2022; Xu et al., 2023a), particularly with the application of geogrids (Biabani and Indraratna, 2015). Several studies have demonstrated that the incorporation of geogrids can significantly enhance the mechanical performance of MCCM, particularly in terms of strength, stiffness, and deformation resistance (Derksen et al., 2021; Jiang et al., 2024; Xu et al., 2019). More recently, triaxial geogrids, which offer multidirectional confinement, have shown superior performance compared to conventional uniaxial or biaxial geogrids (Baadiga and Balunaini, 2023; Chen et al., 2021; Poorahong et al., 2024). Consequently, the pursuit of a comprehensive understanding of the mechanical behavior of MCCM and the elucidation of the reinforcement mechanisms of triaxial geogrids have become critical research frontiers in the field of marine geotechnical engineering.
Extensive research on the reinforcement of MCCM has produced valuable insights; however, most existing studies focus primarily on the reinforcement of pure marine coral sand (Ding et al., 2022b; Wang et al., 2023; Xu et al., 2023b). Among them, geogrids have been identified as an effective reinforcement material (Kermani et al., 2018; Luo et al., 2024; Zhang et al., 2025). Ding et al. (2022b) conducted triaxial consolidated drained tests with customized geogrids to examine the effects of confining pressure and reinforcement layers on the strength of marine coral sand. The results revealed that geogrid reinforcement significantly improved both strength and deformation characteristics. Luo et al. (2023) applied geogrid reinforcement to improve the bearing capacity of marine structures, particularly slopes made from marine coral sand. The study found that geogrids significantly increased shear strength and improved the failure mechanism of the slopes. Chen et al. (2024a) conducted large-scale drained consolidated triaxial compression tests to investigate the effects of confining pressure, moisture content, and geogrid reinforcement on the mechanical and deformation behaviors of marine coral sand. The study found that geogrid reinforcement significantly enhanced the shear strength and mitigated volumetric dilation, while particle breakage increased with higher confining pressures. Some researchers have conducted cyclic triaxial shear tests on geogrid-reinforced marine coral sand and demonstrated that geogrid reinforcement can significantly enhance its liquefaction resistance (Gao et al., 2024; Zhou et al., 2024). These studies provide preliminary references for reinforcing marine coral sand. However, in practical applications, the fill materials used are typically MCCM, and research on reinforcing MCCM with triaxial geogrids remains limited.
In MCCM, the diversity of marine biogenic debris results in highly variable shapes of marine coral sand particles (Akosah et al., 2025; Jin et al., 2022; Wu et al., 2023; Yang et al., 2024). These variations necessitate matching specific geogrid sizes to achieve optimal reinforcement performance (Cheng et al., 2022; Hasheminezhad et al., 2025; Oliveira and Falorca, 2025; Venkateswarlu et al., 2023a). The complexity and high cost of conventional manufacturing methods make it difficult to produce geogrids with precise geometries (Fowmes et al., 2017). Industrial 3D printing technology offers a viable solution by enabling the customization of geogrids based on the distinct characteristics of marine coral sand particles, thereby enhancing their reinforcement effectiveness (Giroud et al., 2023; Liang et al., 2024; Tavakoli et al., 2023; Venkateswarlu et al., 2023b). Stathas et al. (2017) conducted laboratory experiments comparing the mechanical performance of geogrids fabricated via 3D printing and traditional methods. The results indicated that 3D-printed geogrids are more suitable for scaled-down physical model tests of reinforced soils. Fowmes et al. (2017) conducted the first research to explore the application of 3D printing technology in the fabrication of geosynthetics. In addition, various 3D printing methods used for producing geosynthetics were compared and analyzed in terms of their advantages and limitations. The study found that 3D printing offers a viable solution to the challenges of achieving precision and customization that are difficult to attain with traditional manufacturing methods. Zhang et al. (2023) designed an intelligent geogrid by integrating 3D printing technology with FBG sensor elements, thus enabling real-time measurement and monitoring of stress and strain during service. Previous studies confirmed the applicability of 3D-printed geogrids and their rapid, precise fabrication. However, most focus on single soil types, with limited research on MCCM. Thus, applying 3D printing is crucial for optimizing geogrid design for MCCM reinforcement and guiding marine engineering projects.
Predictive models based on physical test results are widely used in geotechnical engineering to generalize and apply experimental findings (Chao and Fowmes, 2021; Chao et al., 2024c; Dong et al., 2017). However, as noted above, the mechanical behavior of MCCM is governed by multiple interacting factors such as clay content, reinforcement method and moisture content, and its internal structure and physical responses exhibit pronounced non-linear characteristics (Chao et al., 2024b; Rowe and Fan, 2021). The intricate interplay among variables makes it difficult for conventional statistical methods to replicate the observed responses accurately, yet faithfully modeling these influences is crucial for a dependable evaluation of MCCM’s strength and deformation behavior (Cavalcante and Mascarenhas, 2021; Chao et al., 2024a). In recent years, machine learning methods have attracted widespread interest among geotechnical researchers due to their superior ability to handle high-dimensional, non-linear, multivariate problems, and have been successfully applied to tasks such as soil property prediction and foundation bearing capacity analysis (Biabani and Indraratna, 2015; Chao and Fowmes, 2021, 2022; Chao et al., 2021). Moreover, most prior investigations have relied on comparatively simple algorithms or on models with suboptimal tuned hyperparameters (Chao et al., 2023a, 2022a, b), so the potential of advanced ensemble techniques for modeling complex soil behavior remains largely unexplored, and this gap presents a significant hurdle to accurate prediction of MCCM’s mechanical performance.
Generally, machine learning models that lack integrated optimization algorithms suffer from low efficiency, slow convergence, overfitting tendencies, and a high risk of entrapment in local optima, which often causes convergence problems (Raja and Shukla, 2020; Saghatforoush et al., 2016). More importantly, manual determination of initial model parameters introduces subjectivity and undermines prediction accuracy (Chao et al., 2022a; Hasanipanah et al., 2018). Consequently, some researchers have employed genetic algorithms (GA) and particle swarm optimization (PSO) to tune the initial parameters of machine-learning models for geotechnical material performance assessment, demonstrating that these hybrid models converge faster and deliver higher prediction accuracy (Ahmadi and Chen, 2019; Al Khalifah et al., 2020; Chao et al., 2022b). However, genetic algorithms and particle swarm optimization still have inherent limitations, such as a tendency to fall into local optima and reliance on empirical parameter selection (Chao et al., 2023b; Liu et al., 2015a; Wang and Shen, 2018). To address this issue, this study proposes a new approach by introducing the GP optimization algorithm, which combines the global search capability of GA with the efficient convergence of PSO to enhance model stability and prediction accuracy in evaluating the mechanical behavior of MCCM.
This study investigates the mechanical behavior of MCCM reinforced with 3D-printed triaxial geogrids. A series of triaxial tests were conducted to evaluate the effects of clay content, number of reinforcement layers, confining pressure, and moisture content on the performance of geogrid-reinforced MCCM. In addition, particle breakage characteristics were analyzed through sieve analysis. The findings provide valuable insights for optimizing geogrid products and advancing the application of 3D printing technology in the reinforcement of MCCM and other geotechnical materials. Based on 900 sets of triaxial test data, a machine learning model was developed to predict the strength of MCCM under various conditions, with a hybrid optimization approach that integrates GA and PSO. Sensitivity analysis was also conducted to identify key influencing variables, which facilitates practical strength estimation of MCCM for geotechnical engineers with limited machine learning experience. This approach forms a closed loop from experimentation to optimization, which significantly decreases the need for extensive repetitive physical testing. This research provides experimental and theoretical support for reinforced soil technologies to enhance the stability and safety of marine engineering structures.
2 Physical test methodology
2.1 Materials
2.1.1 Marine coral sand and clay
The materials used in the test included marine coral sand and kaolin clay. The marine coral sand was collected from the South China Sea. After drying and screening, particles with a grain size range of 0.074 mm to 2 mm were selected for testing. The kaolin clay had a grain size of 10 μm. Figure 1. shows the marine coral sand and kaolin clay used in the test, Additionally, Scanning Electron Microscopy (SEM) images of the specimens were obtained. Figure 2. presents the grain size distribution curve, and Table 1 lists the key material properties. The marine coral sand had a coefficient of uniformity (Cu) of 3.1 and a coefficient of curvature (Cc) of 1.2, which reflects a well-graded particle distribution suitable for engineering applications. The SEM images reveal that the marine coral sand particles possess irregular shapes with rough and porous surfaces, which can enhance mechanical interlocking and influence the interaction with the kaolin clay matrix. These microstructural features are critical in understanding the strength and deformation behavior of the coral sand–clay mixture used in the tests.
Figure 1

Marine coral sand and kaolin clay with SEM images.
Figure 2
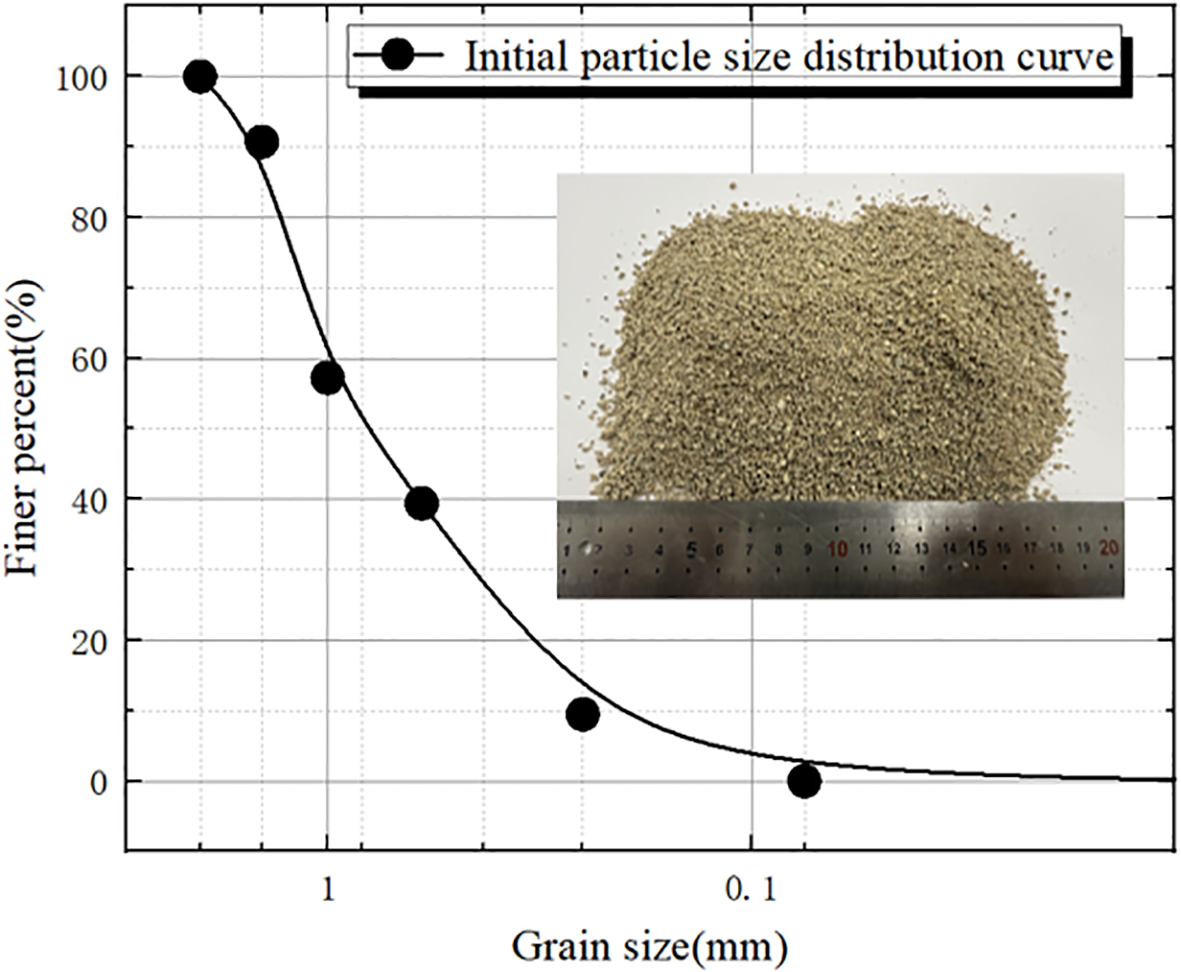
Grain size grading curve of marine coral sand.
Table 1
| GS | D50/mm | Cu | Cc | emin | emax |
|---|---|---|---|---|---|
| 2.81 | 1 | 3.1 | 1.2 | 0.99 | 1.49 |
Basic physical parameters of marine coral sand.
2.1.2 3D printed triaxial geogrid
A triaxial geogrid was fabricated using 3D printing technology of Stereolithography Apparatus (SLA), as shown in Figure 3. The rib width and rib thickness are 1.5 mm and 2 mm, respectively. The apertures are equilateral triangles with a side length of 2 mm. Considering the boundary effect during sample preparation, the diameter of the triaxial geogrid was set to 39.1 mm. Detailed parameters of the triaxial geogrid are listed in Table 2. Figure 4. presents the 3D surface topography of the polymer surfaces obtained via Transmission Electron Microscopy (TEM). This technique enables precise quantification of surface roughness. The Rs parameter denotes the ratio between the actual surface area and its projected area (Frost et al., 2012). 3D surface scans conducted before and after triaxial testing revealed an increase in surface roughness of the multilayer polymer specimens from 1.08 to 1.52. The rise in roughness was primarily attributed to irregular scratches formed by the embedded marine coral sand particles, as illustrated in Figure 4.
Figure 3
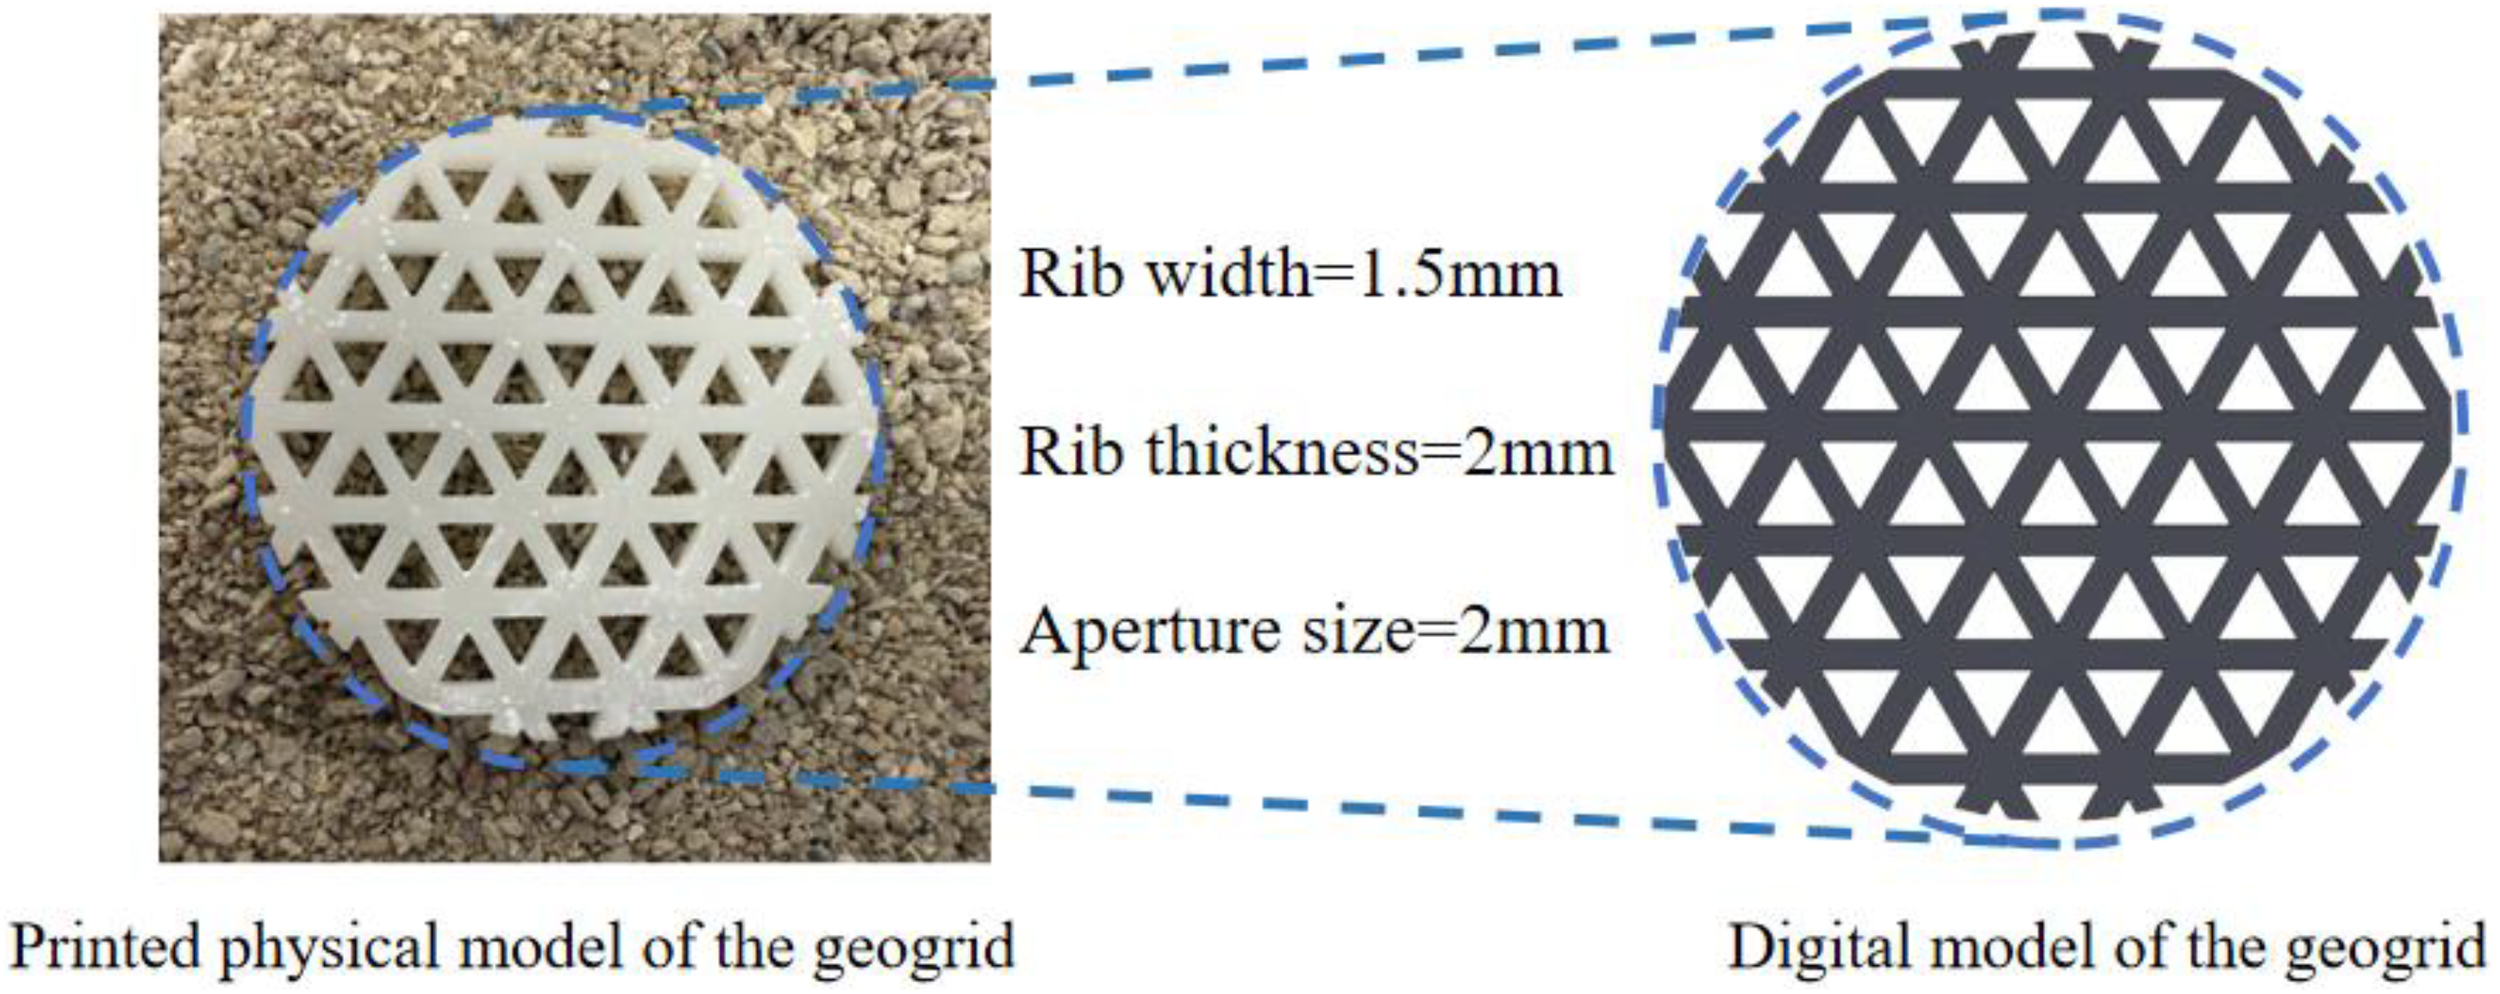
3D printing of geogrid model and entity.
Table 2
| Standard | Tensile modulus | Tensile strength | Elongation at break | Flexural modulus | Impact strength | Distortion temperature |
|---|---|---|---|---|---|---|
| ASTM | 2,598Mpa | 58Mpa | 11% | 2,755Mpa | 30J/m | 65°C |
Physical and mechanical properties of the geogrid.
Figure 4
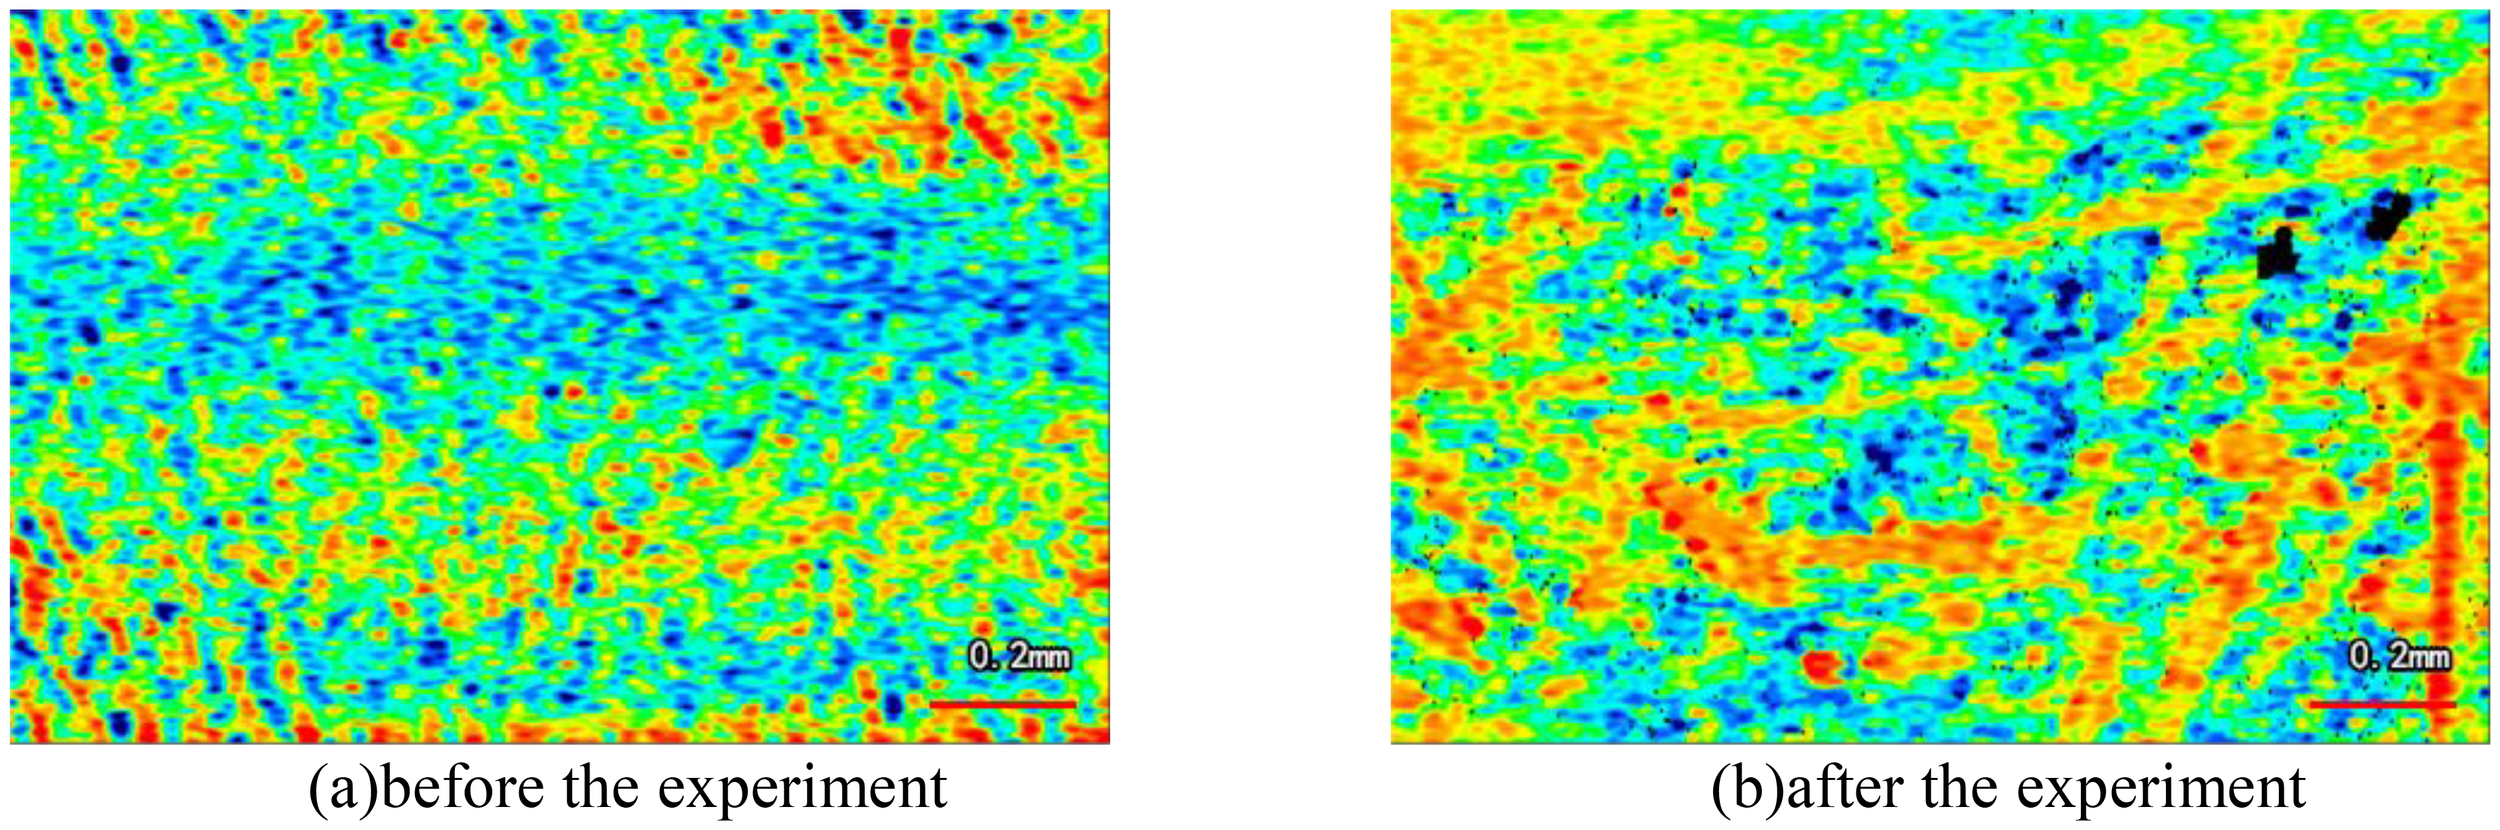
3D surface profile of the geogrid surfaces (a) before the experiment (b) after the experiment.
2.2 Testing program
In the actual environment of the South China Sea islands and reefs, most surface and near-surface marine coral sand remains in an unsaturated state over long periods, resulting in extremely low strength (Chao et al., 2024a). These areas represent potential reinforcement zones for geogrid applications (Chao et al., 2024b). An accurate understanding of their mechanical properties and the development of an effective reinforcement mechanism are critical for ensuring the safety and stability of island construction. To investigate the fundamental mechanical behavior, deformation characteristics, and particle breakage patterns of MCCM with varying clay contents reinforced by triaxial geogrids, a series of unconsolidated undrained (UU) triaxial tests were conducted, as summarized in Table 3. The tests considered the effects of clay content, number of geogrid layers, initial water content, and confining pressure. Given the crushable nature of marine coral sand particles, post-test particle size sieving analyses were also performed to quantitatively evaluate particle breakage characteristics under different conditions.
Table 3
| Number | Clay content | Confining pressure(kPa) | Geogrid layers | Water content |
|---|---|---|---|---|
| T1 | 30 | 50, 100, 150, 200 | 0, 1, 2 | 0 |
| T2 | 50 | 50, 100, 150, 200 | 0, 1, 2 | 0 |
| T3 | 70 | 50, 100, 150, 200 | 0, 1, 2 | 0 |
| T4 | 70 | 50, 100, 150, 200 | 1 | 9 |
| T5 | 70 | 50, 100, 150, 200 | 1 | 15 |
| T6 | 70 | 50, 100, 150, 200 | 1 | 18 |
| T7 | 70 | 50, 100, 150, 200 | 1 | 21 |
| T8 | 70 | 50, 100, 150, 200 | 1 | 27 |
| T9 | 70 | 50, 100, 150, 200 | 1 | 36 |
Experimental scheme.
2.3 Testing step
The experiments were conducted using a static-dynamic triaxial testing system manufactured by VJ Tech, UK, as shown in Figure 5. For each specimen, the mass of each layer was pre-calculated based on the target water content, followed by precise weighing and moisture adjustment. The prepared MCCM, after being uniformly mixed and tamped, was placed into the mold layer by layer and compacted to the designated height. The volume of the geogrid was taken into account and deducted during sample preparation to avoid affecting the specimen’s density. The layout and placement of the geogrid reinforcement are illustrated in Figure 5. Upon completion of sample preparation, triaxial compression tests were carried out, with each test terminated when the axial strain reached 15%. After testing, the MCCM specimens were washed, oven-dried, and sieved to obtain the particle size distribution curve of the marine coral sand after shear.
Figure 5
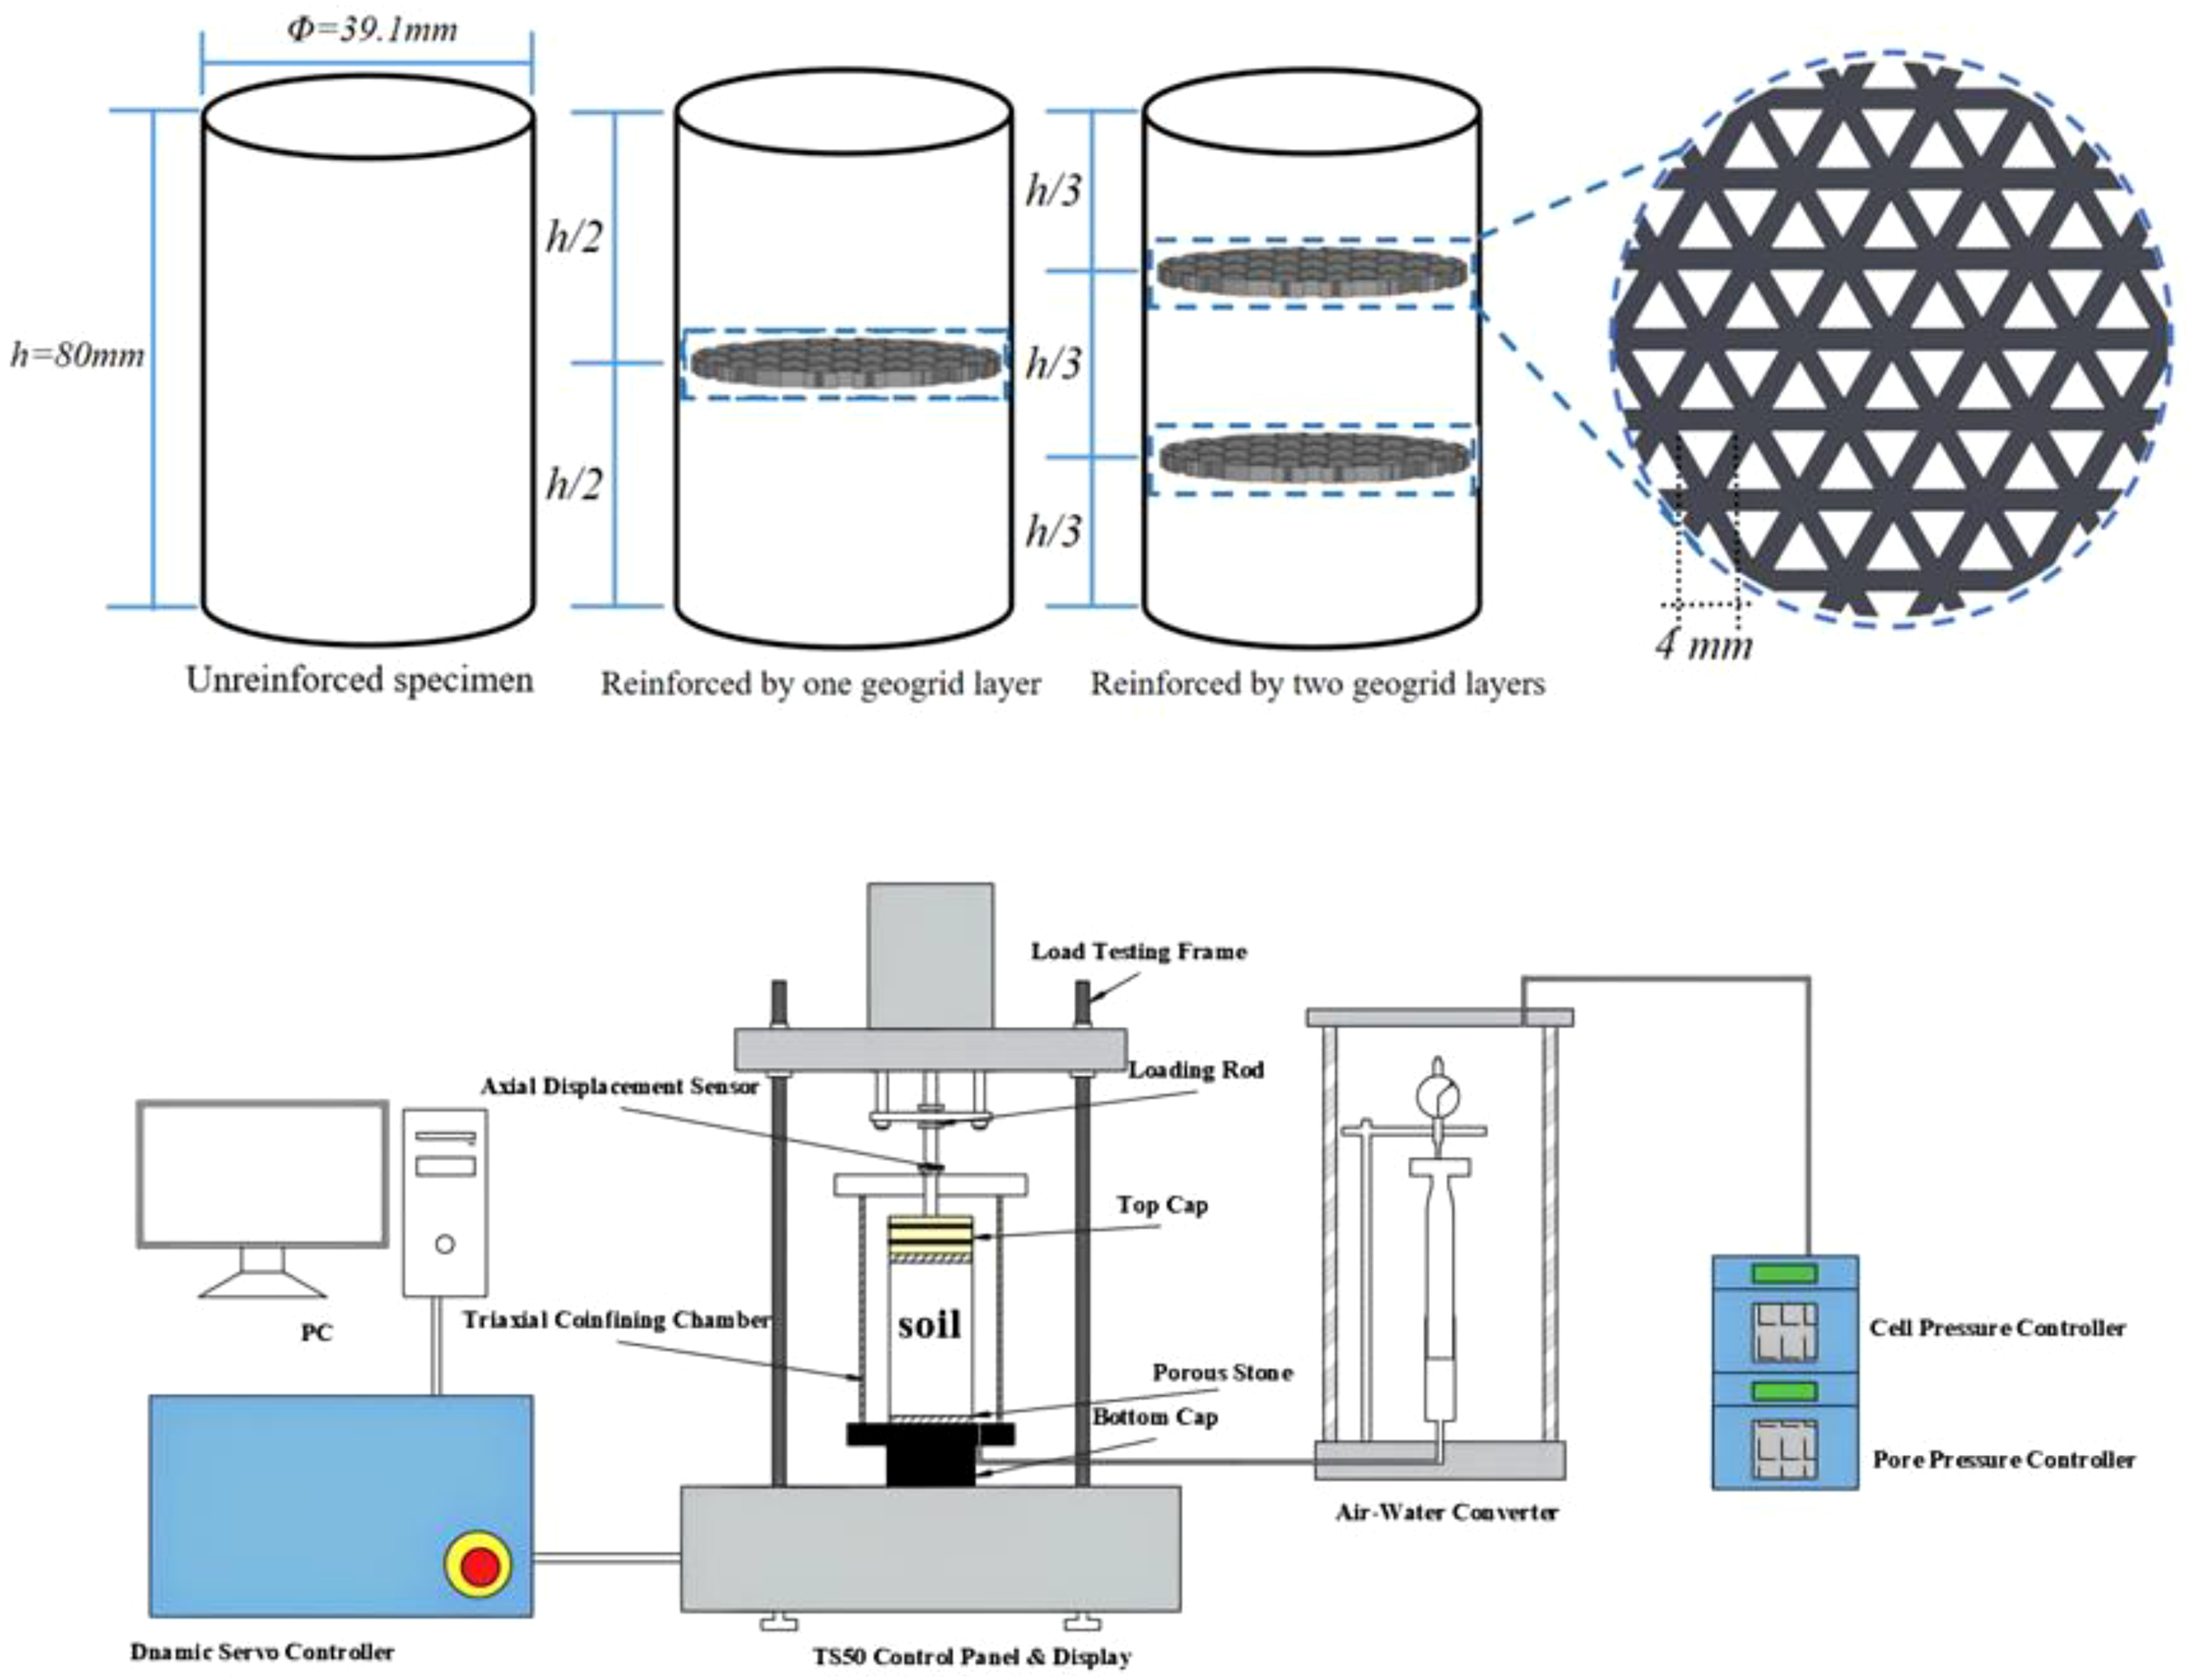
Triaxial geogrid reinforcement position diagram and static-dynamic triaxial testing system.
3 Establishment of machine learning algorithms and datasets
This study employs one machine learning algorithm, namely BPNN (Back Propagation Neural Network). To optimize the algorithm, GA, PSO, and GP are applied. Among the various advantages of using these algorithms, three key benefits can be highlighted.
-
These algorithms were all developed through a standardized procedure (Kardani et al., 2020).
-
These algorithms have been widely applied in solving marine engineering problems (Samui, 2012; Zhou et al., 2017).
-
These algorithms are capable of accurately fitting the complex nonlinear relationships among numerous influencing factors (Liu et al., 2015b).
3.1 BPNN
BPNN is an artificial neural network based on the backpropagation algorithm (Hecht-Nielsen, 1992). It receives data from input parameters through the input layer, transmits them to the hidden layer, and then performs weighted and nonlinear transformations of the input signals using network weights and activation functions, ultimately generating the output. The BPNN model used in this study consists of five input layers (clay content, number of reinforcement layers, confining pressure, moisture content and strain) and one output layer (stress), as shown in Figure 6. The model adopts the Log-Log Sigmoid function as the activation function and uses the newff function to create a backpropagation neural network, optimizing the initial weights and thresholds.
Figure 6
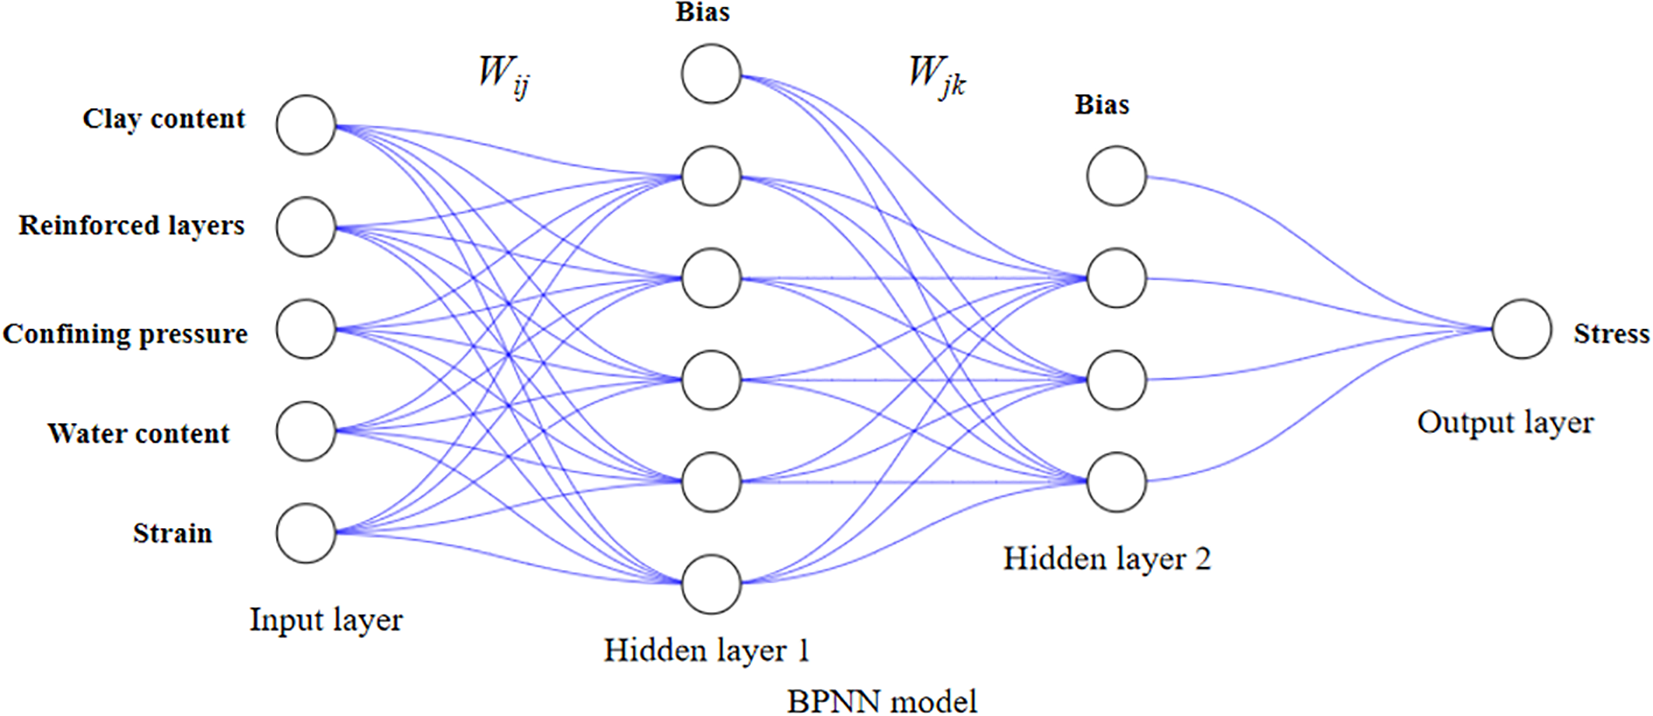
BPNN model.
3.2 GA and PSO
Genetic Algorithm (GA) is an optimization algorithm that simulates the process of natural evolution, searching for optimal solutions through operations such as selection, crossover, and mutation (Lambora et al., 2019). In GA, an initial population is first generated through random initialization, and each individual is evaluated using a fitness function. Based on fitness values, superior individuals are selected for reproduction, and new individuals are generated through crossover and mutation operations. The selection, crossover, and mutation processes are repeated until a termination condition is met, such as reaching the maximum number of iterations or obtaining a satisfactory solution. Genetic algorithms are widely used in optimization and search problems, particularly demonstrating strong search capabilities and adaptability in complex problem spaces and scenarios where traditional methods fail.
Particle Swarm Optimization (PSO) is another heuristic population-based optimization algorithm inspired by the collective behavior of organisms such as bird flocks or fish schools (Wang et al., 2018). In PSO, each candidate solution is treated as a particle that moves through the search space, with its direction and velocity influenced by both its own best historical position and the global best position found by the swarm. Particles adjust their positions based on update rules for their current position and velocity to search for the optimal solution. The key advantages of PSO include its simplicity, ease of implementation, independence from gradient information, global search capability, and fast convergence. It is widely used in function optimization, neural network training, and various other optimization problems.
3.3 GP
GP (GA+PSO) is a hybrid intelligent optimization algorithm that combines the advantages of both Genetic Algorithm (GA) and Particle Swarm Optimization (PSO). The algorithm leverages GA’s global search capability and population diversity to generate new solutions through selection, crossover, and mutation operations, while incorporating PSO’s particle velocity and position update mechanisms to accelerate convergence and enhance local search ability. In GP, the population is first initialized, and GA is used for global exploration, followed by PSO for fine-tuned search to improve the quality of the solutions. This algorithm demonstrates stronger search efficiency and robustness in complex multi-dimensional optimization problems, helping to improve prediction accuracy and reliability for guiding practical marine engineering.
3.4 Dataset creation
In this study, the creation of the dataset forms the foundation for training the machine learning algorithms. To train and validate the performance of BPNN, GA-BPNN, PSO-BPNN, and GP-BPNN, a dataset with 5 input parameters and 1 output parameter was constructed, as shown in Figure 7.
Figure 7
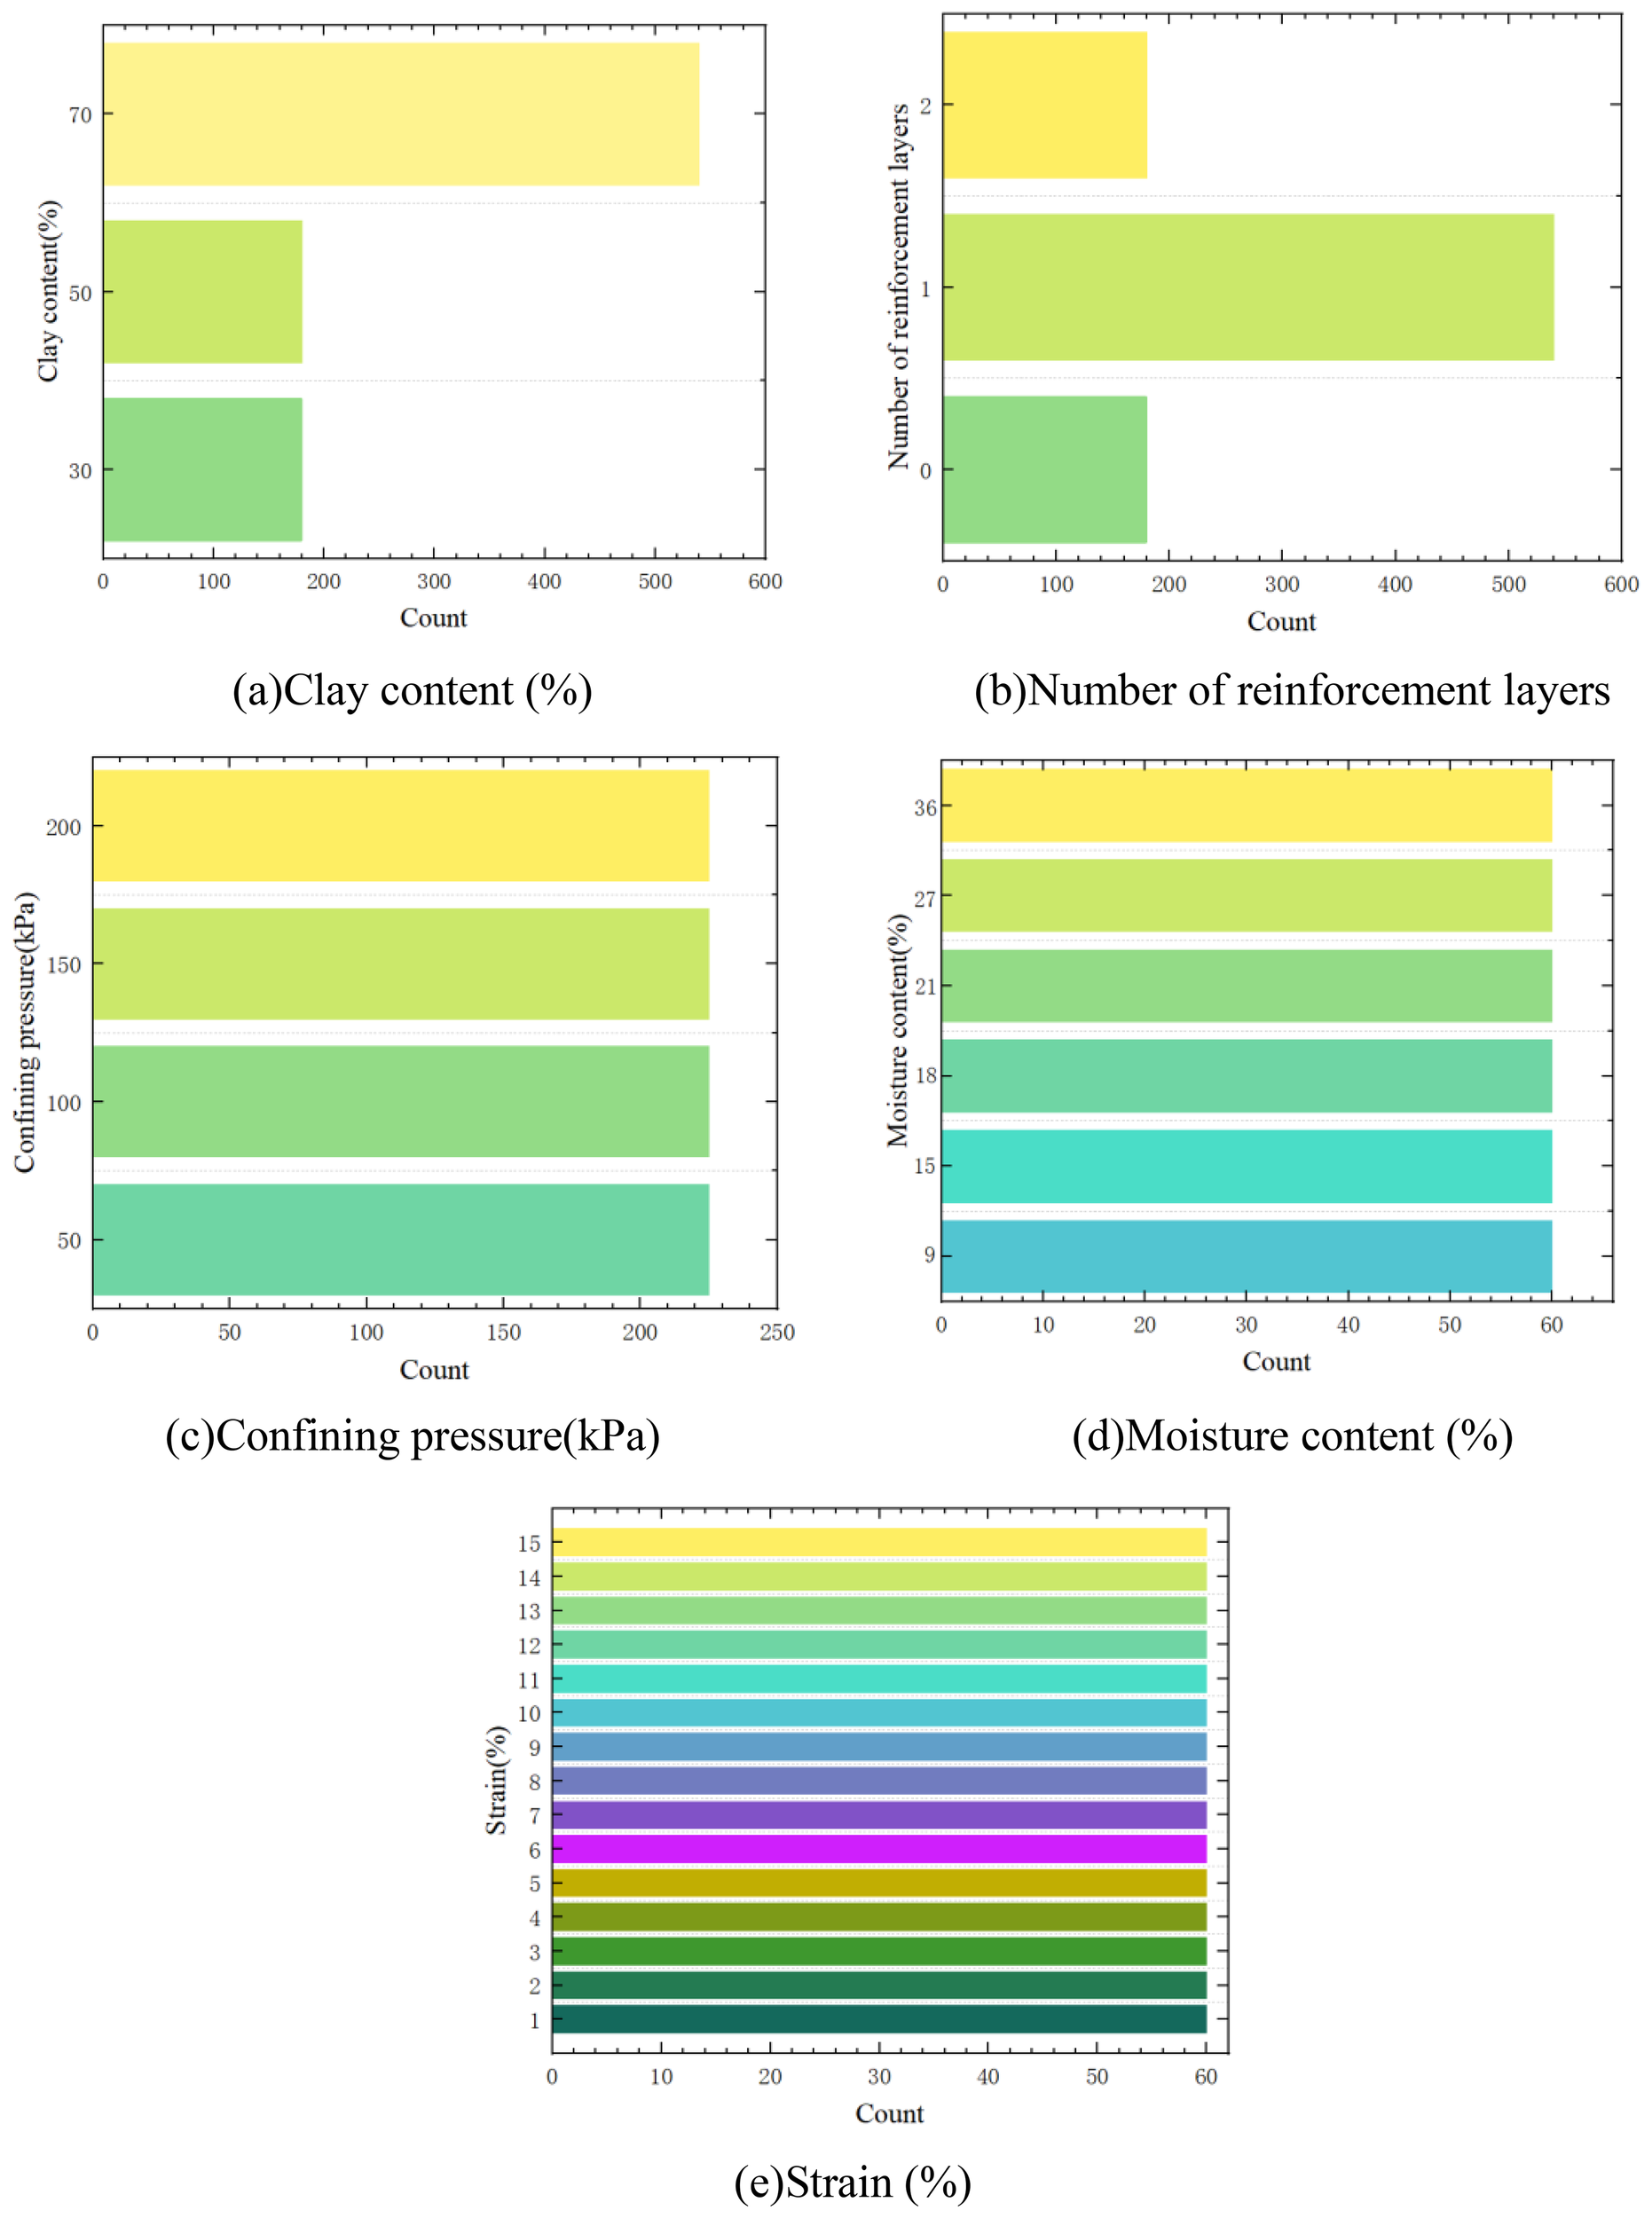
Data distributions for the database (a) Clay content (%) (b) Number of reinforcement layers (c) Confining pressure (kPa) (d) Moisture content (%) (e) Strain (%).
A database consisting of 900 datasets was established, primarily containing four input parameters: clay content, number of reinforcement layers, confining pressure, moisture content, and strain. To evaluate the model’s generalization ability, the dataset was divided into two parts: the training set and the test set. The training set was used to train the model, while the test set was used for the final evaluation of the model’s performance. By reasonably dividing the dataset into 80% for training and 20% for testing, the model’s generalization ability and performance in practical applications were more accurately assessed.
4 Results and analysis
4.1 Analysis of the sample failure patterns
After each test, the pressure chamber was dismantled, and the typical post-test morphologies of specimens with different reinforcement layers were documented, as shown in Figure 8. Overall, the Marine coral sand–Clay Mixture (MCCM) specimens exhibited no clearly defined shear planes but showed noticeable bulging behaviour. The unreinforced specimen experienced the most significant lateral bulging. With one reinforcement layer, bulging was reduced and primarily concentrated above and below the geogrid, where the triaxial geogrid acted like a restraining “belt.” When two reinforcement layers were used, the bulging was further minimized and more uniformly distributed along the specimen’s height, with the geogrids functioning as dual “belts” that enhanced confinement. This behaviour aligns with observations reported by previous researchers (Ding et al., 2022b). These observations suggest that adding more triaxial geogrid reinforcement layers effectively improves lateral stability by reducing bulging in MCCM specimens.
Figure 8
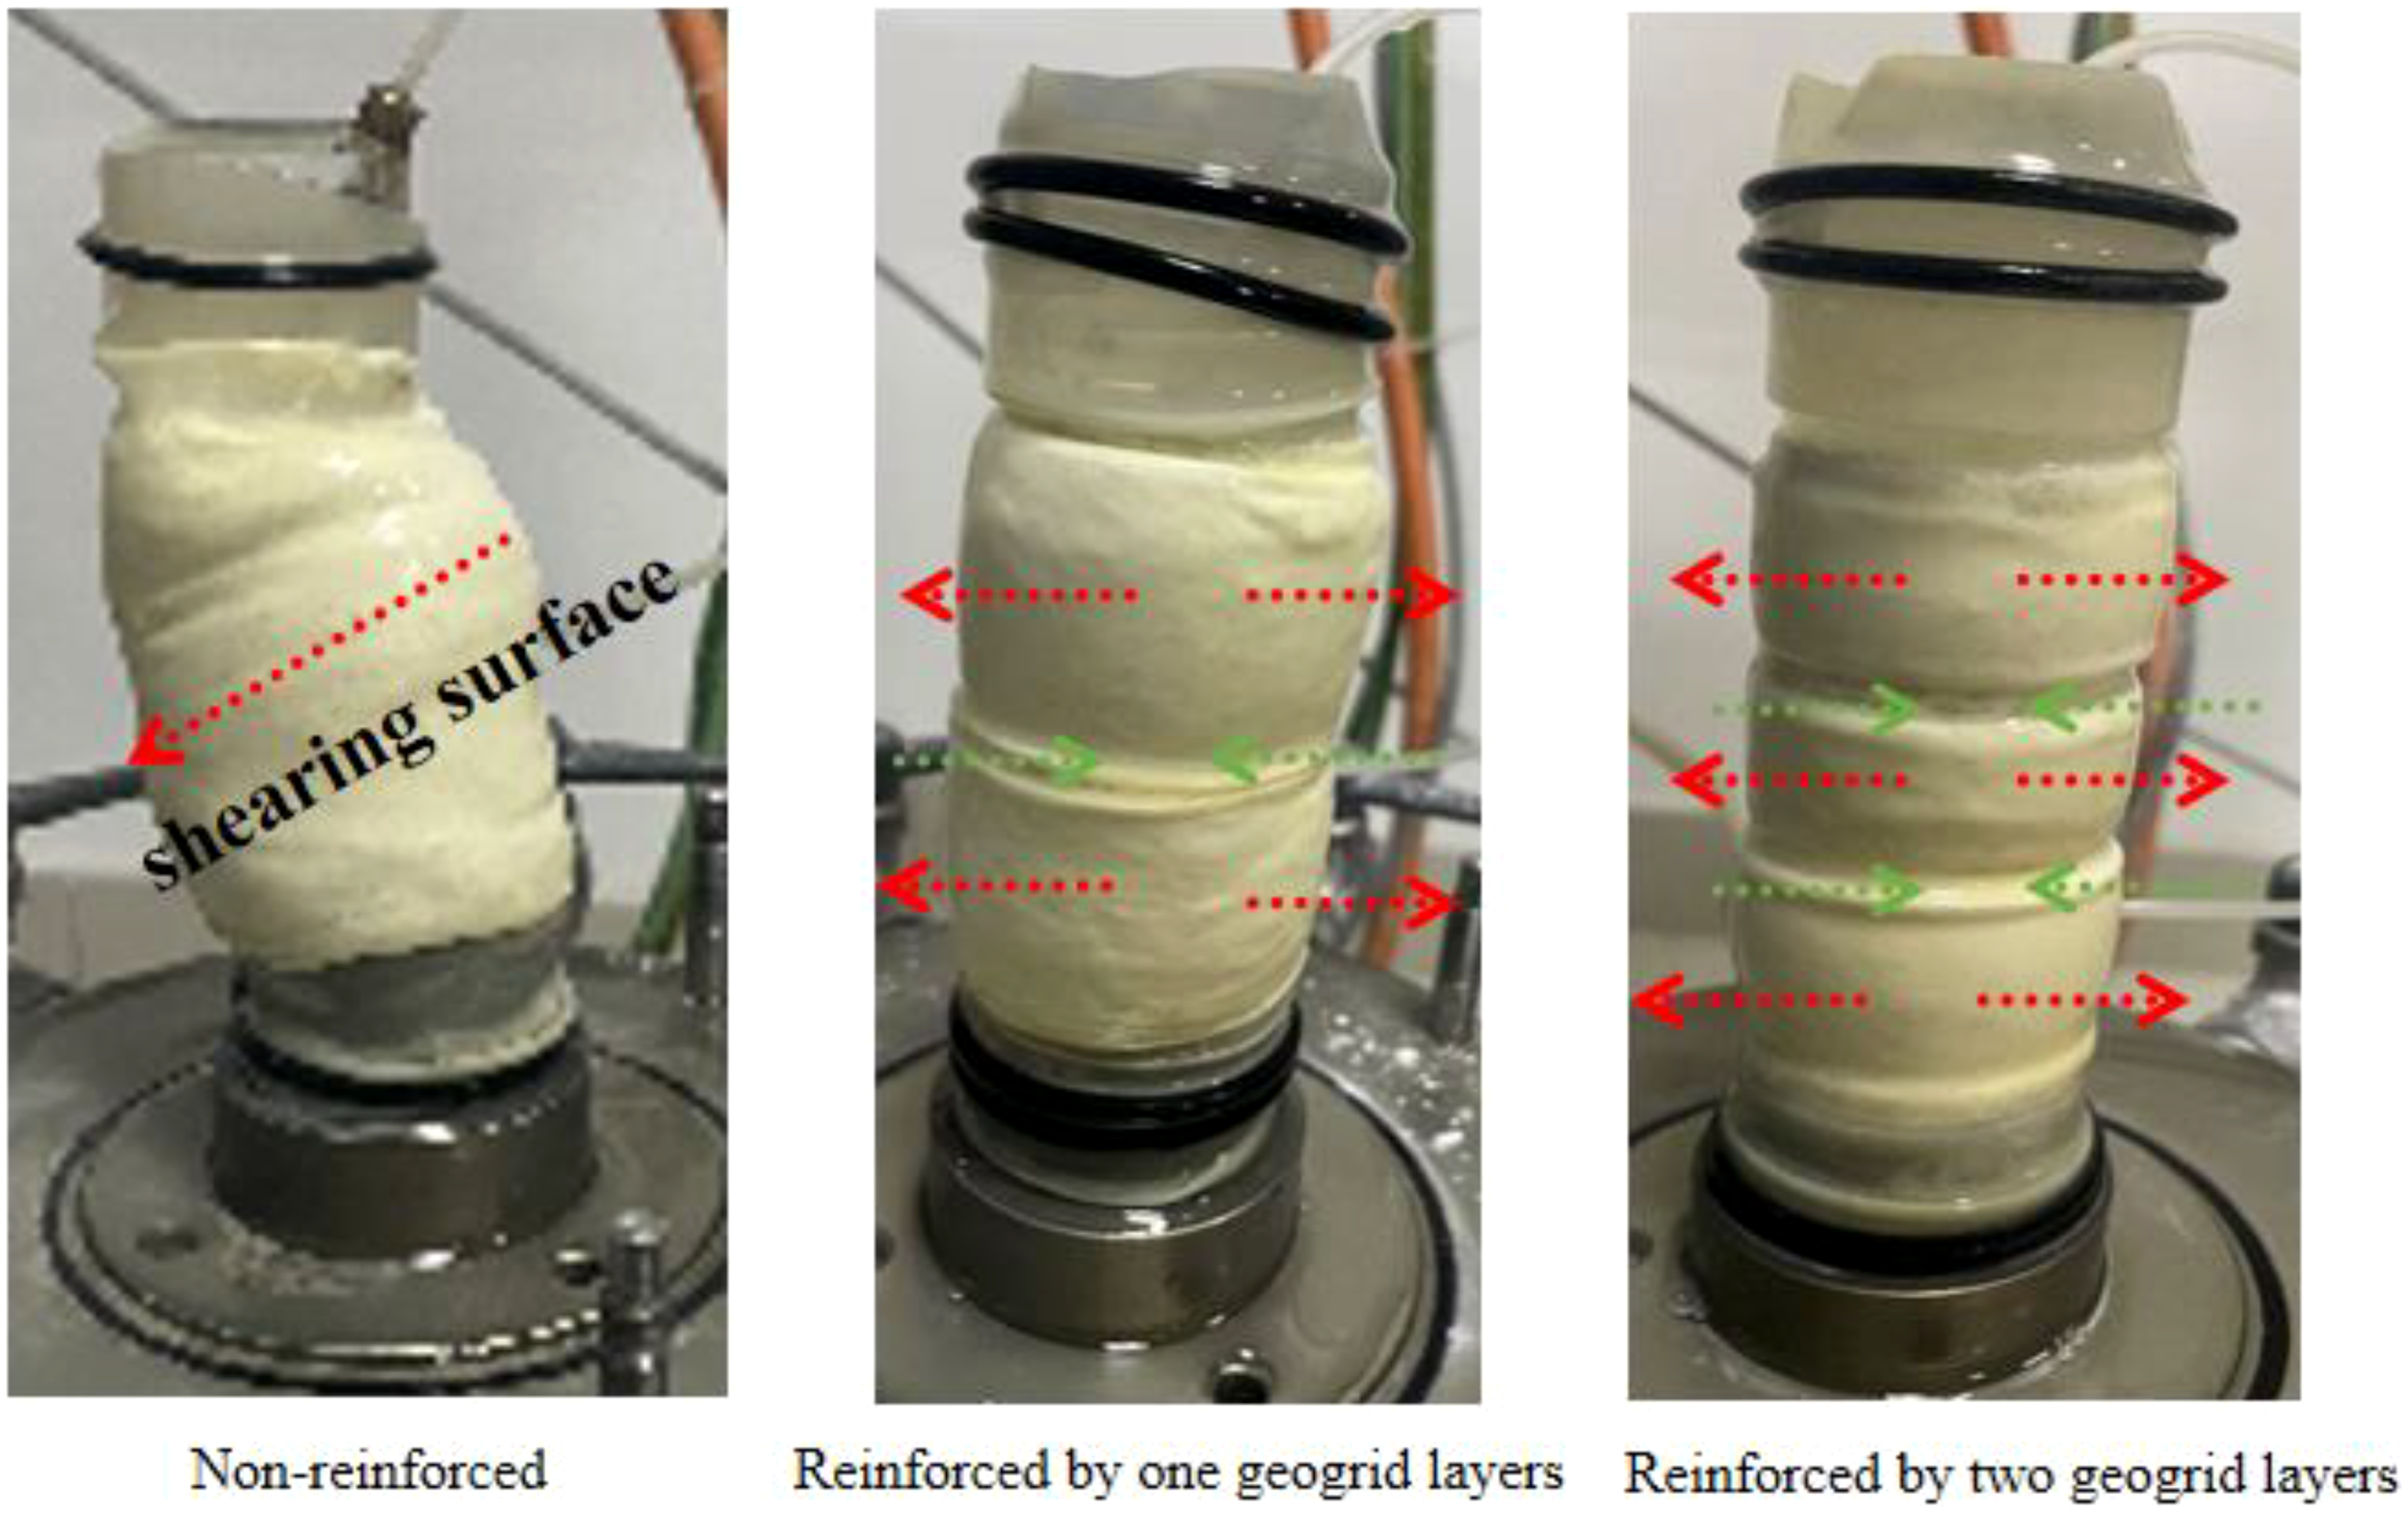
The failure modes of specimens with different numbers of reinforcement layers.
4.2 Deviatoric stress-strain relationship
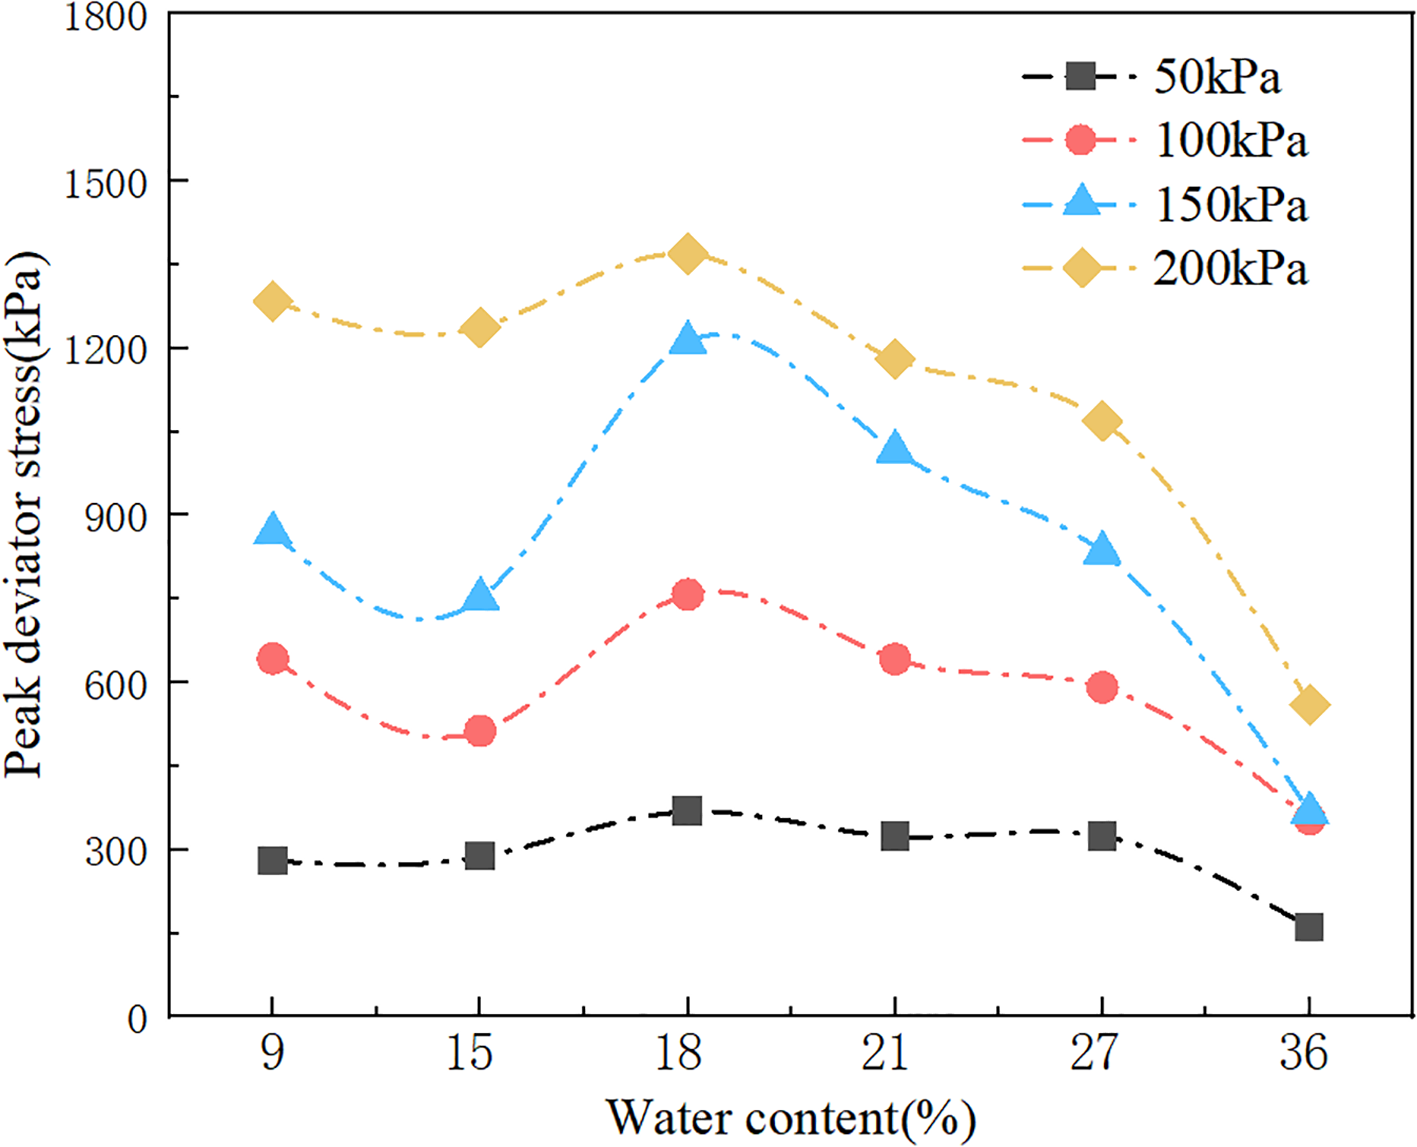
Based on the experimental data, the deviator stress–strain curves for the groups in Table 3 were obtained. Figures 9 display the deviator stress–strain curves of dried MCCM with different clay contents, and it can be observed that, with increasing confining pressure and number of reinforcement layers as well as decreasing clay content, the peak stress increases accordingly and the hardening tendency becomes more pronounced. In particular, for the sample with 30% clay content, under a confining pressure of 200 kPa and with two reinforcement layers, the maximum stress at a strain of 15% reaches as high as 5300.15 kPa. Moreover, Figure 10. clearly shows that the strength of the MCCM exhibits a trend of decreasing, then increasing, and finally decreasing again with increasing moisture content. Some researchers propose that the strength of marine coral sand decreases with increasing moisture content, while others suggest that clay has an optimum moisture content. This study posits that at low moisture contents, the clay absorbs water to form weakly bound water that enhances interparticle cohesion; However, with further increases in moisture content, the swelling of the absorbed clay weakens the cementation between particles, resulting in a gradual loss of cohesion; consequently, the strength of the MCCM is reduced. A detailed discussion on cohesion will be presented in Section 4.3.
Figure 9
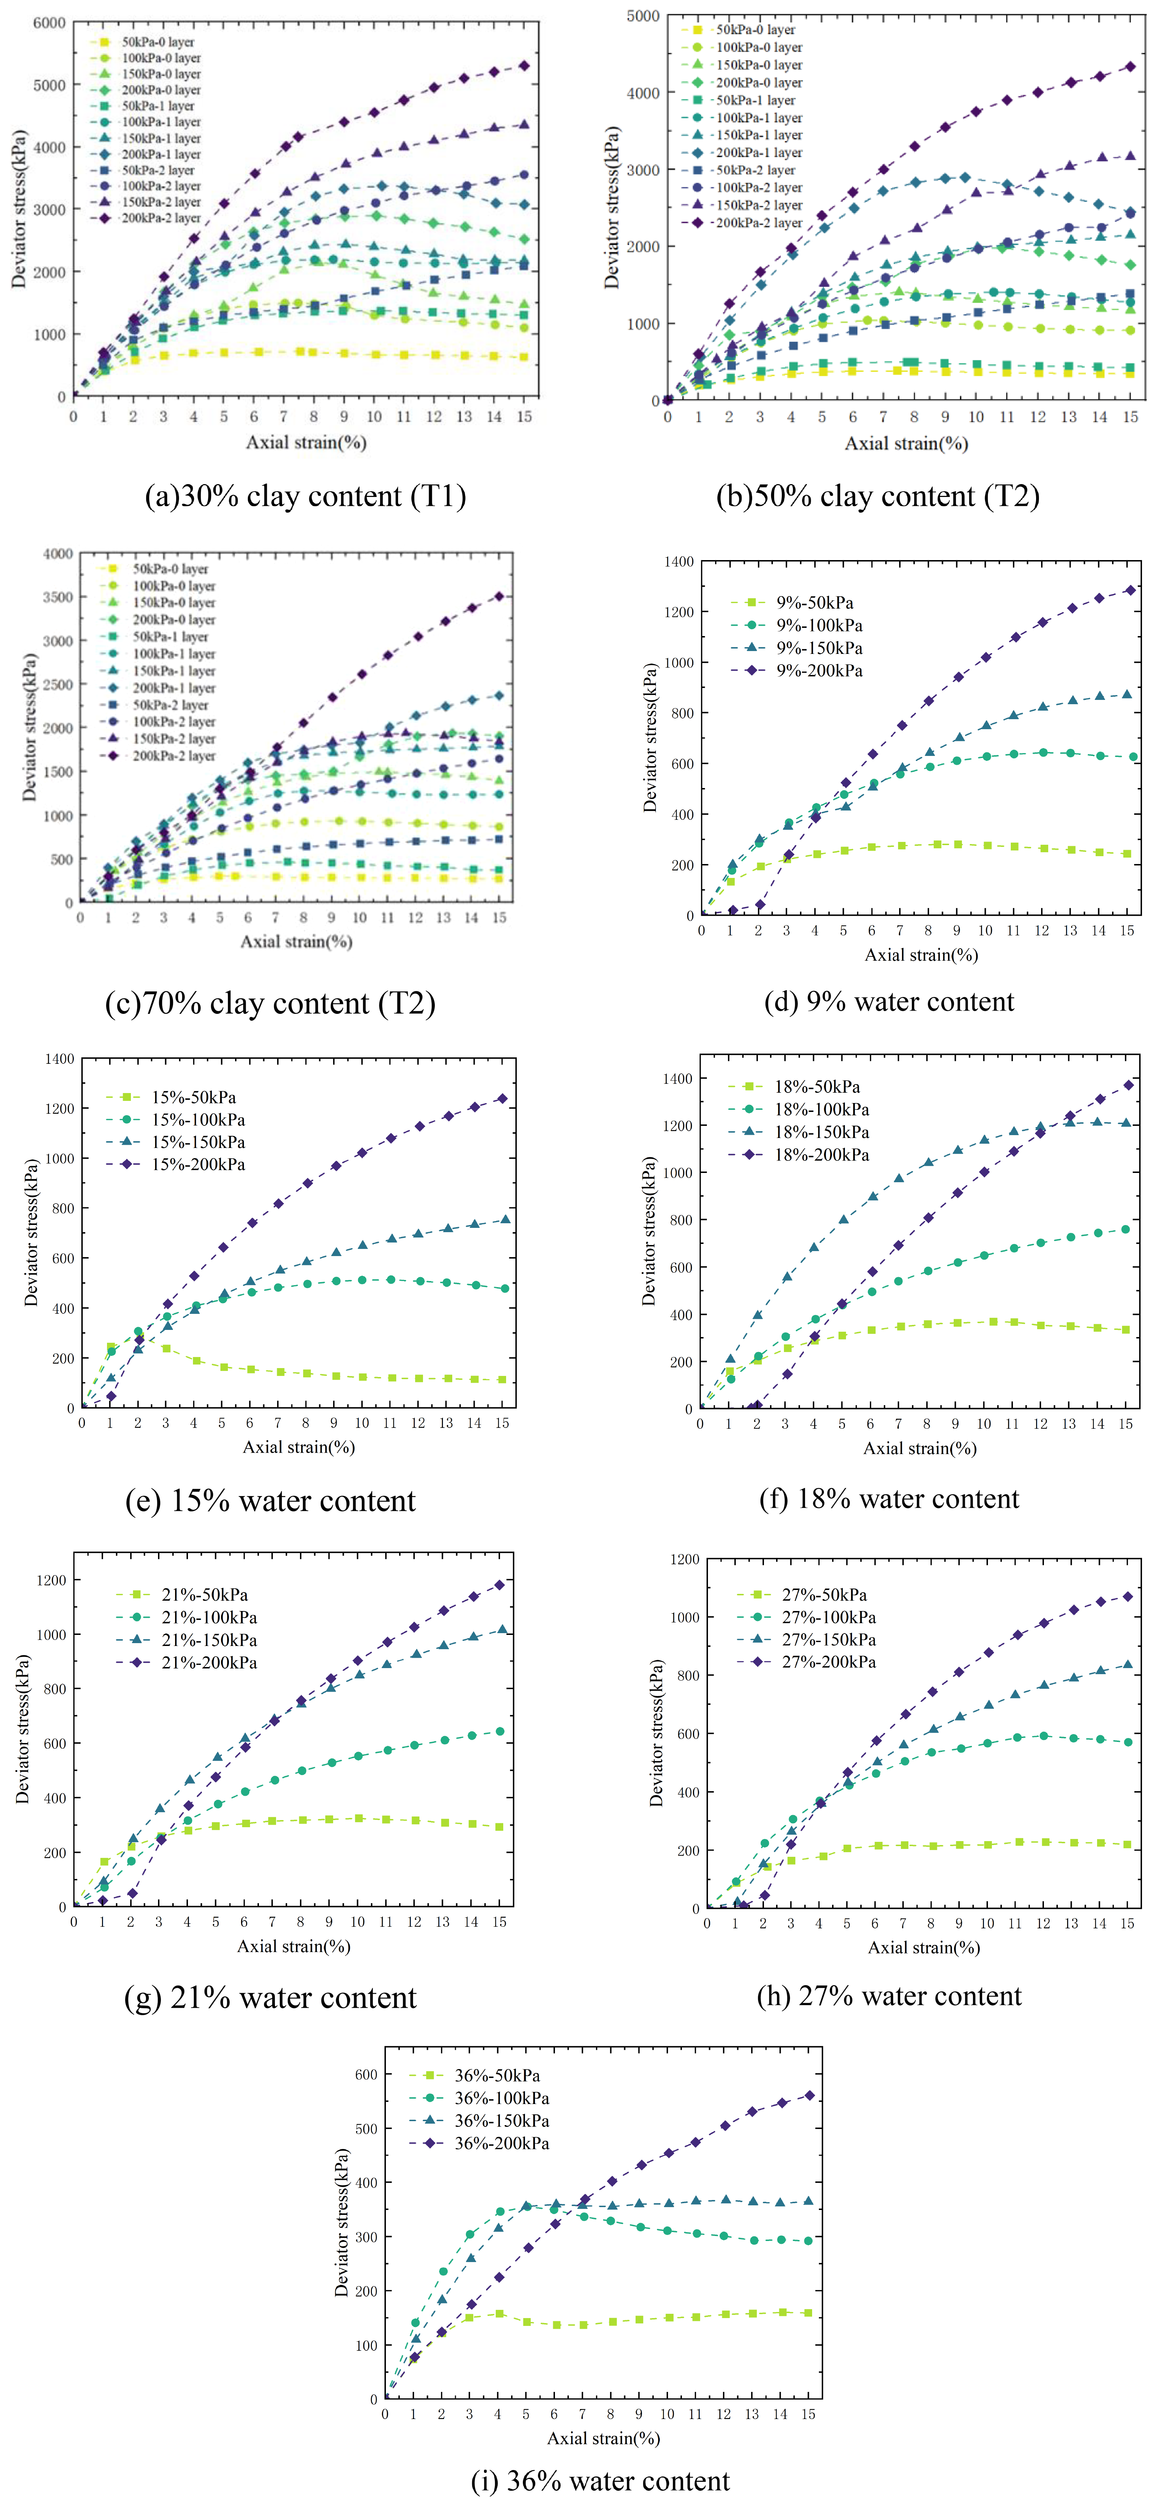
Deviator stress-strain curve (a) 30% clay content (T1) (b) 50% clay content (T2) (c) 70% clay content (T3) (d) 9% water content (T4) (e) 15% water content (T5) (f) 18% water content (T6) (g) 21% water content (T7) (h) 27% water content (T9) (i) 36% water content (T10).
Figure 10
MCCM peak stress: confining pressure and moisture content effects.
4.3 Strength impact analysis
To better investigate the influence of clay content, confining pressure, number of reinforcement layers, and moisture content on the strength behaviour of MCCM, a strength change ratio (Rs) is introduced for quantitative analysis (Luo et al., 2023, 2024). In addition, following the approach adopted by many researchers, the Mohr–Coulomb failure criterion is employed to calculate the cohesion c and internal friction angle φ of MCCM (Jie et al., 2015).
The strength enhancement ratios Rs under different reinforcement layer configurations are illustrated in Figure 11. The maximum improvement, an increase of 264.53%, was observed with two layers of reinforcement at a clay content of 50%. This indicates that the inclusion of triaxial geogrids can significantly enhance the strength of MCCM. As the number of reinforcement layers increases, the strength enhancement ratio also increases. However, with increasing confining pressure, the overall enhancement effect tends to diminish. These results suggest that triaxial geogrid reinforcement is particularly effective in shallow reinforcement applications.
Figure 11
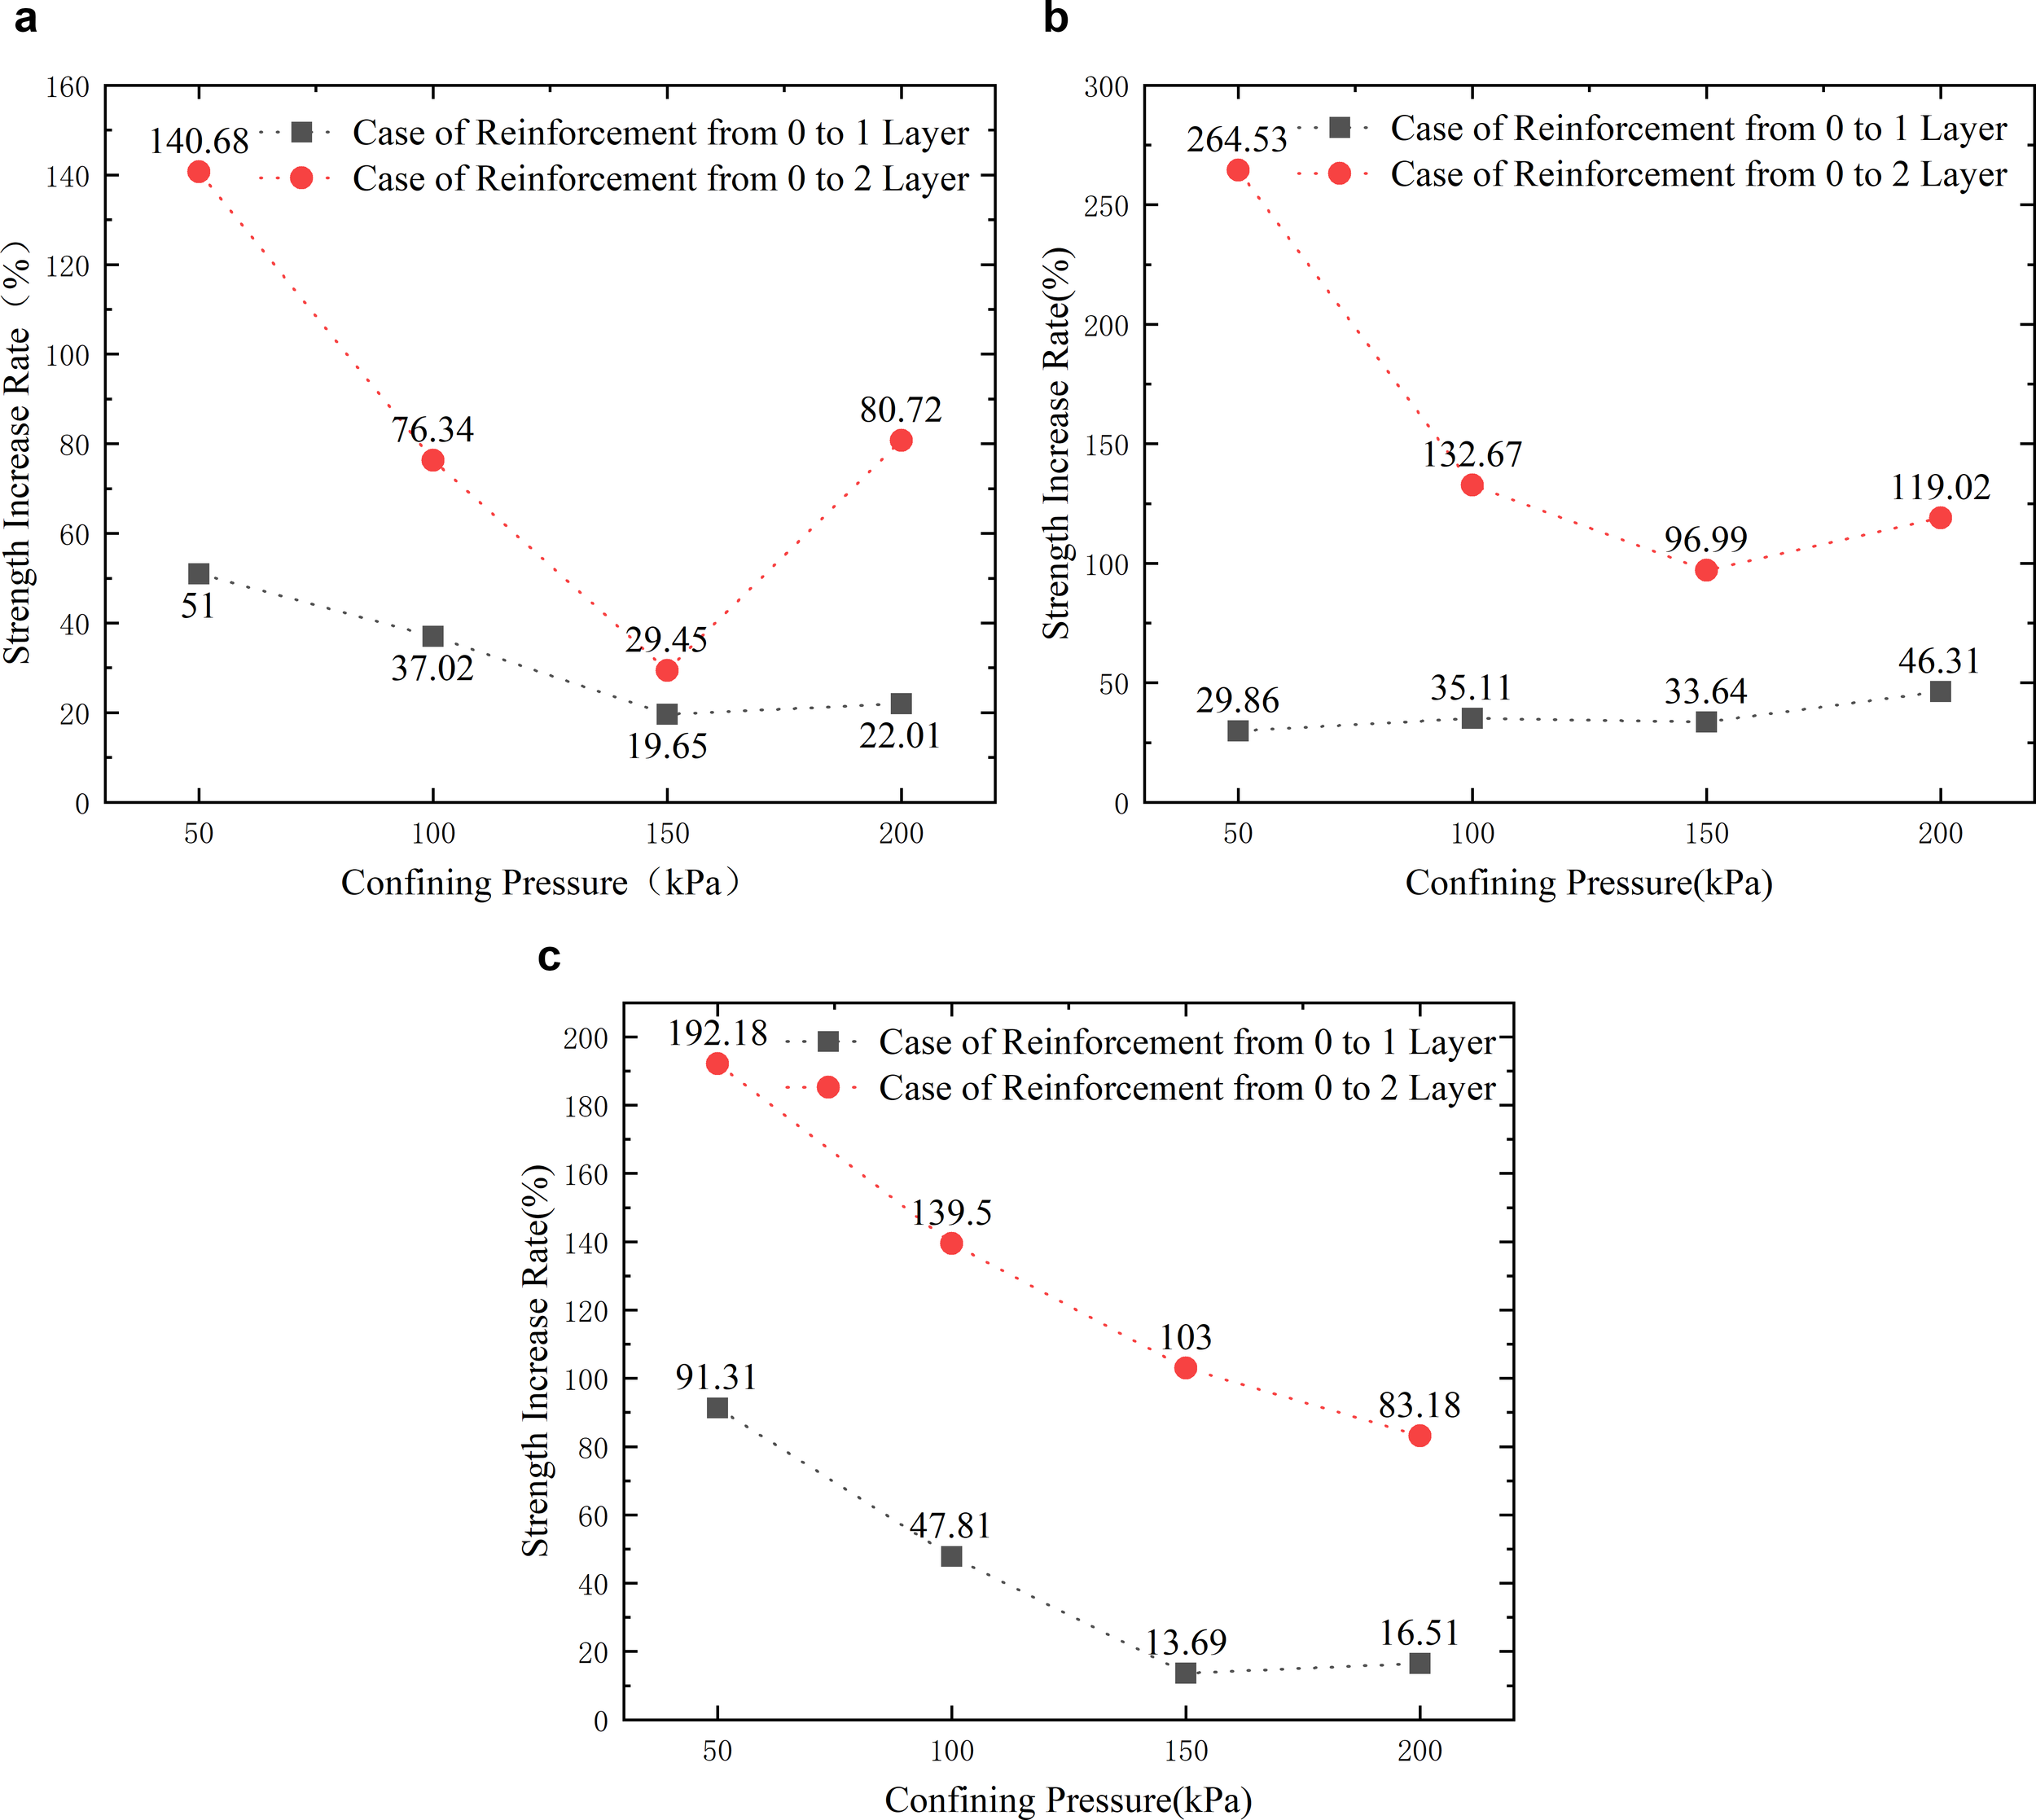
Strength enhancement ratio (a) 70% clay content; (b) 50% clay content; (c) 30% clay content.
As shown in Figure 12, the strength of the MCCM exhibits a negative correlation with clay content; higher clay contents correspond to lower shear strength. In particular, Figure 11A shows that the strength reduction is most pronounced at clay contents of 30% and 50%, with a maximum decrease of 63.94%. This can be attributed to the inherently low strength of clay, and potentially to the fact that, with increasing clay content, the clay tends to encapsulate the marine coral sand particles, disrupting the sand skeleton structure. This transition shifts the mechanical behavior of the mixture from a sand-dominated frictional strength to a clay-dominated weak plastic response, which results in a marked reduction in shear strength.
Figure 12
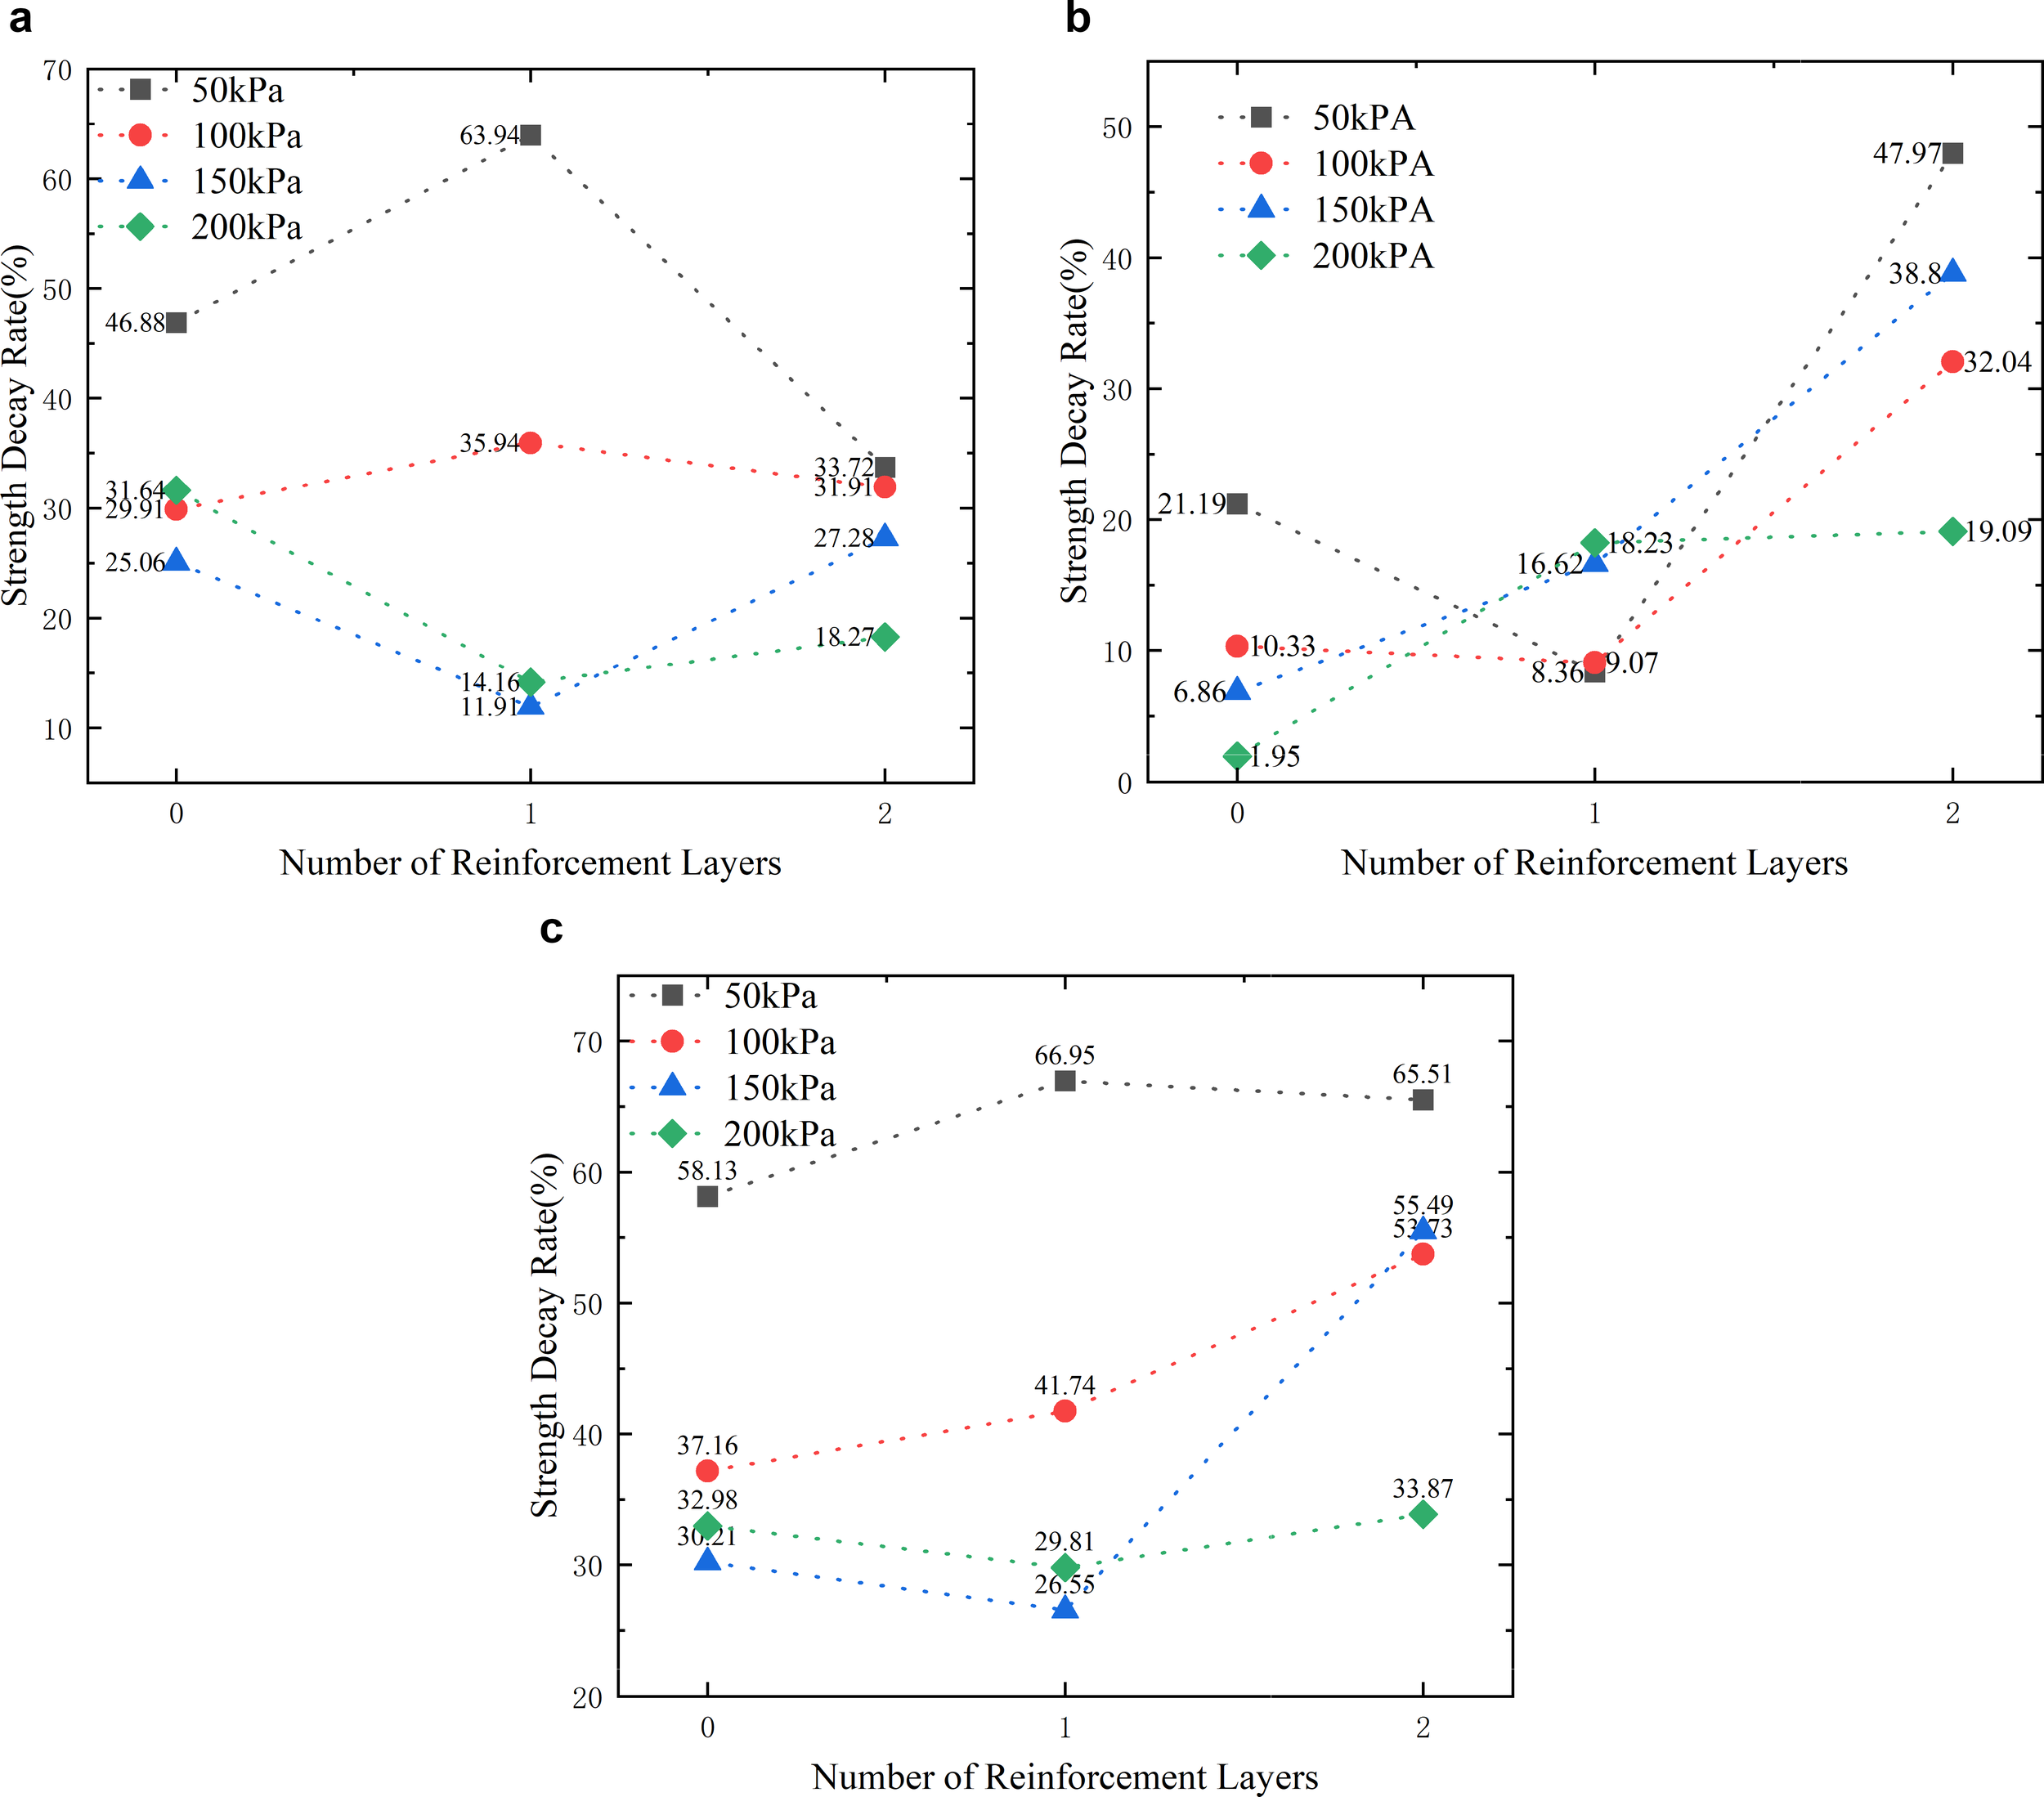
Strength decay ratio (a) 30%-50% clay content; (b) 50%-70% clay content; (c) 30%-70% clay content.(a) Strength decay rate at 30%-50% clay content (b) Strength decay rate at 50%-70% clay content (c) Strength decay rate at 30%-70% clay content.
Furthermore, a significant strength degradation is observed under low confining pressures. This is likely due to the inability of low external pressure to maintain inter-particle contact. Under high confining pressures, the marine coral sand particles are forced into close contact, enhancing interlocking and frictional resistance. Even when coated by clay, the applied pressure helps to preserve a certain degree of skeleton integrity. In contrast, at low confining pressures, insufficient constraint allows relative movement or rotation of clay-coated sand particles, leading to rapid degradation of the structural framework. Consequently, the strength of the MCCM becomes increasingly dependent on the weak cohesive properties of the clay matrix, which are substantially lower than the frictional strength of sand. This pronounced strength reduction will be further discussed in detail in Section 5.1.
The variation in MCCM strength with changing moisture content is presented in Figure 13. Unlike pure marine coral sand, the strength of MCCM does not exhibit a continuous decline with increasing moisture content. Notably, a strength recovery is observed at a moisture content of 18%. A strength-based analysis alone cannot fully account for the observed trend in MCCM strength as moisture content increases. To elucidate this behavior, a further analysis of the cohesion and internal friction angle is carried out in the following discussion.
Figure 13
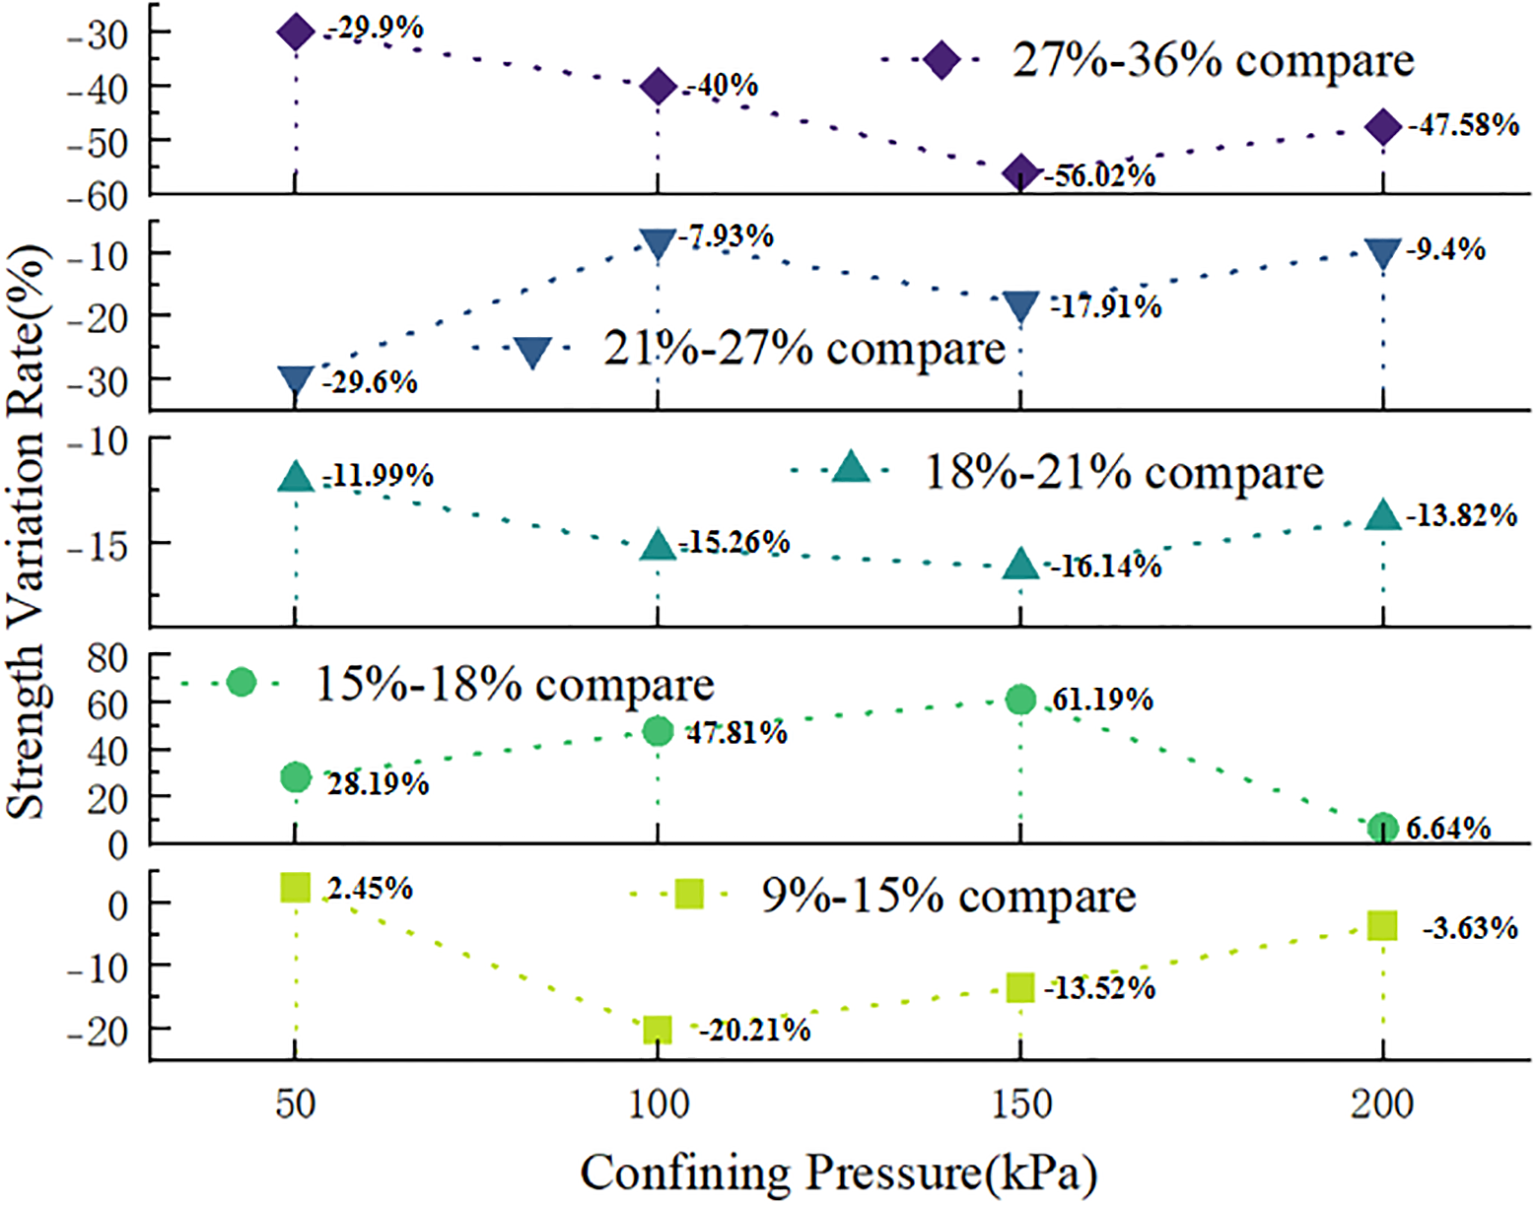
The strength with moisture content under different confining pressures.
Calculations of cohesion c and internal friction angle φ indicate that both parameters in MCCM are significantly higher than those in pure marine coral sand, as shown in Figure 14. This can be attributed to the high cementation characteristics of clay, which enhance inter-particle bonding within the MCCM and consequently increase cohesion. In addition, clay fills the voids between marine coral sand particles, which leads to higher compactness and stronger mechanical interlocking, contributing to an increase in the internal friction angle. This phenomenon will be further investigated in Section 5.1 through SEM imaging, which reveals that clay tends to coat marine coral sand particles, forming more complex shear planes and increasing shear resistance, thereby resulting in a higher internal friction angle.
Figure 14
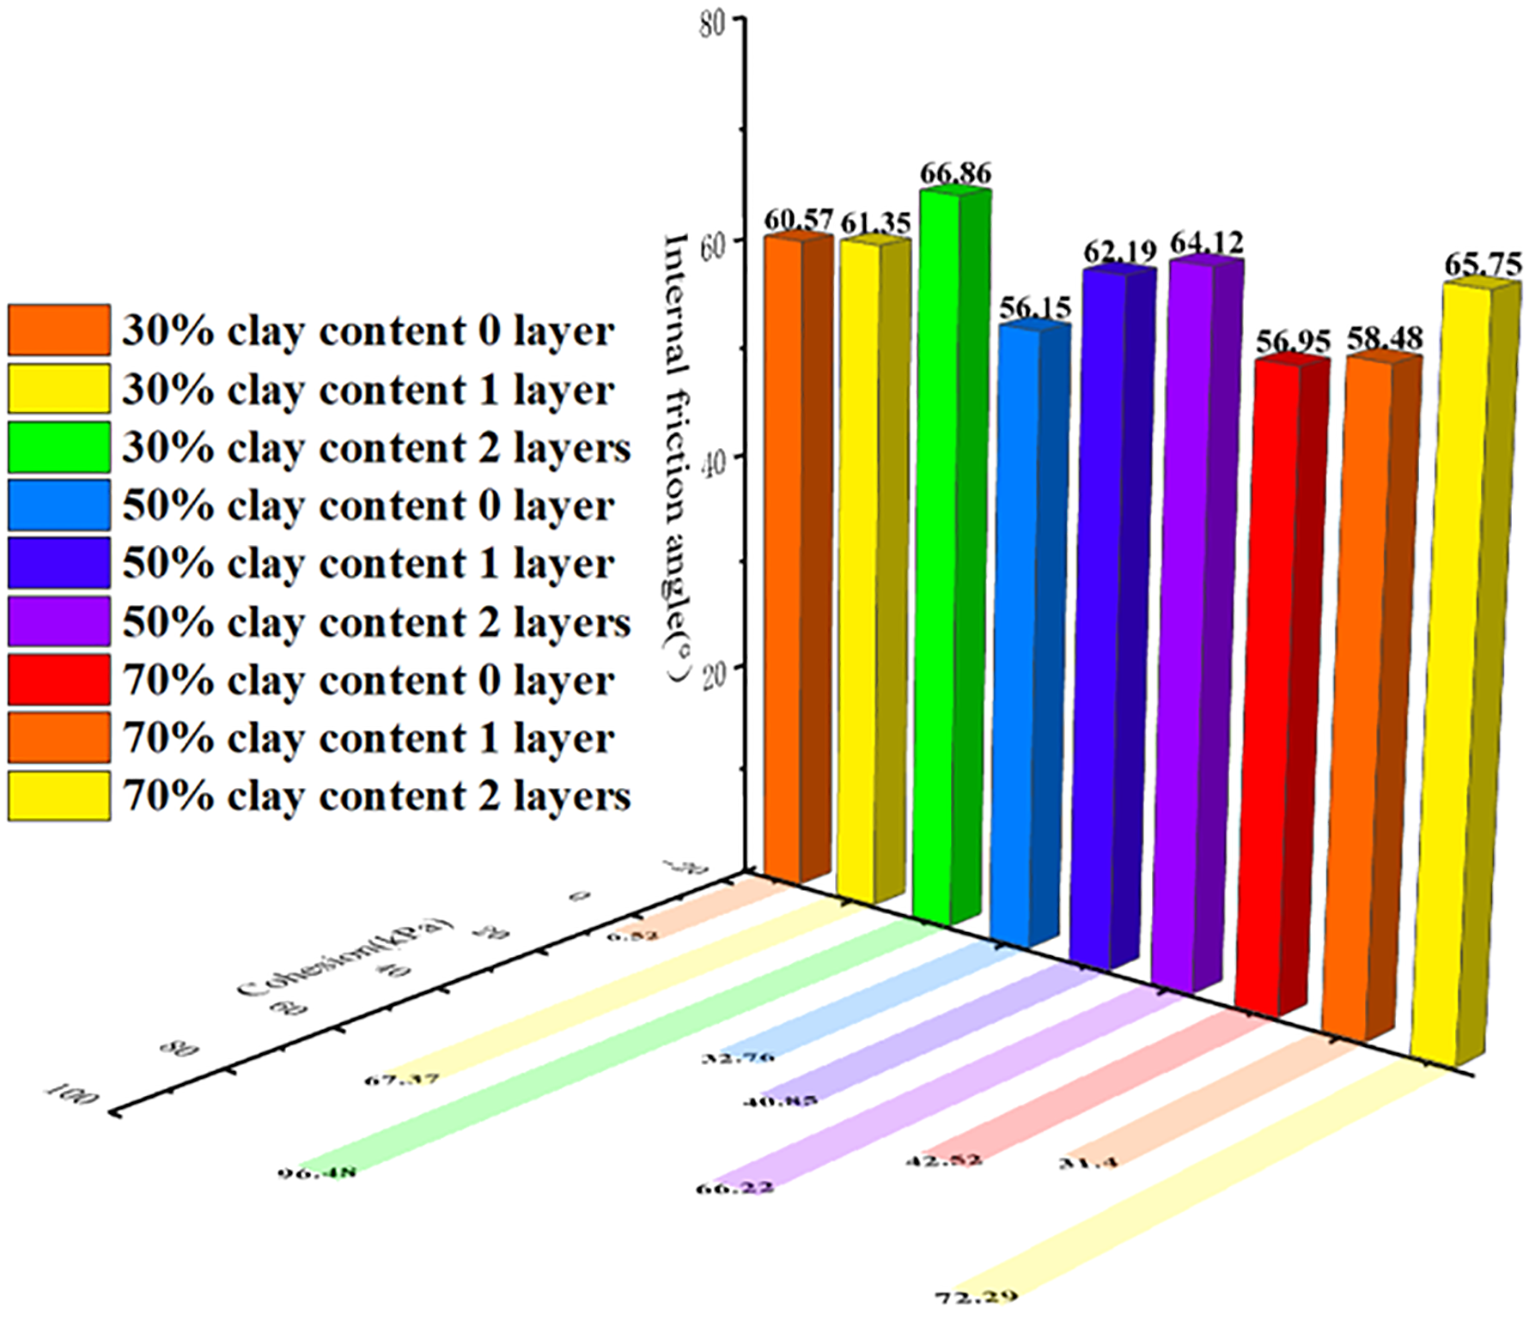
Cohesion c and internal friction angle φ in the dry state.
The strength variation pattern of MCCM with moisture content, as discussed in Section 3.2, can be explained by Figure 15. The cohesion decreases initially with increasing moisture content, then increases, and finally decreases again. Notably, at a moisture content of 18%, the cohesion is nearly equivalent to that under dry conditions. The variation trend of the internal friction angle is also similar to that of cohesion. These results highlight that moisture content is a critical factor influencing the strength of MCCM. In practical engineering applications, it is recommended to control the moisture content between 15%-21% to ensure the strength and stability of marine engineering constructions where MCCM is used as the primary material.
Figure 15

Changes in cohesion c and internal friction angle φ at varying moisture contents. (a) Cohesion c variation trend (b) Internal friction angle φ variation trend.
4.4 Particle breakage analysis
Based on sieve tests conducted on the particles before and after tests T1–T9, Figures 16a-c demonstrate that, under dry conditions, a greater number of reinforcement layers and higher confining pressure lead to an increased degree of particle breakage. In contrast, Figure 16d shows that moisture content has no significant effect on particle breakage. A magnified view of the local curves reveals that the particle breakage zone is concentrated between 0.6 and 1 mm. This study suggests that the particle gradation curves are essentially coincident, indicating that the underlying mechanisms cannot be discerned clearly from these curves alone.
Figure 16
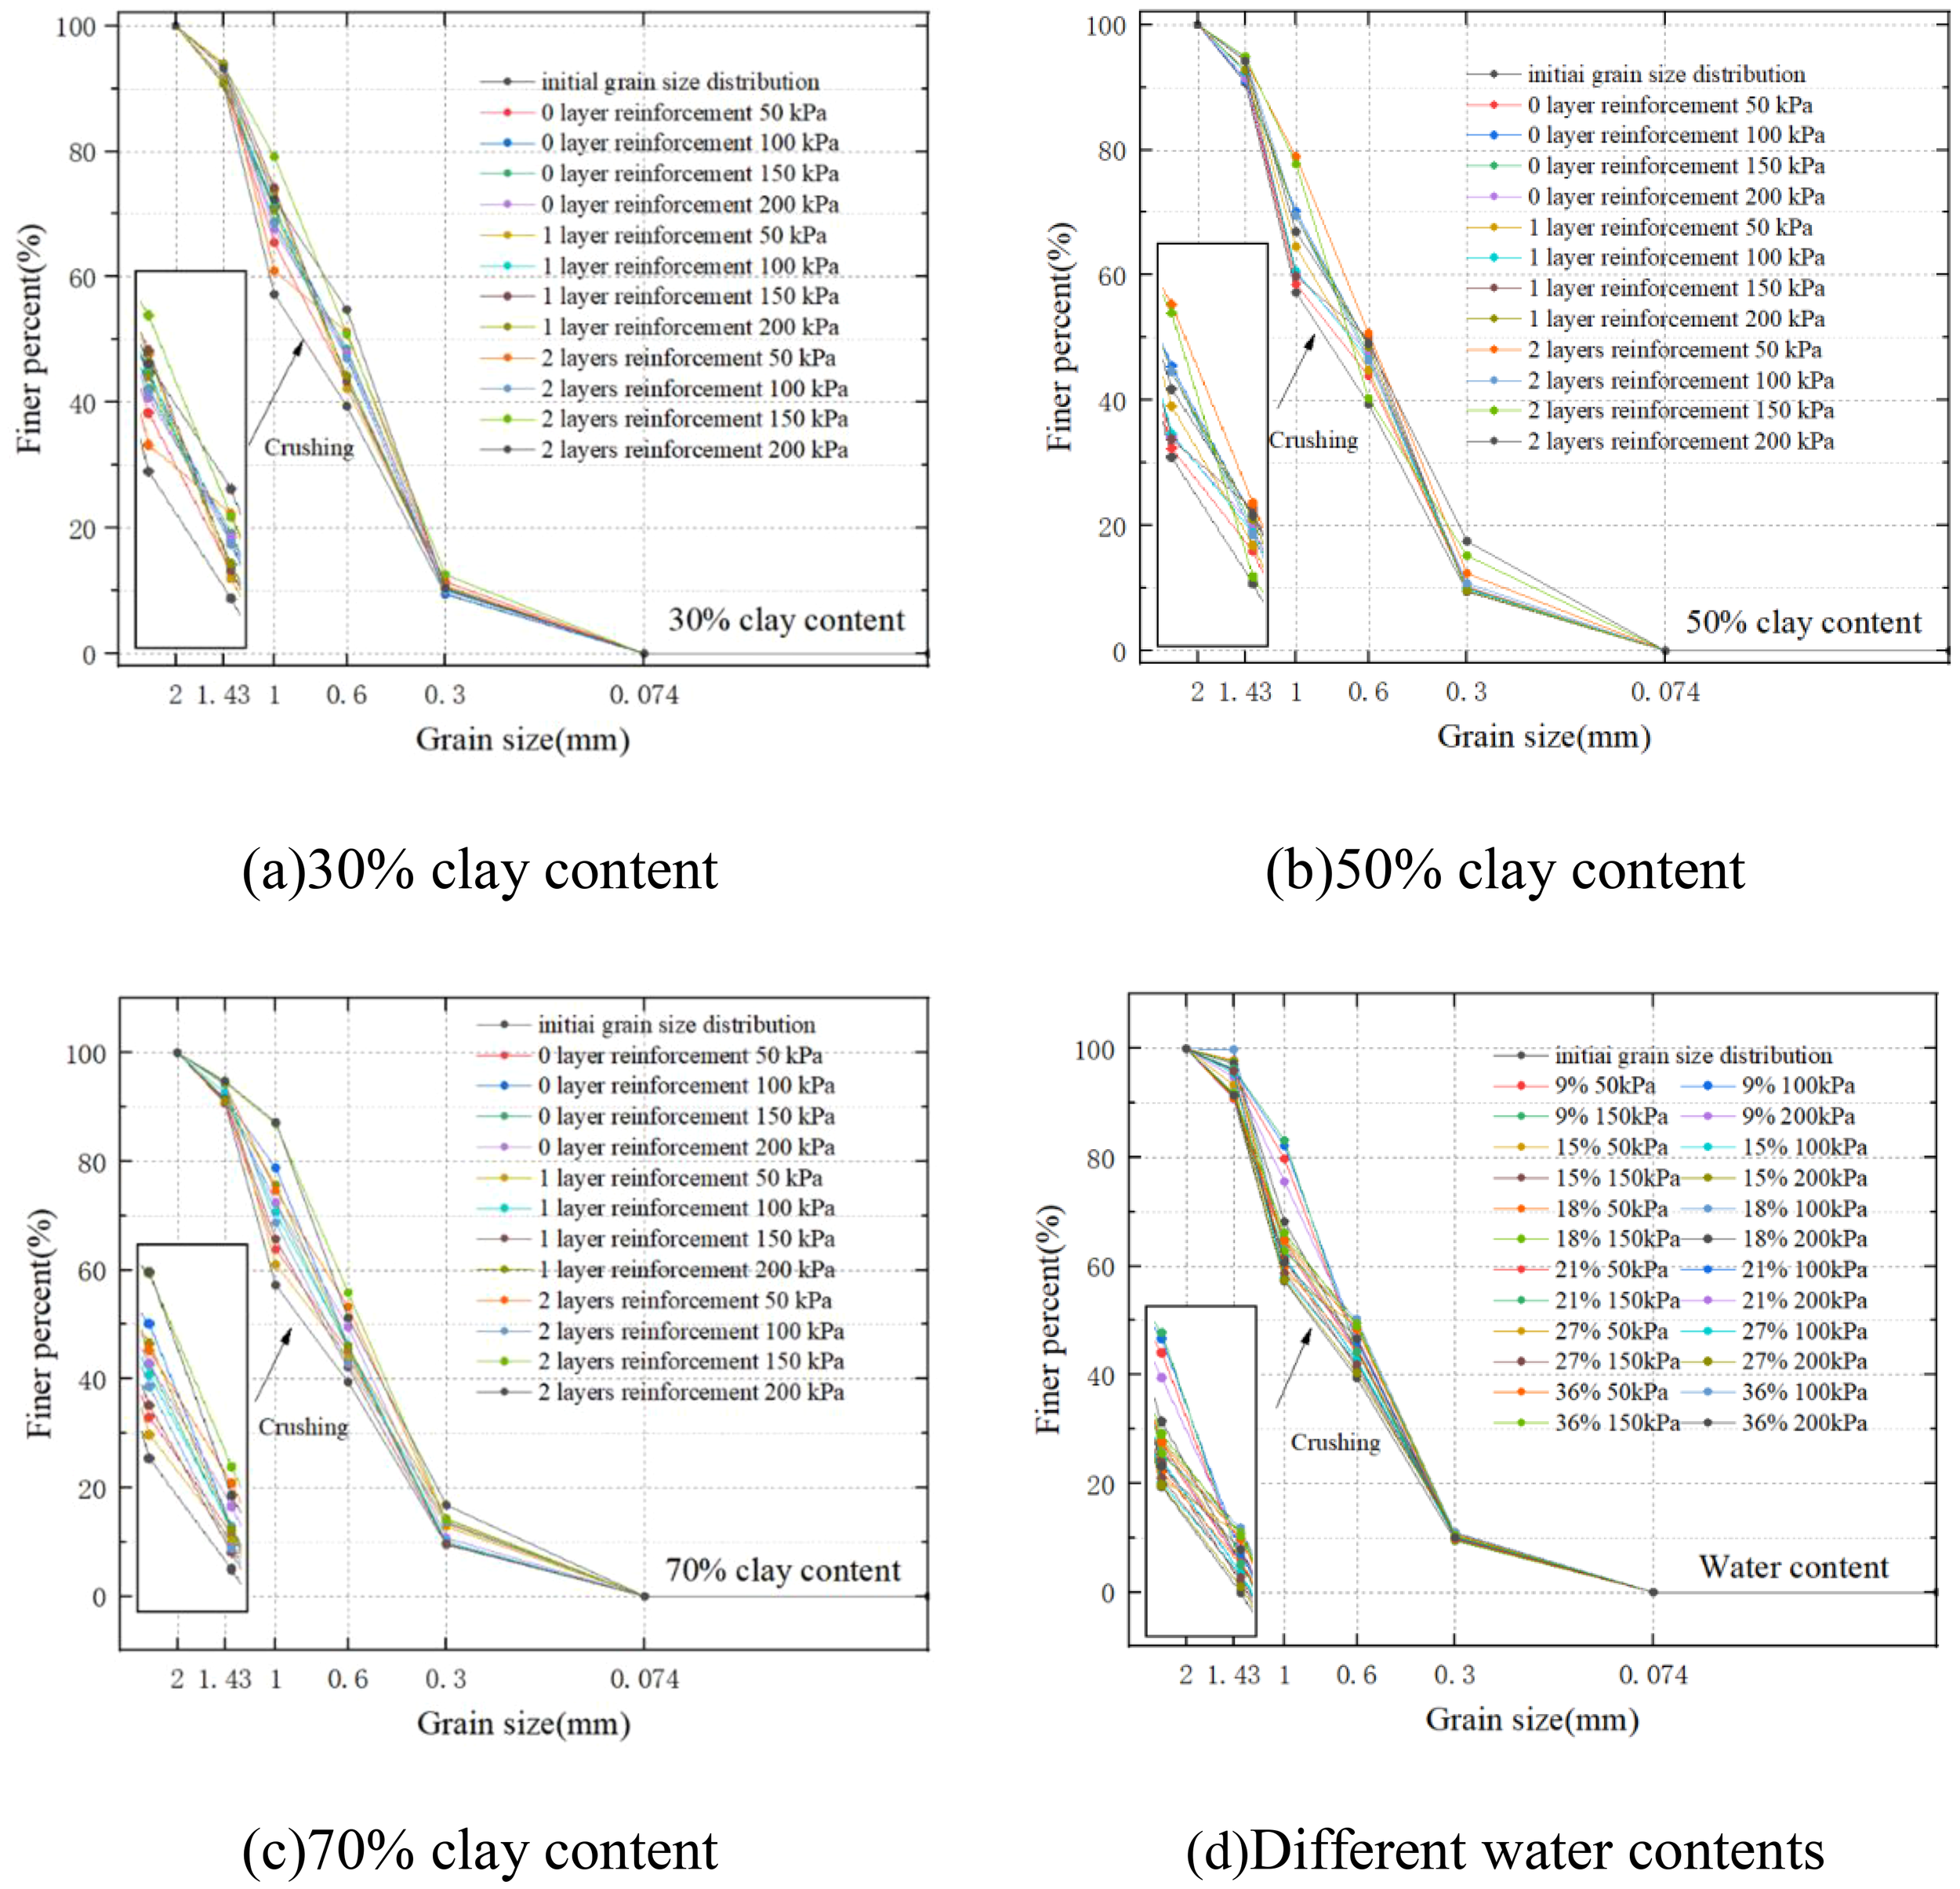
Particle grading curves before and after the experiment (a) 30% clay content (b) 50% clay content (c) 70% clay content (d) Different water contents.
For a quantitative evaluation of the extent of particle fragmentation, Hardin (1985) introduced the concept of the relative breakage rate, Br, as depicted in Figure 17. This method has since been widely used to evaluate the amount of breakage in marine coral sand (Chen et al., 2023; Ding et al., 2022a). The calculation formula as shown in Equation 1:
Figure 17
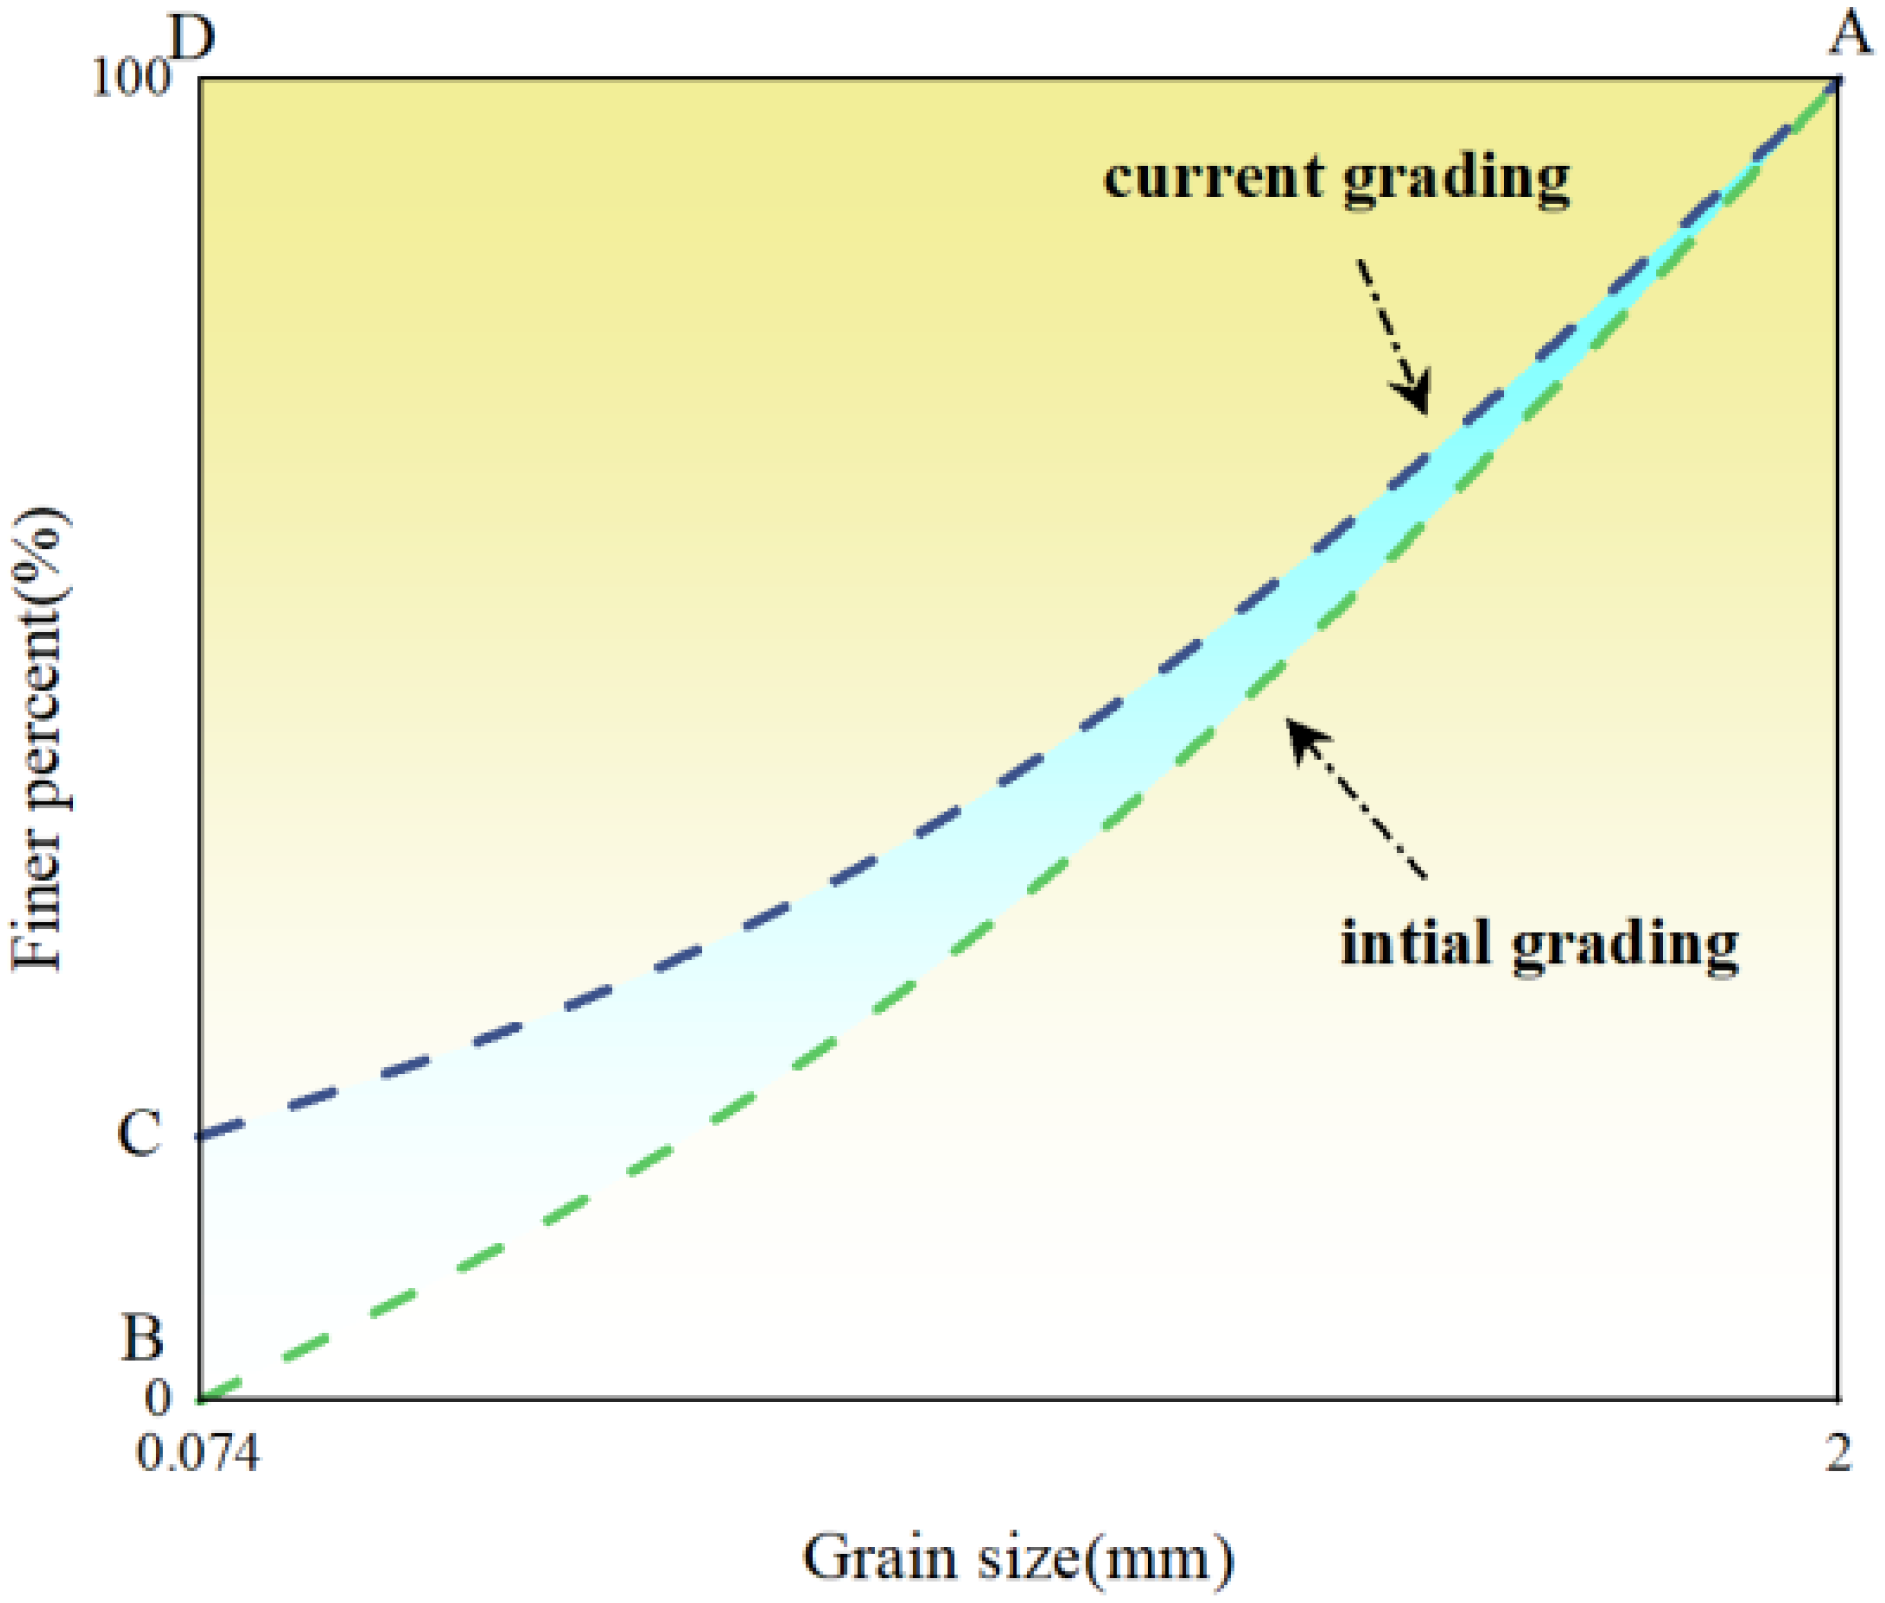
Relative breakage rate Br diagram.
Here, Br indicates the cumulative breakage and Bp represents the potential for breakage. This approach determines Br by integrating the corresponding areas under the particle size distribution curves before and after testing.
The calculations shown in Figure 18 indicate that an increase in the number of reinforcement layers has a significant impact on particle breakage. As the number of reinforcement layers increases, the relative breakage rate of MCCM clearly rises, reaching a maximum of 20.7195% for the case with two layers of reinforcement at a clay content of 70%. Analysis reveals that clay content is positively correlated with the relative breakage rate. This phenomenon is attributed to the fact that marine coral sand particles are encapsulated and isolated by clay; when load is transmitted through the clay, local stress concentrations occur at the contact points between sand particles, thereby enhancing particle breakage. Additionally, the trend of the relative breakage rate with moisture content is analogous to the variation in MCCM strength with moisture content, with the highest relative breakage rate of 18.18725% occurring at a moisture content of 18%.
Figure 18
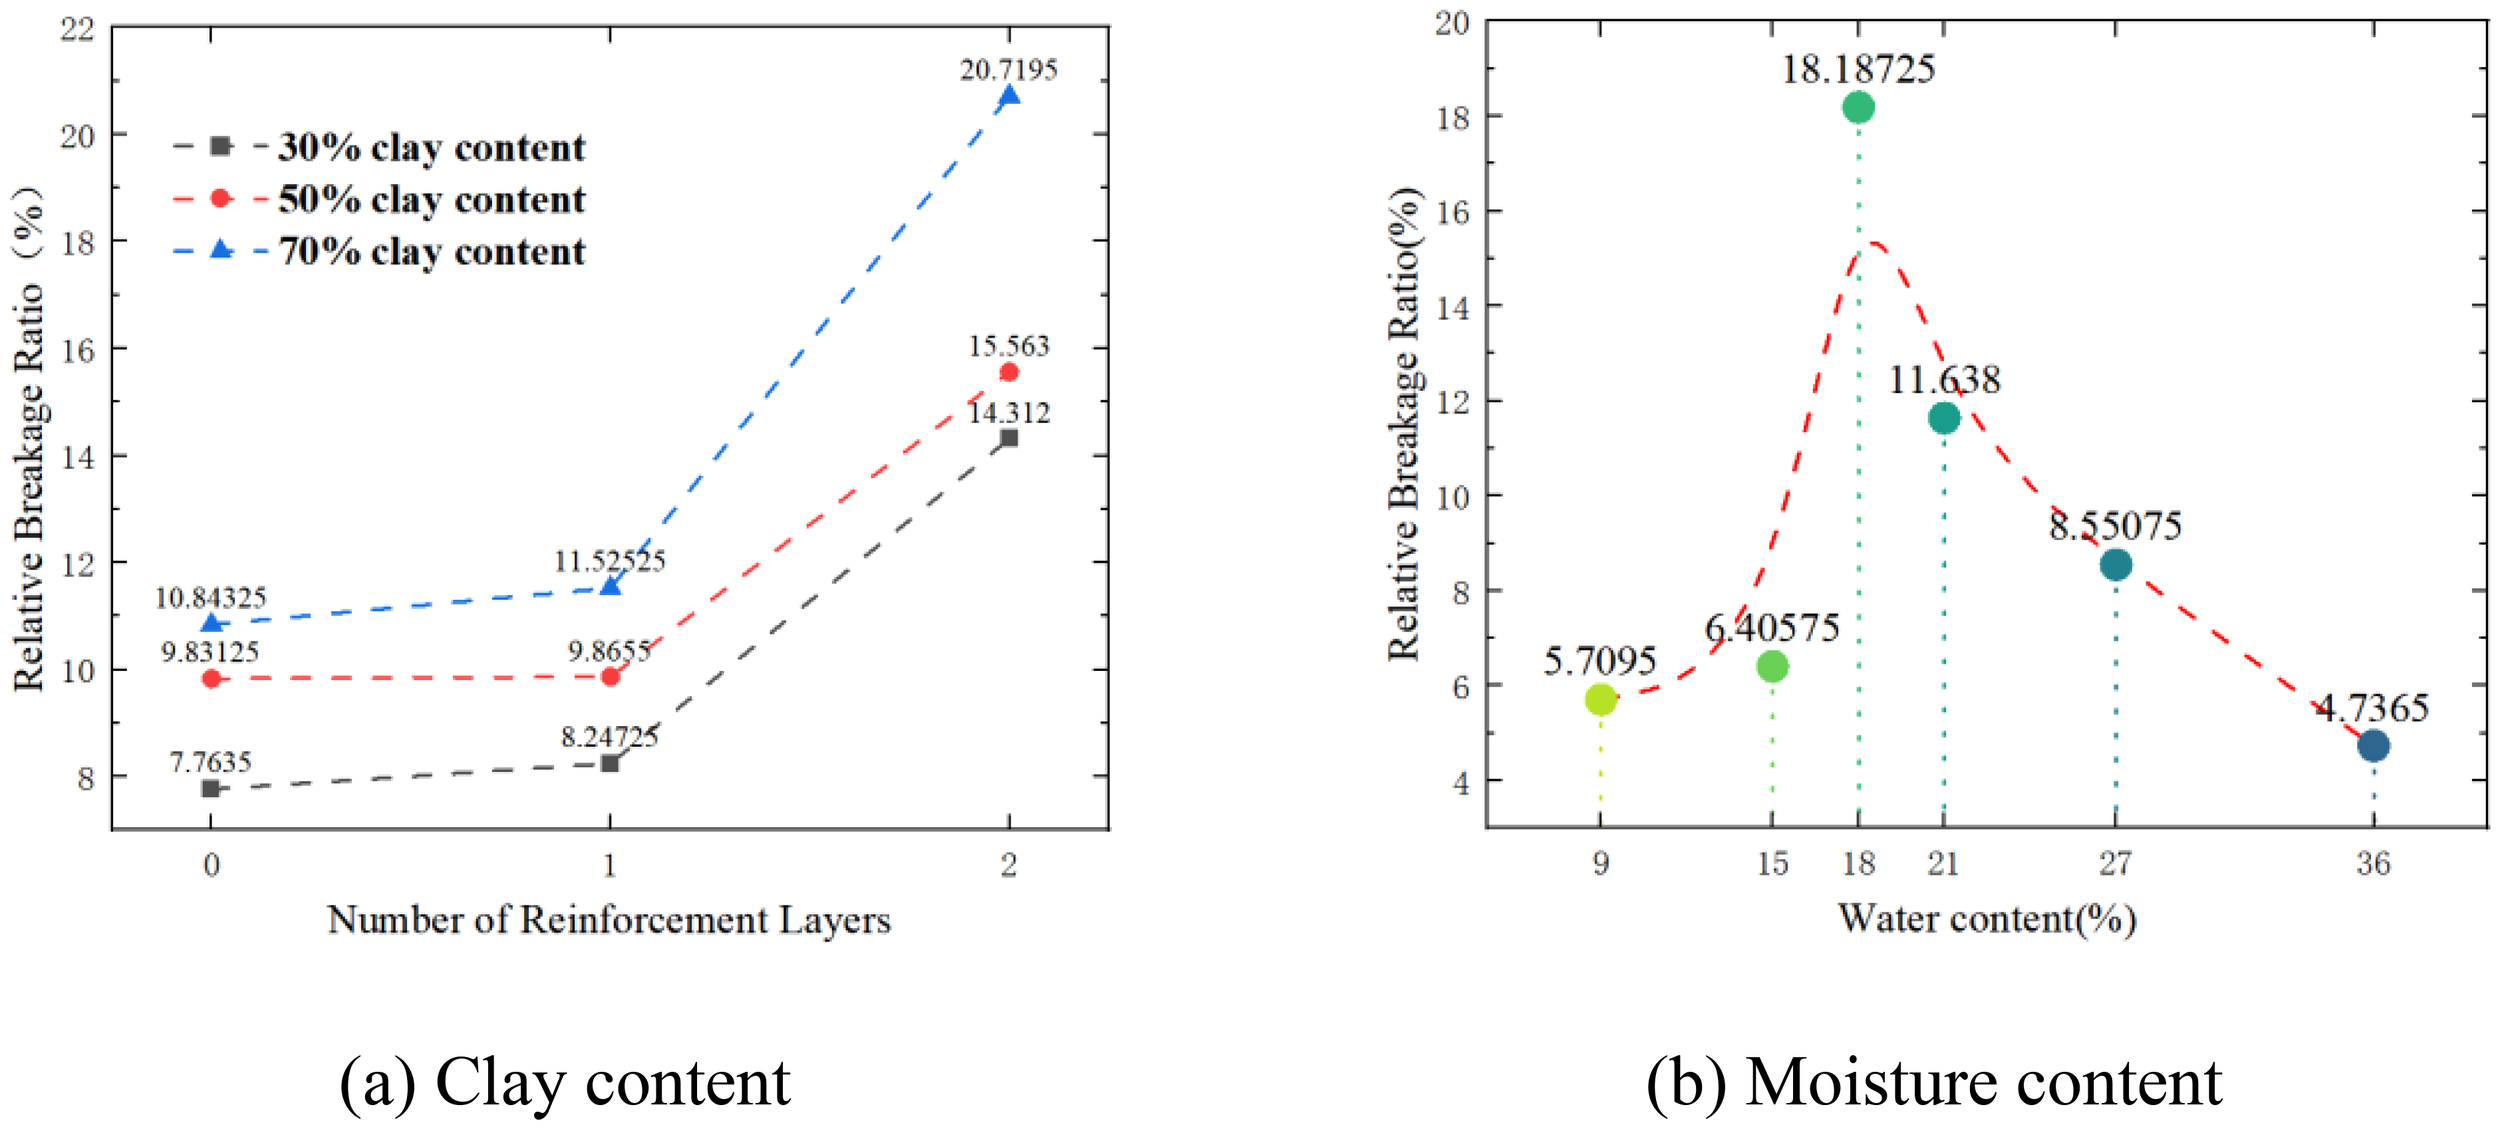
The relative breakage rates (Br) (a) Clay content; (b) Water content.
To further quantify the extent of particle breakage, a fractal model is utilized to characterize the fragmentation behavior. Tyler and Wheatcraft (1992) introduced a fractal model for particle size distribution curves, establishing the relationship between cumulative soil particle mass and particle size. The corresponding formula is as follows:
In this equation, d represents the selected particle size; M (d< di) denotes the cumulative mass of particles with diameters smaller than di; MT is the total mass of the particles; di is the diameter corresponding to the ith sieve layer, with dmax being the maximum particle size for marine coral sand. The slope, α, of the particle size distribution curve at particle diameter di is defined as α = 3−D, where D is the fractal dimension of the particle material. Apply logarithms to both sides of Equation 2 to obtain Equation 3:
Based on Equation 3, the slope (k) of the linear fit between lg[M(d< di)/MT] and lg(di/dmax) is equal to 3 – D, where D is the fractal dimension. Thus, D can be determined from the slope of the log-log plot, with higher values of D indicating more significant particle fragmentation. This formulation is used to characterize the fractal behaviour of reinforced marine coral sand during triaxial compression tests.
After calculations, Tables 4 and 5 were obtained. The analysis reveals that the variation trends of the fractal dimension and the particle breakage rate are similar, indicating that the fractal dimension exhibits the same regularity as particle breakage. With an increase in the number of reinforcement layers, confining pressure, and clay content, the fractal dimension increases. Additionally, under an 18% moisture content, the fractal dimension is higher than under other conditions, although the difference is not very pronounced. In summary, the variation in the fractal dimension can quantitatively describe the degree of particle breakage. The number of reinforcement layers, the magnitude of confining pressure, and clay content are the primary factors affecting changes in the fractal dimension, while moisture content has a relatively minor influence.
Table 4
| Clay content (%) | Confining pressure (kPa) | D | ||
|---|---|---|---|---|
| Number of reinforcement layers | ||||
| 0 | 1 | 2 | ||
| 30 | 50 | 2.04515 | 2.02015 | 2.09695 |
| 100 | 2.03713 | 2.02977 | 2.0414 | |
| 150 | 2.07708 | 2.01591 | 2.14604 | |
| 200 | 2.07355 | 2.03395 | 2.1204 | |
| 50 | 50 | 2.0147 | 2.02296 | 2.13806 |
| 100 | 2.05937 | 2.03096 | 2.05354 | |
| 150 | 2.03422 | 2.0532 | 2.11644 | |
| 200 | 2.05337 | 2.04354 | 2.21236 | |
| 70 | 50 | 2.01107 | 2.07663 | 2.1757 |
| 100 | 2.03817 | 2.03384 | 2.08762 | |
| 150 | 2.02213 | 1.98637 | 2.21802 | |
| 200 | 2.08778 | 2.14163 | 2.23875 | |
Fractal dimension D under different clay content, reinforcement layers, and confining pressure.
Table 5
| Moisture content (%) | D | |||
|---|---|---|---|---|
| Confining pressure(kPa) | ||||
| 50 | 100 | 150 | 200 | |
| 9 | 2.03982 | 1.99429 | 2.01953 | 2.02786 |
| 15 | 2.03033 | 2.01276 | 1.99452 | 2.09083 |
| 18 | 2.02256 | 2.05679 | 2.03817 | 2.03402 |
| 21 | 2.02113 | 2.05252 | 2.03988 | 2.05201 |
| 27 | 2.06233 | 1.99422 | 2.0077 | 1.99799 |
| 36 | 2.06724 | 2.08329 | 2.07158 | 2.03919 |
Fractal dimension D under different moisture content and confining pressure.
4.5 Machine learning predicting performance
Figure 19 . shows the prediction results of the machine learning model constructed to evaluate 900 training and testing datasets.
Figure 19
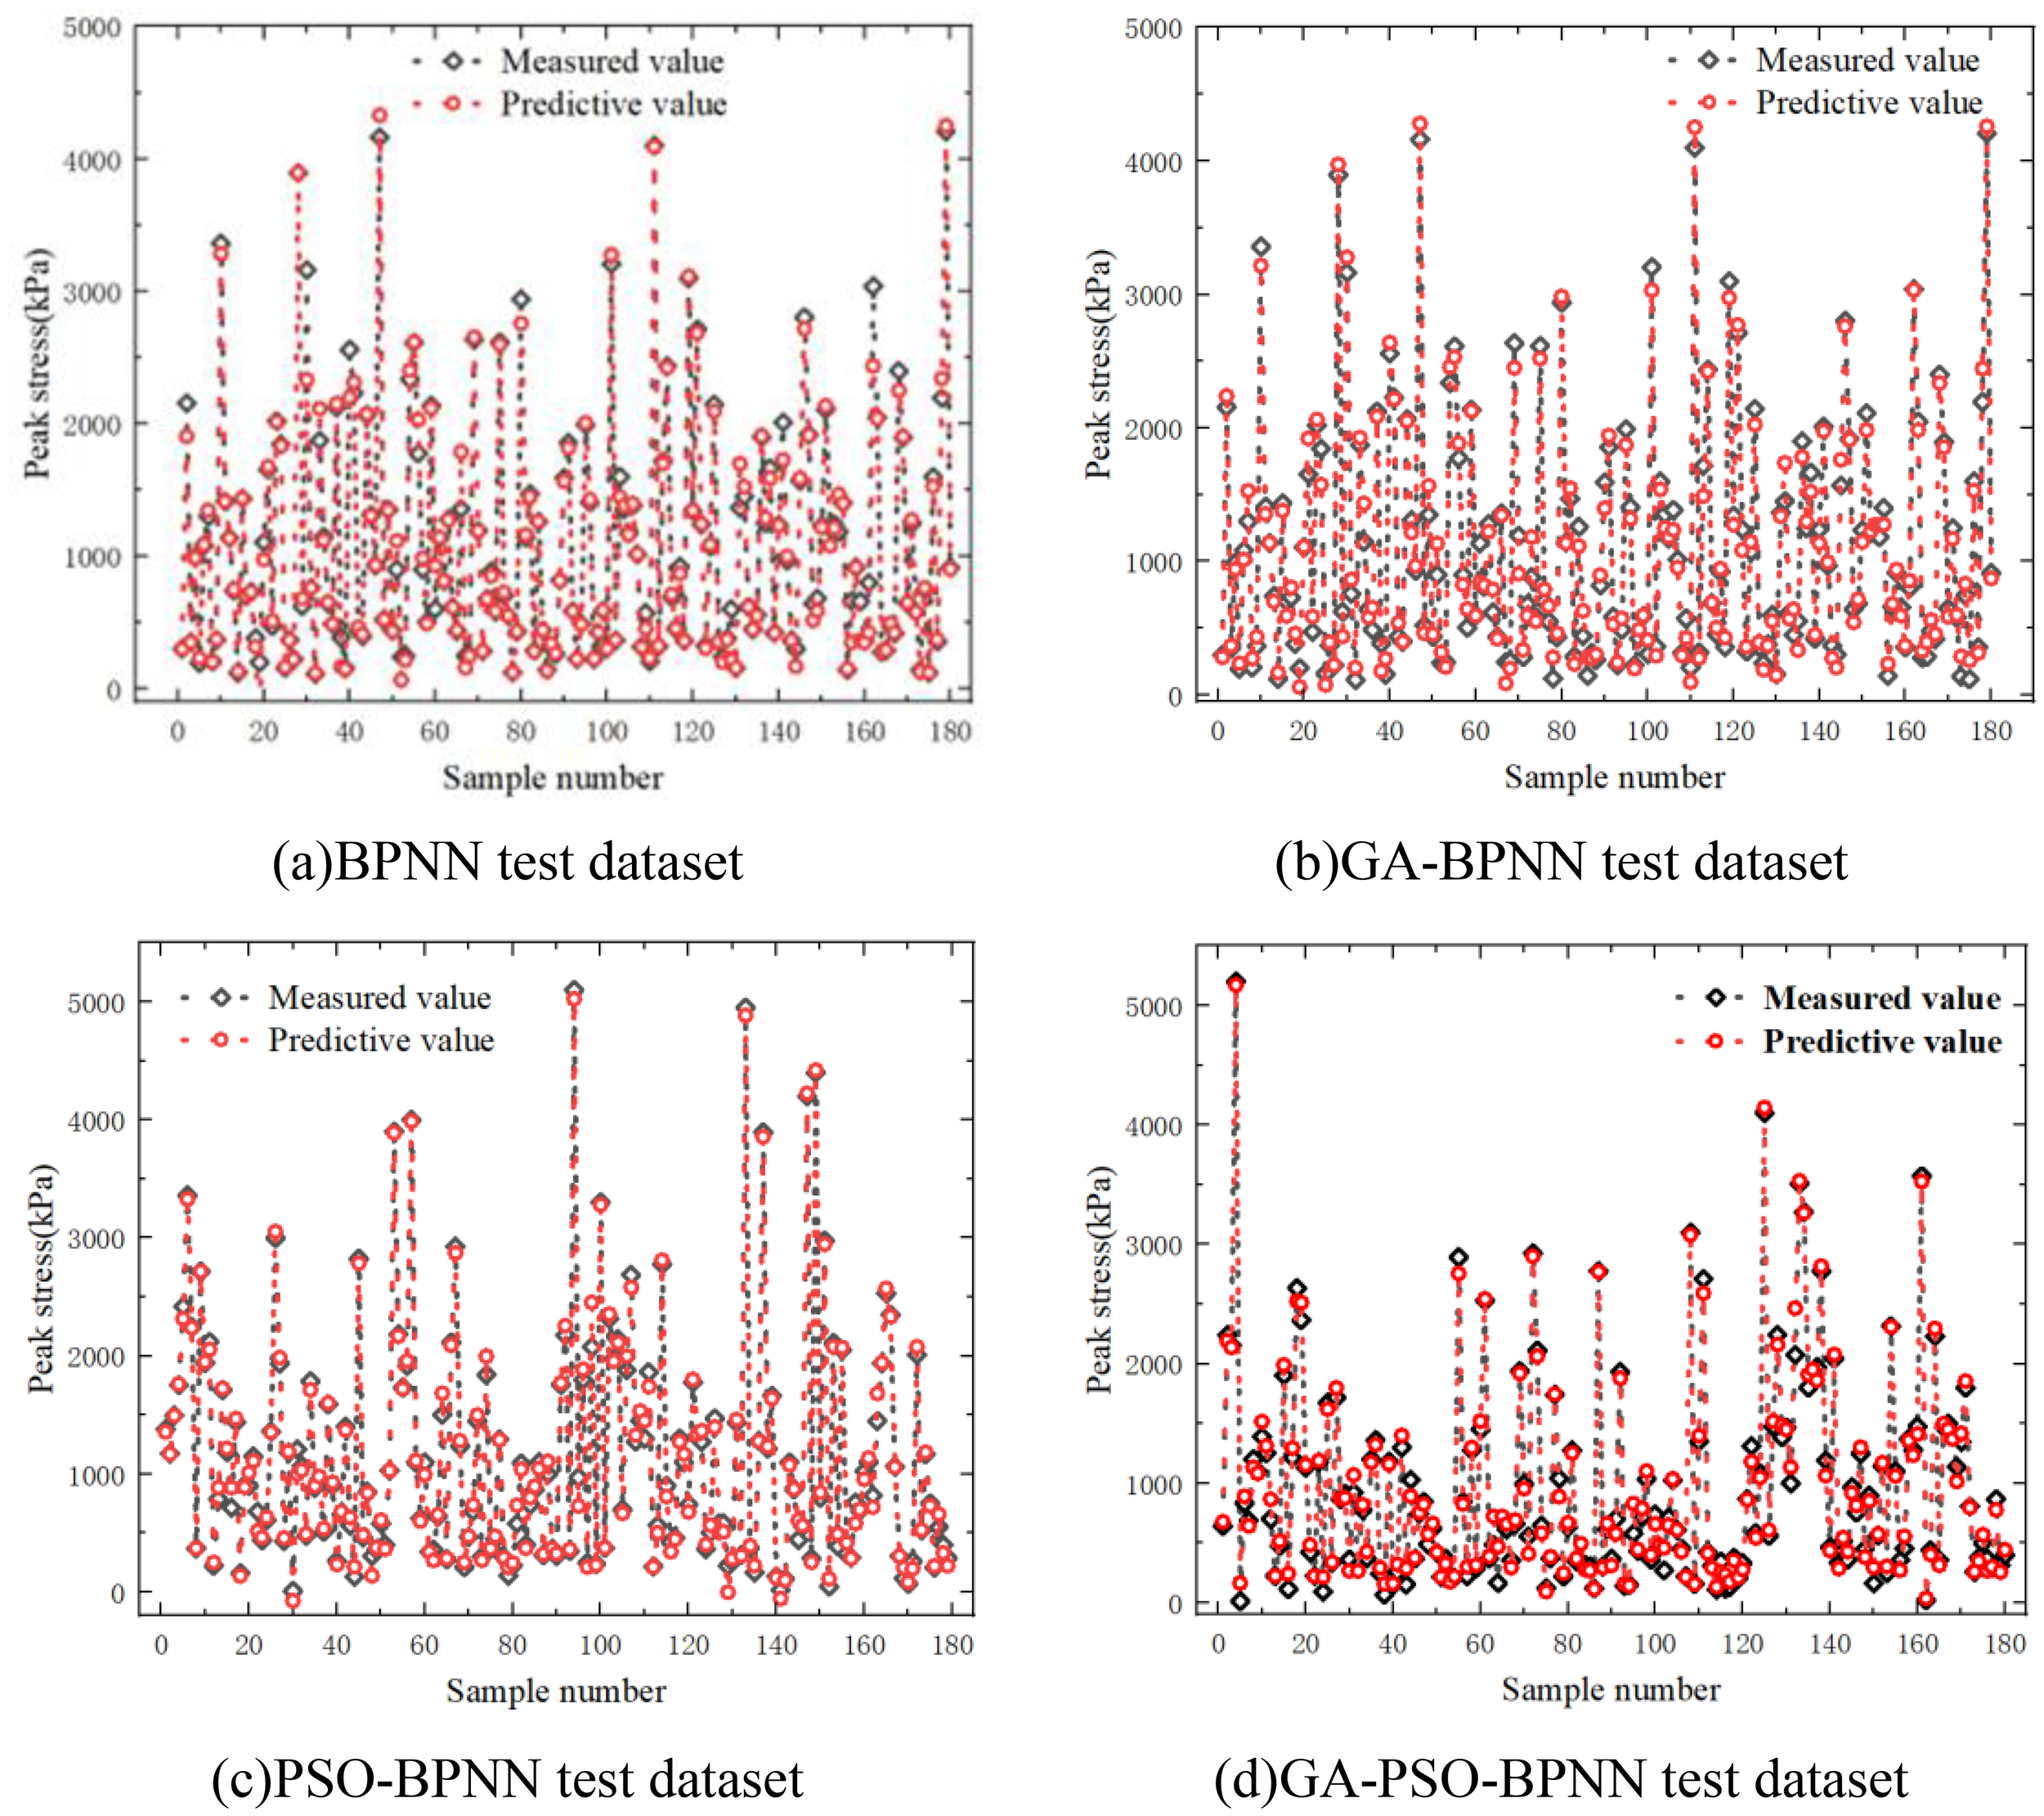
Prediction results on the data from the test datasets (a) BPNN test dataset (b) GA-BPNN test dataset (c) PSO-BPNN test dataset (d) GA-PSO-BPNN test dataset.
From the overall trend, the predicted values (red hollow circles) of all models generally align with the actual values (black hollow diamonds), indicating that each model can effectively fit the training data and capture the nonlinear relationship between input features and the target output. In terms of error performance, there are significant differences among the models. The GP(GA-PSO-BPNN) model (Figure 19d) shows the smallest deviation from the actual values, demonstrating strong fitting capability. In contrast, the BPNN (Figure 19a) exhibits larger prediction errors for some high-peak samples, suggesting that its shallow network structure is insufficient to capture the complex patterns in the data. GA-BPNN (Figure 19b) and PSO-BPNN (Figure 19c) improve the performance of the conventional BPNN through optimization algorithms, showing better alignment with the actual values, though slight overfitting is still observed in some samples. Overall, Figure 19 shows that the GP model outperforms other models on the training set, demonstrating superior learning and generalization capabilities.
Figure 20 . presents the fitting performance of each model, providing a further assessment of how well the training data is matched. The GP model shows the best performance in the fitting plots, with the fitting curve closely aligning with the true values. It achieves an R value of 0.9993, which indicates that GP can effectively capture patterns in the training data and perform accurate fitting. In contrast, BPNN (Figure 20a) exhibits poorer fitting performance, especially in regions with higher peaks, where there is a noticeable deviation between the fitting curve and actual measurements. The lower R value suggests that the depth of the BPNN network is insufficient to handle the complex nonlinear features in the data, which limits its ability to learn intricate patterns effectively. GA-BPNN and PSO-BPNN improve the fitting performance through optimization algorithms, but signs of overfitting are still observed at certain data points.
Figure 20
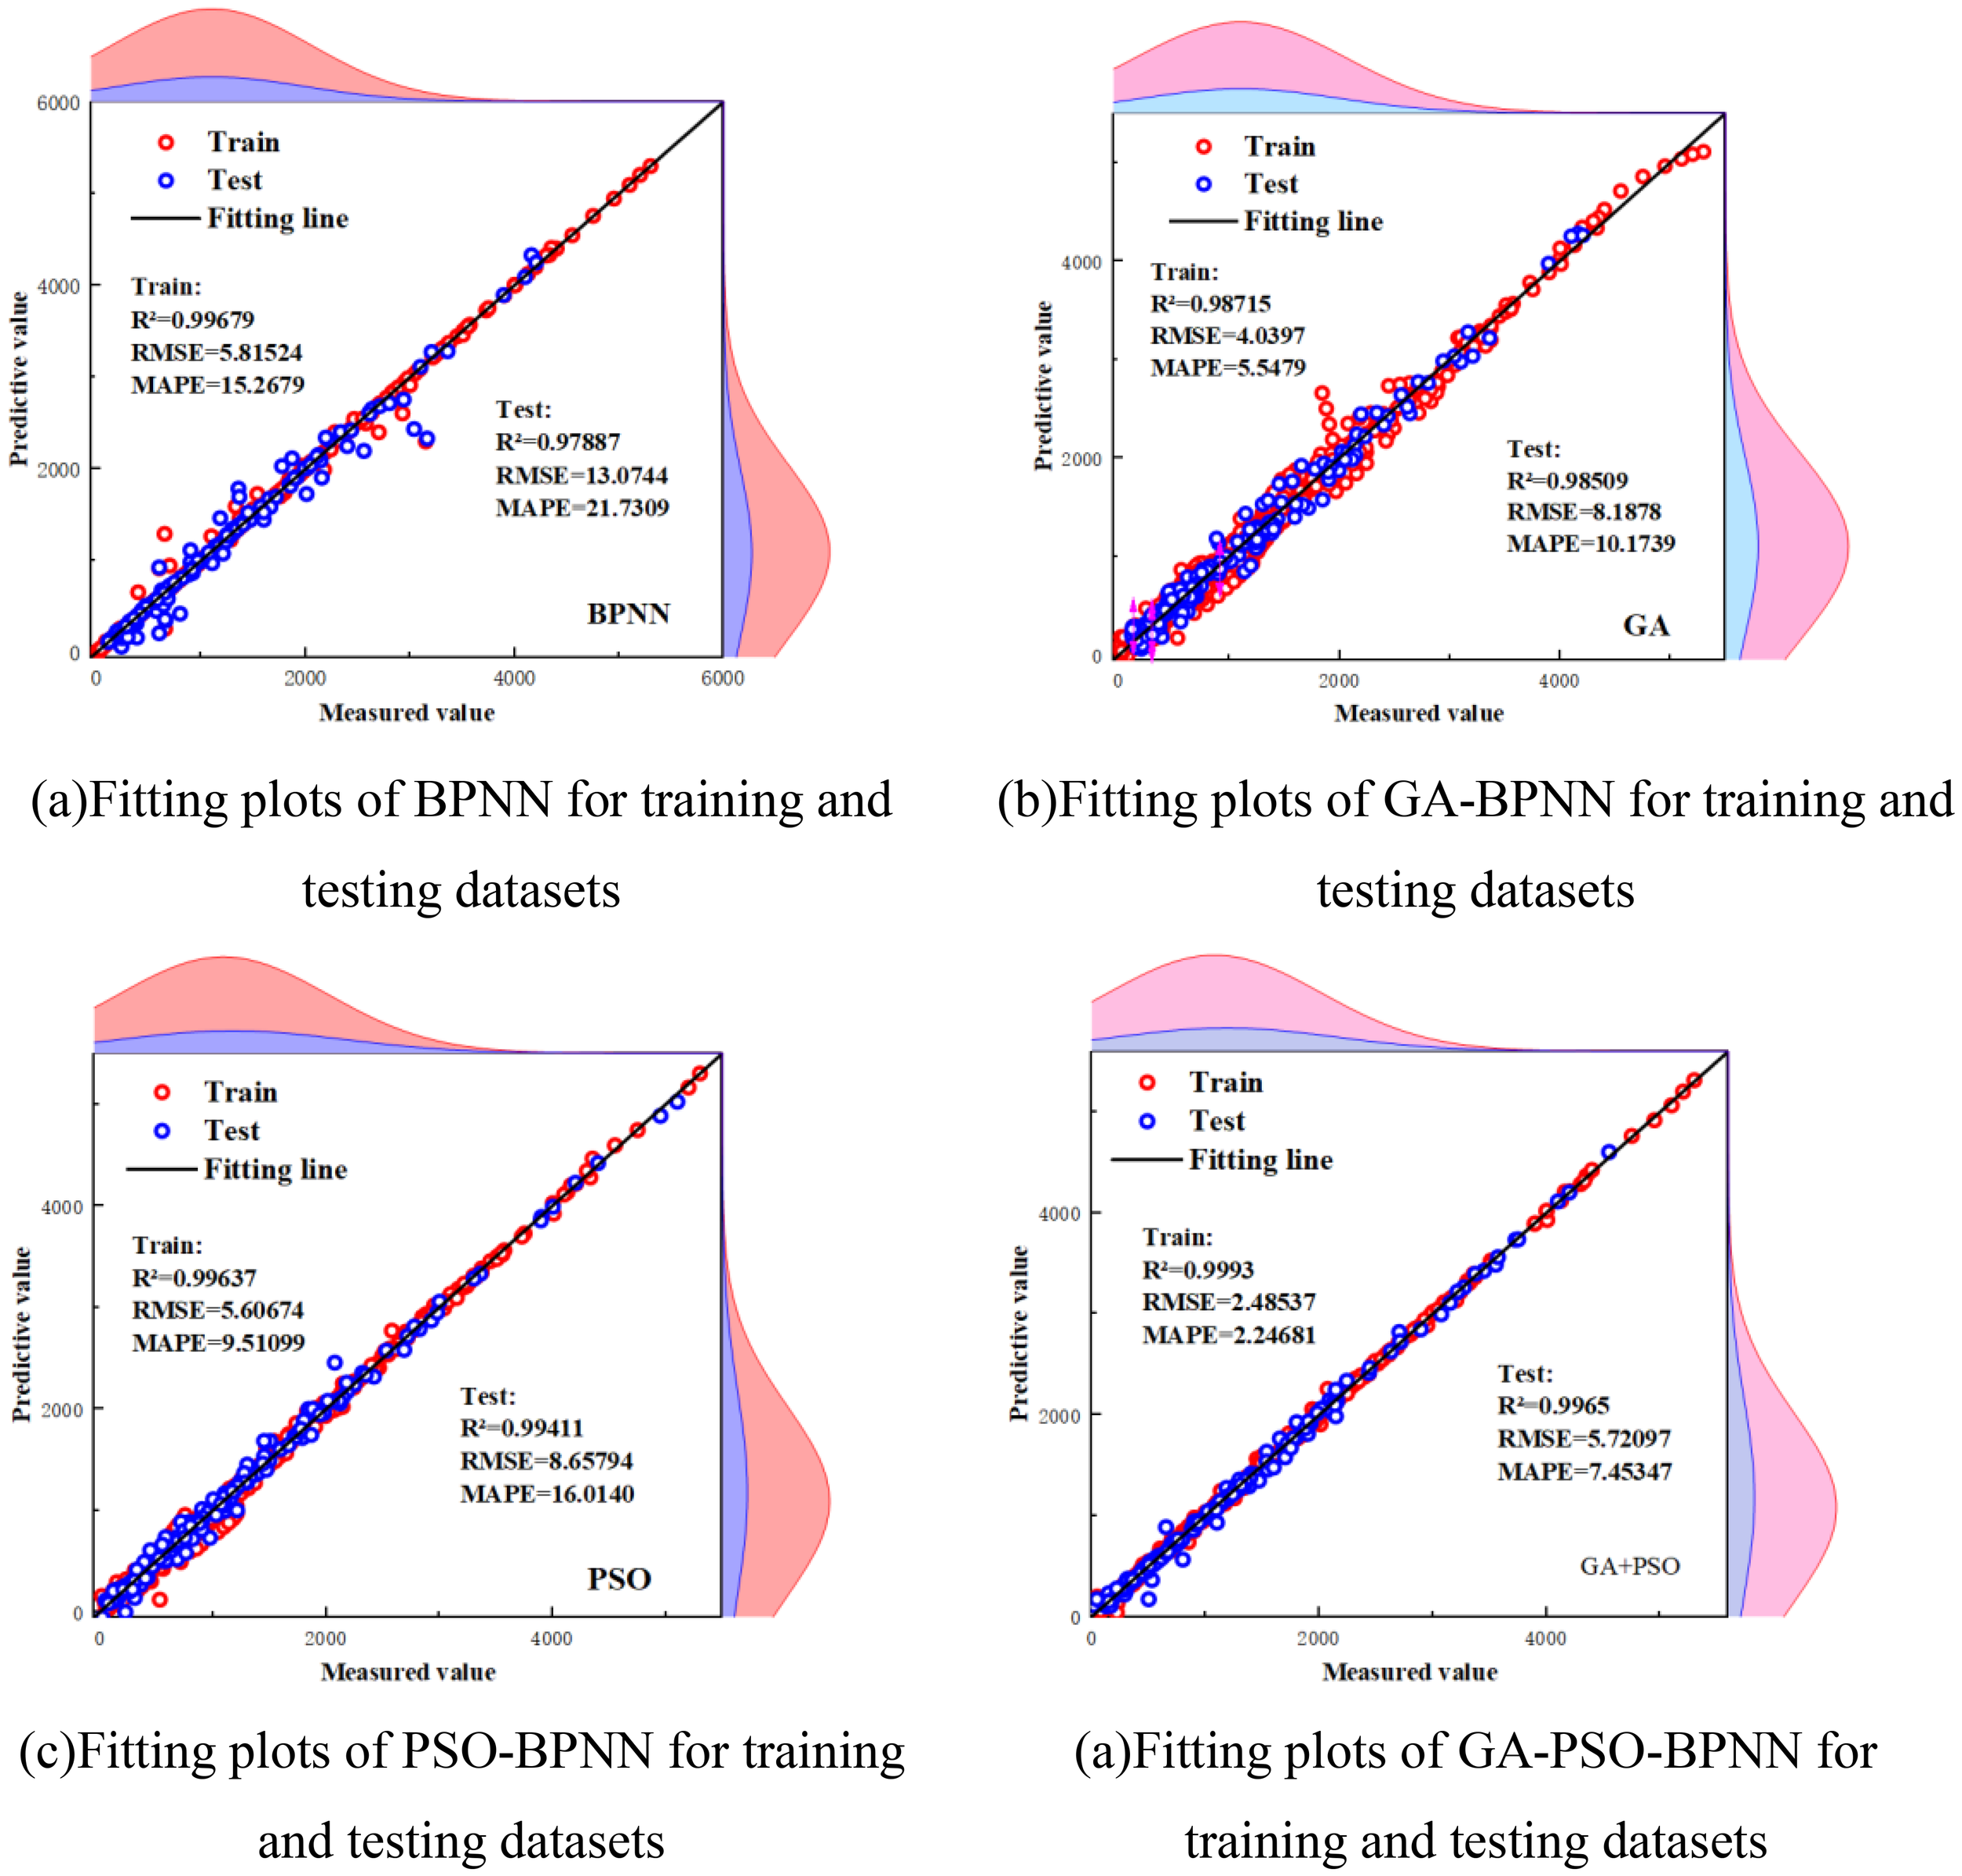
The R value for the algorithms on testing datasets (a)Fitting plots of BPNN for training and testing datasets (b) Fitting plots of GA-BPNN for training and testing datasets (c) Fitting plots of PSO-BPNN for training and testing datasets (d) Fitting plots of GA-PSO-BPNN for training and testing datasets
Specifically, the GP model achieved the highest prediction accuracy, with the lowest RMSE values of 5.72097 and 2.48537 for the test and training sets, respectively, and the lowest MAPE values of 7.45347% and 2.24681%, respectively. In terms of correlation, the GP model yielded an R value of 0.9993 on the test set, which is close to 1, indicating a very high correlation between the predicted results and the measured values. In contrast, although the GA-BPNN model benefited from optimization via the genetic algorithm and showed improved prediction accuracy, it still lagged behind the CNN model. The GA-BPNN achieved RMSE values of 8.1878 and 4.0397 for the test and training sets, respectively, with corresponding MAPE values of 10.1739% and 5.5479%, and an R value of 0.98509, highlighting its limitations in capturing the underlying patterns of the data. The PSO-BPNN model performed relatively poorly, with larger prediction errors and a more scattered distribution of data points, suggesting that the particle swarm optimization did not effectively enhance the prediction capability of the BPNN. PSO-BPNN recorded RMSE values of 8.65794 and 5.60674 for the test and training sets, respectively, MAPE values of 16.0140% and 9.51099%, and an R value of 0.99411. BPNN model had the lowest prediction accuracy, with RMSE values of 13.0744 and 5.81524 for the test and training sets, respectively, and MAPE values of 21.7309% and 15.2679%. Its R value was 0.97887, and its data points deviated significantly from the fitting line, which indicates that it failed to effectively capture the underlying data patterns. This underperformance is mainly due to the simplicity of its model structure, which limits its ability to describe complex data features.
Overall, the GP model outperformed GA-BPNN, PSO-BPNN, and BPNN in evaluating both the training and test datasets. In particular, the GP model demonstrated higher accuracy and efficiency in prediction, along with the best fitting performance and predictive reliability on the test dataset.
4.6 Sensitivity analysis
Interpretable descriptions of machine learning models are essential for achieving a comprehensive understanding and promoting their widespread application. Feature importance analysis helps to demystify the “black-box” nature of these models, providing insights into their predictive behavior and revealing valuable information (Yang et al., 2025). In recent years, a widely adopted interpretability technique is the Shapley Additive Explanations (SHAP) method, introduced by Lundberg and Lee (2017). SHAP leverages principles from game theory to evaluate all possible combinations of input features, analyze their interactions, and compute the SHAP value for each prediction. This value quantifies each feature’s contribution to the model output and ranks them in descending order of importance. A positive SHAP value indicates that the feature contributes to increasing the prediction, while a negative value reflects a decreasing effect.
Figure 21 . illustrates the five most influential features affecting the output of the GP model, and their impacts are briefly analyzed in this study. In the pie chart, the average SHAP value for each feature is indicated, where higher SHAP values represent a stronger influence on the model’s predictions. Additionally, the bees warm plot on the left provides a more detailed view of how the key features affect the model output. Here, the horizontal axis represents the SHAP value, while the vertical axis indicates the feature value. When a data point has a high SHAP value and a high feature value, it implies a positive correlation—higher values of this feature significantly increase the prediction output. Conversely, negative SHAP values indicate a negative correlation between the feature and the prediction result.
Figure 21
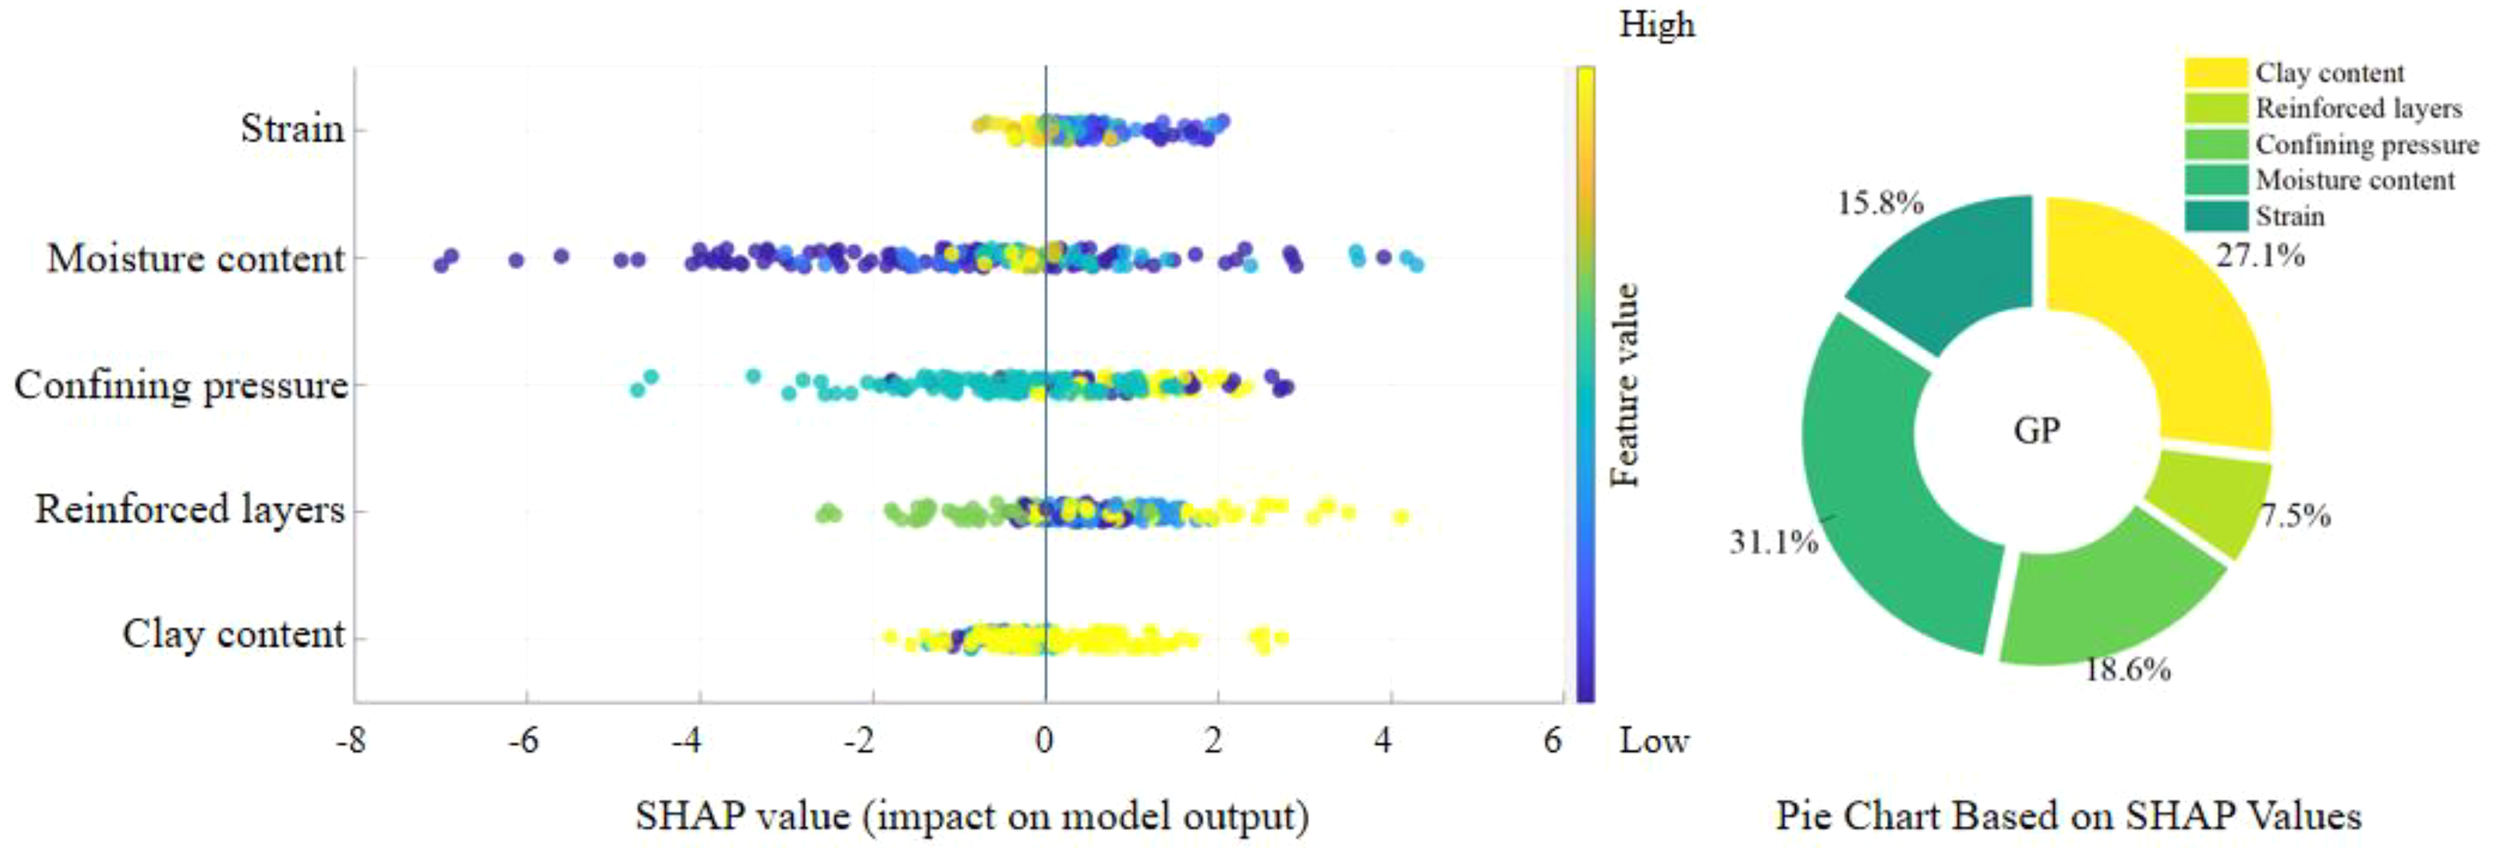
Feature importance analysis plot.
It can be observed that water content has the greatest impact on strain, with a relative importance of 31.1%, followed by clay content at 27.1%. In contrast, the number of reinforcement layers has the least influence, accounting for only 7.5%.
According to the SHAP value analysis, moisture content is the most influential factor affecting the model’s predictive output, with a relative importance of 31.1%. This result can be interpreted from several perspectives. First, moisture content directly influences the contact mechanism between soil particles and the distribution of pore water pressure, serving as a key factor in controlling soil strength and deformation characteristics. As analyzed in Section 4.3, an increase in moisture content enhances the lubrication between soil particles, reduces frictional resistance, and consequently weakens the overall shear strength of the soil. This reduction in stress transfer capacity significantly affects the trend of stress development. Clay content is also a critical factor, accounting for 27.1% of the relative importance, second only to moisture content. This is because clay plays a significant role in the formation of soil structure and the distribution of water within the matrix. A higher clay content typically implies stronger cohesion and more pronounced plastic behavior, which are key to the accumulation and dissipation of stress in the MCCM during the shearing process. Therefore, to ensure the stability and reliability of marine engineering structures constructed with MCCM as the primary material, it is essential to implement optimized measures tailored to the influence of different factors.
5 Discussion on mechanism of action
5.1 Geogrid–MCCM interface and interaction
Figure 22 . presents scanning electron microscope (SEM) images that elucidate the complex interfacial interaction mechanisms between marine coral sand–clay mixtures (MCCM) and geogrid reinforcement. The MCCM is characterized by a combination of highly porous, angular marine coral sand particles and plate-like, adhesive clay minerals. This unique composition leads to the formation of a more intricate and mechanically effective interlocking interface with the geogrid.
Figure 22
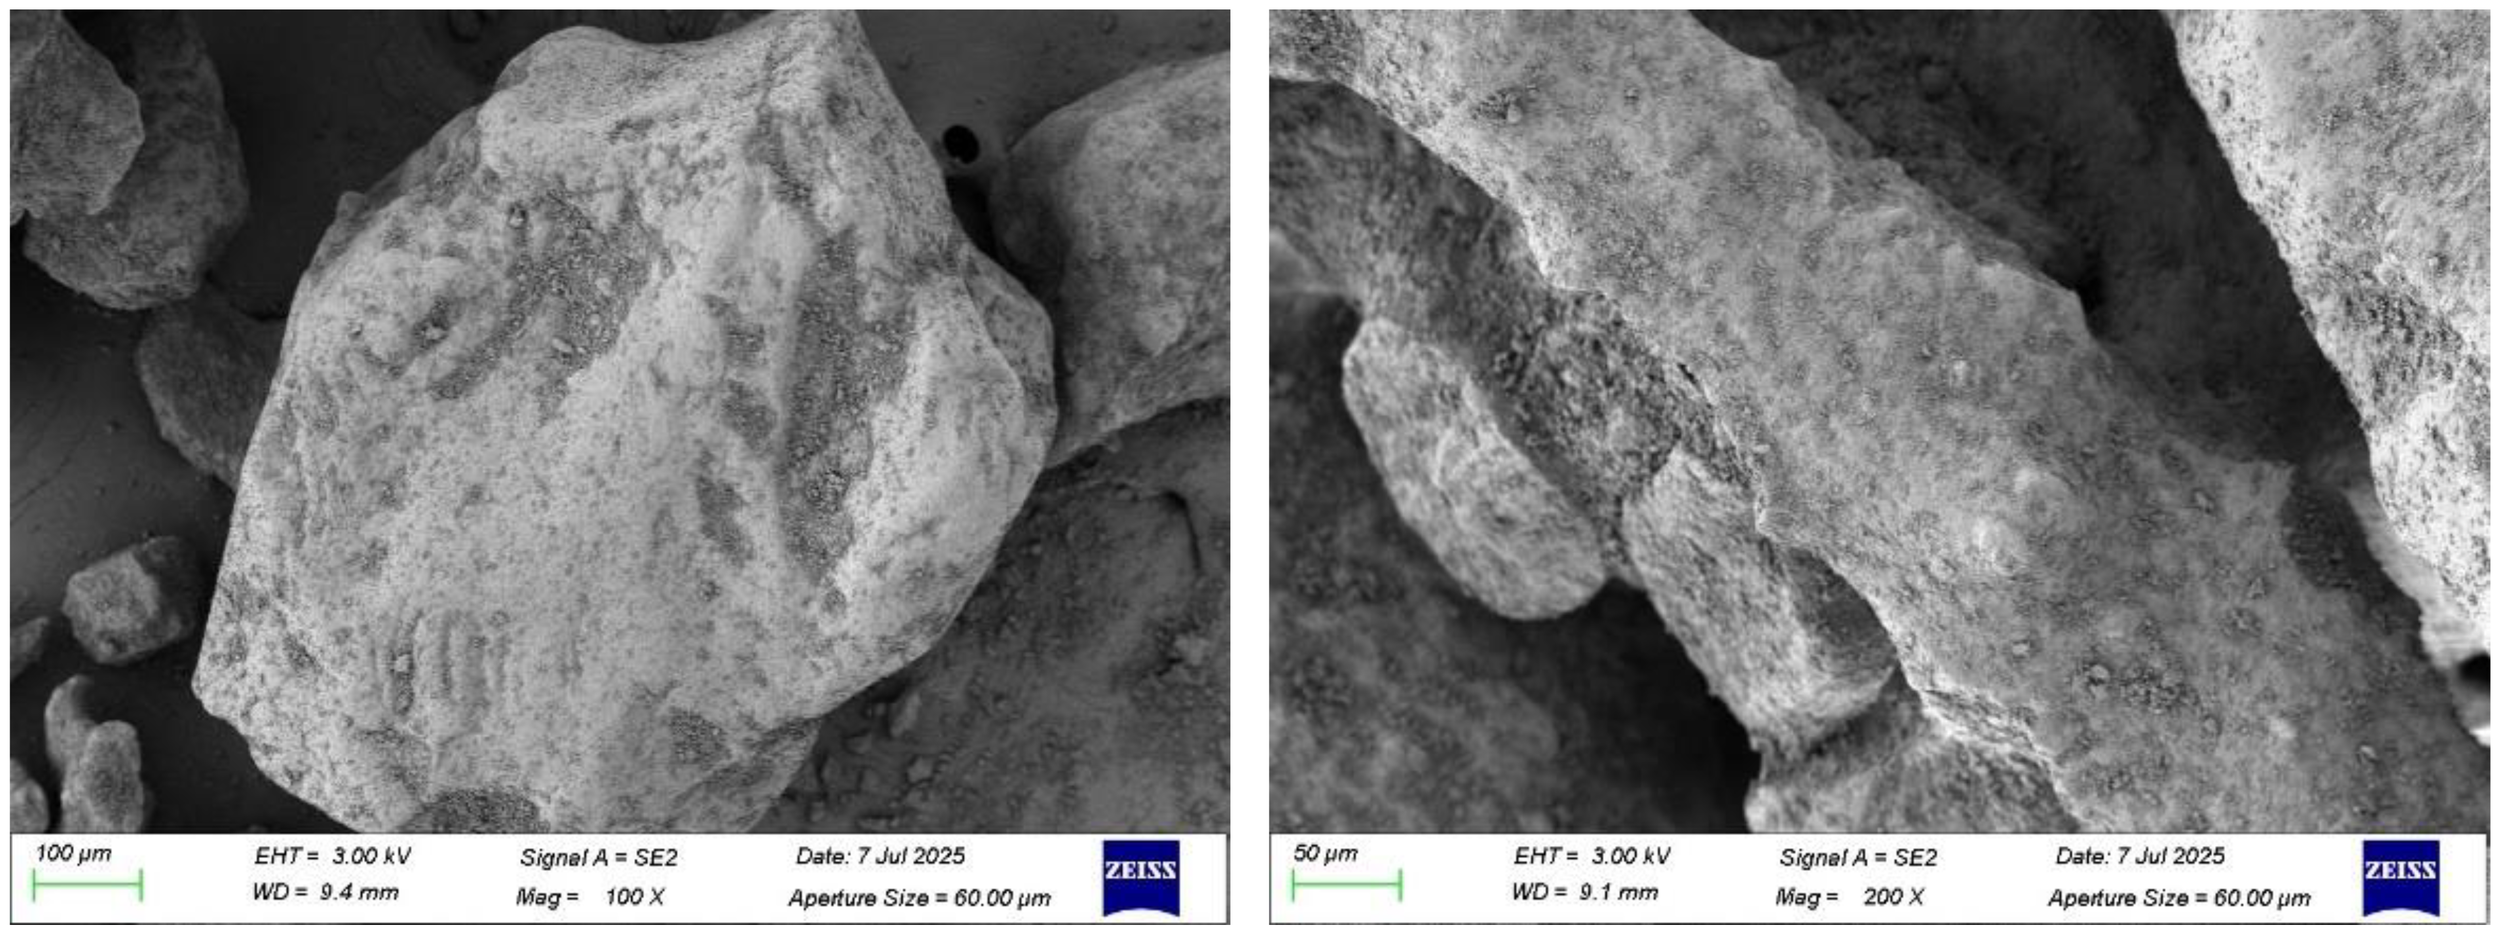
Scanning electron microscope (SEM) images of marine coral sand–clay mixtures.
As shown in Figure 22, fine clay particles infiltrate the voids between marine coral sand grains, forming a denser skeletal structure. This “filling and coating” effect not only reduces the overall porosity of the mixture but also significantly increases the effective bonding area between the MCCM and the geogrid. Particularly at the geogrid surface, clay particles exhibit strong adhesion, enhancing interfacial contact.
Moreover, the angular nature of the marine coral sand particles strengthens the mechanical interlock with the geogrid. SEM images reveal that some sand particles are embedded along the edges of the geogrid apertures, forming localized “locking” structures that contribute to higher interfacial shear strength. The plasticity of the clay further stabilizes these interlocked zones, allowing effective stress transfer and improved resistance to slippage under loading conditions.
In summary, the micro-interaction mechanisms at the geogrid–MCCM interface include:
-
Clay filling and coating of marine coral sand pores;
-
Adhesive bonding between clay and the geogrid;
-
Mechanical interlocking between angular sand particles and the geogrid structure.
These synergistic effects collectively enhance the interfacial strength and overall stability of the reinforced MCCM system, providing a solid microstructural basis for its application in marine soft soil reinforcement and island and reef engineering.
5.2 Equivalent additional stress effect
Confining pressure has a significant influence on the strength of marine coral sand, with higher confining pressures leading to a marked increase in strength and an apparent enhancement in cohesion, as illustrated in Figure 14. In previous studies on reinforced soils, some researchers have modeled this effect as an equivalent additional confining pressure (Δσ3) (Guangxin et al., 1994). Assuming the internal friction angle remains constant, the additional confining pressure can be calculated as follows:
Where Δc represents the increment of apparent cohesion, and φ denotes the internal friction angle of the soil. By substituting the data from Figure 14. into Equation 4 and taking the average values.
the results are shown in Figure 23. Analysis indicates that the equivalent confining pressure increases with the number of layers of triaxial geogrid reinforcement. This further confirms the reinforcing mechanism by which triaxial geogrids enhance the strength of MCCM.
Figure 23
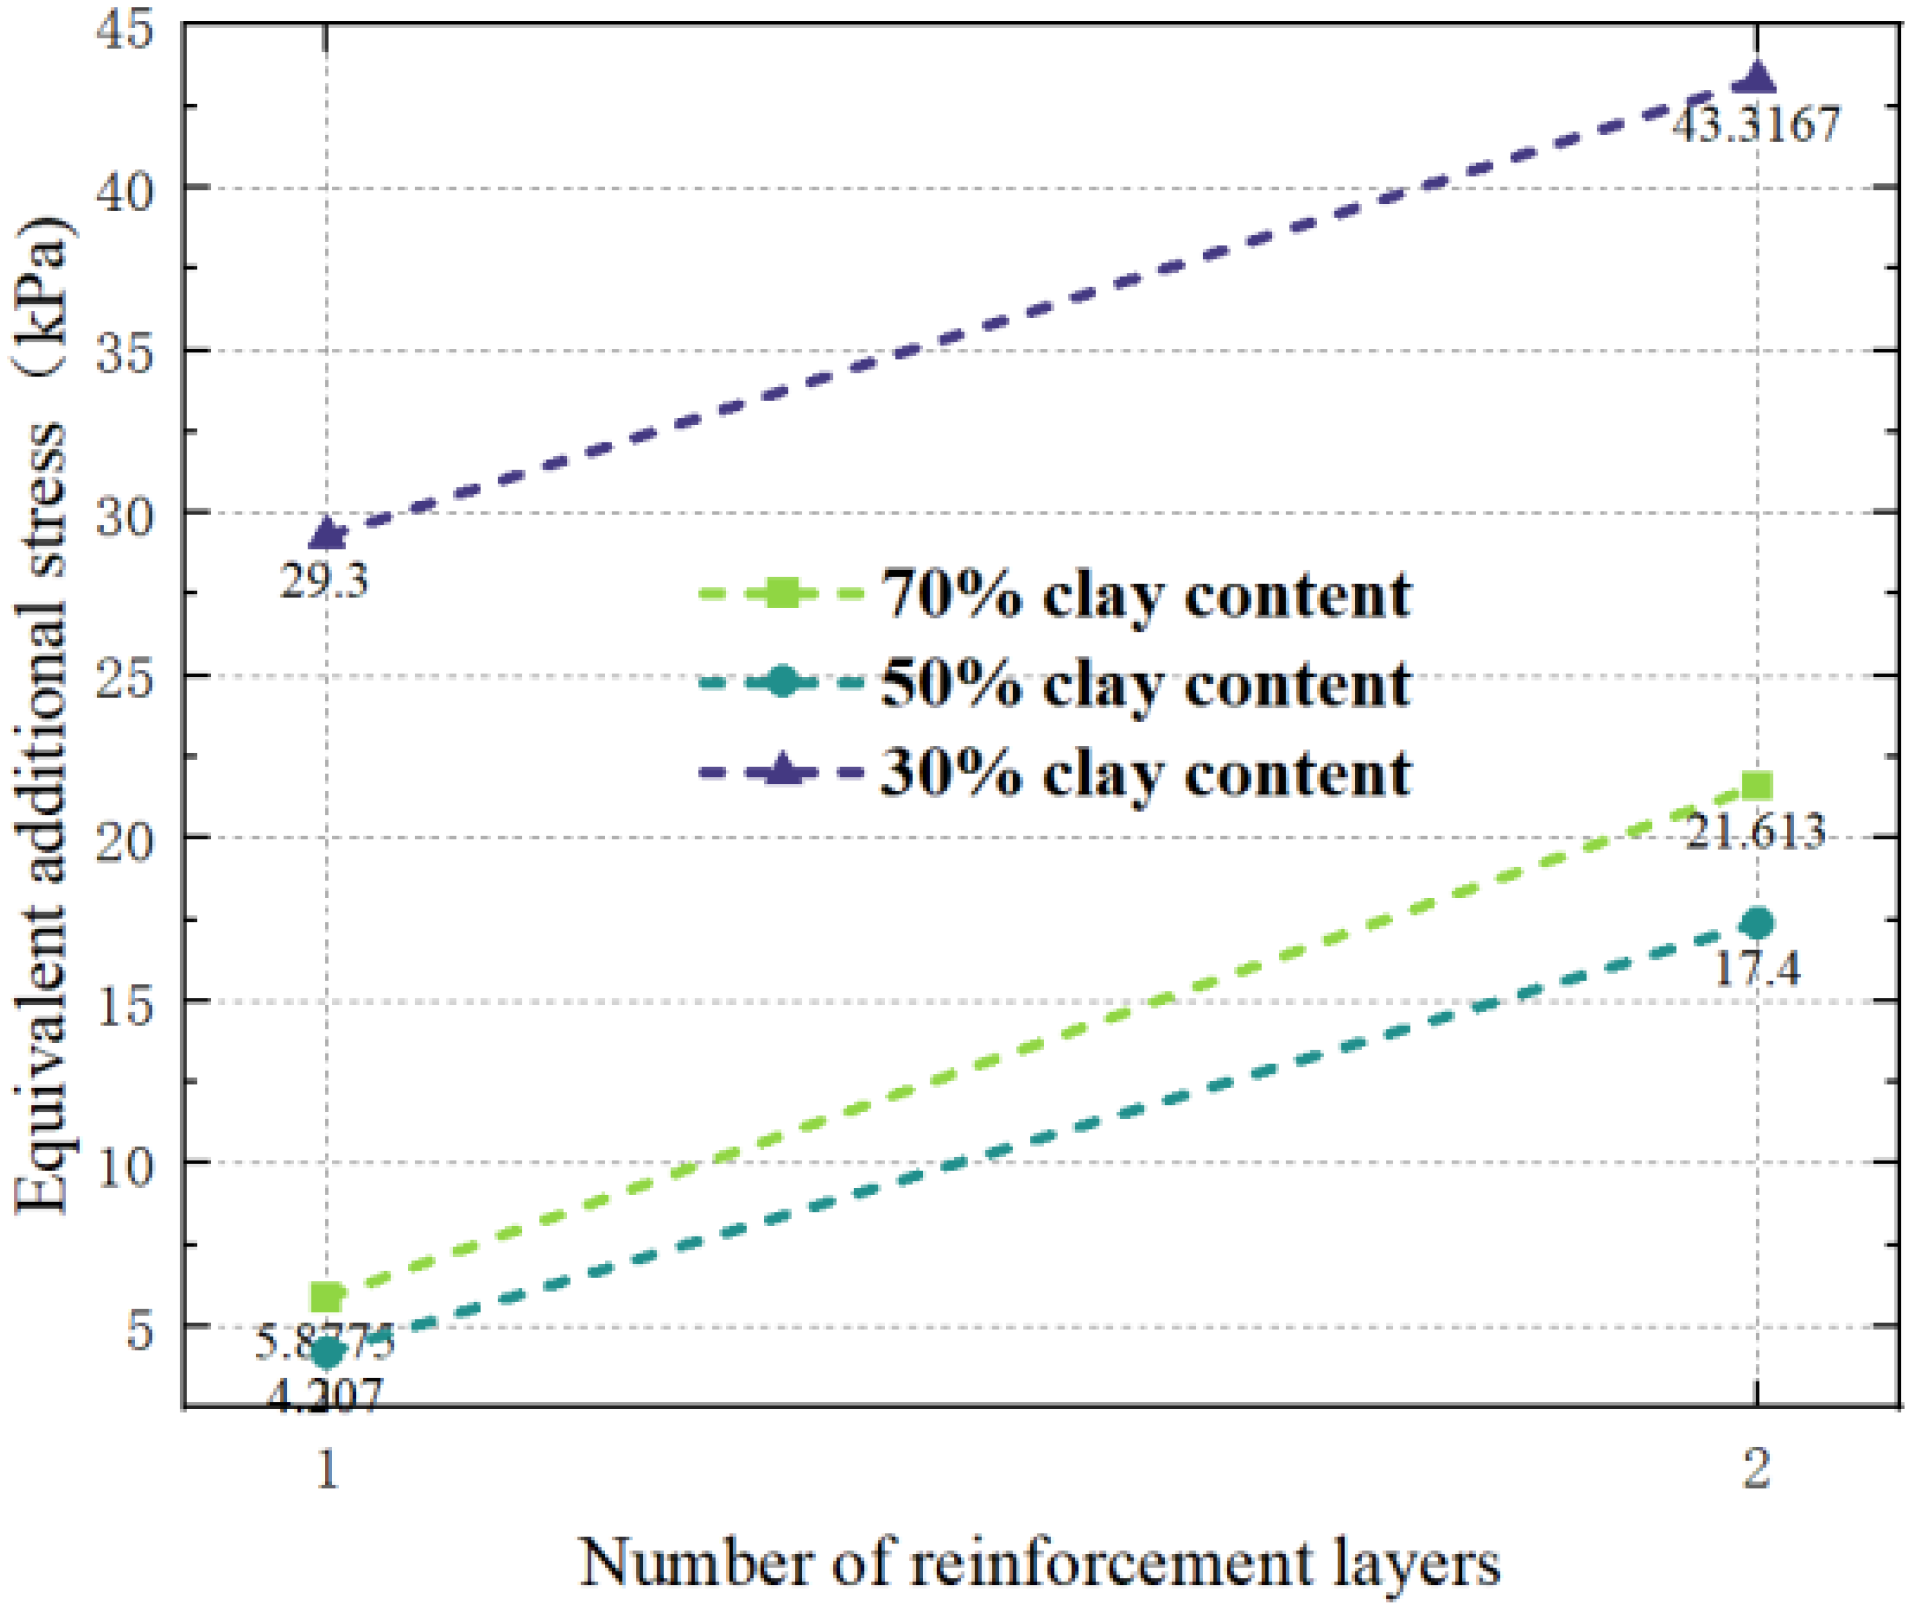
Equivalent additional confining pressure.
5.3 Microscopic analysis of particle–water interactions in MCCM
The irregular shape and high porosity of marine coral sand have a potential impact on the micro-scale particle–water interactions under unsaturated conditions, leading to changes in its properties. Marine coral sand near islands and coastlines remains in an unsaturated state for extended periods due to the wetting–drying cycles caused by climatic conditions. The intriguing phenomena of MCCM under different water contents observed in Section 4.2, even after the analyses in Sections 4.3 and 4.4, still leave room for further discussion. For instance, from the perspective of matric suction, it is evident that matric suction contributes significantly to the strength, a component often referred to as adsorptive strength (Wang et al., 2021).
In this section, the filter paper method is used to determine the suction values of marine coral sand, clay, and MCCM under different water contents. The tests are conducted using Double Ring brand quantitative filter paper and follow the parallel method (Li et al., 2022). As shown in Equations 5, 6:
where s is the matric suction (kPa), and wx is the water content of the filter paper (%).
The calculation shows that the matric suction of marine coral sand is nearly zero and thus does not significantly contribute to the strength. The temporary increase in MCCM strength observed at a water content of 15%–18% is primarily attributed to the matric suction of the clay. As shown in Figure 24, clay exhibits higher matric suction at low water contents. Therefore, changes in water content affect the mechanical behavior of reinforced MCCM mainly by influencing the properties of the clay component.
Figure 24
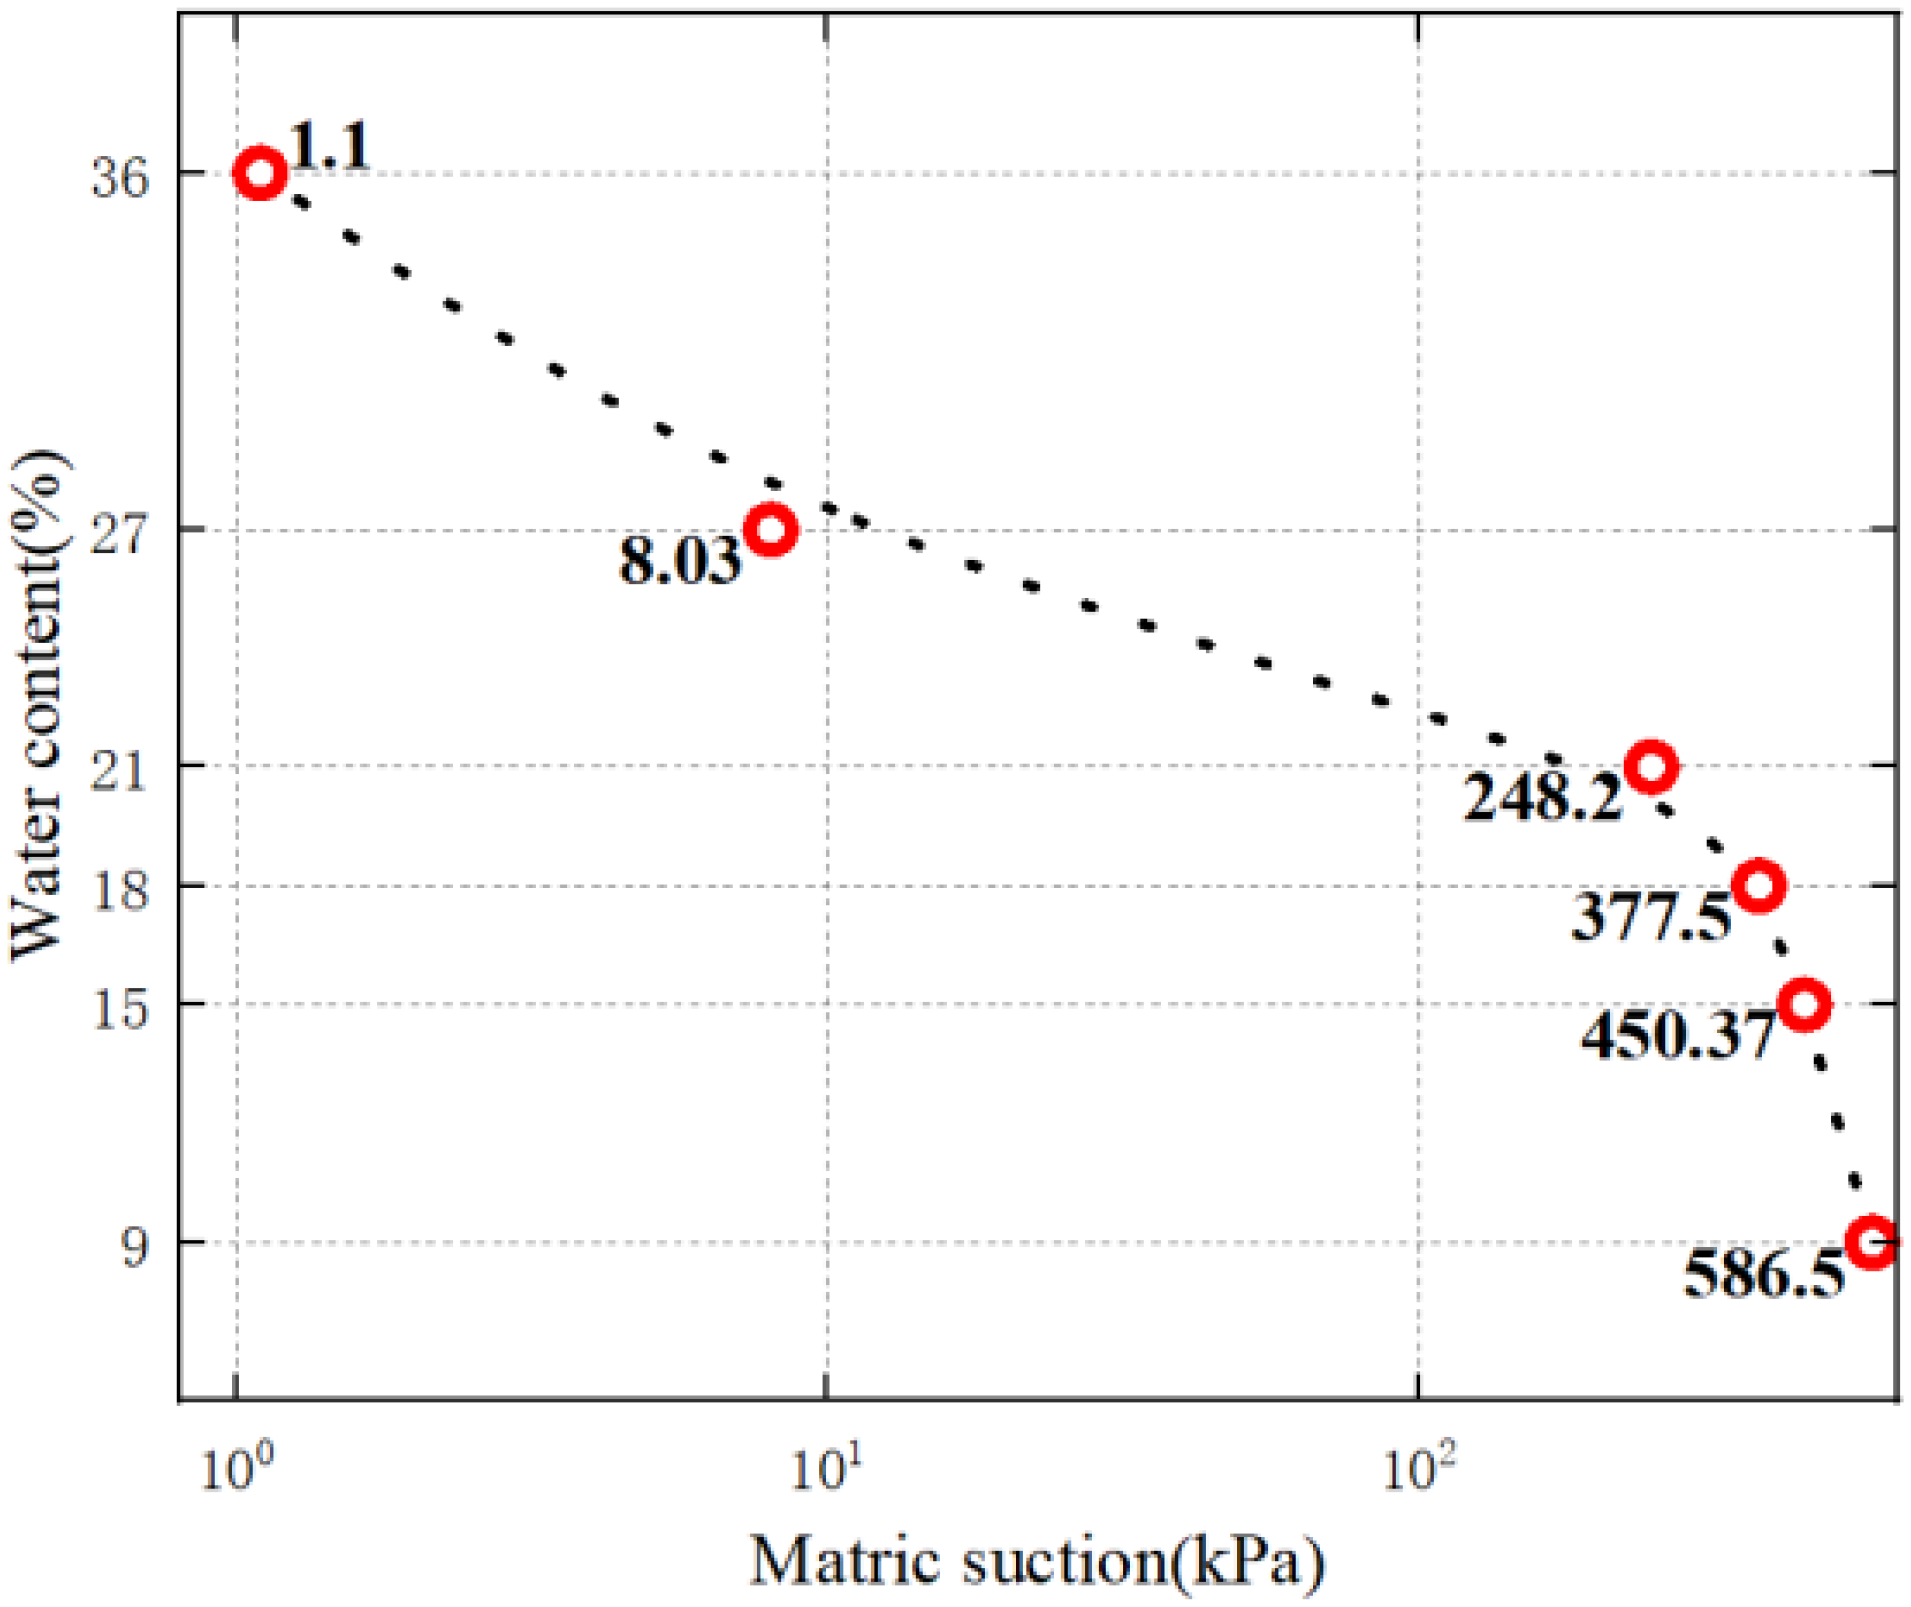
Characteristics of matric suction variation in clay.
6 Conclusion
This study investigates the strength and deformation behaviour of marine coral sand–clay mixtures (MCCM) under the influence of varying clay content, number of reinforcement layers, water content, and confining pressure. A series of triaxial tests were conducted to examine the deviator stress–strain relationship, failure patterns, particle breakage, strength characteristics, and matric suction of MCCM reinforced with 3D-printed triaxial geogrids. These experimental results were further analysed with a GP-optimized machine learning algorithm. The study preliminarily reveals the fundamental mechanical properties and reinforcement mechanisms of geogrid-reinforced MCCM, and the main conclusions are as follows:
-
With decreasing clay content, increasing reinforcement layers, and higher confining pressure, MCCM strength increases notably, with cohesion significantly enhanced and internal friction angle slightly affected. Overall mechanical and deformation performance of reinforced MCCM is greatly improved.
-
With increasing water content, MCCM strength first decreases, then rises, and finally decreases again. This trend mainly results from the weakening of marine coral sand at higher water content, while slight strength gains at low water content are due to matric suction in the clay. Apparent cohesion and internal friction angle vary similarly.
-
The clay content and the water content are the main factors influencing particle breakage of marine coral sand within the MCCM. This conclusion is also supported by the analysis of relative breakage rate and fractal dimension.
-
The GP-BPNN algorithm significantly outperforms GA-BPNN and PSO-BPNN, making it more suitable for machine learning-based strength prediction of reinforced MCCM. Sensitivity analysis further reveals that clay content and water content have the greatest influence on the strength of MCCM.
-
SEM observations show marine coral sand particles have varied shapes, rough surfaces, and many pores. Clay fills the gaps, creating a complex surface that increases friction and interfacial resistance with the triaxial geogrid, enhancing MCCM–geogrid interaction. Analysis indicates equivalent additional confining pressure rises with more geogrid reinforcement layers.
Through a series of experimental investigations and mechanical analyses, this study provides valuable insights into the mechanical behaviour and deformation characteristics of 3D-printed triaxial geogrid-reinforced MCCM.
Statements
Data availability statement
The original contributions presented in the study are included in the article/supplementary material. Further inquiries can be directed to the corresponding author.
Author contributions
DS: Funding acquisition, Visualization, Resources, Project administration, Validation, Data curation, Software, Writing – review & editing, Methodology, Supervision, Conceptualization, Investigation. KX: Validation, Project administration, Visualization, Methodology, Formal Analysis, Data curation, Supervision, Investigation, Conceptualization, Software, Writing – original draft. ZC: Methodology, Project administration, Supervision, Visualization, Data curation, Funding acquisition, Conceptualization, Investigation, Resources, Writing – review & editing, Validation. PC: Funding acquisition, Conceptualization, Supervision, Project administration, Visualization, Resources, Validation, Writing – review & editing, Investigation.
Funding
The author(s) declare financial support was received for the research and/or publication of this article. The authors would like to acknowledge the consistent support of National Natural Science Foundation of China: No 52471290, No 52301327; Project funded by China Postdoctoral Science Foundation: No 2024T170217, No 2023M730929; Failure Mechanics and Engineering Disaster Prevention, Key Lab of Sichuan Province: No FMEDP202209; Shanghai Sailing Program: No 22YF1415800, No 23YF1416100; Shanghai Natural Science Foundation: No 23ZR1426200, No 24ZR1427900; The Shanghai Soft Science Key Project: No 23692119700; Funded by Key Laboratory of Ministry of Education for Coastal Disaster and Protection, Hohai University, No 202302; Funded by Key Laboratory of Estuarine & Coastal Engineering, Ministry of Transport, No KLECE202302. Shanghai Frontiers Science Center of “Full Penetration” Far-Reaching Offshore Ocean Energy and Power.
Conflict of interest
The authors declare that the research was conducted in the absence of any commercial or financial relationships that could be construed as a potential conflict of interest.
Generative AI statement
The author(s) declare that no Generative AI was used in the creation of this manuscript.
Any alternative text (alt text) provided alongside figures in this article has been generated by Frontiers with the support of artificial intelligence and reasonable efforts have been made to ensure accuracy, including review by the authors wherever possible. If you identify any issues, please contact us.
Publisher’s note
All claims expressed in this article are solely those of the authors and do not necessarily represent those of their affiliated organizations, or those of the publisher, the editors and the reviewers. Any product that may be evaluated in this article, or claim that may be made by its manufacturer, is not guaranteed or endorsed by the publisher.
References
1
Abdelaal F. Solanki R. (2022). Effect of geotextile ageing and geomembrane surface roughness on the geomembrane-geotextile interfaces for heap leaching applications. Geotextiles Geomembr50, 55–68. doi: 10.1016/j.geotexmem.2021.09.001
2
Ahmadi M. A. Chen Z. (2019). Comparison of machine learning methods for estimating permeability and porosity of oil reservoirs via petro-physical logs. Petroleum5, 271–284. doi: 10.1016/j.petlm.2018.06.002
3
Akosah S. Zhou L. Chen J. Yao T. Gidigasu S. S. (2025). Undrained dynamic behavior of geogrid-reinforced coral sand. Mar. Georesour Geotechnol43, 244–259. doi: 10.1080/1064119X.2024.2326957
4
Al Khalifah H. Glover P. Lorinczi P. (2020). Permeability prediction and diagenesis in tight carbonates using machine learning techniques. Mar. Petrol Geol112, 104096. doi: 10.1016/j.marpetgeo.2019.104096
5
Baadiga R. Balunaini U. (2023). Evaluation of pavement design input parameters of biaxial and triaxial geogrid stabilized flexible pavements overlying soft subgrades. Cleaner Mater9, 100192. doi: 10.1016/j.clema.2023.100192
6
Bacas B. M. Konietzky H. Berini J. C. Sagaseta C. (2011). A new constitutive model for textured geomembrane/geotextile interfaces. Geotextiles Geomembr29, 137–148. doi: 10.1016/j.geotexmem.2010.10.014
7
Biabani M. M. Indraratna B. (2015). An evaluation of the interface behaviour of rail subballast stabilised with geogrids and geomembranes. Geotextiles Geomembr43, 240–249. doi: 10.1016/j.geotexmem.2015.04.002
8
Cavalcante A. L. B. Mascarenhas P. V. S. (2021). Efficient approach in modeling the shear strength of unsaturated soil using soil water retention curve. Acta Geotech16, 3177–3186. doi: 10.1007/s11440-021-01144-6
9
Chao Z. Dang Y. Pan Y. Wang F. Wang M. Zhang J. et al . (2023a). Prediction of the shale gas permeability: A data mining approach. Geomechan Energy Environ.33, 100435. doi: 10.1016/j.gete.2023.100435
10
Chao Z. Fowmes G. (2021). Modified stress and temperature-controlled direct shear apparatus on soil-geosynthetics interfaces. Geotextiles Geomembr49, 825–841. doi: 10.1016/j.geotexmem.2020.12.011
11
Chao Z. Fowmes G. (2022). The short-term and creep mechanical behaviour of clayey soil-geocomposite drainage layer interfaces subjected to environmental loadings. Geotextiles Geomembr50, 238–248. doi: 10.1016/j.geotexmem.2021.10.004
12
Chao Z. Gong B. Yue W. Xu X. Shi D. Yang C. et al . (2022a). Experimental study on stress-dependent gas permeability and porosity of artificially cracked cement mortar. Construct Building Mater359, 129290. doi: 10.1016/j.conbuildmat.2022.129290
13
Chao Z. Li Z. Dong Y. Shi D. Zheng J. (2024a). Estimating compressive strength of coral sand aggregate concrete in marine environment by combining physical experiments and machine learning-based techniques. Ocean Eng.308, 118320. doi: 10.1016/j.oceaneng.2024.118320
14
Chao Z. Liu H. Wang H. Dong Y. Shi D. Zheng J. (2024b). The interface mechanical properties between polymer layer and marine sand with different particle sizes under the effect of temperature: Laboratory tests and artificial intelligence modelling. Ocean Eng.312, 119255. doi: 10.1016/j.oceaneng.2024.119255
15
Chao Z. Ma G. He K. Wang M. (2021). Investigating low-permeability sandstone based on physical experiments and predictive modeling. Underground Space6, 364–378. doi: 10.1016/j.undsp.2020.05.002
16
Chao Z. Shi D. Fowmes G. Xu X. Yue W. Cui P. et al . (2023b). Artificial intelligence algorithms for predicting peak shear strength of clayey soil-geomembrane interfaces and experimental validation. Geotextiles Geomembr51, 179–198. doi: 10.1016/j.geotexmem.2022.10.007
17
Chao Z. Wang H. Hu S. Wang M. Xu S. Zhang W. (2024c). Permeability and porosity of light-weight concrete with plastic waste aggregate: Experimental study and machine learning modelling. Construct Building Mater411, 134465. doi: 10.1016/j.conbuildmat.2023.134465
18
Chao Z. Wang M. Sun Y. Xu X. Yue W. Yang C. et al . (2022b). Predicting stress-dependent gas permeability of cement mortar with different relative moisture contents based on hybrid ensemble artificial intelligence algorithms. Construct Building Mater348, 128660. doi: 10.1016/j.conbuildmat.2022.128660
19
Chao Z. Zhou J. Shi D. Zheng J. (2025). Particle size effect on the mechanical behavior of coral sand–geogrid interfaces (ICE Publishing, London: Geosynthetics International), 1–17.
20
Chen J. Bao N. Ma C. Sun R. (2024a). Triaxial behavior of unreinforced and geogrid-reinforced calcareous gravelly sand: Experiment and discrete element modelling. Construct Building Mater430, 136405. doi: 10.1016/j.conbuildmat.2024.136405
21
Chen J.-F. Akosah S. Ma C. Gidigasu S. S. (2023). Large-scale triaxial tests of reinforced coral sand with different grain size distributions. Mar. Georesour Geotechnol41, 544–554. doi: 10.1080/1064119X.2022.2068462
22
Chen J.-F. Gu Z.-A. Rajesh S. Yu S.-B. (2021). Pullout behavior of triaxial geogrid embedded in a transparent soil. Int. J. Geomechan21, 04021003. doi: 10.1061/(ASCE)GM.1943-5622.0001936
23
Chen X. Dai G. Liu H. Ouyang H. Gong W. (2024b). A microstructural investigation on hydraulic conductivity of calcareous clay. Appl. Ocean Res.150, 104133. doi: 10.1016/j.apor.2024.104133
24
Cheng L. Hossain M. Hu Y. Kim Y. Ullah S. N. (2022). A simple breakage model for calcareous sand and its FE implementation. J. Geotechnical Geoenvironment Eng.148, 04022065. doi: 10.1061/(ASCE)GT.1943-5606.0002834
25
Derksen J. Ziegler M. Fuentes R. (2021). Geogrid-soil interaction: A new conceptual model and testing apparatus. Geotextiles Geomembr49, 1393–1406. doi: 10.1016/j.geotexmem.2021.05.011
26
Ding X.-m. Luo Z.-g. Ou Q. (2022a). Mechanical property and deformation behavior of geogrid reinforced calcareous sand. Geotextiles Geomembr50, 618–631. doi: 10.1016/j.geotexmem.2022.03.002
27
Ding X. Luo Z. Ou Q. (2022b). Mechanical property and deformation behavior of geogrid reinforced calcareous sand. Geotextiles and Geomembranes (Amsterdam: Elsevier).
28
Dong Y. Wang D. Randolph M. F. (2017). Investigation of impact forces on pipeline by submarine landslide using material point method. Ocean Eng.146, 21–28. doi: 10.1016/j.oceaneng.2017.09.008
29
Fowmes G. J. Dixon N. Fu L. Zaharescu C. A. (2017). Rapid prototyping of geosynthetic interfaces: investigation of peak strength using direct shear tests. Geotextiles Geomembr45, 674–687. doi: 10.1016/j.geotexmem.2017.08.009
30
Frost J. D. Kim D. Lee S.-W. (2012). Microscale geomembrane-granular material interactions. KSCE J. Civil Eng.16, 79–92. doi: 10.1007/s12205-012-1476-x
31
Gao J. Zhu G. Wang J. Yang Y. Li Y. (2024). Study on the dynamic characteristics of geogrids combined with rubber particles reinforced with calcareous sand. Acta Geotech19, 7031–7047. doi: 10.1007/s11440-024-02368-y
32
Giroud J. Han J. Tutumluer E. Dobie M. (2023). The use of geosynthetics in roads. Geosynthetics Int.30, 47–80. doi: 10.1680/jgein.21.00046
33
Guangxin L. Lun C. Fei C. (1994). A new approach to analysis of stress and deformation of reinforced earth. Chin. J. Geotechnical Eng.16, 46–53.
34
Hardin B. O. (1985). Crushing of soil particles. J. Geotechnical Eng.111, 1177–1192. doi: 10.1061/(ASCE)0733-9410(1985)111:10(1177)
35
Hasanipanah M. Amnieh H. B. Arab H. Zamzam M. S. (2018). Feasibility of PSO–ANFIS model to estimate rock fragmentation produced by mine blasting. Neural Comput Appl.30, 1015–1024. doi: 10.1007/s00521-016-2746-1
36
Hasheminezhad A. Ceylan H. Kim S. Tutumluer E. (2025). Evaluation of 3D-printed model geogrids and composite geosynthetics made from recycled plastics: Bridging laboratory insights with field performance. Construct Building Mater465, 140258. doi: 10.1016/j.conbuildmat.2025.140258
37
Hecht-Nielsen R. (1992). Theory of the backpropagation neural network, Neural networks for perception. Elsevierpp, 65–93.
38
Jiang X. Zhang F. Huang B. Titi H. Polaczyk P. Ma Y. et al . (2024). Full-scale accelerated testing of geogrid-reinforced inverted pavements. Geotextiles Geomembr52, 511–525. doi: 10.1016/j.geotexmem.2024.01.005
39
Jie C. Quan J. Xia-ting F. Hong G. (2015). Theoretical probability distribution of shear strength parameters for rock. Rock Soil Mechanics36, 1261–1274.
40
Jin H. Guo L. Sun H. Shi L. Cai Y. (2022). Undrained cyclic shear strength and stiffness degradation of overconsolidated soft marine clay in simple shear tests. Ocean Eng.262, 112270. doi: 10.1016/j.oceaneng.2022.112270
41
Kardani N. Zhou A. Nazem M. Shen S.-L. (2020). Estimation of bearing capacity of piles in cohesionless soil using optimised machine learning approaches. Geotechnical Geol Eng.38, 2271–2291. doi: 10.1007/s10706-019-01085-8
42
Kermani B. Xiao M. Stoffels S. M. Qiu T. (2018). Reduction of subgrade fines migration into subbase of flexible pavement using geotextile. Geotextiles Geomembr46, 377–383. doi: 10.1016/j.geotexmem.2018.03.006
43
King D. J. Bouazza A. Gniel J. R. Rowe R. K. Bui H. H. (2017). Serviceability design for geosynthetic reinforced column supported embankments. Geotextiles Geomembr45, 261–279. doi: 10.1016/j.geotexmem.2017.02.006
44
Lambora A. Gupta K. Chopra K. (2019). Genetic algorithm-A literature review 2019 international conference on machine learning, big data, cloud and parallel computing (COMITCon) (Piscataway, NJ: IEEE), 380–384.
45
Li X. Liu A. Liu L. Liu Y. Wu Y.-K. (2022). A rapid method for determining the soil-water characteristic curves in the full suction range. Rock Soil Mechanics43, 1.
46
Liang H. Shen Y. Chen S. Shen J. Xu J. (2024). Effect of multiscale particle morphology on small-strain shear modulus of irregularly shaped sand under isotropic consolidation: triaxial bender element tests on 3d-printed sand. J. Eng. Mechanics150, 06024001. doi: 10.1061/JENMDT.EMENG-7306
47
Liu Z. Shao J. Xu W. Wu Q. (2015b). Indirect estimation of unconfined compressive strength of carbonate rocks using extreme learning machine. Acta Geotech10, 651–663. doi: 10.1007/s11440-014-0316-1
48
Liu H. Tian H. Liang X. Li Y. (2015a). New wind speed forecasting approaches using fast ensemble empirical model decomposition, genetic algorithm, Mind Evolutionary Algorithm and Artificial Neural Networks. Renewable Energy83, 1066–1075. doi: 10.1016/j.renene.2015.06.004
49
Lundberg S. M. Lee S.-I. (2017). A unified approach to interpreting model predictions. Adv. Neural Inf. Process. Syst.30, 4765–4774.
50
Luo Z.-g. Ding X.-m. Ou Q. Fang H.-q. (2023). Bearing capacity and deformation behavior of rigid strip footings on coral sand slopes. Ocean Eng.267, 113317. doi: 10.1016/j.oceaneng.2022.113317
51
Luo Z.-g. Ding X.-m. Ou Q. Lu Y.-w. (2024). Macro-microscopic mechanical behavior of geogrid reinforced calcareous sand subjected to triaxial loads: Effects of aperture size and tensile resistance. Geotextiles Geomembr52, 526–541. doi: 10.1016/j.geotexmem.2024.01.006
52
Lv Y. Li X. Fan C. Su Y. (2021). Effects of internal pores on the mechanical properties of marine calcareous sand particles. Acta Geotech16, 3209–3228. doi: 10.1007/s11440-021-01223-8
53
Oliveira G. M. Falorca I. M. (2025). Evaluation of two-layered soils reinforced with 3D printed geogrid models under axisymmetric loading conditions. Geotextiles Geomembr53, 798–810. doi: 10.1016/j.geotexmem.2025.01.008
54
Peng Y. Ding X. Yin Z.-Y. Wang P. (2022). Micromechanical analysis of the particle corner breakage effect on pile penetration resistance and formation of breakage zones in coral sand. Ocean Eng.259, 111859. doi: 10.1016/j.oceaneng.2022.111859
55
Poorahong H. Jamsawang P. Thanasisathit N. Jongpradist P. Jing G. (2024). Performance of a triaxial geogrid-reinforced crushed rock base underlain by a soft clay subgrade. Case Stud. Construct Mater20, e03198. doi: 10.1016/j.cscm.2024.e03198
56
Prakasha K. Chandrasekaran V. (2005). Behavior of marine sand-clay mixtures under static and cyclic triaxial shear. J. Geotechnical Geoenvironment Eng.131, 213–222. doi: 10.1061/(ASCE)1090-0241(2005)131:2(213)
57
Qi W. Qifei L. Haiyang Z. Chengshun X. Guoxing C. (2022). Experimental investigation of dynamic shear modulus of saturated marine coral sand. Ocean Eng.264, 112412. doi: 10.1016/j.oceaneng.2022.112412
58
Raja M. N. A. Shukla S. K. (2020). Ultimate bearing capacity of strip footing resting on soil bed strengthened by wraparound geosynthetic reinforcement technique. Geotextiles Geomembr48, 867–874. doi: 10.1016/j.geotexmem.2020.06.005
59
Rowe R. K. Fan J. (2021). Effect of geomembrane hole geometry on leakage overlain by saturated tailings. Geotextiles Geomembr49, 1506–1518. doi: 10.1016/j.geotexmem.2021.06.004
60
Rowe R. K. Fan J. (2022). A general solution for leakage through geomembrane defects overlain by saturated tailings and underlain by highly permeable subgrade. Geotextiles Geomembr50, 694–707. doi: 10.1016/j.geotexmem.2022.03.010
61
Saghatforoush A. Monjezi M. Shirani Faradonbeh R. Jahed Armaghani D. (2016). Combination of neural network and ant colony optimization algorithms for prediction and optimization of flyrock and back-break induced by blasting. Eng. Comput.32, 255–266. doi: 10.1007/s00366-015-0415-0
62
Samui P. (2012). Application of statistical learning algorithms to ultimate bearing capacity of shallow foundation on cohesionless soil. Int. J. Numerical Analytical Methods Geomechan36, 100–110. doi: 10.1002/nag.997
63
Shahnazari H. Rezvani R. (2013). Effective parameters for the particle breakage of calcareous sands: An experimental study. Eng. Geol159, 98–105. doi: 10.1016/j.enggeo.2013.03.005
64
Stathas D. Wang J. Ling H. I. (2017). Model geogrids and 3D printing. Geotextiles Geomembr45, 688–696. doi: 10.1016/j.geotexmem.2017.07.006
65
Tavakoli S. Khojasteh D. Haghani M. Hirdaris S. (2023). A review on the progress and research directions of ocean engineering. Ocean Eng.272, 113617. doi: 10.1016/j.oceaneng.2023.113617
66
Tyler S. W. Wheatcraft S. W. (1992). Fractal scaling of soil particle-size distributions: Analysis and limitations. Soil Sci. Soc. America J.56, 362–369. doi: 10.2136/sssaj1992.03615995005600020005x
67
Venkateswarlu H. Krishnaraj P. Latha G. M. (2023a). Three-dimensionally printed polypropylene sheets: insights on mechanical and interface shear behavior. J. Mater Civil Eng.35, 04023284. doi: 10.1061/JMCEE7.MTENG-15089
68
Venkateswarlu H. SaiKumar A. Latha G. M. (2023b). Sand-geogrid interfacial shear response revisited through additive manufacturing. Geotextiles Geomembr51, 95–107. doi: 10.1016/j.geotexmem.2023.04.001
69
Wang X. Cui J. Wu Y. Zhu C. Wang X. (2021). Mechanical properties of calcareous silts in a hydraulic fill island-reef. Mar. Georesour Geotechnol39, 1–14. doi: 10.1080/1064119X.2020.1748775
70
Wang X.-Z. Jiao Y.-Y. Wang R. Hu M.-J. Meng Q.-S. Tan F.-Y. (2011). Engineering characteristics of the calcareous sand in Nansha Islands, South China Sea. Eng. Geol120, 40–47. doi: 10.1016/j.enggeo.2011.03.011
71
Wang H. Shen J. (2018). An improved model combining evolutionary algorithm and neural networks for PV maximum power point tracking. IEEE Access7, 2823–2827. doi: 10.1109/ACCESS.2018.2881888
72
Wang D. Tan D. Liu L. (2018). Particle swarm optimization algorithm: an overview. Soft Comput22, 387–408. doi: 10.1007/s00500-016-2474-6
73
Wang D.-L. Tang C.-S. Pan X.-H. Liu B. Shi B. (2023). Coupling effect of fiber reinforcement and MICP stabilization on the tensile behavior of calcareous sand. Eng. Geol317, 107090. doi: 10.1016/j.enggeo.2023.107090
74
Wu Q. Ding X. Zhang Y. Chen Z. Zhang Y. (2021a). Numerical simulations on seismic response of soil-pile-superstructure in coral sand. Ocean Eng.239, 109808. doi: 10.1016/j.oceaneng.2021.109808
75
Wu Y. Li N. Wang X. Cui J. Chen Y. Wu Y. et al . (2021b). Experimental investigation on mechanical behavior and particle crushing of calcareous sand retrieved from South China Sea. Eng. Geol280, 105932. doi: 10.1016/j.enggeo.2020.105932
76
Wu Q. Liu Q. Zhuang H. Chen G. Du X. (2023). Liquefaction characteristics of saturated marine coral sand with different non-plastic fines content subjected to complex cyclic stress paths. Ocean Eng.281, 114794. doi: 10.1016/j.oceaneng.2023.114794
77
Xu D.-s. Huang M. Zhou Y. (2020). One-dimensional compression behavior of calcareous sand and marine clay mixtures. Int. J. Geomechan20, 04020137. doi: 10.1061/(ASCE)GM.1943-5622.0001763
78
Xu C. Liang C. Shen P. (2019). Experimental and theoretical studies on the ultimate bearing capacity of geogrid-reinforced sand. Geotextiles Geomembr47, 417–428. doi: 10.1016/j.geotexmem.2019.01.003
79
Xu G. Shi J. Li Y. (2023a). Change pattern of geomembrane surface roughness for geotextile/textured geomembrane interfaces. Geotextiles Geomembr51, 88–99. doi: 10.1016/j.geotexmem.2022.09.009
80
Xu L. Wang R. Liu Q. Chen J. Wang X. Meng Q. (2023b). Effect of particle size distribution on monotonic direct shear characteristics of geotextile/geogrid-calcareous sand interface. Appl. Ocean Res.137, 103601. doi: 10.1016/j.apor.2023.103601
81
Yang H. Li H. Zhao Z. (2025). Modeling prediction of bond strength between rebar and recycled aggregate concrete by deep learning approach based on attention mechanism. Construct Building Mater471, 140753. doi: 10.1016/j.conbuildmat.2025.140753
82
Yang Z. Qin Y. Xue C. Xiao X. Ding J. Chen G. (2024). Experimental study on the generalized dynamic modulus of saturated marine coral sand subjected to different cyclic loading patterns. Ocean Eng.310, 118507. doi: 10.1016/j.oceaneng.2024.118507
83
Zhang R. Zhou Y. Guo Y. Zheng J. Deng Y. Lan T. (2025). Influence of geogrid reinforcement on the cracking characteristics of expansive soils: A laboratory study. Geotextiles Geomembr53, 545–558. doi: 10.1016/j.geotexmem.2024.11.014
84
Zhang M. Zhu H. Yang J. Qiu C. Javadi A. A. (2023). Experimental study of a 3D printed geogrid embedded with FBG sensor for reinforcement of subgrade with underlying cave. Geotextiles Geomembr51, 81–92. doi: 10.1016/j.geotexmem.2023.05.001
85
Zhou L. Chen J.-F. Zhu Y. Yao T. (2024). Liquefaction and post-liquefaction behaviors of unreinforced and geogrid reinforced calcareous sand. Geotextiles Geomembr52, 286–303. doi: 10.1016/j.geotexmem.2023.11.002
86
Zhou J. Shi X. Du K. Qiu X. Li X. Mitri H. S. (2017). Feasibility of random-forest approach for prediction of ground settlements induced by the construction of a shield-driven tunnel. Int. J. Geomechan17, 04016129. doi: 10.1061/(ASCE)GM.1943-5622.0000817
Summary
Keywords
triaxial geogrid reinforcement, marine coral sand-clay mixture, 3D printing technology, triaxial shear tests, particle breakage, machine learning
Citation
Shi D, Xu K, Chao Z and Cui P (2025) Experimental study on mechanical properties of triaxial geogrid reinforced marine coral sand-clay mixture based on 3D printing technology. Front. Mar. Sci. 12:1660611. doi: 10.3389/fmars.2025.1660611
Received
06 July 2025
Accepted
30 July 2025
Published
20 August 2025
Volume
12 - 2025
Edited by
Xianwei Zhang, Chinese Academy of Sciences (CAS), China
Reviewed by
Zhuang Cheng, Wuhan Institute of Technology, China
Gaowen Zhao, Changan University, China
Hangyu Mao, Hohai University, China
Updates
Copyright
© 2025 Shi, Xu, Chao and Cui.
This is an open-access article distributed under the terms of the Creative Commons Attribution License (CC BY). The use, distribution or reproduction in other forums is permitted, provided the original author(s) and the copyright owner(s) are credited and that the original publication in this journal is cited, in accordance with accepted academic practice. No use, distribution or reproduction is permitted which does not comply with these terms.
*Correspondence: Zhiming Chao, zmchao@shmtu.edu.cn; Peng Cui, cuipeng@umu.se
Disclaimer
All claims expressed in this article are solely those of the authors and do not necessarily represent those of their affiliated organizations, or those of the publisher, the editors and the reviewers. Any product that may be evaluated in this article or claim that may be made by its manufacturer is not guaranteed or endorsed by the publisher.