Abstract
Estuarine saltwater intrusion is mainly controlled by river discharge, tide and wind. It is important for utilization of estuarine freshwater to study quantitative relationship between unsuitable water intake time and river discharge. A two-way nested unstructured quadrilateral grid, finite-differencing, three-dimensional estuarine and coastal ocean model (UFDECOM-i) was applied to simulate the saltwater intrusion in the Changjiang Estuary and to get the quantitative relationship between unsuitable water intake time at Qingcaosha Reservoir and river discharge under different northerly wind speeds. The results of numerical experiments show that the salinity at the water intake of Qingcaosha Reservoir is very sensitive to the variation in river discharge. Under 7 day northerly wind of 10 m/s, when the river discharge is 8000 m3/s, the entire estuary is occupied by saline water; the net unit width salt flux (NUSF) landward flows in the North Channel, then flows into the South Channel toward sea, forming a horizontal salt transport route of “flowing into the North Channel and out in the South Channel” due to the strong landward Ekman transport. When the river discharge is 12000 m3/s, the horizontal salt transport route is weakened with the increase of river discharge. Under 7 day northerly wind of 15 m/s, saltwater intrusion increases significantly with the increase of wind speed, and the pattern of NUSF become much stronger. The salinity increases enormously after the action of persistent strong northerly wind. The quantitative relationship between river discharge and the longest continuous unsuitable water intake time of Qingcaosha Reservoir is expressed by formula under climatic wind, 7 day northerly wind of 10 m/s and 15 m/s, respectively, with correlation coefficient R2 of greater than 0.97, which can provide a basis for reservoir water intake and water supply safety.
1 Introduction
The estuarine area is densely populated and economically developed, with a huge demand for freshwater (Small and Nicholls, 2003; Zhu et al., 2020; Ma et al., 2025). Freshwater resources in some estuarine areas are from estuaries, but are subject to frequent saltwater intrusions. Saltwater intrusion is a common phenomenon in estuaries which is mainly controlled by tide and river discharge (Prandle, 1985; Simpson et al., 1990; Geyer, 1993), but it can also be affected by wind stress (Chen and Sanford, 2009; Aristizábal and Chant, 2015; Duran-Matute et al., 2016; Giddings and Maccready, 2017; Zhu et al., 2020; Ma et al., 2025) and vertical mixing (Simpson and Hunter, 1974; Prandle and Lane, 2015; Ayouche et al., 2020, 2021; Ayouche et al., 2022). River discharge inhibits saltwater intrusion in estuaries, and the larger it is, the weaker the saltwater intrusion is. The larger the tide, the farther the saltwater goes upstream with the flood current, the stronger the mixing, resulting in the farther the saltwater intrusion. Wind-driven sea-level setups at the mouth of estuaries can produce landward flows that outcompetes runoff, resulting in the net, landward transport of saltwater (Aristizábal and Chant, 2015; Zhu et al., 2020). For multi-bifurcated estuaries, horizontal circulation is influenced by winds, which alters saltwater transports in each channel (Duran-Matute et al., 2016). The upwelling and downwelling favorable wind can significantly influence the estuarine exchange flow (Giddings and Maccready, 2017).
The Changjiang Estuary is characterized by multiple bifurcations (Figure 1). Saltwater intrusion in the Changjiang Estuary is also mainly determined by river discharge and tides (Shen et al., 2003; Wu et al., 2006; Qiu et al., 2012; Chen et al., 2019; Ma et al., 2025), but is also influenced by wind (Xue et al., 2009; Wu and Zhu, 2010; Li et al., 2012; Zhang et al., 2019; Li et al., 2020; Zhu et al., 2020; Ma et al., 2025). Changjiang River is one of the largest rivers in the world, discharging large amounts of freshwater (9.24×10¹¹ m3)(Reviewer 2) into the East China Sea each year (Shen et al., 2003), with seasonal variations in river discharge ranging from a maximum monthly mean of 49,850 m3/s in July to a minimum of 11,180 m3/s in January (Zhu et al., 2015). The tides in the estuary are semidiurnal, semimonthly spring-neap circles. The maximum tidal range reaches 3.38 m and the minimum tidal range is 0.64 m at the Baozhen hydrological station (Zhu et al., 2015). The maximum tidal current amplitude reaches approximately 2.0 m/s at the river mouth during spring tide. The prevailing monsoon is a northerly wind of 5.5 m/s during winter and a southeasterly wind of 5.0 m/s during summer (Zhu et al., 2015). Xue et al. (2009) pointed out that a northerly wind tends to enhance the saltwater intrusion in the North Branch by reducing the seaward surface elevation gradient forcing. Wu and Zhu (2010) and Li et al. (2012) simulated the pure wind-driven current that flows into the North Channel and out of the South Channel with northerly wind to explain that it can enhance saltwater intrusion in the North Channel, and weaken it in the South Channel. Zhang et al. (2019) reported that the frequency of saltwater intrusion events in the Changjiang Estuary is increasing in recent years due to increasing frequency of winter storms passing East China Sea. Zhu et al. (2020) pointed out that persistent 15day strong northerly wind produced extremely severe saltwater intrusion in February 2014.
Figure 1
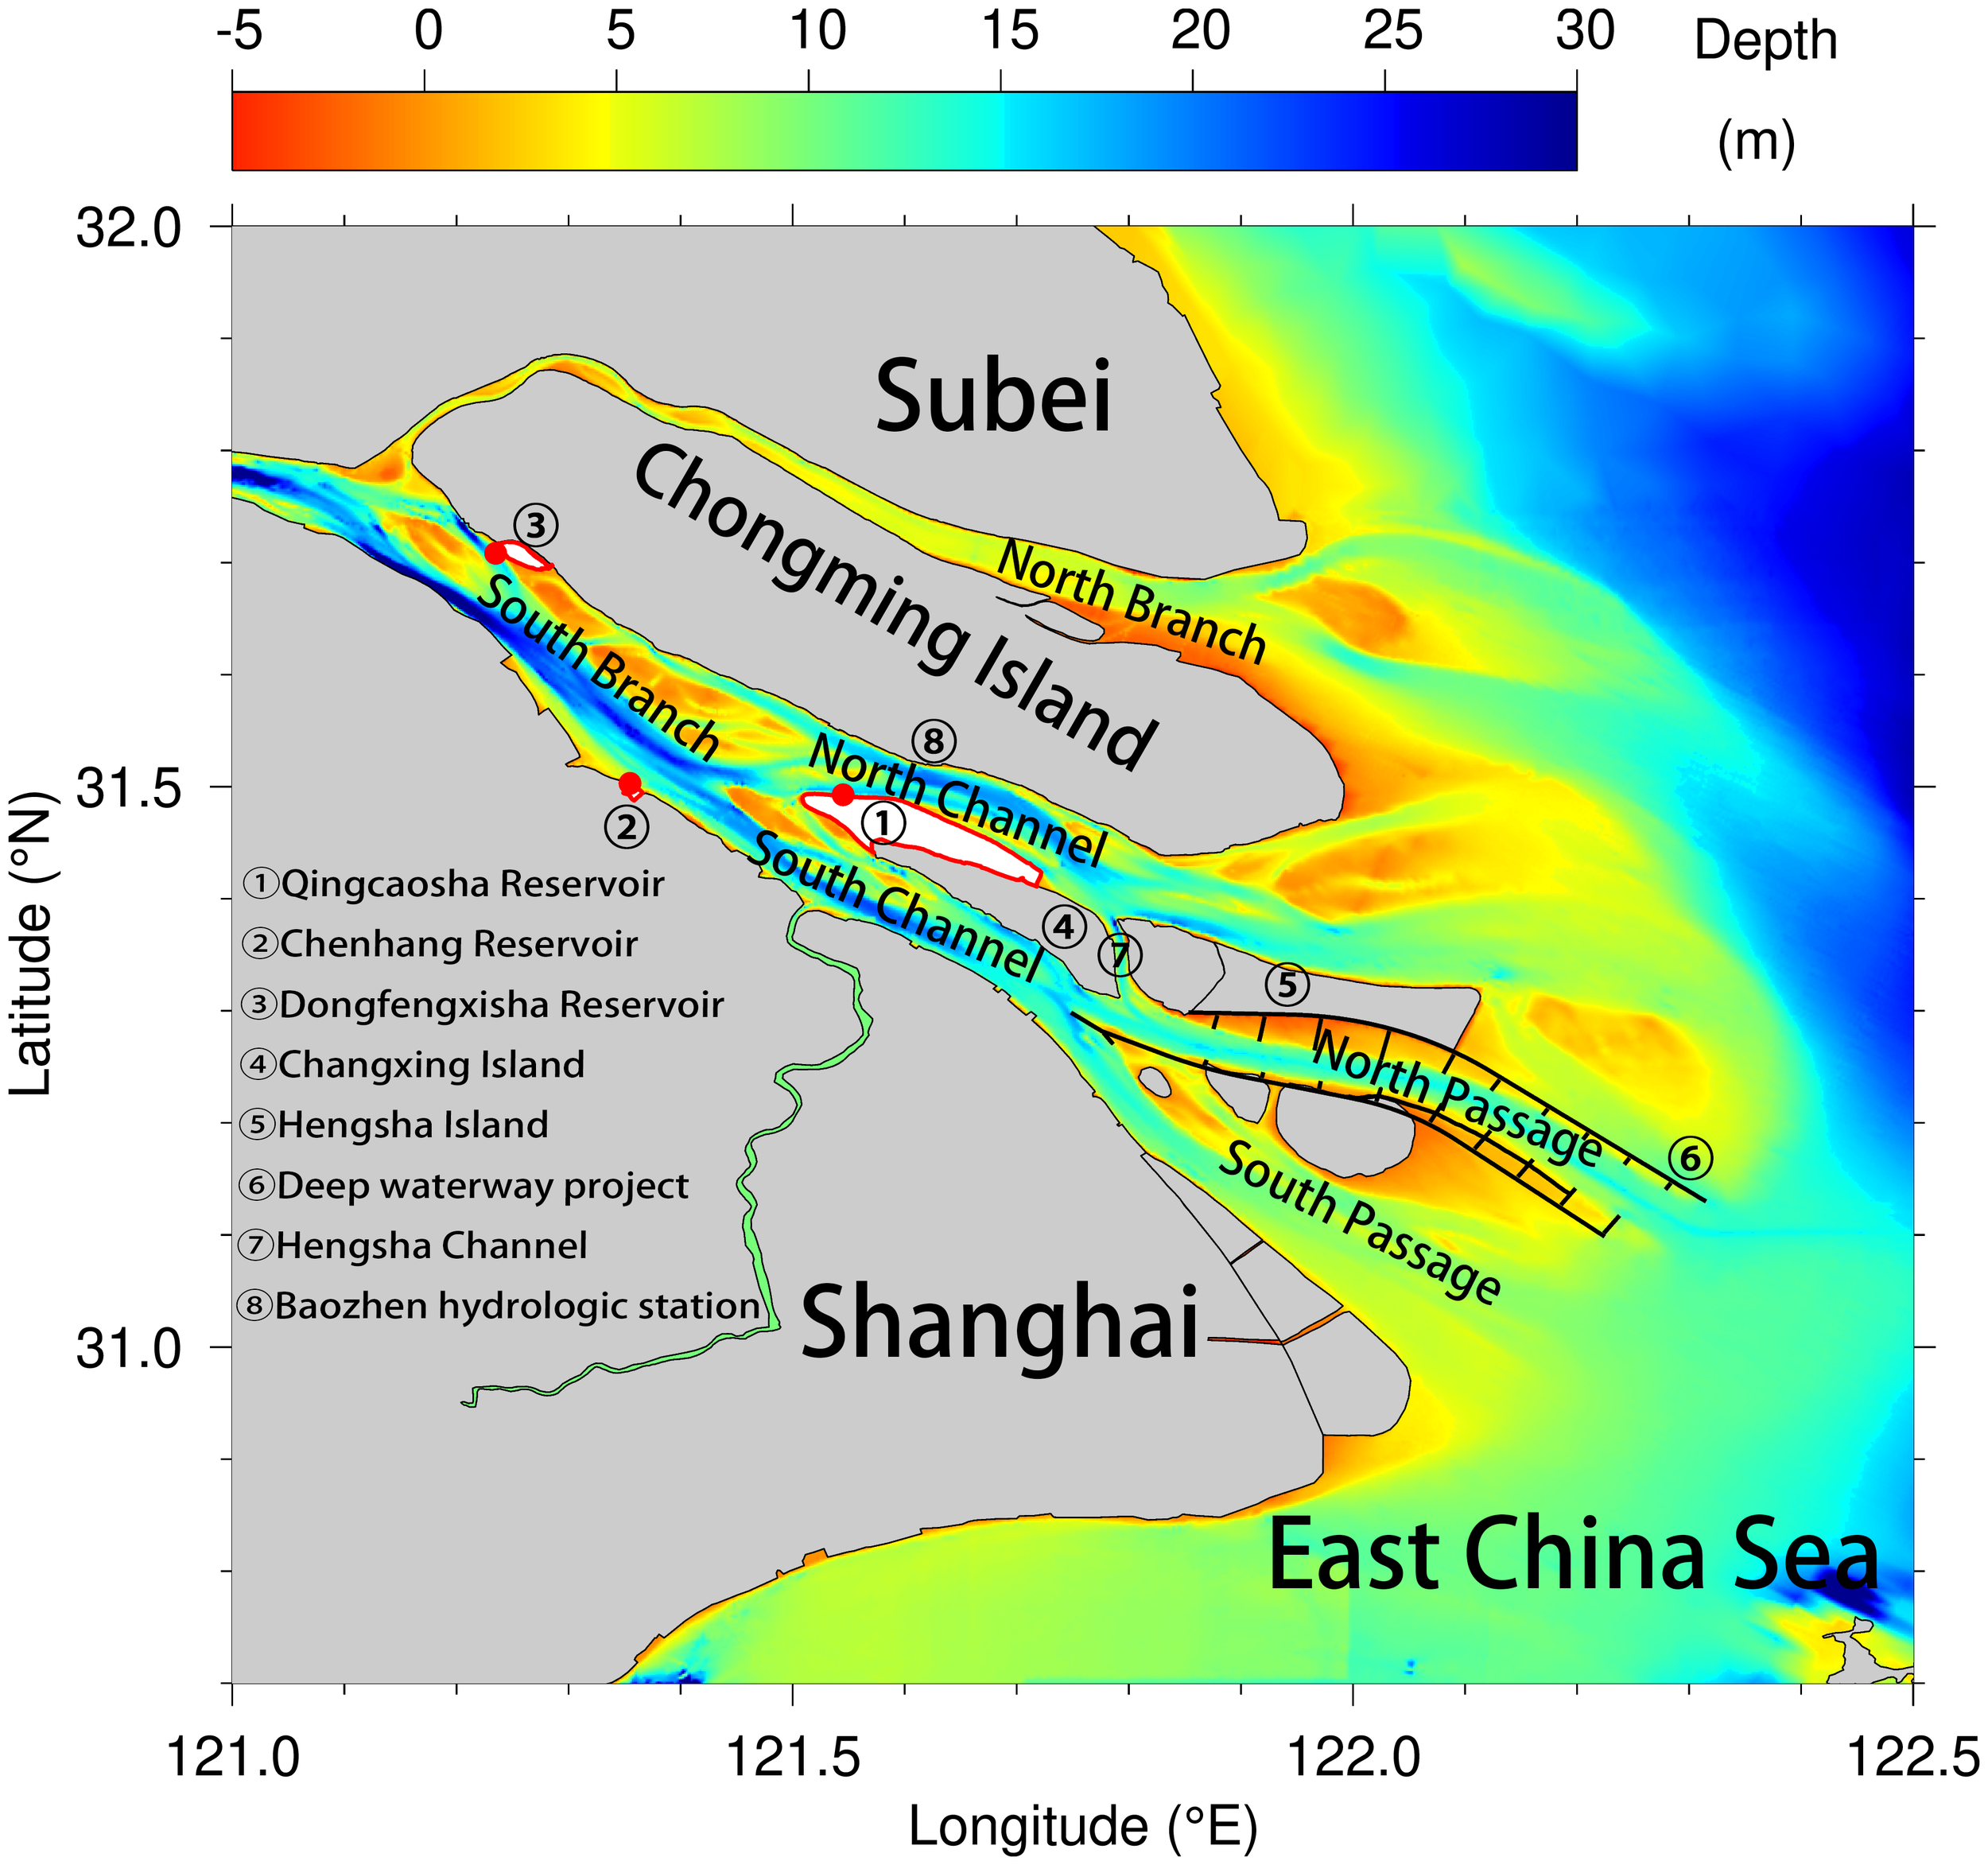
Topography of the Changjiang Estuary. The red dots indicate the locations of the reservoir water intakes.
Shanghai locates in the Changjiang Estuary, has a population of over 25 million people. To meet the growing demand for freshwater, Shanghai built the largest estuarine reservoir in the world, the Qingcaosha Reservoir in 2010 (shown in Figure 1). This reservoir has an effective capacity of 4.35×10⁸ m3 and provides a daily water supply of 7.19×10⁶ m3 for the 13 million people in the main districts of Shanghai, accounting for 55% of the total freshwater in the city. However, the Qingcaosha Reservoir is frequently influenced by saltwater intrusions, particularly during the dry season. Limited by reservoir capacity, long-lasting saltwater intrusions are extremely harmful (Chen et al., 2019).
In order to ensure the water intake safety of Qingcaosha Reservoir, this paper numerically simulates and gives the quantitative relationship between the unsuitable water intake time and river discharge at the water intake of Qingcaosha Reservoir under different wind conditions.
2 Methods
2.1 Numerical model
A two-way nested unstructured quadrilateral grid, finite-differencing, three-dimensional estuarine and coastal ocean model (UFDECOM) was developed by Ding et al. (2021). Based on the model, Ma et al. (2024) proposed an implicit, grid-nesting elevation solution with flux balance and a matching nesting boundary flux conservation interpolation to upgrade the model to UFDECOM-i. The model adopts sigma coordinates in the vertical direction and a curvilinear mesh in the horizontal direction. The vertical turbulent viscosity and diffusion coefficients are calculated using the Mellor-Yamada 2.5-level turbulence closure model (Mellor and Yamada, 1982). In this paper UFDECOM-i was used to simulate the saltwater intrusion in different river discharge and wind. The model domain covers the Bohai Sea, Yellow Sea, Changjiang Estuary and most of the East China Sea. The western boundary was set at Datong station as the river boundary specified with daily averaged river discharge (Figure 2A). The area around the Changjiang Estuary was partially encrypted at a ratio of 1:3 with a resolution of 100 to 400 m (Figure 2B). The resolution was approximately 20 km far away from the estuary. The sea open boundary of the model was driven by ocean elevation composed of tidal elevation and residual elevation, as shown below: (Equation 1)
Figure 2
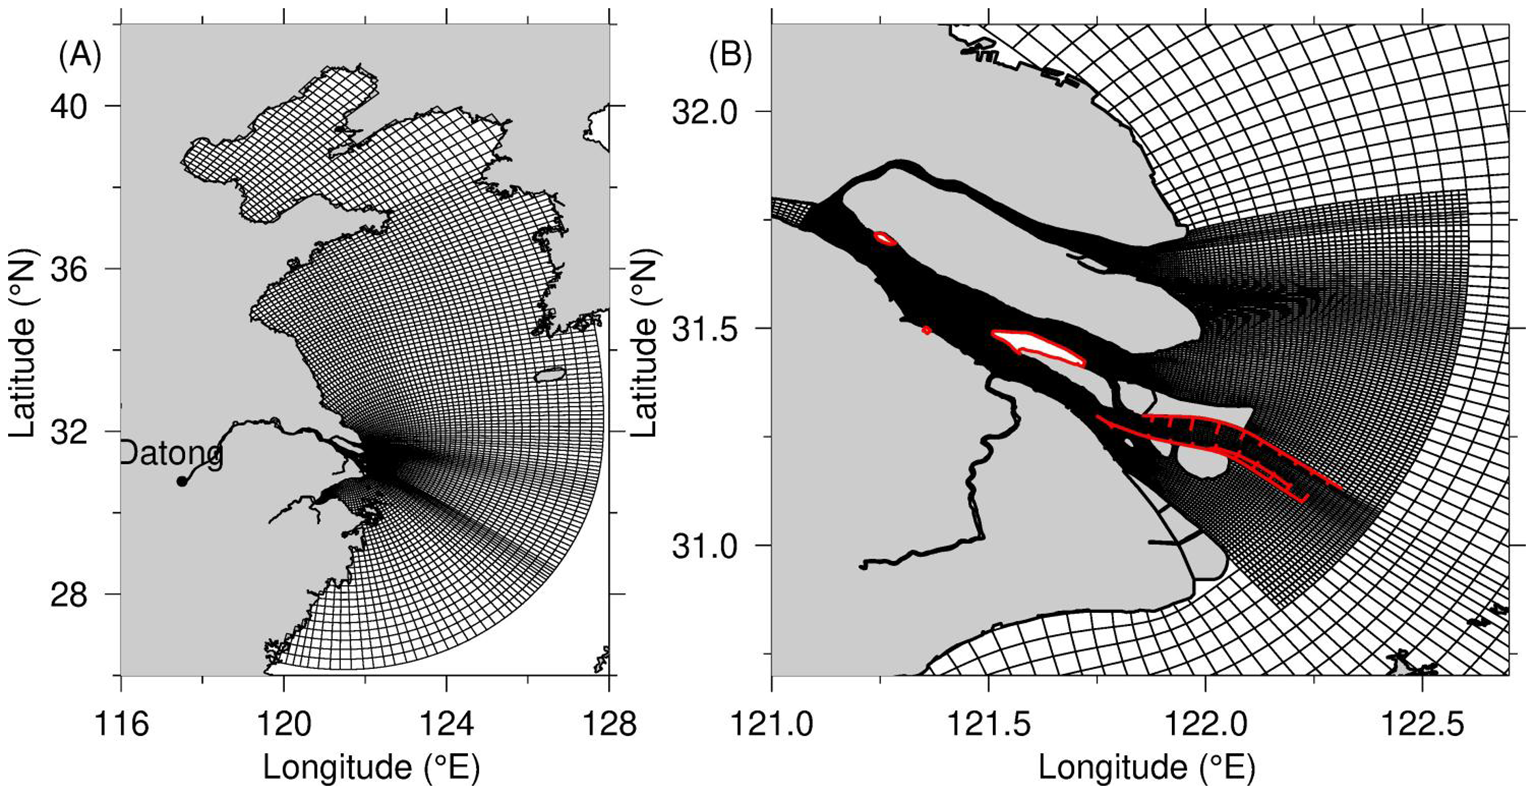
(A) Numerical model domain and curvilinear grids before local refinement. (B) Enlarged views of the nested unstructured quadrilateral grids after local refinement in the Changjiang Estuary.
where is the total ocean elevation and is the residual elevation reflecting the continental shelf current. The tidal elevation consisted of 17 tidal components, including M2, S2, N2, K2, K1, O1, P1, Q1, MU2, NU2, T2, L2, 2N2. ωi is the tidal frequency, and ai and gi are harmonic constants representing the amplitude and phase of each tidal component, respectively, taken from FES2022 (https://www.aviso.altimetry.fr/en/index.php?id=1279). The residual elevation was adopted from the monthly mean data of HYCOM (https://data.hycom.org/datasets). Our model was driven by ocean circulation, tides, river discharge and meteorological factors to simulate elevation, current and salinity. The initial salinity field was taken from the Ocean Atlas in the Huanghai Sea and East China Sea (Hydrology) (Editorial Board for Marine Atlas, 1992).
2.2 Model validation and numerical experiment setup
The numerical model has been validated for the elevation, current and salinity (Ding et al., 2021; Ma et al., 2024, 2025). The model validation showed that the model could correctly simulate the hydrodynamics and saltwater intrusion processes. For saving the space of this paper, it can be referred to the above literatures for mode validation.
The variation of salinity at the water intake of Qingcaosha Reservoir is closely related to river discharge and wind conditions. Water intake is not allowed when the salinity at the intake exceeds 0.45. Starting from the time when water intake is not allowed, a continuous unsuitable water intake time is counted if the salinity remains above 0.45 for six hours. The longest continuous unsuitable water intake time is defined as the maximum duration. In order to reveal the quantitative relationship between the longest continuous unsuitable water intake time and river discharge, three groups of numerical experiments were designed under different wind conditions (Table 1). The simulation time of each experiment is from August 1 to October 31, a total of 92 days. The model is run from August for mode adjustment, and the model data from September to October 15 are output for analysis. Experimental group 1: simulate relationship between the longest continuous unsuitable water intake time and river discharge under climatic wind conditions, which was averaged the recent 20 years wind field at 10m above sea surface from the European Center for Medium-Range Weather Forecast (ECMWF) reanalysis datasets with a spatial resolution of 0.125° × 0.125° and a temporal resolution of 6 h. Experimental group 2 and experimental group 3: simulate the relationship between the longest unsuitable water intake time and river discharge under 7 day northerly wind of 10 m/s and 15 m/s during middle tide after spring tide and neap tide, respectively. Figure 3 shows the temporal variation in elevation at Baozhen hydrologic station, in which the shaded zone is the 7 day period of strong northerly wind action from middle tide after spring tide to neap tide.
Table 1
| Experimental group | River discharge (m3/s) | The longest continuous unsuitable water intake time (day) | Wind condition |
|---|---|---|---|
| Group 1 | 7000 | 43.99 | climatic wind |
| 7200 | 43.99 | ||
| 7500 | 40.15 | ||
| 7800 | 40.09 | ||
| 8000 | 39.09 | ||
| 9000 | 11.14 | ||
| 10000 | 5.29 | ||
| 11000 | 2.21 | ||
| 12000 | 0.00 | ||
| Group 2 | 7000 | 43.99 | 7 day northerly wind 10 m/s during middle tide after spring tide to neap tide |
| 8000 | 39.62 | ||
| 10000 | 19.24 | ||
| 12000 | 14.13 | ||
| 15000 | 5.74 | ||
| 18000 | 0.15 | ||
| 20000 | 0.04 | ||
| Group 3 | 7000 | 43.99 | 7 day northerly wind 15 m/s during middle tide after spring tide to neap tide |
| 8000 | 38.80 | ||
| 10000 | 23.58 | ||
| 12000 | 16.09 | ||
| 15000 | 12.86 | ||
| 18000 | 8.76 | ||
| 20000 | 7.01 | ||
| 25000 | 1.39 | ||
| 30000 | 0.26 |
Setup of numerical experiments of river discharges under different wind conditions and the simulated corresponding the longest continuous unsuitable water intake time.
The longest continuous unsuitable water intake time has an error of approximately 1.01 days.
Figure 3
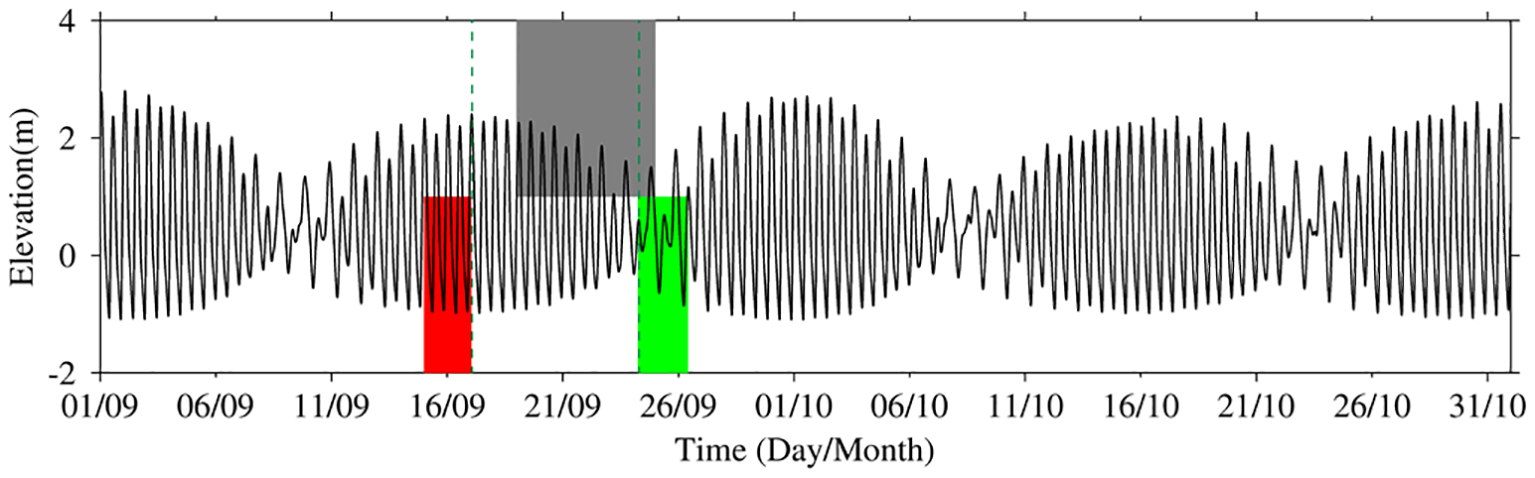
Temporal variation in elevation at Baozhen hydrologic station. The gray shadowed region is the 7 day period of strong northerly wind action from 18 to 24 September during middle tide after spring tide to neap tide; the green dashed line is time of flood slack during spring and neap tides; the red and green shadowed region is tidally-averaged period during spring tide and neap tide, respectively.
3 Results
3.1 Saltwater intrusion under climatic wind conditions (experimental group 1)
3.1.1 Horizontal salinity distribution
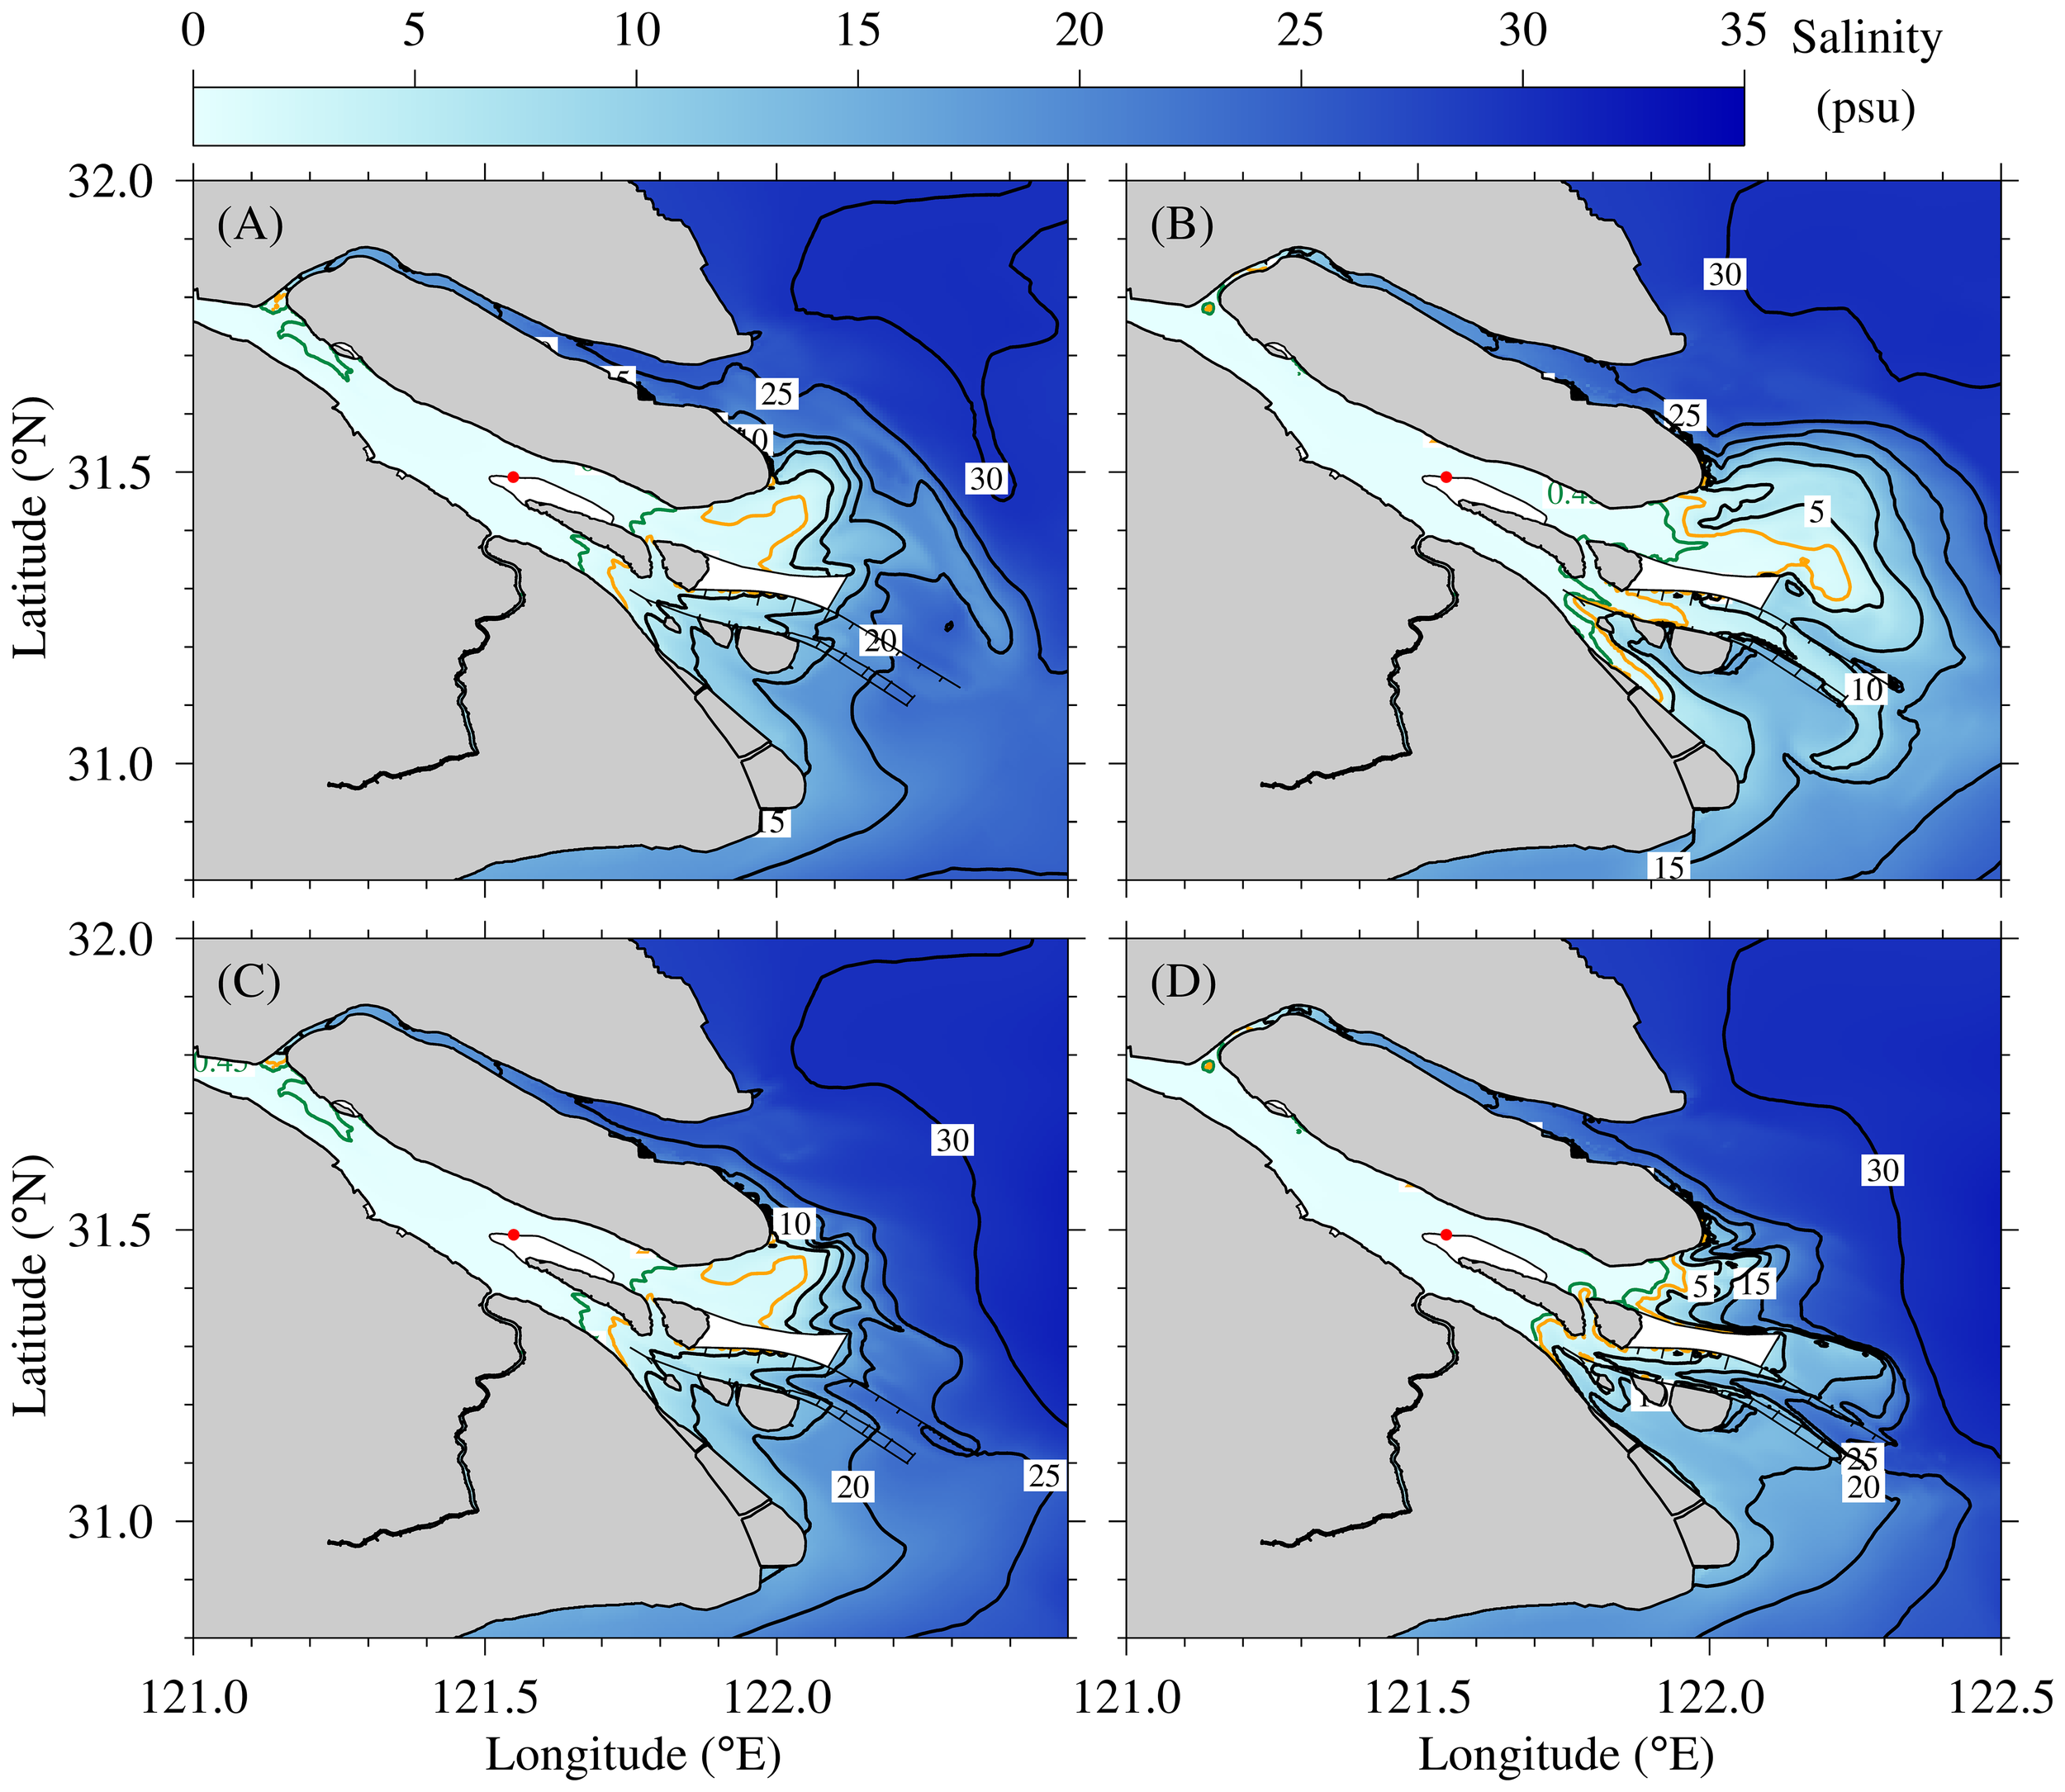
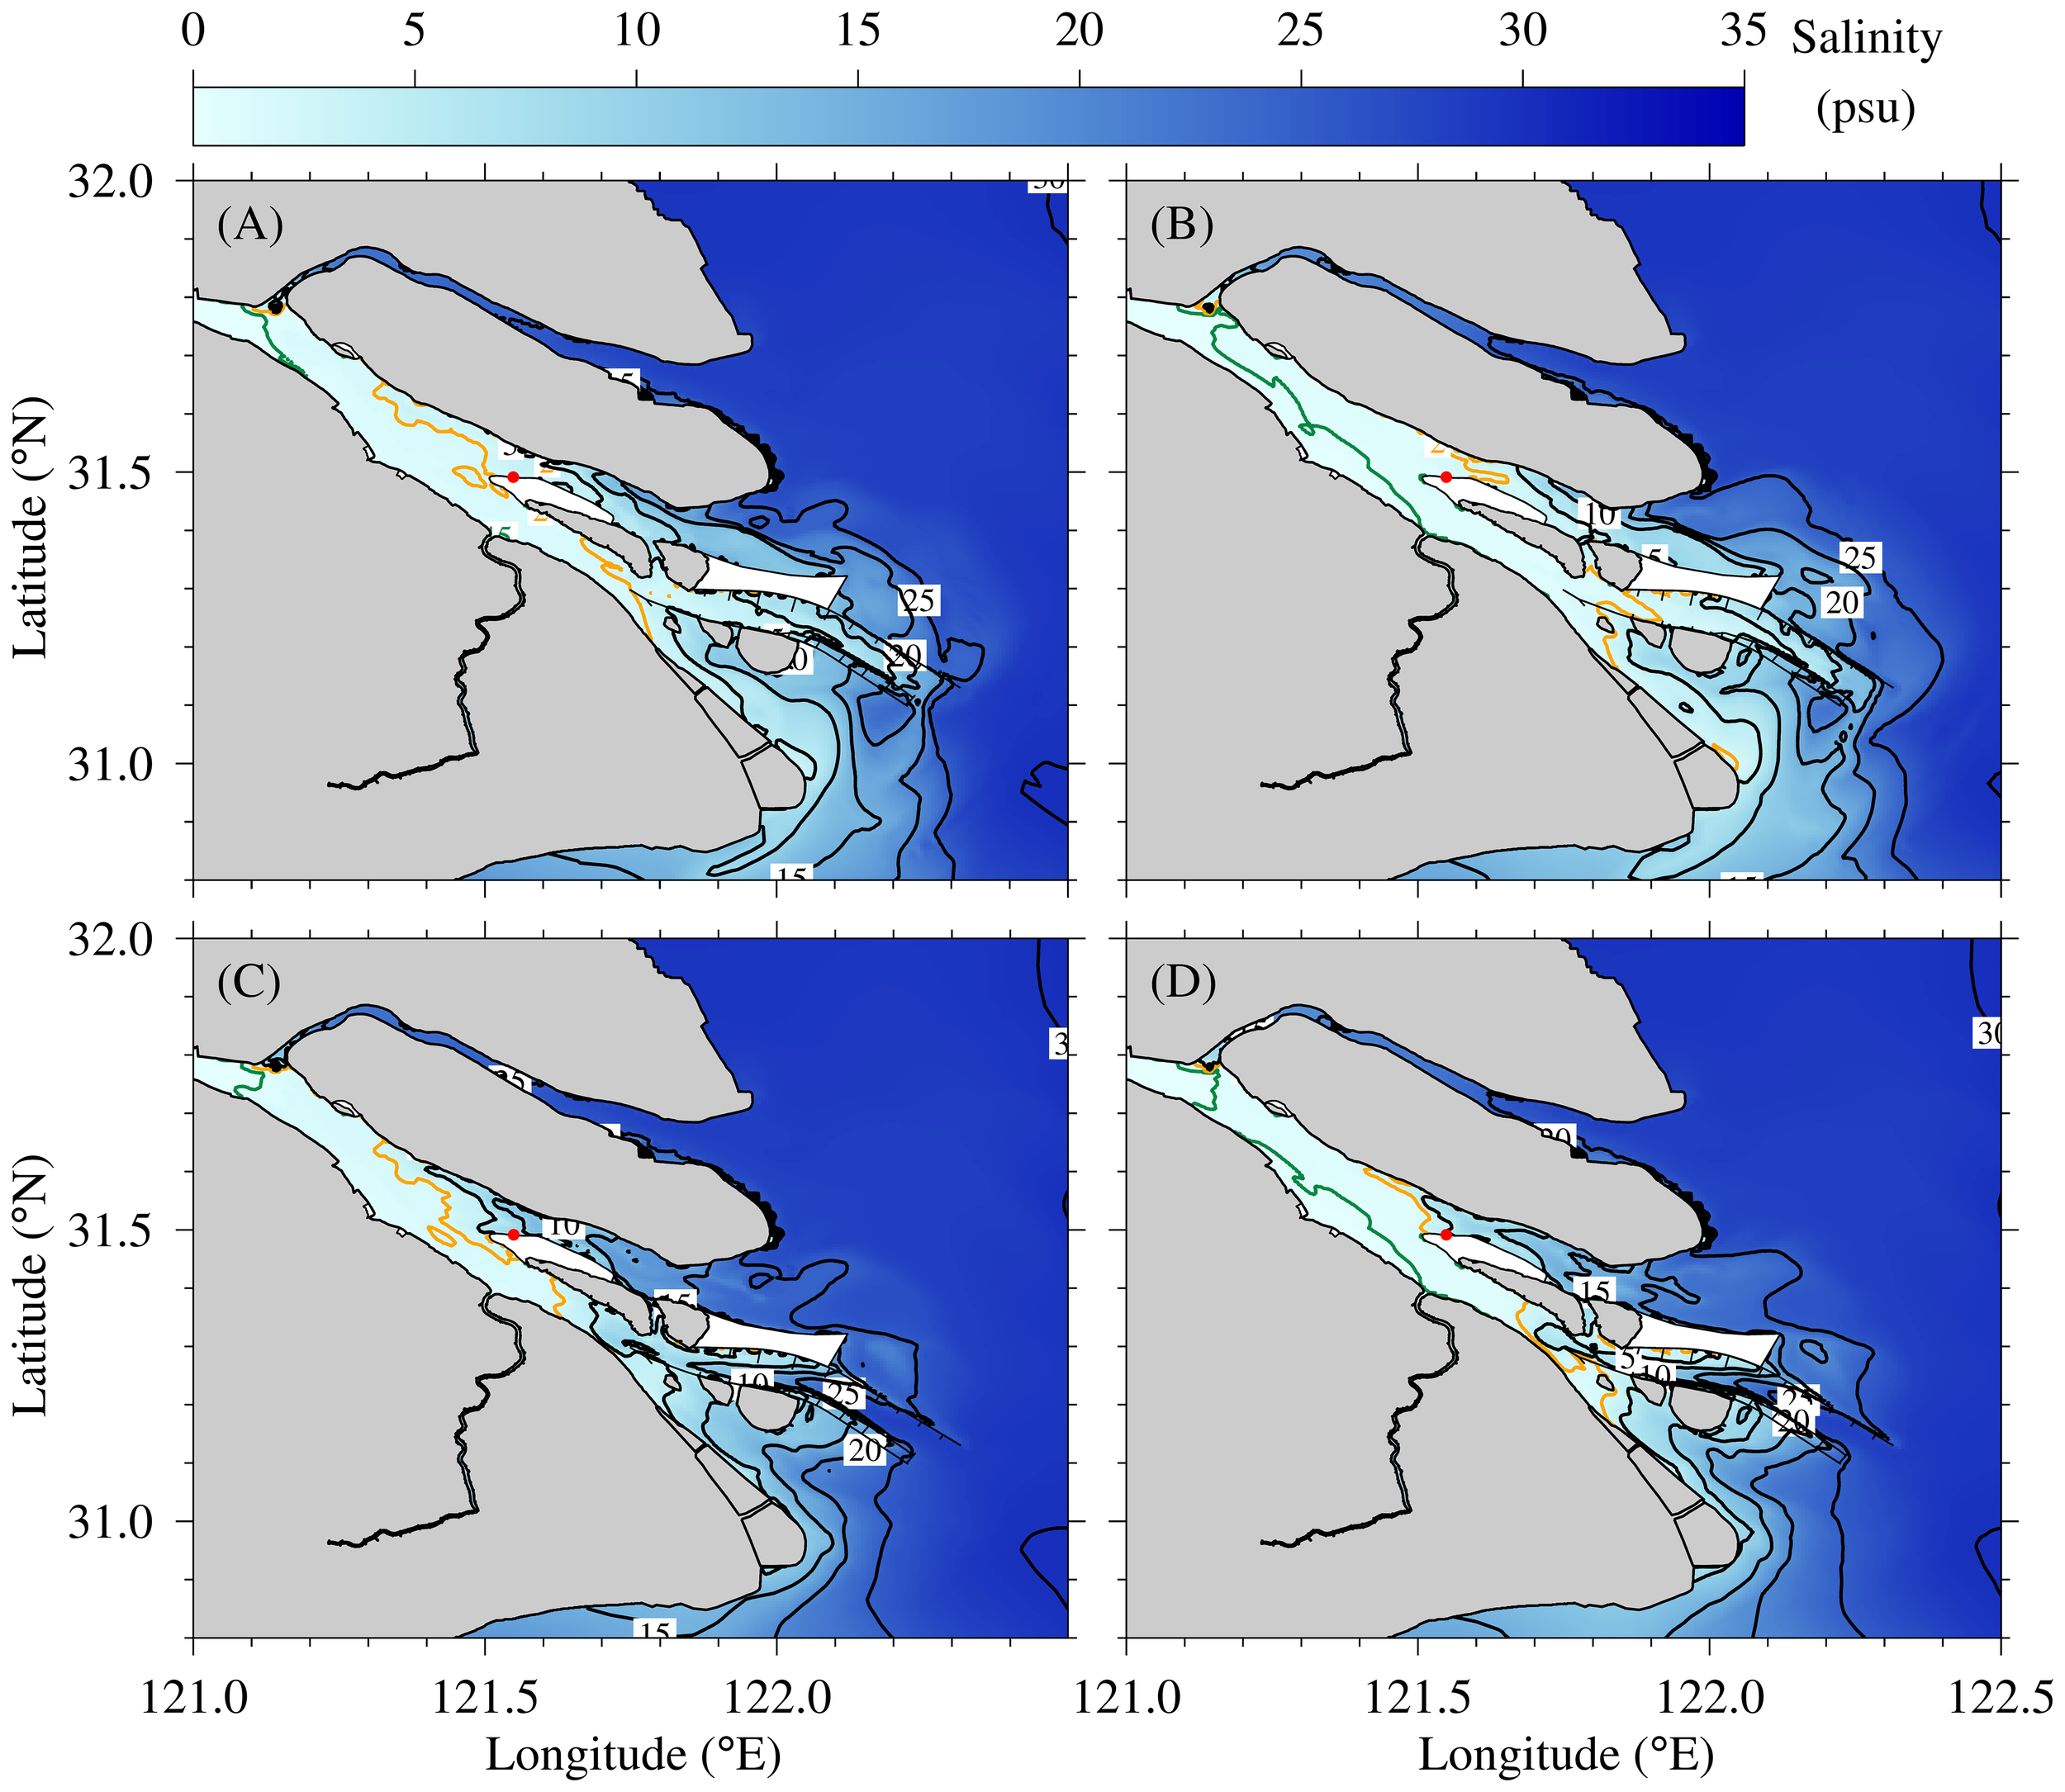
We designed 8 numerical experiments of river discharge from 7000 to 13000 m3/s in Experimental group 1 (Table 1). The distribution of salinity in surface and bottom layer at flood slack during spring tide and neap tide when river discharge is 8000 m3/s were showed in Figure 4. The North Branch is occupied by high saline water due to its funnel shape and low river discharge into it (Wu and Zhu, 2010; Li et al., 2012; Gu et al., 2021). At flood slack during spring tide, there is freshwater (salinity is lower than 0.45, the salinity standard of drink water) in the upper reaches and south side on the middle reaches of the South Branch, and vertical salinity is almost uniformly mixed. But there is saltwater on the north side at upper reaches of the South Branch, that is the most characteristic type of saltwater intrusion in the estuary, the saltwater spillover from the North Branch into the South Branch (Shen et al., 2003; Wu et al., 2006; Lyu and Zhu, 2018). The shallow and funnel-shaped topography helps to prevent runoff from entering the North Branch, especially in the case of low river discharge, and produces a greater tidal range in the North Branch than in the South Branch. The saltwater from the North Branch is transported downstream by runoff and arrives in the middle reaches of the South Branch during the subsequent neap tide, threatening the water supplies of reservoirs located in the estuary. Salinity is higher than 2.0 in the North Channel and South Channel due to low river discharge, and salinity in the bottom layer is slightly higher than that in the surface layer due to strong vertical mixing during spring tide (Li et al., 2021; Ma et al., 2025). There exist strong salinity fronts in the North Channel, North Passage and South Passage where freshwater from upstream river and higher saline water from open sea meet and mix. The salinity at water intake of Qingcaosha Reservoir is slightly higher than 2.0 in the surface and bottom layer. At flood slack during neap tide, the isohalines of 0.45, 2, 5 move seaward, meaning that the saltwater intrusion is weaker in neap tide than in spring tide. The salinity at water intake of Qingcaosha Reservoir is slightly higher than 0.45 in the surface layer, indicating that there is no freshwater. On the whole, the saltwater intrusion in the South Channel is stronger than in the North Channel because the net water radio in the North Channel is higher than in the South Channel (Wu et al., 2023; Yang et al., 2023), and there is no freshwater available for Qingcaosha Reservoir when the river discharge is as low as 8000 m3/s.
Figure 4
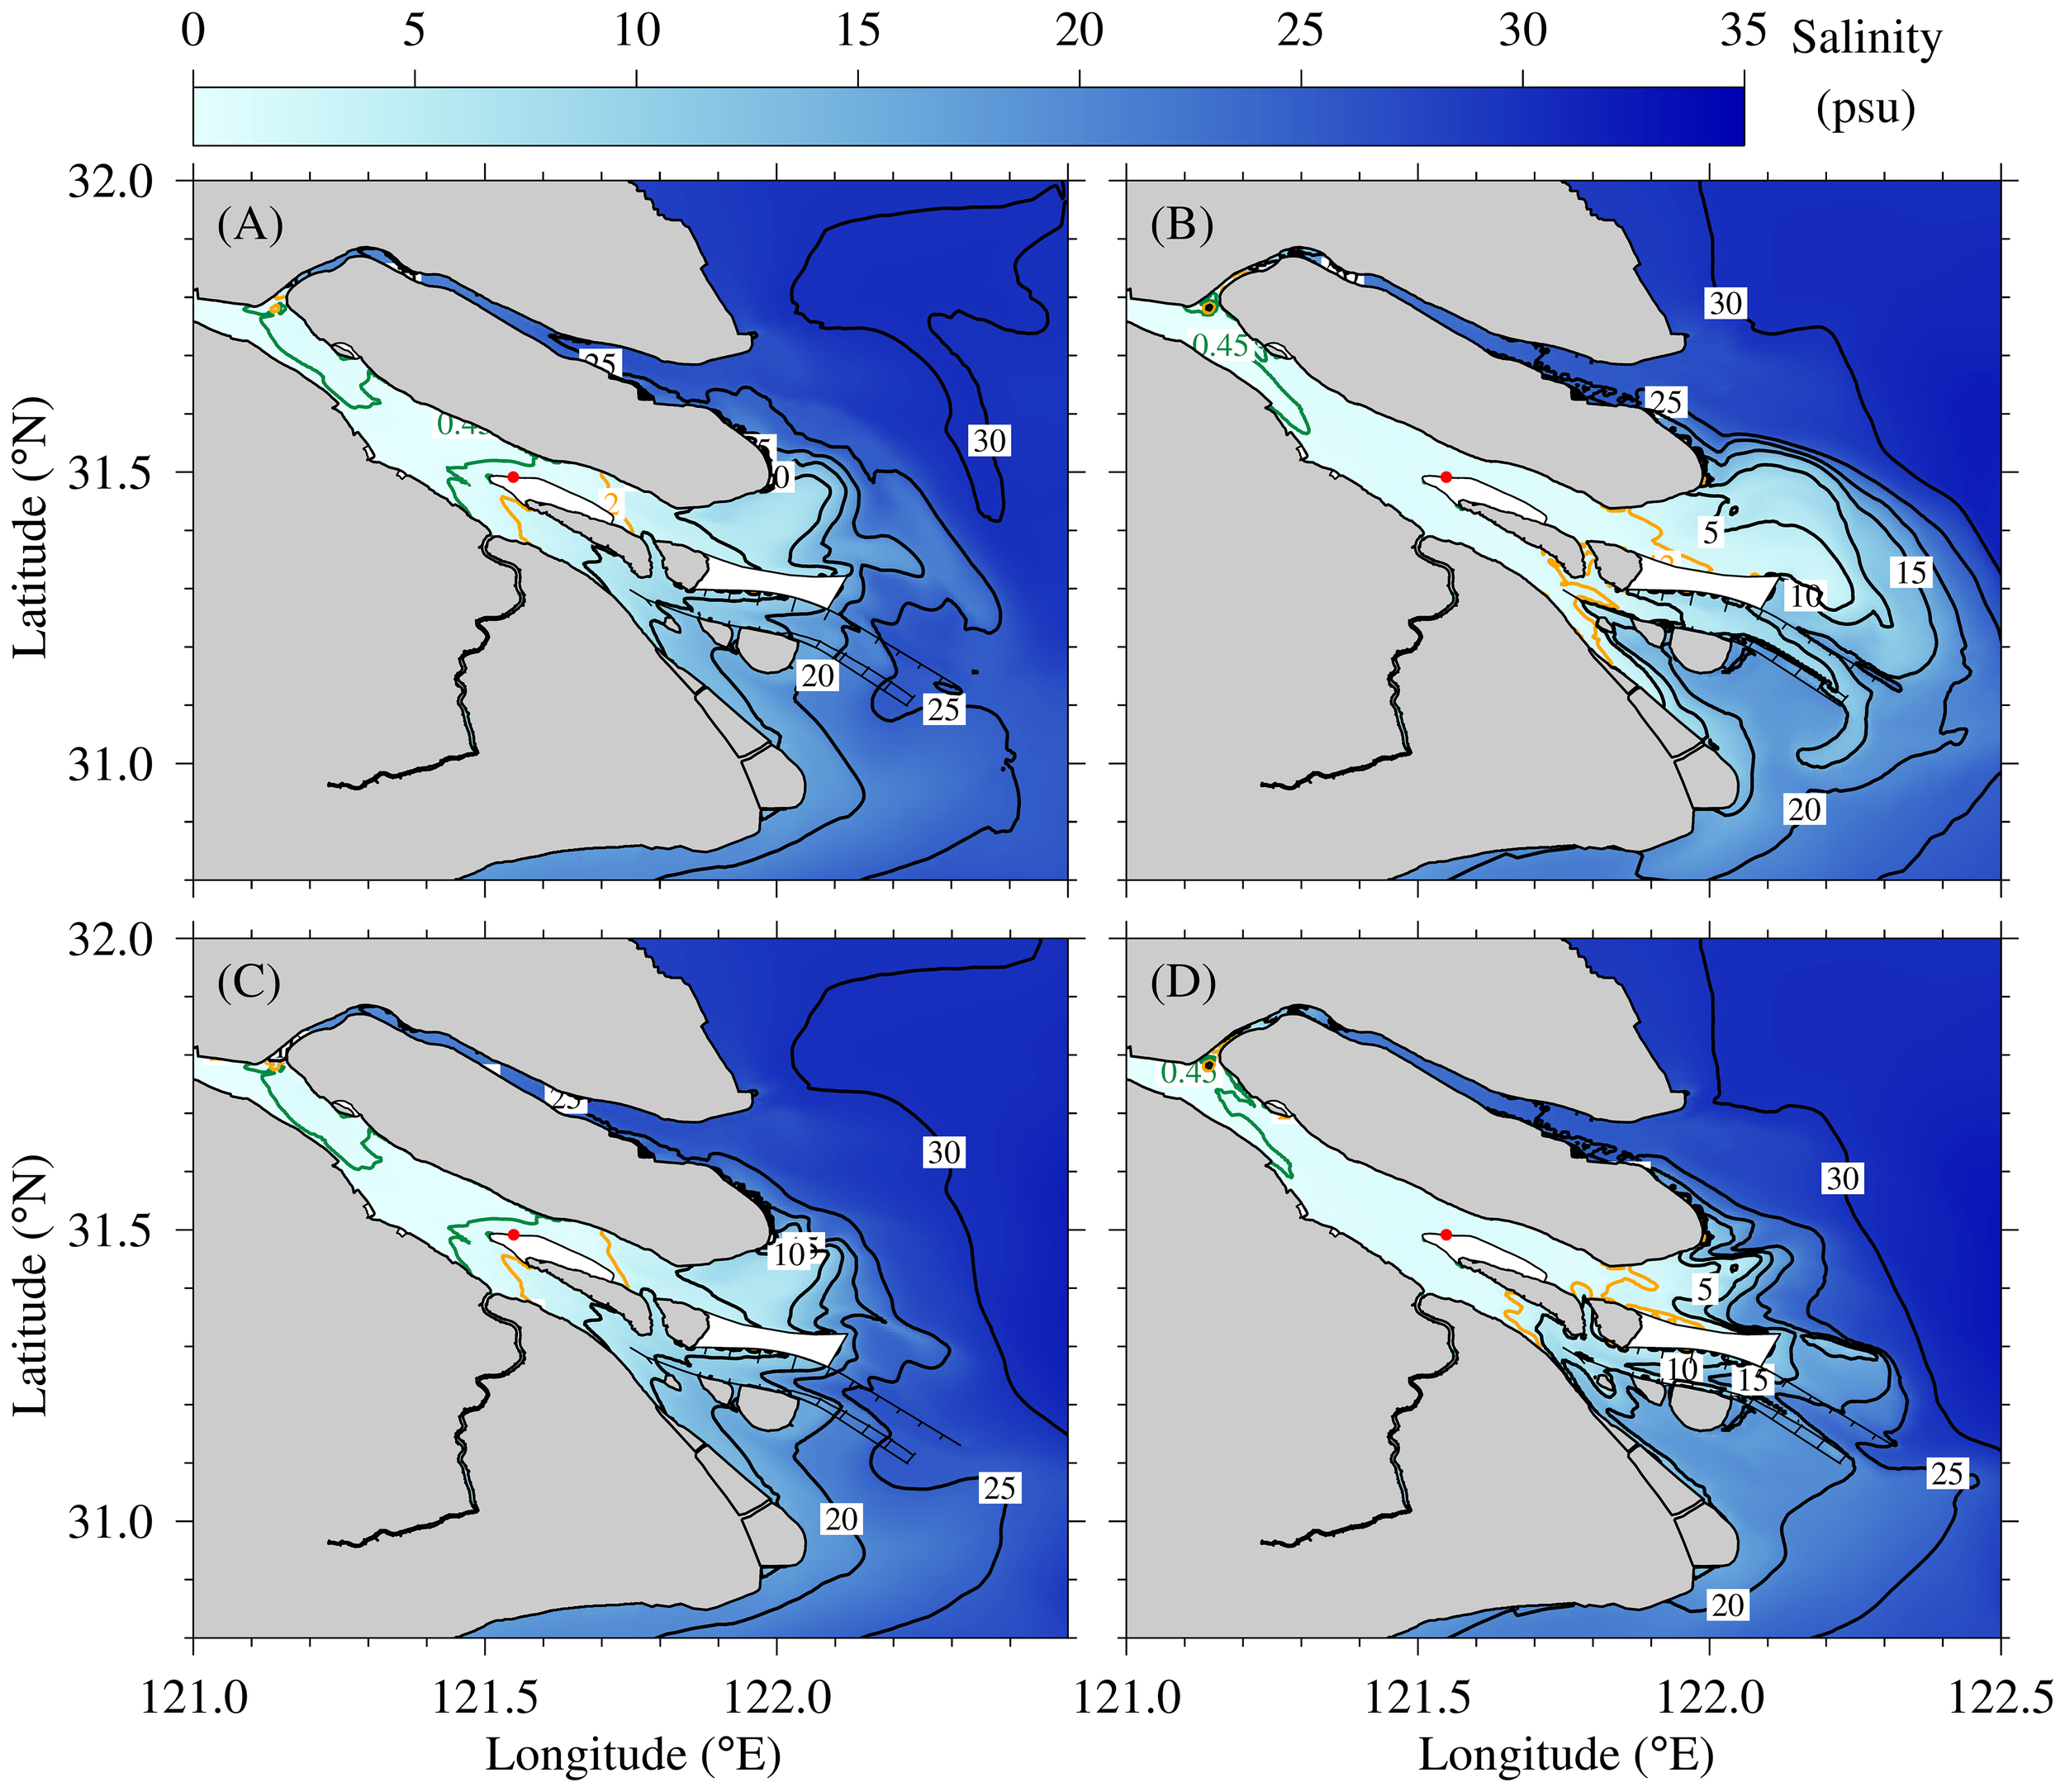
Distribution of salinity in surface layer (upper panel) and bottom layer (lower panel) at flood slack during spring tide (A, C) and neap tide (B, D) when river discharge is 8000 m3/s. The green line represents the 0.45 isohaline, the yellow line represents the 2 isohaline.
When river discharge is 12000 m3/s, saltwater intrusion is significantly reduced due to the increase of river discharge (Figure 5). At flood slack during spring tide, there is freshwater in the upper and middle reaches of the South Branch, and salinity at the water intake of Qingcaosha Reservoir is slightly higher than 0.45. At flood slack during neap tide, there is freshwater in the entire South Branch and in the upper reaches of the North and South Channels. When the river discharge is 12000 m3/s, freshwater is available for Qingcaosha Reservoir during spring and neap tide.
Figure 5
Distribution of salinity in surface layer (upper panel) and bottom layer (lower panel) at flood slack during spring tide (A, C) and neap tide (B, D) when river discharge is 12000 m3/s. The green line represents the 0.45 isohaline, the yellow line represents the 2 isohaline.
3.1.2 Net unit width salt flux distribution
The depth is shallow and has a larger tidal range in the Changjiang Estuary, the net (residual) current cannot properly reflect the net water and salt transport. Therefore, the net unit width salt flux (NUSF) was used to preferably reflect the salt transport, which is defined as: (Equation 2)
Where is the instantaneous horizontal velocity vector; s is the salinity; is the surface water level; h is the still water depth; T is one or more complete tidal cycles. In this study, three semidiurnal tidal cycles were used as an averaging time window to remove the semidiurnal and diurnal tidal signals. This method has been used in many studies in estuaries and shallow bays (Cheng et al., 2021; Huang et al., 2024; Lyu and Zhu, 2018; Ma and Zhu, 2022).
When river discharge is 8000 m3/s, the NUSF flows into the South Branch from the North Branch, the maximum value in the North Branch reaches 20 kg/(m·s) during spring tide (Figure 6A). The NUSF decreases to 2.5 kg/(m·s), and flows downstream in the South Branch. The NUSF landward flows in the South Passage, and further landward flows into the South Channel on the north side, then turns direction and seaward flows on the south side of the South Channel. In the North Channel, the NUSF seaward flows with larger value on the south side of the lower reaches, which is larger than that on the north side due to the Coriolis force action. The value on the downstream south side reaches 12kg/(m·s). In the Hengsha Channel, the NUSF flows northward into the North Channel from the North Passage. The salt transport in the Hengsha Channel is consistent with the result of Ma and Zhu (2022). During neap tide (Figure 6C), the pattern of NUSF is similar with the one in spring tide, but the NUSF from the North Branch into the South Branch is smaller, the maximum value in the North Branch reaches 15 kg/(m·s). The value of NUSF is smaller in the North Channel and Hengsha Channel, the maximum value reaches 5 kg/(m·s). But become larger in the South Passage compared that in spring tide, the maximum value reaches 25 kg/(m·s).
Figure 6
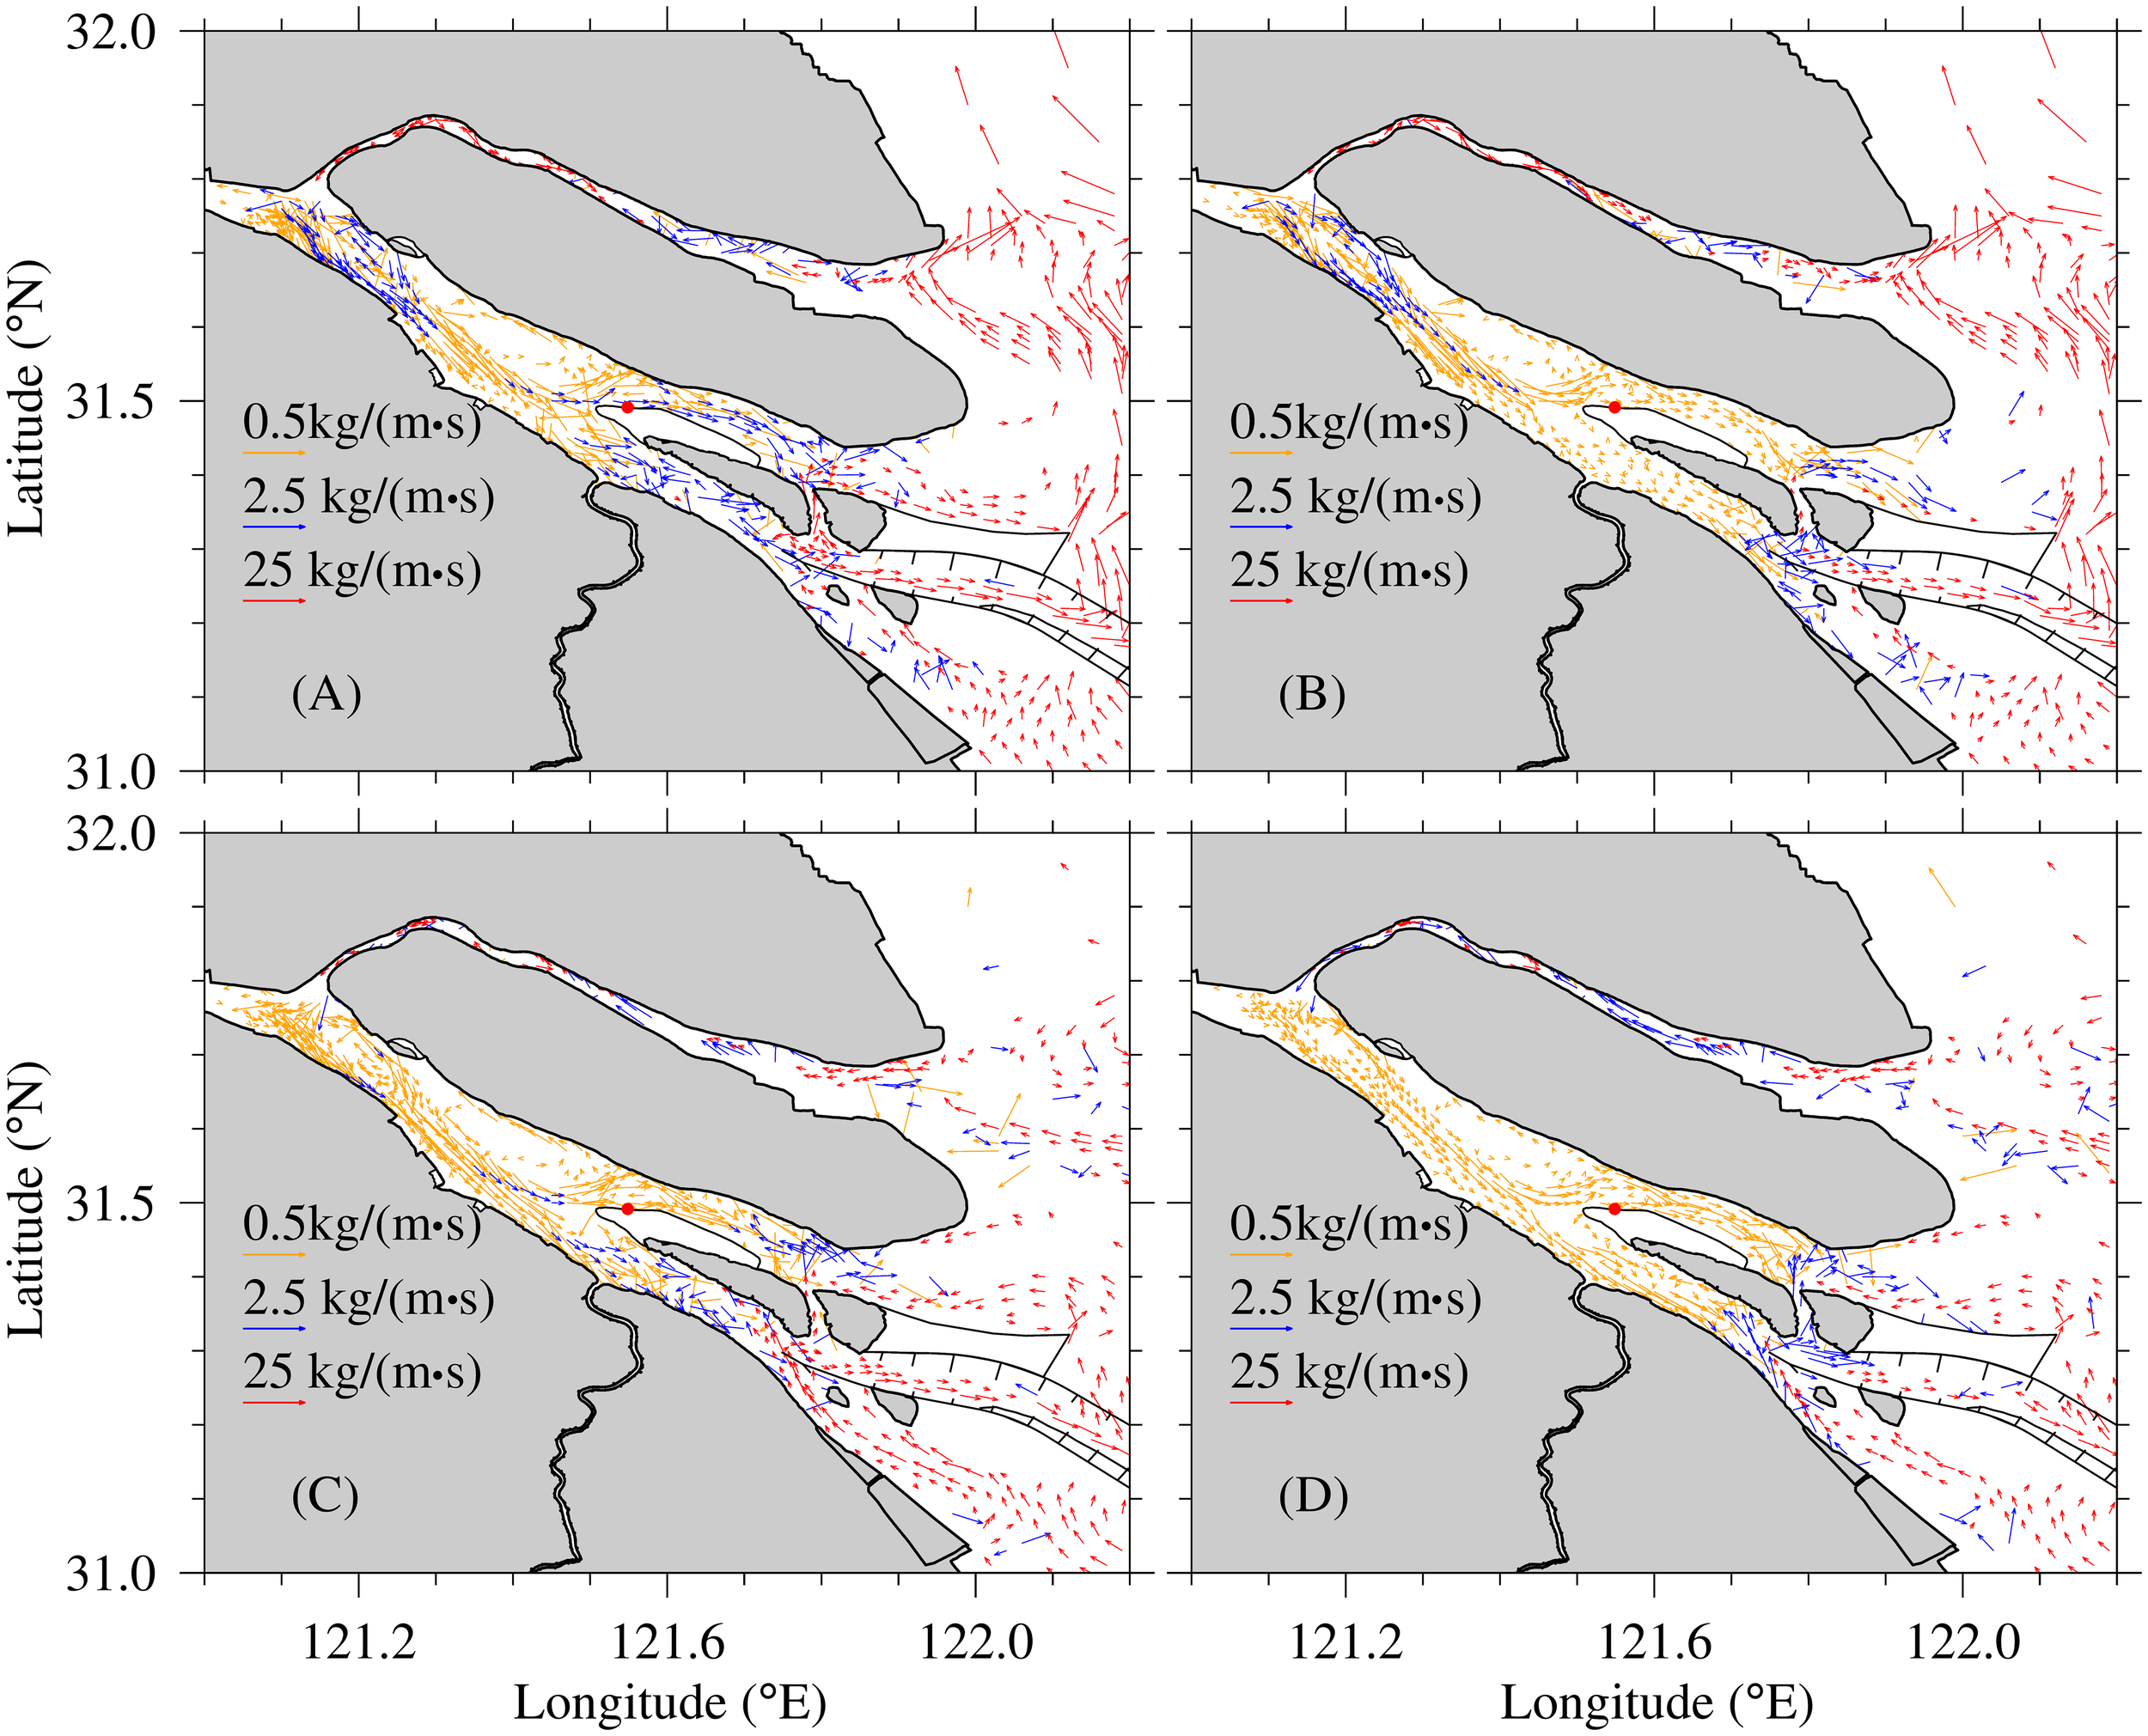
Distribution of NUSF in spring tide (upper panel) and neap tide (lower panel) when river discharge is 8000 m3/s (A, C) and 12000 m3/s (B, D).
When river discharge is 12000 m3/s, the pattern of NUSF is similar with that in the case of 8000 m3/s, but the values become smaller (Figures 6B, D).
3.1.3 Temporal variation in surface salinity at the water intake of Qingcaosha Reservoir
Figure 7 shows temporal variations in surface salinity at water intake of Qingcaosha Reservoir under river discharge of 8000, 10000 and 12000 m3/s. The salinity varies periodically with time, exhibiting distinct semi-diurnal and bimonthly tidal fluctuations. Additionally, the salinity significantly increases during the middle tide after spring tide (tidal level variation shown in Figure 3). When river discharge is 8000 m3/s, the maximum salinity at the water intake is 0.90 in September, and 1.18 in October. Almost the time, the reservoir is not suitable to take water. When river discharge is 10000 m3/s, the maximum salinity at the water intake is 0.58 in September, and 0.83 in October. In most the time, the reservoir can take freshwater. When river discharge is 12000 m3/s, the maximum salinity at the water intake is 0.27 in September, and 0.43 in October. The reservoir can take freshwater in all the time.
Figure 7
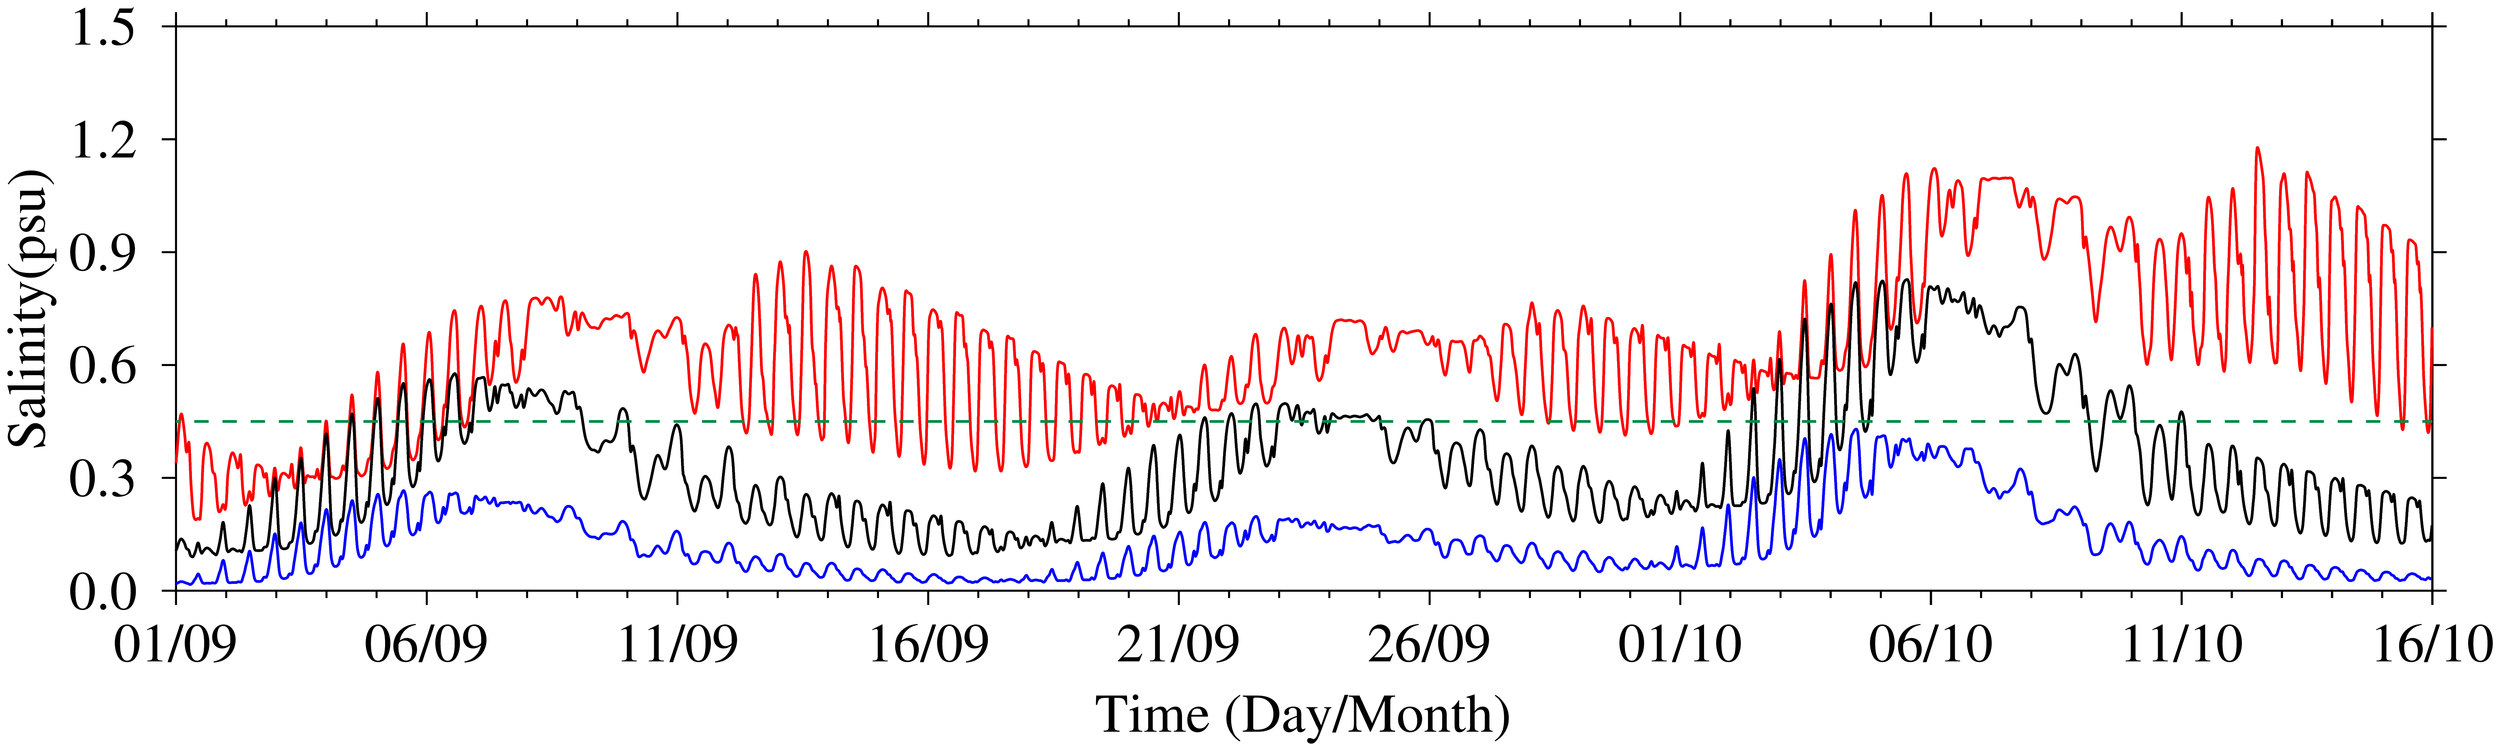
Temporal variations in surface salinity at the water intake of Qingcaosha Reservoir. Red:river discharge 8000 m3/s;black:river discharge 10000 m3/s;blue:river discharge 12000 m3/s. Green dashed line: salinity 0.45, the salinity standard of drink water.
It shows that the salinity at the reservoir intake is very sensitive to the variation in river discharge. With the increase of river discharge, the salinity decreases dramatically, and the available water intake time increases significantly.
3.1.4 Quantitative relationship between the longest continuous unsuitable water intake time and river discharge
Table 1 and Figure 8 show the longest continuous unsuitable water intake time in different river discharges under climatic wind. When river discharge is 7000, 7200, 7500, 7800, 8000, 9000, 10000, 11000 and 12000 m3/s, the longest continuous unsuitable water intake time is 43.99, 43.99, 40.15, 40.09, 39.09, 11.14, 5.29, 2.21 and 0.00 day (Table 1), respectively. The result shows that the smaller the river discharge is, the longer the longest continuous unsuitable water intake time is.
Figure 8
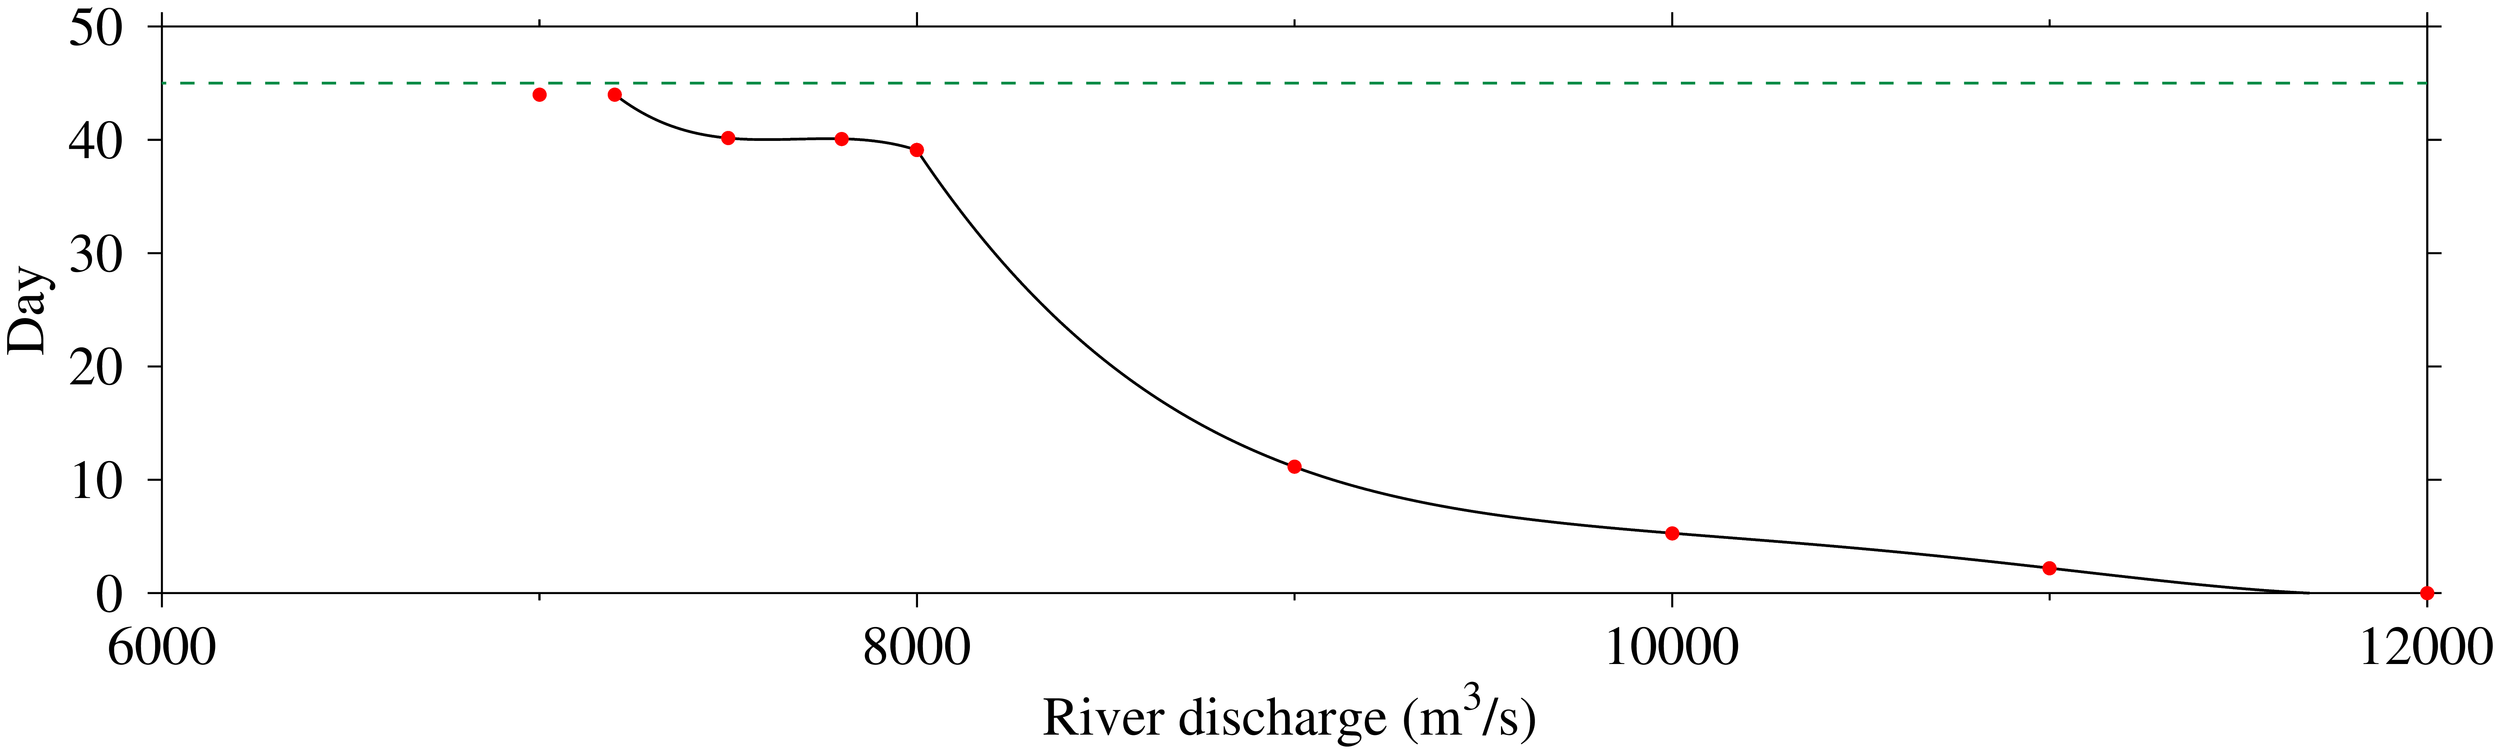
Relationship between the longest continuous unsuitable water intake time and river discharge. Red dot: simulated result; black line: fitting relationship. Green dashed line: the longest continuous unsuitable water intake time of 43.99 day that Qingcaosha Reservoir can reach.
When the river discharge is reduced to 7200 m3/s, the longest continuous unsuitable water intake time is 43.99 days, and water cannot be taken in the whole simulation period. It should be noted that when the river discharge is further reduced to 7000 m3/s, the longest continuous unsuitable water intake time is still 43.99 days. This indicates that when the river discharge is 7200 m³/s, the salinity at the reservoir intake becomes too high due to low river discharge, making water intake impossible. Therefore, when the river discharge falls below 7200 m3/s, the longest continuous unsuitable water intake time will not increase. When the river discharge is between 7200 and 8000 m3/s, the river discharge remains relatively low, and its impact on the salinity at the intake is minimal, resulting in little change in the continuous unsuitable water intake time. However, when the river discharge is increased to 8000 m3/s, the influence of river discharge on the salinity of water intake increases, leading to a significant change in the continuous unsuitable water intake time. When the river discharge is increased to 12000 m3/s, the longest continuous unsuitable water intake time is 0.00 days. It can be inferred that when the river discharge is greater than 12000 m3/s, the longest continuous unsuitable water intake time is 0 days. Fitting the data in Figure 7, we can get the quantitative relationship between river discharge (RD, unit m3/s) and the longest continuous unsuitable water intake time of Qingcaosha Reservoir is: (Equation 3)
Where y is the longest continuous unsuitable water intake time, x is river discharge. The correlation coefficient R2 is 0.99, meaning that the fitting result is good.
3.2 Saltwater intrusion under northerly wind of 10 m/s (Experimental group 2)
3.2.1 Horizontal salinity distribution
The 7 day period of strong northerly wind is forced from middle tide after spring tide to neap tide (Figure 3), so we only show the distribution of salinity in surface layer and bottom layer at flood slack during neap tide (Figure 9). When the river discharge is 8000 m3/s, the saltwater intrusion is very severe. The entire estuary is occupied by saline water, no freshwater exists due to low river discharge and persistent strong northerly wind. The salinity is more than 2 in surface layer and greater than 5 at the water intake of Qingcaosha Reservoir. When the river discharge is 12000 m3/s, the saltwater intrusion weakens, there is freshwater on the south side of the South Branch, but there is still no freshwater at the water intake of Qingcaisha Reservoir.
Figure 9
Distribution of salinity in surface layer (upper panel) and bottom layer (lower panel) at flood slack during neap tide when river discharge is 8000 m3/s (A, C) and 12000 m3/s (B, D). The green line represents the 0.45 isohaline, the yellow line represents the 2 isohaline.
3.2.2 NUSF distribution
During neap tide, when river discharge is 8000 m3/s, the NUSF flows into the South Branch from the North Branch, the maximum value in the North Branch reaches 20 kg/(m·s) during neap tide (Figure 10A). The NUSF landward flows in the North Channel, then turns direction and flows into the South Channel toward sea, forming a horizontal salt transport route of “flowing into the North Channel and out in the South Channel”. This salt transport route is opposite to that under climatic wind conditions. The NUSF southward flows along the Subei coast and pass the area east side of Chongming Island under strong northerly wind, then flows into the North Channel under the Ekman transport. The strong landward Ekman transport resists the seaward runoff forming the horizontal salt transport route of “flowing into the North Channel and out in the South Channel”, which is consistent with the results of Li et al. (2012), Zhu et al. (2020); Ma et al. (2025). In the South Passage, the NUSF flows landward due to its funnel shape and strong salinity front that induces landward boroclinic pressure gradient force. In the Hengsha Channel, the NUSF flows southward into the North Passage from the North Channel under force of strong northerly wind.
Figure 10
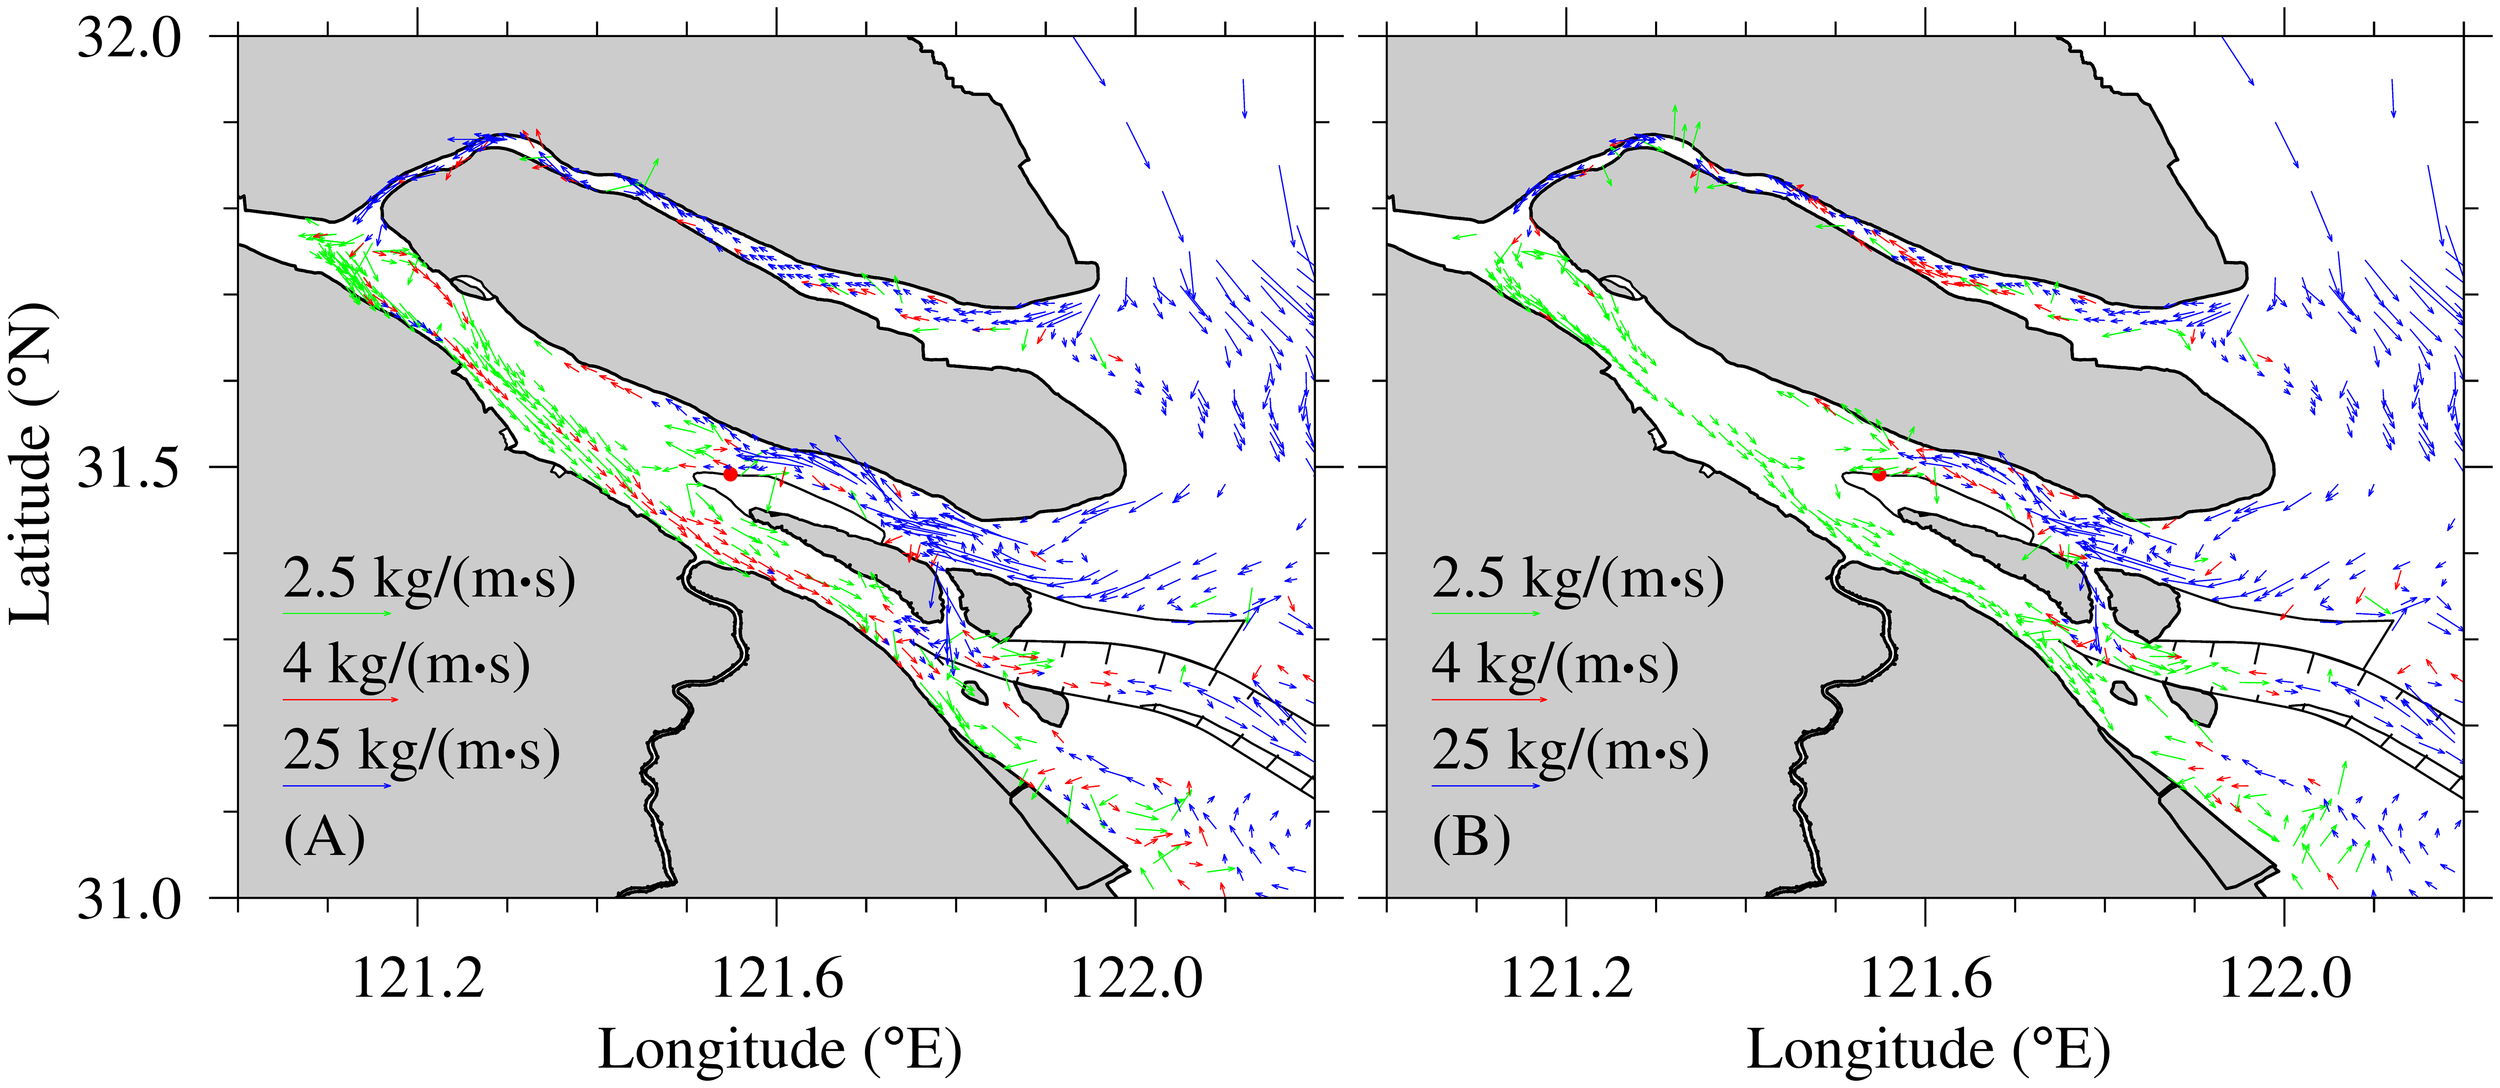
Distribution of unit width salt flux during neap tide when river discharge is 8000 m3/s (A) and 12000 m3/s (B).
When river discharge is 12000 m3/s, the NUSF from the North Branch into the South Branch is weakened, resulting in the decrease of the seaward salt transport in the South Branch compared with the result of river discharge of 8000 m3/s (Figure 10B). The horizontal salt transport route of “flowing into the North Channel and out in the South Channel” is weakened with the increase of river discharge.
3.2.3 Temporal variation in surface salinity at water intake of Qingcaosha Reservior
Figure 11 shows temporal variations in surface salinity at water intake of Qingcaosha Reservoir under river discharge of 8000, 10000 and 12000 m3/s. The salinity increases significantly after the action of persistent strong northerly wind. When river discharge is 8000 m3/s, the maximum salinity at the water intake is 7.83. In all the time, the reservoir is not suitable to take water. When river discharge is 10000 m3/s, the maximum salinity at the water intake is 5.71. The reservoir can take freshwater till 10 October. When river discharge is 12000 m3/s, the maximum salinity at the water intake is 4.15, and salinity fluctuates around 1 till 15 October.
Figure 11
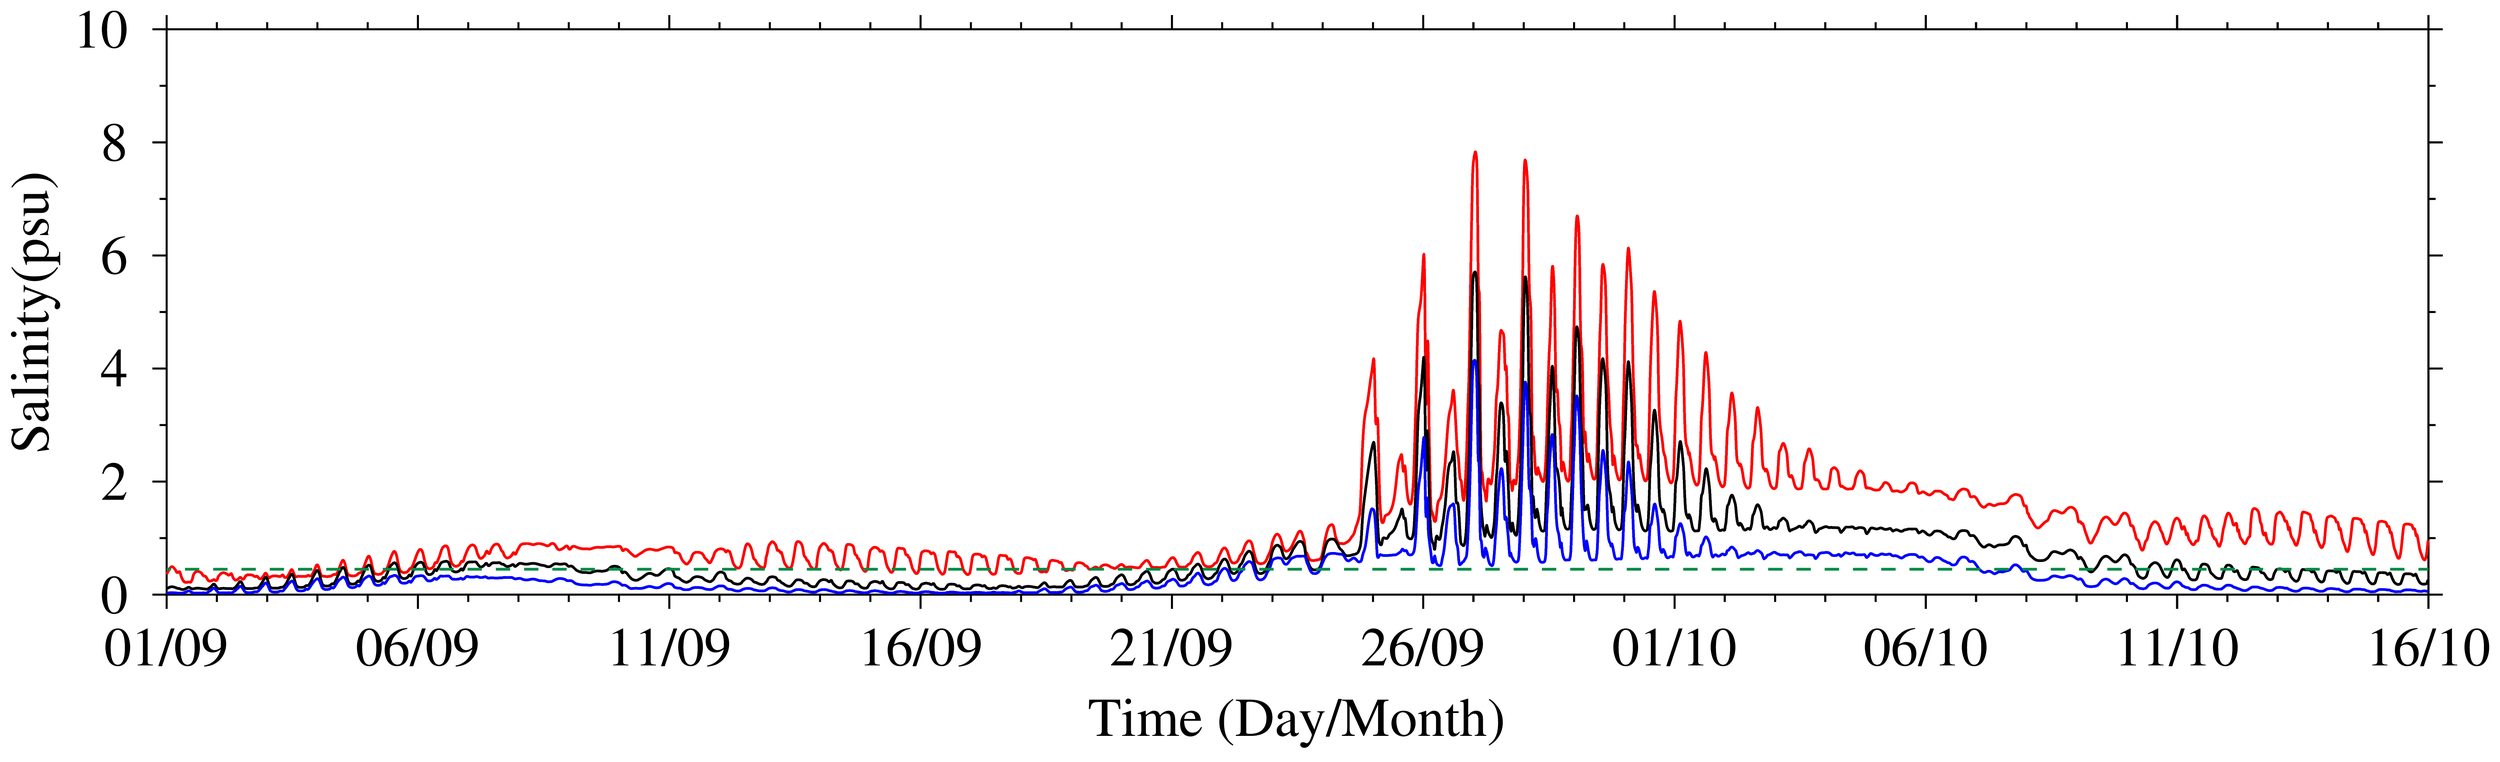
Temporal variations in surface salinity at the water intake of Qingcaosha Reservoir. Red:river discharge 8000 m3/s;black:river discharge 10000 m3/s;blue:river discharge 12000 m3/s. Green dashed line: salinity 0.45, the salinity standard of drink water.
3.2.4 Quantitative relationship between the longest continuous unsuitable water intake time and river discharge
Table 1 and Figure 12 show the longest continuous unsuitable water intake time in different river discharges under persistent northerly wind of 10 m/s. When river discharge is 7000, 8000, 10000, 12000, 15000, 18000 and 20000 m3/s, the longest continuous unsuitable water intake time is 43.99, 39.62, 19.24, 14.13, 5.74, 0.15 and 0.04 day, respectively.
Figure 12
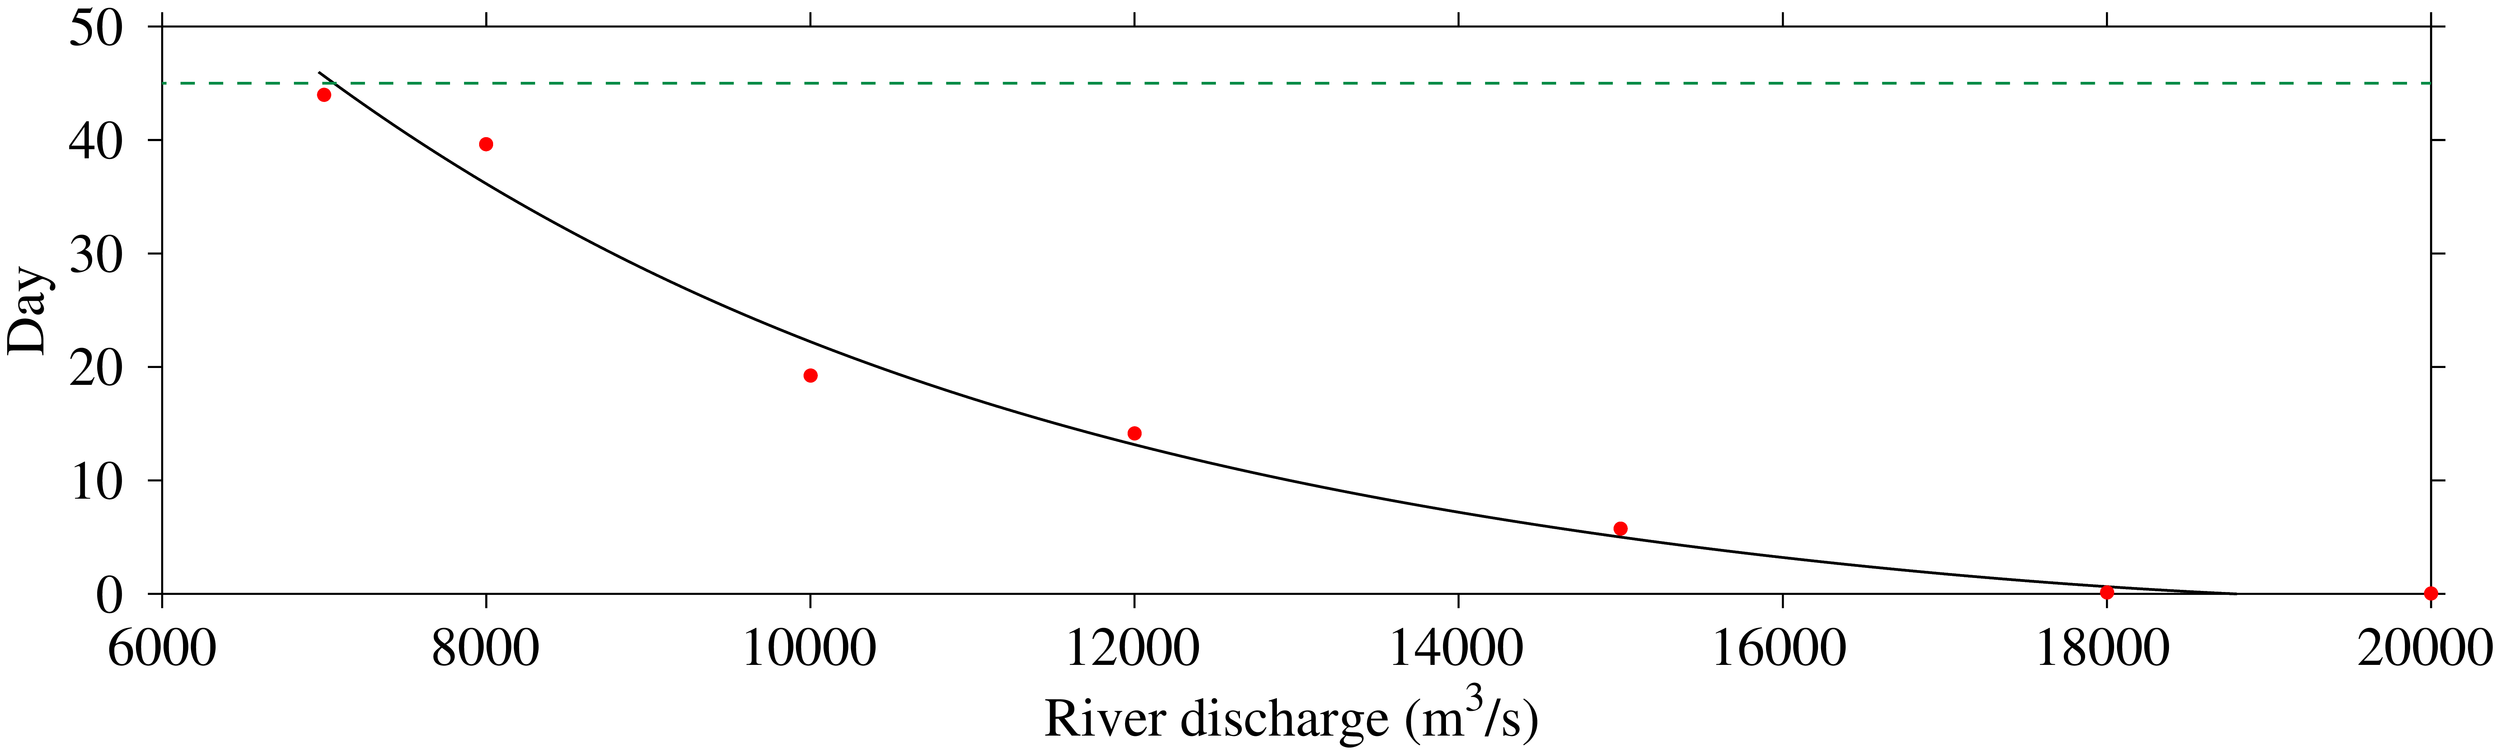
Relationship between the longest continuous unsuitable water intake time and river discharge. Red dot: simulated result; black line: fitting relationship. Green dashed line: the longest continuous unsuitable water intake time of 43.99 day that Qingcaosha Reservoir can reach.
When the river discharge is reduced to 7000 m3/s, the longest continuous unsuitable water intake time is 43.99 days. When the river discharge is increased to 20000 m3/s, the longest continuous unsuitable water intake time is 0.04 days. It can be inferred that when the river discharge is greater than 20000 m3/s, the longest continuous unsuitable water intake time is 0 days. Fitting the data in Figure 12, we can get the quantitative relationship between river discharge (RD, unit m3/s) and the longest continuous unsuitable water intake time of Qingcaosha Reservoir is: (Equation 4)
The correlation coefficient R2 is 0.99.
3.3 Saltwater intrusion under northerly wind of 15 m/s (experimental group 3)
3.3.1 Horizontal salinity distribution
Figure 13 shows the distribution of salinity in surface layer and bottom layer at flood slack during neap tide when river discharge is 8000 m3/s and 12000 m3/s. With the increase of wind speed to 15 m/s, saltwater intrusion increases significantly, and the isohaline moves significantly upstream compared under northerly wind 10 m/s. When the river discharge is 8000 m3/s, the salinity in most areas of the South Branch is greater than 2. The bottom salinity is distinctly higher than the surface salinity at the bifurcation between the North Channel and South Channel. The salinity is greater than 10 in surface layer and greater than 15 at the water intake of Qingcaosha Reservoir. When the river discharge is 12000 m3/s, the isohaline 2 moves seaward, indicating that the saltwater intrusion weakens, there is no freshwater in all most area of the estuary.
Figure 13
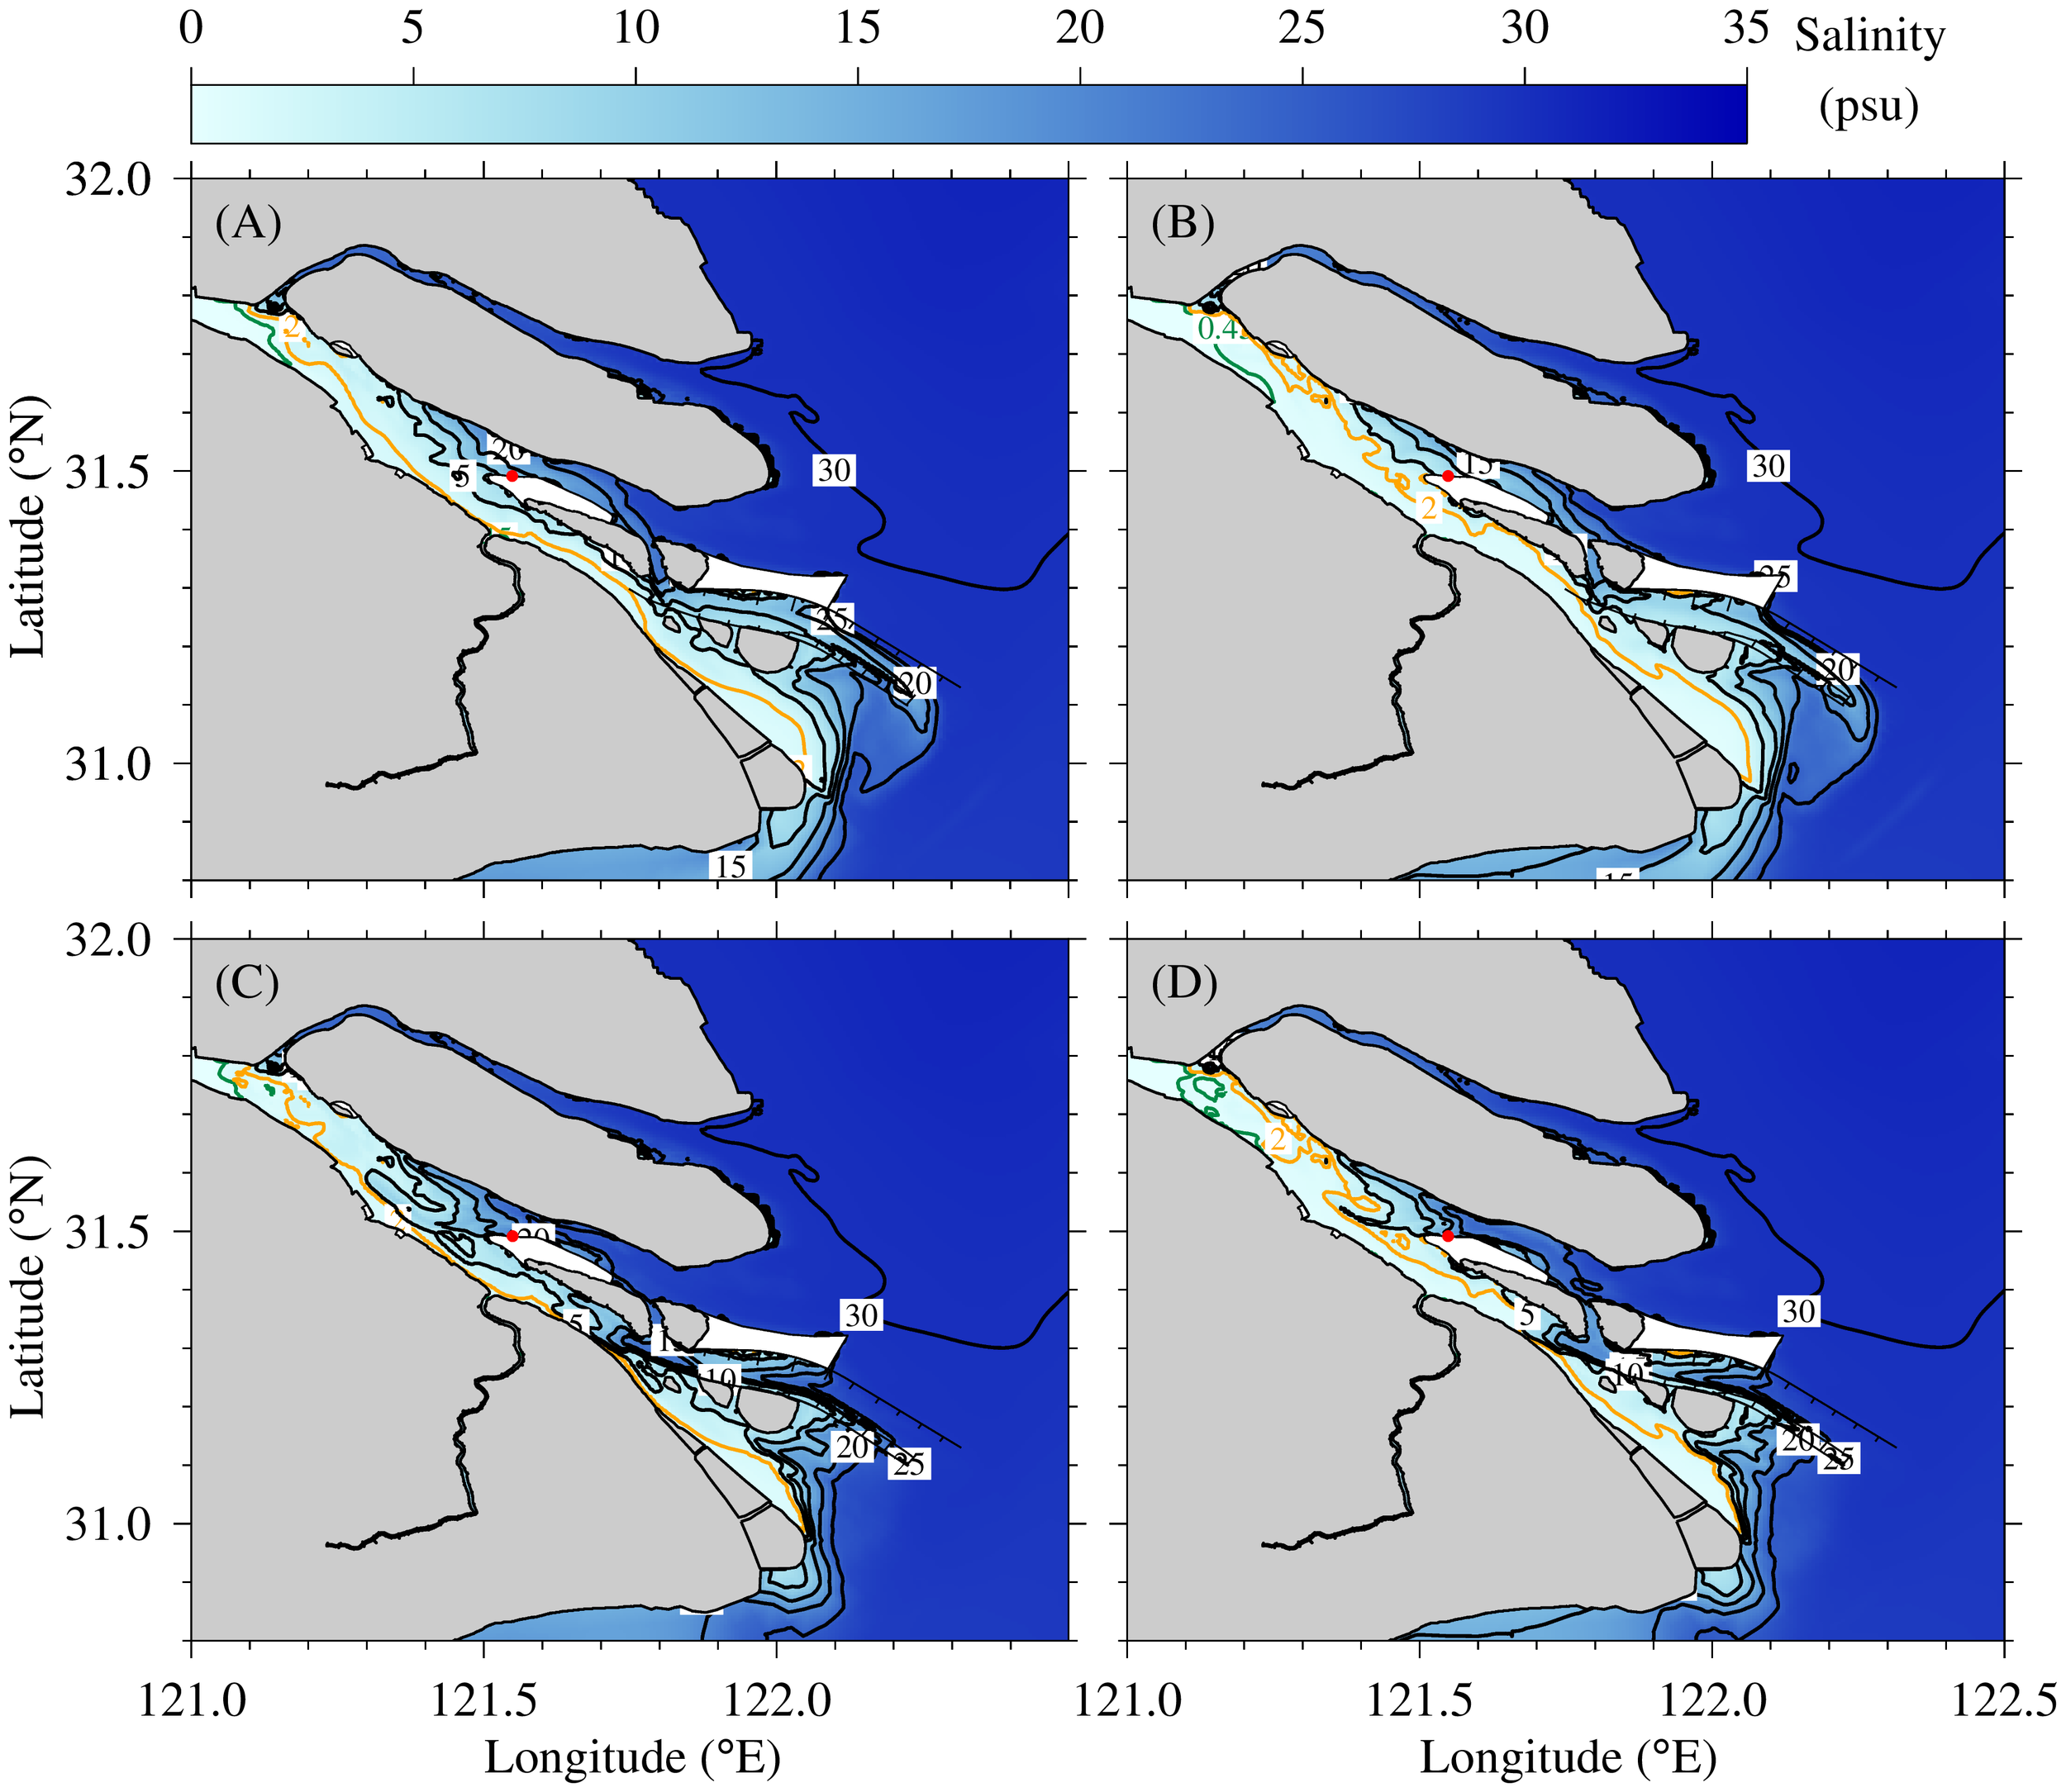
Distribution of salinity in surface layer (upper panel) and bottom layer (lower panel) at flood slack during neap tide when river discharge is 8000 m3/s (A, C) and 12000 m3/s (B, D). The green line represents the 0.45 isohaline, the yellow line represents the 2 isohaline.
3.3.2 NUSF distribution
During neap tide, when river discharge is 8000 m3/s, the pattern of NUSF under persistent northerly wind of 15 m/s is similar with the one under persistent northerly wind of 10 m/s, but become much stronger (Figure 14A). The horizontal salt transport route of “flowing into the North Channel and out in the South Channel” is more distinct. In the South Passage, the NUSF flows seaward under force of strong seaward NUSF in the South Channel. In the Hengsha Channel, a large amount of salt is transported into the North Passage from the North Channel under force of strong northerly wind.
Figure 14
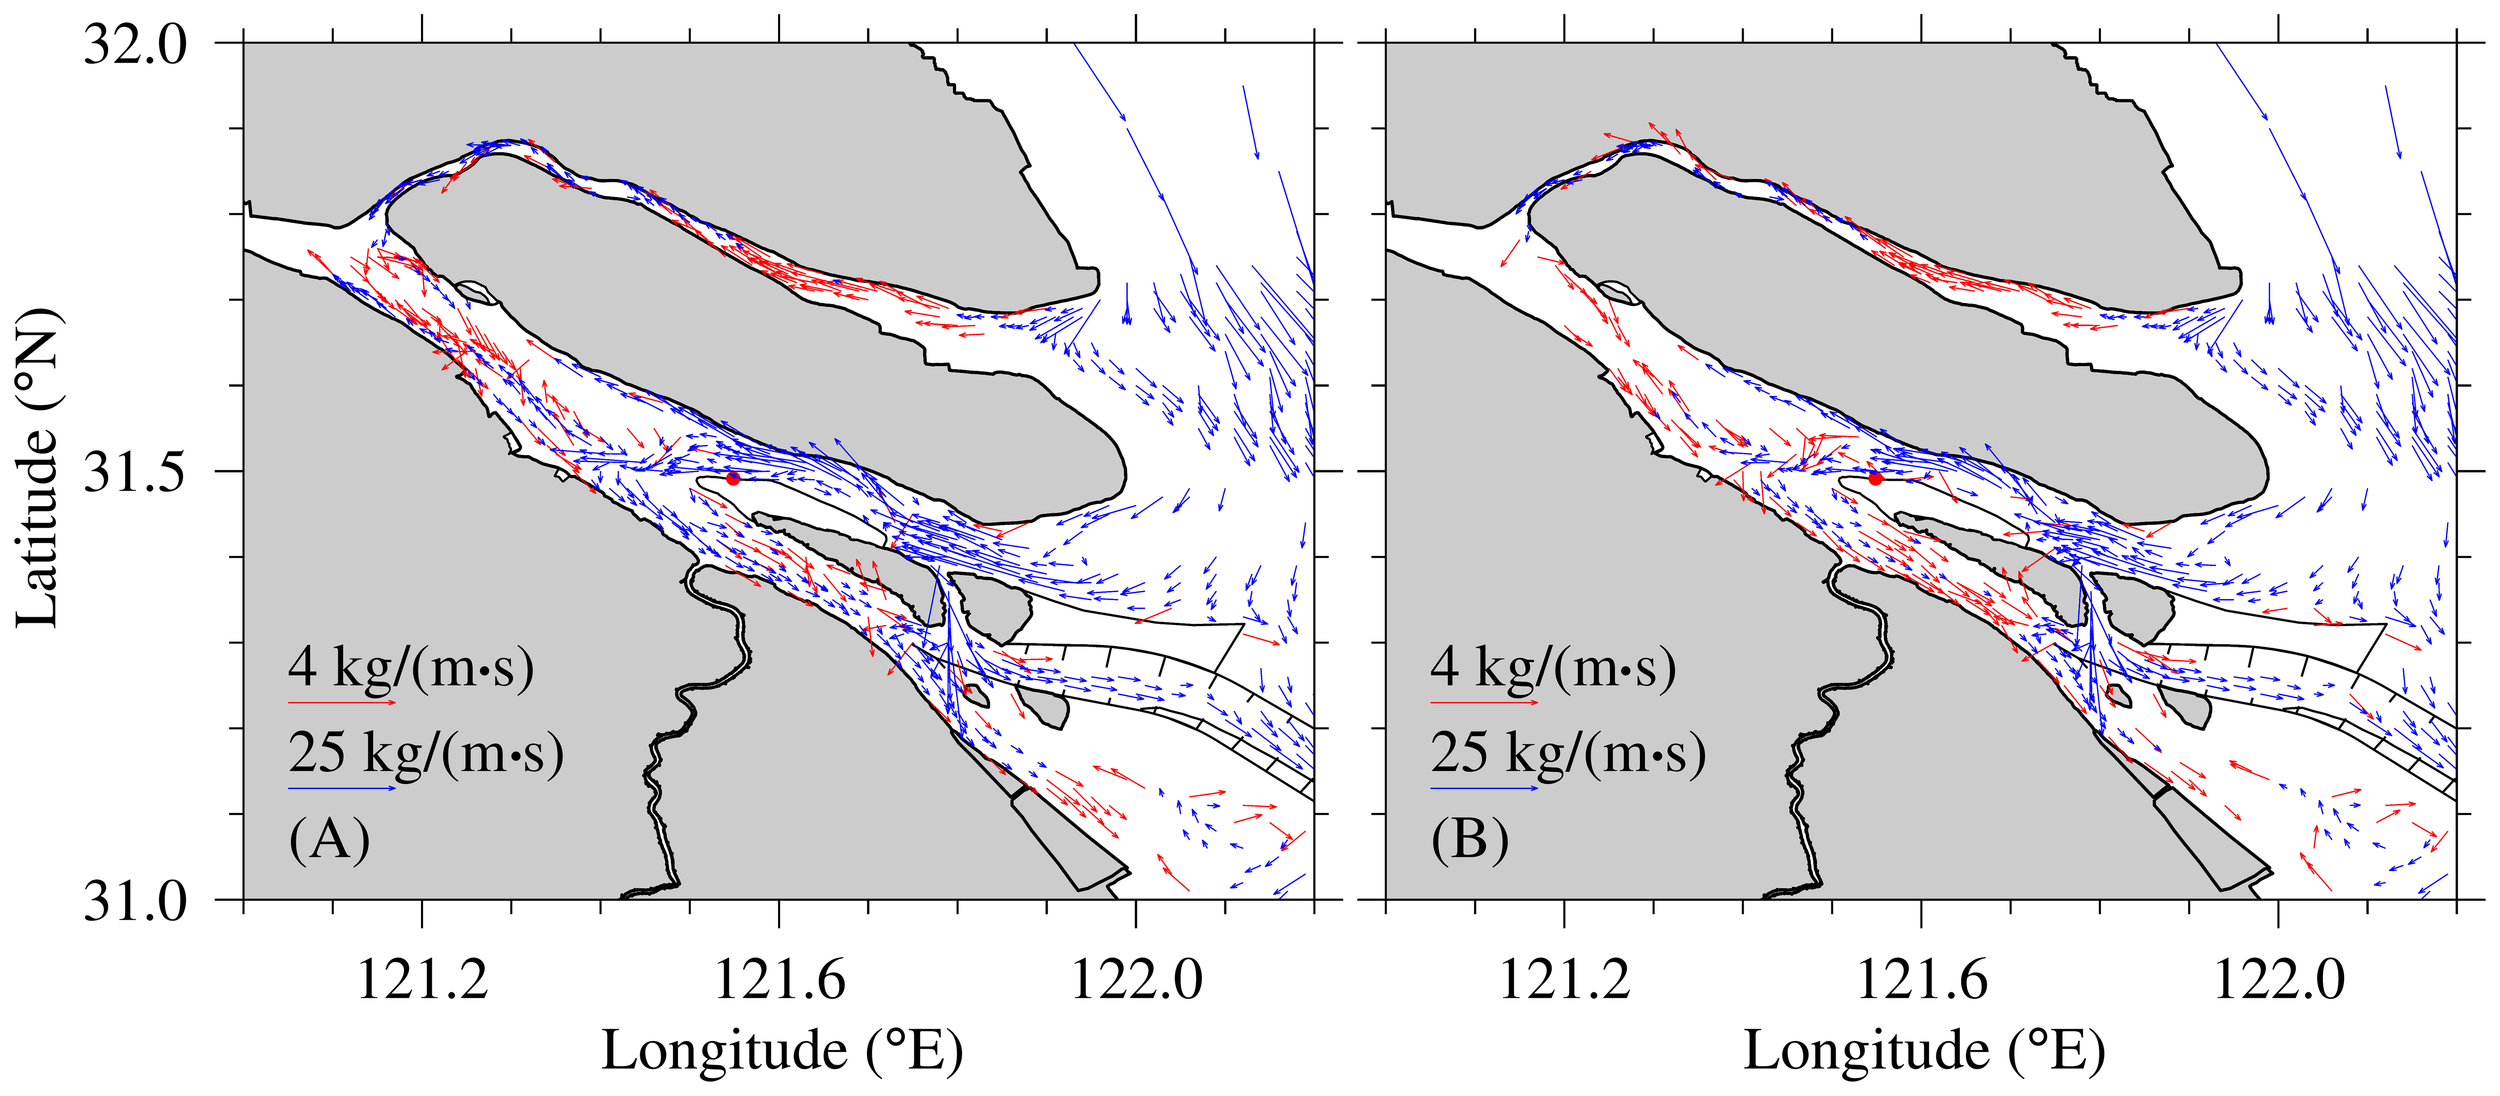
Distribution of unit width salt flux in neap tide when river discharge is 8000 m3/s (A) and 12000 m3/s (B).
When river discharge is 12000 m3/s, the NUSF become weakened with the increase of river discharge (Figure 14B), but the horizontal salt transport route of “flowing into the North Channel and out in the South Channel”is still distinct.
3.3.3 Temporal variation in surface salinity at water intake of Qingcaosha Reservior
Figure 15 shows temporal variations in surface salinity at water intake of Qingcaosha Reservoir under river discharge of 8000, 10000 and 12000 m3/s. The salinity increases enormously after the action of persistent strong northerly wind. When river discharge is 8000 m3/s, the maximum salinity at the water intake is 22.81. When river discharge is 10000 m3/s, the maximum salinity at the water intake is 20.72. The reservoir cannot take freshwater till 10 October. When river discharge is 12000 m3/s, the maximum salinity at the water intake is 18.51, and salinity fluctuates around 2.5 till 15 October.
Figure 15

Temporal variations in surface salinity at the water intake of Qingcaosha Reservoir. Red:river discharge 8000m3/s;black:river discharge 10000 m3/s;blue:river discharge 12000 m3/s. Green dashed line: salinity 0.45, the salinity standard of drink water.
3.3.4 Quantitative relationship between the longest continuous unsuitable water intake time and river discharge
Table 1 and Figure 16 show the longest continuous unsuitable water intake time in different river discharges under persistent northerly wind of 15 m/s. When river discharge is 7000, 8000, 10000, 12000, 15000, 18000, 20000, 25000, and 30000 m3/s, the longest continuous unsuitable water intake time is 43.99, 38.80, 23.58, 16.09, 12.86, 8.76, 7.01, 1.39 and 0.26 day, respectively.
Figure 16
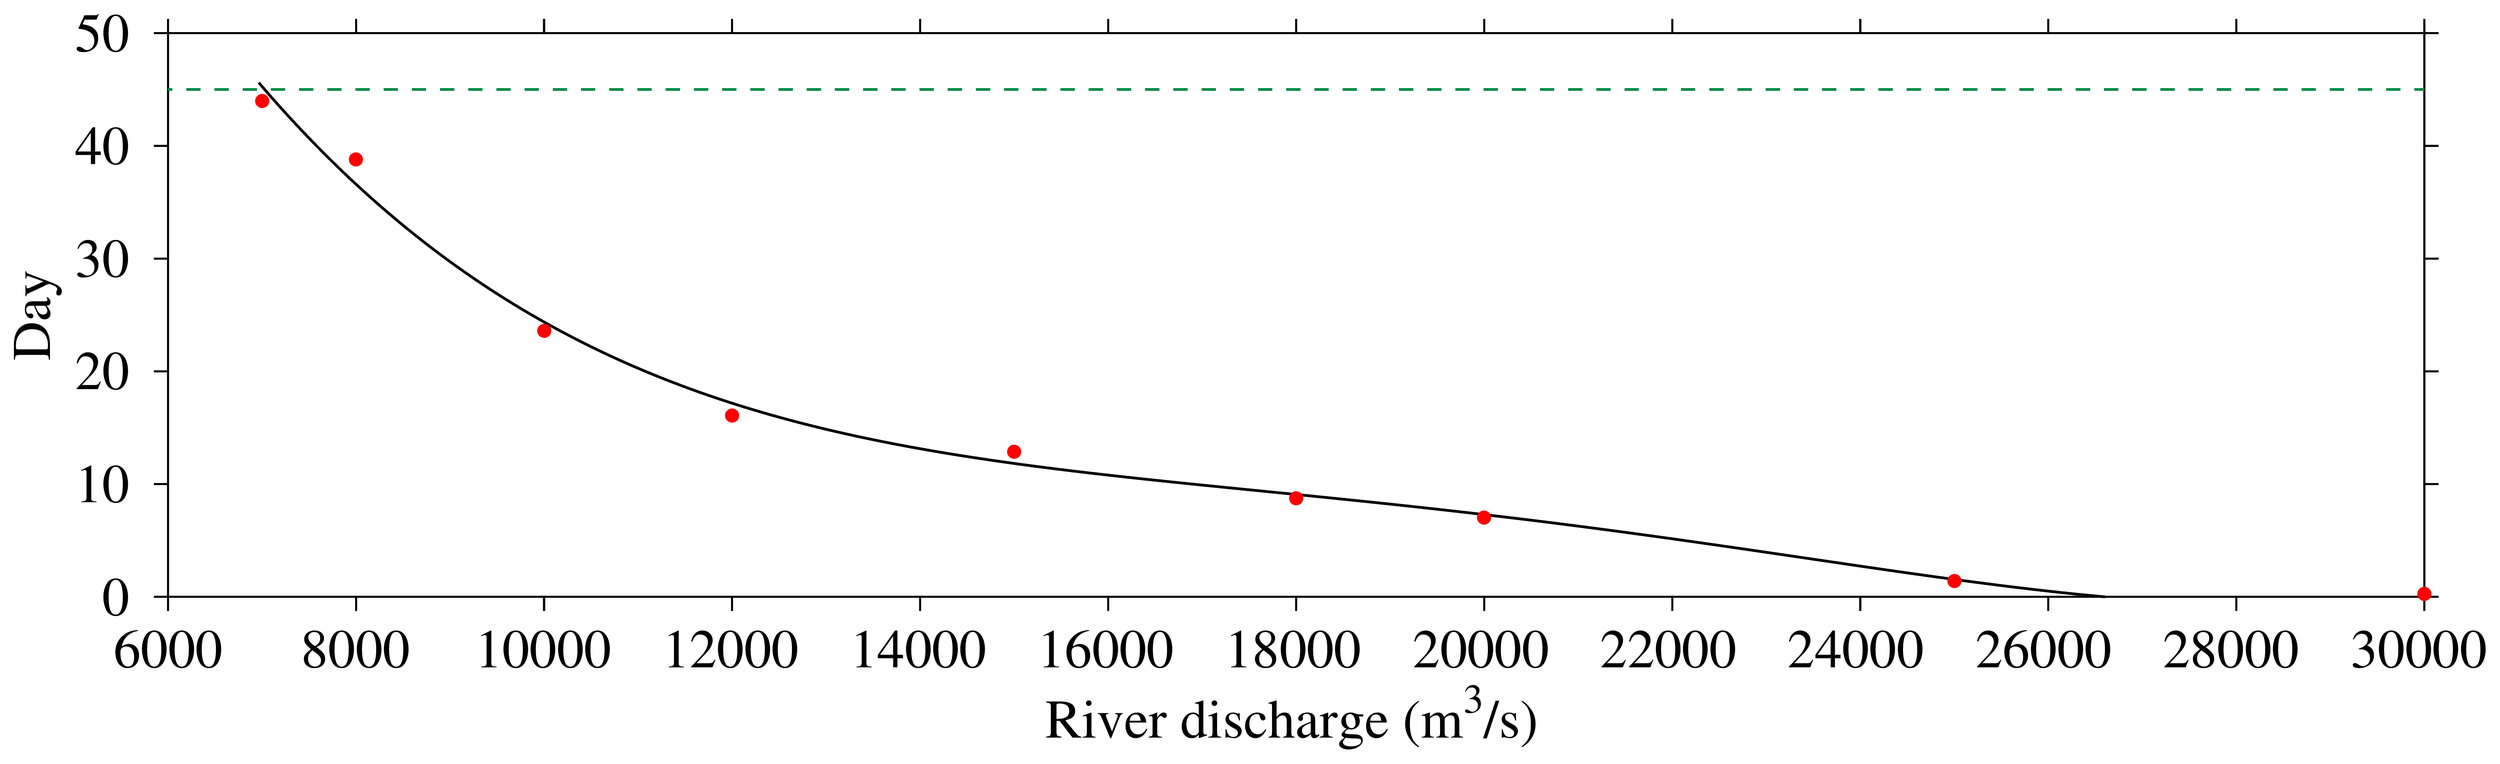
Relationship between the longest continuous unsuitable water intake time and river discharge. Red dot: simulated result; black line: fitting relationship. Green dashed line: the longest continuous unsuitable water intake time of 43.99 day that Qingcaosha Reservoir can reach.
When the river discharge is reduced to 7000 m3/s, the longest continuous unsuitable water intake time is 43.99 days. When the river discharge is increased to 30000 m3/s, the longest continuous unsuitable water intake time is 0.26 days. It can be inferred that when the river discharge is greater than 30000 m3/s, the longest continuous unsuitable water intake time is 0 days. Fitting the data in Figure 16, we can get the quantitative relationship between river discharge (RD, unit m3/s) and the longest continuous unsuitable water intake time of Qingcaosha Reservoir is: (Equation 5)
The correlation coefficient R2 is 0.97.
Climate change can cause sea level rise, extreme drought and floods, which results in extremely low and high river discharge, and persistent long time strong wind. In this paper, the low and high river discharge, persistent strong northerly wind was considered, that can reflect the climate change effect. As for the impact of sea level rise caused by climate change on saltwater intrusion, it can enhance estuarine saltwater intrusion (Qiu and Zhu, 2015). The Three Gorges Dam significantly seasonally regulates the river discharge, intensifying the saltwater intrusion during the flood season and weakening it (Chen and Xu, 1995; Qiu et al., 2024). Climate change and human intervention can both affect saltwater intrusion.
4 Conclusions
The saltwater intrusion in the Changjiang Estuary is mainly controlled by river discharge, tide and wind. We used a two-way nested unstructured quadrilateral grid, finite-differencing, three-dimensional estuarine and coastal ocean model (UFDECOM-i) with flux balance and a matching nesting boundary flux conservation interpolation, and designed numerical experiments of different river discharge under different wind to study change of saltwater intrusion and the quantitative relationship between unsuitable water intake time at Qingcaosha Reservoir and river discharge under different northerly wind speeds.
Under climatic wind conditions, when river discharge is 8000 m3/s, the NUSF flows landward in the North Branch, seaward in the South Branch, seaward in the North Channel and North Passage, landward flows on north side and seaward on south side of the South Channel, landward in the South Passage during spring tide. During neap tide, the pattern of NUSF is similar with the one in spring tide, but the values become smaller except in the South Passage. When river discharge is 12000 m3/s, the pattern of NUSF is similar with that in the case of 8000 m3/s, but the values become smaller. The salinity at the reservoir intake of Qingcaosha Reservoir is very sensitive to the variation in river discharge. With the increase of river discharge, the salinity decreases dramatically, and the available water intake time increases significantly. When river discharge is 7000, 7200, 7500, 7800, 8000, 9000, 10000, 11000, and 12000 m3/s, the longest continuous unsuitable water intake time is 43.99, 43.99, 40.15, 40.09, 39.09, 11.14, 5.29, 2.21, and 0.00 day, respectively. When the river discharge is further reduced to 7000 m3/s, the longest continuous unsuitable water intake time is still 43.99 days, meaning the longest continuous unsuitable water intake time will not increase when river discharge drop below 7200 m3/s. The quantitative relationship between river discharge and the longest continuous unsuitable water intake time of Qingcaosha Reservoir is expressed by Equation A1 with correlation coefficient R2 of 0.99.
Under 7 day northerly wind of 10 m/s, when the river discharge is 8000 m3/s, the saltwater intrusion is very severe when the wind is forced. The entire estuary is occupied by saline water. The NUSF landward flows in the North Channel, then turns direction and flows into the South Channel toward sea, forming a horizontal salt transport route of “flowing into the North Channel and out in the South Channel”. The strong landward Ekman transport resists the seaward runoff forming the horizontal salt transport route. When the river discharge is 12000 m3/s, the saltwater intrusion weakens, there is freshwater only on the south side of the South Branch. The horizontal salt transport route is weakened with the increase of river discharge. The salinity at the water intake of Qingcaosha Reservoir increases significantly after the action of persistent strong northerly wind. When river discharge is 7000, 8000, 10000, 12000, 15000, 18000, and 20000 m3/s, the longest continuous unsuitable water intake time is 43.99, 39.62, 19.24, 14.13, 5.74, 0.15 and 0.04 day, respectively. The quantitative relationship between river discharge and the longest continuous unsuitable water intake time of Qingcaosha Reservoir is expressed by Equation A2 with correlation coefficient R2 of 0.99.
Under 7 day northerly wind of 15 m/s, saltwater intrusion increases significantly with the increase of wind speed. When the river discharge is 8000 m3/s, the salinity in most areas of the South Branch is greater than 2. The salinity is more than 10 in surface layer and greater than 15 at the water intake of Qingcaosha Reservoir. The pattern of NUSF is similar with that under persistent northerly wind of 10 m/s, but become much stronger. The horizontal salt transport route of “flowing into the North Channel and out in the South Channel” is more significant. When the river discharge is 12000 m3/s, there is still no freshwater in all most area of the estuary. The NUSF become weakened with the increase of river discharge, but the horizontal salt transport route of “flowing into the North Channel and out in the South Channel” is still distinct. The salinity increases enormously after the action of persistent strong northerly wind. When river discharge is 7000, 8000, 10000, 12000, 15000, 18000 and 20000, 25000, 30000 m3/s, the longest continuous unsuitable water intake time is 43.99, 38.80, 23.58, 16.09, 12.86, 8.76, 7.01, 1.39 and 0.26 day, respectively. The quantitative relationship between river discharge and the longest continuous unsuitable water intake time of Qingcaosha Reservoir is expressed by Equation A3 with correlation coefficient R2 of 0.97. The relationship between continuous unsuitable water intake time and river discharge under different northerly wind speeds can provide a basis for reservoir water intake and water supply safety.
Statements
Data availability statement
The raw data supporting the conclusions of this article will be made available by the authors, without undue reservation.
Author contributions
XG: Writing – original draft, Conceptualization, Investigation, Formal Analysis, Visualization, Methodology, Data curation. RM: Validation, Supervision, Writing – review & editing, Software. JZ: Funding acquisition, Writing – review & editing, Conceptualization, Investigation, Resources, Project administration, Formal Analysis, Supervision, Visualization, Methodology.
Funding
The author(s) declare financial support was received for the research and/or publication of this article. This work was supported by Science and Technology Commission of Shanghai Municipality (grant 23DZ1203002), and the National Natural Science Foundation of China (grant U2340225, 42276174).
Conflict of interest
The authors declare that the research was conducted in the absence of any commercial or financial relationships that could be construed as a potential conflict of interest.
Generative AI statement
The author(s) declare that no Generative AI was used in the creation of this manuscript.
Any alternative text (alt text) provided alongside figures in this article has been generated by Frontiers with the support of artificial intelligence and reasonable efforts have been made to ensure accuracy, including review by the authors wherever possible. If you identify any issues, please contact us.
Publisher’s note
All claims expressed in this article are solely those of the authors and do not necessarily represent those of their affiliated organizations, or those of the publisher, the editors and the reviewers. Any product that may be evaluated in this article, or claim that may be made by its manufacturer, is not guaranteed or endorsed by the publisher.
References
1
Aristizábal M. F. Chant R. J. (2015). An observational study of salt fluxes in Delaware Bay. Journal of Geophysical Research. Oceans120, 2751–2768. doi: 10.1002/2014JC010680
2
Ayouche A. Carton X. Charria G. (2022). Vertical shear processes in river plumes: instabilities and turbulent mixing. Symmetry14, 217. doi: 10.3390/sym14020217
3
Ayouche A. Carton X. Charria G. Theettens S. Ayoub N. (2020). Instabilities and vertical mixing in river plumes: application to the Bay of Biscay. Geophys. Astrophys. Fluid Dyn.114, 650–689. doi: 10.1080/03091929.2020.1814275
4
Ayouche A. Charria G. Carton X. Ayoub N. Theetten S. (2021). Non-linear processes in the Gironde River plume (North-East Atlantic): instabilities and mixing. Front. Mar. Sci.8. doi: 10.3389/fmars.2021.701773
5
Chen S. N. Sanford L. P. (2009). Axial wind effects on stratification and longitudinal salt transport in an idealized, partially mixed estuary. J. Phys. Oceanogr.39, 1905–1920. doi: 10.1175/2009JPO4016.1
6
Chen J. Xu H. (1995). The impact of the three gorges project on the Yangtze River estuary. Resour. Environ. Yangtze Basin4, 242–246.
7
Chen Q. Zhu J. R. Lyu H. H. Chen S. L. (2019). Determining critical river discharge as a means to provide water supply water security to the Changjiang River Estuary, China. J. Coast. Res.35, 1087–1094. doi: 10.2112/JCOASTRES-D-18-00165.1
8
Cheng X. Zhu J. Chen S. (2021). Dynamics of the extension of the Yellow River plume in the Bohai Sea. Continental Shelf Res.222, 104438. doi: 10.1016/j.csr.2021.104438
9
Ding Z. Zhu J. Chen B. Bao D. (2021). A two-way nesting unstructured quadrilateral grid, finite-differencing, estuarine and coastal ocean model with high-order interpolation schemes. J. Mar. Sci. Eng.9, 335. doi: 10.3390/jmse9030335
10
Duran-Matute M. Gerkema T. Sassi M. G. (2016). Quantifying the residual volume transport through a multiple-inlet system in response to wind forcing: The case of the western Dutch Wadden Sea. J. Geophys. Res.: Oceans12, 8888–8903. doi: 10.1002/2016JC011807
11
Editorial Board for Marine Atlas (1992). Ocean Atlas in Huanhai Sea and East China Sea (Hydrology) (Beijing: China Ocean Press).
12
Geyer W. R. (1993). The importance of suppression of turbulence by stratification on the estuarine turbidity maximum. Estuar. Coasts16, 113–125. doi: 10.2307/1352769
13
Giddings S. N. Maccready P. (2017). Reverse estuarine circulation due to local and remote wind forcing, enhanced by the presence of along-coast estuaries. J. Geophys. Res.: Oceans122, 10184–10205. doi: 10.1002/2016JC012479
14
Gu J. H. Zhu J. R. Lyu H. H. (2021). Observation and analysis of water and salt transports in the north branch of the Changjiang Estuary. J. Coast. Res.37, 518–527. doi: 10.2112/JCOASTRES-D-20-00059.1
15
Huang J. Zhu J. R. Su J. W. Han X. J. Cai L. (2024). Suspended sediment exchange between the Changjiang Estuary and Hangzhou Bay and their key driving mechanisms. Estuar. Coast. Shelf Sci.305, 108876. doi: 10.1016/j.ecss.2024.108876
16
Li L. J. Zhu J. R. Chant R. J. Wang C. N. Fernando Pareja-Roman L. (2020). Effect of dikes on saltwater intrusion under various wind conditions in the Changjiang Estuary. J. Geophys. Res. Oceans125 (7), 1–25. doi: 10.1029/2019JC015685
17
Li L. J. Zhu J. R. Fernando Pareja-Roman L. (2021). Calculating salinity variance fluxes using isohaline coordinates. Estuar. Coast. Shelf Sci.254, 107311. doi: 10.1016/j.ecss.2021.107311
18
Li L. Zhu J. R. Wu H. (2012). Impacts of wind stress on saltwater intrusion in the Yangtze Estuary. Sci. China Earth Sci.55, 1178–1192. doi: 10.1007/s11430-011-4311-1
19
Lyu H. H. Zhu J. R. (2018). Impact of the bottom drag coefficient on saltwater intrusion in the extremely shallow estuary. J. Hydrol.557, 838–850. doi: 10.1016/j.jhydrol.2018.01.010
20
Ma R. Qiu C. Zhu J. Zhang Z. Zhu Y. Kong L. et al . (2025). Dynamic cause of saltwater intrusion extremes and freshwater challenges in the Changjiang Estuary in flood season of 2022. Front. Mar. Sci.12. doi: 10.3389/fmars.2025.1573883
21
Ma R. Zhu J. R. (2022). Water and salt transports in the Hengsha Channel of Changjiang Estuary. J. Mar. Sci. Eng.10, 72. doi: 10.3390/jmse10010072
22
Ma R. Zhu J. Qiu C. (2024). A new scheme for two-way, nesting, quadrilateral grid in an estuarine model. Comput. Mathematics Appl.172, 152–167. doi: 10.1016/j.camwa.2024.08.001
23
Mellor G. L. Yamada T. (1982). Development of a turbulence closure model for geophysical fluid problems. Rev. Geophys.20, 851–875. doi: 10.1029/RG020i004p00851
24
Prandle D. (1985). On salinity regimes and the vertical structure of residual flows in narrow tidal estuaries. Estuar. Coast. Shelf Sci.20, 615–635. doi: 10.1016/0272-7714(85)90111-8
25
Prandle D. Lane A. (2015). Sensitivity of estuaries to sea level rise: vulnerability indices. Estuar. Coast. Shelf Sci.160, 60–68. doi: 10.1016/j.ecss.2015.04.001
26
Qiu W. Luan H. L. Qu G. (2024). The impact of emergency water replenishment from the Three Gorges Reservoir on saltwater intrusion in the Yangtze River Estuary during the 2022 flood season. J. Yangtze River Sci. Res. Institute41, 30–39.
27
Qiu C. Zhu J. R. (2015). Assessing the influence of sea level rise on salt transport processes and estuarine circulation in the Changjiang River estuary. J. Coast. Res.31, 661–670. doi: 10.2112/JCOASTRES-D-13-00138.1
28
Qiu C. Zhu J. R. Gu Y. L. (2012). Impact of seasonal tide variation on saltwater intrusion in the Changjiang River estuary. Chin. J. Oceanol. Limnol.30, 342–351. doi: 10.1007/s00343-012-1115-x
29
Shen H. T. Mao Z. C. Zhu J. R. (2003). Saltwater intrusion in the Changjiang Estuary Vol. 2003 (Beijing: China Ocean).
30
Simpson J. H. Brown J. Matthews J. Allen G. (1990). Tidal straining, density currents, and stirring in the control of estuarine stratification. Estuaries13 (2), 125–132.
31
Simpson J. H. Hunter J. R. (1974). Fronts in the Irish Sea. Nature250, 404–406. doi: 10.1038/250404a0
32
Small C. Nicholls R. J. (2003). A global analysis of human settlement in coastal zones. J. Coast. Res.19, 584–599.
33
Wu H. Zhu J. R. (2010). Advection scheme with 3rd high-order spatial interpolation at the middle temporal level and its application to saltwater intrusion in the Changjiang Estuary. Ocean Model.33, 33–51. doi: 10.1016/j.ocemod.2009.12.001
34
Wu H. Zhu J. R. Chen B. R. Chen Y. Z. (2006). Quantitative relationship of runoff and tide to saltwater spilling over from the North Branch in the Changjiang Estuary: A numerical study. Estuar. Coast. Shelf Sci.69, 125–132. doi: 10.1016/j.ecss.2006.04.009
35
Wu T. Zhu J. R. Ma R. Qiu W. Yuan R. (2023). Freshwater resources around the reclaimed new land on the Eastern Hengsha Shoal in the Changjiang estuary. Front. Mar. Sci. 10, 1302091. doi: 10.3389/fmars.2023.1302091
36
Xue P. F. Chen C. S. Ding P. X. Beardsley R. C. Lin H. C. Ge J. Z. et al . (2009). Saltwater intrusion into the Changjiang River: A model-guided mechanism study. J. Geophys. Res.: Oceans114, C02006. doi: 10.1029/2008JC004831
37
Yang F. Chen W. Lu C. Zou H. Wang Q. Wan D. (2023). Research on comprehensive prevention and control system of saltwater intrusion in the Guangdong-Hong Kong- Macao Greater Bay Area. Water Resour. Prot.39, 32–41.
38
Zhang E. Gao S. Savenije H. H. G. Si C. Cao S. (2019). Saline water intrusion in relation to strong winds during winter cold outbreaks: North Branch of the Yangtze Estuary. J. Hydrol.574, 1099–1109. doi: 10.1016/j.jhydrol.2019.04.096
39
Zhu J. R. Cheng X. Li L. Wu H. Gu J. Lyu H. (2020). Dynamic mechanism of an extremely severe saltwater intrusion in the Changjiang estuary in February 2014. Hydrol. Earth Syst. Sci.24, 5043–5056. doi: 10.5194/hess-24-5043-2020
40
Zhu J. R. Wu H. Li L. (2015). “Hydrodynamics of the Changjiang Estuary and adjacent seas,” in Ecological Continuum from the Changjiang (Yangtze River) Watersheds to the East China Sea Continental Margin (Cham, Switzerland: Springer International Publishing), 19–45. doi: 10.1007/978-3-319-16339-0_2
Appendix
Equation A1:
a= 7.271; b= -3.085; c= 4.9; d= -3.455; e= 9137.969; f= -3.821; g= 8.807; h= -6.766; i=17363.015.
Equation A2:
a= 1.538; b= -1.038; c= 2.791; d= -3.641; e= 195.647.
Equation A3:
a= 1.012; b= -8.314; c= 2.51; d= -3.399; e= 186.298.
Summary
Keywords
saltwater intrusion, estuarine reservoir, river discharge, continuous unsuitable water intake time, numerical experiments
Citation
Guo X, Ma R and Zhu J (2025) Quantitative relationship between unsuitable water intake time at Qingcaosha reservoir and river discharge under different northerly wind speeds. Front. Mar. Sci. 12:1661094. doi: 10.3389/fmars.2025.1661094
Received
07 July 2025
Accepted
26 August 2025
Published
11 September 2025
Volume
12 - 2025
Edited by
Toru Miyama , Japan Agency for Marine-Earth Science and Technology, Japan
Reviewed by
Adam Ayouche, Hong Kong University of Science and Technology, Hong Kong SAR, China
Tong Wu, ChangJiang Waterway Survey and Design Institute (Wuhan) Co., Lt, China
Updates
Copyright
© 2025 Guo, Ma and Zhu.
This is an open-access article distributed under the terms of the Creative Commons Attribution License (CC BY). The use, distribution or reproduction in other forums is permitted, provided the original author(s) and the copyright owner(s) are credited and that the original publication in this journal is cited, in accordance with accepted academic practice. No use, distribution or reproduction is permitted which does not comply with these terms.
*Correspondence: Rui Ma, ruima@fudan.edu.cn; Jianrong Zhu, jrzhu@sklec.ecnu.edu.cn
Disclaimer
All claims expressed in this article are solely those of the authors and do not necessarily represent those of their affiliated organizations, or those of the publisher, the editors and the reviewers. Any product that may be evaluated in this article or claim that may be made by its manufacturer is not guaranteed or endorsed by the publisher.