Abstract
The greener port has become an important goal for the maritime industry. This paper developed an economic model to discuss how the investment effectiveness and two commonly used governmental policies (regulation and subsidy policies) affect port’s output, green investment, and governmental policy choices. Findings show that compared to no policy, both policies promote green investment, but their impacts on output are opposite: regulation restrains output, while subsidies boost it. Subsidies, as a proactive tool, reduce ports’ green investment costs, driving both investment and output—especially in initial stages with high subsidy rates (0.3-0.5) covering over 50% of costs. Regulation, more passive, forces ports to increase investment but limit production, particularly when investment efficiency is low. Investment effectiveness shapes policy selection: subsidies work better at low or high efficiency, while regulation is preferable at medium efficiency. Both policies outperform no intervention in improving social welfare. These insights inform policy design for sustainable port development.
1 Introduction
The urgency to accelerate decarbonization in the maritime sector corresponds with the International Maritime Organization’s (IMO) updated 2023 strategy, which mandates strengthened emission reduction targets: minimum 20% by 2030 and 70-80% by 2040 relative to 2008 baseline levels (IMO, 2023). Current data reveals maritime transportation contributes 3.1% of global CO2 emissions (UTCAD, 2023), with container vessels disproportionately responsible for 23% of sectoral emissions despite comprising merely 11% of the global fleet. Notably, China’s pivotal role in container logistics is evidenced by its ports processing 38.7% of worldwide container throughput (over 310 million TEUs) in 2023 (China Ports & Harbors Association, 2024). This challenge is further intensified by the sector’s capital intensity, requiring over $1.5 trillion investment for energy transition through 2050 (Global Maritime Forum, 2023), particularly for modernizing port infrastructure.
While green technology adoption remains a conventional corporate approach for CO2 mitigation, port-related environmental investments face dual financial constraints: elevated costs in both eco-technological innovation and low-carbon infrastructure development. These economic barriers substantially dampen operator motivation to engage in sustainable port initiatives. Therefore, developing effective strategies to incentivize green investments while implementing emissions control mechanisms constitutes a critical priority for transportation policymakers. Governments have developed multi-tiered policy interventions combining regulatory mandates with market incentives to address port-related emissions. For example, the Port of Los Angeles in the United States established a port emission inventory in the early 21st century and developed a real-time database for monitoring ship emissions. Local governments have implemented various regulatory measures such as emission taxes and incentives for green technologies. As a result, the Port of Los Angeles achieved a 98% reduction in sulfur oxide emissions while experiencing a 26% increase in container throughput from 2005 to 2018. Similarly, the Port of Rotterdam, located in Europe, has designated fixed areas around the port and developed an air quality assessment model to monitor emissions from ships and trucks, thereby achieving energy efficiency and emission reduction. In China, regulations and policies such as the “Law on Prevention and Control of Air Pollution” and the “Yangtze River Protection Law” have been formulated to address emission issues in the maritime transportation system. Local governments are responsible for enforcing these regulations and are encouraged to implement effective measures, including penalties, to reduce ship emissions. Furthermore, the Ministry of Transport has introduced the “Management Measures for Shore Power in Ports and Ships,” which stipulates that ships berthed in ports should use shore power. Ports and shipping companies that refuse to comply may face administrative fines imposed by local governments. Ports and shipping companies are also expected to supervise each other to promote energy-saving and emission reduction in the maritime transportation system. The implementation of emission taxes and penalties mentioned above are regulatory measures aimed at controlling carbon emissions. By assigning corresponding environmental costs to emissions, ports are compelled to make efforts to reduce their emissions.
Beyond establishing carbon emission thresholds, governments globally have deployed strategic subsidy programs to accelerate renewable energy adoption. Recent analyses indicate that 78% of OECD nations now integrate renewable subsidies with carbon pricing mechanisms (Organisation for Economic Co-operation and Development (OECD), 2023). There are a number of companies that have gotten significant help from the government in the form of subsidies (Sendstad et al., 2022). Prominent corporations exemplify this trend: Tesla secured over $15 billion in cumulative U.S. federal and state incentives through 2023, including revamped EV tax credits under the Inflation Reduction Act, while receiving 8.2 billion CNY in Chinese manufacturing subsidies between 2019-2022. The Dutch government has approved approximately $2.4 billion in subsidies for the world’s largest Carbon Capture and Storage (CCS) project, which will be located in the port of Rotterdam. It is anticipated that this project will reduce carbon emissions from the industrial cluster located around Europe’s largest seaport by approximately 10% (Janipour et al., 2021).
Based on the aforementioned government policy cases, we categorize them into subsidy policies and regulatory policies. Most of the existing literature focuses on the impact of a single policy on the greening of ports. However, our study comprehensively considers the important role played by both subsidy and regulatory policies in the port industry and conducts a holistic analysis and comparison. This enriches the literature on green investments in ports. The following are the main research questions: (i) Should the government introduce policies to promote the development of green ports? If so, which is better for social welfare: subsidies or regulations? (ii) How do these policies affect port production and green investment planning compared to the benchmark? (iii) How does the optimal policy change with the improvement of green investment efficiency?
In summary, our research aims to examine the impact of regulatory policies and subsidy policies on port production and green investment planning, and determine the optimal policy considering social welfare. To address these issues specifically, we develop a systematic model to explore investment and output decisions by port operators without government intervention, which serves as a benchmark for comparing the results of government regulations or subsidy policies. The main contributions of this study can be summarized as follows: First, it deals with both port production and green investment planning in an integrated model, as an increase in port throughput will simultaneously increase economic contribution and greenhouse gas emissions. In addition to investment costs, the environmental cost of port emissions is proposed as a standard for government regulation. The daily emissions of the port are directly proportional to its output, and the port needs to bear the corresponding environmental cost for its emissions. When it undertakes green investments, it will reduce the expenditure on this portion of the cost. Furthermore, based on the initial emission level of the port, the environmental cost is divided into high-emission and low-emission parts. The model also considers the effectiveness of green investments. The impact of green investment effectiveness on port decision-making is investigated, and the selection of government policies under different levels of effectiveness is determined.
The rest of this paper is organized as follows. Section 2 reviews the relevant literature, and Section 3 establishes the model and elaborate the game stage. The benchmark case without government policy, and the outcomes under subsidization and regulation are derived and compared in Section 4. In Section 5, numerical simulation is conducted to examine the impacts of several key parameters on port profits. Finally, Section 6 concludes the paper and suggests several future research directions. For clarify, all detailed proofs of the analytical results in this paper are provided in the Appendix 1.
2 Literature review
Our work is related to three main research streams of literature: port investment strategy, the greening of port management and government’s policy on the green development of ocean transportation. For recent studies about the port investment strategy, some discuss the investment on port capacity, see (Xu et al., 2025a; Lu et al., 2025; Balliauw et al., 2020; Gong et al., 2020; Xie et al., 2021; Xu et al., 2021). Some investigate the port investment in disaster prevention or adaptation (Xia et al., 2024; Xia and Lindsey, 2021; Zheng et al., 2021). Others focus on the green investment in port (Xu et al., 2025b; Schodler and Saraceni, 2024; Mahmud et al., 2024; Finlayson et al., 2022; Song et al., 2022);, which is can also be included in the second stream of literature.
The second stream of the literature mainly concentrates on the greening of port management. Port authorities around the world are greening their port management to safeguard their operating licenses and enhance their economic and environmental competitiveness (Notteboom and Lam, 2018). In past two decades, many scholars have shed light on the green strategies of port activities, which includes reducing energy use, using cleaner electric (electric or LNG) vehicles for port activities, and developing renewable energy sources at the port (Xu et al., 2025c; Acciaro et al., 2014; Chen et al., 2013; Winnes et al., 2015). The plans for waste management and recycling, including sewage, spills, and ballast water, reducing noise, vibration, and dust from handling activities (Lam and Notteboom, 2014) and ecosystem protection relating to the marine habitat, wetland, and coastal erosion were also taken into consideration (Chen and Pak, 2017). Further, Port and shipping companies are also focusing on the application of investment in emission reduction technologies. This includes the use of low-carbon equipment and investment in updated green technologies (Abbas, 2019; Metzger and SChinas, 2019; Ren et al., 2019), considering emissions from a port equipment perspective (Geerlings and van Duin, 2011; Yang and Lin, 2013). Some ports invest in shore power systems for ships (Li et al., 2020; Radwan et al., 2019; Tan et al., 2023), while others focus on the use of hydrogen energy in port shipping (Kizielewicz, 2022). Ballini and Bozzo (2015) proposed that shore power technology can reduce shipping carbon emissions and improve the port city environment Sciberras et al. (2015) found that using shore power technology can significantly reduce emissions when ships are docked. (Kotrikla et al., 2017). found that shore power infrastructure can promote the sustainable development of ports and mitigate negative impacts on the urban environment. Expert scholars have found that investing in port infrastructure to increase ship berthing capacity has positive impacts on reducing transportation costs and CO2 emissions. Liu et al. (2021) focused on port-led supply chain and analyzed the interest relationships between different members in three investment scenarios. They then analyzed the changes in social welfare under different investment strategies. Sogut and Erdoğan (2022) developed a conceptual framework related to the green concept to support environmental sustainability. Lai et al. (2019) proposed that port and shipping companies face complex decision-making and multiple stakeholder involvement in sustainable development, influenced by economic, social, and environmental responsibilities. Technological, organizational, market, policy support, and socio-economic aspects also pose challenges. To comply with strict emission control regulations, port and shipping companies should invest in the sustainability of the environment, improve the sustainability of the port supply chain, and enhance the sustainability of the investment environment in the face of market uncertainty (Randrianarisoa and Gillen, 2022) In this paper, we have taken a unique approach in exploring the greening of port management by focusing on the strategy of green investment and output, rather than specific implementation methods discussed in previous literature. Our goal is to effectively reduce the environmental cost in port daily operation. This fresh perspective offers a new dimension to the existing body of knowledge on port management and sustainability.
Studies on the government’s policies on green development of ocean transportation can be further divided into two categories: the emission regulations in ocean shipping (Liu et al., 2014; Tang et al., 2018; Tseng and Pilcher, 2019; Wang et al., 2007), the policies and regulations of green ports (Ayotamuno and Gobo, 2004; Birch and Taylor, 2002; Stojanovic et al., 2006; Zheng et al., 2017). Here, we focus on the latter. In the context of policies and regulations on green ports development, Farrell (1986) has proposed the concept of the subsidization of seaports at an early stage. In recent studies, some scholars have paid attention to the impact of policy instruments on port emission reduction, but most focus on the effect analysis of a single policy. For example, Li et al. (2020) Study the two-echelon maritime supply chain composed of ports and shipping companies under the government’s green subsidy and explore the subsidy mechanism and its impact. Considering the influence of government subsidies, a multi-period dual-objective port shore power deployment optimization model is constructed by Lu and Huang (2021), which is aiming at minimizing operating costs and minimizing CO2 emissions. Wang and Jiao (2022) developed a game model to study the shipping companies’ choice of low sulfur fuel oil with government subsidy, and the possible impact has been explored. Except for the subsidization, the regulations on port emission have been discussed widely. Zhu and Wang (2021) evaluated wind pattern and pollutant retention time, the actual effect and spatial distribution of fuel content control in four ports based on the control implementation. In existing studies, some scholars have paid attention to the impact of policy instruments on port emission reduction, but most focus on the effect analysis of a single policy. Park et al. (2018) constructed an analytical model of government emission standards, compared the emission reduction responses of port operators under multilateral, unilateral and single-country regulatory scenarios, and found that multilateral regulation is more likely to achieve global emission reduction goals, but did not involve a comparison with subsidy policies. Zhu and Wang (2021) evaluated the actual effects of fuel content regulations in four major ports and found that policy stringency and spatial distribution have a significant impact on emission reduction effectiveness, but did not explore the synergistic effect of economic incentive instruments such as subsidies.
To sum up, the existing literature has adequately analyzed the mechanism of a single policy, but there is a lack of a systematic comparison of the “incentive-constraint” effects of subsidy and regulatory policies in port green investment, especially the failure to combine dynamic evaluation of investment effectiveness to determine the optimal policy choice. This study addresses this gap by integrating the two policy instruments and constructing a dynamic analysis framework to fill the gap in existing research. By incorporating both subsidization and regulation into our analysis, we can gain a comprehensive understanding of their effects on the green development of seaports. We compare the outcomes under these two different government policies with a scenario in which no government intervention is present. This allows us to identify the optimal policy in light of varying levels of investment effectiveness. Furthermore, we derive insights into the investment and output decisions made by seaports under different policy scenarios.
3 Modeling preliminaries
In this part, we establish an analytic model to evaluate port operators’ decisions to adopt green investments in response to two government policies, namely subsidization and regulation. The decision-making without government interference is used as a benchmark to evaluate the impact of government regulation and subsidies.
In multi-port areas, most ports have cross hinterland, and these ports provide homogeneous services. Therefore, we consider that there are identical ports in the same region, whose demand function has the same form as Equation 1:
where is the throughputs of Port ; is the generalized price for each port, where measures the substitutability of port services, which also reflects the degree of competition between these ports.
As one of the most significant sources of carbon emissions, the daily operation of maritime ports must bear the associated environmental cost. The environmental cost of port emissions is the damage to the environment caused by the emissions in the daily production operations of ports. Using shore power when ships are docked is one of the most effective ways to reduce air pollutant emissions. However, the installation and utilization of onshore power varies from terminal to terminal (Peng et al., 2021; Radwan et al., 2019). In addition, the daily operation efficiency of each port is different, and the green concept of the cooperative terminal operators is different, which will lead to the classification of ports into low-emission zones that have implemented certain emission reduction technologies and high-emission zones that maintain the original emission levels. Therefore, the environmental cost of emissions to be borne by port is defined as Equation 2:
where the proportion of high-emission parts is , and the environmental costs that ports have to undertake for each unit of output is ; meanwhile, the proportion of low-emission part is , and the environmental costs that ports have to undertake for each unit of output is (Tian et al., 2019); represents the green investment effectiveness. Note that a larger implies that carbon emissions cost reduction efficiency increases. It worth noting that the effectiveness of green technology adoption in low-emission part will be reduced to , where . Further, we assume that and , which means green investment in ports can only reduce the environmental costs, but it won’t have any other spill-over effects. Thus, the expected profit of port has the following form:
is the green investment of each port having a convex form (Hong and Guo, 2019). Further, the social welfare is considered as the sum of port users’ surplus and the total ports’ profits, which is:
Specifically, when the policy makers choose to regulate port carbon emissions, they will set the minimum requirement, the government regulates the expected environmental cost must be less than a target . We employ superscript to denote the regulation model. The constraint can be specified as Equation 5:
When subsidization is adopted, port will receive subsidy for every unit of the green investment (denoted by superscript ). If the government choose the to subsidize the port’s green investment, the cost will be reduced from to .
We model the policy decision and port’s action with a multistage game and depict in the Figure 1.
Figure 1
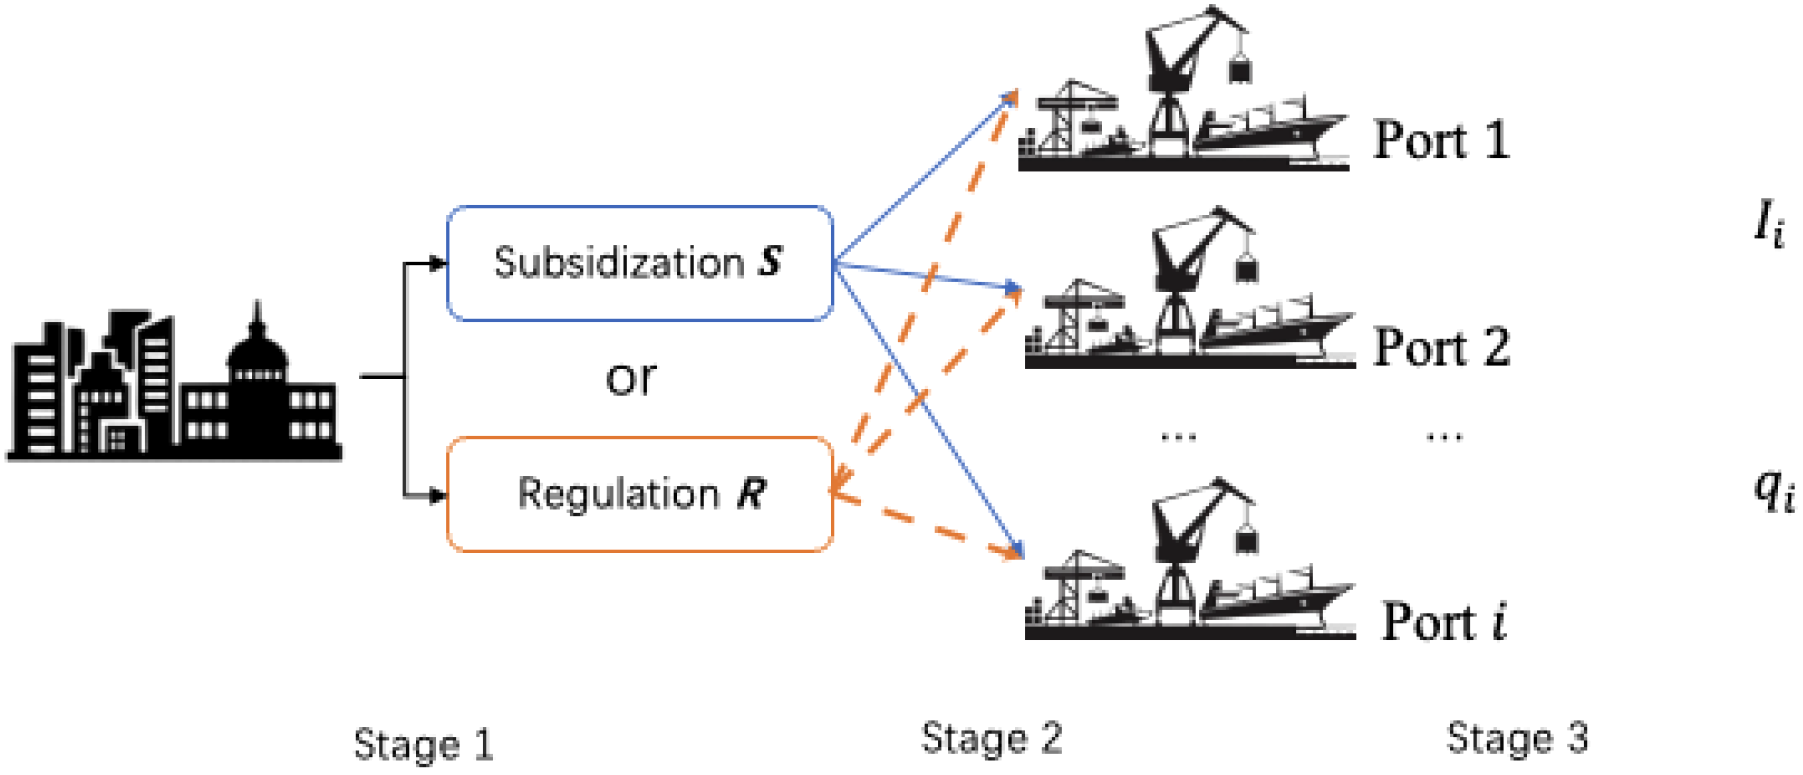
Multistage game.
The government will choose between the two policies in the first stage. Once the subsidy or the regulation is determined, ports will decide their green investments in stage 2 under either the subsidization or the regulation policy and decide the optimal outputs in stage 3.
4 Market equilibriums
To clarify all the notation used in the paper, we describe the terms in advance in Table 1.
Table 1
| Terms | Description | Unit |
|---|---|---|
| The throughput of port . | TEU | |
| The service charge of port . | USD/TEU | |
| The environmental cost of port . | USD | |
| The unit environmental cost of port production in high and low emission areas | USD | |
| Port i’s profits. | USD | |
| Social welfare. | USD | |
| The effectiveness of port green investment. | / | |
| The level of green investment decided by port . | / | |
| The investment cost coefficient. | / | |
| The proportion of areas with high emissions. | / |
Terms description.
4.1 Benchmark
The equilibrium outcomes of port’s output and green investment in benchmark model are derived and summarized in Table 2. (The detailed process is presented in the Appendix 1 by using backward induction).
Table 2
| Port i | ||||
|---|---|---|---|---|
| Benchmark | ||||
Optimal port production and green investment decision without government intervention.
After observing the equilibrium outcomes, we have the following lemma.
Lemma 1. Optimal green investment and output decisions of each port depend on the investment effectiveness .
Lemma 1 demonstrates that port investment and output decisions have a step-like structure in response to a change in investment effectiveness. To better comprehend lemma 1, we assumed the values of a few factors, and Figures 2a, b depicts the ideal port’s investment and production. When ,we observe that the port’s green investment will increase with the investment’s effectiveness, but the port’s production will not increase correspondingly. When ,we find and , which demonstrates that increasing investment effectiveness will reduce investment while increasing output. This is due to the fact that when the emission reductions from green investment can only cover the environmental cost of the low-emission portion, the cost of the investment exceeds its contribution. When ,with the growth of green contribution, the environmental cost of the high-emission portion will be partially covered, the port operator will be more likely to invest in green technology. However, after all the environmental cost is fully covered (, the port will not pursue additional green investment because it is meaningless to the contribution of green investment.
Figure 2
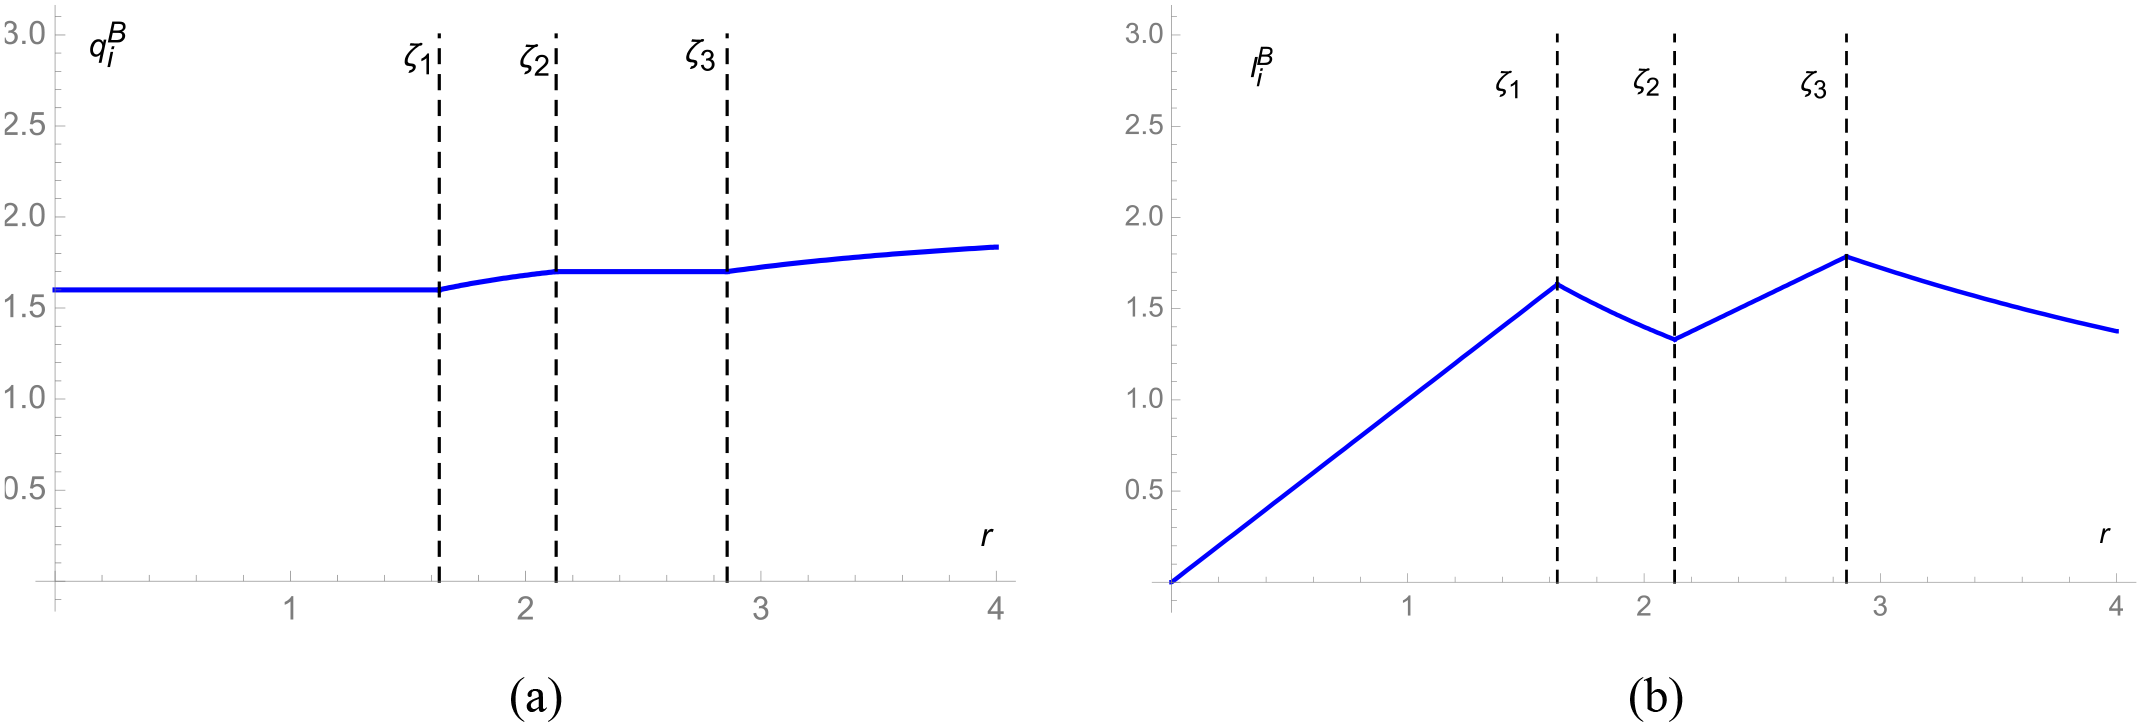
The port’s optimal output and green investment in benchmark model.
In addition, we find that the port’s investment and output will drop with the growth in the number of rivals in the same region and will increase with the market size, which can be obtained from . A less concentrated market, on the other hand, may encourage a greater overall investment and output, both of which fits in with the Cournot model. According to the Cournot model, as the number of competitive enterprises increases, output of each individual participant will decrease. However, the output of the whole market will be improved simultaneously. Additionally, the size of the market drives up production and green investment at each port.
4.2 Regulation and subsidization
When the government chooses a policy between regulation and subsidization, the policy becomes the premise upon which ports determine the optimal green investment and output. The equilibrium outcomes of the regulation and subsidy are presented in Tables 2, 3, and the calculation procedure is detailed in Appendix 1.
Table 3
| Port i | ||
|---|---|---|
| Regulation | ||
Optimal port production and green investment decisions under government’s regulation.
4.2.1 Regulation policy
Lemma 2. Optimal green investment and output decisions under government’s regulation of each port depend on the investment effectiveness and the minimum regulation .
Lemma 2 and Table 3 demonstrate that, based on the regulation model, ports’ decisions about their green investments and outputs have been split into two portions (when ) due to an increase in the effectiveness of the investments. We discover that ports always have the intention of increasing their green investments while simultaneously decreasing their outputs, which can be deduced from and .This is due to the fact that as the effectiveness of investments increases, green investments will provide a greater contribution to the reduction of the environmental cost, while ports will be required to bear a lower total cost of investments. Moreover, the government has a carbon emission regulation that is less strict in the first part of the region () and a regulation that is more severe in the second portion of the region (). Because of the more restrictive standards imposed by the government, ports are being required to cover the environmental cost of both low and high emission parts to the greatest extent possible, which has caused a jump at .
To compare the benchmark model with the regulatory model, we have made some simple numerical assumptions and depicted the results in Figures 3a, b. It is obvious that after the government makes the decision to set the maximum expected environmental cost, ports will be willing to produce more while investing less( and ).This may be because increasing investment will hurt ports profits; increasing production and reducing investment will also hurt ports profits if they are operating within regulatory boundaries; however, increasing green investment has a greater potential for loss, which is why ports would rather increase production than expand green investment. This kind of situation will be improved as investment effectiveness increases.
Figure 3
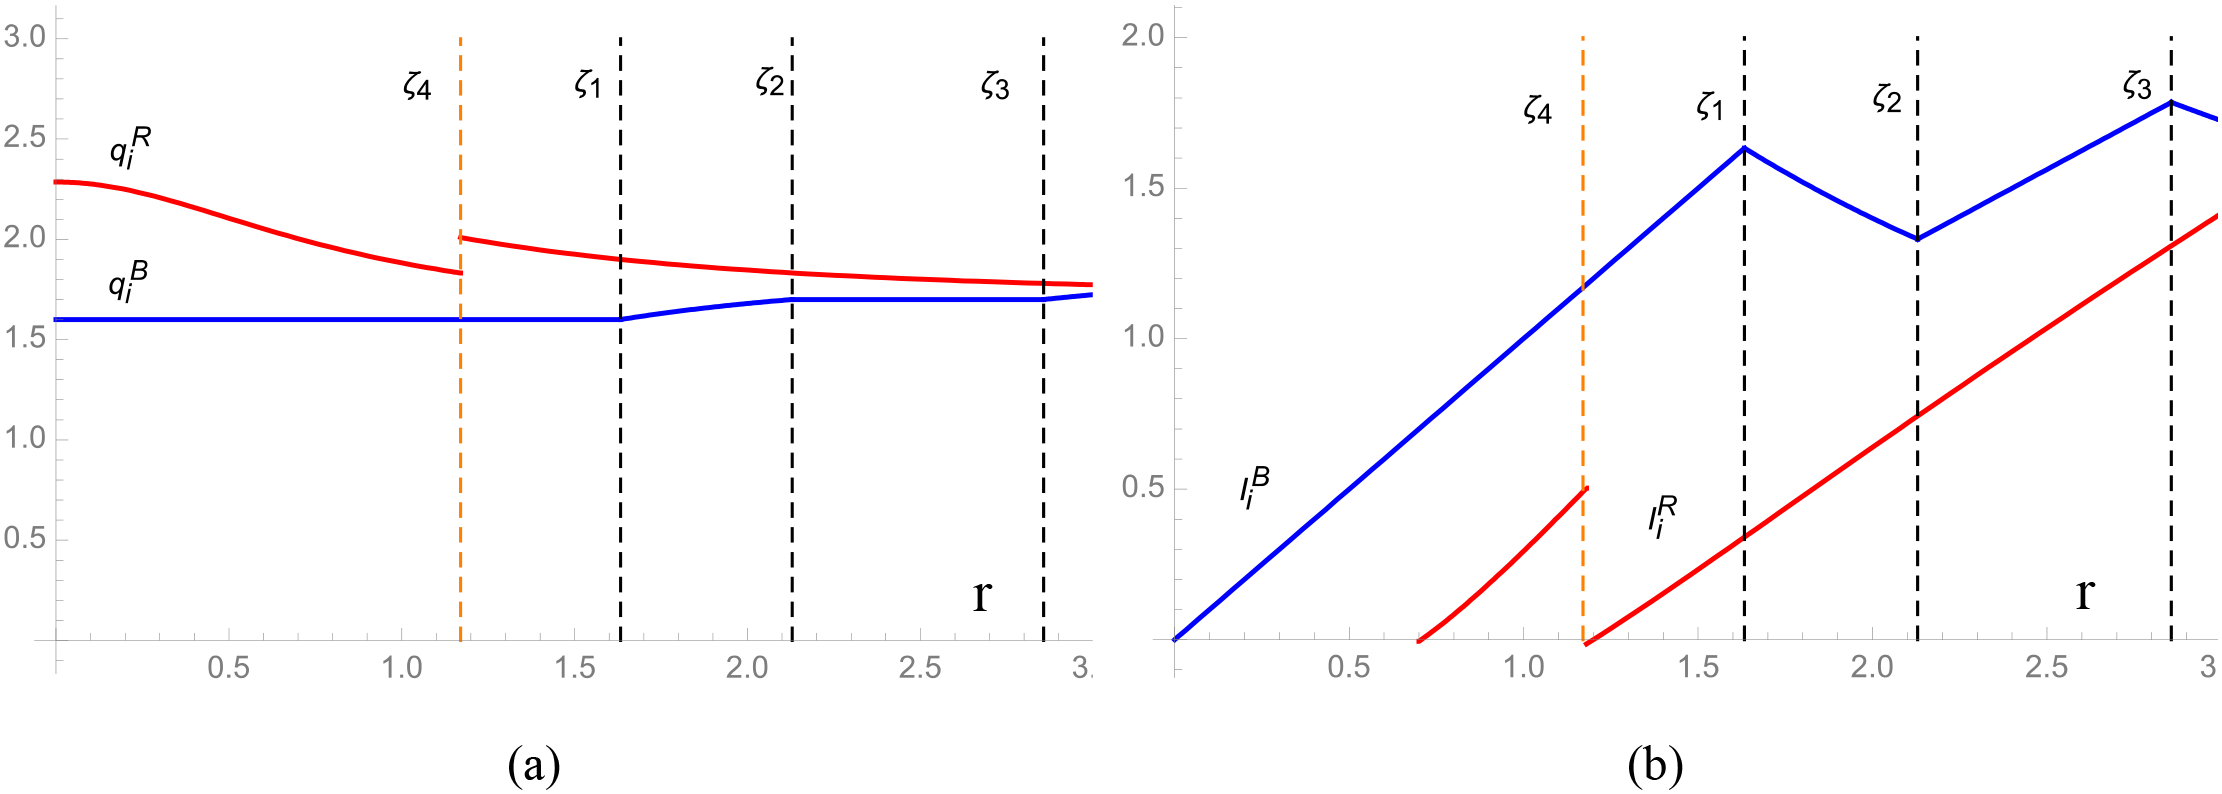
The port’s optimal output and green investment in regulation model.
4.2.2 Subsidization policy
After observing the equilibrium outcomes, we have the following lemma.
Lemma 3. Optimal green investment and output decisions under government’s subsidization of each port depend on the investment effectiveness and the subsidy .
Lemma 3 and Table 4 demonstrate that, according to the subsidization model, the port’s investments and outputs similarly exhibit a step structure with rising effectiveness. In addition, it states that the subsidy is always necessary for ports and that it aims to reach as much as feasible in order to fully cover the green investments made by ports because . It is found that and , as demonstrated by the outcomes depicted in Figures 4a, b.
Table 4
| Port i | ||
|---|---|---|
| Subsidization | ||
Optimal port production and green investment decision under government’s subsidization.
Figure 4
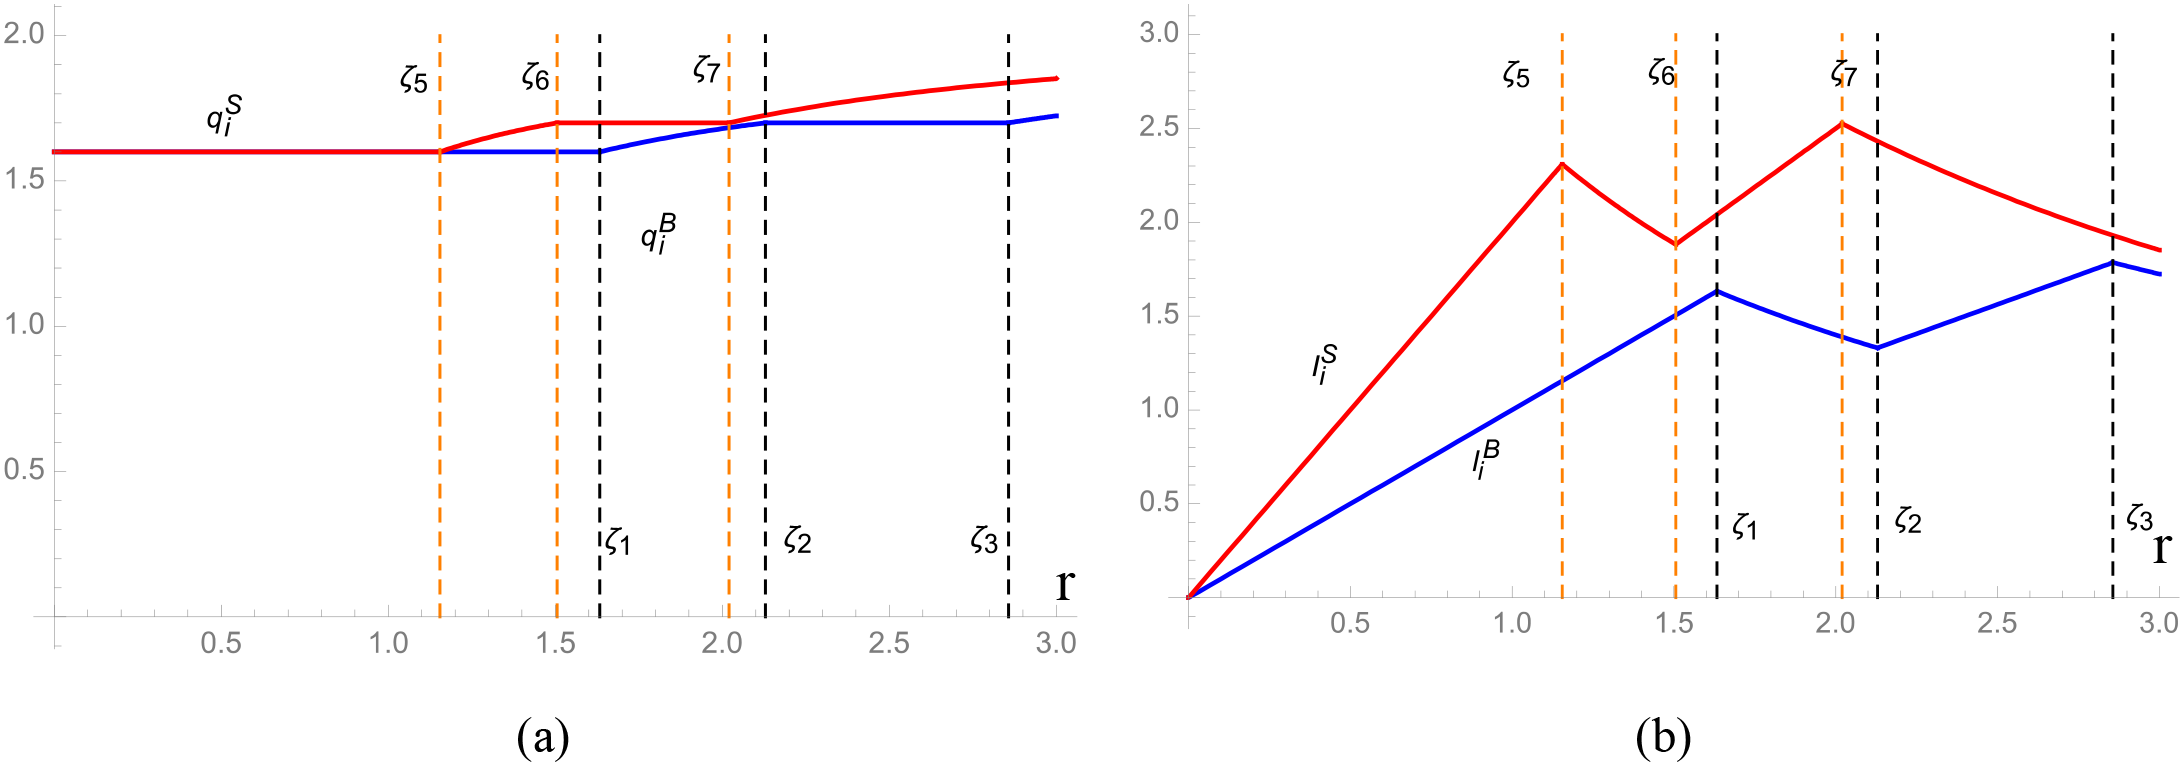
The port’s optimal output and green investment in subsidization model.
Comparing the subsidization model to the benchmark reveals that, unlike the regulatory model, government subsidies simultaneously stimulate green port investment and outputs. Therefore, the subsidization policy is a more active strategy to controlling carbon emissions by limiting investment, whereas the regulating policy is a more passive approach for ports.
4.2.3 The optimal policy
In order to find out the government’s optimal options in the three models, namely benchmark, regulation and subsidization, we compare the expected social welfare and have the results depicted as follows in Figure 5.
Figure 5
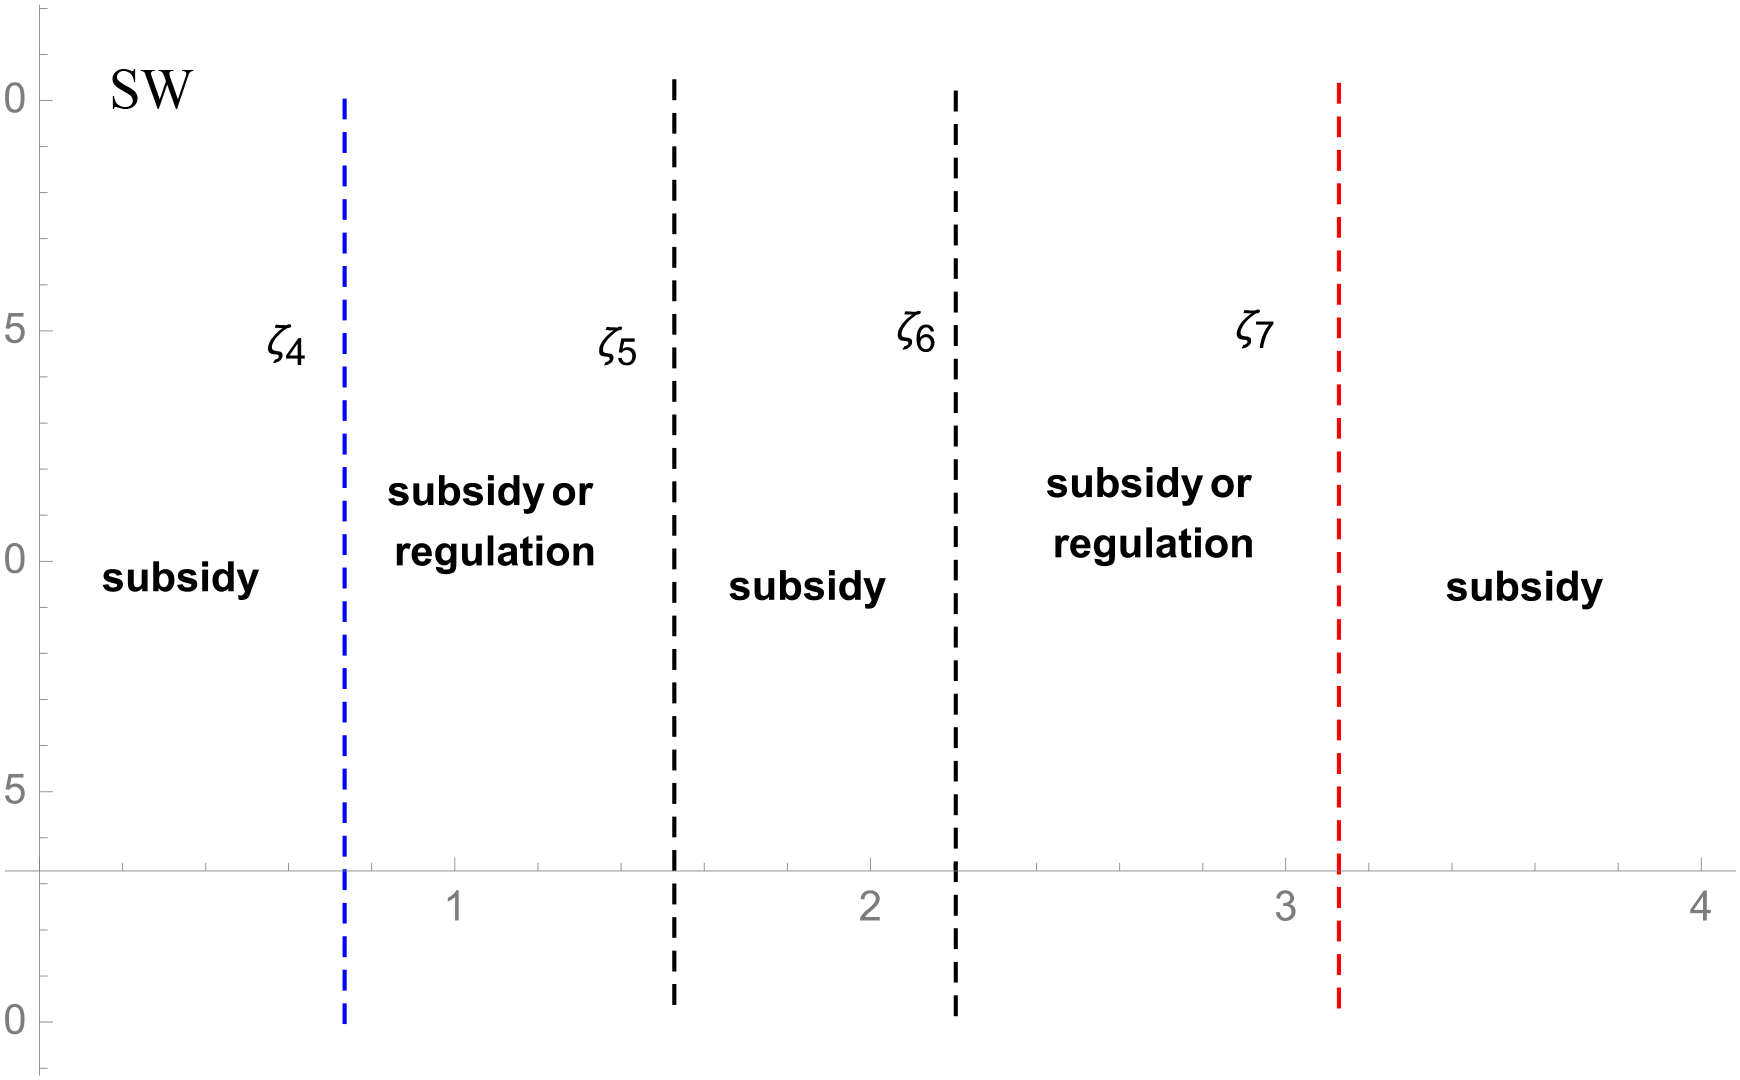
The optimal government policy.
Without government policy, port green investments will contribute less to social welfare than they would with policy assistance. The policies stimulate green investment and output to some extent. Even if the government provides subsidies, ports will not increase their outputs to cover the additional environmental costs while the effectiveness of investment is at a relatively low level, that is, . During this time, ports will invest in green technology; but, they will not increase their outputs to bear a greater share of the environmental costs. From Figure 5, it can be found that of the two kinds of government policy, subsidy policy still holds the dominant position.
When ,the total environmental benefit rises, and the subsidy program not only supports port investment but also boosts port output. And in ,when the investment is efficient enough, the port has a strong motivation to fully cover the environmental cost from both high emission and low emission parts, thereby making the minimum regulation unnecessary. Consequently, the subsidies contribute to the enhancement of social welfare.
However, when ,due to the existence of the minimum regulation on the environmental cost, the port will raise its investment in green technology, but the green benefit will still be less than its cost. In this way, large-scale output will harm the port’s profitability, thus the port’s output will be lowered. In this case, minimum regulations may be preferable than subsidies. At this point, for port green development, although regulation leads to a decline in port output, the cost savings brought about by increased green investment partially offset the profit loss. Especially when investment effectiveness is at a medium level, the marginal emission reduction cost is lower than the fiscal expenditure on subsidies. Under regulation, the reduction in output lowers consumer surplus, but the improvement in environmental benefits makes up for this loss, resulting in an overall increase in social welfare. In contrast, although subsidy policies boost consumer surplus, high subsidy costs may crowd out public welfare expenditures, leading to a net loss of social welfare in the interval of medium investment effectiveness. In addition, it is indicated that if there are more rivals or a larger market, the players will be less interested in growing their investment; hence, regulation will be more beneficial in such a circumstance.
5 Numerical studies
In Section 4, we explore the impact of investment effectiveness on port optimal green investment and output decisions under government’s policies. However, it’s still missing the exploration of the impact of several key parameters on the ports’ profits. Therefore, in this section, we conduct the numerical studies to examine the impacts of effectiveness parameter , the proportion of high-emission part in the port and the substitutability of port services .We set the following parameter values as: ,which can be verified that these values satisfy all the positive assumptions in our model. First, we discuss the ports’ profits with different levels of . In this case, we let and depict the results in Figure 6.
Figure 6
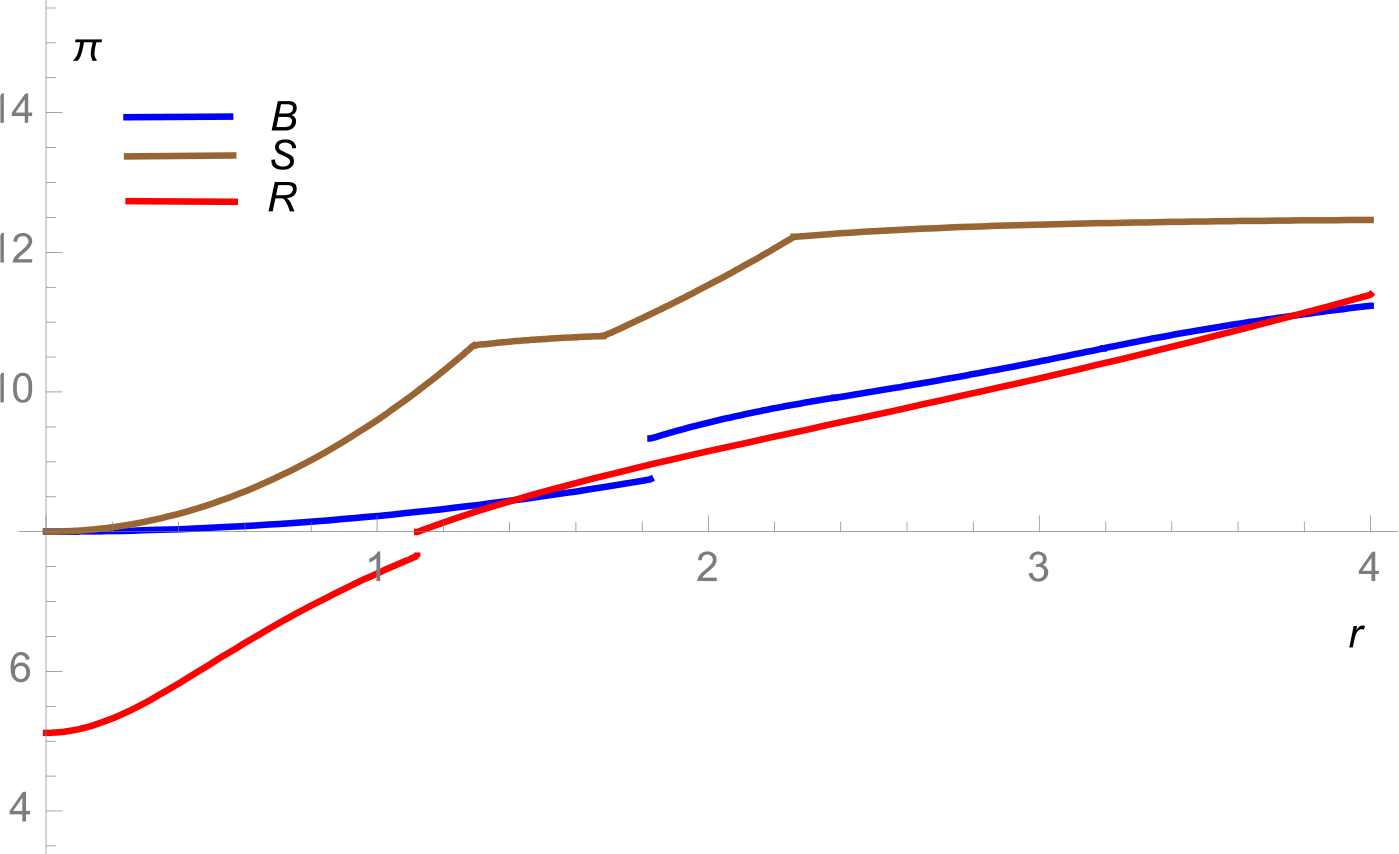
The effect of on ports’ profits under three models.
Figure 6 illustrates that in all three options, the revenues generated by the ports will go up by . It can be obtained that, from the perspective of port operators, once the government decides to subsidize their green investment, they can achieve the highest profits. However, it can be found that the regulation policy would hurt ports’ profits to some extent. Only when the investment effectiveness is at a high level, the regulation of government won’t be annoying for port operators.
Taking the application of shore power at Shanghai Port as an example, the Shanghai Municipal Transportation Commission began to promote the construction of shore power facilities at the port in 2014 and formulated relevant policies and standards. In 2015, the first batch of shore power facilities at Shanghai Port were put into use, and some ships started to use shore power for power supply. In 2017, Shanghai explicitly required ships of specific types and sizes to install shore power interfaces and use shore power for power supply. In the initial stage of shore power implementation, the utilization rate of shore power was relatively low due to factors such as the need for shore power infrastructure construction and ship adaptability. The construction and maintenance of shore power facilities usually require a certain amount of investment, which also has an impact on the financial status of the port. It was not until 2019 that the Shanghai Municipal Government introduced a subsidy policy, providing subsidies and incentive measures for ships that meet specific conditions to use shore power. The implementation of this subsidy policy further encouraged ships to use shore power, thereby increasing the utilization rate of shore power. After the implementation of the subsidy policy in 2019, the utilization rate of shore power increased from 15% to 40%. According to the 2020 Environmental Report of the Shanghai Port Authority, the proportion of high-emission areas θ decreased from 0.6 to 0.3. Combined with model calculations, the effectiveness of green investment r at this time is approximately 1.2, which is between the theoretical thresholds ζ4 (about 1.0) and ζ5 (about 1.5). This is consistent with the model’s prediction that “regulatory policies are more optimal under moderate investment effectiveness” — the mandatory regulations on shore power use (regulatory policies) introduced by Shanghai Port during the same period reduced carbon emissions per unit throughput by 22%, which confirms the theoretical conclusion.
Next, we study the impacts of . To distinguish the impact of ,we divide it into low and high values , and plot the outcomes in Figures 7a, b.
Figure 7
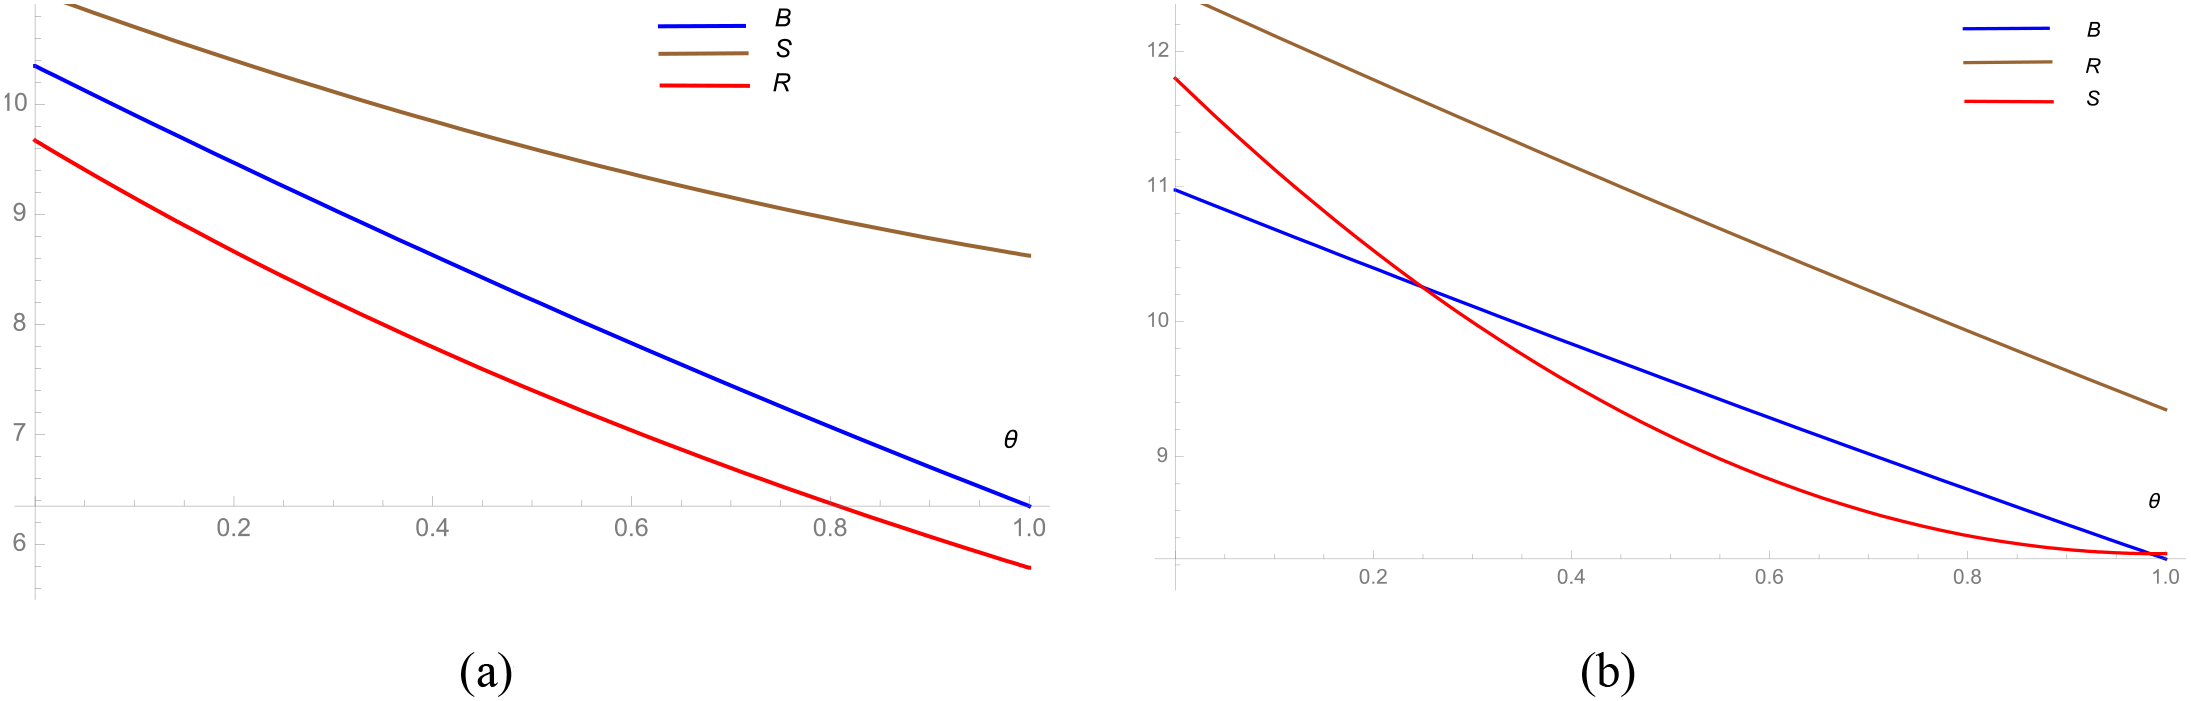
The effects of on ports’ profits under three models. (a) r=1 (b) r=3.
It can be obtained from Figure 7 intuitively that ports’ profit will decrease with the increasing in the proportion of high-emission part of the ports. The subsidy policy always benefits the ports’ profits. When the investment effectiveness is at a low level, the government’s regulation policy will worsen the situation of ports. Further, when the high-emission part accounts for a smaller proportion, and the investment effectiveness is high, the ports situation can be improved, which is in line with Lemma 2. However, once the proportion of high-emission part become larger, it is better for ports’ profits without regulation policy. The same as , the substitutability of port services also has similar effect on ports’ profits (see Figure 8). Interestingly, when competition between ports is intense, profits tend to be the same in all three models. Moreover, when substitutability between ports is not strong, higher investment effectiveness will be more conducive to port profits.
Figure 8
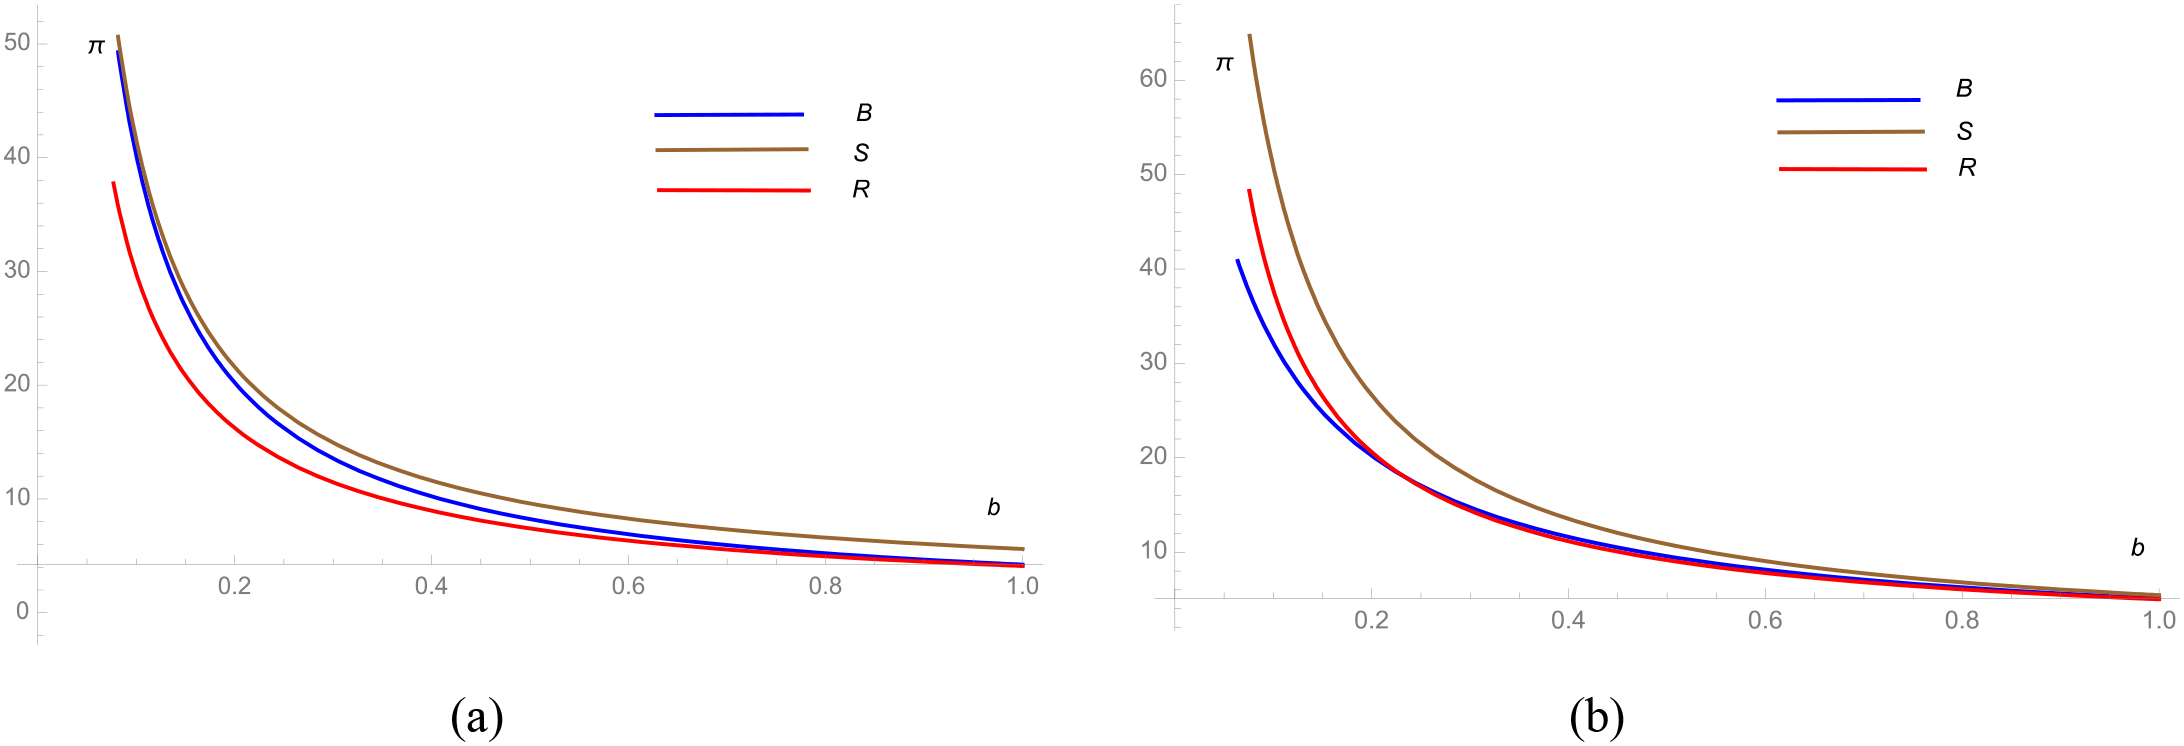
The effects of on ports’ profits under three models. (a) r=1 (b) r=3.
In recent years, Shanghai Port and Ningbo-Zhoushan Port, both ranking among the top five ports globally in terms of container throughput, have maintained a long-term competitive relationship. Both ports have been committed to the development and improvement of shore power facilities. Ningbo-Zhoushan Port began to promote the construction of shore power facilities in 2017 and implemented them within its port area. Shanghai Port, however, started earlier in advancing shore power facility construction and has a more comprehensive set of shore power facilities. Although both ports have received government support in promoting the development and utilization of shore power facilities, there is a key difference: Shanghai Port explicitly requires ships of certain types and sizes to install shore power interfaces and use shore power supply, while Ningbo-Zhoushan Port has no such regulations. As a result, the shore power utilization rate of Shanghai Port is higher, at approximately 30%, while that of Ningbo-Zhoushan Port is relatively lower, at around 10%. It can be calculated that due to the lack of mandatory regulations (θ=0.5, rθ=0.5, Ningbo-Zhoushan Port falls into the interval below ζ4. The model indicates that subsidy policies are more effective in this scenario, which is consistent with the actual situation of the port—its shore power utilization rate only reaches 10% (lower than that of Shanghai Port) even after relying on subsidies. This reveals the limitations of pure subsidies under low investment effectiveness. Therefore, in practical applications, although subsidies can attract green investment, regulatory policies are a better choice to ensure the sustainable development of green ports.
6 Conclusions
An economic model is developed in this paper to analyze the impact of government policies on green investment in ports. Two commonly used policies, regulatory policy and subsidy policy, are examined and compared. The environmental cost of port emissions is used as a measure of government regulation, which has not been utilized in previous studies. Based on this, the paper analyzes the effects of the two policies on port production and green investments, as well as the optimal choices for the government under different circumstances. Therefore, this paper presents the following theoretical implications and new managerial insights.
-
The analysis results show that compared with the situation without government policies, these two policies have the same impact on green investment, but their impacts on port output are opposite. From the perspective of regulation, low investment efficiency is not conducive to green investment in ports. To comply with government regulations, ports will increase investment and restrict production to meet the requirements. The differences in such impacts are particularly evident in the stages of policy implementation: in the initial stage (), to avoid the inhibitory effect of regulation on output, the government will adopt loose regulation, accompanied by high subsidies. For example, Shanghai Port subsidized 0.5 yuan per kilowatt-hour of shore power used in 2019, which not only quickly boosted investment willingness through subsidies but also ensured stable growth of output through loose regulation. This also confirms the inverse relationship between the output-promoting effect of subsidies and the potential output restriction caused by regulation.
-
Different from government regulation, the existence of subsidies effectively reduces the cost of green investment for ports. Ports always strive to obtain as many subsidies as possible. Therefore, government subsidies can both promote green investment and drive the growth of port output. This effect is most significant in the initial stage (): a high subsidy rate (s=0.3-0.5) directly covers more than 50% of the green investment cost, greatly lowering the investment threshold for ports. When entering the medium-term stage (): subsidies are gradually reduced (s=0.1-0.2), but the investment foundation laid in the early stage has stabilized the application of green technologies, providing conditions for the subsequent policy transition. This also indicates from the side the key driving role of subsidies in green investment and output during the start-up stage.
-
When comparing these two mechanisms, subsidies are often a more proactive means, while regulatory policies are more passive. However, both policies can promote social welfare better than no policy intervention. When investment efficiency is low, government subsidies will encourage ports to increase investment. When investment efficiency is high, subsidies serve as rewards for ports. Only when investment efficiency is at a medium level will regulation become a better choice. Although strict regulation will not promote output, ports will increase investment in green technologies. In such cases, subsidy policies may not achieve better results. Specifically, the differences in such policy choices show a clear path in different stages: in the initial stage () with low investment efficiency, high subsidies (s=0.3-0.5) become the core means, supplemented by loose regulation, which can quickly activate ports’ investment willingness and ensure stable output growth; in the medium-term stage ( as investment efficiency improves, subsidies are gradually reduced (s=0.1-0.2) and shifted to strict regulation, because the improved investment effectiveness makes regulatory costs lower than subsidy costs; in the mature stage (), with high investment efficiency, subsidies can be canceled, and market-oriented regulation (such as carbon emission rights trading) becomes the main approach. The Port of Rotterdam, through market-oriented financing for the “Carbon Capture and Storage (CCS) Project” combined with emission taxes (regulatory policies), achieves the maximization of social welfare.
Based on these conclusions, we believe that in practical applications, the government should select appropriate policy combinations according to specific circumstances to promote the sustainable development of ports. From the government’s perspective, initial subsidy policies can incentivize the steady progress of port greening efforts, while regulatory policies serve as the primary means to consolidate the green development process in subsequent stages. Relying solely on subsidies may undermine social welfare, whereas excessive regulation will impose a burden on port operators. In the early stage, subsidies are necessary to stimulate green investment, but as time goes on and the effects of green measures gradually become apparent, regulatory policies emerge as a better choice. The aforementioned phased policy design (high subsidies + loose regulation in the initial stage, reduced subsidies + strict regulation in the medium term, and no subsidies + market-oriented regulation in the mature stage) is a concrete manifestation of this logic. It not only takes into account the characteristics of investment efficiency in different stages but also achieves a balance between policy costs and social welfare.
Future research can further explore the specific design and implementation of these policies and assess their long-term impacts on the sustainable development of ports. By conducting in-depth studies on the interaction between ports and government policies, we can provide more management insights and decision support for the sustainable development of the port industry. In addition, this paper acknowledges certain unconsidered limitations. Firstly, the government uses public funds to provide subsidies, and these funds could otherwise be allocated to other sectors such as education and healthcare, which might enhance social welfare. The missing element here lies in the shadow price. We can intuitively conclude that once shadow prices are taken into account, the advantages of subsidies over regulation will be significantly diminished. Moreover, when considering regulatory policies, we assume that the regulation of carbon emissions represents the environmental cost; however, such costs are also related to factors such as the social and economic environment, climate, and others. We have also assumed that ports are homogeneous, but in reality, ports vary greatly in terms of scale, throughput, and other aspects, and these factors need to be taken into consideration. These unconsidered issues are important for future research and warrant further investigation.
Statements
Data availability statement
The original contributions presented in the study are included in the article/supplementary material. Further inquiries can be directed to the corresponding author.
Author contributions
FX: Methodology, Writing – original draft, Investigation, Conceptualization, Writing – review & editing, Formal Analysis. ZZ: Resources, Data curation, Project administration, Methodology, Writing – review & editing, Investigation, Conceptualization, Supervision, Funding acquisition.
Funding
The author(s) declare that no financial support was received for the research and/or publication of this article.
Conflict of interest
The authors declare that the research was conducted in the absence of any commercial or financial relationships that could be construed as a potential conflict of interest.
Generative AI statement
The author(s) declare that no Generative AI was used in the creation of this manuscript.
Publisher’s note
All claims expressed in this article are solely those of the authors and do not necessarily represent those of their affiliated organizations, or those of the publisher, the editors and the reviewers. Any product that may be evaluated in this article, or claim that may be made by its manufacturer, is not guaranteed or endorsed by the publisher.
References
1
Abbas J. (2019). Impact of total quality management on corporate green performance through the mediating role of corporate social responsibility. J. Cleaner Production227, 118458. doi: 10.1016/j.jclepro.2019.118458
2
Acciaro M. Ghiara H. Cusano M. I. (2014). Energy management in seaports: A new role for port authorities. Energy Policy71, 4–12. doi: 10.1016/j.enpol.2014.04.013
3
Ayotamuno J. M. Gobo A. E. (2004). Municipal solid waste management in Port Harcourt, Nigeria: Obstacles and prospects. Manage. Environ. Quality: Int. J.15, 389–398. doi: 10.1108/14777830410540135
4
Balliauw M. (2020). Time to build: A real options analysis of port capacity expansion investments under uncertainty. Res. Transp. Econ.83, 100929. doi: 10.1016/j.retrec.2020.100929
5
Ballini F. Bozzo R. (2015). Air pollution from ships in ports: The socio-economic benefit of cold-ironing technology. Res. Transportation Business Manage.17, 92–98. doi: 10.1016/j.rtbm.2015.10.007
6
Birch G. F. Taylor S. E. (2002). Application of sediment quality guidelines in the assessment and management of contaminated surficial sediments in port jackson (Sydney Harbour), Australia. Environ. Manage.29, 860–870. doi: 10.1007/s00267-001-2620-4
7
Chen G. Govindan K. Golias M. M. (2013). Reducing truck emissions at container terminals in a low carbon economy: Proposal of a queueing-based bi-objective model for optimizing truck arrival pattern. Transportation Res. Part E: Logistics Transportation Rev.55, 3–22. doi: 10.1016/j.tre.2013.03.008
8
Chen Z. Pak M. (2017). A Delphi analysis on green performance evaluation indices for ports in China. Maritime Policy Manage.44, 537–550. doi: 10.1080/03088839.2017.1327726
9
China Ports & Harbors Association (2024). 2023 Annual report on global container throughput statistics. Shanghai: China Ports & Harbors Association.
10
Farrell S. (1986). The subsidization of seaports: an alternative approach. Maritime Policy Manage.13, 177–184. doi: 10.1080/03088838600000061
11
Finlayson K. A. Limpus C. J. van de Merwe J. P. (2022). Temporal changes in chemical contamination of green turtles (Chelonia mydas) foraging in a heavily industrialised seaport. Sci. Total Environ.817, 152848. doi: 10.1016/j.scitotenv.2021.152848
12
Geerlings H. van Duin R. (2011). A new method for assessing CO2-emissions from container terminals: a promising approach applied in Rotterdam. J. Cleaner Production19, 657–666. doi: 10.1016/j.jclepro.2010.10.012
13
Global Maritime Forum (2023). Mapping of zero-emission pilots and demonstrations in maritime transport (Copenhagen: Global Maritime Forum).
14
Gong L. Xiao Y. Jiang C. Zheng S. Fu X. (2020). Seaport investments in capacity and natural disaster prevention. Transportation Res. Part D: Transport Environ.85, 102367. doi: 10.1016/j.trd.2020.102367
15
Hong Z. Guo X. (2019). Green product supply chain contracts considering environmental responsibilities. Omega83, 155–166. doi: 10.1016/j.omega.2018.02.010
16
IMO (2023). Available online at: https://www.imo.org/en/OurWork/Environment/Pages/2023-IMO-Strategy-on-Reduction-of-GHG-Emissions-from-Ships.aspx (Accessed July 29, 2025).
17
Janipour Z. Swennenhuis F. de Gooyert V. de Coninck H. (2021). Understanding contrasting narratives on carbon dioxide capture and storage for Dutch industry using system dynamics. Int. J. Greenhouse Gas Control105, 103235. doi: 10.1016/j.ijggc.2020.103235
18
Kizielewicz J. (2022). Monitoring energy efficiency and environmental ship index by cruise seaports in Northern Europe. Energies15, 4215. doi: 10.3390/en15124215
19
Kotrikla A. M. Lilas T. Nikitakos N. (2017). Abatement of air pollution at an aegean island port utilizing shore side electricity and renewable energy. Mar. Policy75, 238–248. doi: 10.1016/j.marpol.2016.01.026
20
Lai X. Tao Y. Wang F. Zou Z. (2019). Sustainability investment in maritime supply chain with risk behavior and information sharing. Int. J. production economics218, 16–29. doi: 10.1016/j.ijpe.2019.02.021
21
Lam J. S. L. Notteboom T. (2014). The greening of ports: A comparison of port management tools used by leading ports in Asia and Europe. Transport Rev.34, 169–189. doi: 10.1080/01441647.2014.891162
22
Li X. Kuang H. Hu Y. (2020). Using system dynamics and game model to estimate optimal subsidy in shore power technology. IEEE Access8, 116310–116320. doi: 10.1109/ACCESS.2020.3004183
23
Liu T.-K. Sheu H.-Y. Tsai J.-Y. (2014). Sulfur dioxide emission estimates from merchant vessels in a port area and related control strategies. Aerosol Air Qual. Res.14, 413–421. doi: 10.4209/aaqr.2013.02.0061
24
Liu J. Zhao H. Li J. (2021). Research on investment strategy of maritime supply chain based on green investment efficiency. Chin. Manage. Sci.29, 33–44. doi: 10.16381/j.cnki.issn1003-207x.2019.1898
25
Lu H. Huang L. (2021). Optimization of shore power deployment in green ports considering government subsidies. Sustainability13, 1640. doi: 10.3390/su13041640
26
Lu B. Luo R. Wu X. Wang H. (2025). Optimisation of port investment strategies considering uncertain cargo demand and environmental pollutions. Comput. Ind. Eng.200, 110788. doi: 10.1016/j.cie.2024.110788
27
Mahmud K. K. Chowdhury M. M. H. Shaheen M. M. A. (2024). Green port management practices for sustainable port operations: a multi method study of Asian ports. Maritime Policy Manage.51, 1902–1937. doi: 10.1080/03088839.2023.2258125
28
Metzger D. SChinas O. (2019). Fuzzy real options and shared savings: Investment appraisal for green shipping technologies. Transportation Res. Part D: Transport Environ.77, 1–10. doi: 10.1016/j.trd.2019.09.016
29
Notteboom T. Lam J. (2018). The greening of terminal concessions in seaports. Sustainability10, 3318. doi: 10.3390/su10093318
30
Organisation for Economic Co-operation and Development (OECD) (2023). Climate Policy Instruments Monitoring Report 2023 (Paris: OECD Publishing).
31
Park H. Chang Y.-T. Zou B. (2018). Emission control under private port operator duopoly. Transportation Res. Part E: Logistics Transportation Rev.114, 40–65. doi: 10.1016/j.tre.2018.03.010
32
Peng Y. Dong M. Li X. Liu H. Wang W. (2021). Cooperative optimization of shore power allocation and berth allocation: A balance between cost and environmental benefit. J. Cleaner Production279, 123816. doi: 10.1016/j.jclepro.2020.123816
33
Radwan M. E. Chen J. Wan Z. Zheng T. Hua C. Huang X. (2019). Critical barriers to the introduction of shore power supply for green port development: case of Djibouti container terminals. Clean Technol. Environ. Policy21, 1293–1306. doi: 10.1007/s10098-019-01706-z
34
Randrianarisoa L. M. Gillen D. (2022). Reducing emissions in international transport: A supply chain perspective. Transportation research, Part D. Transport Environ.102, 103074. doi: 10.1016/j.trd.2021.103074
35
Ren S. He D. Zhang T. Chen X. (2019). Symbolic reactions or substantive pro-environmental behaviour? An empirical study of corporate environmental performance under the government’s environmental subsidy scheme. Business strategy Environ.28, 845–860. doi: 10.1002/bse.v28.6
36
Schodler K. Saraceni A. (2024). Factors influencing greenhouse gas reduction measures in european ports: implications for sustainable investing. J. Risk Financial Manage.17, 329. doi: 10.3390/jrfm17080329
37
Sciberras E. A. Zahawi B. Atkinson D. J. (2015). Electrical characteristics of cold ironing energy supply for berthed ships. Transportation Res. Part D Transport Environ.39, 31–43. doi: 10.1016/j.trd.2015.05.007
38
Sendstad L. H. Hagspiel V. Mikkelsen W. J. Ravndal R. Tveitstøl M. (2022). The impact of subsidy retraction on European renewable energy investments. Energy Policy160, 112675. doi: 10.1016/j.enpol.2021.112675
39
Sogut M. Z. Erdoğan O. (2022). An investigation on a holistic framework of green port transition based on energy and environmental sustainability. Ocean Eng.266, 112671. doi: 10.1016/j.oceaneng.2022.112671
40
Song Z. He S. Wang Y. An J. (2022). Green pharmaceutical supply chain coordination considering green investment, green logistics, and government intervention. Environ. Sci. pollut. Res. Int.29, 63321–63343. doi: 10.1007/s11356-021-18275-8
41
Stojanovic T. A. Ormerod Smith H. D. Wooldridge C. F. (2006). The impact of the Habitats Directive on European port operations and management. GeoJournal65, 165–176. doi: 10.1007/s10708-006-0004-2
42
Tan Z. Zeng X. Wang T. Wang Y. Chen J. (2023). Capacity investment of shore power berths for a container port: Environmental incentive and infrastructure subsidy policies. Ocean Coast. Manage.239, 106582. doi: 10.1016/j.ocecoaman.2023.106582
43
Tang R. Wu Z. Li X. (2018). Optimal operation of photovoltaic/battery/diesel/cold-ironing hybrid energy system for maritime application. Energy162, 697–714. doi: 10.1016/j.energy.2018.08.048
44
Tian L. Ye Q. Zhen Z. (2019). A new assessment model ofenvironmental cost of carbon and its situation analysis in China. J. Cleaner Production211, 1434–1443. doi: 10.1016/j.jclepro.2018.11.117
45
Tseng P.-H. Pilcher N. (2019). Evaluating the key factors of green port policies in Taiwan through quantitative and qualitative approaches. Transport Policy82, 127–137. doi: 10.1016/j.tranpol.2018.12.014
46
UTCAD (2023). Available online at: https://unctad.org/publication/annual-report-2023 (Accessed July 29, 2025).
47
Wang C. Corbett J. J. Winebrake J. J. (2007). Cost-effectiveness of reducing sulfur emissions from ships. Environ. Sci. Technol.41, 8233–8239. doi: 10.1021/es070812w
48
Wang C. Jiao Y. (2022). Shipping companies’ choice of low sulfur fuel oil with government subsidy and different maritime supply chain power structures. Maritime Policy Manage.49, 323–346. doi: 10.1080/03088839.2021.1950860
49
Winnes H. Styhre L. Fridell E. (2015). Reducing GHG emissions from ships in port areas. Res. Transportation Business Manage.17, 73–82. doi: 10.1016/j.rtbm.2015.10.008
50
Xia W. Lindsey R. (2021). Port adaptation to climate change and capacity investments under uncertainty. Transportation Res. Part B: Methodological152, 180–204. doi: 10.1016/j.trb.2021.08.009
51
Xia W. Mishra J. Adulyasak Y. (2024). Seaport adaptation and capacity investments under inter-port competition and climate-change uncertainty. Transportation Res. Part D: Transport Environ.130, 104183. doi: 10.1016/j.trd.2024.104183
52
Xie F. Wang C. Xu L. (2021). Whether to invest in terminal efficiency: A perspective considering customer preference and capital constraint in competitive environment? Ocean Coast. Manage.205, 105563. doi: 10.1016/j.ocecoaman.2021.105563
53
Xu L. Huang J. Fu S. Chen J . (2025a). Evaluation of navigation capacity in the Northeast Arctic passage: evidence from multiple factors. Maritime Policy Manage52, 497–513. doi: 10.1080/03088839.2024.2376126
54
Xu L. Shen C. Chen J. (2025b). The impact of the Maritime Silk Road Initiative on the carbon intensity of the participating countries. Maritime Economics Logistics27, 349. doi: 10.1057/s41278-024-00295-z
55
Xu C. Y. Wang Y. Q. Yao D. L. Qiu S. Y. Li H. (2025c). Research on the coordination of a marine green fuel supply chain considering a cost-sharing contract and a revenue-sharing contract. Front. Mar. Sci.12. doi: 10.3389/fmars.2025.1552136
56
Xu L. Xie F. Wang C. (2021). Passive or proactive capacity sharing? A perspective of cooperation and competition between two regional ports: Article. Maritime Policy Manage.49, 492–509. doi: 10.1080/03088839.2021.1876938
57
Yang Y.-C. Lin C.-L. (2013). Performance analysis of cargo-handling equipment from a green container terminal perspective. Transportation Res. Part D: Transport Environ.23, 9–11. doi: 10.1016/j.trd.2013.03.009
58
Zheng S. Ge Y.-E. Fu X. Nie Y. Xie C. (2017). Modeling collusion-proof port emission regulation of cargo-handling activities under incomplete information. Transportation Res. Part B: Methodological104, 543–567. doi: 10.1016/j.trb.2017.04.015
59
Zheng S. Wang K. Li Z.-C. Fu X. Chan F. T. S. (2021). Subsidy or minimum requirement? Regulation of port adaptation investment under disaster ambiguity. Transportation Res. Part B: Methodological150, 457–481. doi: 10.1016/j.trb.2021.04.006
60
Zhu J. Wang J. (2021). The effects of fuel content regulation at ports on regional pollution and shipping industry. J. Environ. Economics Manage.106, 102424. doi: 10.1016/j.jeem.2021.102424
Appendix 1. Proofs of Market equilibriums in Section 4
4.1 benchmark
To expand the expected profits of ports in Equation 3, we have
For convenience, we assume When . Then we maximize the objective function Equation 6 with respect to , we obtain . Substituting it into Equation 6 and imposing symmetry on , we have . Substituting and into , we obtain .
When
we know that and , and the Equation 7 becomes:
Then maximizing the Equation 8, we have , and .
When , the objective function is the same as Equation 8. Maximizing it with respect to we obtain and imposing the symmetry, we obtain . Then substituting and into , we have .
When , we have
Substituting Equation 9 into Equation 10, and maximizing it with respect to , we have , and derive through .
4.2.1 Regulation policy
In this section, the specific value of minimum regulation has been explored. Then we present the proofs within the feasible regions of R.
When , and , we have and obtain . Substituting it into Eq. (4), and maximizing it with respect to , we have Then we maximize the social welfare with respect to , and we have and .
When and , we have and substitute into Equation 4. Then maximizing it with respect to , we have and , where .
4.2.2Subsidization policy
Maximizing the expected social welfare of Equation 4 with respect to and , and then substituting them into Equation 4 to obtain the optimal subsidy. The proofs are based on the same logic presented above and omitted.
Summary
Keywords
port green investment, regulation, subsidy, investment effectiveness, green policy
Citation
Xie F and Zhou Z (2025) Port green investment strategy under government subsidization and regulation policy. Front. Mar. Sci. 12:1661382. doi: 10.3389/fmars.2025.1661382
Received
07 July 2025
Accepted
21 July 2025
Published
06 August 2025
Volume
12 - 2025
Edited by
Lang Xu, Nanyang Technological University, Singapore
Reviewed by
Le Zhang, Jinan University, China
Mingshuo Cao, Shanghai Maritime University, China
Xu Changyan, Shanghai Maritime University, China
Lingchen Huang, Fudan University, China
Min Zhou, Shanghai University of Electric Power, China
Updates
Copyright
© 2025 Xie and Zhou.
This is an open-access article distributed under the terms of the Creative Commons Attribution License (CC BY). The use, distribution or reproduction in other forums is permitted, provided the original author(s) and the copyright owner(s) are credited and that the original publication in this journal is cited, in accordance with accepted academic practice. No use, distribution or reproduction is permitted which does not comply with these terms.
*Correspondence: Zhongyin Zhou, zjh001012@163.com
Disclaimer
All claims expressed in this article are solely those of the authors and do not necessarily represent those of their affiliated organizations, or those of the publisher, the editors and the reviewers. Any product that may be evaluated in this article or claim that may be made by its manufacturer is not guaranteed or endorsed by the publisher.