Abstract
Sea turtles are highly migratory species that can travel vast distances between their feeding and breeding sites. Considering the vulnerability and conservation concern of most sea turtle species, it is essential to establish connections between foraging and nesting areas to link threats at seas with the affected populations. Previous studies analyzed the population of origin for loggerhead turtles (Caretta caretta) in most known Mediterranean foraging areas, while knowledge on green turtles (Chelonia mydas) foraging areas is much scarcer. In this context, Kuşadası Bay, an important foraging zone located in the Aegean Sea, is inhabited by the two species all year round, although their population composition is unknown. Here, we evaluated the populations of origin of turtles foraging in Kuşadası Bay from 2017 to 2021 to perform a regional assessment of the migratory routes of both species. We genotyped 31 green turtles, using four mitochondrial DNA (mtDNA) short tandem repeats (STRs), and 61 loggerhead turtles, using a segment of the mtDNA D-loop (control region). The mixed-stock analysis (MSA) revealed that turtles from Kuşadası Bay come mainly from Turkish nesting populations, with the loggerheads mostly from western beaches and green turtles from easternmost beaches. By integrating all previously published studies of Mediterranean foraging grounds, we delineate the main foraging routes of both species in the Mediterranean that were consistent with prevailing currents. However, significant differences were generally found when comparing the foraging grounds observed composition with those predicted by particle modeling, indicating that juvenile and adult turtles may combine passive drifting with active swimming during their migrations in most of the foraging areas. This study highlights the importance of using genetic tools to identify the origin of sea turtles and to gather information from a wide geographic scale to refine the knowledge of the main foraging migration routes in Mediterranean Sea turtles at regional level.
Introduction
Many marine species undertake long migrations to enhance their fitness by moving from optimal reproductive areas to different foraging grounds, which involves utilizing various habitats that are often widely separated geographically. Furthermore, highly migratory species can also be philopatric, implying that they return to their natal region to breed, despite their migratory behavior. Thus, individuals from the same breeding areas can migrate to different foraging sites, and individuals from genetically different breeding areas can feed in the same sites without mixing (Carreras et al., 2011). The combination of migration and philopatry in marine species can produce mixed feeding aggregates and link widely separated environments, while maintaining overall strong population structuring due to philopatry. Consequently, understanding spatio-temporal movements and connectivity between distant habitats and populations is crucial for migratory and philopatric marine species management and conservation, such as marine turtles (Rees et al., 2017).
Marine turtles have a complex life cycle that involves ontogenetic habitat shifts through large migration events (Bolten, 2003), but with a general plasticity of habitat use (Casale et al., 2018). During the first months of life, sea turtle hatchlings have limited swimming capacity, and are assumed to drift passively heading out into the open ocean (Casale and Mariani, 2014). Eventually, oceanographic fronts and major currents are thought to be the primary drivers of their migration towards the foraging grounds at this first life stage (Casale and Mariani, 2014; Spotila, 2004). Sea turtles feed on pelagic preys in the first period of their lives, and as they grow in size, their swimming ability improves (Revelles et al., 2007). These ontogenic shifts can also imply a change in diet depending on the species, such as the loggerhead turtle (Caretta caretta) feeding on benthic prey or the green turtle (Chelonia mydas) on seagrasses and algae (Bjorndal, 1997). The switch between these two phases is not fixed, as some individuals may remain pelagic (Eder et al., 2012), while in other cases it can be reversible since juveniles recruited to neritic foraging grounds might return to the oceanic environment on shorter scales for reasons not yet completely understood (Saied et al., 2012). Despite the swimming capability improvement with size, juvenile and adult sea turtle distribution seems to be also influenced by oceanography (Carreras et al., 2006). To explain these observations, some authors (Hays et al., 2010; Gaspar et al., 2012) proposed the Learned Migration Goal (LMG) theory, suggesting that grown individuals may use the same foraging areas used as hatchlings when their movements were restricted by the prevailing currents, instead of exploring new areas using their improved swimming skills. Although this theory is widely accepted considering adult and juvenile distributions, it has never been statistically tested.
The complexity of marine turtle life cycles and their long migrations increases their vulnerability to anthropogenic threats. The Mediterranean Sea is a biodiversity hotspot (Coll et al., 2010), and hosts nesting populations of two of the seven sea turtle species in the world: the loggerhead turtle Caretta caretta and the green turtle Chelonia mydas (Casale et al., 2018). After a generalized decline in the past century, the Mediterranean loggerhead turtle populations have increased in the past decade (Casale et al., 2018) and have been declared of least concern, but conservation dependent, by the International Union for Conservation of Nature in their last revision (IUCN, 2025). On the contrary, the green turtle population is still considered endangered (IUCN, 2025), even though recent studies suggest that some populations are now increasing (Stokes et al., 2015). Incidental bycatch by fishing activity is still the main threat for both species (Casale et al., 2018; Wallace et al., 2025). The largest sea turtle nesting areas occur in the eastern Mediterranean, although in recent years, due to global warming, sporadic nesting events have been found westwards for both species (Luna-Ortiz et al., 2024; Marín-Capuz et al., 2025). Loggerhead turtles, the most abundant sea turtle in the Mediterranean, reproduce mainly in Greece, Türkiye, Cyprus, and Libya (Casale et al., 2018), while green turtles primarily nest in the east: Türkiye, Cyprus, and the Levant shoreline to eastern North Africa (Egypt). Furthermore, the Mediterranean Sea also hosts foraging grounds for both species, the whole Mediterranean basin for the loggerhead sea turtle, and the eastern Mediterranean for the green sea turtle (Casale et al., 2018).
Considering that sea turtles are species of conservation concern, it is essential to establish connections between all these foraging grounds and putative nesting areas of origin to link threats at sea with the affected populations. During the last years, several genetic studies have assessed the origin of loggerhead and green sea turtles foraging in multiple Mediterranean areas (Figure 1, Clusa et al., 2013, Clusa et al., 2014; Garofalo et al., 2009; Karaman et al., 2022; Rees et al., 2017; Saied et al., 2012; Tikochinski et al., 2012; Turkozan et al., 2018; Yilmaz et al., 2011). However, connectivity analyses are particularly sensitive to gaps in knowledge, as missing key populations or foraging areas may lead to undiagnosed population sinks to otherwise protected stocks (Carreras et al., 2013). In this context, the Aegean Sea in the eastern Mediterranean has not been addressed and remains a significant knowledge gap (Figure 1) despite hosting relevant foraging grounds for both species. In particular, Kuşadası Bay is an important foraging aggregation site of loggerhead and green turtles. Therefore, it is crucial to investigate the origins of turtles foraging in this area for a complete regional assessment. Since bycatch of individuals at their foraging grounds is one of the most significant anthropogenic threats for sea turtles, fine-scale information on the contribution from the different nesting areas to the principal foraging grounds and the assessment of sea turtle’s migratory foraging routes at regional scale is essential for an effective management and conservation of these two species in the Mediterranean Sea.
There are a wide variety of methodologies to assess connectivity and population structure among reproductive areas and developmental and foraging areas for marine species, such as mark and recapture techniques, stable isotope analysis (SIA) (Cardona et al., 2024), satellite telemetry, and genetics (Rees et al., 2017). Genetic tools have been demonstrated to be effective in inferring connectivity in migrating marine animals (Clusa et al., 2014; Clusa et al., 2018), providing information of the relative contribution of each breeding area to specific foraging grounds, which can be assessed through mixed-stock analysis (MSA; (Grant et al., 1980). Selecting the appropriate genetic marker is crucial when planning an MSA project (Karl et al., 2012). Population genetic studies with marine turtles in the last two decades have used short (380 bp) or long (800 bp) fragments of the control region D-loop of the mitochondrial DNA (mtDNA) sequences, a non-coding region of the mtDNA expected to evolve neutrally (Moritz et al., 1987). The haplotypes of the long fragments of the control region provided better genetic resolution for the loggerhead turtles (Yilmaz et al., 2011; Carreras et al., 2006; Clusa et al., 2013) than for Mediterranean green turtles, since 97% of the Mediterranean green turtles have the same CM-A13 haplotype (Bagda et al., 2012). Subsequently, Tikochinski et al., 2012 sequenced four consecutive mitochondrial short tandem repeats (mtSTR) at the 3’ end of the control region and subdivided the CM-A13 haplotype into 33 variants, revealing high polymorphism. This new haplotyping system for Chelonia mydas turtles involves AT-rich mtDNA STRs that are polymorphic enough to provide a much better resolution in mixed-stock analysis (Karaman et al., 2022; Tikochinski et al., 2018). In this study, we genetically characterize the foraging area of Kuşadası Bay for a better understanding of the migratory pathways for Caretta caretta and Chelonia mydas in the Mediterranean Sea. To do so, we sequenced 92 samples from C. caretta and C. mydas from Kuşadası Bay, with the long D-loop and STR sequences, respectively, which allowed us to infer the nesting populations of origin using MSA. We then combined our results with the available information on other nesting grounds and foraging areas to perform a regional assessment of migratory routes in the Mediterranean Sea. In addition, we compared the origin assignment based on genetic tools with the one inferred from particle dispersal model simulations to unveil the extent of the Learned Migration Goal theory in both species. Our results highlight the importance of compiling region-wide datasets of both nesting and foraging areas to have a comprehensive understanding of global patterns of connectivity in highly migratory and philopatric species.
Materials and methods
Study area
Tissue samples were collected from stranded dead loggerhead and green sea turtles around Kuşadası Bay (Türkiye) in the Aegean Sea (37°52’13.1”N, 27°15’21.1”E) (Figure 1), between 2017 and 2021. Curved carapace length (CCL) and curved carapace width (CCW) were measured following standard procedures (NOAA Technical Memorandum, 2008). Sex identification was conducted based on external characters (Casale et al., 2005; Stokes et al., 2008). Tissue samples were preserved in 99% alcohol until DNA extraction. All samples were collected under the local legislation, and ethical approval was not required for the study, as samples were from stranded animals.
DNA extraction and haplotyping
Loggerhead turtles
DNA extractions were performed with a modified version of the standard phenol-chloroform protocol (Hillis and Moritz, 1990) as conducted by Turkozan et al. (2018). A fragment of 862 base-pair (bp) of the mt DNA D-loop control region was PCR amplified using the primer pair LCM15382 (5.-GCT TAA CCC TAA AGC ATT GG -3’) and H950 (5.-GTC TCG GAT TTA GGG GTT TG -3.) (Abreu-Grobois et al., 2006) carrying out the protocol according to (Yilmaz et al., 2011). Each reaction was prepared in a final mix volume of 15 µl containing 5.08 µl of Nuclease Free-water (Thermo Scientific), 3 µl of PCR Buffer 5X (GoTaq Promega), 1.8 µl of dNTPs (1 mm), 0.6 µl of MgCl2 (25 mm), 1.8 µl of Bovine Serum Albumin, 0.3 µl of Forward primer (10 µm), 0.3 µl of Reverse primer (10 µm), 0.12 µl of Gotaq G2 Flexi DNA Polymerase (Promega 5U/µl), and 2 µl of DNA (~ 10 ng/µl). The resulting PCR products were visualized by electrophoresis and purified with the GenElute PCR Clean-Up Kit following the manufacturer’s instructions (Sigma, Germany). A total of 3 µl of the PCR product was purified using 2 µl of ExoSAP.IT® (Affymetrix Inc.), following the manufacturer’s instructions. The purified PCR products were sequenced in both forward and reverse directions using a 3730xl capillary system automatic sequencer (Macrogen Inc., S. Korea). Sequences were aligned using the program BioEdit v7.0.9 (Hall, 1999) and compared to the haplotype database maintained by the Archie Carr Center for Sea Turtle Research database (http://accstr.ufl.edu/).
Green turtles
DNA extractions were performed according to the manufacturer’s protocol using the Invitrogen PureLink Mini genomic DNA isolation kit (ThermoFisher) as described in the literature (Karaman et al., 2022). A DNA fragment of about 200 bp (depending on the number of repeats of the four STRs) at the 3’ end of the mitochondrial DNA control region was PCR amplified using the primer pair CM.D.1 F (5’-AGC CCA TTT ACT TCT CGC CAA ACC CC-3´) and CM.D.5 R (5’-GCT CCT TTT ATC TGA TGG GAC TGT T-3´) (Tikochinski et al., 2012). Each reaction was prepared in a final mix volume of 15 µl containing 5.08 µl of Nuclease Free-water (Thermo Scientific), 3 µl of PCR Buffer 5X (GoTaq Promega), 1.8 µl of dNTPs (1 mm), 0.6 µl of MgCl2 (25 mm), 1.8 µl of Bovine Serum Albumin, 0.3 µl of Forward primer (10 µm), 0.3 µl of Reverse primer (10 µm), 0.12 µl of Gotaq G2 Flexi DNA Polymerase (Promega 5U/µl), and 2 µl of DNA (~ 10 ng/µl). After an initial 5 min denaturing step (94 °C), the PCR protocol consisted of 40 cycles of the following temperature regime: 1 min at 94 °C (denaturing), 1 min at 52 °C (annealing), and 1:30 min at 72 °C (extension). In addition, we included a final extension step of 10 min at 72 °C. The resulting PCR products were visualized by electrophoresis to ensure successful amplification, and a total of 3 µl of the PCR product was purified using 2 µl of ExoSAP.IT® (Affymetrix Inc.), following the manufacturer’s instructions. The purified mtDNA amplicon was sequenced at Scientific-Technical Services at the University of Barcelona. Sequences were visualized with BioEdit v7.2. and STRs were scored by counting the number of ‘AT’ repeats in each of the four loci of the sequence, and haplotypes were defined by combining the four STRs and named using the four-number barcoding system described in the literature (Tikochinski et al., 2012).
Diversity and differentiation among Mediterranean nesting areas and foraging grounds
To compare Kuşadası Bay haplotype frequencies with nesting areas and other foraging grounds, we searched for available information found in the literature from previous genetic structure studies of Mediterranean nesting areas and foraging grounds for both species (Figure 1). Mediterranean regular loggerhead nesting areas are MIS (Misurata), SIR (Sirte) (Saied et al, 2012), ISR (Israel), LEB (Lebanon), CYP (Cyprus), CRE (Crete), WGR (West Greece) (Clusa et al., 2013), ETU (East Türkiye), MTU (Mid Türkiye), WTU (West Türkiye), DLM (Dalaman), DLY (Dalyan) (Yilmaz et al., 2011), CAL (Calabria) (Garofalo et al., 2009) and for green turtles are AKD (Akdeniz), NKAR (North Karpaz), SKAR (South Karpaz), ALT (Alata), DVL (Davultepe), KAZ (Kazanlı), AKY (Akyatan), SGZ (Sugözü) SAM (Samandağ) (Karaman et al., 2022), AKA (Akamas), ALG (Alagadi) and ISR (Israel) (Tikochinski et al., 2018). Foraging grounds from previous studies are CAB (the Catalano-Balearic Sea), ALG (the Algerian basin), TYR (the Tyrrhenian Sea), the NADR (the North Adriatic Sea, and SADR (the South Adriatic Sea), ION (the northern Ionian Sea), SLE (the southern Levantine Sea) (Clusa et al., 2014), DRI (the Drini Bay), AMV (the Amvrakikos Gulf) (Rees et al., 2017), TURW (Western Türkiye) and TURE (Eastern Türkiye) (Turkozan et al., 2018) for loggerhead turtles. For green sea turtles, ISR (Israel coast) (Tikochinski et al., 2012), foraging ground information was available. Detailed information about haplotype frequencies and references for nesting areas and foraging grounds for both species can be found in the supplementary material (Supplementary Table S1, and Supplementary Table S2). Finally, the emerging nesting activity in the western Mediterranean (Hochscheid et al., 2022) was not considered in the loggerhead baseline for several reasons. Firstly, the samples from the analyzed foraging grounds were obtained before 2015, except for Kuşadası from 2017 to 2020. Considering that nesting was nearly absent prior to 2016, with less than 20 nests per year for the whole basin, and started to increase in 2020 (Hochscheid et al., 2022), it is unlikely that this scattered nesting significantly contributed to the foraging areas when sampled. Furthermore, the genetic information on the western Mediterranean is still scarce (Carreras et al., 2018), limiting its inclusion as a baseline. However, genetic studies are advised to characterize these new nesting areas and future studies on foraging grounds with more recent samples should consider them in their baseline. We used Arlequin 3.5.2. (Excoffier & Lischer, 2010) to calculate haplotype (H) and nucleotide (π) diversity for each nesting and foraging area. For the green turtles, nucleotide diversity was not considered due to the nature of the marker used (STR), whose polymorphism is based on the number of repetitions of the ‘AT’ motif. Pairwise genetic distances (FST) among all nesting areas and foraging grounds were also calculated using Arlequin. The significance of the genetic differentiation among pairs of locations was assessed using Hudson’s nearest neighbor statistic (SNN) with 1.000 permutations and 0.05 for the p-value. Pairwise genetic distances (FST) among locations were plotted with a principal coordinate analysis (PCoA) using GenAlEx v6.5 (Peakall and Smouse, 2012).
Stock composition of foraging grounds
A Bayesian mixed-stock analysis (MSA) was used to assess the composition of Kuşadası Bay foraging ground as implemented in BAYES (Pella and Masuda, 2001) for green and loggerhead turtles. This analysis estimates the proportion of individuals in the foraging ground coming from different nesting areas, named a ‘many-to-one’ MSA. The ‘many-to-many’ approach (Bolker et al., 2007) was not applied, as this analysis assumes that all foraging areas are sampled, and that turtles from a given nesting area are distributed without overlapping along the foraging areas, assumptions that are not accomplished in the Mediterranean. The analysis was undertaken twice for loggerhead turtles: first, considering two regional areas (Atlantic and Mediterranean), and second, within the Mediterranean, considering all nesting sites as independent units (fine scale level) as performed in previous studies. For green turtles, we only performed a Mediterranean fine scale analysis, as the contribution from outside of the Mediterranean can be discarded due to the absence of shared haplotypes with the Atlantic in all the individuals from the foraging areas. We used as a baseline all the genetic information found from potential nesting populations of origin (Clusa et al., 2013; Garofalo et al., 2009; Karaman et al., 2022; Saied et al., 2012; Tikochinski et al., 2018; Yilmaz et al., 2011; Supplementary Table S1 and Supplementary Table S2 for green and loggerhead turtles, respectively). For the fine scale level, three different simulations were performed: (i) no weighting factor; (ii) using an estimate on the size of each rookery (expressed as the mean number of nests per year) and (iii) using the Euclidean distance across sea (expressed in km) as a weighting factor. Population sizes were taken from the literature (Casale and Mariani, 2014; Stokes et al., 2015), and the minimum distance across the sea was measured using GoogleEarth®. Iterated chains were only considered reliable when the Gelman-Rubin criterion was fulfilled (G-R shrink factor <1.2 for all parameters), as described in the software manual. The results from Kuşadası Bay were compiled with MSA results for green turtles (Tikochinski et al., 2012) and for loggerhead turtles (Clusa et al., 2014; Rees et al., 2017; Turkozan et al., 2018) from other foraging areas in the region to assess the patterns of migration routes of both species within the Mediterranean Sea.
Testing the learned migration goal theory
We compared the juvenile composition of each Mediterranean foraging ground, inferred by MSA, with the hatchling composition, inferred by particle modeling analyses (Casale and Mariani, 2014). Following the Learned Migration Goal theory (Hays et al., 2010; Gaspar et al., 2012), the composition of juvenile and adult turtles would match the hatchlings composition, as currents highly influence them at this early life stage. Particle modeling considered both short and long particle dispersal simulation models (running from the emergence of the hatchlings until 1st December and 1st February, respectively) (Casale and Mariani, 2014). The short model represents rapid, current-driven dispersal, reflecting early-stage passive drift immediately after hatching, whereas the long model incorporates prolonged drift and potential behavioral influences, such as active swimming and orientation, which become increasingly relevant as turtles grow and gain mobility. For each period we considered the proportion of particles found in a specific marine zone originated from different nesting areas, simulating the different origin of turtles found in a common foraging zone. Consequently, the results produced are equivalent to the ‘many-to-one’ MSA approach. Following the rationale from the particle modelling study, for the MSA, we combined the green turtle nesting areas of origin into three main groups: Türkiye (Alata, Davultepe, Kazanlı, Akyatan, Sugözü, and Samandağ), Cyprus (Akamas, Akdeniz, Alagadi, North Karpaz, and South Karpaz), and Levantine (pooling Syria and Israel nesting areas together). Similarly, for the loggerhead turtles MSA, we combined the nesting sites of origin into four main groups: Türkiye (East Türkiye, Middle Türkiye, West Türkiye, Dalaman, and Dalyan), Cyprus, Libya (pooling Sirte and Misrata), and Levantine (merging Lebanon and Israel nesting areas), and renamed Crete as Eastern Greece. As the particle modelling did not consider the Atlantic nesting areas, we removed from the analysis the foraging areas with a significant Atlantic contribution, corresponding to the western Mediterranean Basin (CAB, ALG, and TYR, Figure 1, see results). Fisher tests between the composition inferred by genetics (MSA) and the composition predicted by the two particle dispersal models, short and long periods, were performed for each foraging area. P-values were subsequently adjusted for multiple comparisons using the False Discovery Rate (FDR) correction based on the Benjamini–Hochberg procedure.
Results
Sea turtle’s characteristics in Kuşadası bay
In Kuşadası Bay, green turtle individuals (n=31), CCL ranged from 11.5 to 85 cm (mean 37.61). The CCL frequency distribution (Figure 2) indicated a majority of juvenile and immature green individuals (80.6%), with only 1 individual potentially adult (with a CCL > 77 (Casale et al., 2018), a male). In loggerhead turtles (n=61), CCL ranged from 48 to 81 cm (mean 64). The CCL frequency distribution for loggerheads captured in Kuşadası Bay (Figure 1) showed a majority of adults (63.93%), with 39 potential adult turtles (with a CCL> 60 cm (Casale et al., 2018)). Only 3 individuals were considered fully developed adults with reliable sexual dimorphism (with a CCL> 75 cm (Casale et al., 2018)). Moreover, green turtles were more abundant in spring (38.63%) and autumn (25%) than in summer (20.45%) and winter (15.9%). Loggerhead turtles were also more abundant in spring (35.52%) and summer (30.26%) than in winter (22.36%) and autumn (11.84%) (Figure 2).
Figure 1
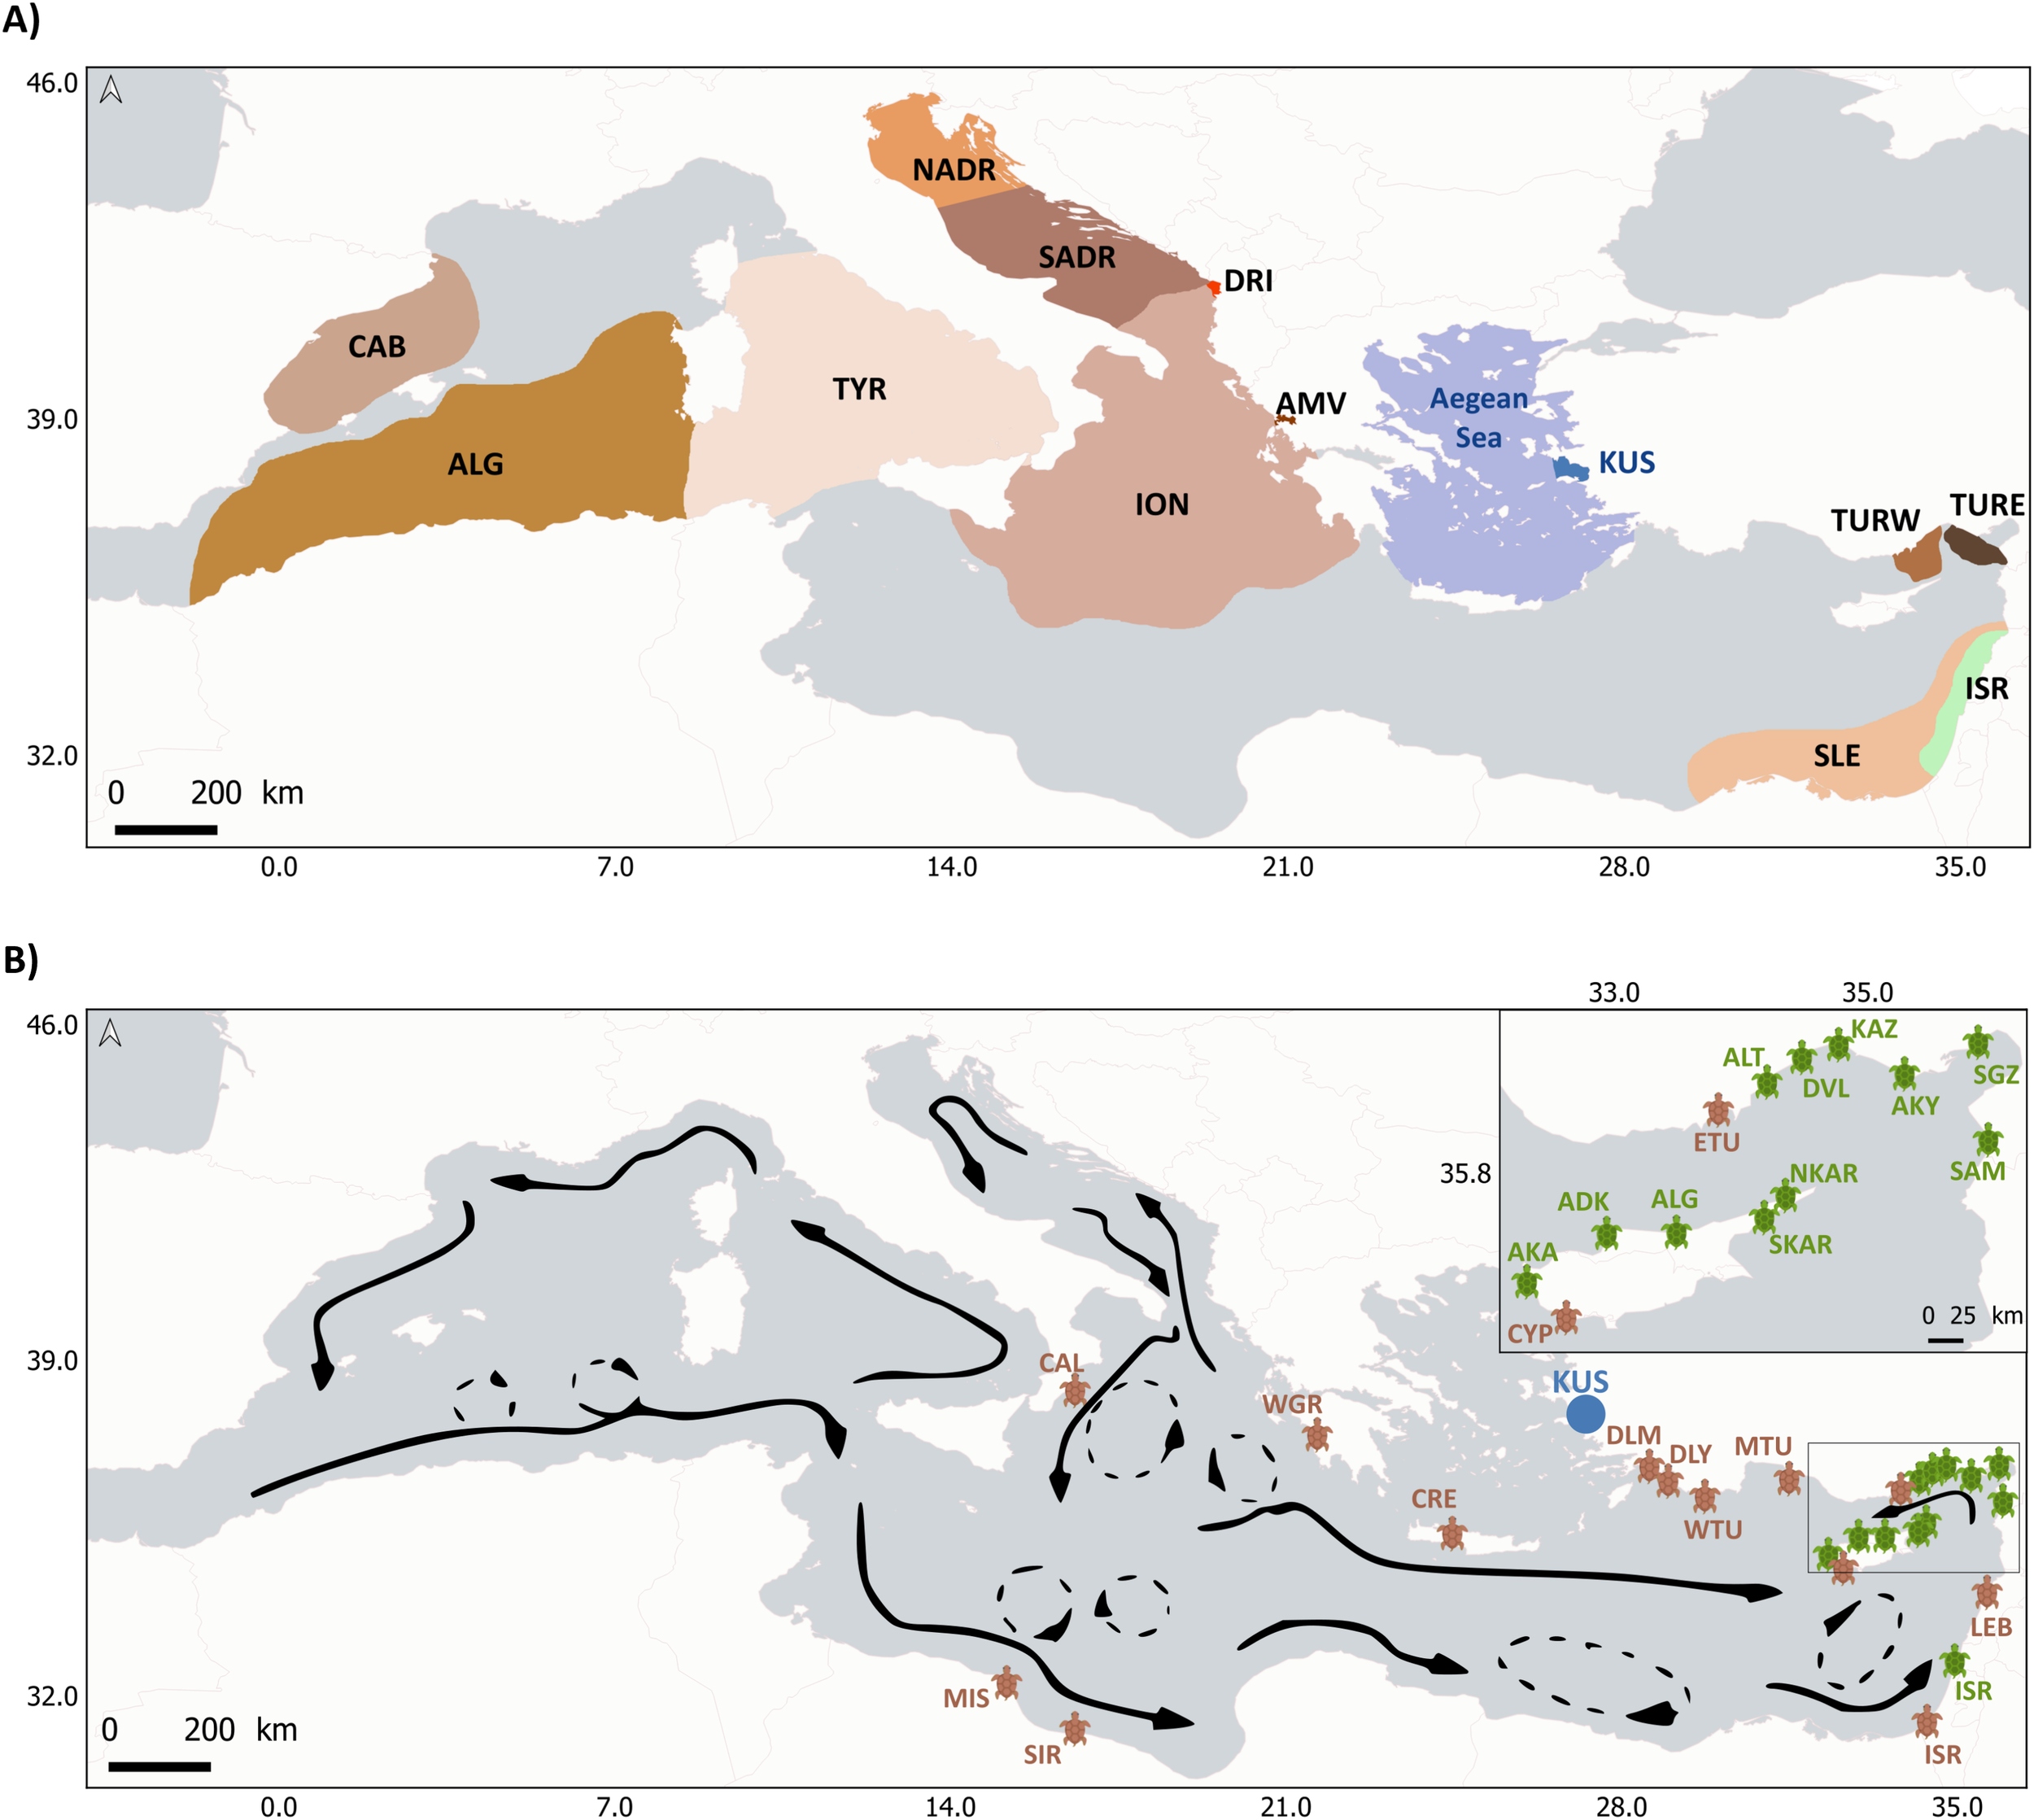
(A) Foraging grounds for loggerhead (in brown) and green turtles (in green) genetically studied in previous studies. In blue, we show the location of (KUS) the Kuşadası Bay foraging ground in the Aegean Sea for both species (this study). Foraging grounds for loggerhead sea turtles from previous studies: CAB (the Catalano-Balearic Sea), ALG (the Algerian basin), TYR (the Tyrrhenian Sea), the NADR (the North Adriatic Sea, SADR (the South Adriatic Sea), ION (the northern Ionian Sea), SLE (the southern Levantine Sea), DRI (the Drini Bay), AMV (the Amvrakikos Gulf), TURW (Western Türkiye) and TURE (Eastern Türkiye). Foraging ground for green sea turtles from previous studies: the ISR (Israeli coast). (B) Main surface circulation patterns of the Mediterranean Sea. Adapted and modified after Millot and Taupier-Letage, 2004 and Clusa et al., 2014. Thin dashed lines show transient gyres and eddies. Regular nesting areas for Caretta caretta (brown icons) and Chelonia mydas (green icons) in the Mediterranean from which we have genetic information from previous studies: MIS (Misurata), SIR (Sirte), ISR (Israel), LEB (Lebanon), CYP (Cyprus), ETU (East Türkiye), MTU (Mid Türkiye), WTU (West Türkiye), DLM (Dalaman), DLY (Dalyan), CRE (Crete), WGR (West Greece), CAL (Calabria) for loggerhead turtles and AKA (Akamas), AKD (Akdeniz), ALG (Alagadi), NKAR (North Karpaz), SKAR (South Karpaz), ALT (Alata), DVL (Davultepe), KAZ (Kazanlı), AKY (Akyatan), SGZ (Sugözü) SAM (Samandağ), ISR (Israel) for green turtles.
Figure 2
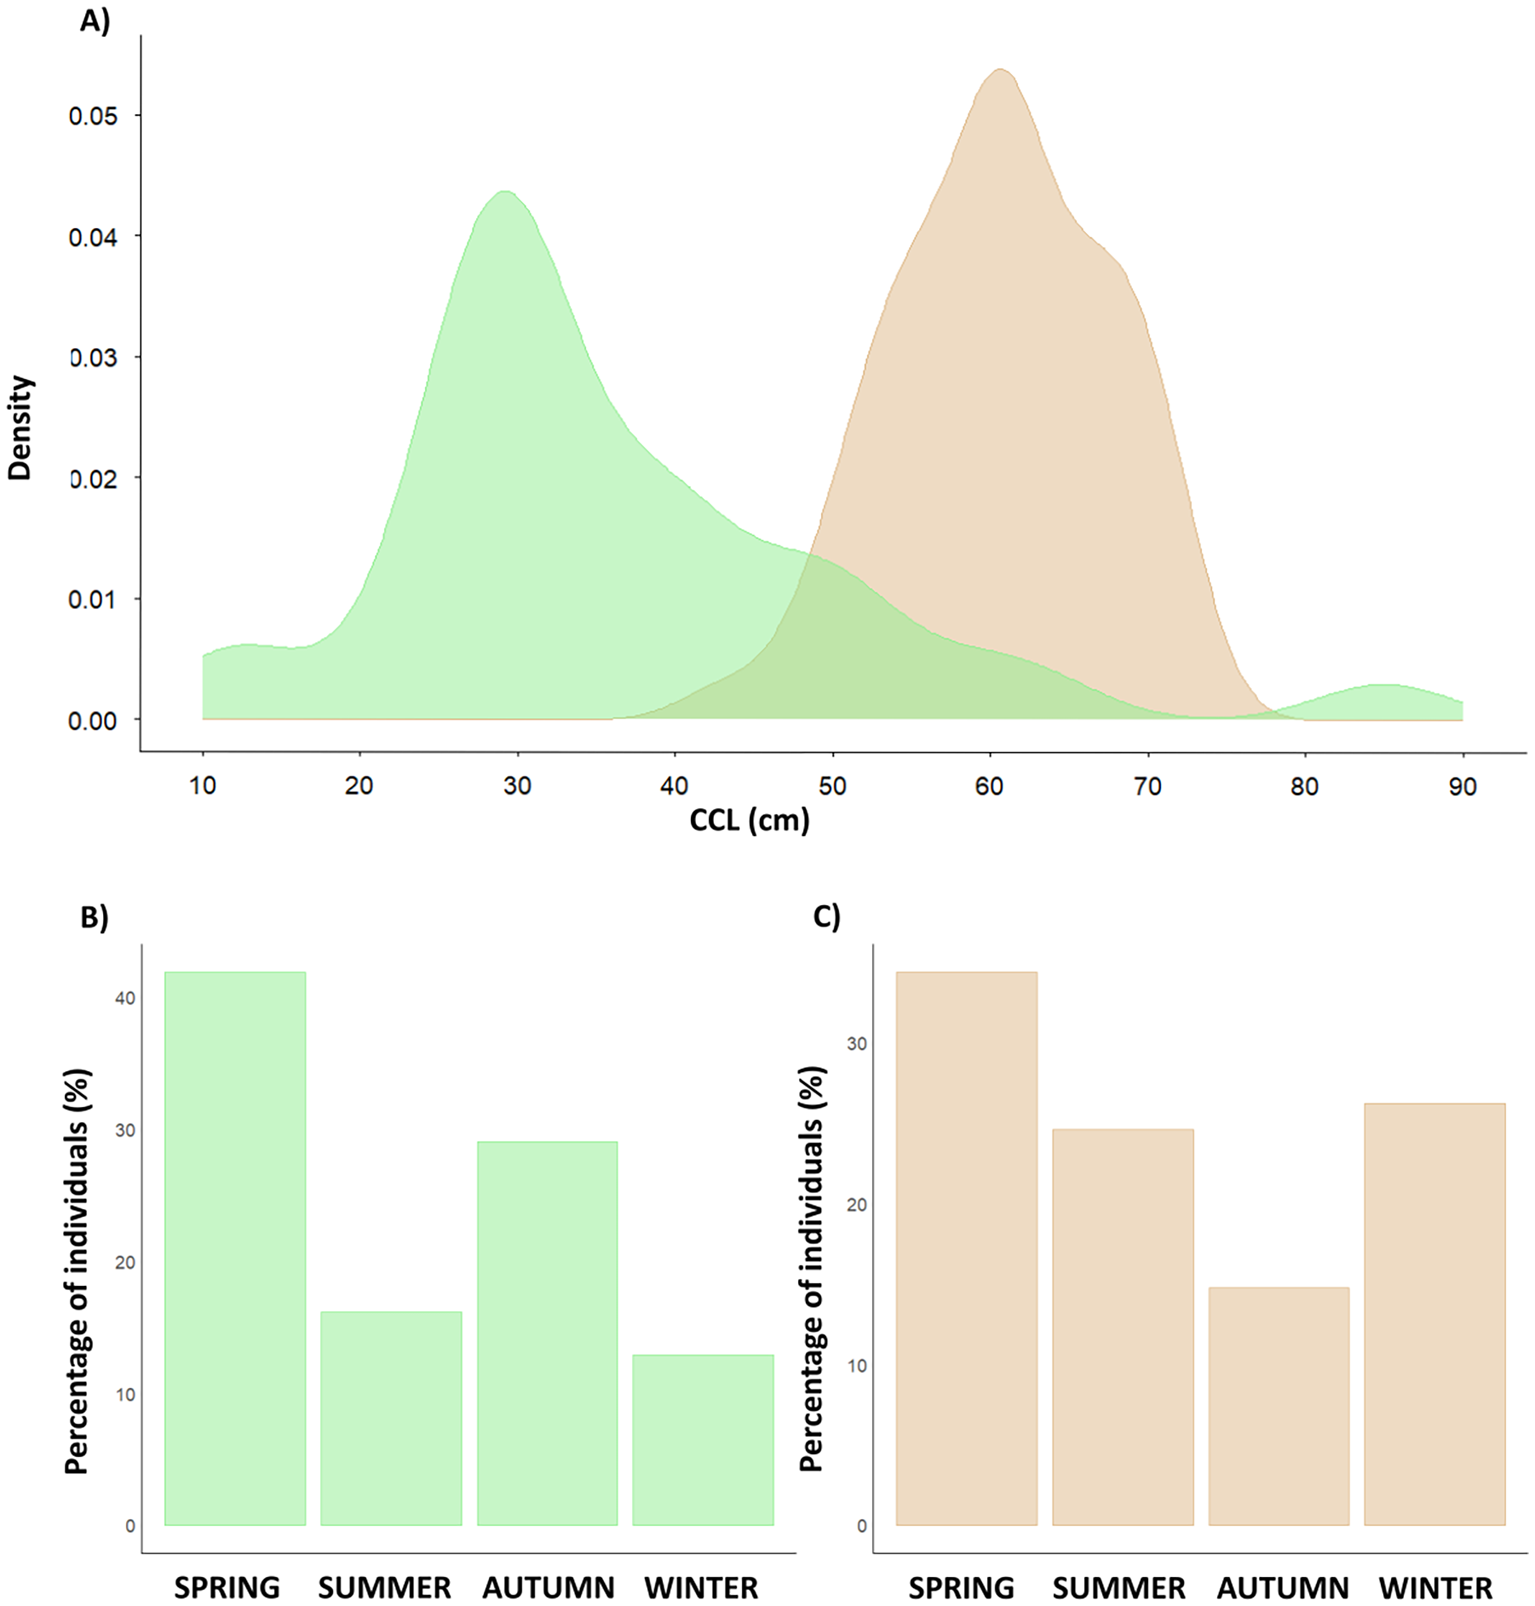
(A) Density plot for curved carapace length (CCL) for Chelonia mydas (green) and Caretta caretta (brown). (B) Seasonal percentage of individuals for green turtles (Spring 39%, Summer 20%, Autumn 25%, and Winter 16%) in green and (C) for loggerhead turtles (Spring 34%, Summer 25%, Autumn 15% and Winter 26%) in brown.
Genetic diversity of Kuşadası bay
For green turtles, we detected a total of 9 different haplotypes within the 31 individuals analyzed (H = 0.723, Supplementary Table S3). All STR haplotypes detected are exclusive from the Mediterranean, the most frequent being 6 8 8 4 (48.4%), 6 8 5 4 (22.6%), and 6 8 7 4 (9.7%) (Supplementary Table S3). In the loggerhead turtles, we detected 3 different haplotypes in the 61 analyzed individuals (H = 0.284; π= 0.00057), and only CCA2.8 is exclusive to the Mediterranean. The most frequent haplotypes were CCA2.1 (83.6%), CCA3.1 (14.8%), and CCA2.8 (1.6%) (Supplementary Table S3). No new haplotypes were found in any of the two species.
Population structure in nesting and foraging areas in the Mediterranean
For the green turtles, we combined Kuşadası Bay information with all additional genetic data available for Mediterranean nesting areas (n=13 sites) and a foraging ground (n=1 site) Supplementary Table S1). We found significant genetic differentiation in 46.15% of the comparisons involving the two studied foraging grounds and all nesting areas (Supplementary Table S4). There were non-significant differences between comparing the two foraging sites, Kuşadası Bay and Israel (FST = 0.02, p= 0.6152). Kuşadası Bay significantly differed from most Cyprus nesting areas apart from Akamas in southern Cyprus. PCoA ordination explained 77.4% of the observed variation with the first two axes. The first axis explained 43.2% of the variation, with all the populations from the island of Cyprus plus Israel on the left section of the plot having negative values, all the Turkish nesting areas on the right half of the plot with positive values and the two foraging grounds having intermediate positions (Figure 3).
Figure 3
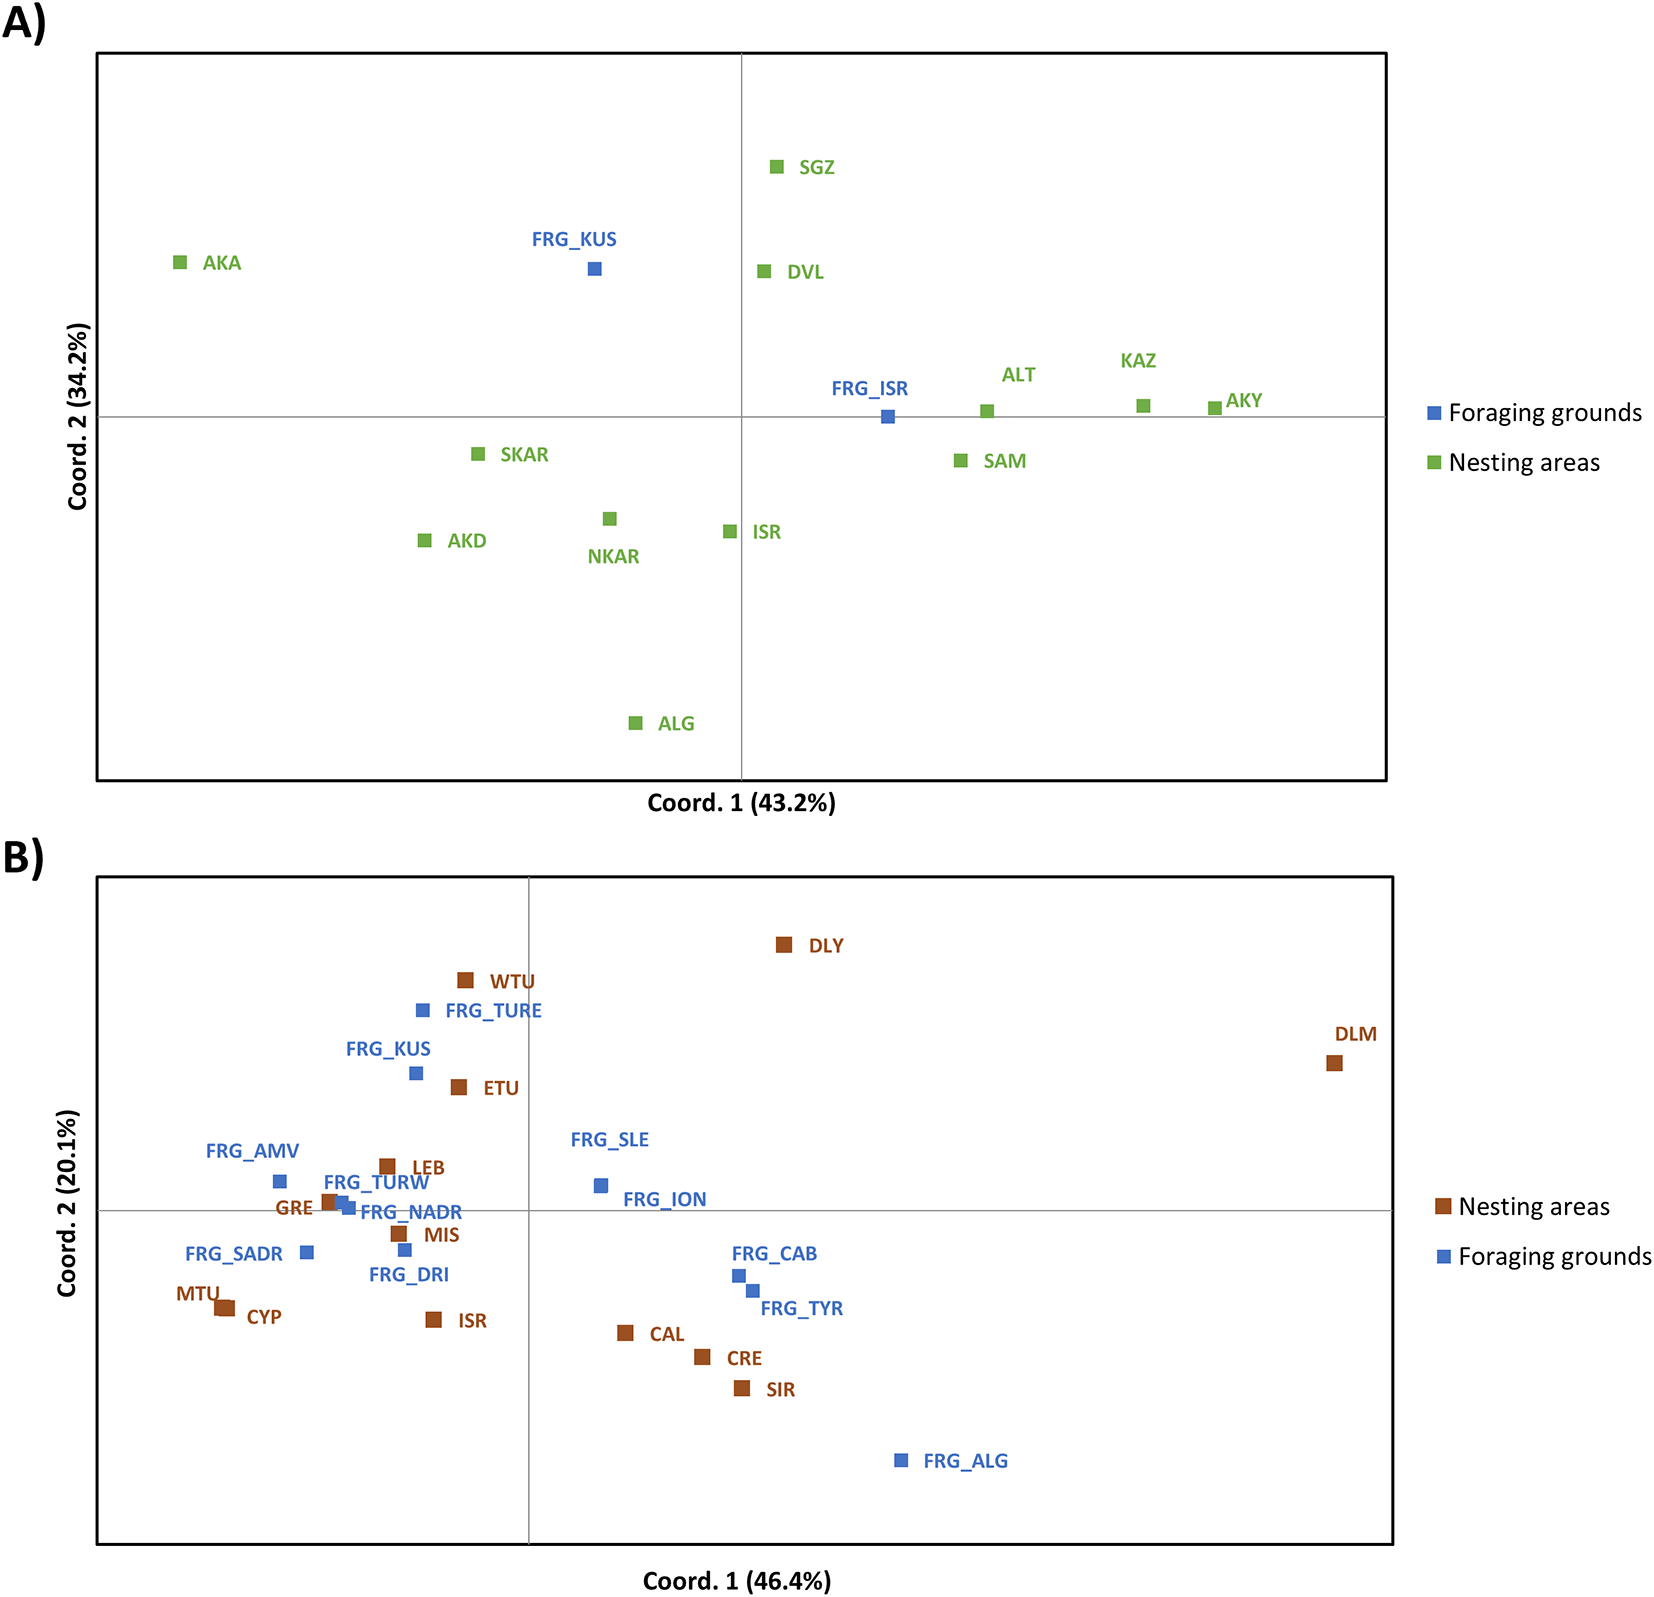
Principal coordinate analysis based on genetic distances (FST) between green turtles (A) and loggerhead turtles (B) in Mediterranean foraging grounds and nesting areas. The percentage of variation explained by each coordinate is included in brackets. For green turtles, nesting areas acronyms are AKA (Akamas), AKD (Akdeniz), ALG (Alagadi), NKAR (North Karpaz), SKAR (South Karpaz), ALT (Alata), DVL (Davultepe), KAZ (Kazanlı), AKY (Akyatan), SGZ (Sugözü) SAM (Samandağ), ISR (Israel); foraging grounds acronyms are KUS (Kuşadası Bay) and ISR (Israel). For loggerhead turtles, nesting areas are MIS (Misurata), SIR (Sirte), ISR (Israel), LEB (Lebanon), CYP (Cyprus), ETU (East Türkiye), MTU (Mid Türkiye), WTU (West Türkiye), DLM (Dalaman), DLY (Dalyan), CRE (Crete), WGR (West Greece) and CAL (Calabria); foraging grounds acronyms are the CAB (Catalano-Balearic Sea), ALG (Algerian basin), TYR (Tyrrhenian Sea), NADR (North Adriatic Sea), SADR (South Adriatic Sea), ION (Northern Ionian Sea), SLE (southern Levantine Sea), DRI (Drini Bay), AMV (Amvrakikos Gulf), TURW (Western Türkiye), TURE (Eastern Türkiye) and KUS (Kuşadası Bay) in blue.
For the loggerhead turtles, we also combined our results with genetic data available for Mediterranean nesting areas (n=13) and foraging grounds (n=12) from previous studies (Supplementary Table S4). We found significant genetic differentiation among the studied foraging grounds (Supplementary Table S5). The Catalano-Balearic Sea (FST = 0.092, p = 0.00098), the Algerian Basin (FST = 0.370, p = 0.000), the Tyrrhenian Sea (FST = 0.105 p = 0.000), the northern Ionian Sea (FST = 0.031, p = 0.032) and the Amvrakikos Gulf (FST = 0.035 p = 0.009) foraging grounds differed significantly from Kuşadası Bay. Contrarily, East and West Türkiye, the Adriatic Sea, and the southern Levantine Sea pairwise comparisons were nonsignificantly different from Kuşadası Bay. The PCoA ordination explained 66.5% of the observed variation with the first two axes and 46.4% only by the first axis (Figure 3). The PCoA reflected the differentiation between Dalaman (DLM) and Dalyan (DLY) and a deep differentiation between the Algerian basin foraging area (ALG) and the rest of the nesting and foraging grounds. Kuşadası Bay was close to some Turkish nesting and foraging areas (Figure 3).
Mixed-Stock Analyses for Kuşadası bay foraging ground
For the green turtles, since all Kuşadası Bay haplotypes were exclusive from the Mediterranean, we performed a mixed-stock analysis including only the Mediterranean nesting areas (Supplementary Table S1). The green turtle MSA results for the Kuşadası foraging ground were very similar regardless of the weighting factor applied. Most individuals originated in the Turkish populations of Sugözü (SGZ) and Davultepe (DVL), with a more negligible contribution from other populations such as Alata (ALT), Akyatan (AKY), Samandağ (SAM), or Akamas (AKA) (Figure 4A). The results of the mixed-stock analysis previously carried out for Israel’s foraging ground (Supplementary Table S6) showed the origin of individuals differed from our results from Kuşadası Bay as Samandağ (Türkiye) had the greatest contribution to Israel (Figure 4C).
For the loggerhead turtles, we first performed a MSA analysis considering all potential nesting sites to discriminate between Atlantic and Mediterranean origin. Our results showed that most Kuşadası foraging ground individuals originated in Mediterranean nesting beaches (97.82% from the Mediterranean) consistent with an exclusive contribution of Mediterranean nesting areas considering the confidence intervals of the analysis. The Atlantic nesting contribution was notable only on all three western foraging grounds (Algerian Basin (ALG), Catalano Balearic Sea (CAB), and Tyrrhenian Sea (THY), with a minor contribution to the Southern Levantine Sea (SLE) in the eastern Mediterranean (Figure 4D). Thus, the occurrence of Atlantic-origin turtles captured in foraging grounds is higher in the west than in the east side of the Mediterranean basin where it is negligible with the exception of SLE (Figure 4D). When removing the Atlantic populations from our baseline for a fine scale analysis, most individuals feeding in Kuşadası originated in western Türkiye (WTU), with a minor contribution from Lebanon (LEB), Dalyan (DLY), and Crete (CRE) (Figure 4C). We detected slight differences depending on the weighting factor used, mainly as an overrepresentation of the small population of Lebanon when no weight is considered. When using population size, the predicted contribution of the smallest populations was reduced, and Western Greece’s (WGR) importance increased. Western Greece’s importance was reduced when using Euclidean distance across the sea while Dalyan and Crete’s contribution increased.
The results of MSA for previously published foraging grounds suggest that Dalaman and Dalyan nesting areas contribution is mainly limited to Kuşadası Bay, with some Dalyan individuals also foraging in Eastern Türkiye (Figure 4D; Supplementary Table S7). When digging into the foraging grounds across the Mediterranean from west to east, we observed that the Western Mediterranean foraging grounds (Catalano Balearic Sea (CAB), Algerian Basin (ALG), and Tyrrhenian Sea (THY)) have a high proportion of the Atlantic and a fraction of Misrata’s individuals. Additionally, the Tyrrhenian Sea hosts most Calabria nesting individuals (Figure 4D). The Ionian Sea (ION) has a prevalence of turtles from Misrata and Sirte (Libya). Amvrakikos Gulf (AMV), Drini Bay (DRI), and the Adriatic Sea (ADR) are foraging grounds primarily utilized by turtles from Western Greece nesting sites. The eastern Mediterranean is the principal foraging area for Türkiye, Cyprus, Lebanon, and Israel nesting turtles. Kuşadası Bay (KUS) and Eastern Türkiye (ETU) foraging areas are used mainly by turtles originating at West Türkiye beaches. Middle Türkiye (MTU) foraging ground hosts mostly nesting turtles from Cyprus. The Southern Levantine Sea (SLE) area has a majority of Turkish nesting turtles, some Atlantic individuals. Israel and Lebanon’s contributions are mainly restricted to this area (Figure 4D).
Comparisons between genetic data and dispersal particle analysis
For the green turtles, no significant differences were observed between the fine-scale contributions to Mediterranean foraging grounds estimated by MSA (genetic data) and those predicted by the particle dispersal models for Kuşadası Bay (p = 1 for both periods). Conversely, significant differences were detected for the Israel foraging ground (p < 0.0001 for both periods; Supplementary Table S8), reflecting a higher-than-expected contribution of turtles originating from Türkiye and Cyprus to this area. For loggerhead turtles, no significant differences were detected between our genetic data and particle analyses for the Southern Levantine Sea and Kuşadası Bay over both periods. Whereas statistically significant differences were found in all the remaining foraging areas for both periods after the FDR correction (Supplementary Table S9). The discrepancies reflected a higher arrival of turtles from Türkiye to the Adriatic indicated by genetics in comparison to those expected by particle modelling, a higher proportion of turtles from Libya to the Ionian Sea, a higher proportion of Turkish turtles to east Türkiye, an increase of turtles from Cyprus in west Türkiye, an increase of turtles from western Greece in Amvrakikos, and an increase of turtles from Türkiye and eastern Greece in Drini Bay.
Discussion
Connecting foraging grounds with nesting areas is essential for conserving highly migratory marine organisms, such as sea turtles, since hazards in foraging aggregations can impact distant nesting populations. This work provides crucial information about the habitat use of loggerhead and green sea turtles by analyzing Kuşadası Bay in the Aegean Sea, a key foraging ground for both species in the eastern Mediterranean. Furthermore, we integrated this novel genetic data into all previously studied foraging aggregations and nesting sites to create a Mediterranean habitat usage map for both species. Additionally, we compared genetic results in adult and juvenile foraging grounds with particle dispersal studies to infer migratory trends when choosing foraging grounds in relation to the Learned Migration Goal theory. The Aegean Sea, and particularly Kuşadası Bay, has been an important gap of knowledge for both species to date. Our results indicate that Kuşadası Bay is used as foraging area by juveniles and subadults, with very few adult individuals for green turtles, while it is mainly inhabited by subadults and adults for loggerhead turtles. We observed seasonality as both species were more abundant in spring, followed by summer for green and autumn for loggerhead turtles (Figure 2). The greater abundance observed during warmer periods may be linked to heightened maritime traffic and intensified fishing activities, which may increase the sightings of turtles and the number of stranded individuals. However, this seasonal pattern could also reflect variations in the availability of food resources and thus an increase of the number of turtles arriving to the area. Whether the observed seasonality is real, or an artifact of the human activity should be evaluated in the future using census methods not related to this activity, such as the use of aerial surveys (Gómez de Segura et al., 2006).
The genetic analysis of individuals feeding in Kuşadası Bay revealed that this is an aggregation of turtles from several distant locations, highlighting its importance as foraging ground within the Mediterranean for both species. However, the highest contribution corresponds to Turkish nesting populations, (such as Sugözü and Davultepe) in green turtles or West Türkiye in loggerhead turtles (Figure 4). This result is not surprising for the green turtles, as this foraging area is located in the westernmost edge of this species distribution within the Mediterranean along the Turkish coast. However, nesting populations of the loggerhead turtles exist along the Greek coast, including Crete, that could potentially have a significant contribution to Kuşadası Bay. Multiple elements could explain the differential contribution of nesting areas to the foraging grounds, including population size of the putative nesting beaches of origin, proximity to the foraging ground, or the pattern of surface currents (Clusa et al., 2014). In this case, sea currents might explain the prevalence of Türkiye nesting turtles in the Aegean Sea for both species, as hatchling movements are mainly driven by the currents because, even with some swimming activity, they cannot swim against them, considering that the potential to swim against currents in sea turtles is related to size (Revelles et al., 2007). The northwestern vein flows along the Turkish slope most of the year, and the prevailing northerly summer winds cause the main surface current to penetrate the Aegean (Millot and Taupier-Letage, 2004), allowing hatchlings to flow towards this area (Figure 1B).
Figure 4
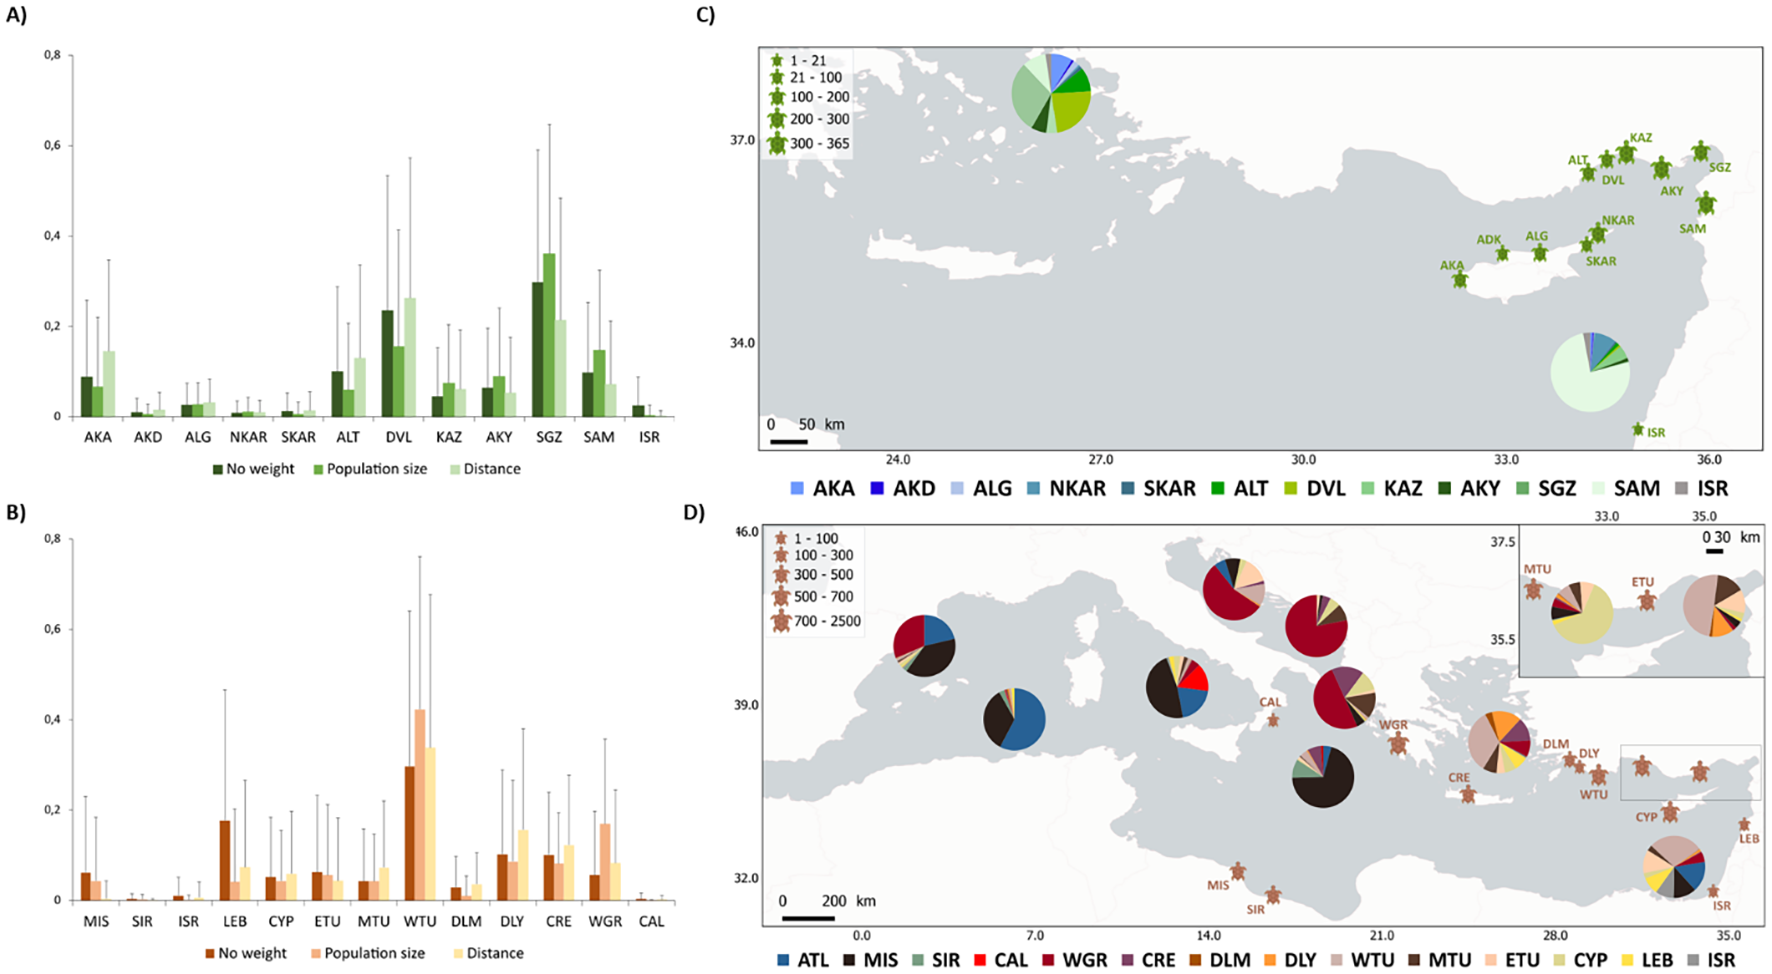
Mixed-stock analyses (MSA) of the individuals found along the Kuşadası Bay. Bar plots represent the percentage of turtles originating from each of the different nesting population groups for (A) loggerhead and (B) green turtles. Three different analyses were run, including (i) no weighting factor; (ii) population size as a weighting factor; and (iii) distance to the nesting area as a weighting factor. Error bars show the 95% confidence intervals. MSA estimated fine-scale nesting contributions (%) to Mediterranean green turtles (C) and loggerhead turtles (D) foraging grounds. Turtle size represents Mediterranean nesting population size; numbers indicate nest counts (nests/year). Nesting areas acronyms for green turtles (A, C) AKA (Akamas), AKD (Akdeniz), ALG (Alagadi), NKAR (North Karpaz), SKAR (South Karpaz), ALT (Alata), DVL (Davultepe), KAZ (Kazanlı), AKY (Akyatan), SGZ (Sugözü), SAM (Samandağ), and ISR (Israel). Nesting areas acronyms for loggerhead turtles (B, D) MIS (Misurata), SIR (Sirte), ISR (Israel), LEB (Lebanon), CYP (Cyprus), ETU (East Türkiye), MTU (Mid Türkiye), WTU (West Türkiye), DLM (Dalaman), DLY (Dalyan), CRE (Crete), WGR (West Greece), and CAL (Calabria). *All Atlantic contributions were aggregated for loggerhead turtles.
Adding Kuşadası Bay results to previous studies allowed us to obtain a regional assessment of the Mediterranean migration routes to foraging grounds for the two species. This is particularly relevant for the green turtle, due general lack of knowledge on nesting population genetic structure and foraging grounds composition until very recently. The almost nil polymorphism of the D-loop control region within the Mediterranean (Bagda et al., 2012) limited the potential to detect population differentiation, and thus to perform MSA. The development of primers to amplify the mitochondrial STRs of the D-loop (Tikochinski et al., 2012) indicated a deep structuring within the Mediterranean, but only one foraging area has been analyzed to date (Karaman et al., 2022; Tikochinski et al., 2018). Our study is the first to test the potential heterogeneity of different green turtle foraging areas within the Mediterranean. Globally, the Turkish nesting areas are the major contributing locations to the two studied foraging grounds, with 74.99% of Turkish-originated individuals in Kuşadası Bay and 85.49% in Israel, and a reduced presence of individuals from Israel or Cyprus. This result is consistent with several lines of evidence. Firstly, the currents system, inferred by particle dispersal, already predicted a high proportion of turtles from these two areas coming from Türkiye (Casale and Mariani, 2014). Satellite telemetry studies on turtles from Cyprus suggested that the majority of the individuals from Cypriot populations migrate to the African shores, from Egypt to Libya (Bradshaw et al., 2017; Stokes et al., 2015), with a small proportion of tracks passing in front of Israel without stopping to feed there, and no track reaching the Aegean Sea. Finally, Türkiye concentrates more than 80% of the Mediterranean nesting population, and consequently, it is expected to have a higher overall contribution. Besides the general high contribution from Türkiye, the fine scale analysis revealed, for the first time, a clear heterogeneity across different green turtles foraging areas. Thus, Kuşadası Bay would be visited mainly by turtles from the populations of Sugözü and Davultepe, while Israel would be visited by turtles from the easternmost Turkish populations, such as Samandağ, which is consistent with this population being the closest to Israel along the coast. Future studies should focus on foraging grounds discovered by satellite telemetry and isotope stable analysis, but not yet genotyped for STRs, such as Egypt or Libya foraging areas (Bradshaw et al., 2017; Stokes et al., 2015), in order to complete the regional migration assessment for the species.
For the loggerhead turtle up to eleven foraging areas were previously studied in the Mediterranean (Clusa et al., 2014; Rees et al., 2017; Turkozan et al., 2018), the Aegean Sea being a notable omission, despite its importance, as this area is located between the Turkish and Greek nesting areas. Our study revealed that in Kuşadası Bay, most of the turtles originated from Turkish beaches, consistent with hatchling movements inferred by particle dispersal analysis (Casale and Mariani, 2014). By combining all data, clear origin differences arise between individuals foraging in the eastern and western Mediterranean basins, as already indicated in previous studies. Turtles of Atlantic origin are found mainly in the western Mediterranean foraging grounds, the Algerian Basin, the Catalano-Balearic Sea, and the Tyrrhenian Sea (Figure 4D; Clusa et al., 2014). This distribution can be explained by a permanent eastward flow of Atlantic water entering through the Gibraltar Straits, generated by a negative water balance of the Mediterranean Sea (Figure 4; Millot and Taupier-Letage, 2004). Once in the Mediterranean, the Atlantic current splits in two branches, one flowing eastwards along the coast of Libya to the southern Levantine Sea, drifting hatchlings to this area, and the other leading Atlantic-origin hatchlings to the Tyrrhenian Sea, Algerian Basin, and the Catalano-Balearic Sea (Figure 1B; Clusa et al., 2014; Millot and Taupier-Letage, 2004). Apart from the Atlantic contribution, the three foraging grounds of the western Mediterranean show clear differences in the contribution from the Mediterranean nesting sites. The Tyrrhenian Sea has a clear contribution from Calabrian nesting turtles, likely due to its proximity, its small population size (only 15 nests per year on average (Casale and Mariani, 2014)), and the influence of the Sicily Channel westward current flow, which may direct hatchlings from Calabria beaches almost exclusively into the Tyrrhenian Sea (Figure 1; Millot and Taupier-Letage, 2004). This Sicily current could also explain the high percentage of Misrata turtles in the Algerian Basin, the Catalano-Balearic, and the Tyrrhenian Sea foraging grounds, allowing hatchlings to drift towards the western foraging areas following the European coast Millot and Taupier-Letage, 2004). The eddies (i. e. circular movements of water) in the central Mediterranean are probably responsible for the high abundance of Misrata and Sirte (Libya) nesting turtles in the Ionian Sea foraging ground. These results are consistent with previous tagging and satellite-tracking studies identifying the Ionian Sea as the main foraging ground for adult loggerhead turtles nesting in Libya (Hochscheid et al., 2012).
The foraging areas of the Adriatic Sea, Amvrakikos Gulf, and Drini Bay are mainly used by turtles from western Greece (Figure 4D), probably due to its proximity, but also because of the current patterns in this zone. This result is consistent with stable isotope (Cardona et al., 2014; Haywood et al., 2020) and telemetry data from the Greek nesting sites (Zbinden et al., 2011) highlighting the importance of these foraging areas for these nesting populations. The principal surface circulation in Greece enters the Adriatic Sea and drifts hatchlings nested in western Greece into the northern Ionian and the Adriatic Sea (Figure 1). These are the most productive habitats of the western Mediterranean Sea. Therefore, access to the Adriatic Sea by turtles from western Greece is likely to promote their fitness and may explain why females nesting there are larger and lay more eggs than females foraging elsewhere in the Mediterranean Sea (Cardona et al., 2014). However, turtles from other origins can also be found in the Adriatic Sea, including Crete and Cyprus, mainly in Drini Bay or different Turkish populations along the Adriatic. To support these alternative origins, satellite tracking of individuals departing Amvrakikos foraging area indicated that a small portion of the turtles using this area could originate in the nesting populations in Türkiye (Rees et al., 2017).
The composition of the easternmost Mediterranean foraging grounds is highly variable. Although the global contribution of Turkish nesting beaches is predominant, fine-scale analysis shows differential roles from the distinct Turkish nesting populations in the eastern foraging areas, which can produce differences among foraging grounds even at relatively small scales (Turkozan et al., 2018). The eastern Mediterranean is characterized by a complex pattern of ocean circulation, including the South-to-North surface currents (Hecht et al., 1988) and the western circulation of eddies at the surface in that area (Figure 1B; Millot and Taupier-Letage, 2004). Consequently, turtles from a certain origin could be directed towards certain foraging areas, while avoiding others. As an example, from all the foraging areas analyzed in the eastern part of the Mediterranean, turtles from Cyprus are detected almost exclusively in the nearby western Turkey foraging area, in agreement with telemetry data that suggests a limited and localized use of Turkish foraging areas (Snape et al., 2016), although turtles from this nesting area are known to mainly use foraging areas along the eastern and African coasts of the Mediterranean (Haywood et al., 2020). In addition, Israel’s nesting area contribution is limited to the Southern Levantine Sea foraging area (Figure 4D). As in the case of Calabria, this small localized presence could be explained by its lower nesting activity (only 57 nests per year on average (Casale and Mariani, 2014)), its proximity to this foraging area, and the presence of mesoscale anticyclonic eddies all year in the southern Levantine Sea (Figure 4; Millot and Taupier-Letage, 2004). Finally, most loggerhead turtles hatching in Lebanon forage in the Southern Levantine Sea, probably due to the anticyclonic eddies leading to the eastern Mediterranean (Figure 4; Millot and Taupier-Letage, 2004). Yet, some individuals follow the northern Middle East slope to forage on Türkiye’s coast and Kuşadası Bay in the Aegean Sea (Figure 4D).
Globally, our results showed a high heterogeneity in the composition of the different foraging grounds in the Mediterranean for both species, that are consistent with the major current patterns and uneven nesting population sizes. However, our analyses detected significant differences between the observed composition, as inferred using genetic analyses, and the expected composition if turtles followed the trajectories dictated by currents as hatchlings, considering particle simulations (Casale and Mariani, 2014). Previous studies comparing genetics with particle simulations and Lagrangian drifters concluded that sea turtles in the Mediterranean showed a pattern of passive drift from nesting to foraging areas (Cardona and Hays, 2018), in agreement with the Learned Migration Goal theory, which postulates that grown individuals tend to use the same foraging areas used as hatchlings (Hays et al., 2010; Gaspar et al., 2012). Hence, in addition to passive juvenile migrations, our results indicate that other factors may influence how individuals recruit to foraging grounds as adults. For example, magnetic orientation plays a significant role in sea turtle movements. Hatchlings can detect the intensity and inclination of the magnetic field, and eventually, develop a large-scale coordinate magnetic map to use in long-distance migrations that result in directed hatchling movements that can be tested empirically (Lohmann and Lohmann, 1996). The fact that hatchlings can develop a magnetic map and swim accordingly may have two potential implications. On one side, hatchlings can contribute with some active swimming while migrating, which can slightly modify their trajectories even with their limited swimming capability due to their small sizes (Revelles et al., 2007). On the second hand, turtles could potentially remember the sites visited, while constrained by the current system as hatchlings, but swim actively to select the optimal sites visited when maturing. Several authors have indicated that adults nesting in the same area may have very different foraging strategies and destinations (e.g. Ceriani et al., 2012; Eder et al., 2012; Mansfield et al., 2009; Zbinden et al., 2011). These differences may arise from individual differences in the knowledge of the heterogeneity of habitats, resulting in differences in key fitness parameters, such as the reproductive output, even within populations (Cardona et al., 2014). Consequently, a combination of passive drifting (following the Learned Migration Goal Theory) and active swimming is the most likely explanation of the observed composition of sea turtle foraging grounds in the Mediterranean.
In summary, the present study has revealed the previously unknown composition of the Mediterranean loggerhead and green sea turtles foraging in the Aegean Sea using genetics. By integrating all the available information from foraging grounds, we have also delineated the regional migratory routes from breeding to foraging grounds in the Mediterranean, highlighting the importance of complete datasets to perform global analyses comprising vast sampling areas. By incorporating particle modelling data, we have assessed the role of passive drifting in sea turtle distribution. This study represents the most complete overview of sea turtle distribution within the Mediterranean to date, and thus of paramount importance to include connectivity in management and conservation plans for both species.
Statements
Data availability statement
The original contributions presented in the study are included in the article/Supplementary Material. Further inquiries can be directed to the corresponding authors.
Ethics statement
Ethical approval was not required for the study involving animals in accordance with the local legislation and institutional requirements because samples were collected from stranded animals.
Author contributions
HV-G: Conceptualization, Data curation, Formal Analysis, Investigation, Methodology, Visualization, Writing – original draft, Writing – review & editing. SK: Investigation, Methodology, Writing – review & editing. BS: Methodology, Resources, Writing – review & editing. OT: Conceptualization, Funding acquisition, Investigation, Writing – original draft, Writing – review & editing. MP: Conceptualization, Formal Analysis, Funding acquisition, Investigation, Project administration, Resources, Supervision, Validation, Visualization, Writing – original draft, Writing – review & editing. CP: Conceptualization, Formal Analysis, Investigation, Resources, Supervision, Validation, Visualization, Writing – original draft, Writing – review & editing. CC: Conceptualization, Formal Analysis, Funding acquisition, Investigation, Project administration, Resources, Supervision, Validation, Visualization, Writing – original draft, Writing – review & editing.
Funding
The author(s) declare financial support was received for the research and/or publication of this article. This research was funded by the projects GenoMarTur (CNS2022-135205 funded by MICIU/AEI/10.13039/501100011033 and the ‘European Union NextGenerationEU/PRTR’) and BlueDNA (PID2023-146307OB) funded by MCIN/AEI/10.13039/501100011033 and ERDF/EU, both of them from the Spanish Government. The authors HV, CP, MP, and CC are members of the research group SGR2021-01271 funded by the Generalitat de Catalunya.
Acknowledgments
The authors would like to acknowledge EKODOSD NGO and all the volunteers who participated in fieldwork and collected the data.
Conflict of interest
The authors declare that the research was conducted in the absence of any commercial or financial relationships that could be construed as a potential conflict of interest.
Generative AI statement
The author(s) declare that no Generative AI was used in the creation of this manuscript.
Any alternative text (alt text) provided alongside figures in this article has been generated by Frontiers with the support of artificial intelligence and reasonable efforts have been made to ensure accuracy, including review by the authors wherever possible. If you identify any issues, please contact us.
Publisher’s note
All claims expressed in this article are solely those of the authors and do not necessarily represent those of their affiliated organizations, or those of the publisher, the editors and the reviewers. Any product that may be evaluated in this article, or claim that may be made by its manufacturer, is not guaranteed or endorsed by the publisher.
Supplementary material
The Supplementary Material for this article can be found online at: https://www.frontiersin.org/articles/10.3389/fmars.2025.1661954/full#supplementary-material
References
1
Abreu-Grobois A. Horrocks J. Formia A. LeRoux R. Velez-Zuazo X. Peter D. et al . (2006). New mt DNA D-loop primers which work for a variety of marine turtle species may increase the resolution capacity of mixed stock analysis. Poster presented at the 26th Annual Symposium on Sea Turtle Biology and Conservation (Crete, Greece). Available online at: http://www.iucn-mtsg.org/genetics/meth/primers/abreu_grobois_etal_new_dloop_primers.pdf.
2
Bagda E. Bardakci F. Turkozan O. (2012). Lower genetic structuring in mitochondrial DNA than nuclear DNAamong the nesting colonies of green turtles (Chelonia mydas) in the Mediterranean. Biochem. Systematics Ecol.43, 192–199. doi: 10.1016/j.bse.2012.03.015
3
Bjorndal K. (1997). Foraging ecology and nutrition of sea turles. In The biology of sea turtlesLutzP. L.MusickJ. A. (Eds.), (Vol. 1, pp. 199–231). (CRC Press/Taylor & Francis Group).
4
Bolker B. M. Okuyama T. Bjorndal K. A. Bolten A. B. (2007). Incorporating multiple mixed stocks in mixed stock analysis: “many-to-many. analyses. Mol. Ecology 16(4)685–695. doi: 10.1111/j.1365-294X.2006.03161.x
5
Bolten A. B. (2003). Active swimmers – passive drifters: the Oceanic Juvenile Stage of Loggerheads in the Atlantic System. BoltenA. B.WitheringtonB. E. (editors), Loggerhead Sea TurtlesLoggerhead Sea Turtles ( Washington, D.C.: Smithsonian Institution Press).
6
Bradshaw P. J. Broderick A. C. Carreras C. Inger R. Fuller W. Snape R. et al . (2017). Satellite tracking and sta ble isotope analysis highlight differential recruitment among foraging areas in green turtles. Mar. Ecol. Prog. Ser.582, 201–214. doi: 10.3354/meps12297
7
Cardona L. Abalo-Morla S. Cani A. Feliu-Tena B. Izaguirre N. Tomás J. et al . (2024). Identifying the foraging grounds of the new loggerhead turtle nesters in the western Mediterranean. Aquat. Conservation: Mar. Freshw. Ecosyst.34. doi: 10.1002/aqc.4059
8
Cardona L. Clusa M. Eder E. Demetropoulos A. Margaritoulis D. Rees A. F. et al . (2014). Distribution patterns and foraging ground productivity determine clutch size in Mediterranean loggerhead turtles. Mar. Ecol. Prog. Ser.497, 229–241. doi: 10.3354/meps10595
9
Cardona L. Hays G. C. (2018). Ocean currents, individual movements and genetic structuring of populations. Mar. Biol.165, 10. doi: 10.1007/s00227-017-3262-2
10
Carreras C. Godley B. J. León Y. M. Hawkes L. A. Revuelta O. Raga J. A. et al . (2013). Contextualising the last survivors: population structure of marine turtles in the Dominican republic. PloS One8, e66037. doi: 10.1371/journal.pone.0066037
11
Carreras C. Pascual M. Cardona L. Marco A. Bellido J. J. Castillo J. J. et al . (2011). Living Together but Remaining Apart: Atlantic and Mediterranean Loggerhead Sea Turtles (Caretta caretta) in Shared Feeding Grounds. J. Heredity102, 666–677. doi: 10.1093/jhered/esr089
12
Carreras C. Pascual M. Tomás J. et al . (2018). Sporadic nesting reveals long distance colonisation in the philopatric loggerhead sea turtle (Caretta caretta). Scientific Reports8, 1435. doi: 10.1038/s41598-018-19887-w
13
Carreras C. Pont S. Maffucci F. Pascual M. Barceló A. Bentivegna F. et al . (2006). Genetic structuring of immature loggerhead sea turtles (Caretta caretta) in the Mediterranean Sea reflects water circulation patterns. Mar. Biol.149, 1269–1279. doi: 10.1007/s00227-006-0282-8
14
Casale P. Mariani P. (2014). The first “lost year” of Mediterranean sea turtles: Dispersal patterns indicate subregional management units for conservation. Mar. Ecol. Prog. Ser.498, 263–274. doi: 10.3354/meps10640
15
Casale P. Broderick A. C. Camiñas J. A. Cardona L. Carreras C. Demetropoulos A. et al . (2018). Mediterranean sea turtles: Current knowledge and priorities for conservation and research. In Endangered Species Res.36, 229–267. doi: 10.3354/esr00901
16
Casale P. Freggi D. Basso R. Argano R. (2005). Size at male maturity, sexing methods and adult sex ratio in loggerhead turtles (Caretta caretta) from Italian waters investigated through tail measurements. The Herpetological Journal15 (3), 145–148.
17
Ceriani S. A. Roth J. D. Evans D. R. Weishampel J. F. Ehrhart L. M. (2012). Inferring foraging areas of nesting loggerhead turtles using satellite telemetry and st able isotopes. PloS One7, e45335. doi: 10.1371/journal.pone.0045335
18
Clusa M. Carreras C. Pascual M. Demetropoulos A. Margaritoulis D. Rees A. F. et al . (2013). Mitochondrial DNA reveals Pleistocenic colonisation of the Mediterranean by loggerhead turtles (Caretta caretta). J. Exp. Mar. Biol. Ecol.439, 15–24. doi: 10.1016/j.jembe.2012.10.011
19
Clusa M. Carreras C. Pascual M. Gaughran S. J. Piovano S. Giacoma C. et al . (2014). Fine-scale distribution of juvenile Atlantic and Mediterranean loggerhead turtles (Caretta caretta) in the Mediterranean Sea. Mar. Biol.161, 509–519. doi: 10.1007/s00227-013-2353-y
20
Clusa M. Carreras C. Cardona L. Demetropoulos A. Margaritoulis D. Rees A. F. et al . (2018). Philopatry in loggerhead turtles Caretta caretta: beyond the gender paradigm. Marine Ecology Progress Series. 588 ,201–213. https://www.jstor.org/stable/26403518
21
Coll M. Piroddi C. Steenbeek J. Kaschner K. Lasram F. B. R. Aguzzi J. et al . (2010). The biodiversity of the Mediterranean Sea: Estimates, patterns, and threats. In PloS One5. doi: 10.1371/journal.pone.0011842
22
Eder E. Ceballos A. Martins S. Pérez-García H. Marín I. Marco A. et al . (2012). Foraging dichotomy in loggerhead sea turtles Caretta off northwestern Africa. Mar. Ecol. Prog. Ser.470, 113–122. doi: 10.3354/meps10018
23
Excoffier L. Lischer H. E. (2010). Arlequin suite ver 3.5: a new series of programs to perform population genetics analyses under Linux and Windows. Molecular ecology resources10 (3), 564–567. doi: 10.1111/j.1755-0998.2010.02847.x
24
Garofalo L. Mingozzi T. Micò A. Novelletto A. (2009). Loggerhead turtle (Caretta caretta) matrilines in the Mediterranean: Further evidence of genetic diversity and connectivity. Mar. Biol.156, 2085–2095. doi: 10.1007/s00227-009-1239-5
25
Gaspar P. Benson S. R. Dutton P. H. Reveillere A. Jacob G. Meetoo C. et al . (2012). Oceanic dispersal of juvenile leatherback turtles: going beyond passive drift modeling. Mar. Ecol. Prog. Ser.457, 265–284. doi: 10.3354/meps09689
26
Gómez de Segura A. Tomás J. Pedraza S. N. Crespo E. A. Raga J. A. (2006). Abundance and distribution of the endangered loggerhead turtle in Spanish Mediterranean waters and the conservation implications. Anim. Conserv.9, 199–206. doi: 10.1111/j.1469-1795.2005.00014.x
27
Grant W. S. Milner G. B. Krasnowski P. Utter F. M. (1980). Use of biochemical genetic variants for identification of sockeye salmon (Oncorhynchus nerka) stocks in cook inlet, alaska. Can. J. Fisheries Aquat. Sci.37, 1236–1247. doi: 10.1139/f80-159
28
Hall T. A. (1999). BioEdit: a user-friendly biological sequence alignment editor and analysis program for Windows 95/98/NT. Nucleic. Acids Symposium Ser.41, 95–98.
29
Hays G. C. Fossette S. Katselidis K. A. Mariani P. Schofield G. (2010). Ontogenetic development of migration: Lagrangian drift trajectories suggest a new paradigm for sea turtles. J. R Soc. Interface7, 1319–1327. doi: 10.1098/rsif.2010.0009
30
Haywood J. C. Fuller W. J. Godley B. J. Margaritoulis D. Shutler J. D. Snape R. T. E. et al . (2020). Spatial ecology of loggerhead turtles: Insights from stabl e isotope markers and satellite telemetry. Diversity Distributions26, 368–381. doi: 10.1111/ddi.13023
31
Hecht A. Pinardi N. Robinson R.A. (1988). Currents, water masses, eddies and jets in the mediterranean levantine basin. J. Phys. Oceanography18 (10), 1320–1353. doi: 10.1175/1520-0485
32
Hillis D. M. Moritz C. (Eds.). (1990). Molecular systematics. Sinauer Associates.
33
Hochscheid S. Maffucci F. Abella E. Bradai M. N. Camedda A. Carreras C. et al . (2022). Nesting range expansion of loggerhead turtles in the Mediterranean: Phenology, spatial distribution, and conservation.implications. Global Ecol. Conserv.38, e02194. doi: 10.1016/j.gecco.2022.e02194
34
Hochscheid S. Saied A. M. Oureghi A. Dryag S. M. H. Bentivegna F. (2012). Satellite tracking reveals: loggerhead turtles nesting in Libya prefer to feed on the Tunisian plateau. Proc. 31st Annu. Symposium Sea Turtle Biol. Conserv., 138–139. NOAA Techincal Memorandum NMFS-SEFSC-631
35
IUCN (2025). The IUCN red list of threatened species. Version 2025-1. Available online at: https://www.iucnredlist.org (Accessed May 21, 2025).
36
Karaman S. Turkozan O. Carreras C. Yılmaz C. Sönmez B. Candan O. et al . (2022). Population genetic diversity of green turtles, Chelonia mydas, in the Mediterranean revisited. Mar. Biol.169. doi: 10.1007/s00227-022-04068-1
37
Karl S. A. Toonen R. J. Grant W. S. Bowen B. W. (2012). Common misconceptions in molecular ecology: echoes of the modern synthesis. Molecular Ecology21 (17), 4171–4189. doi: 10.1111/j.1365-294X.2012.05576.x
38
Lohmann K. J. Lohmann C. M. F. (1996). Detection of magnetic field intensity by sea turtles. Nature380, 59–61. doi: 10.1038/380059a0
39
Luna-Ortiz A. Marín-Capuz G. Abella E. Crespo-Picazo J. L. Escribano F. Félix G. et al . (2024). New colonisers drive the increase of the emerging loggerhead turtle nesting in Western Mediterranean. Sci. Rep.14. doi: 10.1038/s41598024-51664-w
40
Mansfield K. L. Saba V. S. Keinath J. A. Musick J. A. (2009). Satellite tracking reveals a dichotomy in migration strategies among juvenile loggerhead turtles in the Northwest Atlantic. Mar. Biol.156, 2555–2570. doi: 10.1007/s00227-009-1279-x
41
Marín-Capuz G. Crespo-Picazo J. L. Demetropoulos S. Garrido L. Hardwick J. Jribi I. et al . (2025). Incipient range expansion of green turtles in the mediterranean. Mol. Ecol.34 (11), e17790. doi: 10.1111/mec.17790
42
Millot C. Taupier-Letage I. (2005). Circulation in the Mediterranean Sea. In: SaliotA. (ed.), The Mediterranean Sea. Handbook of Environmental Chemistry , vol. 5K. (Berlin, Heidelberg: Springer). doi: 10.1007/b107143
43
Moritz C. Dowling T. E. Brown W. M . (1987). Evolution of animal mitochondrial DNA: relevance for population biology and systematics. Annual Review of Ecology and Systematics18, 269–292. doi: 10.1146/annurev.es.18.110187.001413
44
Peakall R. Smouse P. E. (2012). GenAlEx 6.5: genetic analysis in Excel. Population genetic software for teaching and research—an update. Bioinformatics28, 2537–2539. doi: 10.1093/bioinformatics/bts460
45
Pella J. J. Masuda M. (2001). Bayesian methods for analysis of stock mixtures from genetic characters. Fishery Bull.99, 151–167.
46
Rees A. Carreras C. Broderick A. C. Margaritoulis D. Stringell T. B. Godley B. J. (2017). Linking loggerhead locations: using multiple methods to determine the origin of sea turtles in feeding grounds. Mar. Biol.164. doi: 10.1007/s00227-016-3055-z
47
Revelles M. Carreras C. Cardona L. Marco A. Bentivegna F. Castillo J. J. et al . (2007). Evidence for an asymmetrical size exchange of loggerhead sea turtles between the Mediterranean and the Atlantic through the Straits of Gibraltar. J. Exp. Mar. Biol. Ecol.349, 261–271. doi: 10.1016/j.jembe.2007.05.018
48
Saied A. Maffucci F. Hochscheid S. Dryag S. Swayeb B. Borra M. et al . (2012). Loggerhead turtles nesting in Libya: An important management unit for the Mediterranean stock. Mar. Ecol. Prog. Ser.450, 207–218. doi: 10.3354/meps09548
49
Snape R. T. E. Broderick A. C. Çiçek B. A. Fuller W. J. Glen F. Stokes K. et al . (2016). Shelf life: neritic habitat use of a turtle population highly threatened by fisheries. Diversity Distributions22, 797–807. doi: 10.1111/ddi.12440
50
Spotila J. R. (2004). Sea turtles: A complete guide to their biology, behavior, and conservation (pp. 57–69). The Johns Hopkins University Press and Oakwood Arts.
51
Stokes K. L. Broderick A. C. Canbolat A. F. Candan O. Fuller W. J. Glen F. et al . (2015). Migratory corridors and foraging hotspots: Critical habitats identified for Mediterranean green turtles. Diversity Distributions21, 665–674. doi: 10.1111/ddi.12317
52
Stokes L. Epperly S. P. Avens L. I. Belskis L. C. Benson S. R. Braun-McNeill J. et al (2008). Sea turtle research techniques manual. NOAA Technical Memorandum NMFS-SEFSC-579. U.S. Department of Commerce, National Oceanic and Atmospheric Administration, National Marine Fisheries Service, Southeast Fisheries Science Center. Available at: https://repository.library.noaa.gov/view/noaa/3626
53
Tikochinski Y. Bendelac R. Barash A. Daya A. Levy Y. Friedmann A. (2012). Mitochondrial DNA STR analysis as a tool for studying the green sea turtle (Chelonia mydas) populations: The Mediterranean Sea case study. Mar. Genomics6, 17–24. doi: 10.1016/j.margen.2012.01.002
54
Tikochinski Y. Bradshaw P. Mastrogiacomo A. Broderick A. Daya A. Demetropoulos A. et al . (2018). Mitochondrial DNA short tandem repeats unveil hidden population structuring and migration routes of an endangered marine turtle. Aquat. Conservation: Mar. Freshw. Ecosyst.28, 788–797. doi: 10.1002/aqc.2908
55
Turkozan O. Yılmaz C. Uçar A. H. Carreras C. Ergene S. Aymak C. et al . (2018). Local differentiation in the origin of stranded loggerhead turtles, Caretta, within an eastern Turkey foraging area. Ocean Coast. Manage.153, 70–75. doi: 10.1016/j.ocecoaman.2017.12.011
56
Wallace B. Bandimere A. Abreu-Grobois F. Acosta H. Akiti J. Akomedi M. et al . (2025). Updated global conservation status and priorities for marine turtles. Endangered Species Res.56, 247–276. doi: 10.3354/esr01385
57
Yilmaz C. Turkozan O. Bardakci F. (2011). Genetic structure of loggerhead turtle (Caretta caretta) populations in Turkey. Biochem. Systematics Ecol.39, 266–276. doi: 10.1016/j.bse.2011.08.018
58
Zbinden J. A. Bearhop S. Bradshaw P. Gill B. Margaritoulis D. Newton J. et al . (2011). Migratory dichotomy and associated phenotypic variation in marine turtles revealed by satellite tracking and sta ble isotope analysis. Mar. Ecol. Prog. Ser.421, 291–302. doi: 10.3354/meps08871
Summary
Keywords
Caretta caretta , Chelonia mydas , migration routes, mtDNA control region D-loop, short tandem repeats (STRs), Mediterranean sea and conservation
Citation
Vela-Garcia H, Karaman S, Sürücü B, Turkozan O, Pascual M, Pegueroles C and Carreras C (2025) Where do sea turtles forage in the Mediterranean sea? Filling the gaps for a regional assessment of migration routes. Front. Mar. Sci. 12:1661954. doi: 10.3389/fmars.2025.1661954
Received
08 July 2025
Accepted
15 October 2025
Published
13 November 2025
Volume
12 - 2025
Edited by
Ana M Faria, University of Porto, Portugal
Reviewed by
Katherine R. Martin, Oregon State University, United States
Sara Abalo Morla, Spanish National Research Council (CSIC), Spain
Updates
Copyright
© 2025 Vela-Garcia, Karaman, Sürücü, Turkozan, Pascual, Pegueroles and Carreras.
This is an open-access article distributed under the terms of the Creative Commons Attribution License (CC BY). The use, distribution or reproduction in other forums is permitted, provided the original author(s) and the copyright owner(s) are credited and that the original publication in this journal is cited, in accordance with accepted academic practice. No use, distribution or reproduction is permitted which does not comply with these terms.
*Correspondence: Helena Vela-Garcia, helena.vela.garcia@gmail.com; Cinta Pegueroles, cinta.pegueroles@uab.cat; Carlos Carreras, carreras@ub.edu
Disclaimer
All claims expressed in this article are solely those of the authors and do not necessarily represent those of their affiliated organizations, or those of the publisher, the editors and the reviewers. Any product that may be evaluated in this article or claim that may be made by its manufacturer is not guaranteed or endorsed by the publisher.