Abstract
The speckled blue grouper (Epinephelus cyanopodus) is a coral reef-dwelling grouper with high market and ecological value. During intensive aquaculture and the transportation of live fish, fish often expose acute hypoxic stress. In this study, transcriptomic techniques were used to detect the response of E. cyanopodus to acute hypoxia. The results showed that after acute hypoxia, there were 2,887 differentially expressed genes (DEGs) in the head kidney. GO and KEGG enrichment analyses revealed that the DEGs were mainly involved in processes such as transmembrane signal receptor activity, G protein-coupled receptor activity, and molecular transducer activity, involving the HIF-1, PI3K-Akt, and AMPK signaling pathways. In addition, E. cyanopodus HIF-1α (EcHIF-1α) was cloned and characterized. Multiple analyses have shown that the EcHIF-1α had a relatively high conservation. Tissue distribution indicated that EcHIF-1α was expressed in all tissues and was highly expressed in the heart, liver, and peripheral blood. The results of qRT-PCR were consistent with the transcriptomic techniques, and the expression of EcHIF-1α was significant after hypoxia. Meanwhile, EcHIF-1α was significantly induced by Vibrio harveyi, LPS and Poly (I:C) in the head kidney and liver, indicating that EcHIF-1α was involved in the immune response. After hypoxia treatment, the significant expression of EcHIF-1α induced by Vibrio harveyi, LPS and Poly(I:C) was further advanced and enhanced. These results not only confirmed the key role of HIF-1α in fish pathogen infection, but also demonstrated experimentally for the first time that oxygen stress can pre-activate the immune response of speckled blue grouper against pathogenic bacteria. Overall, the work not only contributes to a thorough understanding of the hypoxia tolerance mechanism of teleost, but also provides a new perspective for further exploration of hypoxia and the outbreak of aquatic pathogen diseases.
1 Introduction
Dissolved oxygen (DO) is crucial for the metabolism, growth and survival of organisms (Xiao, 2015). When the DO concentration is less than 2.0 mg/L, aquatic animals will encounter hypoxic challenges (Diaz, 2001). Globally, declining oxygen levels in coastal and marine environments, driven by climate change, eutrophication, and intensive farming practices, have led to substantial economic losses in fisheries (Breitburg and Levin, 2018).
Fish have evolved various physiological, biochemical, and molecular mechanisms to adapt to hypoxic environments (Richards, 2011). One common adaptation is the increase in red blood cell production, which improves oxygen-carrying capacity (Xiao, 2015; Xu et al., 2016). Additionally, fish modify the morphology of their gills to increase oxygen exchange, facilitating better oxygen uptake from water (Tzaneva et al., 2014). In the face of acute hypoxic challenges, fish may also reduce their activity and metabolic rate to conserve energy and oxygen (Zheng et al., 2021). In severe cases, fish may resort to behaviors such as “floating head” to access oxygen-rich surface water (Xiao, 2015). However, acute hypoxia can lead to the mass death of oxygen-sensitive fish. Energy metabolism in fish undergoes significant changes under hypoxic conditions (Xiao, 2015). Fish lower their ATP and oxygen utilization by suppressing biosynthesis, cell - cycle advancement and ion transportation (Pamenter, 2014). At the molecular level, hypoxia-inducible factors (HIFs) have a core part in managing the organism’s response to hypoxic situations. The activation of the HIF signaling pathway involves the gene of glucose metabolism and angiogenesis, and erythropoiesis, facilitating oxygen delivery and utilization (Semenza, 2011). The HIF signaling pathway in fish controls the expression of hypoxia - responsive genes, playing a key part in hypoxia - related physiological reactions (Zhang et al., 2012).
HIF-1 is a crucial protein in the HIF signaling pathway (Semenza, 2011). It is a heterodimer composed of two subunits: HIF-1α and HIF-1β (Palazon et al., 2014). Under normal DO, HIF-1α is degraded by the ubiquitin proteolytic complex, inhibiting the activation of the HIF signaling pathway. The ubiquitin proteolytic complex can degrade HIF-1α, thereby inhibiting the conduction of the HIF signaling pathway. However, after being subjected to hypoxic stress, it will be transported to the cell nucleus to form a dimer with HIF-1β, thereby regulating the expression of the target gene (Schumacker, 2005). The HIF pathway is conserved in fish species, and they maintain functional homologs of HIF-α. The HIF-1α was initially discovered in rainbow trout in fish. And HIF-1α sequences have been identified in several fish species, including Micropogonias undulatus, Boleophthalmus pectinirostris, and Danio rerio (Lee et al., 2017; Xiao, 2015; Zhang et al., 2024). Intensive aquaculture practices frequently expose fish to hypoxic conditions due to elevated stocking densities. Due to increased stocking densities, intensive aquaculture frequently exposes fish to hypoxic conditions. The effect of hypoxia on bacterial disease outbreaks in aquatic animals has gained widespread attention. However, the mechanism of HIF-1α in regulating fish responses to hypoxia and pathogen infection remains unclear.
The speckled blue grouper (Epinephelus cyanopodus), a species from the western Pacific, dwells in coral reefs within lagoons and bays, feeding on fishes and crustaceans that live in sandy environments (Cao et al., 2022). Valued for both its chromatic variability and delicate flesh texture, this species has gained popularity as a culinary delicacy and ornamental aquarium fish. Artificial breeding programs have consequently been initiated across multiple regions in China. Additionally, the speckled blue grouper serves as an important model organism for coral reef ecosystem studies due to its dual ecological significance as a protogynous hermaphroditic species and apex predator within reef communities. In the work, transcriptomic analysis revealed the involvement of apoptosis signaling pathways, insulin resistance, and antioxidant enzymes in the acute-hypoxia stress response of the speckled blue grouper. Furthermore, we successfully cloned and characterized HIF-1α (EcHIF-1α), and systematically analyzed its expression dynamics under hypoxic conditions as well as following stimulation with LPS and Poly(I:C), and Vibrio harveyi in speckled blue grouper.
2 Materials and methods
2.1 Fish, acute hypoxic exposure, and immune challenge
Speckled blue grouper (Epinephelus cyanopodus, body weight: 35.0 ± 1.0 g, 4-month-old females) were acclimated for 3 weeks in 300 L recirculating aquaculture tanks. Fish were acclimated without bacterial or viral infection in a freshwater environment of 22 ± 2°C with the normal oxygen level DO (DO:6.0 ± 0.1 mg/L). The hypoxic treatment followed our previous studies (Wu et al., 2023, 2024). Briefly, we stopped the circulating water, sealed the bucket opening with plastic film and injected nitrogen at a constant rate. Within 1 h, we reduced the normal oxygen level to a low DO level (0.5 ± 0.1 mg/L) (Liang et al., 2024), and then maintained this DO concentration. When we reduced the dissolved oxygen from the normoxic level to 0.5 ± 0.1 mg/L, the floating head frequency, respiratory rate and tail flap frequency initially showed a sharp increase. All these manifestations indicated that the grouper was under hypoxic stress. Under normoxic conditions, 3 fish were randomly selected for head kidney (HK) tissue dissection and named Ctrl (control). When hypoxia persisted for 6 h, HK tissues were randomly collected from 3 fish and named Hyp. To explore the physiological processes of grouper under the dual stress of hypoxia and pathogenic bacteria, we conducted the following experiments. A total of 504 fish were divided into 2 groups (control group and hypoxia group), with 3 replicates in each group, and 84 fish in each replicate. Each replicate was subjected to stress from LPS, Vibrio harveyi (V. harveyi), Poly (I:C), and PBS respectively. Fish cultured under normoxia and hypoxia for 6 h were randomly grouped and intraperitoneally injected with 100 μL LPS (50 μg/mL) (Sandamalika et al., 2022), 100 μL V. harveyi (1 × 10⁸ CFU/mL), 100 μL Poly(I:C) (50 μg/mL) (Thanasaksiri et al., 2014), or 100 μL PBS (control), respectively. The injection dose of V. harveyi was determined by testing 1 × 10⁷, 3 × 10⁷, 9 × 10⁷, 2.7 × 10⁸ and 8.4 × 10⁸ CFU/mL (Supplementary Figure S1) in 150 fish. At 0, 3, 6, 12, 24, 48, and 72 h post-injection (p.i.), liver and head kidney tissues were harvested from 3 individual fish, then stored at - 80°C before use. To study the transcriptional expression of EcHIF-1α in healthy speckled blue grouper, a variety of tissues including head kidney (HK), spleen (SP), peripheral blood (PBL), posterior kidney (PK), heart (HE), thymus (TH), muscle (MU), brain (BRA), gills (GI), liver (LI), and stomach (STO) were carefully dissected and gathered from 3 distinct fish and preserved using liquid nitrogen.
2.2 cDNA library construction and sequencing
Total RNA was extracted from samples using the TRIzol Kit (Promega, USA) following the manufacturer’s instructions. RNA integrity, quality, and quantity were assessed using an Agilent 2100 bioanalyzer, NanoPhotometer spectrophotometer, Qubit 2.0 Fluorometer, and agarose gel electrophoresis. Poly-A-tailed mRNA was enriched using Oligo(dT)-coated magnetic beads and then fragmented by sonication. First-strand cDNA synthesis was initiated using the fragmented mRNA as a template, random oligonucleotide primers, and the M-MuLV reverse transcriptase system. RNase H was employed to degrade the RNA component, enabling second-strand cDNA synthesis with DNA polymerase I and dNTPs. The cDNA fragments were purified using a QIAquick PCR extraction kit (QIAGEN). The purified cDNA fragments were washed with EB buffer solution for end repair with poly (A), and then attached to the sequencing adapter. After agarose gel electrophoresis, about 300 bp cDNA fragments were purified and enriched by PCR to construct the final cDNA library. The cDNA sequencing libraries subsequently underwent sequencing utilizing the Illumina HiSeq™ 2500 system, carried out by Genedenovo Biotechnology Co., Ltd., located in Guangzhou, China.
2.3 Identification of differentially expressed genes
To identify and remove non-coding RNAs, the clean reads were aligned with data from the GenBank and Rfam databases. The DEGs among the 3 groups were determined by the DESeq2 algorithm. Genes with more than 2-fold the Change (|log2 (Fold Change) |>1) and a false detection rate (FDR) < 0.05 were marked as significant DEGs. The DEGs were subjected to GO and KEGG enrichment analyses. In review enriched GO terms or pathways were determined employing an FDR-adjusted p value threshold of 0.05. Further GO and KO enrichment analysis (p < 0.05) was conducted using a hypergeometric distribution test.
2.4 Cloning and sequence analysis of EcHIF-1α
The cDNA sequence of EcHIF-1α gene was subsequently identified using transcriptome analysis. The EcHIF-1α-specific primers were designed using Primer Premier 5.0 and presented in Table 1. The PCR product was sequenced at BGI TECH SOLUTIONS CO., LIMITED (Guangzhou, China) using an ABI 3730XL automated sequencer. The predicted amino acid (aa) sequence of EcHIF-1α was assessed via the Expert Protein Analysis System on http://www.expasy.org/. The molecular weight (MW) and theoretical isoelectric point (PI) were calculated using the ProtParam tool at https://web.expasy.org/protparam/?tdsourcetag=s_pcqq_aiomsg. The Simple Modular Architecture Research Tool (SMART) from http://smart.emblheidelberg.de/ was applied for protein domain prediction. Multiple sequence alignments were performed using DNAMAN software (LynnonBiosoft, USA), and the phylogenetic tree for HIF-1α sequences was generated using the neighbor-joining (N-J) method in MEGA 6.0, with reliability evaluated through 1000 bootstrap replicates.
Table 1
| Primers | Sequences (5’-3’) | Application |
|---|---|---|
| HIF-1α-F | ATGGACACAGGAATTGTACCCGAAA | gene sequence |
| HIF-1α-R | TCAATTGACGTGGTCCAGGGCGCGC | gene sequence |
| qHIF-1α-F | TGGGAAGGAGTCTGAGGTGT | RT-qPCR |
| qHIF-1α-R | TCCGCATTGAGCAGTTTCCT | RT-qPCR |
| β-actin-F | TACGAGCTTCCTGACGGACA | RT-qPCR |
| β-actin-R | GGCTGTGATCTCCTTCTGC | RT-qPCR |
| ef1-α-F | ATCAAGAAGATCGGCTACAACCC | RT-qPCR |
| ef1-α-R | ATCCCTTGAACCAGTTCATCTTGT | RT-qPCR |
Primers used in this study.
2.5 Quantitative real-time PCR validation and expression analysis
To verify the RNA-seq findings, 12 key DEGs were randomly chosen for qRT-PCR validation. DEGs-specific primers were designed with Primer Premier 5.0, with β-actin and Ef1α serving as reference genes (Supplementary Table S1). The qRT-PCR assay was conducted on the ABI 7500 apparatus (Applied Biosystems, USA) utilizing Yeasen’s SYBR qPCR Master Mix. The reaction mixture with a volume of 20 μL was prepared as follows: 2 μL of each primer (2 μM), 10 μL of 2× Hieff® qPCR SYBR Green Master Mix (Low Rox Plus) (Yeasen Biotechnology, China), 3 μL of diluted cDNA, and 3 μL of DEPC-treated water were combined. The thermal cycling protocol consisted of an initial denaturation at 95°C for 30 seconds, followed by 40 cycles of 95°C for 10 seconds, 60°C for 30 seconds, and a final extension. Ultimately, a melting curve analysis was performed following these steps: 95°C for 15 s, 60°C for 60 s, and 95°C for 15 s. This step was conducted to identify any non-specific amplification or primer dimers (Wu et al., 2024). All DEG expression levels were calculated by 2−ΔΔCT (Schmittgen and Livak, 2008).
In healthy fish, the tissue distribution of EcHIF-1α was analyzed across various tissues, including HK, PBL, SP, MU, IN, PK, TY, HE, STO, LI, BR, and GI, by qRT-PCR. Relative expression analyses of tissue distribution were normalized against β-actin and Ef1α by the 2−ΔCT method (Gao et al., 2020). To further investigate the expression of EcHIF-1α against the LPS, V. harveyi, Poly(I:C), and PBS, the differential expression levels of EcHIF-1α were computed using β-actin and ef1α as internal standards, and the findings were benchmarked against the corresponding control group to assess the variation in gene expression. The EcHIF-1α expression was calculated by 2−ΔΔCT method.
2.6 Statistical analysis
Data handling was performed using Microsoft Office Excel 2021. All statistical analyses and figures were generated with GraphPad Prism 9.3.1. Data analyzed by one-way ANOVA are presented as the mean ± SD, and *p< 0.05 and **p< 0.01 were used to defined the statistical significance.
3 Results
3.1 Quality of RNA-seq data
RNA-Seq of 6 head kidney tissue samples yielded 33,586,082 to 55,062,978 raw reads. After removing low-quality sequences, we obtained 33,482,278 to 54,827,026 clean reads for further analysis. The parameter statistics of the clean reads in each group were Q20, 96.28 − 98.77%; Q30, 88.69 – 96.26%; GC content, 47.97 − 49.25%, and total mapped rate, 81.13 – 84.16% (Table 2). The above results suggest that the RNA-seq data are reliable and suitable for subsequent analysis.
Table 2
| Sample | Raw reads | Clean reads | Clean bases (Gb) | Q20% | Q30% | GC% | Total mapped (%) |
|---|---|---|---|---|---|---|---|
| AK-Ctrl-1 | 41,123,224 | 41,030,988 | 6.10 | 96.28 | 88.69 | 48.35 | 84.16 |
| AK-Ctrl-2 | 38,281,160 | 38,198,610 | 5.68 | 96.42 | 88.94 | 47.97 | 83.78 |
| AK-Ctrl-3 | 46,887,098 | 46,778,664 | 6.93 | 97.64 | 92.67 | 48.41 | 83.66 |
| AK-Hyp-1 | 33,586,082 | 33,482,278 | 4.91 | 98.74 | 96.19 | 49.25 | 81.13 |
| AK-Hyp-2 | 38,808,602 | 38,706,286 | 5.73 | 98.77 | 96.26 | 48.61 | 83.30 |
| AK-Hyp-3 | 55,062,978 | 54,827,026 | 8.13 | 97.34 | 92.23 | 48.58 | 83.60 |
Statistical analysis for the RNA-seq of Epinephelus cyanopodus.
3.2 Classification and identification of DEGs
The comparison of Ctrl and Hyp revealed 2,887 DEGs, with 926 up-regulated and 1,961 down-regulated DEGs (Supplementary Figures S2A, B). The 2,887 DEGs were analyzed for GO and KEGG enrichment. As shown in Figure 1A, the comparison of Ctrl and Hyp showed GO enrichment results. GO enrichment between Ctrl and Hyp was mainly concentrated in biological processes (BP), molecular functions (MF), and cellular components (CC).
Figure 1
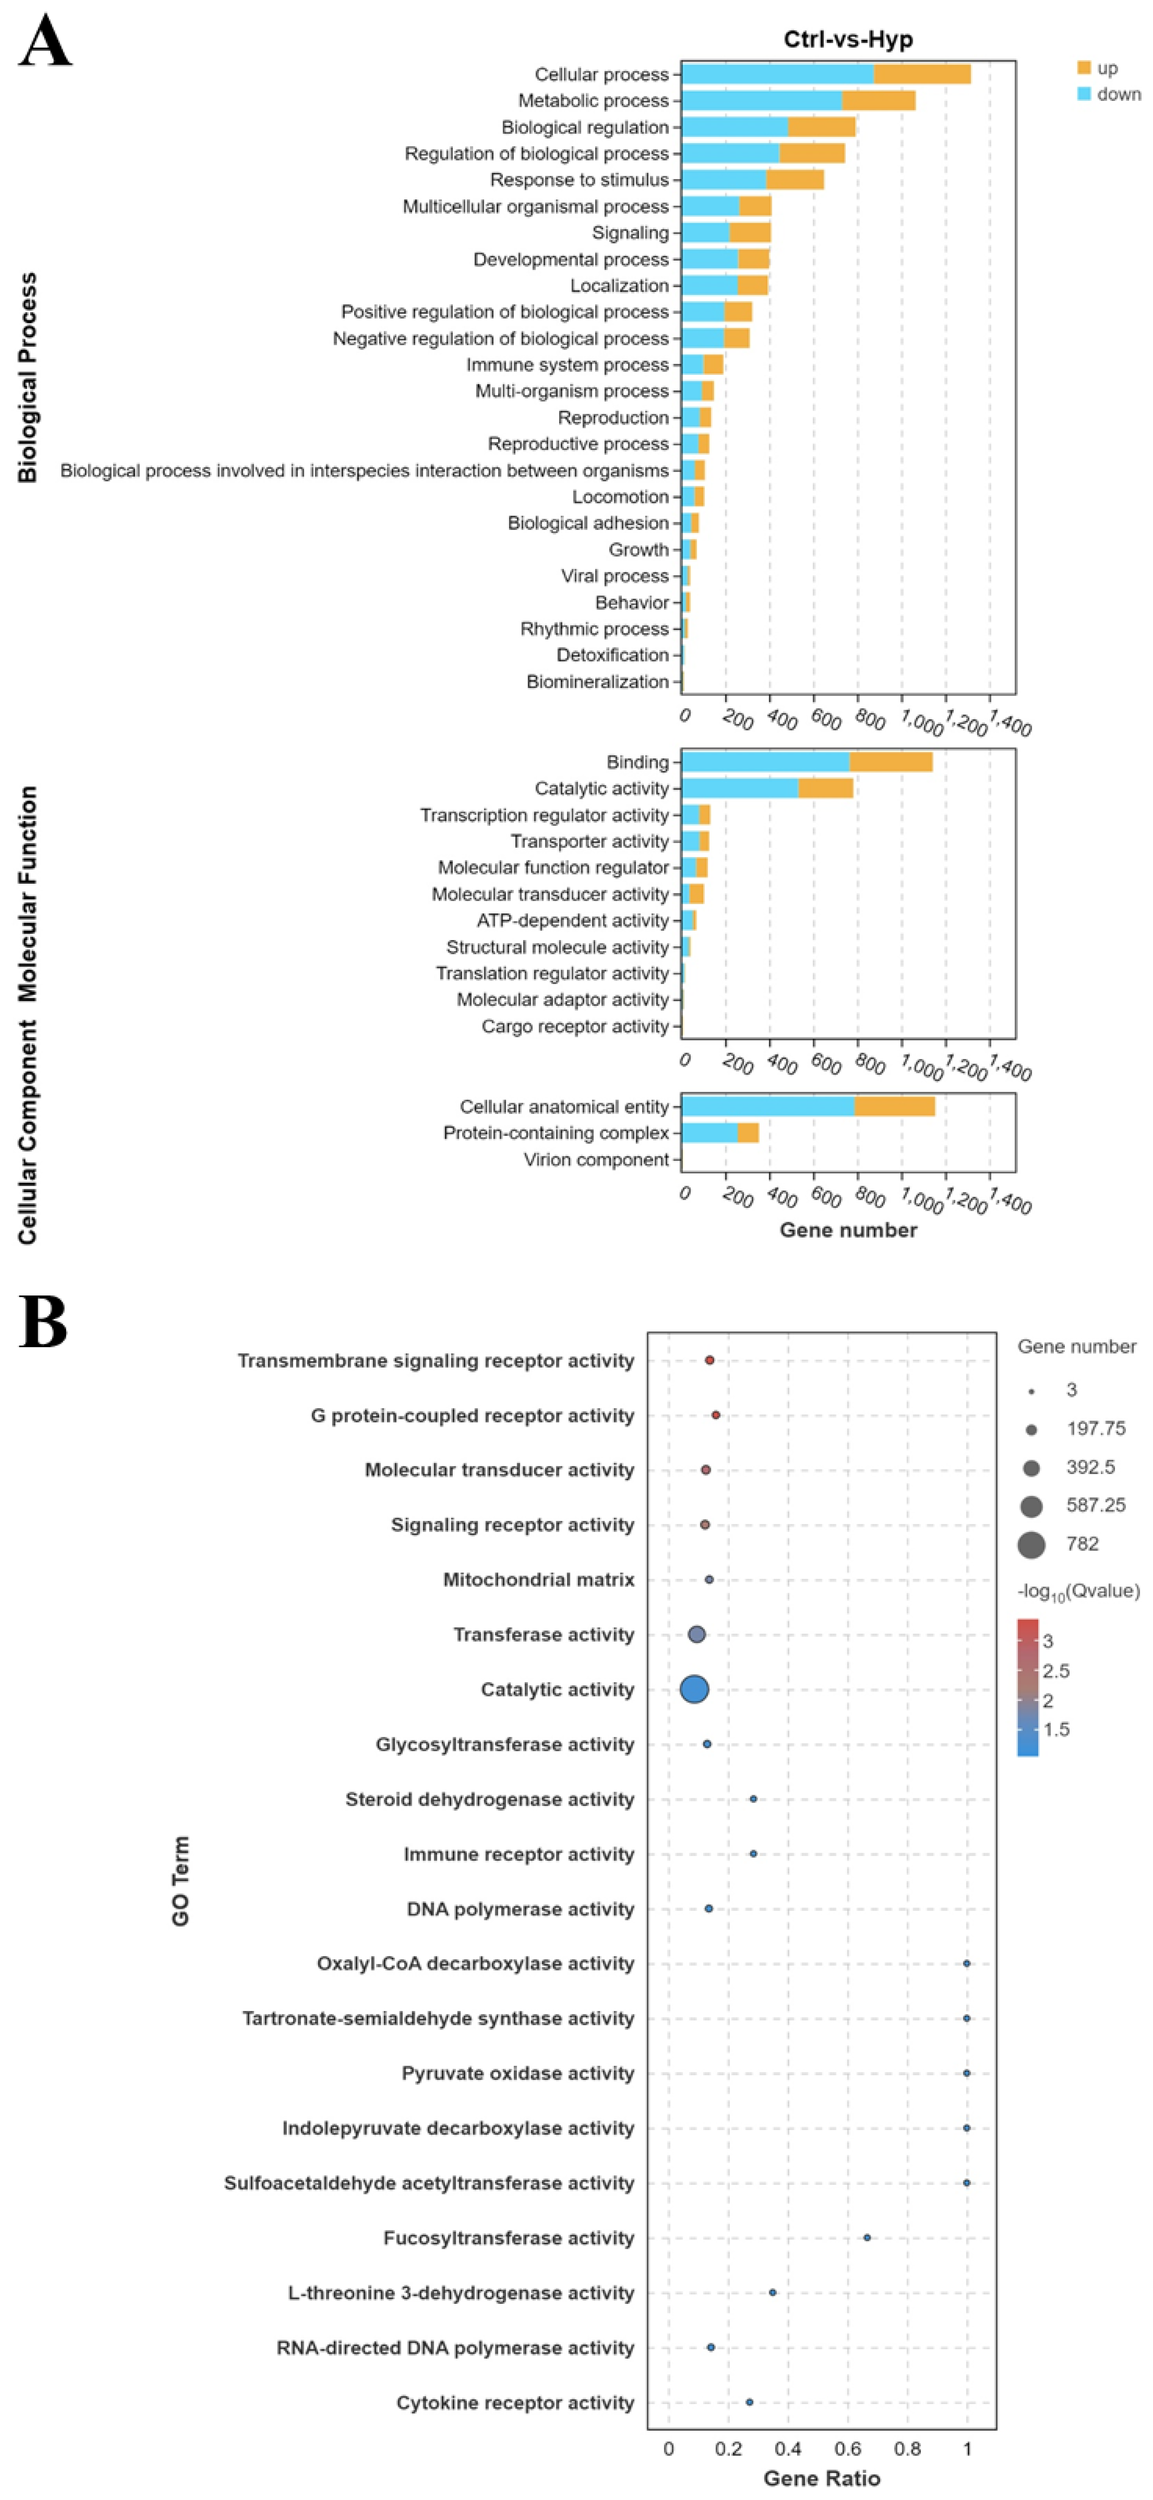
Gene ontology (GO) functional enrichment analysis of differentially expressed genes (DEGs). (A) GO pathway analysis of DEGs between the control group (Ctrl group) and the hypoxia group (Hyp group). (B) Top 20 enriched items of DEGs between the Ctrl and Hyp groups.
In the BP category, the top three terms were cellular process, metabolic process, and biological regulation. In the CC category, the top three terms were cellular anatomical entity, protein-containing complex, and virion component. In the MF category, binding, catalytic activity, and transcription regulator activity ranked as the top three terms. The top 20 enriched GO terms were primarily concentrated in the MF category. The top 3 GO terms, ranked by q-values, were transmembrane signaling receptor activity, G protein-coupled receptor activity, and molecular transducer activity (Figure 1B).
After acute hypoxia, KEGG pathway analysis revealed that multiple pathways were enriched, including six categories: metabolism, human diseases, organic systems, genetic information processing, cellular processes, and environmental information processing. Among them, the pathways related to metabolism, human diseases and organic systems were 12, 11 and 10 respectively. These were mainly associated with lipid and aa metabolism, infectious diseases, and immune regulation (Figure 2A).
Figure 2
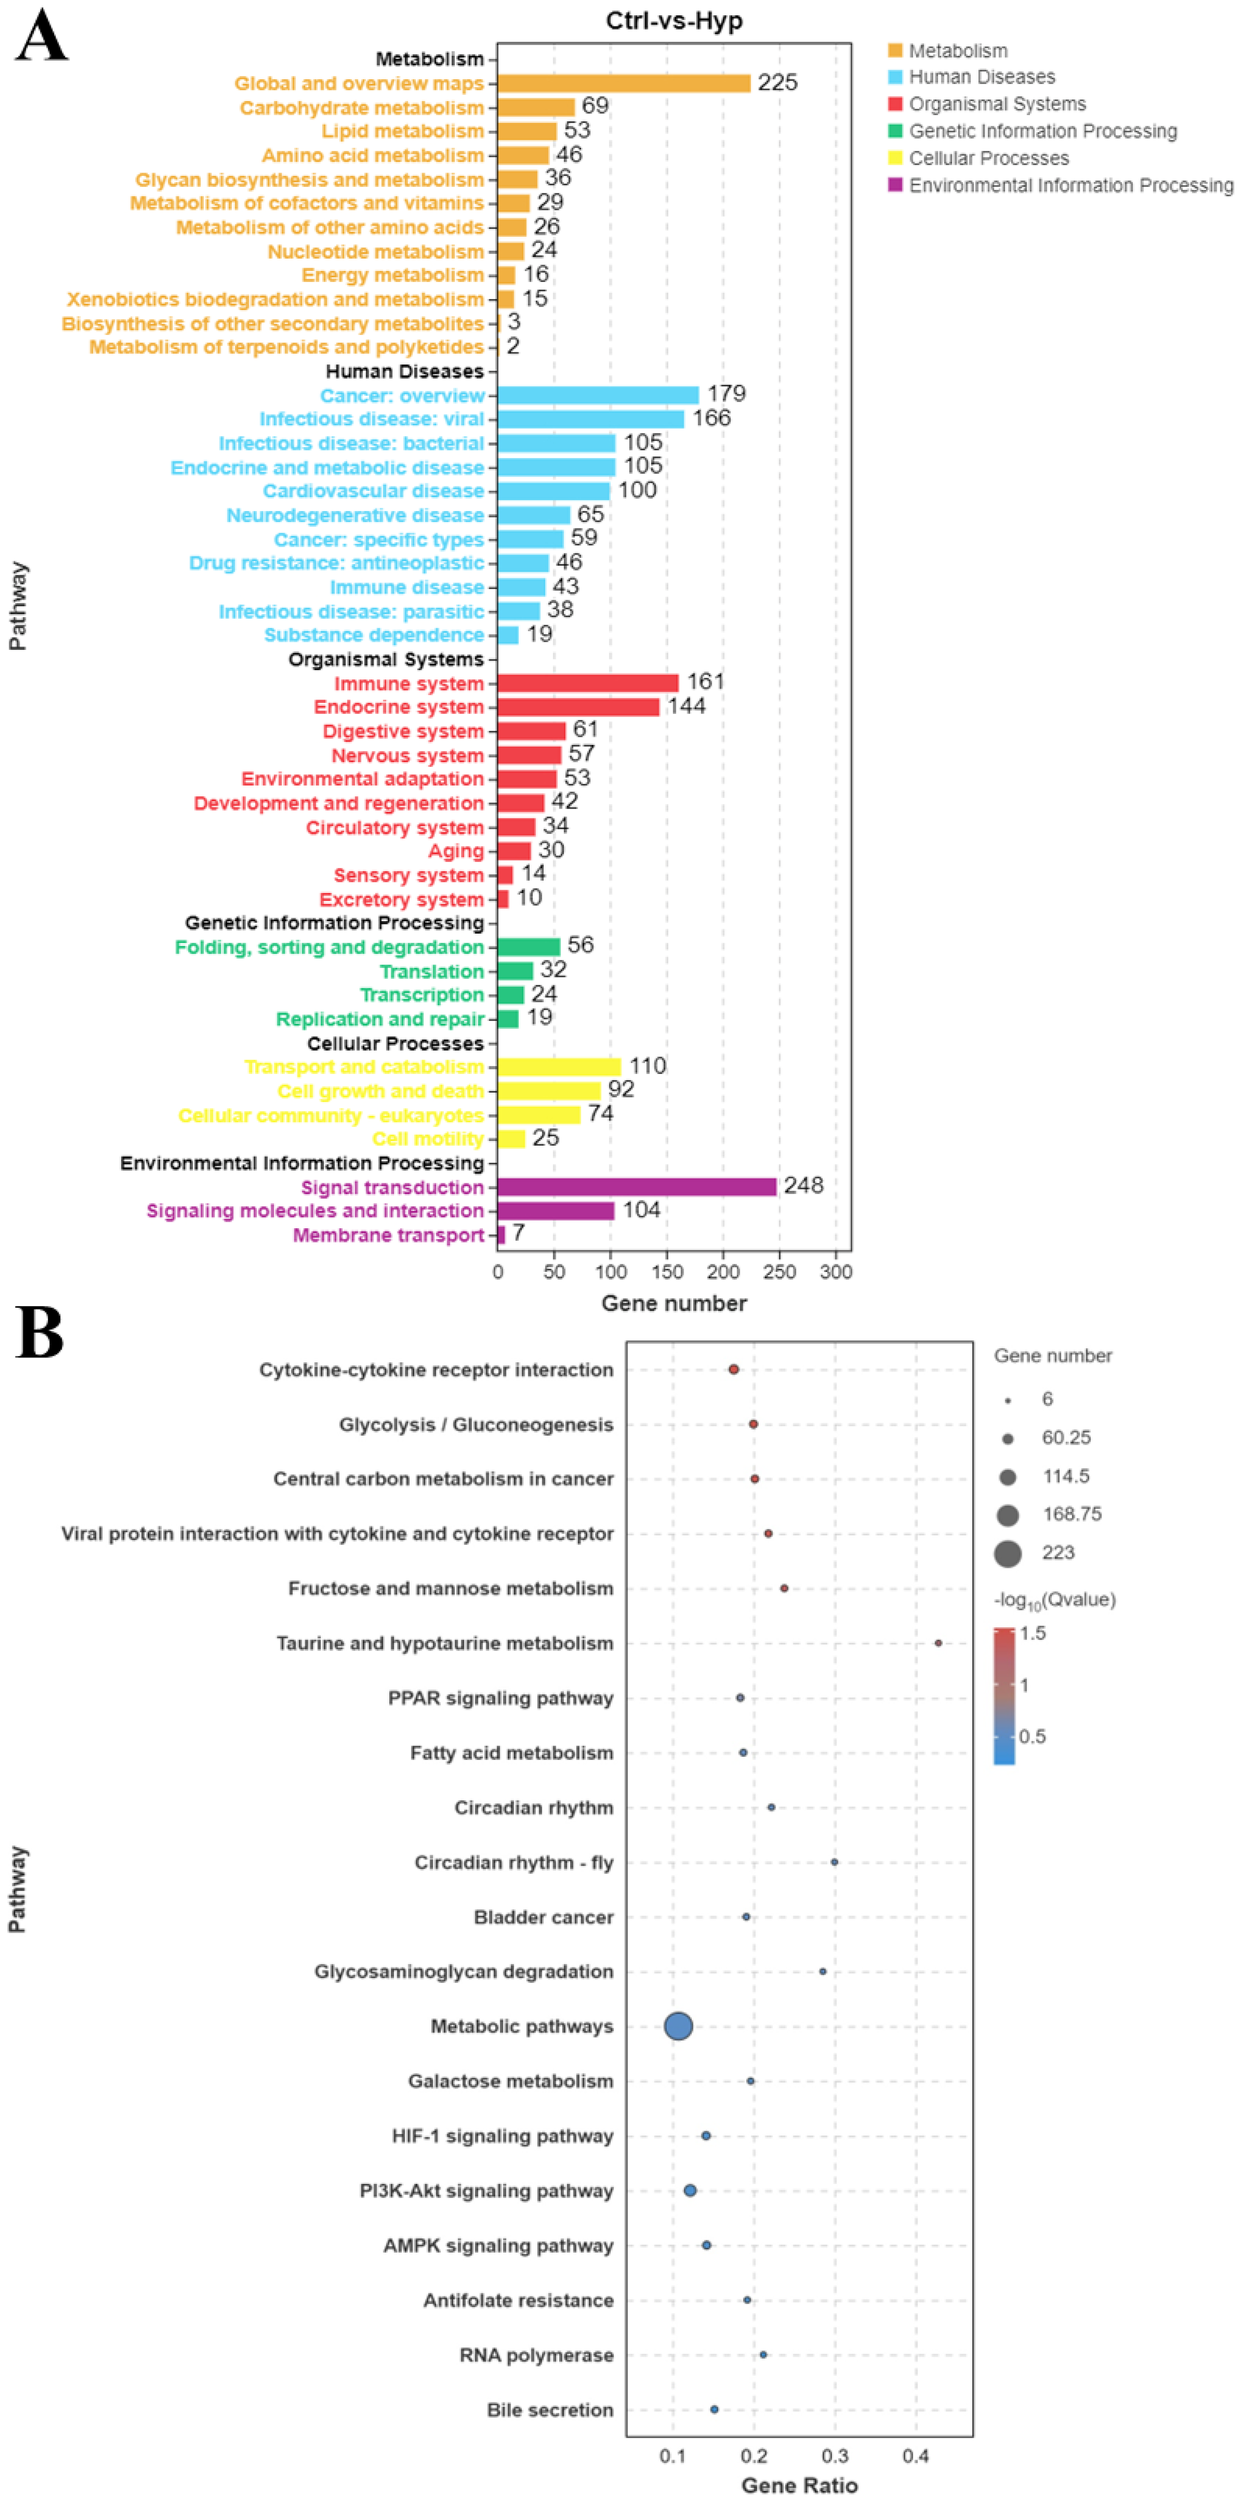
Kyoto encyclopedia of genes and genomes (KEGG) functional enrichment analysis of DEGs. (A) KEGG pathway enrichment analysis of DEGs between the Ctrl and Hyp groups. (B) Top 20 enriched pathways of DEGs between the Ctrl and Hyp groups.
To explore the biological pathways involved in hypoxic adaptation within HK tissues, the top 20 enriched KEGG pathways were analyzed. Key pathways related to hypoxia included cytokine-cytokine receptor interaction, PPAR signaling pathway, and fatty acid metabolism, HIF-1 signaling pathway, PI3K-Akt signaling pathway, and AMPK signaling pathway (Figure 2B).
3.3 Identification of DEGs in HIF-1 signaling pathway
In order to investigate the hypoxia adaptation mechanism of HIF-1 signaling pathway in grouper, the DEGs of HIF-1 signaling pathway enriched in the HK tissue were identified. After hypoxia, a total of 26 DEGs were enriched compared with the Ctrl group, and the transcription levels were shown in Supplementary Figure S3. There were 21 DEGs showed significant up-regulation and 5 DEGs showed significant down-regulation in the Hyp group.
DEGs with significantly up-regulated expression levels in the Hyp group included in glycolytic related genes (enolase 1 (ENO1), 6-phosphofructo-2-kinase/fructose-2,6-bisphosphatase 3 (PFKFB3), ATP-dependent 6-phosphofructokinase, liver type (PFKL), hexokinase-1 (HK1), LDHA, fructose-bisphosphate aldolase C-B (aldocb), ATP-dependent 6-phosphofructokinase, platelet type-like (PFKP), glyceraldehyde-3-phosphate dehydrogenase 2, cytosolic (GAPC)), and hypoxia responses (HIF1A, facilitated glucose transporter member 1 (SLC2A1), transferrin receptor 1b (TFRC)), cell proliferation and apoptosis (BCL2), and other unnamed genes. DEGs with markedly significantly down-regulated expression levels in the Hyp group included hexokinase HKDC1-like (Hkdc1), dual specificity mitogen-activated protein kinase kinase 2b (map2k2), eukaryotic translation initiation factor 4E family member 1c (EIF4E), cyclin-dependent kinase inhibitor 1 (CDKN1B), and other unnamed genes. These DEGs were mainly involved in human diseases, metabolism, organic systems, environmental information processing, and cellular processes.
3.4 qRT-PCR verification
To verify the accuracy of the RNA-seq data obtained, HIF-1α, TFRC, NFKBIA, HSP30, HSP70, IL21R, TLR9, ddit4, Egln1, CXCR1, CXCR2, CXCR4a, CXCR4b, CCR9a, CCR9b, ccnb1, ccnd1, egr1, CD274, and MRC1 were selected in Ctrl and Hyp groups for qRT-PCR validation (Figure 3). log2FC was used for correlation analysis. Meanwhile, qRT-PCR validation was performed for BCL2, mknk2, PIK3R1, vegfaa, SLC2A1, PFKP, HK1, LDHA, Hkdc1, map2k2, EIF4E, and CDKN1B in the HIF1 pathway (Figure 4). The qRT-PCR results confirmed the RNA-Seq data, showing consistent expression patterns.
Figure 3
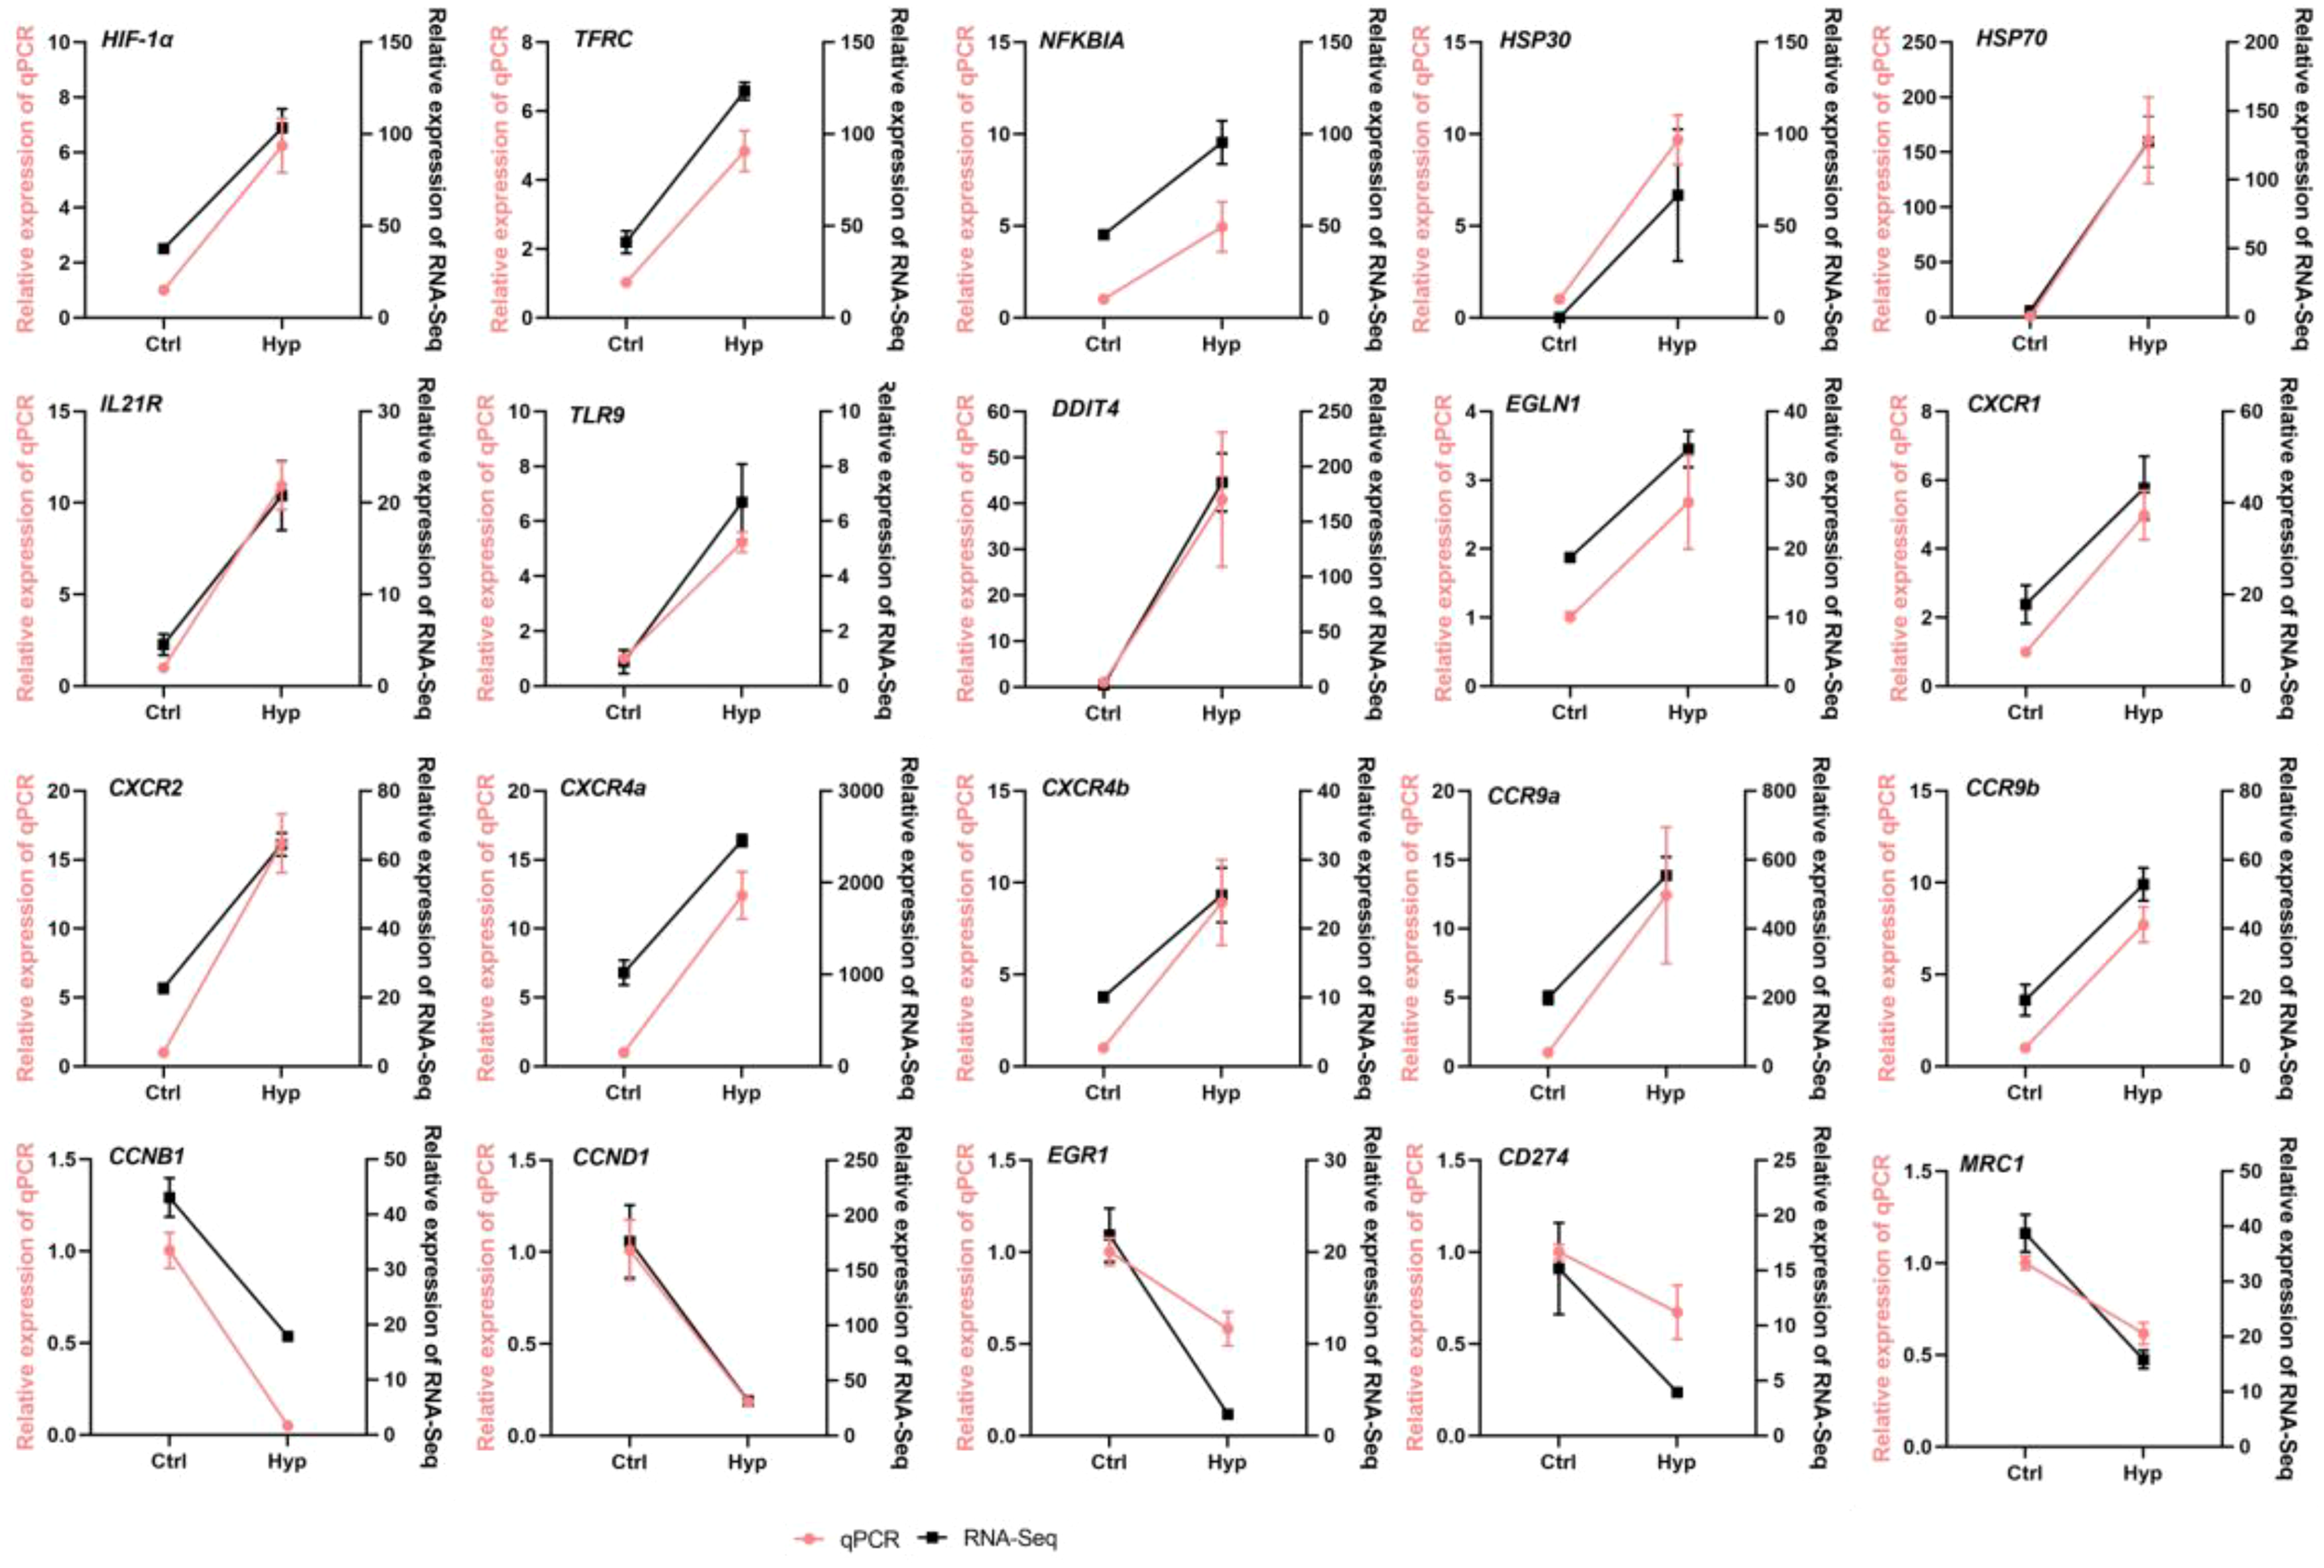
RT-qPCR detected the relative expression level of randomly selected DEGs.
Figure 4
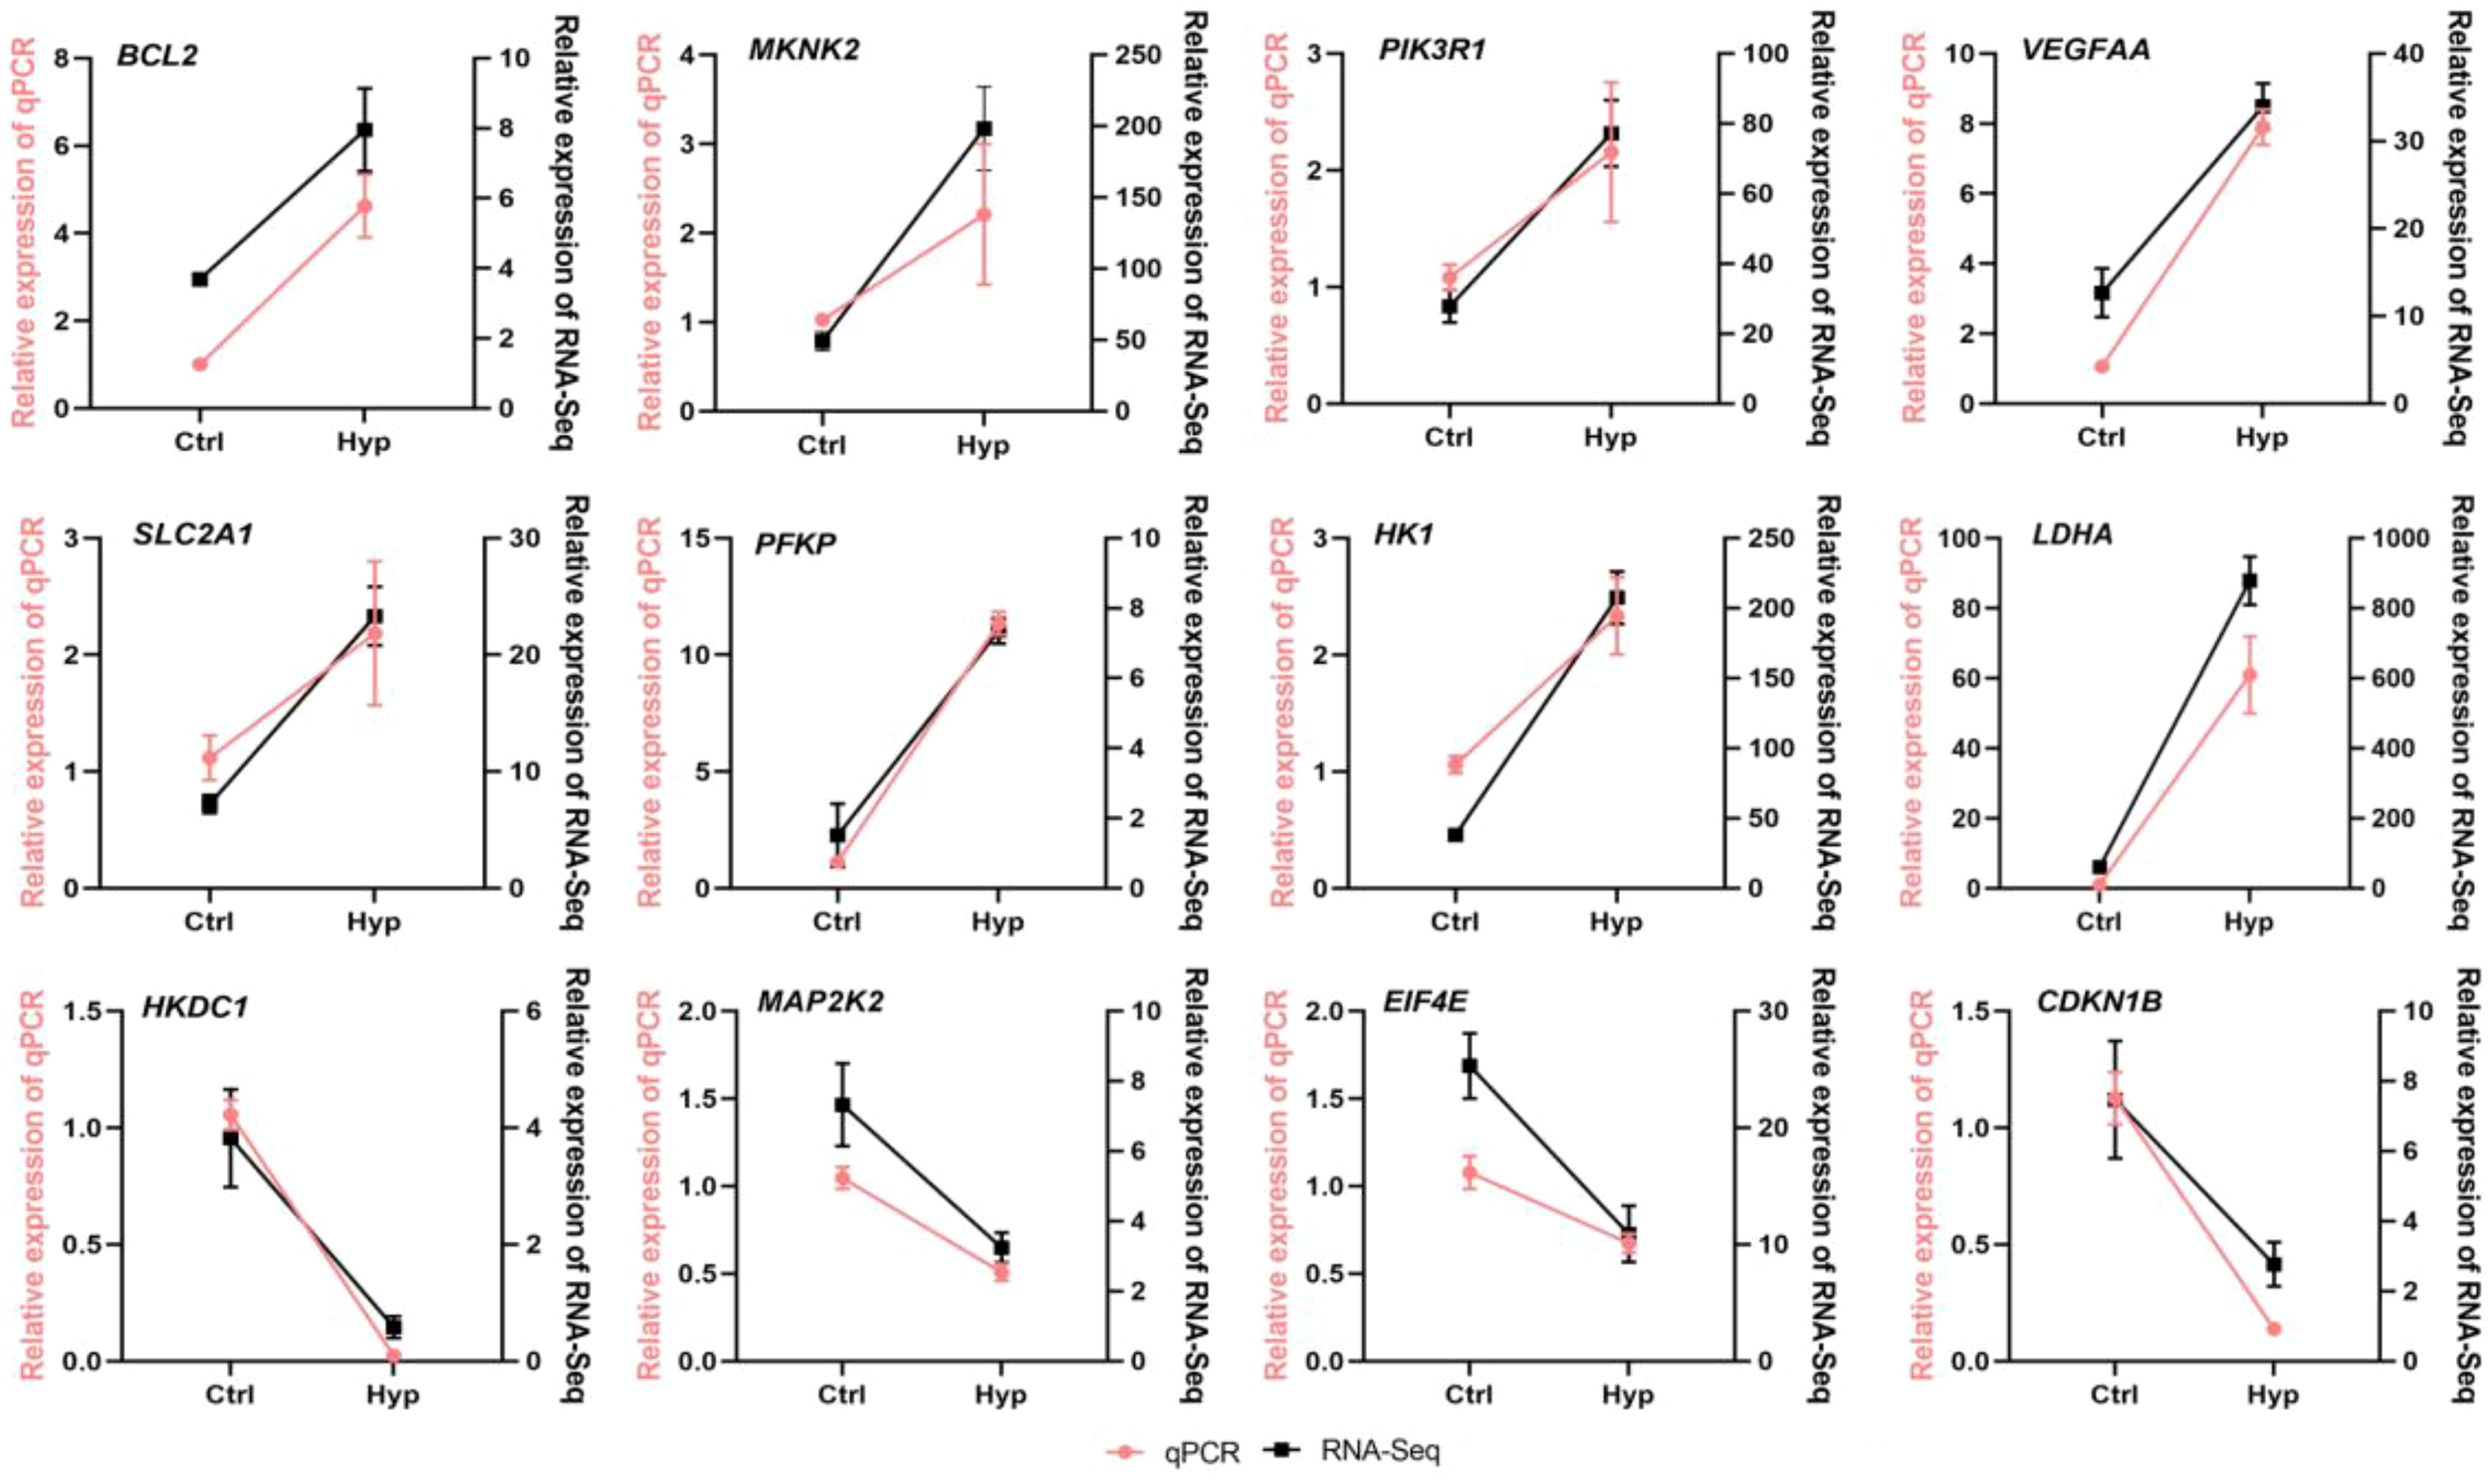
The relative expression level of DEGs in the randomly selected HIF-1α pathway was detected by RT-qPCR.
3.5 Molecular characterization of EcHIF-1α
To investigate the role of EcHIF-1α in E. cyanopodus under hypoxia stress, we cloned and identified HIF-1α. The EcHIF-1α gene, containing 2262 bp and encoding 753 aa, had a predicted MW of approximately 84.38 kDa and a PI of 5.11 (Figure 5A). The EcHIF-1α amino acid sequence contains key domains, including a HLH domain (residues 22–77), two PAS domains (residues 88–154 and 230–296), a PAC domain (residues 302–345), a HIF-1 domain (residues 551–582), and a HIF-1_CTAD domain (residues 716–752) via the SMART program (Figures 5A, B). The aa sequences of HIF-1α from speckled blue grouper and other species were compared. The results revealed that the gene has homology to other known and predicted HIF-1α (Supplementary Figure S5). Moreover, the EcHIF-1α shared high sequence identity with giant grouper-HIF-1α (98.01%), zebrafish-HIF-1α (62.16%), african clawed frog-HIF-1α (51.05%), mouse-HIF-1α (51.05%), and human-HIF-1α (52.85%). To analyze the evolutionary relationships of EcHIF-1α, a phylogenetic tree was constructed using the NJ method (Supplementary Figure S6). The tree demonstrated that EcHIF-1α is highly homologous to HIF-1α sequences from other fish species, with the closest relationship to that of the giant grouper (E. lanceolatus).
Figure 5
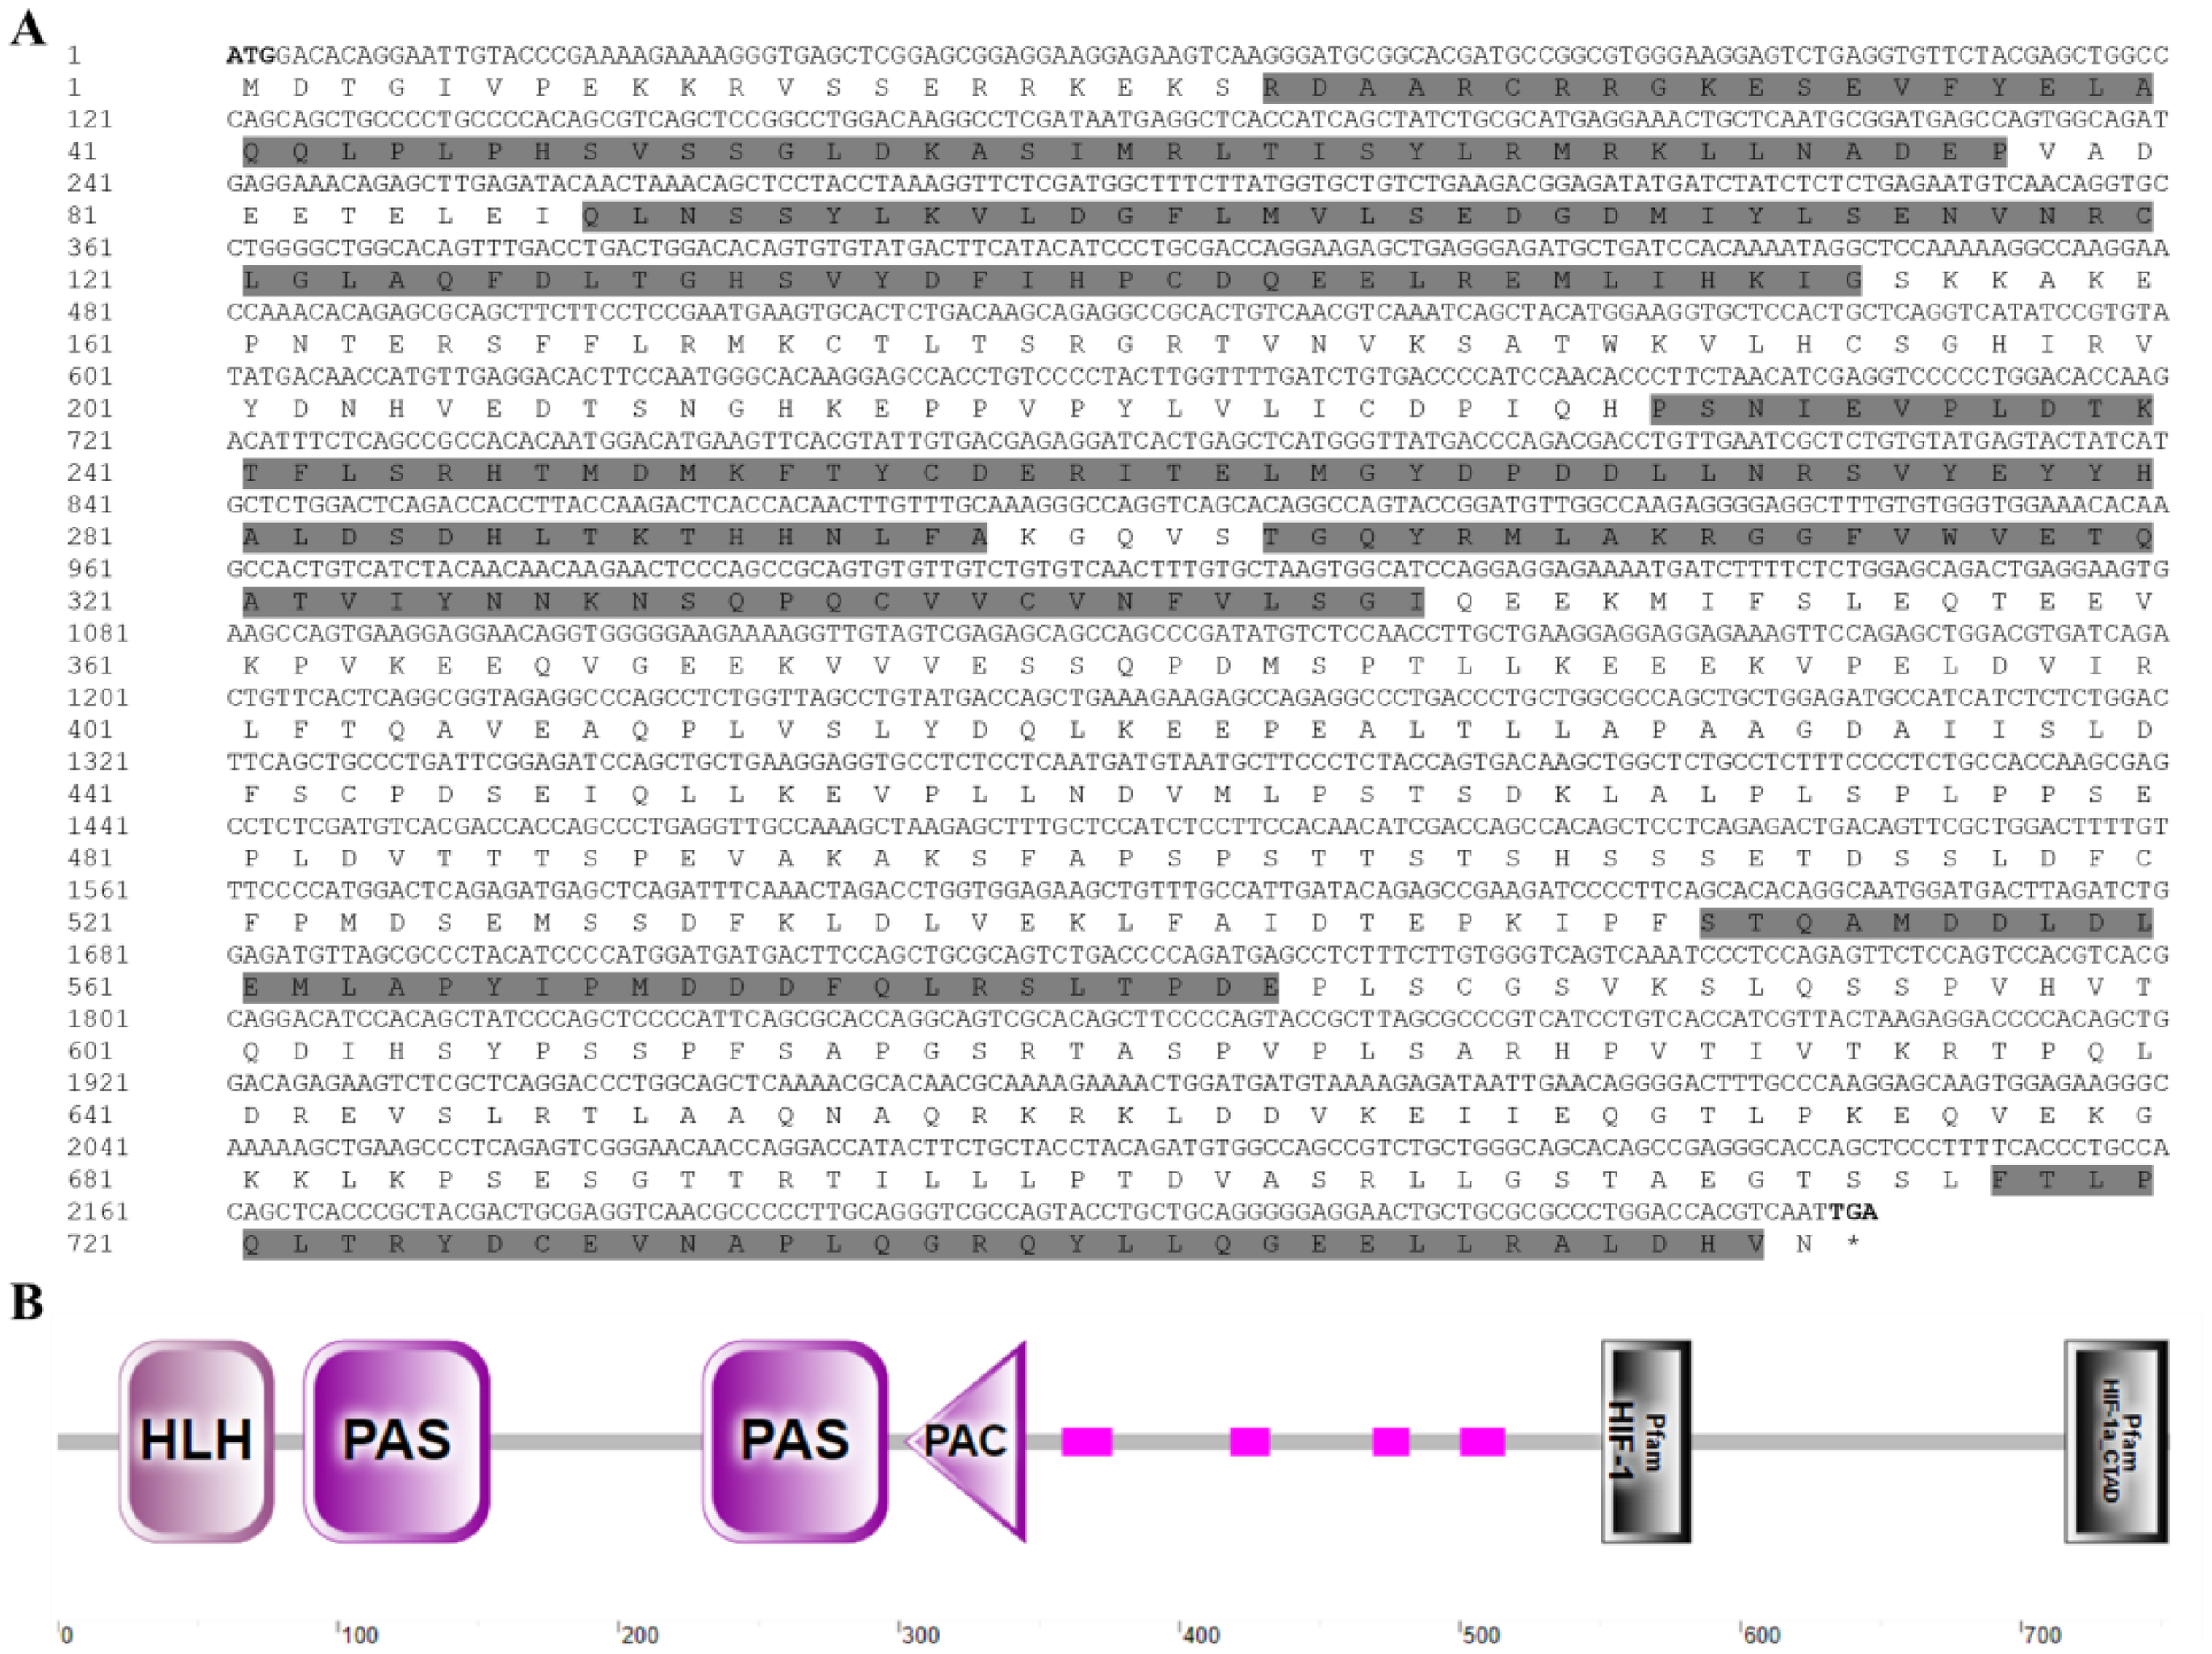
Nucleotide sequence and domain of EcHIF-1α. (A) The nucleotide sequence of EcHIF-1α and its corresponding amino acid sequence. In the derived amino acid sequences, the HLH domain, the two PAS domains, the PAC domain, the HIF-1, and the HIF-1a-CTAD domains are shown as gray background (number 22-77, 88-154, 230-296, 302-345, 551-582, and 716-752, respectively). (B) Domains of EcHIF-1α predicted by SMART. The number represents the amino acid residue of EcHIF-1α. The pink patterns indicate regions of low compositional complexity.
3.6 Constitutive distribution of EcHIF-1α mRNA in healthy tissues
qRT-PCR was utilized to assess the tissue-specific expression pattern of EcHIF-1α in healthy grouper. As depicted in Figure 6, EcHIF-1α was detected across all examined tissues. The highest expression of EcHIF-1α was observed in the HE, with subsequent notable expression in the TH, LI, PBL, and so on.
Figure 6
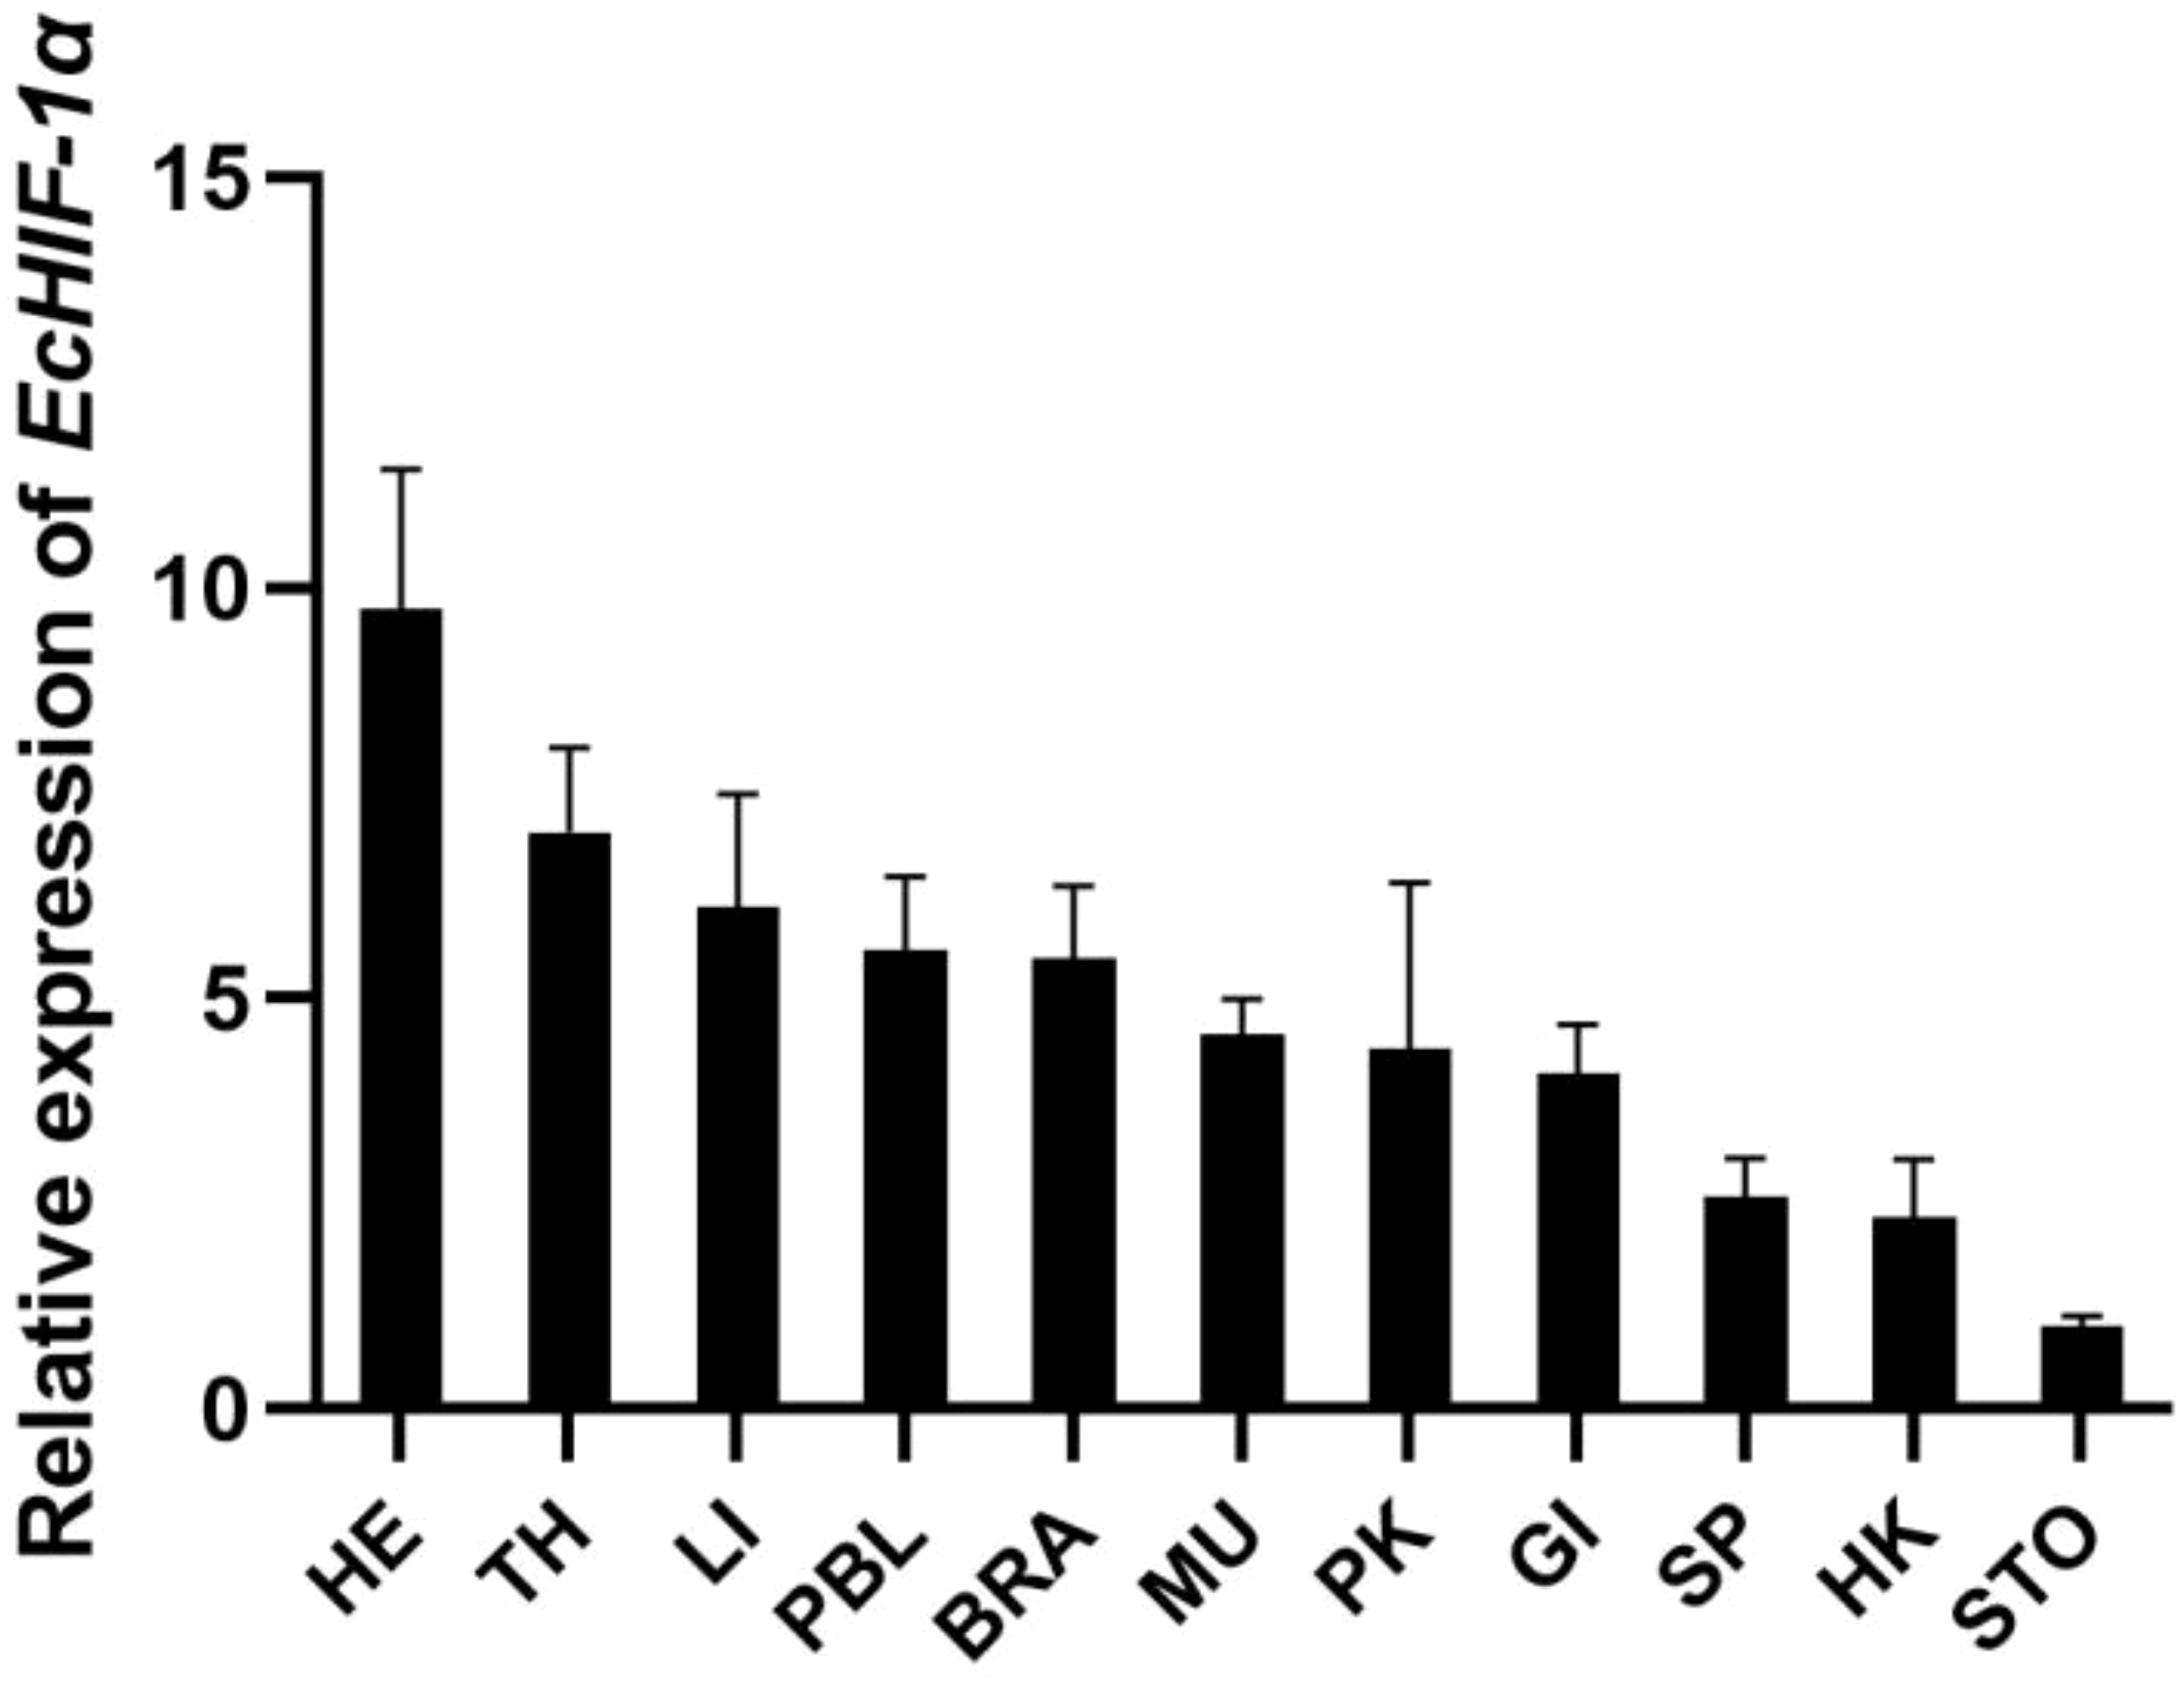
Tissue distribution of EcHIF-1α in healthy speckled blue grouper. Tissues include: PBL (peripheral blood), SP (spleen), MU (muscle), HK (head kidney), PK (posterior kidney), GI (gill), IN (intestine), LI (liver), SK (skin), TH (thymus), STO (stomach). The ratio denotes the gene expression across various tissues compared to muscle tissue, with normalization against β-actin. Results are shown as the mean ± standard deviation (SD) from three replicates.
3.7 Expression changes of EcHIF-1α after challenge under normal oxygen
To investigate how bacterial infection affects EcHIF-1α expression in HK and LI, qRT-PCR was employed to investigate alterations with the V. harveyi, Poly(I:C) and LPS. In head kidney, the EcHIF-1α was expressed from 3 h to 72 h and reached the highest fold change at 6 h (25.53-fold) when stimulated with LPS (Figure 7A). Upon Poly(I:C) infection, EcHIF-1α exhibited sustained and significant up-regulation, peaking at 6 h with a 21.17-fold increase (Figure 7B). After V. harveyi challenged, it also showed significant up-regulation, reaching a maximum 16.05-fold increase at 12 h (Figure 7C).
Figure 7
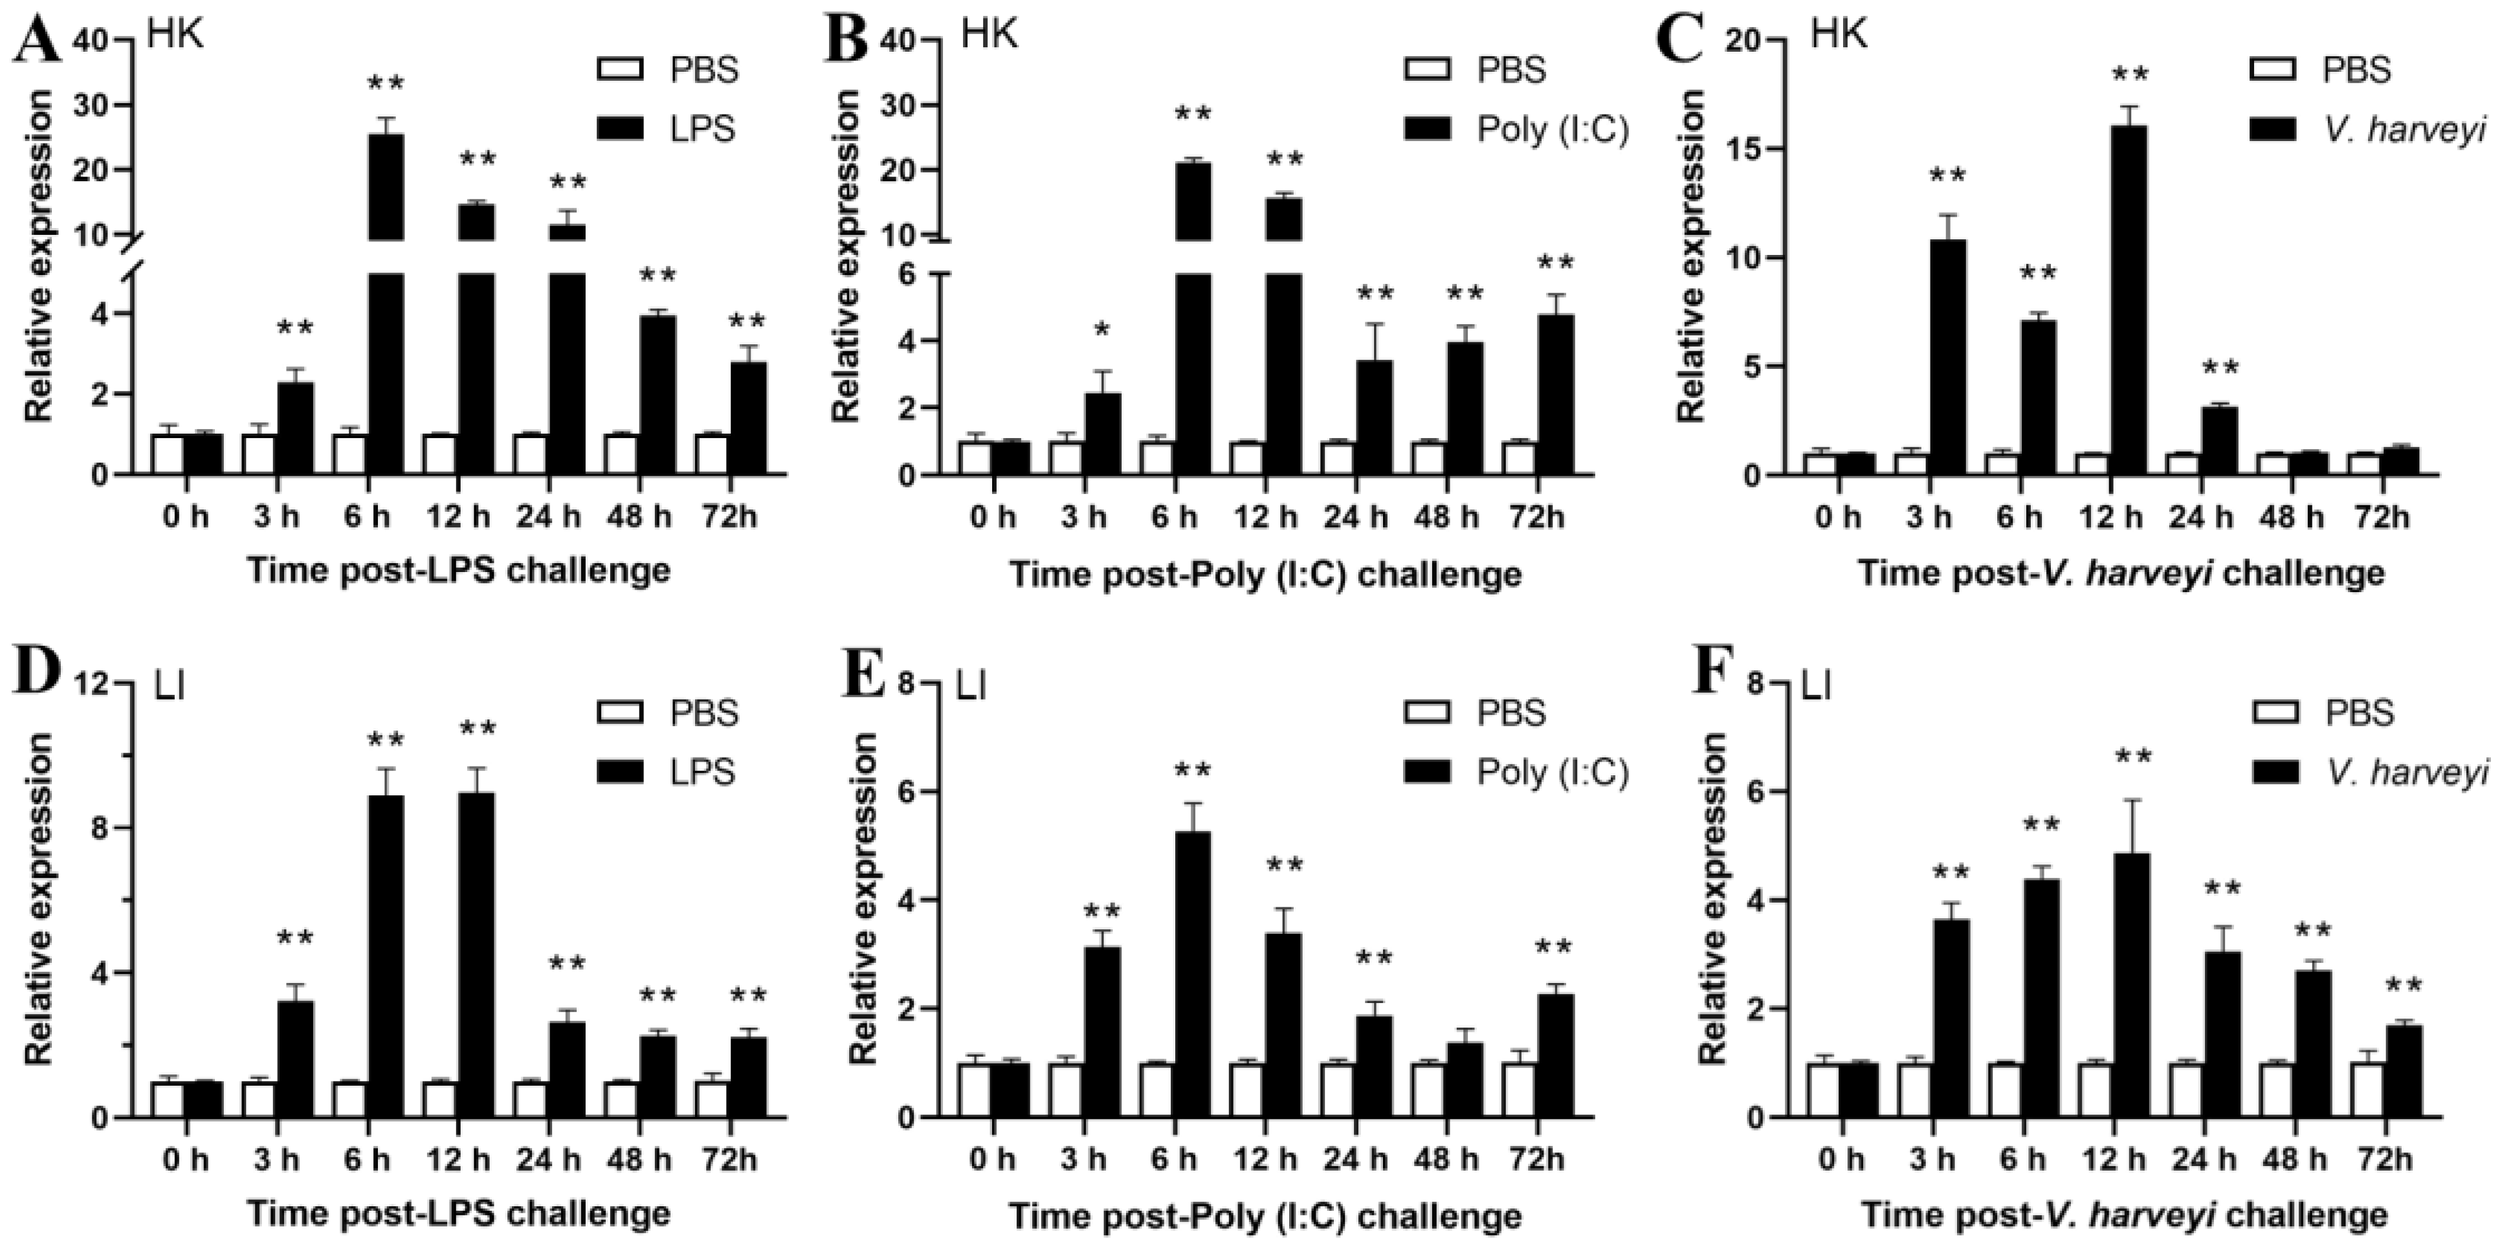
Temporal expression profile of EcHIF-1α mRNA in HK(A-C) and LI (D-F) after LPS, Poly (I:C) and V. harveyi stimulation in vivo. The mean value of the longitudinal bar graph is ± SD (n = 3), and * indicates a significant difference between the PBS group and the stimulated group. *p < 0.05, **p < 0.01.
In the liver, EcHIF-1α increased strongly after the challenge, although the increase was not as high as in HK. Challenged with LPS and V. harveyi, the EcHIF-1α expression was markedly up-regulated, peaking at 12 h with an 8.98-fold and 5.27-fold increase (Figures 7D, E), respectively. EcHIF-1α was prominently up-regulated after Poly (I:C) challenged and reached the peak at 6 h (Figure 7F).
3.8 Transcription profile of EcHIF-1α in response to immune stimulation after hypoxic reoxygenation
To further investigate the effects of hypoxia and pathogens on EcHIF-1α expression, we cultured healthy speckled blue grouper in a bucket with low-xygen conditions 0.5 ± 0.1 mg/L) for 6 h, and then transferred it to a bucket with normal oxygen for challenge. As shown in Figure 8, EcHIF-1α was in a differential pattern after treatment of different immune challenges.
Figure 8
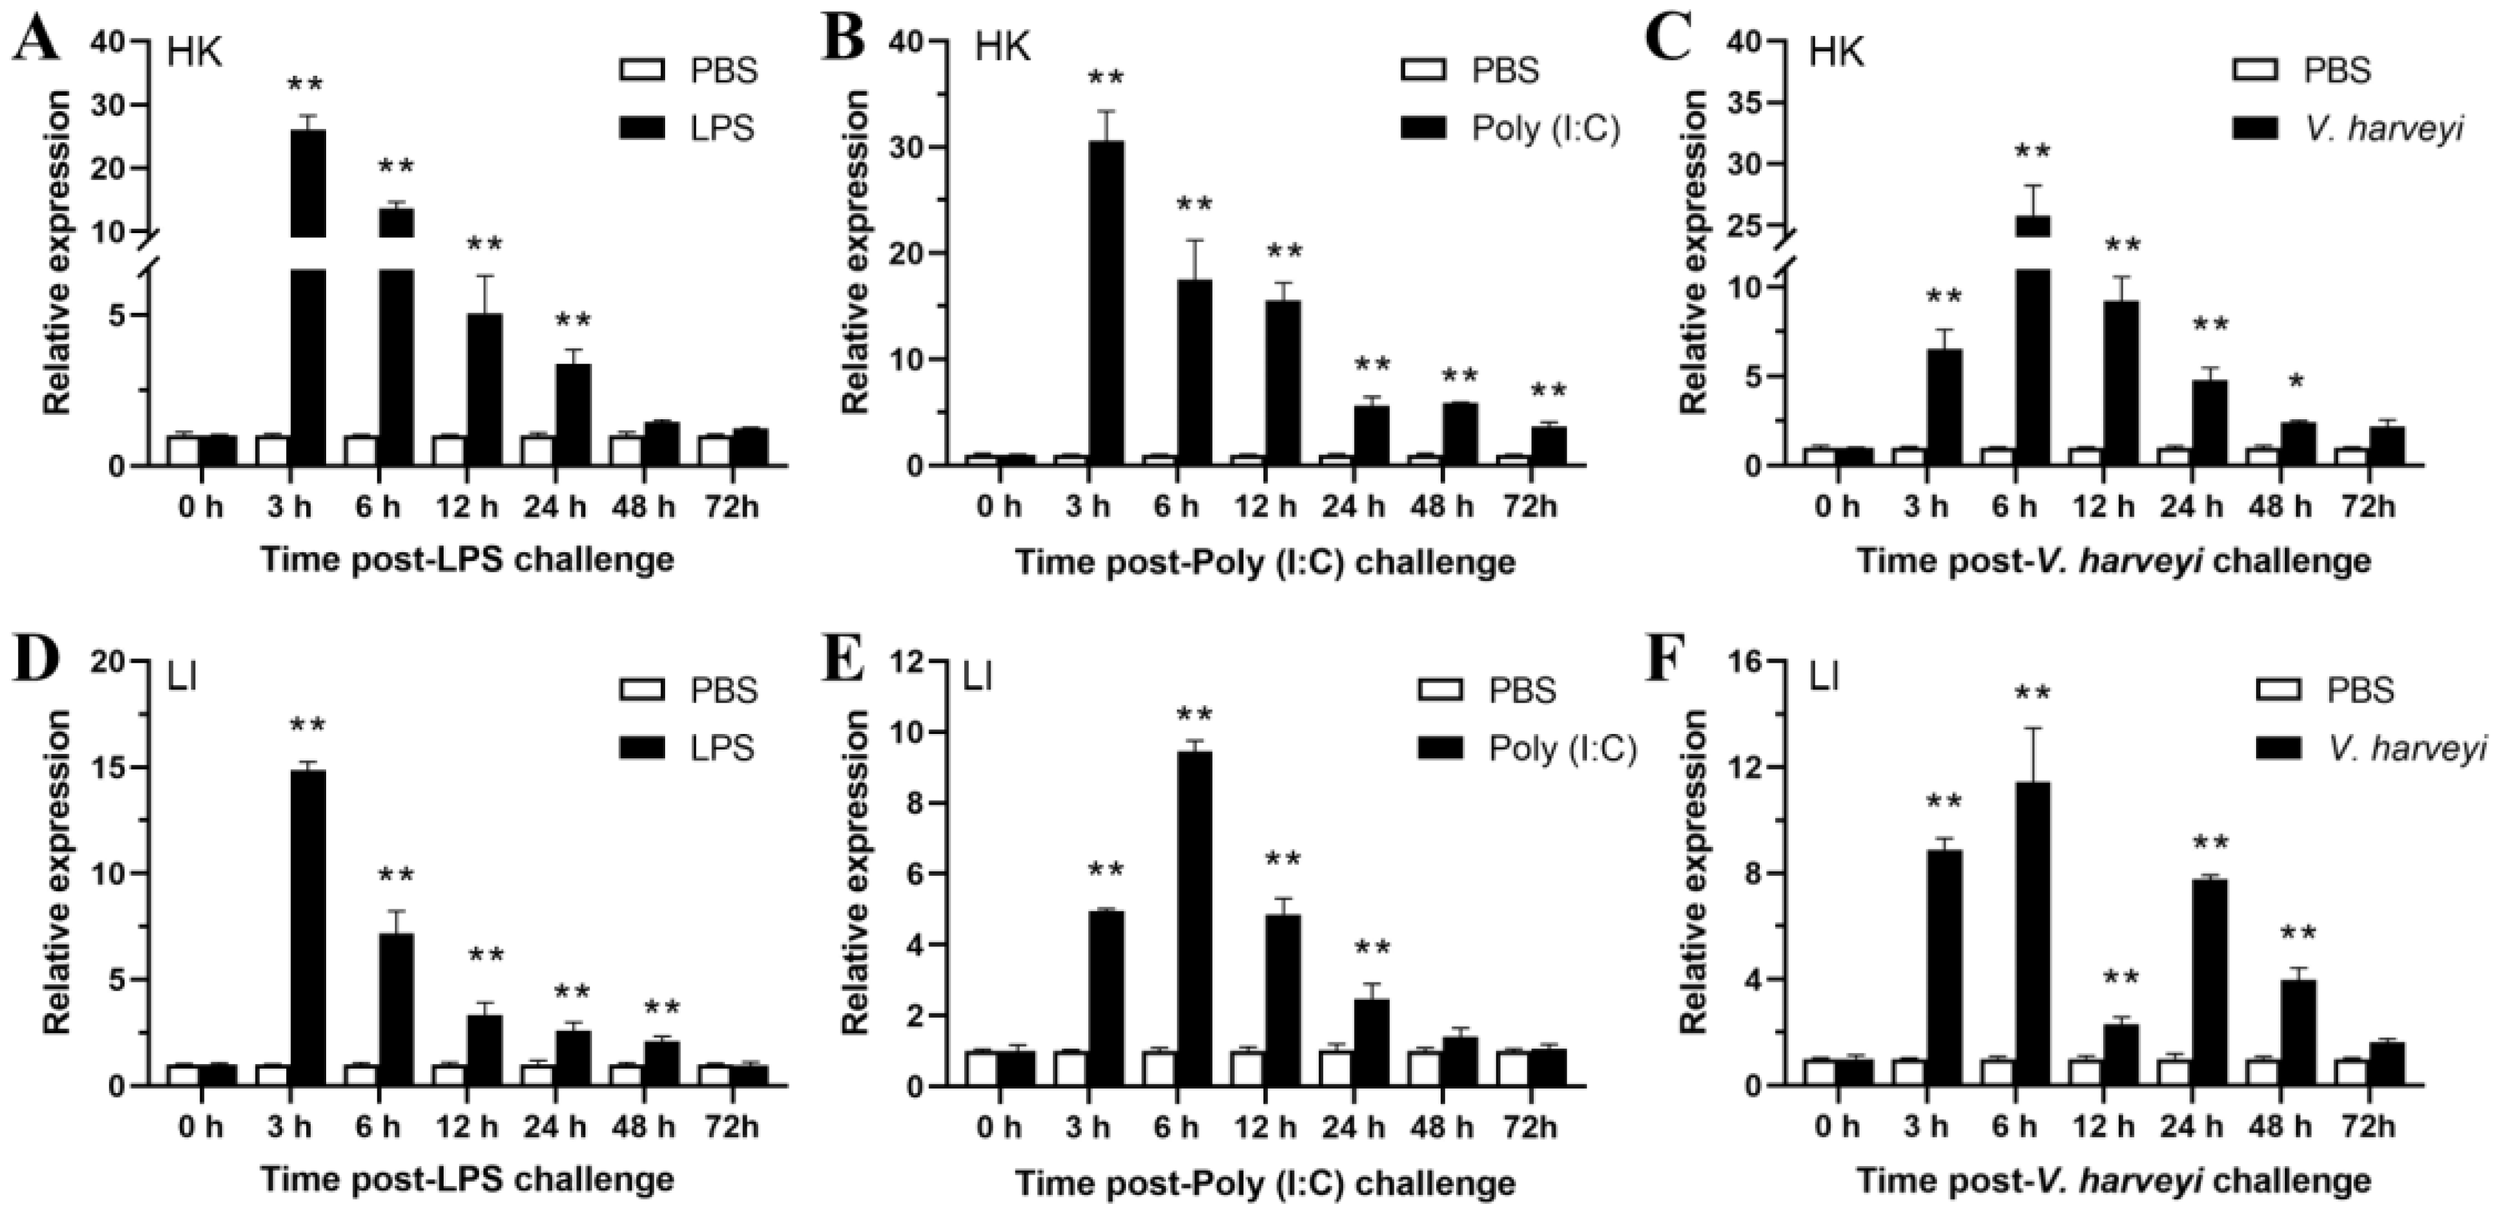
Expression changes of EcHIF-1α mRNA in HK (A-C) and LI (D-F) after 6 h of hypoxia treatment followed by intraperitoneal injection of LPS, Poly(I:C), and V. harveyi. The data represented means ± SD (n = 3), and * indicates a significant difference between the PBS group and the stimulated group. *p < 0.05, **p < 0.01.
In HK tissue, EcHIF-1α was prominently up-regulated at 3 h after LPS and Poly(I:C) stimulation (26.05-fold and 30.57-fold, respectively) (Figures 8A, B). Post stimulated with V. harveyi, EcHIF-1α was exhibited significant up-regulation, peaking at 6 h post-infection with a 25.77-fold increase (Figure 8C). In LI tissue, from 3 to 48 h after LPS infection, EcHIF-1α was significantly up-regulated and reached the peak at 3 h (14.86 -fold) (Figure 8D). The tendency of EcHIF-1α was similar to that after both Poly(I:C) and V. harveyi infections, EcHIF-1α exhibited significant up-regulation, reaching its peak at 6 hours p.i., which were 9.45-fold and 11.44-fold, respectively (Figures 8E, F).
4 Discussion
To simulate the acute hypoxia that speckled blue grouper may experience during intensive farming and live fish transport, we controlled the DO at 0.5 ± 0.1 mg/L. The method explains the molecular mechanism allowing the species to survive in hypoxic conditions. Reoxygenation was carried out after 6 h of hypoxia, and pathogenic bacteria were used to attack the virus at the same time, in order to explore the immune response of speckled blue grouper under the double stress of hypoxia and pathogenic bacteria. Using RNA-Seq, we analyzed gene expression differences in the head kidney, the immune organ of speckled blue grouper, identifying key genes and pathways linked to acute hypoxia and hypoxia response, with a focus on the HIF-1α gene. By examining the expression changes of HIF-1α gene under the dual stress of hypoxia and pathogenic bacteria, we proposed that hypoxia stress can activate the immune response of speckled blue grouper to pathogenic bacteria in advance. This study provides new insights into the adaptation of teleost to the dual stressors of hypoxia and pathogenic bacteria.
We screened 2,887 DEGs related to hypoxia response in speckled blue grouper by RNA-Seq analysis, and enrichment analysis using the GO (Figure 1) and KEGG (Figure 2) showed that these DEGs participated in a wide range of BP. Including immune response, inflammatory response, apoptosis and energy metabolism. In this process, the activation of cytokine-cytokine receptor interaction, PPAR signaling pathway, fatty acid metabolism, HIF-1, PI3K-Akt, and AMPK signaling pathway was involved, thereby maintaining the normal physiological activities of speckled blue grouper under hypoxia. When fish are subjected to hypoxia stress, their aerobic metabolism is inhibited, and anaerobic metabolism is the main energy supply mode (Polymeropoulos et al., 2017). LDH is a hallmark enzyme of anaerobic metabolism, catalyzing the conversion of pyruvate to lactic acid. To some extent, its activity mirrors the intensity of the body’s anaerobic metabolic processes. LDH is encoded by LDHA. Our results indicate that hypoxia notably elevates LDHA gene expression (Figure 4). This result is consistent with the increase of LDH activity with the extension of hypoxia stress time in pearl gentian grouper (Liang et al., 2024).
Our analysis revealed that the expression of glucose metabolism-related genes (PFKP, ALDOCB, and ENO1) was dramatically increased after hypoxia in speckled blue grouper. PFKP and ALDOCB function early in glycolysis, while ENO1 acts later in the process. PFKP and ALDOCB play roles in the early stages of glycolysis, and ENO 1 plays a role in the late stages of glycolysis. The PFKP gene produces phosphofructokinase (PFK), which serves as the second rate-limiting enzyme in the glycolysis process. PFK facilitates the conversion of fructose-6-phosphate to fructose-1,6-bisphosphate (F-1,6-BP). The ALDOCB gene codes for aldolase C fructose diphosphate (ALDOC) and is involved in the glycolytic pathway. In pearl gentian grouper and Litopenaeus vannamei, hypoxia induced the expression of PFK and promoted glycolysis and ATP production (Cota-Ruiz et al., 2015; Liang et al., 2024). Hypoxia induced ALDOA expression plays an important role in the glycolytic pathway in pearl gentian grouper and Apostichopus japonicus (Huo et al., 2017). Unlike in pearl gentian grouper, ENO1 expression was significantly increased. ENO1 encodes enolase (ENO), which participates in the conversion of 2-phosphoglyceric acid to phosphoenolpyruvate (PEP) during glycolysis and regulates apoptosis as a plasminogen (PLG) receptor (Wang et al., 2021). Thus, we speculate that the up-regulated expression of PFKP, ALDOCB, and ENO 1 accelerates the rate of glycolysis, provides energy requirements under hypoxic conditions, and participates in apoptosis. In addition, the HK-1, PFKL, and PKM related genes involved in glucose metabolism significantly increased after acute hypoxia, which is consistent with studies in yellow catfish (Wang et al., 2021). Overall, PFKP, ALDOCB, ENO1, LDHA, HK-1, PFKL, and PKM regulate glucose metabolism, enabling glucose transport and anaerobic glycolysis. This process supplies energy to help maintain homeostasis during acute hypoxia in grouper.
Notably, HIF-1α was significantly enriched not only in the HIF-1 signaling pathway but also in the “immune system” after hypoxia (Supplementary Figures S3, S4), further confirming its central role in hypoxia adaptation. The HIF-1 signaling pathway has been confirmed to play a crucial role in adapting to hypoxia in various teleost, such as cobia (Huang et al., 2021), juvenile yellow catfish (Wang et al., 2021), and largemouth bass (Sun et al., 2019). In hypoxia, HIF-1α activates genes related to oxygen transport, red cell production, angiogenesis, energy metabolism, cell cycle, and immune responses (Mu et al., 2020; Xiao, 2015). Thus, we speculated that under acute hypoxia, the speckled blue grouper largely sustains oxygen equilibrium via HIF-1’s direct or indirect manipulation of downstream genes connected with immune reactions and energy metabolism. To further investigate the role of HIF-1α in hypoxia, we carried out the cloning and identification of EcHIF-1α in speckled blue grouper (Figure 5). EcHIF-1α has typical domains, including: HLH domain, two PAS domains, a PAC domain, a HIF-1 domain, and a HIF-1_CTAD domain. Multiple sequence alignment of EcHIF-1α showed that the conserved domain of EcHIF-1α had a high similarity to that of other teleost (Supplementary Figure S3), suggesting that they may have similar functions. Homology comparisons of HIF-1α sequences of multiple species were conducted. It was found that all teleost were clustered together, and speckled blue grouper was in the same sister clade as Epinephelus lanceolatus (Supplementary Figure S4).
HIF-1α was examined in 11 different tissues with varying expression levels (Figure 6), as reported in Ctenopharyngodon idellus (Law et al., 2006), Siniperca chuatsi (He et al., 2019), Dicentrarchus labrax (Terova et al., 2008), Boleophthalmus pectinirostris (Lee et al., 2017), Ictalurus punctatus (Geng et al., 2014), Clarias batrachus (Mohindra et al., 2013), Megalobrama amblycephala (Shen et al., 2010), Oncorhynchus mykiss (Soitamo et al., 2001). The expression of EcHIF-1α was highest in heart, which is dominant in blood pumping, suggesting that the HIF system has tissue-specific priority (Heidbreder et al., 2003).
Head kidney and liver play crucial roles in immune functions within teleost fish. Understanding the immune response of EcHIF-1α in the immune organs of spotted seabass following external stimuli is crucial for devising effective disease management strategies. Consequently, we analyzed the EcHIF-1α mRNA in the HK and LI of speckled blue grouper after in vivo stimulation with LPS, Poly (I:C) and V. harveyi (Figure 7). Poly (I:C) is a synthetic double-stranded RNA that can not only activate viral recognition receptors but also induce the occurrence of inflammation (Alexopoulou et al., 2001). Lipopolysaccharide is the primary constituent of Gram-negative bacteria’s cellular wall. It activates the TLR signaling pathway, which in turn promotes the release of various inflammatory factors (Gao et al., 2020). V. harveyi, a Gram-negative bacterium found in nature, infects a variety of fish, especially grouper (Lai et al., 2023). Upon exposure to LPS, Poly (I:C), and V. harveyi challenges, there was a marked up-regulation of EcHIF-1α expression observed both in the HK and LI (Figure 7). The up-regulation of EcHIF-1α in the HK was much higher than that in the liver. This might be there were more types of immune cells in the head kidney that can exert a rapid immune response. In mammals, the up-regulated expression of HIF-1α transcripts can be detected in response to bacterial, viral, or parasitic infections (Zinkernagel et al., 2007). Studies in teleost have found that infection of mudskipper with Edwardsiella tarda, a Gram-negative bacterium similar to V. harveyi, increases the transcript of HIF-1α (Lee et al., 2017). Consistent results have been observed in large yellow croakers (Larimichthys crocea), where infection with Vibrio harveyi significantly increases the expression of HIF-1α (Mu et al., 2020). Furthermore, Aeromonas hydrophila, a Gram-positive bacterium, also induced increased HIF-1α expression in large yellow croaker (Zhang et al., 2022). These results indicate that EcHIF-1α plays a key role in inducing responses to antiviral and microbial pathogens.
To better explore how EcHIF-1α responds under dual stress conditions of low oxygen and bacterial pathogens, we exposed healthy speckled blue grouper to hypoxic conditions for 6 h, followed by stimulation using LPS, Poly (I:C), and V. harveyi (Figure 8). Interestingly, we found that after LPS, Poly(I:C) and V. harveyi stimulation, the expression of EcHIF-1α was significantly up-regulated in the HK and LI, and the response time was earlier than that under normal oxygen stimulation. These results suggest that hypoxia can pre-activate the immune response of fish, indirectly confirming the hypothesis proposed in large yellow croaker that hypoxic-tolerant individuals have a higher survival rate after infection (Zhang et al., 2022).
5 Conclusion
In summary, through RNA-Seq, we studied DEGs in the HK of speckled blue grouper under acute hypoxia. The DEGs were primarily associated with functions such as transmembrane signaling receptor activity, G-protein coupled receptor activity, and molecular transducer activity. The DEGs were involved in multiple signaling pathways, including HIF-1, PI3K-Akt, and AMPK, and participated in immune responses, inflammatory responses, apoptosis regulation, energy metabolism, and material metabolism. Notably, our results first demonstrated that hypoxia stress can pre-activate the immune response of teleost to pathogenic bacteria. This study not only provides new insights into the adaptation mechanisms of teleost under dual stressors of hypoxia and pathogenic bacteria, but also provides a foundation for the molecular breeding of grouper varieties with enhanced hypoxia tolerance.
Statements
Data availability statement
The datasets presented in this study can be found in online repositories. The names of the repository/repositories and accession number(s) can be found in the article/Supplementary Material.
Ethics statement
The animal study was approved by the Experimental Animal Ethics Committee of Guangzhou University, China. The study was conducted in accordance with the local legislation and institutional requirements.
Author contributions
AG: Project administration, Writing – original draft, Data curation, Validation, Writing – review & editing. QC: Validation, Methodology, Investigation, Writing – original draft. YH: Writing – original draft, Formal Analysis, Data curation, Investigation. ZY: Writing – review & editing, Validation, Formal Analysis. WH: Visualization, Writing – review & editing. JW: Writing – original draft, Visualization, Formal Analysis. JH: Formal Analysis, Writing – original draft, Investigation. TC: Writing – original draft, Investigation. HS: Funding acquisition, Writing – review & editing, Supervision.
Funding
The author(s) declare financial support was received for the research and/or publication of this article. The project was supported by grants from China Postdoctoral Science Foundation (2025M772603), Research on breeding technology of candidate species for Guangdong modern marine ranching (2024-MRB-00-001), Science and Technology Program of Guangdong Province (2019B030316022), Guangdong financial Budget 2023 No.6, and China-ASEAN Fisheries Resources Conservation and Exploitation (CAMC-2018F). The Natural Science Foundation of China (No. 42177262), 2023 National Undergraduate Innovation and Entrepreneurship Training Program (202311078043) and the “2 + 5” platform funding support from Guangzhou University.
Conflict of interest
Author TC was employed by company Shenzhen Haiyuan Aquacture Technology CO., Ltd.
The remaining authors declare that the research was conducted in the absence of any commercial or financial relationships that could be construed as a potential conflict of interest.
Generative AI statement
The author(s) declare that no Generative AI was used in the creation of this manuscript.
Any alternative text (alt text) provided alongside figures in this article has been generated by Frontiers with the support of artificial intelligence and reasonable efforts have been made to ensure accuracy, including review by the authors wherever possible. If you identify any issues, please contact us.
Publisher’s note
All claims expressed in this article are solely those of the authors and do not necessarily represent those of their affiliated organizations, or those of the publisher, the editors and the reviewers. Any product that may be evaluated in this article, or claim that may be made by its manufacturer, is not guaranteed or endorsed by the publisher.
Supplementary material
The Supplementary Material for this article can be found online at: https://www.frontiersin.org/articles/10.3389/fmars.2025.1662359/full#supplementary-material
References
1
Alexopoulou L. Holt A. C. Medzhitov R. Flavell R. A. (2001). Recognition of double-stranded RNA and activation of NF-kappaB by Toll-like receptor 3. Nature413, 732–738. doi: 10.1038/35099560
2
Breitburg D. Levin L. A. (2018). Declining oxygen in the global ocean and coastal waters. Science359. doi: 10.1126/science.aam7240
3
Cao X. Zhang J. Deng S. Ding S. (2022). Chromosome-level genome assembly of the speckled blue grouper (Epinephelus cyanopodus) provides insight into its adaptive evolution. Biology11, 1810. doi: 10.3390/biology11121810
4
Cota-Ruiz K. Peregrino-Uriarte A. B. Felix-Portillo M. Martínez-Quintana J. A. Yepiz-Plascencia G. (2015). Expression of fructose 1,6-bisphosphatase and phosphofructokinase is induced in hepatopancreas of the white shrimp Litopenaeus vannamei by hypoxia. Mar. Environ. Res.106, 1–9. doi: 10.1016/j.marenvres.2015.02.003
5
Diaz R. J. (2001). Overview of hypoxia around the world. J. Environ. Qual.30, 275–281. doi: 10.2134/jeq2001.302275x
6
Gao A. Yan F. Zhou E. Wu L. Li L. Chen J. et al . (2020). Molecular characterization and expression analysis of chemokine (CXCL12) from Nile tilapia (Oreochromis niloticus). Fish Shellfish Immun.104, 314–323. doi: 10.1016/j.fsi.2020.06.003
7
Geng X. Feng J. Liu S. Wang Y. Arias C. Liu Z. (2014). Transcriptional regulation of hypoxia inducible factors alpha (HIF-α) and their inhibiting factor (FIH-1) of channel catfish (Ictalurus punctatus) under hypoxia. Comp. Biochem. Phy. B.169, 38–50. doi: 10.1016/j.cbpb.2013.12.007
8
He J. Yu Y. Qin X. W. Zeng R. Y. Wang Y. Y. Li Z. M. et al . (2019). Identification and functional analysis of the Mandarin fish (Siniperca chuatsi) hypoxia-inducible factor-1α involved in the immune response. Fish Shellfish Immun.92, 141–150. doi: 10.1016/j.fsi.2019.04.298
9
Heidbreder M. Fröhlich F. Jöhren O. Dendorfer A. Qadri F. Dominiak P. (2003). Hypoxia rapidly activates HIF-3alpha mRNA expression. Faseb. J.17, 1541–1543. doi: 10.1096/fj.02-0963fje
10
Huang J. S. Li H. J. Guo Z. X. Zhang J. D. Wang W. Z. Wang Z. L. et al . (2021). Identification and expression analysis of cobia (Rachycentron canadum) liver-related miRNAs under hypoxia stress. Fish Physiol. Biochem.47, 1951–1967. doi: 10.1007/s10695-021-01017-5
11
Huo D. Sun L. Li X. Ru X. Liu S. Zhang L. et al . (2017). Differential expression of miRNAs in the respiratory tree of the sea cucumber Apostichopus japonicus under hypoxia stress. G3 (Bethesda Md.)7, 3681–3692. doi: 10.1534/g3.117.1129
12
Lai X. Wu H. Guo W. Li X. Wang J. Duan Y. et al . (2023). Vibrio harveyi co-infected with Cryptocaryon irritans to orange-spotted groupers Epinephelus coioides. Fish Shellfish Immun.139, 108879. doi: 10.1016/j.fsi.2023.108879
13
Law S. H. Wu R. S. Ng P. K. Yu R. M. Kong R. Y. (2006). Cloning and expression analysis of two distinct HIF-alpha isoforms–gcHIF-1alpha and gcHIF-4alpha–from the hypoxia-tolerant grass carp, Ctenopharyngodon idellus. BMC Mol. Biol.7, 15. doi: 10.1186/1471-2199-7-15
14
Lee S.-G. Guan F. Lu X.-J. Li C.-H. Chen J. (2017). Molecular characterization of mudskipper (Boleophthalmus pectinirostris) hypoxia-inducible factor-1α (HIF-1α) and analysis of its function in monocytes/macrophages. PloS One12, e0177960. doi: 10.1371/journal.pone.0177960
15
Liang Y.-S. Wu R.-X. Miao B.-B. Niu S.-F. Liang Z.-B. Zhai Y. (2024). Integrated mRNA-Seq and miRNA-Seq analysis reveals the microRNAs-transcription factor-mRNA regulatory network of pearl gentian grouper under acute hypoxia. Aquaculture578, 740120. doi: 10.1016/j.aquaculture.2023.740120
16
Mohindra V. Tripathi R. K. Singh R. K. Lal K. K. (2013). Molecular characterization and expression analysis of three hypoxia-inducible factor alpha subunits, HIF-1α, -2α and -3α in hypoxia-tolerant Indian catfish, Clarias batrachus [Linnaeus 1758. Mol. Biol. Rep.40, 5805–5815. doi: 10.1007/s11033-013-2685-1
17
Mu Y. Li W. Wu B. Chen J. Chen X. (2020). Transcriptome analysis reveals new insights into immune response to hypoxia challenge of large yellow croaker (Larimichthys crocea). Fish Shellfish Immun.98, 738–747. doi: 10.1016/j.fsi.2019.11.021
18
Palazon A. Goldrath A. W. Nizet V. Johnson R. S. (2014). HIF transcription factors, inflammation, and immunity. Immunity41, 518–528. doi: 10.1016/j.immuni.2014.09.008
19
Pamenter M. E. (2014). Mitochondria: a multimodal hub of hypoxia tolerance. Can. J. Zool.92, 569–589. doi: 10.1139/cjz-2013-0247
20
Polymeropoulos E. T. Elliott N. G. Frappell P. B. (2017). Hypoxic acclimation leads to metabolic compensation after reoxygenation in Atlantic salmon yolk-sac alevins. Comp. Biochem. Physiol. A Mol. Integr. Physiol.213, 28–35. doi: 10.1016/j.cbpa.2017.08.011
21
Richards J. G. (2011). Physiological, behavioral and biochemical adaptations of intertidal fishes to hypoxia. J. Exp. Biol.214, 191–199. doi: 10.1242/jeb.047951
22
Sandamalika W. M. G. Liyanage D. S. Lim C. Yang H. Lee S. Jeong T. et al . (2022). Differential gene expression of red-spotted grouper (Epinephelus akaara) in response to lipopolysaccharide, poly I:C, and nervous necrosis virus revealed by RNA-seq data. Fish Shellfish Immun.131, 939–944. doi: 10.1016/j.fsi.2022.11.006
23
Schmittgen T. Livak K. (2008). Analyzing real-time PCR data by the comparative C(T) method. Nat. Protoc.3, 1101–1108. doi: 10.1038/nprot.2008.73
24
Schumacker P. T. (2005). Hypoxia-inducible factor-1 (HIF-1). Crit. Care Med.33, S423–S425. doi: 10.1097/01.ccm.0000191716.38566.e0
25
Semenza G. L. (2011). Oxygen sensing, homeostasis, and disease REPLY. New Engl. J. Med.365, 1846–1846. doi: 10.1056/NEJMra1011165
26
Shen R.-J. Jiang X.-Y. Pu J.-W. Zou S.-M. (2010). HIF-1α and -2α genes in a hypoxia-sensitive teleost species Megalobrama amblycephala: cDNA cloning, expression and different responses to hypoxia. Comp. Biochem. Phys. B.157, 273–280. doi: 10.1016/j.cbpb.2010.06.013
27
Soitamo A. J. Råbergh C. M. I. Gassmann M. Sistonen L. Nikinmaa M. (2001). Characterization of a hypoxia-inducible factor (HIF-1α) from rainbow trout. J. Biol. Chem.276, 19699–19705. doi: 10.1074/jbc.M009057200
28
Sun J.-l. Zhao L.-l. Wu H. Liu Q. Liao L. Luo J. et al . (2019). Acute hypoxia changes the mode of glucose and lipid utilization in the liver of the largemouth bass (Micropterus salmoides). Sci. Total Environ.713, 135157. doi: 10.1016/j.scitotenv.2019.135157
29
Terova G. Rimoldi S. Corà S. Bernardini G. Gornati R. Saroglia M. (2008). Acute and chronic hypoxia affects HIF-1α mRNA levels in sea bass (Dicentrarchus labrax). Aquaculture279, 150–159. doi: 10.1016/j.aquaculture.2008.03.041
30
Thanasaksiri K. Sakai N. Yamashita H. Hirono I. Kondo H. (2014). Influence of temperature on Mx gene expression profiles and the protection of sevenband grouper, Epinephelus septemfasciatus, against red-spotted grouper nervous necrosis virus (RGNNV) infection after poly (I:C) injection. Fish Shellfish Immun.40, 441–445. doi: 10.1016/j.fsi.2014.07.035
31
Tzaneva V. Vadeboncoeur C. Ting J. Perry S. F. (2014). Effects of hypoxia-induced gill remodelling on the innervation and distribution of ionocytes in the gill of goldfish, Carassius auratus. J. Comp. Neurol.522, 118–130. doi: 10.1002/cne.23392
32
Wang M. Wu F. Xie S. Zhang L. (2021). Acute hypoxia and reoxygenation: Effect on oxidative stress and hypoxia signal transduction in the juvenile yellow catfish (Pelteobagrus fulvidraco). Aquaculture531, 735903. doi: 10.1016/j.aquaculture.2020.735903
33
Wu Y. Lai X. Lin B. Lin Y. Yang Y. Zhang M. et al . (2023). Transcriptome and hypoxia-responsive gene expression analyses reveal the physiological reaction to acute hypoxia and reoxygenation in Epinephelus coioides. Aquacult. Rep.31, 101655. doi: 10.1016/j.aqrep.2023.101655
34
Wu Y. Lin Y. Lin B. Huang Y. Yu Z. Ma Y. et al . (2024). Effects of hypoxia and reoxygenation on energy metabolism, immune response, and apoptosis in orange-spotted grouper (Epinephelus coioides). Front. Mar. Sci.11. doi: 10.3389/fmars.2024.1495068
35
Xiao W. H. (2015). The hypoxia signaling pathway and hypoxic adaptation in fishes. Sci. China Life Sci.58, 148–155. doi: 10.1007/s11427-015-4801-z
36
Xu Q. Zhang C. Zhang D. Jiang H. Peng S. Liu Y. et al . (2016). Analysis of the erythropoietin of a Tibetan Plateau schizothoracine fish (Gymnocypris dobula) reveals enhanced cytoprotection function in hypoxic environments. BMC Evol. Biol.16, 11. doi: 10.1186/s12862-015-0581-0
37
Zhang Y. Shen W. Ding J. Gao X. Wu X. Zhu J. (2022). Comparative transcriptome analysis of head kidney of aeromonas hydrophila-infected hypoxia-tolerant and normal large yellow croaker. Mar. Biotechnol. (NY)24, 1039–1054. doi: 10.1007/s10126-022-10158-4
38
Zhang Y. Wang X. Gao Z. Li X. Meng R. Wu X. et al . (2024). Hypoxia-inducible factor-1α promotes macrophage functional activities in protecting hypoxia-tolerant large yellow croaker (Larimichthys crocea) against Aeromonas hydrophila infection. Front. Immunol.15. doi: 10.3389/fimmu.2024.1410082
39
Zhang Z. Wells M. C. Boswell M. G. Beldorth I. Kirk L. M. Wang Y. et al . (2012). Identification of robust hypoxia biomarker candidates from fin of medaka (Oryzias latipes). Comp. Biochem. Phys. C.155, 11–17. doi: 10.1016/j.cbpc.2011.05.015
40
Zheng C. Zhao Q. Li E. Zhao D. Sun S. (2021). Role of hypoxia in the behaviour, physiology, immunity and response mechanisms of crustaceans: A review. Rev. Aquacult.14, 676–687. doi: 10.1111/raq.12618
41
Zinkernagel A. S. Johnson R. S. Nizet V. (2007). Hypoxia inducible factor (HIF) function in innate immunity and infection. J. Mol. Med. (Berl)85, 1339–1346. doi: 10.1007/s00109-007-0282-2
Summary
Keywords
Epinephelus cyanopodus , hypoxia, HIF-1α, immune response, Vibrio harveyi
Citation
Gao A, Chen Q, Huang Y, Yu Z, He W, Wu J, Huang J, Cai T and Shu H (2025) Molecular characterization and expression analysis of hypoxia inducible factor-1α during hypoxic stress in speckled blue grouper (Epinephelus cyanopodus). Front. Mar. Sci. 12:1662359. doi: 10.3389/fmars.2025.1662359
Received
09 July 2025
Accepted
04 August 2025
Published
20 August 2025
Volume
12 - 2025
Edited by
Basanta Kumar Das, Central Inland Fisheries Research Institute (ICAR), India
Reviewed by
Sofia Priyadarsani Das, National Taiwan Ocean University, Taiwan
Biswajit Mandal, Central Inland Fisheries Research Institute (ICAR), India
Updates
Copyright
© 2025 Gao, Chen, Huang, Yu, He, Wu, Huang, Cai and Shu.
This is an open-access article distributed under the terms of the Creative Commons Attribution License (CC BY). The use, distribution or reproduction in other forums is permitted, provided the original author(s) and the copyright owner(s) are credited and that the original publication in this journal is cited, in accordance with accepted academic practice. No use, distribution or reproduction is permitted which does not comply with these terms.
*Correspondence: Along Gao, algao@gzhu.edu.cn; Hu Shu, shuhu001@126.com
Disclaimer
All claims expressed in this article are solely those of the authors and do not necessarily represent those of their affiliated organizations, or those of the publisher, the editors and the reviewers. Any product that may be evaluated in this article or claim that may be made by its manufacturer is not guaranteed or endorsed by the publisher.