Abstract
This study presents a low-cost monitoring approach to assess energy consumption and carbon footprint in the Basque artisanal albacore fishery, focusing on two fishing techniques: trolling (LTL) and pole-and-line with live bait (LHP). Using intrusive and non-intrusive monitoring systems, vessel-specific fuel consumption–speed over ground curves (FOC-SOG) were established, enabling accurate estimation of fuel use and greenhouse gas (GHG) emissions across five fishing seasons (2015–2019). The results show that LTL vessels, although having bigger engines, exhibit higher fuel use intensity (FUI: 899.2 L/t) and carbon intensity (2.45 kg CO2eq/kg landed) compared to LHP vessels (FUI: 632.6 L/t; 1.72 kg CO2eq/kg landed), due to lower catch volumes and longer distance covered. Despite their higher fuel consumption, LHP vessels achieve greater catches, making them relatively more energy efficient. The study also confirms that vessel speed is a key factor in fuel consumption, validating the use of SOG as a proxy for energy demand. This research demonstrates the feasibility of applying low-cost monitoring strategies to small-scale fisheries, offering a scalable method for evaluating operational patterns and supporting decarbonisation efforts. The findings provide a solid foundation for future energy-saving measures tailored to each fishing technique, contributing to the broader goal of reducing the environmental impact of artisanal fleets.
Highlights
-
• A cost-effective fuel monitoring method was validated in Basque albacore fisheries.
-
• Fuel use and carbon footprint were estimated via intrusive and non-intrusive systems.
-
• Trolling vessels had higher fuel use intensity and carbon intensity compared with pole-and-line with live bait vessels.
-
• Vessel speed over ground proved to be a reliable proxy for estimating energy demand.
-
• The approach enables scalable monitoring to support decarbonisation of artisanal fisheries.
1 Introduction
Mitigating climate change is one of our society’s greatest challenges in the first half of this century. Policies and actions promoted in Europe do not seem to be able to keep pace with the rapid growth of the associated risks, with Europe being the most fast-warming continent in the world (EEA, 2024). Coastal regions are also affected by the proximity of maritime traffic, another pollutant emission niche. This leads to exposure to public health diseases and climate change due to this air pollution. Policies with clear goals towards net-zero emissions are needed (Roy and Chakraborty, 2025).
It is therefore necessary to involve all economic sectors in decarbonisation actions, including the fishing industry. This fuel-dependent sector, which contributes to climate change through its emissions, is directly affected by it (Bastardie et al., 2022). Indeed, the warming of the oceans has altered the spatial and temporal distribution of different fish species (Worm and Lotze, 2021), such as tuna, whose dynamic and large-scale distribution has shifted to more northern regions (Erauskin-Extramiana et al., 2019). This has directly impacted the routes fishing vessels follow to reach schools of fish and, consequently, the energy demand and their carbon footprint.
Over the last decade, different studies have tried to put a figure on the emissions and fossil fuel consumption of the European and world fishing fleet, mainly powered by diesel engines. Some authors highlighted that the increase in greenhouse gas (GHG) emissions intensified by 28% from 1990 to 2011, reaching nearly 175 million tonnes of CO2 equivalent (CO2eq), where European fisheries represented 11% (Parker et al., 2018). Another study pointed out that fishing fleets account for 1.2% of the global fuel consumption, representing 134 million tonnes of CO2 into the atmosphere (Basurko et al., 2016). Other approaches have been published; for example, in 2018, the total GHG emissions from the global fisheries exceeded the figure of 40 million tonnes, where European fisheries represented 7 million tonnes (Alma-Maris, 2023). In addition, the carbon footprint of the European fishing fleet was estimated to be almost 7 million tonnes of CO2eq from 2008 to 2019, representing 17% of the global fisheries (Prellezo et al., 2022), and fuel-related GHG emissions represent between 60% and 90% of the total life cycle carbon footprint of the fishing product supply chain (Parker and Tyedmers, 2015). Finally, more recent studies have found that the global fishing fleet, primarily powered by diesel engines, accounts for between 0.1% and 0.5% of global emissions, with an estimated figure of over 50 million tonnes of GHGs (UNCTAD, 2024). However, previous and more recent studies yield different figures, which is probably due to a slight reduction of the fishing fleet, different data sources, or lack of fuel consumption data in fisheries.
Certain fisheries such as trawling have a larger carbon footprint than land-based food production and processing (Hilborn et al., 2023). Therefore, fisheries management entities and European policymakers have started to look for decarbonisation solutions for fisheries in order to reduce their GHG contribution (Basurko et al., 2023). Nonetheless, this atmospheric pollution is yet to be rigorously considered within the fisheries management plans (Driscoll and Tyedmers, 2010), even though it could be drastically minimised within mitigation scenarios (Henson et al., 2017). However, IMO’s GHG regulations do not apply to fishing vessels yet (Díaz-Secades, 2024).
Fishing practices are varied, and they depend on cultural and regional customs and habits, as well as target species and their migratory nature. Thus, in terms of fuel use, not all the fishing trips are the same per vessel, gear, and target species (Basurko et al., 2023; Schau et al., 2009). In general terms, some passive gears, purse seines, and fisheries using other surrounding nets are more environmentally friendly compared to active towed gears such as beam and bottom trawls (Suuronen et al., 2012); paradoxically, lobster and shrimp pot and trap fisheries, despite being passive, have reported the highest fuel use intensity (FUI) scores (given in litres of fuel per tonnes of catch), due to the low catch in comparison to other fisheries (Parker and Tyedmers, 2015). Likewise, small-scale fisheries, although they are likely to be more environmentally friendly than larger fleet segments (Suuronen et al., 2012), have a significant (25%) share of fisheries’ annual global GHG emissions (Greer et al., 2019). Therefore, all fisheries, regardless of their characteristics, need to implement decarbonisation strategies.
Decarbonisation requires of a good understanding of the different fisheries, their activity patterns, and their relationship with fuel consumption. Monitoring the vessels, i.e., their activity and consumption, has been highlighted as the first step in setting decarbonisation strategies due to the fact that it provides a detailed understanding of the vessel’s production activity and its energy demand (Basurko et al., 2023; Koričan et al., 2023). According to some studies, the use of monitoring devices can save 5%–15% of energy consumption due to the valuable information they provide in order to find the optimum point of instantaneous consumption versus vessel speed, during navigation and fishing (Basurko et al., 2013; Notti and Sala, 2014). In the long-distance fleet, the energy-monitoring devices are more commonly used, but are not yet widespread for the smaller or artisanal fleet. The reasons could be the costs or the lack of innovative proactivity due to unawareness or funding possibilities (Basurko et al., 2023). In addition, some authors suggested other developments from vessel operational data (i.e. date, time, speed, and course), with trajectory pattern assessments for fishing vessel behaviour identification and sustainable practices (Yang et al., 2024).
Albacore artisanal fisheries that operate in the Bay of Biscay and northeast Atlantic Ocean are very dependent on long routes in search of tuna stocks, which leads to significant fuel consumption and GHG emissions. This is due to the migration of the albacore occurring approximately between May and October that moves from the Azores archipelago to the east or northeast of the Bay of Biscay, or even to southern Ireland as the tuna season progresses (Arrizabalaga et al., 2002). In order to shed light on the low-cost monitoring and taking this fishery as a case study, this contribution aims at becoming a showcase on how 1) to monitor the fuel consumption and carbon footprint in a relatively low-cost and non-intrusive manner; 2) to monitor fuel consumption and fishing activity to increase our knowledge of fuel dependency per fishing segment; and 3) to differentiate the operational and energy use pattern of two different artisanal fishing techniques, focusing on the same area and target species. This study also provides information on albacore artisanal fishing fleet’s (i.e., trollers and live-bait pole and liners) carbon footprint of the Bay of Biscay. For this, seven vessels were monitored using intrusive monitoring (IMS) and non-intrusive monitoring (NIMS) systems. The knowledge gained regarding fuel consumption was used to define the low-cost monitoring approach, and subsequently, this approach was tested in six artisanal albacore vessels during their albacore seasons from 2015 to 2019.
2 Material and methods
2.1 Monitoring strategy
2.1.1 General approach
The monitoring consisted of recording the speed over ground (SOG) and fuel oil consumption (FOC) of six fishing vessels during five albacore fishing seasons (2015–2019). SOG data were obtained by means of GPS-derived positions, from vessel monitoring systems (VMS). FOC, however, is usually not measured in artisanal vessels. Therefore, by taking advantage of the database generated during the monitoring of certain vessels, a two-step approach was applied to obtain low-cost FOC data (Figure 1):
Figure 1
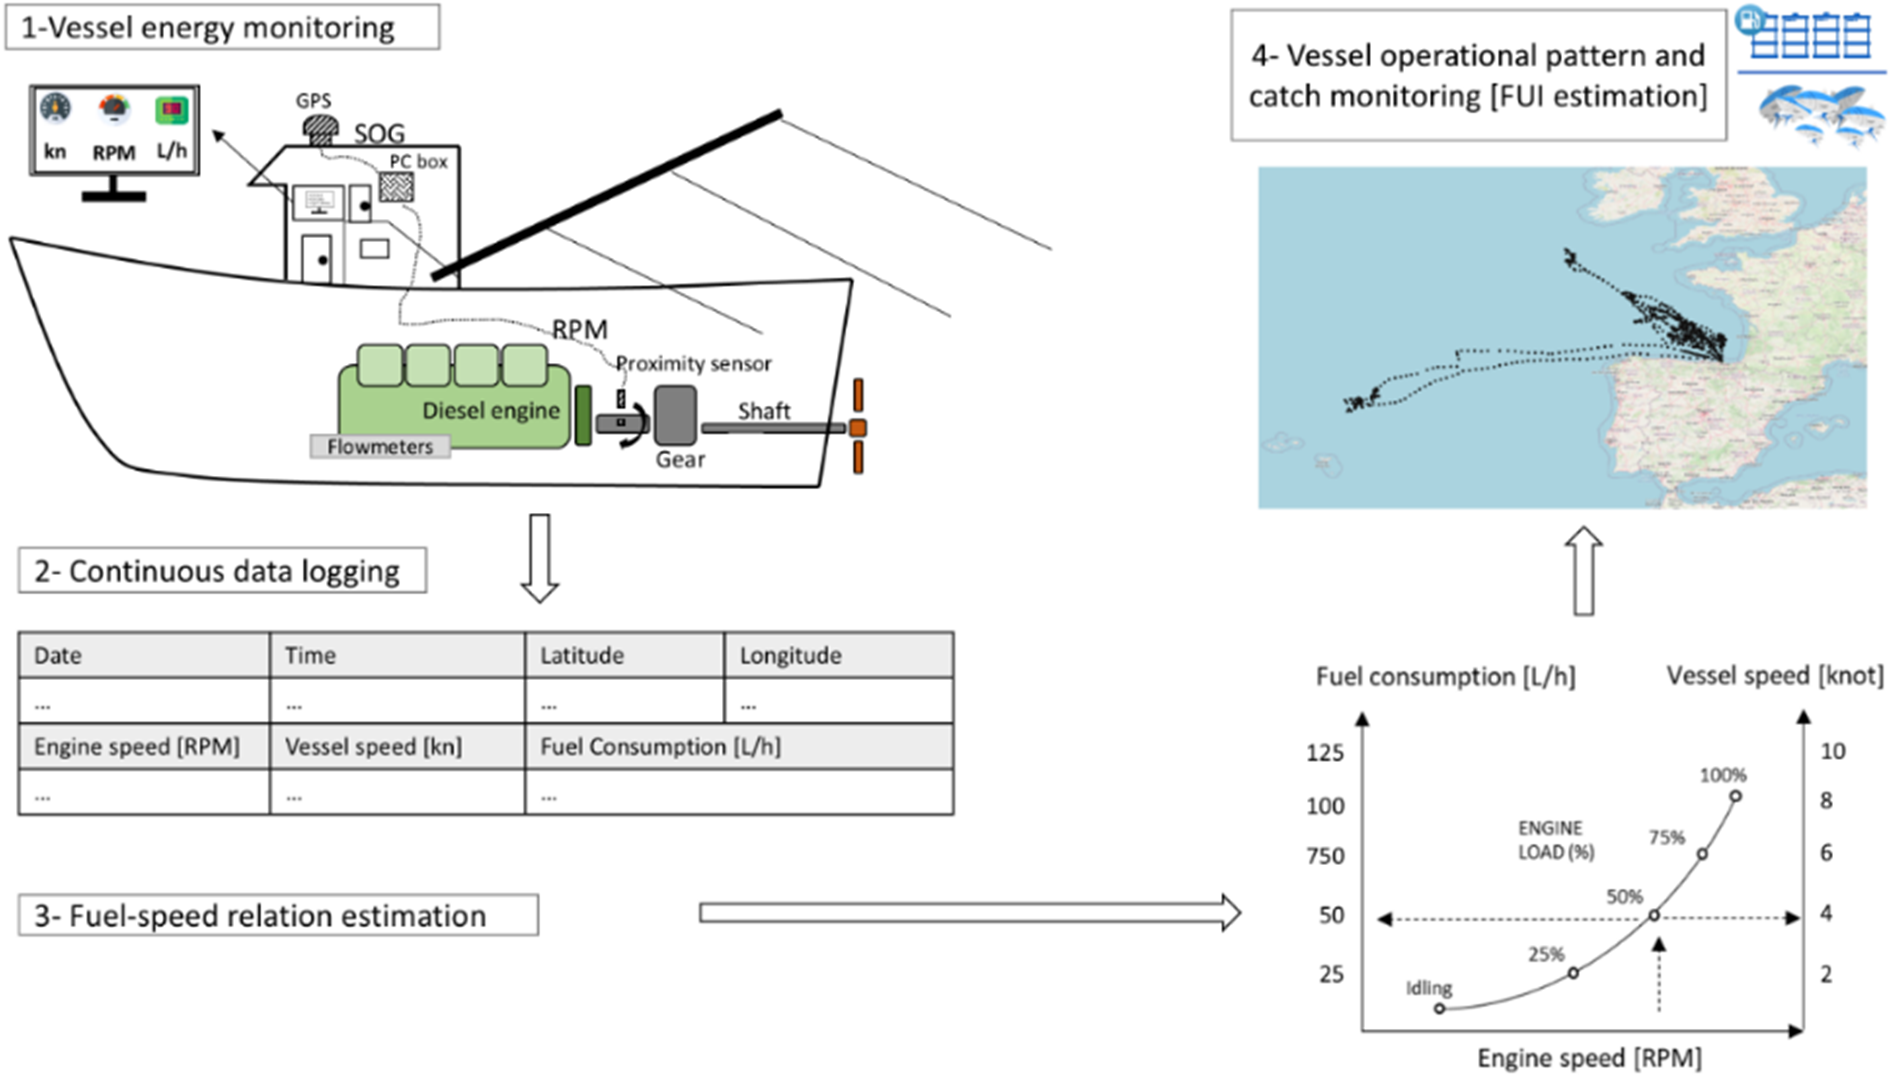
Flowchart showing how data were obtained: monitoring system scheme, data logging, and fuel use intensity estimation.
-Step 1: Estimation of SOG-FOC relationship
Seven albacore artisanal vessels (vessels A–G of Table 1), engaged in either trolling (LTL) or pole and line (LHP), were monitored using IMS and NIMS systems (Section 2.1.2) to estimate their SOG versus FOC relation trace based on their activity. Then, the average curves for each fishing technique were estimated (Section 2.1.3).
Table 1
| Vessela | Length overall (LOA) [m] | Fishing gearsb | Besides albacore, other target species with other gears | Activity data | Energyc data | |||
|---|---|---|---|---|---|---|---|---|
| Main | Secondary | Data provider | Outcome | Data provider | Outcome | |||
| Vessels used to estimate the fuel consumption (FOC) and speed over ground (SOG) curve of the Basque artisanal albacore vessels | ||||||||
| A | 25.90 | LTLd | GNS, LHM | Monkfish, mackerel | Intrusive monitoring (GPS) | Lat., long., SOG | IMS (flow meters) | FOC, RPM, SOG–FOC curves |
| B | 36.20 | LHP | PS | Sardine, mackerel, anchovy, horse mackerel | ||||
| C | 37.00 | LHP | PS | |||||
| D | 26.00 | LTL | LHM | Mackerel | Non-intrusive monitoring (GPS) | NIMS (proximity sensor and engine operation datasheet, i.e., RPM-FOC curves) | FOC, RPM, SOG–FOC curves | |
| E | 23.00 | LTL | LHM, LLS | Mackerel, hake | ||||
| F | 18.00 | LTL | GNS, LHM | Monkfish, mackerel | ||||
| G | 36.00 | LHP | PS | Sardine, mackerel, anchovy, horse mackerel | ||||
| Vessels used to define the activity and energy monitoring of the Basque artisanal albacore vessels (2015–2019) | ||||||||
| 1 | 25.90 | LTLd | GNS, LHM | Monkfish, mackerel | VMS | Lat., long., SOG | SOG–FOC curvee | FOC |
| 2 | 25.00 | LTL | LHM | Mackerel | ||||
| 3 | 26.00 | LTL | PS | Sardine, mackerel, anchovy, horse mackerel | ||||
| 4 | 36.20 | LHP | PS | |||||
| 5 | 32.00 | LHP | PS | |||||
| 6 | 30.85 | LHP | PS | |||||
Details about the analysed trolling (LTL) and pole-and-line with live bait (LHP) vessels, the fuel monitoring devices installed on board, and the data used in this study.
All the vessels considered in this study operate in the Bay of Biscay and adjacent waters (FAO zone: 27.8).
Fishing gear types abbreviations according to European Commission classification Popescu and Breuer (2024).
LTL main engine propulsion power rate: 500–750 HP; and LHP main engine propulsion power rate: 1,200–1,400 HP.
LTL vessels that are not considered within the small-scale fishing sector. Smaller vessels also go trolling albacore, but due to their reduced scale in terms of fishing trips and zones, they were not the target of this study.
Average of the SOG–FOC curves extracted from vessels A–F.
-Step 2: Fishing activity monitoring
The resulting average SOG–FOC curves were employed to estimate the fuel consumption of a set of six LTL and LHP albacore artisanal vessels (vessels 1–6 of Table 1) for five fishing seasons (2015–2019) (Section 2.1.4).
In the following subsections, this two-step process will be explained.
2.1.2 The intrusive and non-intrusive devices: estimation of SOG–FOC relationship
As stated before, measurements obtained by the IMS and NIMS systems of seven vessels were used in this study to compute the SOG–FOC curves. Fuel and vessel activity monitoring details are listed in Table 2.
Table 2
| Variable measured | Type of equipment used | Model | Units | Accuracy | Installation onboard |
|---|---|---|---|---|---|
| FOC | Flow meter (usually 2 flow meters by vessel: one for inlet and the other for outlet flow measurement)a | a) KRAL OMG20 b) KRAL OMG13 |
L/h | a) ± 0.1%; [15.3–2,295.0] kg/h b) ± 0.1%; [5–785] kg/h |
Fuel circuit |
| Fuel temperature | Temperature sensor | PT100 | °C | ± 0.1%; [20–200] °C | Inside flow meter |
| Engine speed | Proximity sensor | Hamlin-Hall type – inductive | RPM | Total error <2% of operation voltage (24Vdc) | Engine power wheel |
| SOG, course and position | GPS | a) Furuno (on board)b b) Arduino NEO-6 |
Knots, degrees, lat., long. | a) 10 m 95% b) 2.5 m, 0.1 m/s, 0.5° |
Vessel deck |
Components of the fuel monitoring devices.
Key:
FOC[L/h]: volumetric fuel consumption directly measured but mass consumption [kg/h] calculated by means of the density, which is calculated as a function of the fuel temperature. Only for the IMS system. FOC for the NIMS system was calculated by the RPM–FOC curve from the engine datasheet.
In two cases, the vessel’s GPS (Furuno GPXX) was used for SOG, course, and position measurement. At 95% of the time, the common precision for such GPS type is 10 m.
On the one hand, three of them were monitored using the IMS system (vessels A–C, Table 1). The IMS comprised of a GPS (signal extracted from the vessel equipment), inductive proximity sensor, and fuel flow meters. A proximity sensor was installed in the engine wheel for engine speed measurement, and flow meters were in the fuel flow line and included an integrated fuel temperature sensor. The IMS recorded locally in the system’s central processing unit and put into the cloud every minute the following set of data: date, time, latitude, longitude, SOG, FOC, and engine speed.
On the other hand, four vessels were monitored using the NIMS device (vessels D–G, Table 1). The NIMS consisted of an Arduino board; an open-source platform integrated by a Raspberry Pi as a central processing unit, which received GPS (time, position, speed, and course); and engine speed data. GPS readings were provided by a GPS embedded in the Raspberry Pi unit, the continuous readings for revolutions per minute (RPMs) were taken by an inductive proximity sensor fixed in the shaft, and the FOC was estimated by a direct calculation based on the recorded RPMs and the engine consumption curve (also known as the “engine operation datasheet”) provided by the manufacturer (i.e., RPM–FOC curve). These data were then sent using GSM (Global System for Mobile communication) to a private server in near real time.
2.1.3 Defining the SOG–FOC curves
From each of the monitored vessels (A–G), the relationship between the SOG and FOC, namely, the “SOG–FOC curve,” was calculated. These curves represented the fuel oil consumption at different vessel speeds. Then, the average value for the FOC–SOG curve for both fishing techniques was computed. Note that the vessels studied within each fishing technique were similar in structural characteristic, hull shape, and dimensions, as shown in Table 1.
A total of 4,395 h of data were employed to build the SOG–FOC curves, and each vessel had the following data: vessel A, 1,500 h; B, 270 h; C, 490 h; D, 305 h; E, 650 h; F, 320 h; and G, 860 h. The large amount of data was considered to attenuate any influence that may have been caused by sea conditions in the estimation of the functions.
2.1.4 Low-cost fishing activity monitoring of artisanal vessels: operational and energy patterns
The operational activity of the six vessels (vessels 1–6, Table 1) was monitored during five albacore seasons (period 2015–2019). The onboard VMS device provided the hourly position (latitude and longitude) and SOG of the vessel. The FOC was calculated using the SOG–FOC curves determined in step 1, reducing the costs for fuel consumption monitoring in an intrusive way for artisanal fishing methods. This analysis provided information about the differences in operational patterns for same fishing techniques and, in addition, for different fishing techniques in relation to their energy use.
Note that the FOC readings corresponded to the main engine consumption. However, electric and hydraulic power demand is also supplied by internal combustion diesel engines, such as genset or generator engines. In the albacore fishing season, the main engine consumes (due to propulsion) 89.2% of the total FOC in LTL vessels and 88% in LHP vessels; the rest is consumed by auxiliary engines, as obtained in previous studies (Basurko et al., 2013). Thus, the total FOC of the vessels (main engine and genset) was calculated accordingly by multiplying the FOC value provided by the SOG–FOC curve at different speeds by 1.12 (LTL) and 1.14 (LHP).
The operational and energy patterns of the six vessels (vessels 1–6, Table 1) were defined by analysing their speed profiles and representative trips, the time allocated, and the fuel consumed while steaming or fishing. In both cases, the activity of the vessel was discriminated by the vessel SOG. Energy efficiency was calculated by applying the FUI indicator (the total fuel consumption per total catch weight during a trip) per vessel and year. For this computation, total catches reported every fishing trip of these six vessels were compiled. Catch data were the ones reported by the logbooks onboard the vessels provided by Spanish General Secretariat for Fisheries. For the calculation of the amount of CO2eq emission per tonne of fish landed, the conversion factor 3.206 t CO2eq/t diesel-gasoil proposed by the International Maritime Organization (IMO) was applied (IMO, 2009).
3 Results
3.1 SOG–FOC curves
In terms of data provided between different monitoring systems, little differences were found between the FOC–SOG curves obtained with the NIMS and IMS, in other words, between real and calculated data (Figure 2). Furthermore, results showed a high degree of fitting, presenting regression coefficients very close to 1 (Table 3). Despite the variability introduced by sea conditions and structural modifications, it is assumed to be attenuated through hundreds of hours of data recording as shown in Section 2.1.3.
Figure 2
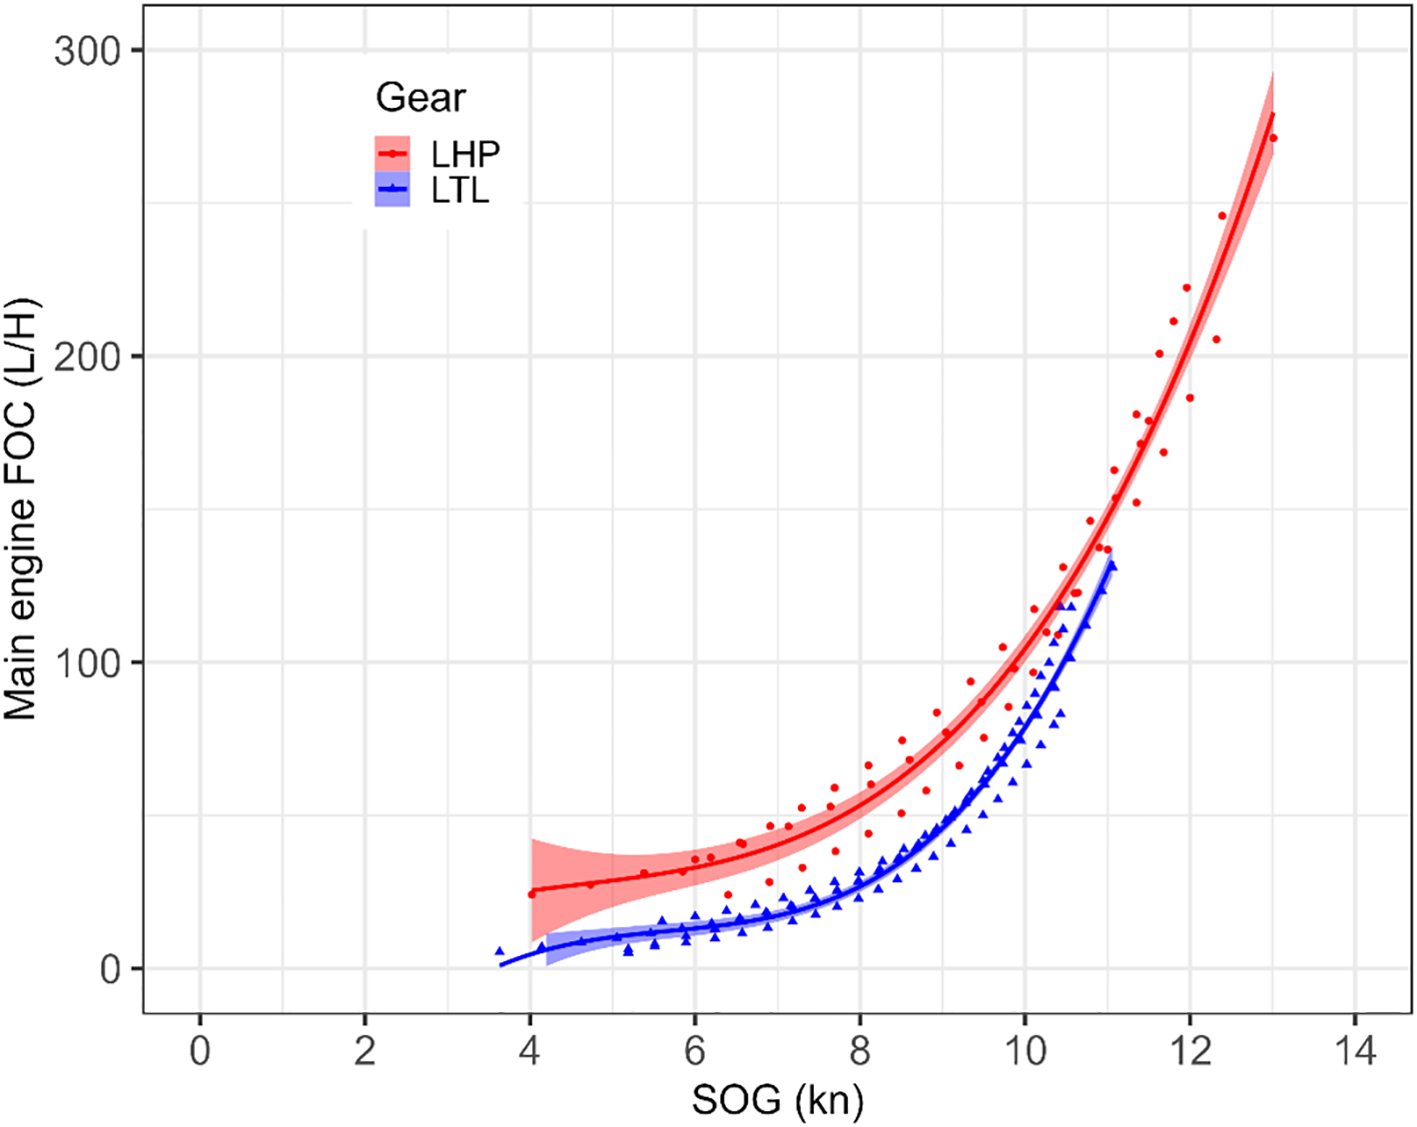
Fuel consumption (FOC)–speed over ground (SOG) curves recorded by intrusive monitoring and non-intrusive monitoring devices for trolling (LTL) and pole-and-line with live bait (LHP) vessels.
Table 3
| Vessel type | FOC–SOG equation for albacore fishing vesselsa | R2 |
|---|---|---|
| LTL | FOC = 0.6872·SOG3 − 11.7168·SOG2 + 69.1983·SOG − 128.7065 | 0.9691 |
| LHP | FOC = 0.3771·SOG3 − 5.1943·SOG2 + 27.0564·SOG − 23.7946 | 0.9732 |
Relationship between fuel consumption (FOC) and vessel speed (SOG).
Key:
FOC in L/h and SOG in knots.
3.2 Operational patterns of albacore fishing
Details of the operative patterns of the vessels from both gear types (LTL and LHP) operated in the same fishing areas (Bay of Biscay and northeast Atlantic Ocean) during the tuna season (from mid-spring to mid-autumn) from 2015 to 2019 are shown in Table 4. LTL vessels were smaller in size (average 24 m) than LHP (average 35 m), their crews were one-third the size of those in LHP, and they had different fishing and operative patterns as reflected in the diverse speed patterns present through the fishing trips (Figure 3). LTL vessels operated 67% of the time in high engine loads, above 6 knots, during trolling and sailing to port or even to another fishing ground (Figure 3). Specifically, 51% of their time was spent trolling when fish schools disaggregated. In contrast, LHP vessels devoted 59% of the time in high engine loads, and this occurred when searching for fish schools and sailing to port or even to another fishing ground. Furthermore, fishing operation using rods represented less than 40% of the time; this activity was undertaken at very low propulsion loads, very slowly, following the aggregated schools of fish. At night, both LTL and LHP vessels stopped their fishing activity and left adrift navigating at less than 1 knot. Sometimes, nights were used to reach new fishing grounds.
Table 4
| Fishing gear | Gear description | Fishing trips per season | Weeks per trip | Crew | Fishing speed [kn] | Navigating speed [kn] |
|---|---|---|---|---|---|---|
| LTL | Line with natural or artificial baited hooks (or lures) towed astern by a vessel near the surface or at a certain depth | 4–5 | 2–4 | 5 fishers | 6.0–8.0 (slightly reduced to 5.0–6.0 knots to haul the line and fish on board) | 8.0–10.0 |
| LHP | Hooked line attached to a pole; the hook is baited with a life bait and thrown to the fish. The albacore is attracted with the life bait close to the surface and vessel. | ~10 | 1–2 | 15 fishers | 0.0–2.0 | 8.5–11.0 |
Operative patterns of trolling (LTL) and pole-and-line with live bait (LHP) vessels.
Figure 3
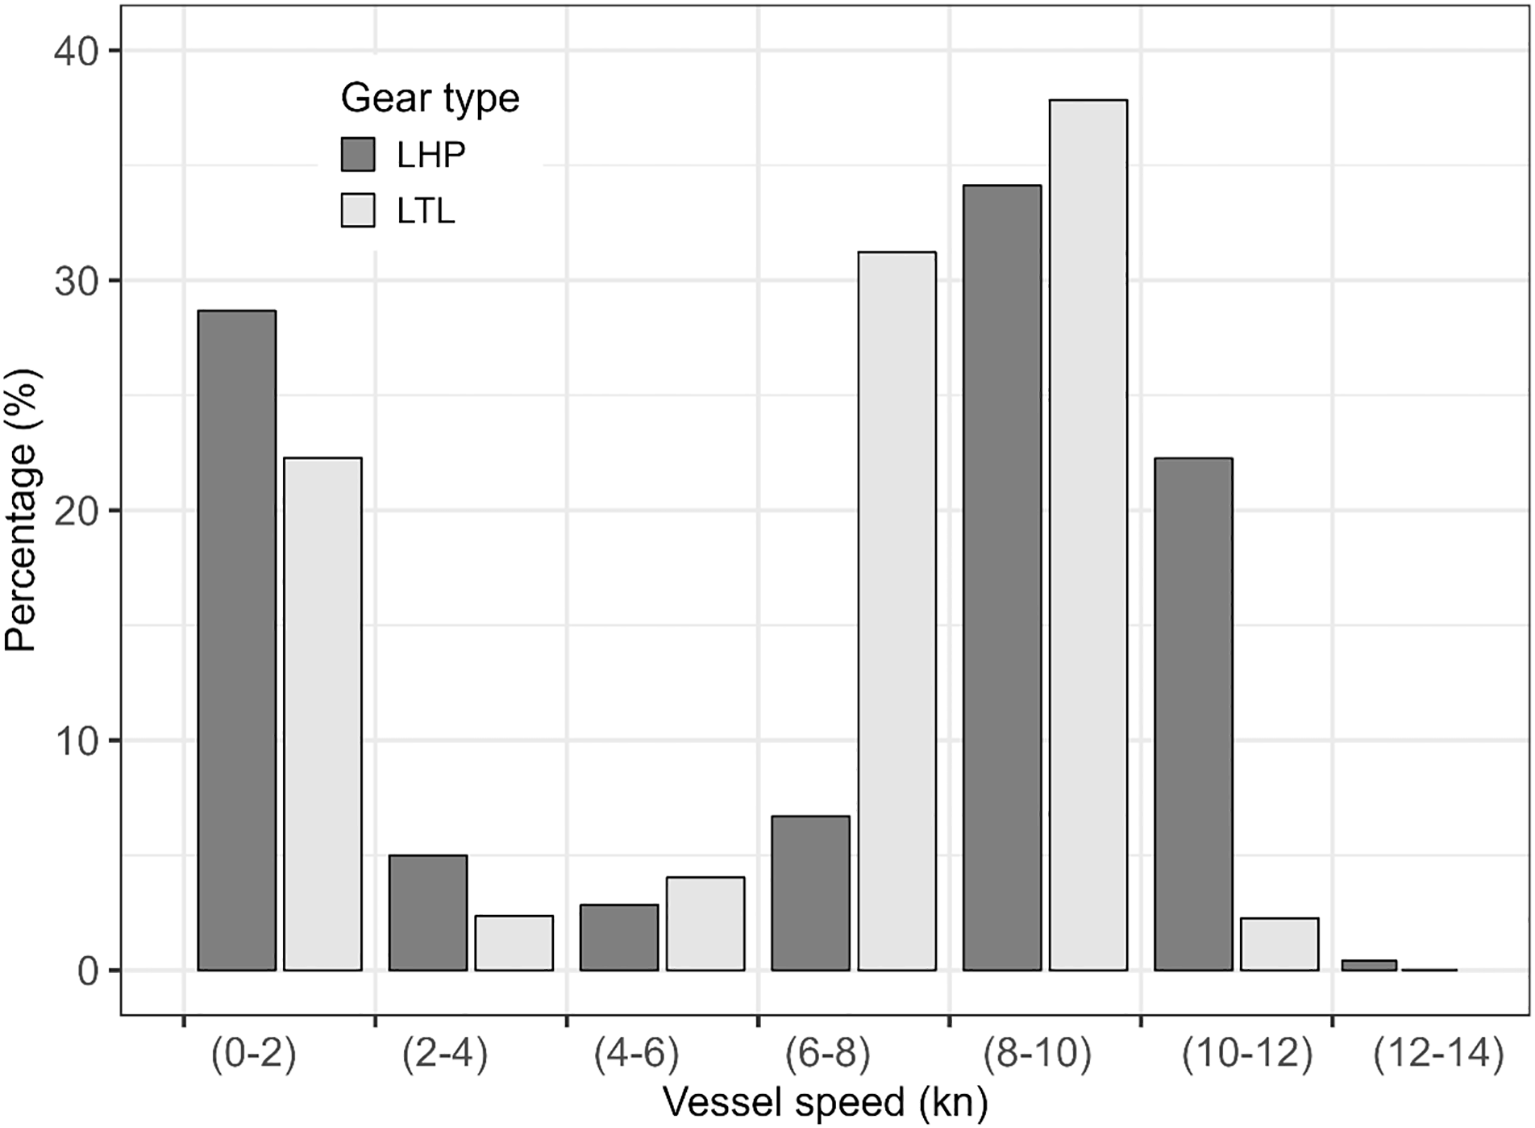
Speed pattern of vessels 1–6 [trolling (LTL) and pole-and-line with live bait (LHP)] for the period 2015 to 2019.
Similarly, not all the fishing trips were equal in duration and geospatial distribution. LTL vessels usually start the season some weeks earlier, while LHP fisheries still use the purse gear 2–4 weeks more; so, LTL fisheries have taken the role of looking for suitable fishing grounds for not only LTL vessels but also to other albacore fisheries. This was also observed in the data collected. As a result, the first fishing trips of LTL vessels resulted longer in duration. Thus, these first trips involved higher fuel use. As time went by, the albacore started to move to the east, approaching to the base ports, and the fishing trips tend to get shorter; thus, the fuel use varied as a function of the fish location. LTL (LHP) trips were, therefore, highly variable and could be grouped in long trips lasting 3 (2) weeks in the northeast Atlantic and short trips lasting 1.5 weeks (1 week) in the Bay of Biscay as shown in Figure 4.
Figure 4
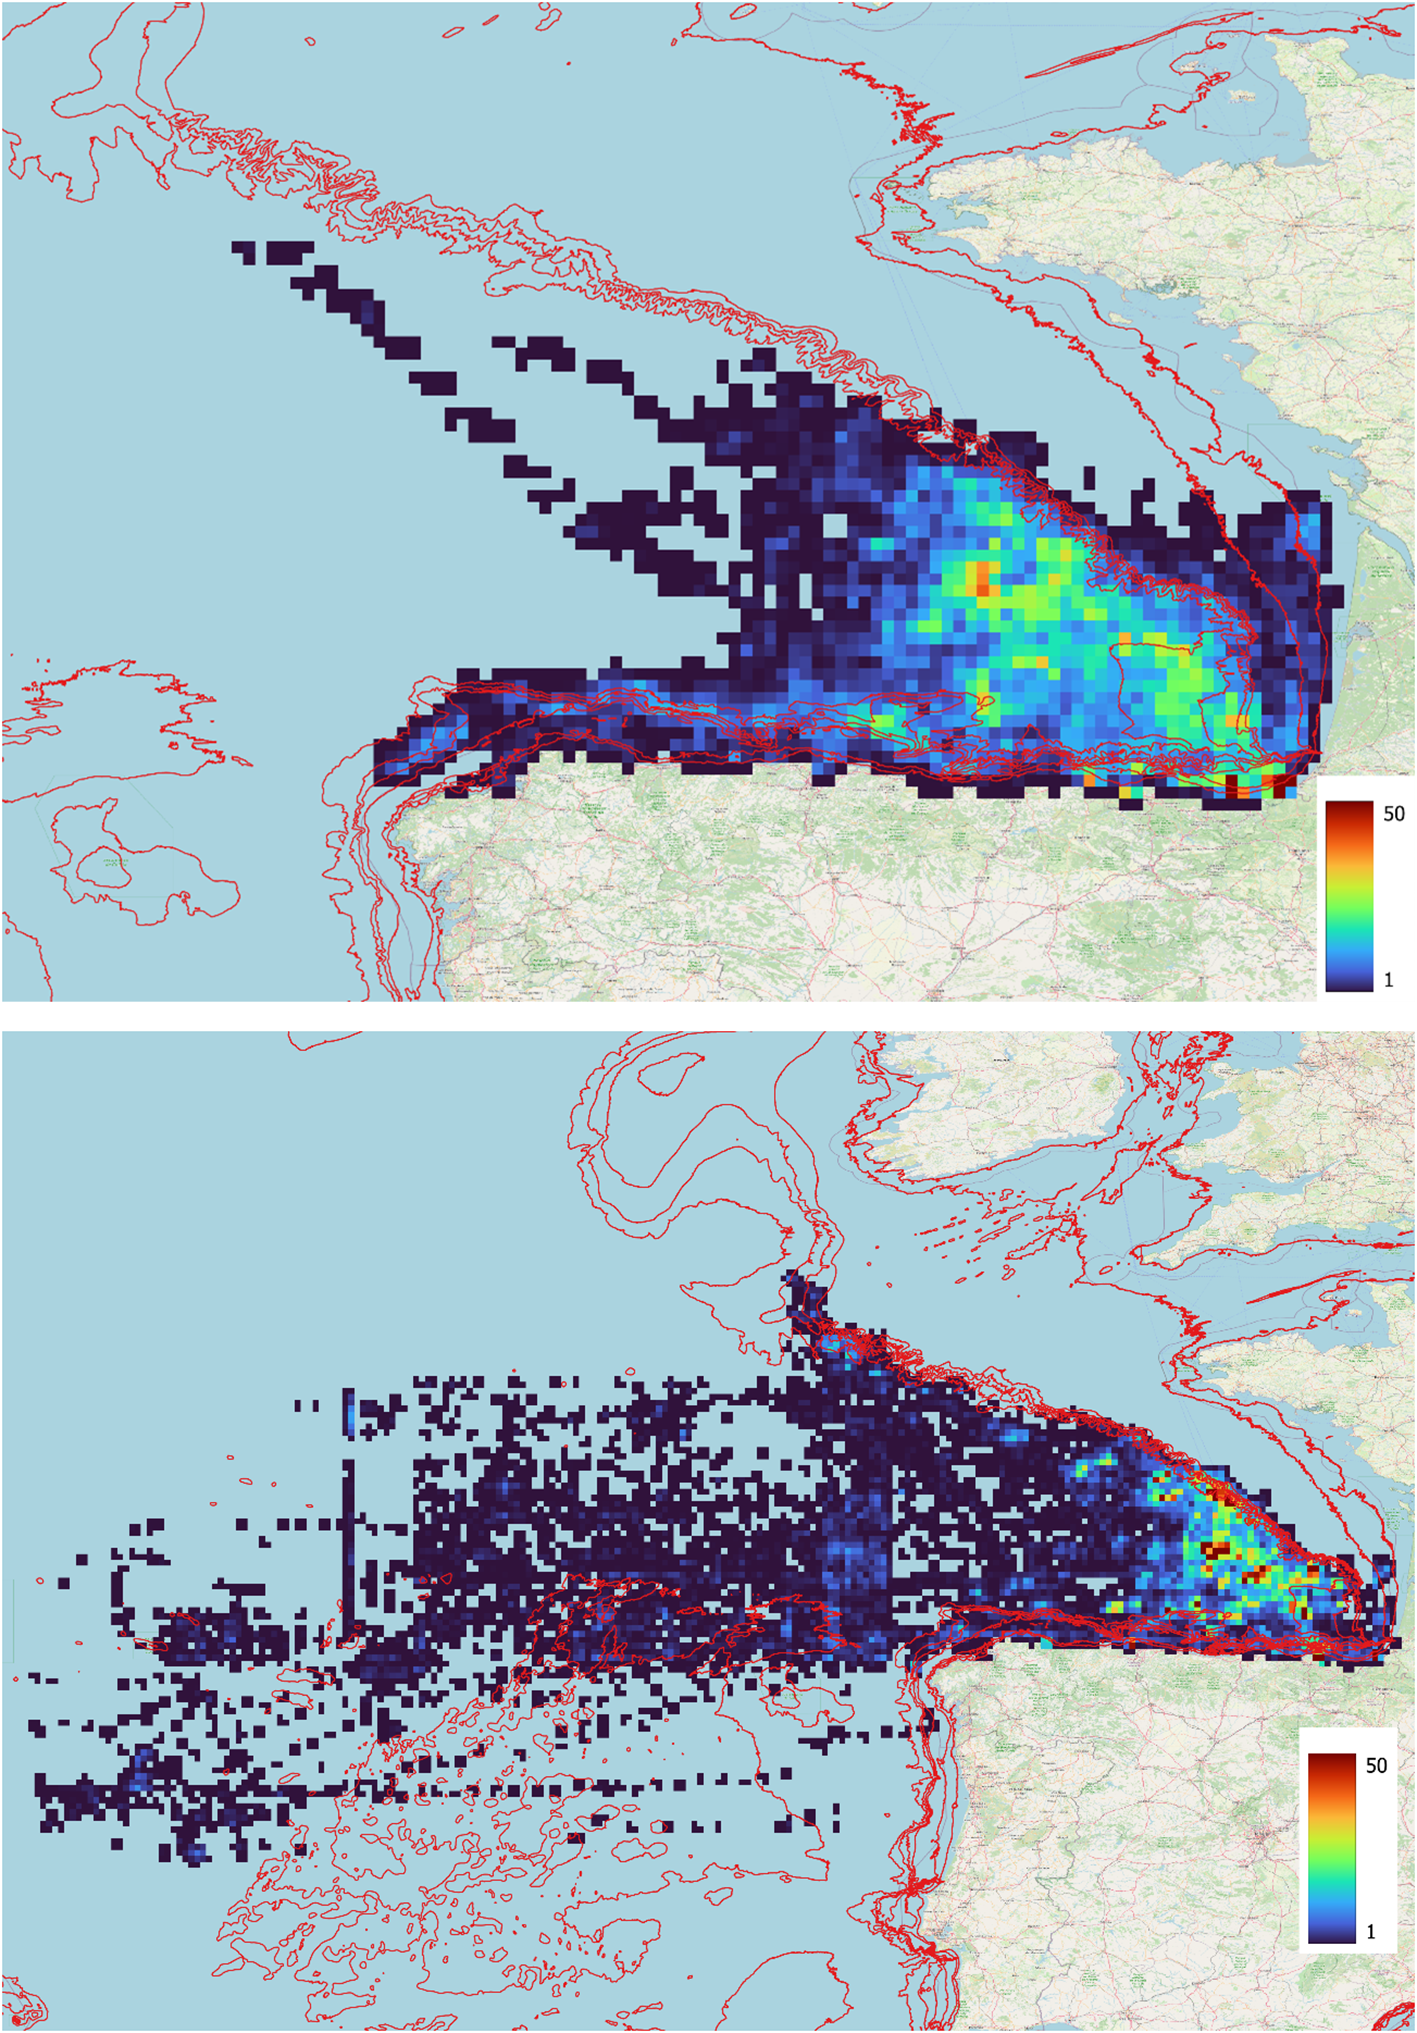
Heat map of the frequency of the fleet positions for 2015–2019; the number of VMS observations per 0.1° x 0.1° pixels for trolling (above) and pole-and-line with live bait (below).
3.3 Fishing activity and fuel use intensity
Even though the FOC and the GHG varies among vessels within each fishing technique and depending on the year and trip (Table 4), they are significantly different between LTL and LHP. The mean yearly FOC of LHP (90,216.3 L) is more than double that of LTL (42,419.9 L).
With regard to the energy efficiency, LTL vessels are, in relative terms, slightly less energy efficient than LHP vessels as they have higher FUI values. LTL vessels consume slightly less fuel despite presenting longer navigation routes; nonetheless, their catch is lower than LHP (Table 4). This means that LTL vessels are more fuel and carbon intensive than LTL (2.45 and 1.72 kg CO2eq/kg landed, respectively) for the same target species. Fuel and emissions performance values vary by fishing trip and year (Table 5; Figure 5). Vessel 4 presents the lowest FUI, while vessels 5 and 6 presents FUI values similar to LTLs, suggesting that further research is needed with more monitored vessels per fishing technique.
Table 5
| Vessel | Gear | Year | Time [h] | Distance [nm] | Total fuel consumption (FOC) [L] | GHGa emissions [kg CO2eq] | Catch [kg] | Fuel use intensity (FUI) [L fuel/t catch] |
|---|---|---|---|---|---|---|---|---|
| 01 | LTL | 2015 | 1,730.6 | 12,240.6 | 46,888.5 | 127,024.2 | 33,479.0 | 1,400.5 |
| 2016 | 1,896.0 | 11,317.3 | 40,111.4 | 108,664.5 | 42,845.0 | 936.2 | ||
| 2017 | 1,872.0 | 9,848.1 | 32,118.6 | 87,011.6 | 57,690.0 | 556.7 | ||
| 2018 | 1,632.0 | 8,682.7 | 26,782.6 | 72,556.0 | 59,037.0 | 453.7 | ||
| 2019 | 1,764.8 | 9,622.7 | 30,048.8 | 81,404.2 | 65,436.0 | 459.2 | ||
| Mean | 1,779.1 | 10,342.3 | 35,190.0 | 95,332.1 | 51,697.4 | 761.3 | ||
| ± SD | 107.8 | 1,420.4 | 8,179.6 | 22,159.1 | 13,122.5 | 408.3 | ||
| 02 | LTL | 2015 | 3,095.8 | 20,449.3 | 89,607.2 | 242,752.1 | 56,640.0 | 1,582.0 |
| 2016 | 1,392.0 | 8,987.6 | 35,947.4 | 97,383.9 | 24,443.0 | 1,470.7 | ||
| 2017 | 1,536.0 | 9,383.7 | 34,175.8 | 92,584.7 | 57,010.0 | 599.5 | ||
| 2018 | 1,848.0 | 10,722.8 | 40,946.1 | 110,925.9 | 72,555.0 | 564.3 | ||
| 2019 | 2,025.8 | 11,791.5 | 45,017.5 | 121,955.5 | 88,110.0 | 510.9 | ||
| Mean | 1,979.5 | 12,267.0 | 49,138.8 | 133,120.4 | 59,751.6 | 945.5 | ||
| ± SD | 672.2 | 4,707.1 | 23,020.1 | 62,363.0 | 23,622.1 | 532.6 | ||
| 03 | LTL | 2015 | 1,718.8 | 12,277.1 | 62,241.9 | 168,617.7 | 41,775.0 | 1,489.9 |
| 2016 | 1,392.0 | 9,042.3 | 42,575.4 | 115,339.8 | 24,443.0 | 1,741.8 | ||
| 2017 | 1,536.0 | 9,262.5 | 38,533.0 | 104,388.5 | 57,010.0 | 675.9 | ||
| 2018 | 1,440.0 | 7,902.1 | 36,585.7 | 99,113.3 | 62,057.5 | 589.5 | ||
| 2019 | 1,574.5 | 8,052.6 | 34,718.5 | 94,054.8 | 75,988.0 | 456.9 | ||
| Mean | 1,532.3 | 9,307.3 | 42,930.9 | 116,302.8 | 52,254.7 | 990.8 | ||
| ± SD | 127.3 | 1,763.6 | 11,181.3 | 30,291.0 | 19,781.9 | 582.8 | ||
| 04 | LHP | 2015 | 1,609.2 | 11,083.4 | 113,618.9 | 307,801.5 | 246,850.0 | 460.3 |
| 2016 | 2,040.0 | 14,078.8 | 139,217.0 | 377,148.5 | 264,300.0 | 526.7 | ||
| 2017 | 1,752.0 | 11,892.8 | 116,394.1 | 315,319.9 | 241,000.0 | 483.0 | ||
| 2018 | 1,152.0 | 6,865.7 | 72,932.3 | 197,578.6 | 385,842.5 | 189.0 | ||
| 2019 | 1,302.0 | 7,960.5 | 80,496.2 | 218,069.8 | 373,018.5 | 215.8 | ||
| Mean | 1,571.0 | 10,376.2 | 104,531.7 | 283,183.7 | 302,202.2 | 375.0 | ||
| ± SD | 354.3 | 2,944.0 | 27,398.0 | 74,223.0 | 71,163.2 | 159.6 | ||
| 05 | LHP | 2015 | 738.7 | 5,045.2 | 57,449.6 | 155,635.1 | 48,300.0 | 1,189.4 |
| 2016 | 1,512.0 | 11,122.8 | 123,588.3 | 334,809.4 | 120,778.0 | 1,023.3 | ||
| 2017 | 1,464.0 | 10,045.3 | 107,021.0 | 289,927.3 | 111,135.0 | 963.0 | ||
| 2018 | 1,032.0 | 5,330.9 | 56,676.5 | 153,540.7 | 218,000.0 | 260.0 | ||
| 2019 | 1,271.0 | 7,112.1 | 72,700.6 | 196,951.1 | 158,476.5 | 458.7 | ||
| Mean | 1,203.5 | 7,731.2 | 83,487.2 | 226,172.7 | 131,337.9 | 778.9 | ||
| ± SD | 321.3 | 2,748.5 | 30,311.1 | 82,114.9 | 62,573.5 | 398.1 | ||
| 06 | LHP | 2015 | 1,218.35 | 8,087.3 | 80,020.7 | 216,781.7 | 63,020.0 | 1,269.8 |
| 2016 | 1,632 | 11,391.6 | 120,627.9 | 326,789.4 | 141,720.0 | 851.2 | ||
| 2017 | 1,320 | 8,640.8 | 82,344.9 | 223,078.1 | 96,565.0 | 852.7 | ||
| 2018 | 1,152 | 6,251.7 | 58,928.5 | 159,641.5 | 196,440.0 | 300.0 | ||
| 2019 | 1,376 | 7,340.7 | 71,228.4 | 192,962.7 | 159,412.0 | 446.8 | ||
| Mean | 1,339.7 | 8,342.4 | 82,630.1 | 223,850.7 | 131,431.4 | 744.1 | ||
| ± SD | 185.1 | 1,925.2 | 23,143.5 | 62,697.4 | 52,465.9 | 382.5 | ||
| Gear type (mean values per gear) | Time [h] | Distance [nm] | Total fuel consumption (FOC) [L] | GHGa emissions [kg CO2eq] | Catch [kg] | Fuel use intensity (FUI) [L fuel/t catch] | ||
| LTL pear year | Mean | 1,763.6 | 10,638.9 | 42,419.9 | 114,918.5 | 54,567.9 | 899.2 | |
| ± SD | 415.8 | 3,067.1 | 15,528.3 | 42,067.2 | 18,299.9 | 486.1 | ||
| LHP per year | Mean | 1,371.4 | 8,816.6 | 90,216.3 | 24,4402.4 | 188,323.8 | 632.6 | |
| ± SD | 315.9 | 2,657.7 | 27,201.5 | 73,690.9 | 101,485.9 | 360.8 | ||
| LTL per trip | Mean | 267.2 | 2,672.5 | 7,313.4 | 19,812.6 | 8,267.9 | 3,137.2 | |
| ± SD | 173.2 | 4,261.2 | 5,636.5 | 15,269.7 | 6,618.3 | 7,269.6 | ||
| Max | 784.7 | 25,983.4 | 30,126.8 | 81,615.5 | 25,201.0 | 56,290.9 | ||
| Min | 20.0 | 132.0 | 532.8 | 1,443.4 | 33.0 | 71.0 | ||
| LHP per trip | Mean | 126.8 | 816.4 | 8,381.8 | 22,706.9 | 17,331.0 | 1,418.7 | |
| ± SD | 67.1 | 426.5 | 4,451.9 | 12,060.6 | 16,433.7 | 5,417.9 | ||
| Max | 339.6 | 2,131.2 | 23,529.6 | 63,743.3 | 65,642.0 | 57,670.6 | ||
| Min | 24.0 | 156.0 | 1,497.6 | 4,057.1 | 68.0 | 20.1 | ||
Trolling (LTL) and pole-and-line with live bait (LHP) albacore fishing operative’s performance parameters, aggregated by yearly activity.
Key:
GHG emissions have been calculated by means of conversion ratio established by the International Maritime Organization (IMO), 1 kg fuel (diesel oil) = 3.026 kg CO2eq (IMO, 2009), where fuel density has been considered as 0.845 kg/L.
Figure 5
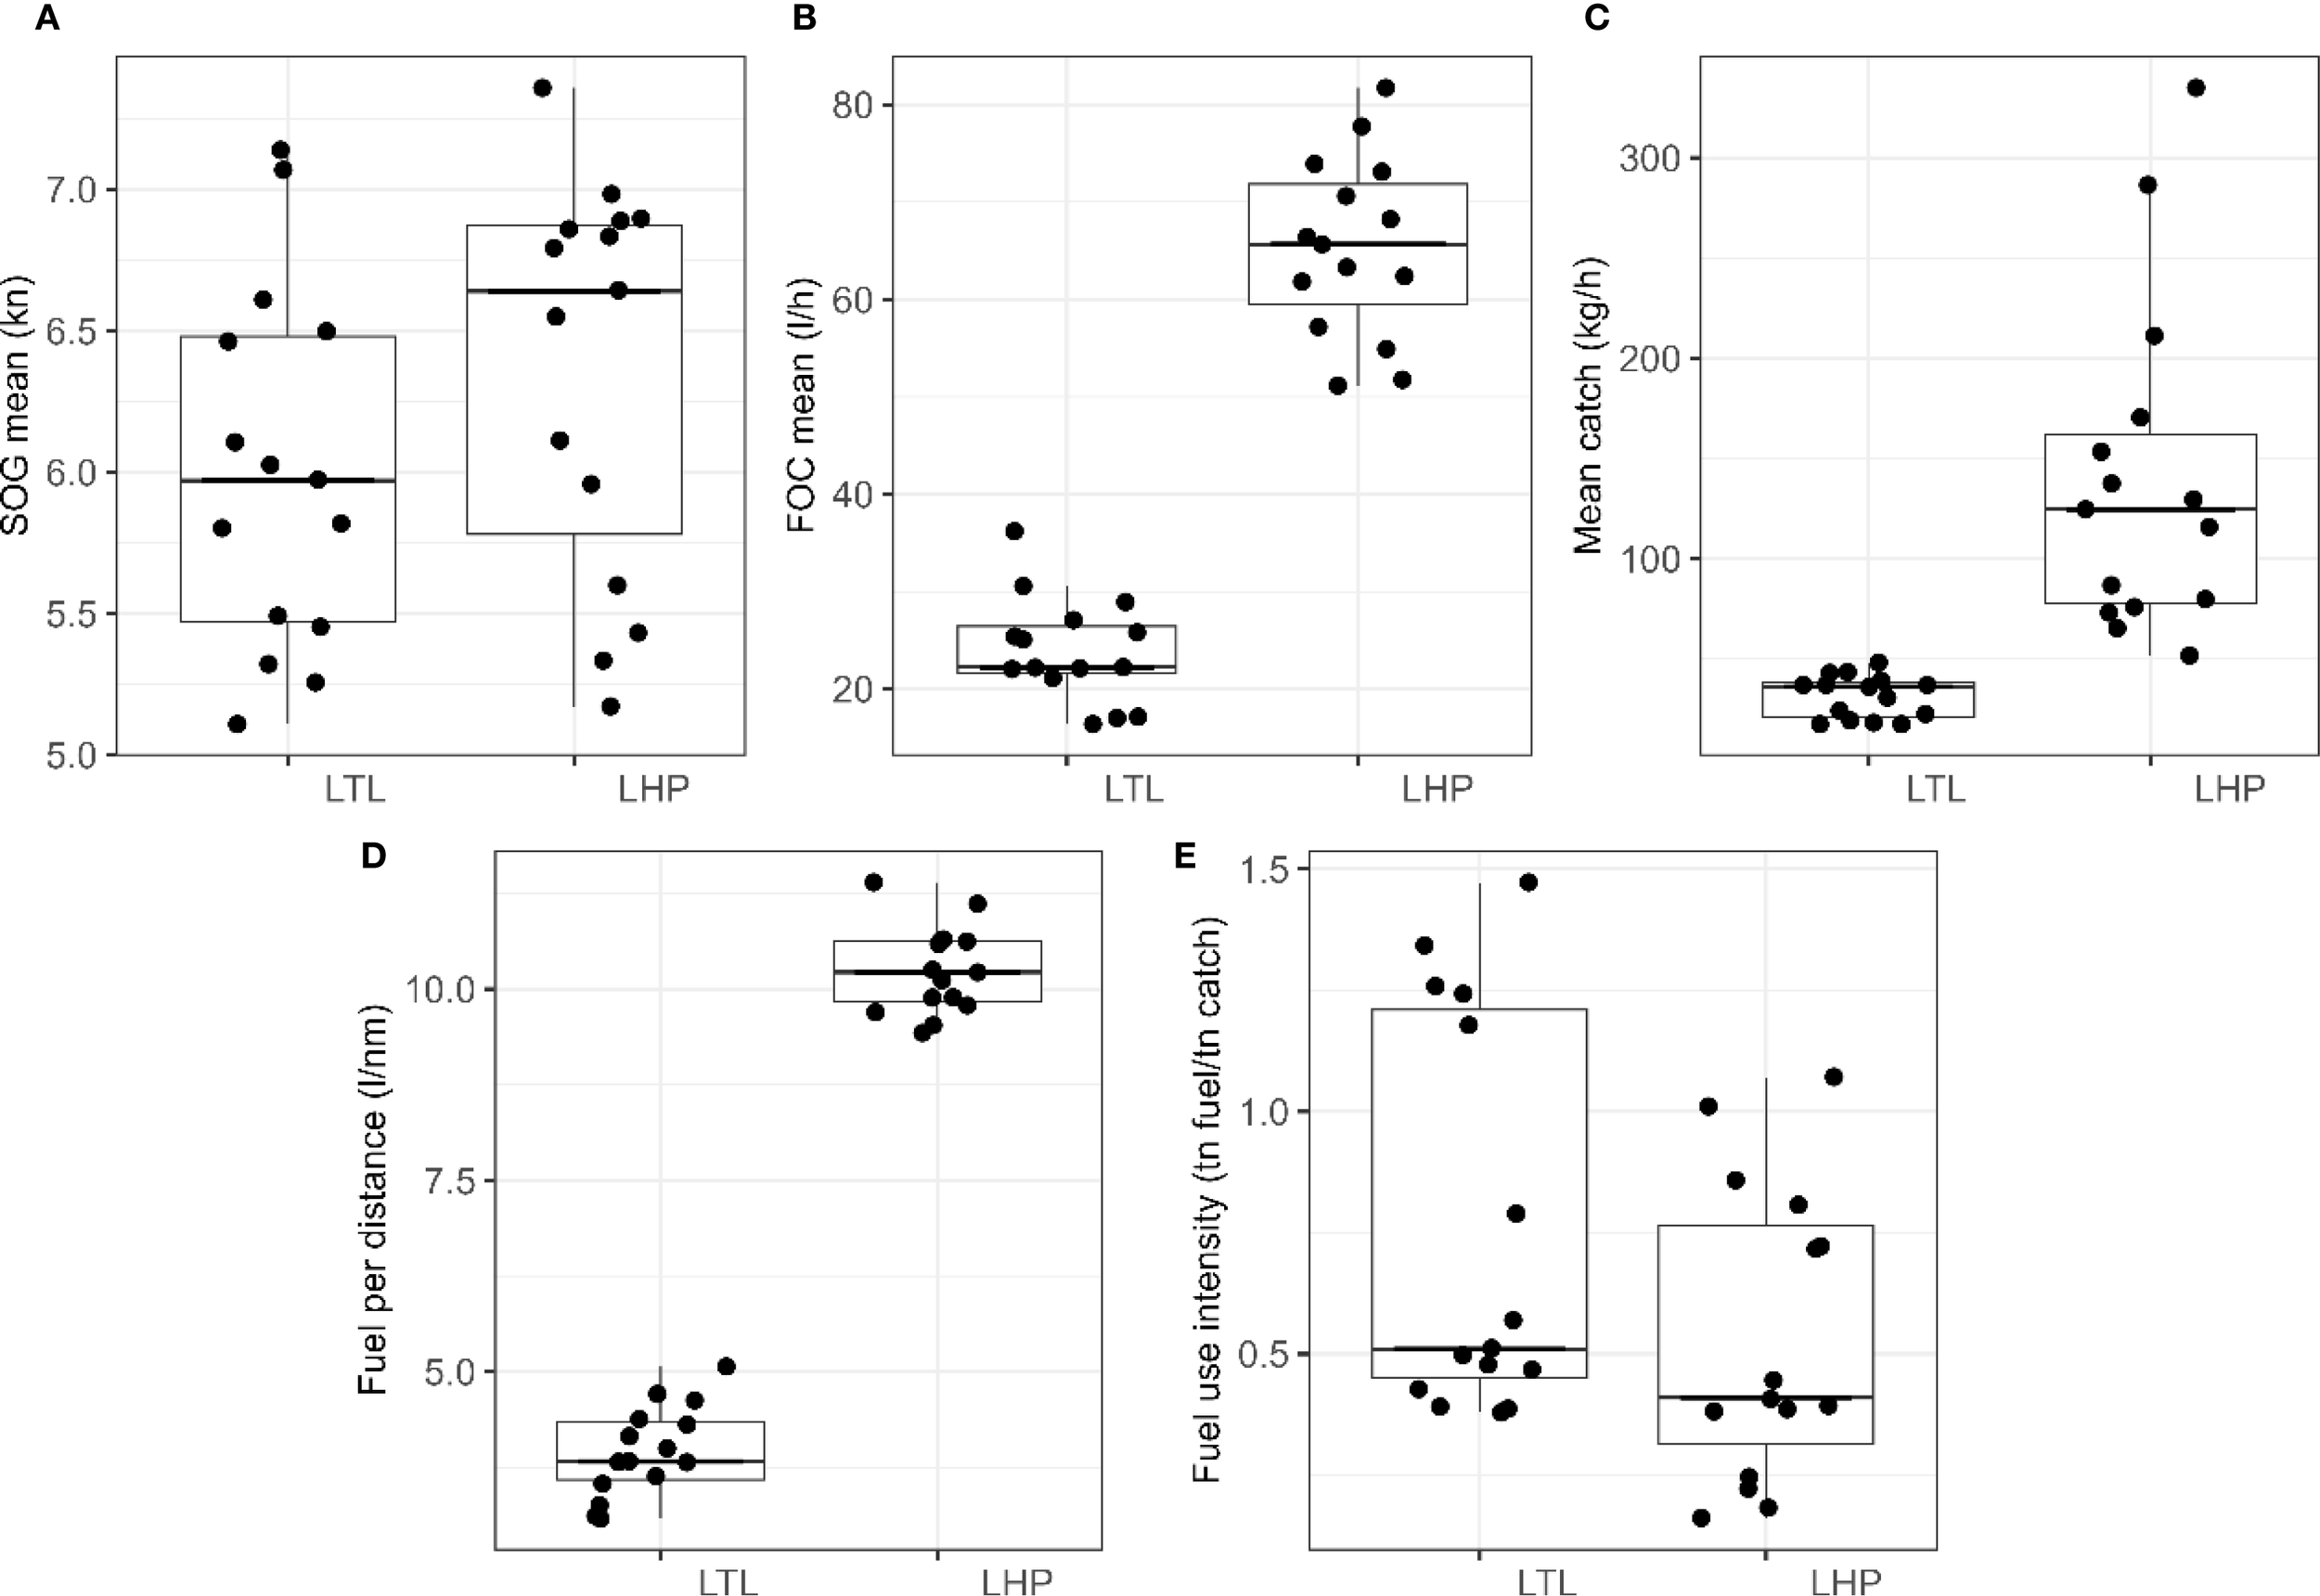
LTL and LHP statistical (mean of all the trips) representation of the operational parameters: SOG (A), FOC (B), Meand catch (C), Fuel persistance (D) and FUI (E).
4 Discussion
4.1 Low-cost monitoring
This study proposes a low-cost monitoring approach to determine the energy-consuming activities, fuel use, and carbon footprint of the LTL and LHP artisanal albacore fishery in the Bay of Biscay.
First, the “fuel consumption versus vessel speed” functions (FOC–SOG curves) were determined by using data acquired with intrusive and non-intrusive systems. Once estimated, these functions, the total time, navigated distance, fuel consumption, and GHG emissions were calculated for five different albacore fishing seasons (2015–2019) in six vessels (three LTL and three LHP fishing vessels).
A recent work has also explored low-cost telematics monitoring for other purposes, such as condition-based maintenance and operational analysis on board fishing vessels (Abrori et al., 2021). Furthermore, some authors have developed different tools and fishing activity assessments through VMS and such type of monitoring system’s data (Birchenough et al., 2021; Galotto-Tebar et al., 2019; Guillot et al., 2017; Zong et al., 2016). Vessel SOG can result in a good proxy to monitor fishing operatives and obtain fuel- and emission-related figures, as shown in this contribution.
Vessel speed is the most influencing parameter in terms of fuel consumption (Górski et al., 2013). Specifically, “the cube law” equation represents the relation between FOC and SOG. The admiralty coefficient relates vessel parameters, such as power or FOC, displacement coefficient, and SOG, and it is described by the Equation 1:
Where, D = vessel’s displacement in tonnes, P = brake power in kW, V = vessel speed in knots (SOG), FOC = mass fuel consumption per hour (kg/h), ϒ = the linear relation between power and FOC, and F = fuel coefficient (C × ϒ) (Taylor, 1996).
Thus, if two vessels are similar in type, such as displacement, power, and speed, then their admiralty coefficient should be similar. Literature suggests that the C value should be between 300 and 600, with higher values indicating greater vessel efficiency (Barrass, 2004). Some authors reaffirm the cubic relation between the power delivered by the propeller and the vessel speed, which we found in this paper (Psaraftis and Lagouvardou, 2023) and presented in Figure 2; Table 3. Thus, the FOC–SOG curves obtained in this study are consistent from a naval engineering perspective.
Therefore, this confirms the suitability of using a low-cost monitoring approach for artisanal fisheries fuel consumption and carbon footprint monitoring purposes. So, the present study considers the SOG of the vessel to assess the fishing activity of LTL and LHP vessels of the Bay of Biscay.
4.2 Fuel use intensity of albacore LTL and LHP fishing vessels compared to other studies
According to the total catch per time spent fishing albacore every year, such as the instantaneous catch (kg/h), the total volume of albacore captured per vessel varied mainly according to vessel type. LTL vessels catch a lower number of tonnes than LHP. Their vessel capacity is considerably lower than LHP’s. LHP can fish more quantity of albacore in a shorter time, very dependent on how aggregated the school of fish is; thus, the variability of total catch is higher than LTL vessels, as shown in Figure 5. Thus, FUI values are slightly higher for LTL vessels, consuming more fuel per catch tonnes than LHP vessels. In addition, LHP vessels present higher variability, between vessels, than LTL vessels (Figure 5). Although LTL has lower fuel consumption in terms of consumption, total catches are lower due to its lower fishing capacity (fewer GTs), which means that fuel use intensity is higher compared to LHP. This study has presented a methodology for estimating the energy demand of a given fishing fleet based on a parameter that can be easily obtained, such as the speed over ground of the vessel, by VMS, AIS, etc. However, a comprehensive study must first be carried out to make consumption estimates based on this parameter. In addition, the study suggests having a larger number of vessels with which to obtain the FOC–SOG ratio.
Up to the present, many authors have assessed the FUI of different fisheries, reaching diverse conclusions depending on each case of study, fishing gear, and region. For hook-and-line skipjack and purse seine fisheries operating in the Atlantic Ocean, some authors recorded a wide range of FUI values ranging from 1,000 to 1,800 in the former and 445 L fuel/t catch in the latter (Parker et al., 2015). Continuing with tuna fisheries, albacore fisheries in the Atlantic Ocean showed different FUI values depending on the fishing method: LTL fisheries have an FUI of 1,107 L fuel/t catch, while LHP fisheries had a higher FUI of 1,485 L fuel/t catch (Tyedmers and Parker, 2012). Bluefin tuna and albacore fisheries in the Atlantic Ocean also show different FUI values depending on the fishing method: LTL fisheries have an FUI of 1,136 L fuel/t catch, while LHP fisheries show a slightly lower FUI of 1,080 L fuel/t catch (Basurko et al., 2022). Without differentiating within target species, the European Observatory of the Blue Economy reported for the Spanish fleet 741.17 L fuel/t catch, with vessels using hooks showing a slightly higher FUI of 870.58 L fuel/t catch. Meanwhile, the FUI of the overall European fleet and European vessels using hooks is 470.58 and 882.35 L fuel/t catch, respectively (EC, 2024). Finally, comparing the extreme variance case apart from other fishing gear, Norwegian coastal purse seiners showed FUI values close to 65 L fuel/t catch (Jafarzadeh et al., 2016).
As a closer comparison to the present study, the studies carried out for albacore species in the Atlantic Ocean with LTL and LHP exceed those obtained in this study by 20%–40% (LTL–LHP). However, in the case of Spanish and European fleets using hooks, the FUI ranges are within the range of the results of the present study.
4.3 Carbon footprint of fisheries
Regarding the carbon footprint of the fisheries, Parker et al. (2018) stated that, in 2011, the Australian fleet had one of the highest carbon emission intensities (5.20 kg CO2eq/kg landed) compared to the US fleet, which had a lower carbon emission intensity (1.6 kg CO2eq/kg landed) (Parker et al., 2018). The numbers obtained in the present study are situated between both, highlighting a relevant difference in terms of the higher value. The same study showed that, in 2011, the mean GHG emissions ratio by sector for big pelagic fisheries (i.e., albacore species > 30 cm, among others) was 1.9 kg CO2eq/kg landed, and by region, for European fisheries, it was 1.7 kg CO2eq/kg landed (Parker et al., 2018). The values obtained in the present study are close to those ratios, particularly for LHP vessels.
The methodology used in this study for the measurement and calculation of fuel consumption of vessels in their real environment, as well as the analysis of their operational pattern, allows us to extend the assessment to the whole albacore LTL and LHP fleets in a feasible way. However, there are other studies that propose a detailed audit with sophisticated measuring equipment, from flow meters to torque meters that give an accurate measurement of consumption (Basurko et al., 2023; Sala et al., 2022). Despite adding accuracy to the data, the results have demonstrated that simulated data can be acceptable if artisanal fisheries are to be monitored or if the devices have to be purchased by the shipowner (<5,000 €), which can be a challenge for artisanal fisheries shipowners (Basurko et al., 2023) in comparison to more industrial fisheries due to the high purchase cost of such accurate measurement devices (>20,000 €). Furthermore, the scope of the number of vessels to be studied would be limited by the high cost of installation and equipment. Thus, low-cost monitoring has better chances to contribute to the decarbonisation studies for artisanal fleets.
5 Conclusions
This study establishes the baseline of fuel consumption and carbon footprint of the fishing vessels that operate during the albacore fishing season in the Bay of Biscay and the northeast Atlantic. The fuel consumption curves set in the present study are applicable to estimate fuel consumption of fishing vessels with similar characteristics of the six studied vessels from 2015 to 2019, with data such as the VMS that may be much easier to acquire than fuel flow meters or other intrusive fuel consumption measuring devices. These curves were used to calculate the FUI and carbon footprint for both fishing gears (LTL and LHP). The following conclusions were drawn:
-
-The fuel consumption calculation curves determined with NIMS were in good agreement with the curves acquired with intrusive fuel consumption acquisition systems. All curves acquired with NIMS and IMS were fitted with cubic functions, which showed high adjustment levels. This sets a valuable reference to calculate approximate fuel consumption in other albacore fishing or similar vessels based on VMS or GPS data, and account for the atmospheric impact of such vessels.
-
-FUI values of 899.2 and 632.6 L/t were obtained for LTL and LHP vessels, respectively. Regarding carbon intensity, 2.45 and 1.72 kg CO2eq/kg landed were obtained for LTL and LHP, respectively. Both FUI and carbon intensity values are in the ranges of values reached in other studies and vary depending on the fishing zone and fishing gear employed. Overall, vessels using trolling lines tend to cover longer distances than vessels using pole and line (specifically in longer trips to the western zones of the Bay of Biscay), even if pole-and-line fishing vessels end up consuming higher amounts of fuel due to their bigger dimensions as well as reaching higher catch levels.
-
-The result of this study opens the possibility of monitoring the entire albacore LTL and LHP fleet of the Bay of Biscay and evaluating this fishery in terms of FUI and carbon footprint in a relatively economic manner. This will facilitate the development of successful energy-saving strategies that are appropriate and unique to each fishing mode and contribute to the decarbonisation of such fishing sector. By monitoring the energy consumption of the vessel or fleet before and after the implementation of any energy-saving strategies, under similar conditions, the effectiveness of the measure can be estimated.
-
-In order to transfer this methodology to other fleets, a study would first have to be carried out on the type of vessel, propulsion system (fixed or variable pitch), type of fishing, and free navigation or tugging, and this study should also determine which parameters are ideal for obtaining fuel consumption estimates. Even in fleets of greater economic magnitude, the most sensible approach would be to install IMS equipment on all vessels and then conduct the study using that instrumentation. This would also make it possible to use AI to obtain analysis models automatically.
Statements
Data availability statement
The original contributions presented in the study are included in the article/supplementary material, further inquiries can be directed to the corresponding author/s.
Author contributions
GG: Conceptualization, Data curation, Formal Analysis, Investigation, Methodology, Supervision, Validation, Writing – original draft, Writing – review & editing. AC: Conceptualization, Formal Analysis, Funding acquisition, Investigation, Project administration, Writing – original draft, Writing – review & editing. NeG: Conceptualization, Data curation, Formal Analysis, Investigation, Writing – original draft, Writing – review & editing. JC: Conceptualization, Data curation, Formal Analysis, Writing – original draft, Writing – review & editing. NiG: Writing – original draft, Writing – review & editing. YS: Writing – original draft, Writing – review & editing. OB: Conceptualization, Investigation, Writing – original draft, Writing – review & editing.
Funding
The author(s) declare financial support was received for the research and/or publication of this article. The work presented in this contribution has been sponsored by 1) the Basque Government by the European Maritime and Fisheries Fund, by fleet digitalization projects in albacore fisheries with the following expedient numbers: 00002-INP2019-33 and 00001-INP2020-33; and 2) the Producer Organization of Gipuzkoa (OPEGUI), by the Ministry of Agriculture, Fisheries and Food, General Secretariat of Fisheries of Spain by fleet digitalization project in Gipuzkoa (DIPEGUI).
Acknowledgments
The authors of this contribution would like to extend their gratitude to the shipowners and skippers of the vessels from Bizkaia and Gipuzkoa (Basque region) involved in this study, highlighting their helpful support. This paper is contribution nº 1285 from AZTI, Marine Research, Basque Research and Technology Alliance (BRTA).
Conflict of interest
The authors declare that the research was conducted in the absence of any commercial or financial relationships that could be construed as a potential conflict of interest.
Generative AI statement
The author(s) declare that no Generative AI was used in the creation of this manuscript.
Any alternative text (alt text) provided alongside figures in this article has been generated by Frontiers with the support of artificial intelligence and reasonable efforts have been made to ensure accuracy, including review by the authors wherever possible. If you identify any issues, please contact us.
Publisher’s note
All claims expressed in this article are solely those of the authors and do not necessarily represent those of their affiliated organizations, or those of the publisher, the editors and the reviewers. Any product that may be evaluated in this article, or claim that may be made by its manufacturer, is not guaranteed or endorsed by the publisher.
References
1
Abrori M. Sidhi S. Prasetyo D. (2021). Modern monitoring instrument to support fishing vessel operation and maintenance: A review. Int. J. Advanced Science Eng. Inf. Technol.11, 2305. doi: 10.18517/ijaseit.11.6.15066
2
Alma-Maris (2023). A pathway to decarbonise the EU fisheries sector by 2050 ( Alma Maris Consulting), 96.
3
Arrizabalaga H. López-Rodas V. Ortiz-de-Zárate V. Costas E. González-Garcés-Santiso A. (2002). Study on the migrations and stock structure of albacore (Thunnus alalunga) from the Atlantic Ocean and the Mediterranean Sea based on conventional tag release-recapture experiences ( Centro Oceanográfico de Vigo).
4
Barrass C. B. (2004). Ship design and performance for masters and mates ( Elsevier Butterworth-Heinemann).
5
Bastardie F. Feary D. A. Brunel T. Kell L. T. Döring R. Metz S. et al . (2022). Ten lessons on the resilience of the EU common fisheries policy towards climate change and fuel efficiency - A call for adaptive, flexible and well-informed fisheries management. Front. Mar. Sci.9. doi: 10.3389/fmars.2022.947150
6
Basurko O. C. Aranda M. Caballero A. Andrés M. Murua J. Gabiña G. (2023). Research for PECH Committee – Workshop on the European Green Deal - Challenges and opportunities for EU fisheries and aquaculture – Part I: Decarbonisation & circular economy aspects for fisheries (Brussels: European Parliament, Policy Department for Structural and Cohesion Policies).
7
Basurko O. C. Gabiña G. Lopez J. Granado I. Murua H. Fernandes J. A. et al . (2022). Fuel consumption of free-swimming school versus FAD strategies in tropical tuna purse seine fishing. Fisheries Res.245, 106139. doi: 10.1016/j.fishres.2021.106139
8
Basurko O. C. Gabiña G. Quincoces I. (2016). “ Fuel consumption monitoring in fishing vessels and its potential for different stakeholders,” in Shipping in Changing Climates Conference. (Newcastle, UK: Newcastle University) 10–12.
9
Basurko O. C. Gabiña G. Uriondo Z. (2013). Energy performance of fishing vessels and potential savings. J. Cleaner Production54, 30–40. doi: 10.1016/j.jclepro.2013.05.024
10
Birchenough S. E. Cooper P. A. Jensen A. C. (2021). Vessel monitoring systems as a tool for mapping fishing effort for a small inshore fishery operating within a marine protected area. Mar. Policy124, 104325. doi: 10.1016/j.marpol.2020.104325
11
Díaz-Secades L. A. (2024). Enhancement of Maritime Sector Decarbonization through the Integration of Fishing Vessels into IMO Energy Efficiency Measures. J. Mar. Sci. Eng.12, 663. doi: 10.3390/jmse12040663
12
Driscoll J. Tyedmers P. (2010). Fuel use and greenhouse gas emission implications of fisheries management: the case of the new england atlantic herring fishery. Mar. Policy34, 353–359. doi: 10.1016/j.marpol.2009.08.005
13
EC . (2024). Fishing fleet fuel analysis european commission, energy, climate change, environment ( EU Blue Economy Observatory).
14
EEA . (2024). European climate risk assessment. European Environment Agency (Luxembourg: Publications Office of the European Union), ISBN: ISBN 978-92-9480-627-7. doi: 10.2800/204249
15
Erauskin-Extramiana M. Arrizabalaga H. Hobday A. J. Cabré A. Ibaibarriaga L. Arregui I. et al . (2019). Large-scale distribution of tuna species in a warming ocean. Global Change Biol.25, 2043–2060. doi: 10.1111/gcb.14630
16
Galotto-Tebar M. Pomares-Padilla A. Czerwinski I. Gutiérrez-Estrada J. C. (2019). Using mobile device’s sensors to identify fishing activity. J. Mar. Sci. Technol.25 (3), 978–989.
17
Górski W. Abramowicz-Gerigk T. Burciu Z. (2013). The influence of ship operational parameters on fuel consumption. Zeszyty Naukowe / Akademia Morska w Szczecinie36, 49–54.
18
Greer K. Zeller D. Woroniak J. Coulter A. Winchester M. Palomares M. D. et al . (2019). Global trends in carbon dioxide (CO2) emissions from fuel combustion in marine fisheries from 1950 to 2016. Mar. Policy107, 103382. doi: 10.1016/j.marpol.2018.12.001
19
Guillot G. Benoit P. Kinalis S. Bastardie F. Bartolino V. (2017). Enhancing and comparing methods for the detection of fishing activity from Vessel Monitoring System data. arXiv preprint arXiv:1708.09663.
20
Henson S. A. Beaulieu C. Ilyina T. John J. G. Long M. Séférian R. et al . (2017). Rapid emergence of climate change in environmental drivers of marine ecosystems. Nat. Commun.8, 14682. doi: 10.1038/ncomms14682
21
Hilborn R. Amoroso R. Collie J. Hiddink J. Kaiser M. Mazor T. et al . (2023). Evaluating the sustainability and environmental impacts of trawling compared to other food production systems. ICES J. Mar. Sci.80, 1567–1579. doi: 10.1093/icesjms/fsad115
22
IMO (2009). Report of the marine environment protection committee on its 59th session.
23
Jafarzadeh S. Ellingsen H. Aanondsen S. A. (2016). Energy efficiency of Norwegian fisheries from 2003 to 2012. J. Cleaner Production112, 3616–3630. doi: 10.1016/j.jclepro.2015.06.114
24
Koričan M. Vladimir N. Fan A. (2023). Investigation of the energy efficiency of fishing vessels: Case study of the fishing fleet in the Adriatic Sea. Ocean Eng.286, 115734. doi: 10.1016/j.oceaneng.2023.115734
25
Notti E. Sala A. (2014). Information collection in energy efficiency for fisheries (ICEEF-3) (Ancona: European Commission, Joint Research Centre).
26
Parker R. W. R. Blanchard J. L. Gardner C. Green B. S. Hartmann K. Tyedmers P. H. et al . (2018). Fuel use and greenhouse gas emissions of world fisheries. Nat. Climate Change8, 333–337. doi: 10.1038/s41558-018-0117-x
27
Parker R. W. Tyedmers P. H. (2015). Fuel consumption of global fishing fleets: current understanding and knowledge gaps. Fish Fisheries16, 684–696. doi: 10.1111/faf.12087
28
Parker R. W. R. Vázquez-Rowe I. Tyedmers P. H. (2015). Fuel performance and carbon footprint of the global purse seine tuna fleet. J. Cleaner Production103, 517–524. doi: 10.1016/j.jclepro.2014.05.017
29
Popescu I. Breuer M. (2024). Research for PECH committee: Handbook of fishing gears used by the EU fleet. Available online at: https://www.europarl.europa.eu/RegData/etudes/STUD/2024/759320/IPOL_STU(2024)759320_EN.pdf.
30
Prellezo R. Sabatella E. Virtanen J. Guillen Garcia J. (2022). Scientific, technical and economic committee for fisheries (STECF) - the 2022 annual economic report on the EU fishing fleet (STECF 22-06). EUR 28359 (Luxembourg: Publications Office of the European Union), ISBN: ISBN 978-92-76-56541-3. doi: 10.2760/120462
31
Psaraftis H. N. Lagouvardou S. (2023). Ship speed vs power or fuel consumption: Are laws of physics still valid? Regression analysis pitfalls and misguided policy implications. Cleaner Logistics Supply Chain7, 100111. doi: 10.1016/j.clscn.2023.100111
32
Roy A. Chakraborty M. (2025). A review of ship emissions impacts on environmental, health, societal impacts and IMO's mitigation policies. Regional Stud. Mar. Sci.81, 103964. doi: 10.1016/j.rsma.2024.103964
33
Sala A. Damalas D. Labanchi L. Martinsohn J. Moro F. Sabatella R. et al . (2022). Energy audit and carbon footprint in trawl fisheries. Sci. Data9, 428. doi: 10.1038/s41597-022-01478-0
34
Schau E. M. Ellingsen H. Endal A. Aanondsen S. A. (2009). Energy consumption in the Norwegian fisheries. J. Cleaner Production17, 325–334. doi: 10.1016/j.jclepro.2008.08.015
35
Suuronen P. Chopin F. Glass C. Løkkeborg S. Matsushita Y. Queirolo D. et al . (2012). Low impact and fuel efficient fishing—Looking beyond the horizon. Fisheries Res.119-120, 135–146. doi: 10.1016/j.fishres.2011.12.009
36
Taylor D. A. (1996). Introduction to marine engineering ( Elsevier Butterworth-Heinemann).
37
Tyedmers P. Parker R. (2012). Fuel consumption and greenhouse emissions from global tuna fisheries, A preliminary assessment, ISSF Technical Report 2012-03.
38
UNCTAD (2024). Energy transition: Charting a fair course for fishing fleets ( Development, U.T).
39
Worm B. Lotze H. K. (2021). “ Chapter 21 - Marine biodiversity and climate change,” in Climate change, 3rd ed. Ed. LetcherT. M. ( Elsevier), 445–464. doi: 10.1016/B978-0-12-821575-3.00021-9
40
Yang D. Li X. Zhang L. (2024). A novel vessel trajectory feature engineering for fishing vessel behavior identification. Ocean Eng.310, 118677. doi: 10.1016/j.oceaneng.2024.118677
41
Zong Y. Huang H. Hong F. Zhen Y. Guo Z. (2016). Recognizing fishing activities via VMS trace analysis based on Mathematical Morphology ( 2016 Techno-Ocean (Techno-Ocean), 465–470.
Summary
Keywords
energy monitoring, fisheries decarbonisation, fuel use intensity, carbon footprint, Bay of Biscay
Citation
Gabiña G, Caballero A, Goikoetxea N, Castresana J, Goñi N, Sagarminaga Y and Basurko OC (2025) Energy-consumption monitoring towards decarbonisation: insights from the Basque albacore artisanal fisheries. Front. Mar. Sci. 12:1663538. doi: 10.3389/fmars.2025.1663538
Received
13 July 2025
Accepted
15 September 2025
Published
13 October 2025
Volume
12 - 2025
Edited by
Francois Bastardie, Technical University of Denmark, Denmark
Reviewed by
Emilio Notti, National Research Council (CNR), Italy; Nikola Vladimir, University of Zagreb, Croatia
Updates
Copyright
© 2025 Gabiña, Caballero, Goikoetxea, Castresana, Goñi, Sagarminaga and Basurko.
This is an open-access article distributed under the terms of the Creative Commons Attribution License (CC BY). The use, distribution or reproduction in other forums is permitted, provided the original author(s) and the copyright owner(s) are credited and that the original publication in this journal is cited, in accordance with accepted academic practice. No use, distribution or reproduction is permitted which does not comply with these terms.
*Correspondence: Gorka Gabiña, ggabina@azti.es
† Present address: Nicolas Goñi, LUKE, Natural Resources Institute Finland, Turku, Finland
ORCID: Nicolas Goñi, orcid.org/0000-0001-6562-0727
Disclaimer
All claims expressed in this article are solely those of the authors and do not necessarily represent those of their affiliated organizations, or those of the publisher, the editors and the reviewers. Any product that may be evaluated in this article or claim that may be made by its manufacturer is not guaranteed or endorsed by the publisher.