Abstract
Understanding the ecology and population dynamics of Arctic appendicularians is increasingly important as oceanographic and climatic conditions continue to change in the high polar systems. Here, the adoption of sediment traps allowed for efficient fixation and preservation of their soft bodies, and validated a representative point sampling for these species regarding their patchy distribution. This study investigates the temporal distribution, phenological rhythms and oceanographic drivers affecting two appendicularian species, Oikopleura (Vexillaria) vanhoeffeni and Fritillaria borealis in Kongsfjorden (Svalbard), a high-Arctic fjord occasionally influenced by Atlantic Water (AW) intrusions and variable sea ice conditions. Based on a time-series of sediment trap samples from 2010 to 2023, O. vanhoeffeni was consistently present and increased in occurrences after 2016. F. borealis, was not detected until 2017, appeared episodically, likely as a non-resident species seasonally introduced into the fjord. Temporal succession of the two species appeared to be influenced by the combination of (i) seasonal variability of thermohaline conditions, (ii) glacial meltwater influencing water mass structure, and (iii) turbidity fluctuations from marine and continental inputs. Oikopleura vanhoeffeni exhibited a well-defined annual cycle with juveniles appearing in autumn (post-reproductive phase), growing through winter-spring, and maturing into reproductive adults by summer. Growth during the polar night was primarily influenced by hydrological conditions, whereas food availability became more important in summer. In contrast, F. borealis showed a peak of adults in spring-summer and juveniles in autumn-winter, indicating a reproductive phase following the spring phytoplankton bloom. These findings contribute to understanding the ecology and population dynamics of Arctic appendicularians under shifting oceanographic and climatic conditions, emphasizing their potential role as sentinel species in a rapidly changing polar environment.
1 Introduction
Appendicularia, also known as “larvaceans”, are ubiquitous, solitary and free-swimming pelagic tunicates distributed in estuarine, neritic and oceanic waters (Shiga, 1993a; Lindsay and Williams, 2010; Kalarus and Panasiuk, 2021; Volkov, 2022). These organisms live within gelatinous houses used for filtering water and retaining a wide range of particles, from colloids to large phytoplankton cells (Deibel, 1988; Urban et al., 1992; Acuña et al., 2002; Brena et al., 2003; Capitanio et al., 2018; Giménez et al., 2023; Deja, 2025). Almost all larvaceans are protandrous hermaphrodites with a short generation time and a single reproductive event through their life span (Shiga, 1976; Aguirre et al., 2006; Choe and Deibel, 2011; Capitanio et al., 2018). They are important components (1.6% of the total abundance) of the polar zooplankton communities (Tsujimoto et al., 2006; Maekakuchi et al., 2018), acting as food sources for key predators such as cods, seabirds, and marine mammals (Eisner et al., 2014; Volkov, 2022). Moreover, they actively support deep-sea communities through the vertical transport of materials, composed of fecal pellets and their abandoned houses (Choe and Deibel, 2008; Lindsay and Williams, 2010; Maekakuchi et al., 2018; Pettitt-Wade et al., 2020; Panasiuk and Kalarus, 2021; Volkov, 2022; Jaspers et al., 2023). Under favorable conditions, they can produce extensive aggregations and it is expected that their occurrence will increase as a consequence of climate change, including in the Arctic Ocean (Pettitt-Wade et al., 2020; Pantiukhin et al., 2024a). Thus, their ability to respond quickly to environmental fluctuations makes them valuable indicators of ecosystem shifts, especially in rapidly changing and challenging Arctic environments (Hopcroft, 2005; Brotz et al., 2012; Panasiuk and Kalarus, 2021).
The Svalbard archipelago represents a key observation area of the Arctic for understanding the ecological responses of planktic organisms to climate-driven transformations. Fjord systems in this region, particularly Kongsfjorden, have emerged as climate hotspots due to accelerated warming trends that exceed the global average by more than fourfold, leading to significant sea ice retreat, increased glacial meltwater input and altered hydrographic conditions (D’Angelo et al., 2018; IPCC, 2019; De Rovere et al., 2022; Rantanen et al., 2022; Pantiukhin et al., 2024a). Additionally, the climate-related process of Atlantification, characterized by increasing volumes of salt and heat associated with Atlantic Water (AW) intrusions, has emerged as a critical driver of environmental changes in the last decades (Tesi et al., 2021; De Rovere et al., 2022, 2024; Hop et al., 2023). The resulting expansion of open water areas, enhanced terrestrial runoff, and shifts in phytoplankton composition are creating conditions that particularly benefit filter-feeding appendicularians (Spinelli et al., 2009; Franco et al., 2014; Deibel et al., 2017; D’Angelo et al., 2018, 2024; Panasiuk and Kalarus, 2021; Jaspers et al., 2023; Pantiukhin et al., 2024a, b).
Despite their ecological relevance and predicted increase under future scenarios, knowledge on Arctic appendicularians remain scarce due to their patchy distribution and delicate bodies that complicate sampling efficiency, preservation and identification (Swanberg and Båmstedt, 1991; Hopcroft, 2005; Brotz et al., 2012). In addition, the strong seasonal and hydrological gradients in these regions affect their occurrences and the lack of long-term series of data make the identification of consistent ecological trends challenging (Kalarus and Panasiuk, 2021; Panasiuk and Kalarus, 2021; Zaldua-Mendizabal et al., 2021; Pantiukhin et al., 2024a, b).
The present study analyzes a long-term dataset (2010-2023) of Arctic larvaceans collected using an automatic sediment trap moored in the inner Kongsfjorden, Svalbard Islands. Even with its own limitations (Weydmann-Zwolicka et al., 2021), this collection methodology is considered valid and offers a practical solution for studying fragile gelatinous species, providing a reliable estimation of their distribution and abundance in challenging environments where traditional net sampling methods may be inefficient (Gislason and Astthorsson, 1992; Seiler and Brandt, 1997; Makabe et al., 2016; Atherden et al., 2024). Moreover, time-series of sediment trap samples give valuable insights into the influence of AW advection on Arctic zooplankton communities during polar nights (Willis et al., 2008; D’Angelo et al., 2024) and represent continuous measurements in logistically challenging regions.
In this study we test whether the temporal patterns of larvaceans in Kongsfjorden are shaped by hydrological variability, including water mass composition and variability, sea ice occurrence and fluctuations in turbidity. Then, we test the hypothesis that the population structure of larvaceans reflects phenological rhythms driven by the same oceanographic drivers – hydrography, sea ice presence and turbidity – highlighting their role in shaping the maturity stage distribution over time. By testing these hypotheses, this study contributes to filling a key knowledge gap on the role of larvaceans in Arctic marine ecosystems and their potential as sensitive sentinels of climate-driven change in high-latitude marine habitats.
2 Study area
The study was conducted in Kongsfjorden, located on the eastern side of the Fram Strait, in the Svalbard archipelago (Figure 1A). This region is influenced by two main currents: (i) the West Spitsbergen Current (WSC, Figure 1B), which transports AW with significant seasonal and interannual variability (Chatterjee et al., 2018; Muilwijk et al., 2018; Raj et al., 2018; Wang et al., 2020; Bensi et al., 2025), and (ii) the Spitsbergen Polar Current (SPC, Figure 1B), derived from the East Spitsbergen Current (ESC, Figure 1B), which carries Arctic Waters (ArW) (Nilsen et al., 2021; Bensi et al., 2025) and sea ice (Tverberg et al., 2019) along the West Spitsbergen Shelf. Over recent decades, AW intrusions into Kongsfjorden have become more frequent, causing temperature and salinity anomalies, particularly during winter, driven by wind reversal events and preconditioning factors (Skogseth et al., 2020; De Rovere et al., 2022). The water mass dynamics in Kongsfjorden (Figure 1C) are influenced by the interaction between the SPC and WSC, glacial meltwaters and river discharge, sea ice processes and local atmospheric circulation (Stigebrandt, 2012; Cottier et al., 2007; De Rovere et al., 2024, De Rovere et al., 2025).
Figure 1
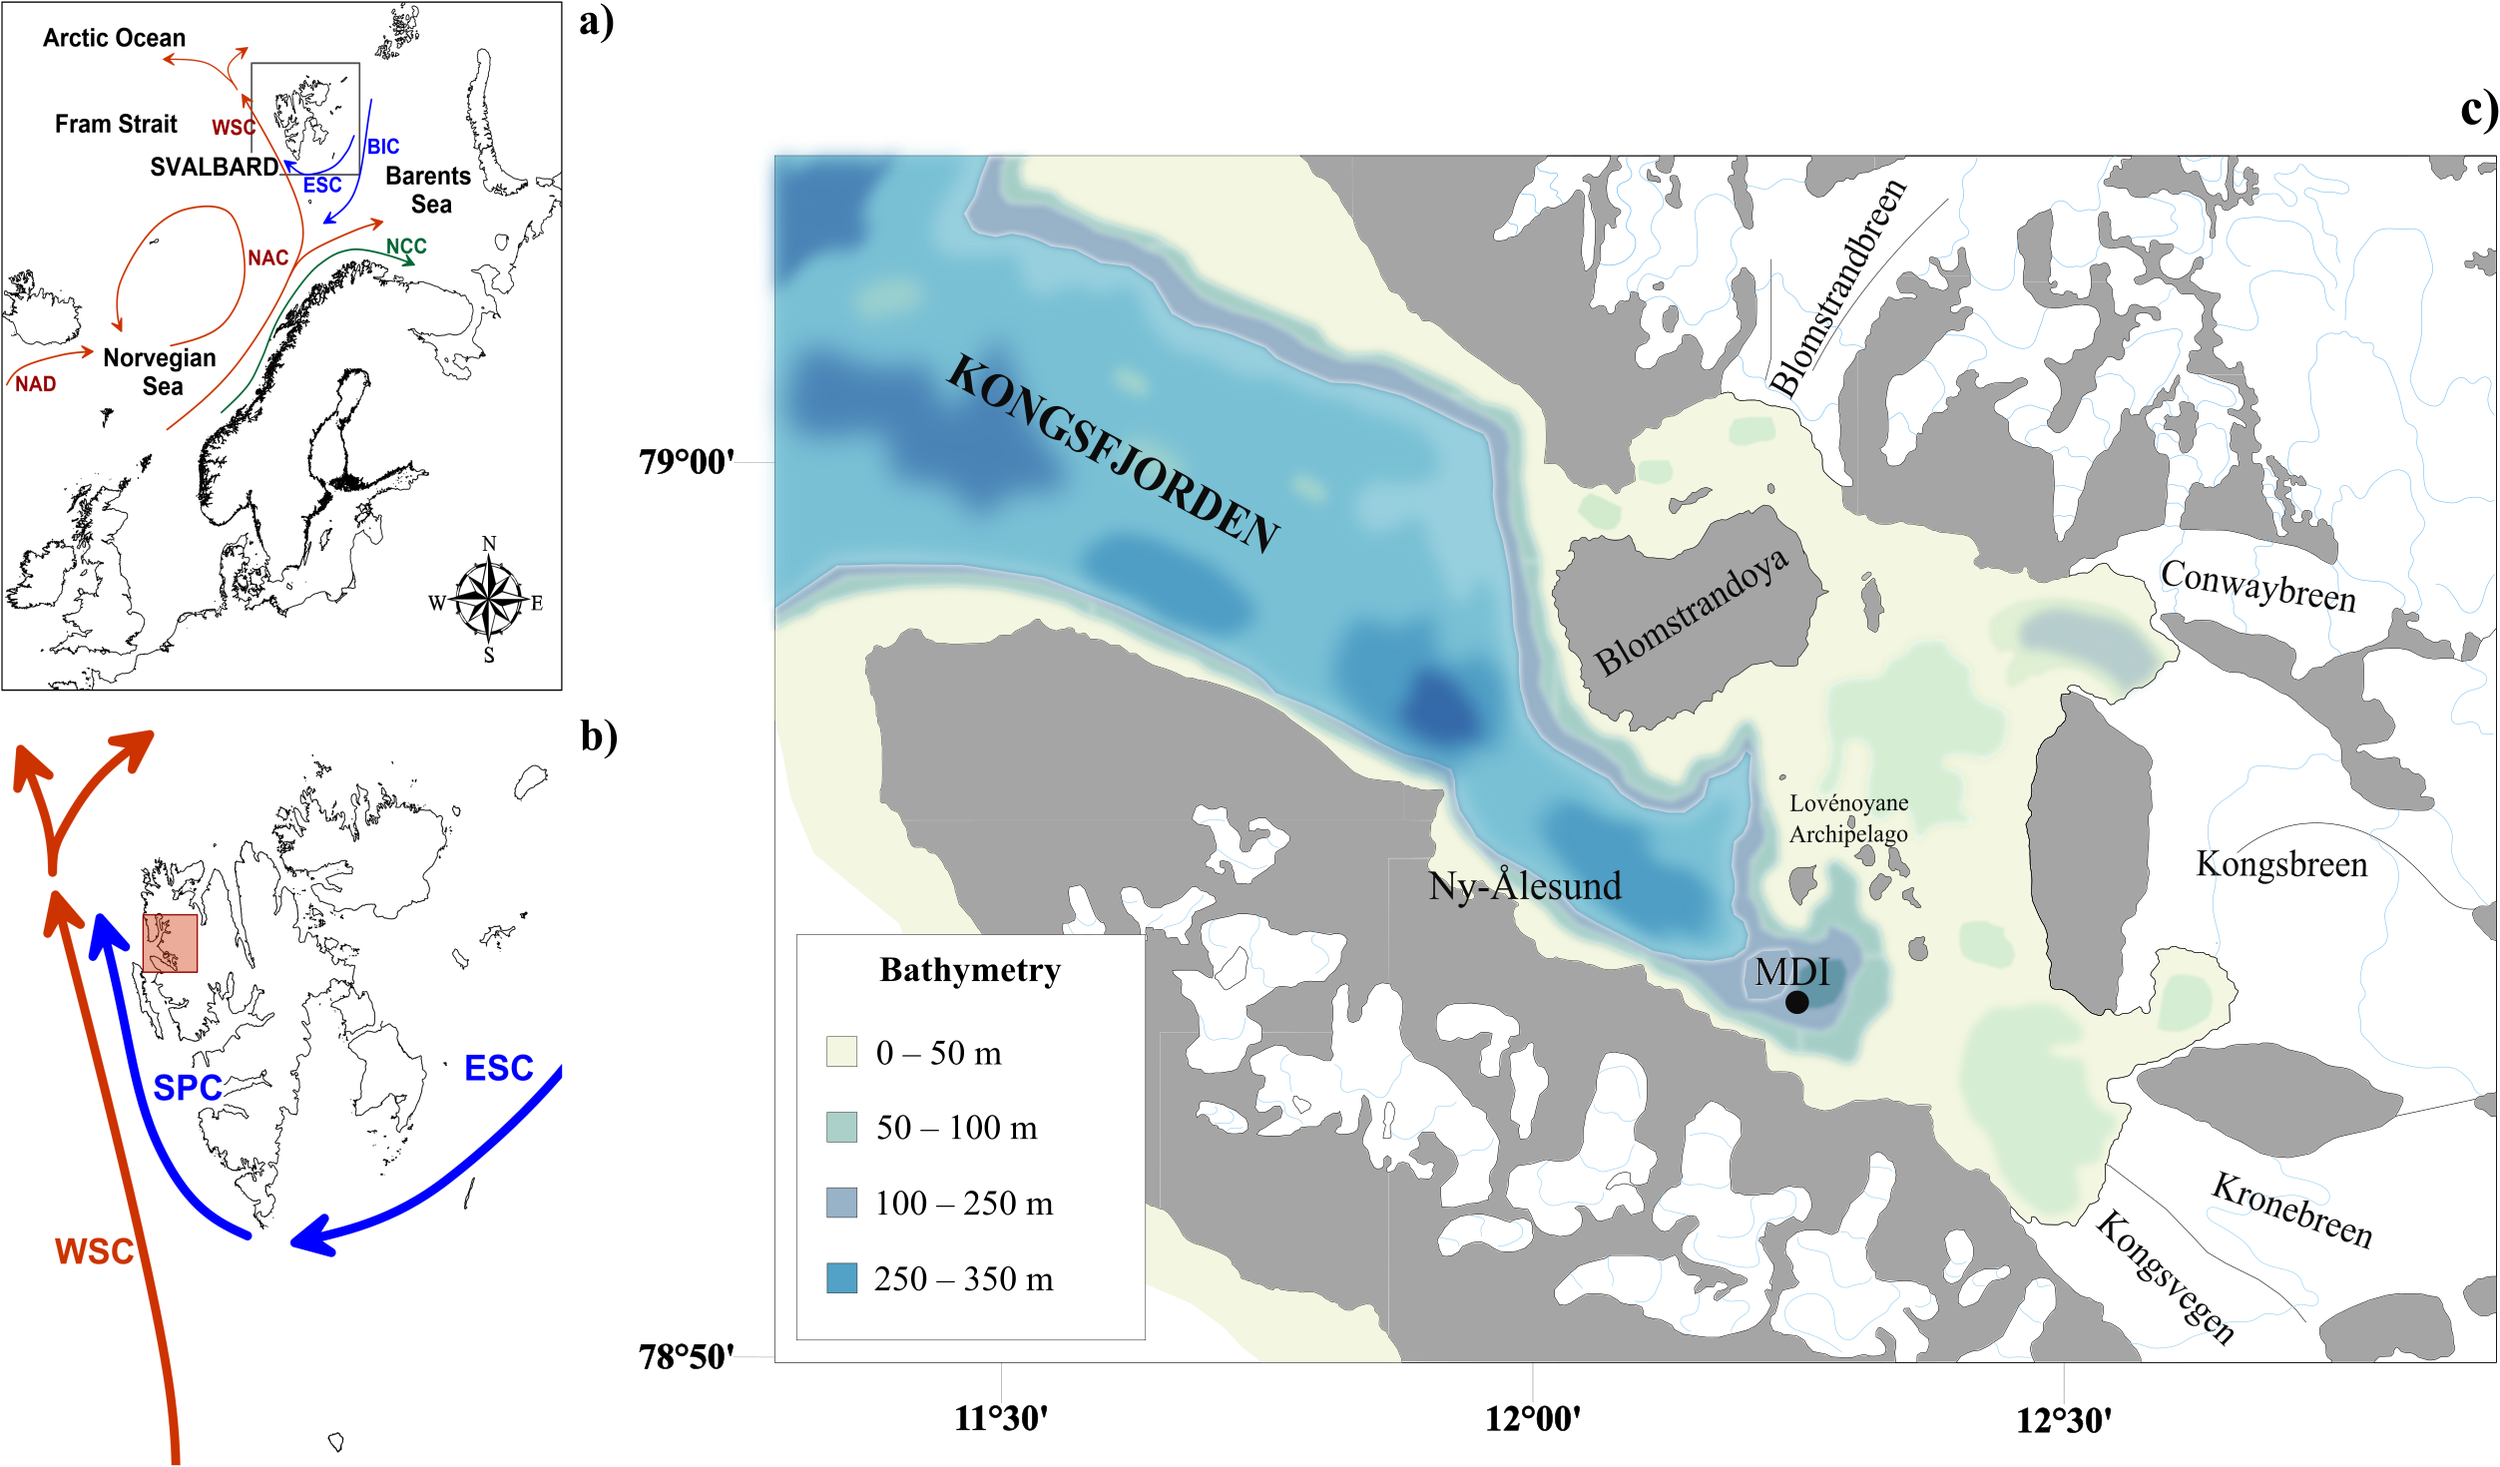
(A) Location of the Svalbard Islands within the Arctic Ocean, highlighting the major ocean current circulations. (B) Svalbard Archipelago with the location of Kongsfjorden (red square) on the northwestern coast of the main island (Spitsbergen) and the dominant oceanic currents in the area. Acronyms are explained as follows: BIC, Bear Island Current; ESC, East Spitsbergen Current; NAC, North Atlantic Current; NAD, North Atlantic Drift; SPC, South Polar Current; WSC, West Spitsbergen Current. (C) Kongsfjorden map with bathymetry, location of Mooring “Dirigibile Italia” (MDI) and the village of Ny-Ålesund.
Different water masses occupy the fjord seasonally, with cold and relatively low-salinity waters appearing during the cold months while warm and salty waters occupy the fjord during the warm ones (Svendsen et al., 2002; Cottier et al., 2005, 2010, De Rovere et al., 2022). In this study, we adopted the water mass classification from De Rovere et al. (2022), considering: (i) cold and low-saline Arctic Waters (ArW), (ii) warm and saline Atlantic waters (AW), (iii) mixed waters (IW and TAW) derived from interactions between ArW and AW, and (iv) water masses derived from local glacial melting (LW and SW). In fact, the innermost part of the Kongsfjord is influenced by the presence of three tidewater glaciers (Conwaybreen, Kongsvegen, Kronebreen, Figure 1B).
Since 2010, the mooring “Dirigibile Italia” (MDI) is deployed at 78°54.815 N, 12°14.899 E (Figure 1A) at 100 m depth, and managed by the National Research Council, Institute of Polar Sciences (CNR-ISP), efficiently maintained in vertical position by the buoyancy system (Aliani et al., 2016; D’Angelo et al., 2018; De Rovere et al., 2022, 2024). The mooring was deployed in the inner part of Kongsfjorden, where currents are extremely low throughout the year (average 4.4 cm s-¹, as reported by D’Angelo et al., 2018), The MDI is equipped with several automatic sensors mounted along the mooring chain acquiring oceanographic and biological data and samples at different water depths. Two multiparametric probes (SBE16 plus) mounted at 30 and 90 m depths record thermohaline properties and turbidity of the water column whereas the sediment trap is positioned at 87 m depth.
3 Methods
3.1 Oceanographic data
The sampling interval of the two multiparametric probes varied from 3 hours for the measurements at 30 m and 30 minutes for those at 90 m depth. The higher number of oceanographic sensors at 30 m required a broader sampling temporal resolution to allow for a full annual cycle of data acquisition. Sampling intervals changed through the long-term record due to technical failures of sensors (SI1). In order to extend the observations, we have also used the data collected from the AWIPEV underwater cabled observatory from the year 2016 (temporal resolution of 1 hour) located in 12 m water depth (Fischer et al., 2018, 2019, 2021, 2022, 2024). This dataset is useful to extend the observation of the physical processes in another site inside the Kongsfjord near the MDI mooring (approximately 6 km west) at shallower depth (12 m). The type of water mass present during the opening intervals of the sediment traps at the two different depths is determined based on thermohaline records. The frequency of water masses occupying the fjord was calculated from the number of events counted in each sampling interval of the sediment trap.
Moreover, the mean values of turbidity, salinity, and temperature are calculated for each trap opening interval. Data recorded from the SBE16 plus data at 30 and 90 m are managed following FAIR principles and are freely available at the Italian Arctic Data Center (Paladini et al., 2024a; Paladini et al., 2024b).
The presence of sea ice in the area was visually interpreted from satellite imagery (Skogseth et al., 2020) and photographic records (Gerland et al., 2022) to qualitatively assess bay openness. For this study, we adopted a simplified binary scheme using the two end-member categories - open water (value = 0) and sea ice presence (value = 1) - to derive a general coverage index for the MDI site. The choice of a binary code was related to the impossibility of extrapolating continuous and qualitative values for sea ice coverage from photographic and satellite datasets.
3.2 Larvacean sampling and data processing
Sinking particles and zooplankton were collected from 11 September 2010 to 16 June 2023 using an automated Technicap sediment trap (model PPS4/3, 12–24 cups, 0.05 m2 collecting area, ongoing activity) tethered at 87 m water depth. The cups were pre-filled with a buffered solution of 5% formaldehyde to better preserve the organic matter and the rotation intervals varied during the years between 7 days to 3 months (SI1). The sampling resolution varied across years due to technical failures. The mooring has been serviced annually to replace the sampling cups and carry out regular maintenance of the instrumentation.
Sediment trap samples were processed at the CNR-ISP in Bologna, Italy. Following Chiarini et al. (2013), samples were rinsed with prefiltered Arctic seawater through a 500 µm sieve to separate sinking particles from larger swimmers. The retained fraction on the sieve was manually inspected under a ZEISS Discovery V8 stereomicroscope, and all swimmers were picked, identified, and counted (Giordano et al., 2025). In addition, the material that passed through the 500 µm sieve was briefly examined under the microscope to recover any smaller swimmers that had escaped the mesh, which were subsequently reintegrated into the sample. This protocol ensured that 100% of the swimmers collected in each cup over the sampling interval were accounted for.
Larvaceans were recognized and classified according to the World Register of Marine Species (WoRMS, https://www.marinespecies.org). The total abundances were standardized with sediment trap collecting areas (m2) and trap opening intervals (d), being expressed as flux:
Photos of each specimen were taken to obtain morphometric data related to trunk and tail lengths and widths. Then, average values of morphometric data were calculated for each season in order to quantify and describe the life stage composition and phenological cycles for both species. Life stages (juvenile and adult) were assessed based on gonadal development and overall body size, following published references (Deibel et al., 1992; Shiga, 1993b; Presta et al., 2015). Phenological rhythms were characterized across the four seasons: winter (December-January-February, DJF), spring (March-April-May, MAM), summer (June-July-August, JJA) and autumn (September-October-November, SON).
3.3 Statistics
We adopted a multivariate statistics approach to analyze temporal variations of larvacean fluxes using R software. A matrix of similarities was calculated from the fluxes estimating the Bray-Curtis index, then we ran PERMANOVA to test differences in larvacean fluxes throughout the long-term series. A Pearson correlation test between species fluxes was performed and the intensity of the relationship followed the scale of Giménez et al. (2023), adopting a level of significance threshold (p) was set p<0.05.
The relationship between larvacean fluxes and environmental variables (i.e., water temperature and salinity at 30 m and 90 m depths, sea ice presence) was tested with a Generalized-Additive Model (GAM) using the package “mgcv”. To address over distribution in the data, different distributions were selected: a Quasi-Poisson family for Oikopleuridae, and a negative binomial family for Fritillaridae. The choice of regression families was driven by distributional characteristics of species-specific flux data. For Oikopleuridae, the Quasi-Poisson regression was appropriate as it accounted well for moderate overdispersion in the data. In contrast, Fritillaridae flux data exhibited a higher degree of overdispersion, consequently a Negative Binomial regression was preferred to better model the variance structure and provide more reliable estimates. The attempted use of Quasi-Poisson regression for Fritillaridae flux resulted in poor model fit, justifying the adoption of the Negative Binomial distribution family.
Sea ice presence was included in the model as a binary categorical variable and treated as a parametric term. Therefore, its influence on larvacean fluxes was interpreted relative to the intercept, which represents the logarithm of the expected average flux (µ) under ice-free conditions. Summarizing, the GAM model equation will be defined as:
where log(µ) is the logarithmic average of larvacean flux distribution (µ), ß0 is the intercept, ß1 is the linear effect of sea ice presence, s(iTEMP) and s(iSAL) are the predicted effects of temperature and salinity at 30 m depth and, similarly, s(bTEMP) and s(bSAL) for continuous temperature and salinity data at 90 m depth.
To better interpret the model, it is useful to understand the behavior of Equation 1.1 under different conditions of sea ice. In ice-free conditions, the sea ice term is ß1 = 0, therefore the expected larvacean flux (µ) depends only on hydrological conditions at different depths.
In ice-covered conditions, the sea ice effect becomes active and expressed by the term ß1≠0, manifesting an additive effect on the expected larvacean flux (Equation 1.1). A cross-correlation analysis was conducted to examine the role of turbidity in driving species occurrences, with the aim of identifying potential lag-intervals between highest turbidity levels and appendicularian peaks.
Biometric analyses were conducted exclusively on well-preserved and complete specimens. Given the high variability in the data, the non-parametric Kruskall-Wallis test was applied to assess seasonal and inter-annual variations in trunk and tail lengths, using a significance threshold of p<0.05. When significant differences were detected, Dunn’s post-hoc test was performed to identify specific pairwise comparisons. Finally, Equations 1.1 and (1.2) were adapted to investigate the relationship between larvacean body size and hydrological variables under different sea ice conditions. In this case, as data overdispersion was less pronounced, we adopted a Quasi-Poisson family distribution for both Oikopleuridae and Fritillaridae biometric traits.
4 Results
4.1 Hydrography and water mass characterization
CTD data collected at both 30 m (iTEMP and iSAL, from May 29, 2016) and 90 m (bTEMP and bSAL, since September 2010) confirmed the high seasonal variability described by previous works (Cottier et al., 2005, 2010; De Rovere et al., 2022, 2024).
The iTEMP ranged from –1.70 ± 3.29 °C during the coldest period (January–April 2020) to 6.72 ± 0.28 °C in the warmest period (15–31 August, 2022), while iSAL varied between 33.1 and 34.9, with the lowest value recorded between September 9 and 15, 2021, and the highest in April 2017. Similarly, bTEMP showed a minimum of –1.64 ± 0.12 °C in February 2011 and a maximum of 5.51 ± 0.22 °C in October 2017, with salinity fluctuating between 33.78 ± 0.02 (August 27 and September 4, 2013) and 35.05 ± 0.02 (May 26 to June 16, 2016).
The characterization of water masses at 30 m depth (Figure 2B) revealed a cyclic pattern, with Surface Water (SW) dominating during the summer-autumn period (June-November) and ArW prevailing in winter-spring (December-May). However, sporadic incursions of AW were observed in the summer months, particularly between June and September 2017 (Figure 2B). To compensate for sampling gaps at 30 m, we incorporated CTD and turbidity data collected by the AWIPEV station near the fjord mouth, at 12 m depth (Figure 2A). The comparison revealed a strong correspondence between water mass types and turbidity at both 12 m and 30 m depths. Therefore, we consider the CTD data collected at 30 m representative of surface water mass characteristics in inner Kongsfjorden.
Figure 2
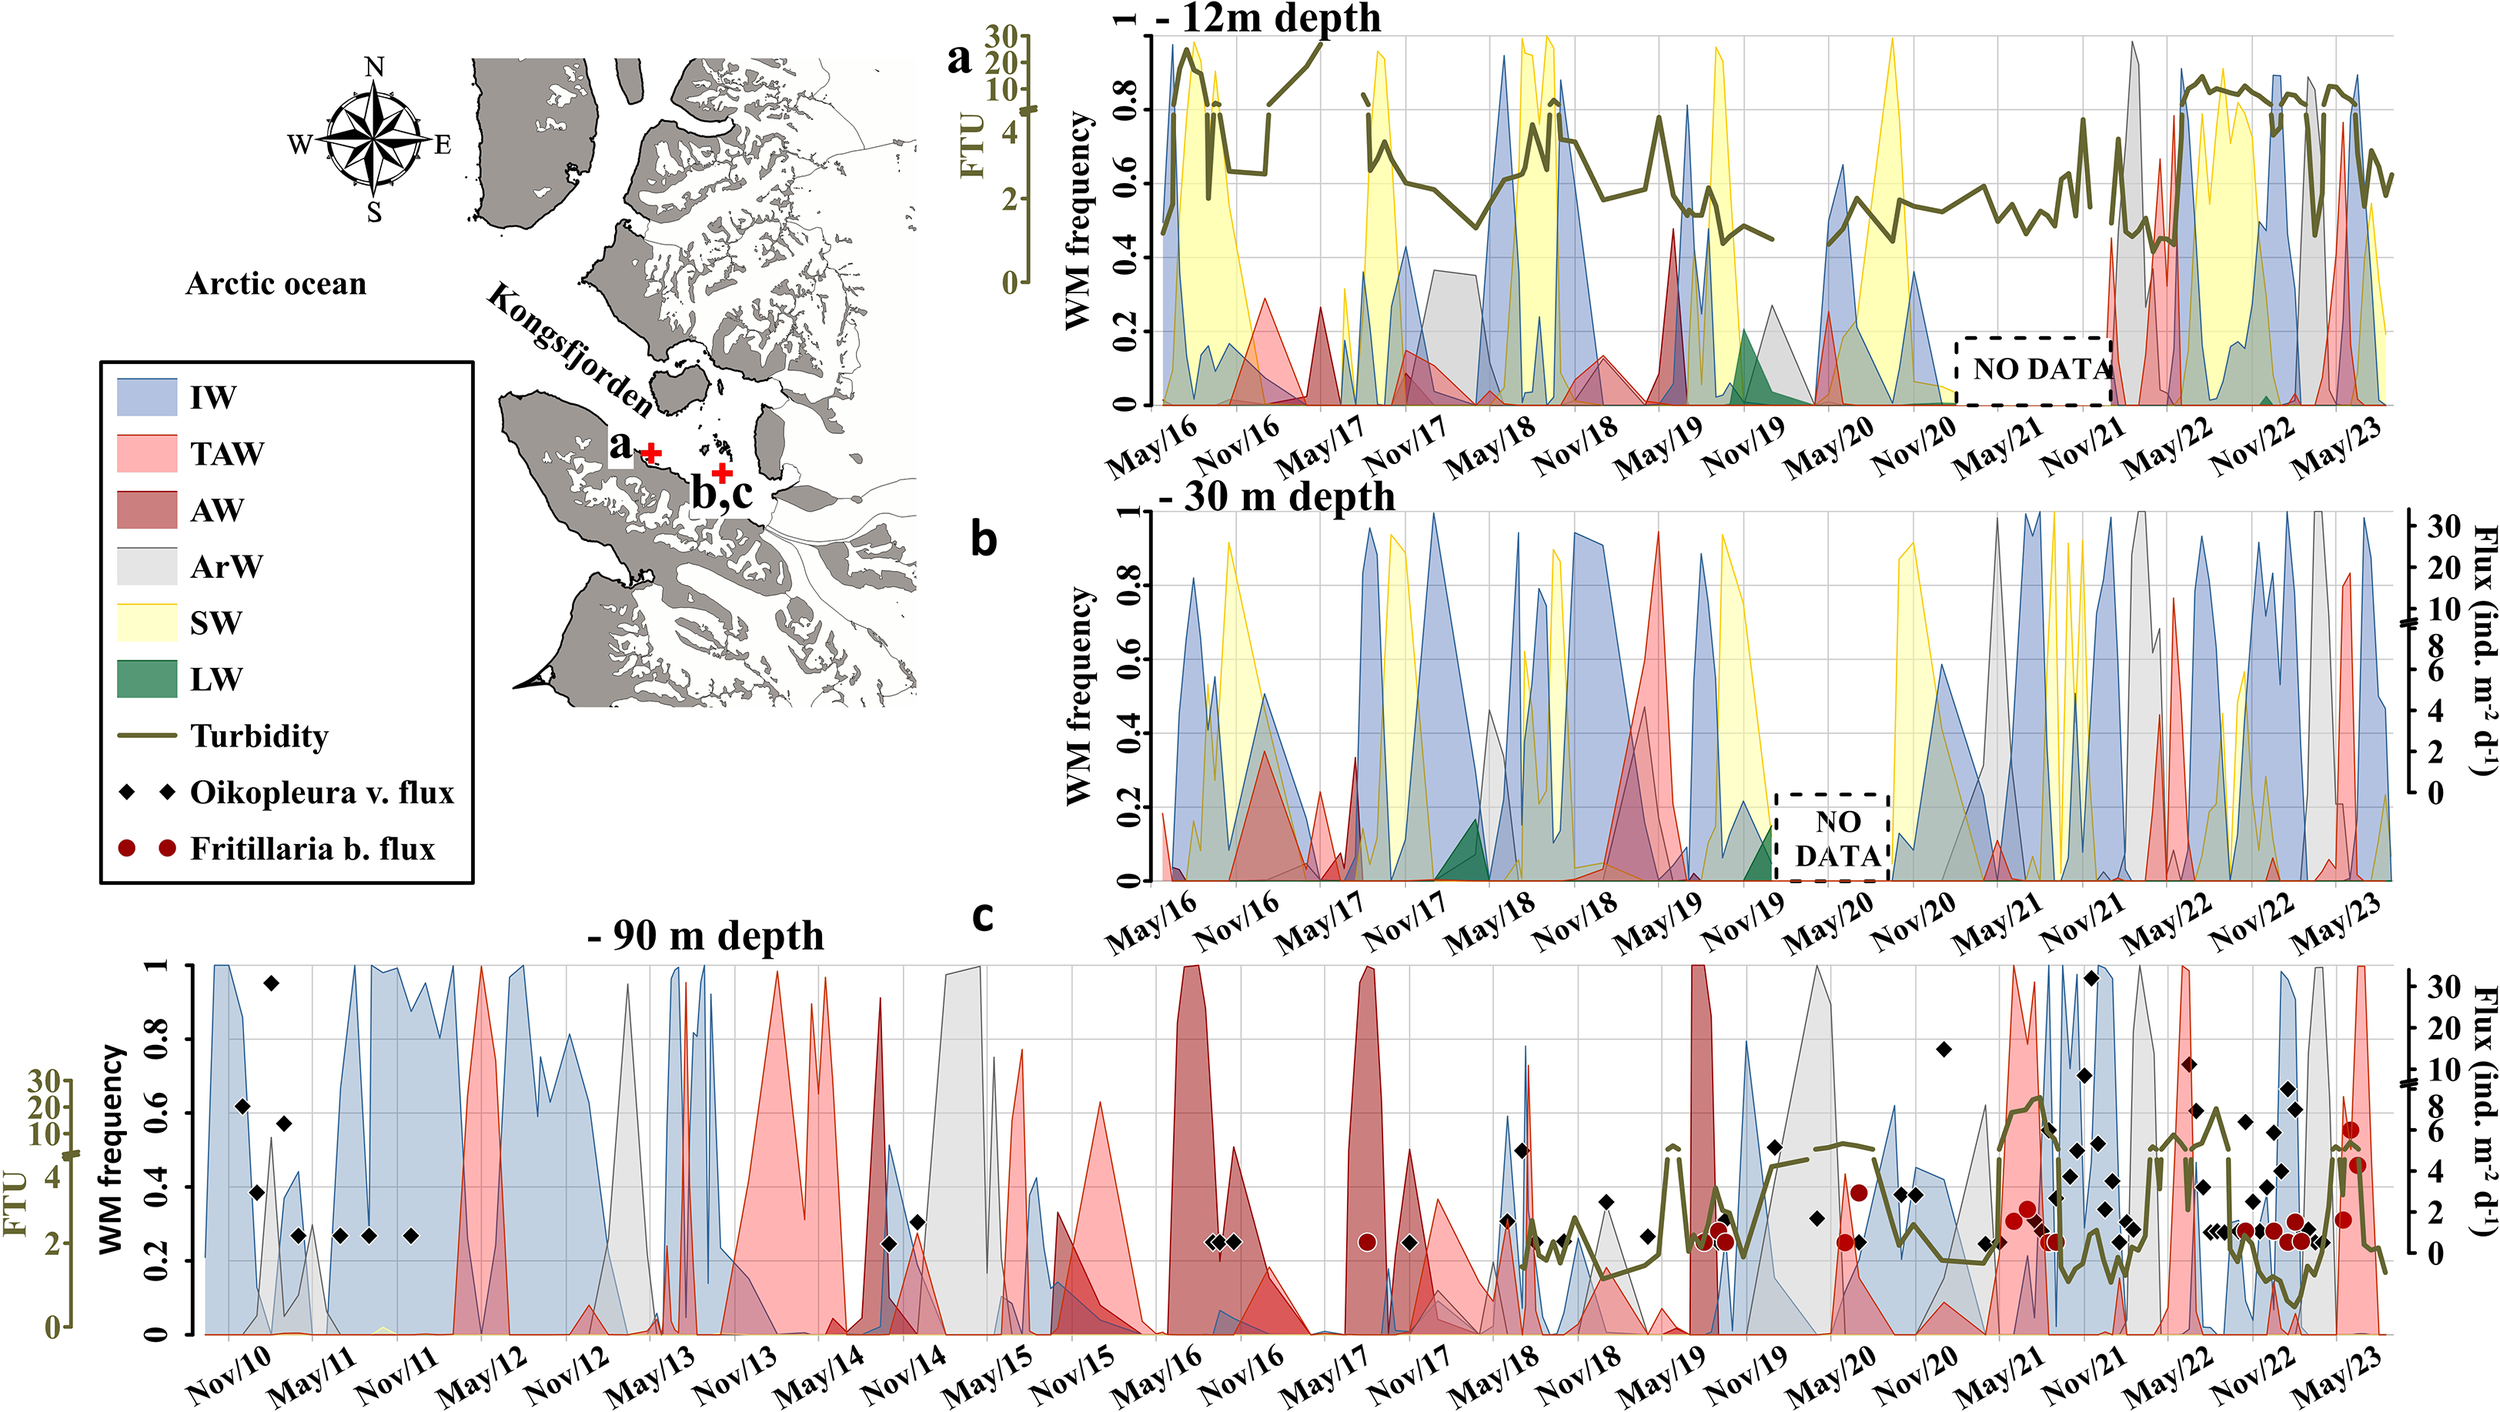
Water mass characterization in the Kongsfjord at 12 m (A), based on the AWIPEV underwater observatory, and at 30 m (B) and 90 m (C) depths from the MDI. Acronyms are defined as follows: FTU, Formazin Turbidity Unit; WM Frequency, Water Mass Frequency; IW, Intermediate Water; TAW, Transformed Atlantic Water; AW, Atlantic Water; ArW, Arctic Water; SW, Surface Water; LW, Local Water.
At 90 m depth, ArW mainly dominated from September 2010 to June 2014, after which AW appeared and persisted until September 2019 (Figure 2C). Deep ArW was again observed in 2015, 2018, 2019 becoming the dominant water mass, and it resumed its dominance from December 2019 onward (Figure 2C).
4.2 Turbidity
Turbidity data acquisition began in July 2018 (Figure 2B). The lowest average value was recorded in early February 2023 (0.48 ± 0.12 FTU) while the highest average peak (23.60 ± 1.72 FTU) occurred in early August 2021 (SI1).
Turbidity levels exhibited a clear seasonal pattern, with higher values occurring during the summer-autumn period and lower levels in winter-spring months, mainly driven by the advection of glacial meltwater in the MDI region (Figure 2B).
4.3 Sea ice observations
Sea ice presence followed a consistent seasonal cycle throughout the monitoring period: (i) ice-covered conditions prevailed from November to May (grey bands, Figure 3), while open waters were dominant from June to September (white bands, Figure 3). Exceptions were observed in summer 2017 and 2018, when floating ice masses were still present (Figure 3). Overall, Kongsfjorden is typically ice-free during summer, with sea ice forming in autumn and winter and persisting through the spring months (Figure 3).
Figure 3
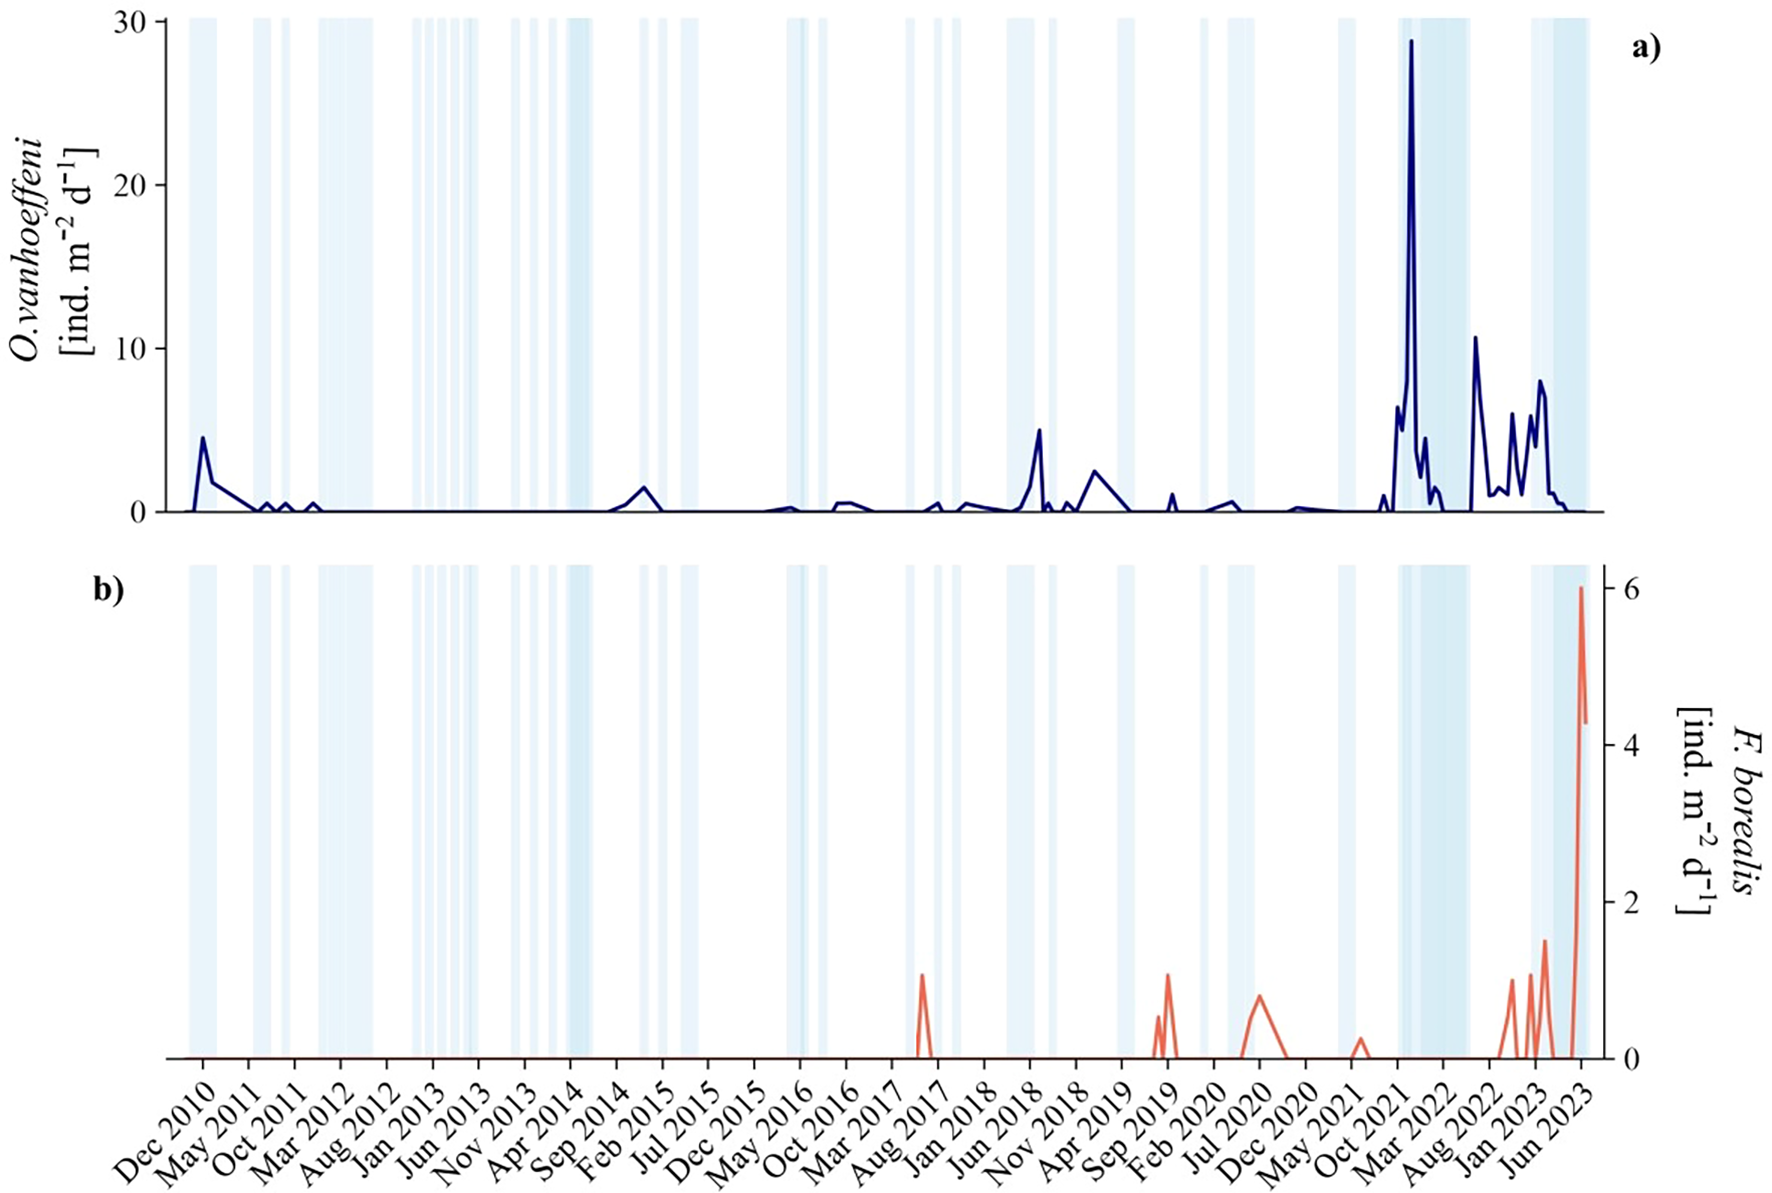
Sea ice observations from the mountain Zeppelinfjellet (Svalbard) during the period 2010-2023 (data source: Norwegian Polar Institute), shown in relation to vertical fluxes of (A)Oikopleura vanhoeffeni (blue line) and (B)Fritillaria borealis (red line). White bands indicate periods dominated by open waters (sea ice=0), whereas light blue ones represent the occurrence of various sea ice conditions (sea ice =1).
4.4 Long-term records of Arctic larvaceans
Two Appendicularia species, O. vanhoeffeni (Lohmann, 1896) and F. borealis (Lohmann, 1896), were identified during the monitoring period (2010-2023) in MDI, inner Kongsfjorden.
Oikopleura vanhoeffeni fluxes were generally low from 2010 to 2016 (<8 ind. m-2 d-1, except for January 2011) and reached the peak between November 1 and 16, 2021 (Figure 4A). The species produced four main peaks during winter 2011, 2020, 2021 and 2023 (≥15 ind. m-2 d-1), with the highest estimated flux between October and December 2021 (SI1). F. borealis was absent in our samples before July 2017 (1 ind. m-2 d-1, Figure 4B), and the highest flux (6 ind. m-2 d-1) occurred in May-June 2023 (SI1). Nevertheless, sporadic individuals (≤ 3 ind. m-2 d-1) were collected in the same months during 2020 and 2021 (Figure 4B). No overlap occurred for the species distribution throughout the time series, except for August 2021, October 2022, and between December 2022 and February 2023 (Figure 4). From our data, O. vanhoeffeni fluxes are about 5 times higher than F. borealis.
Figure 4
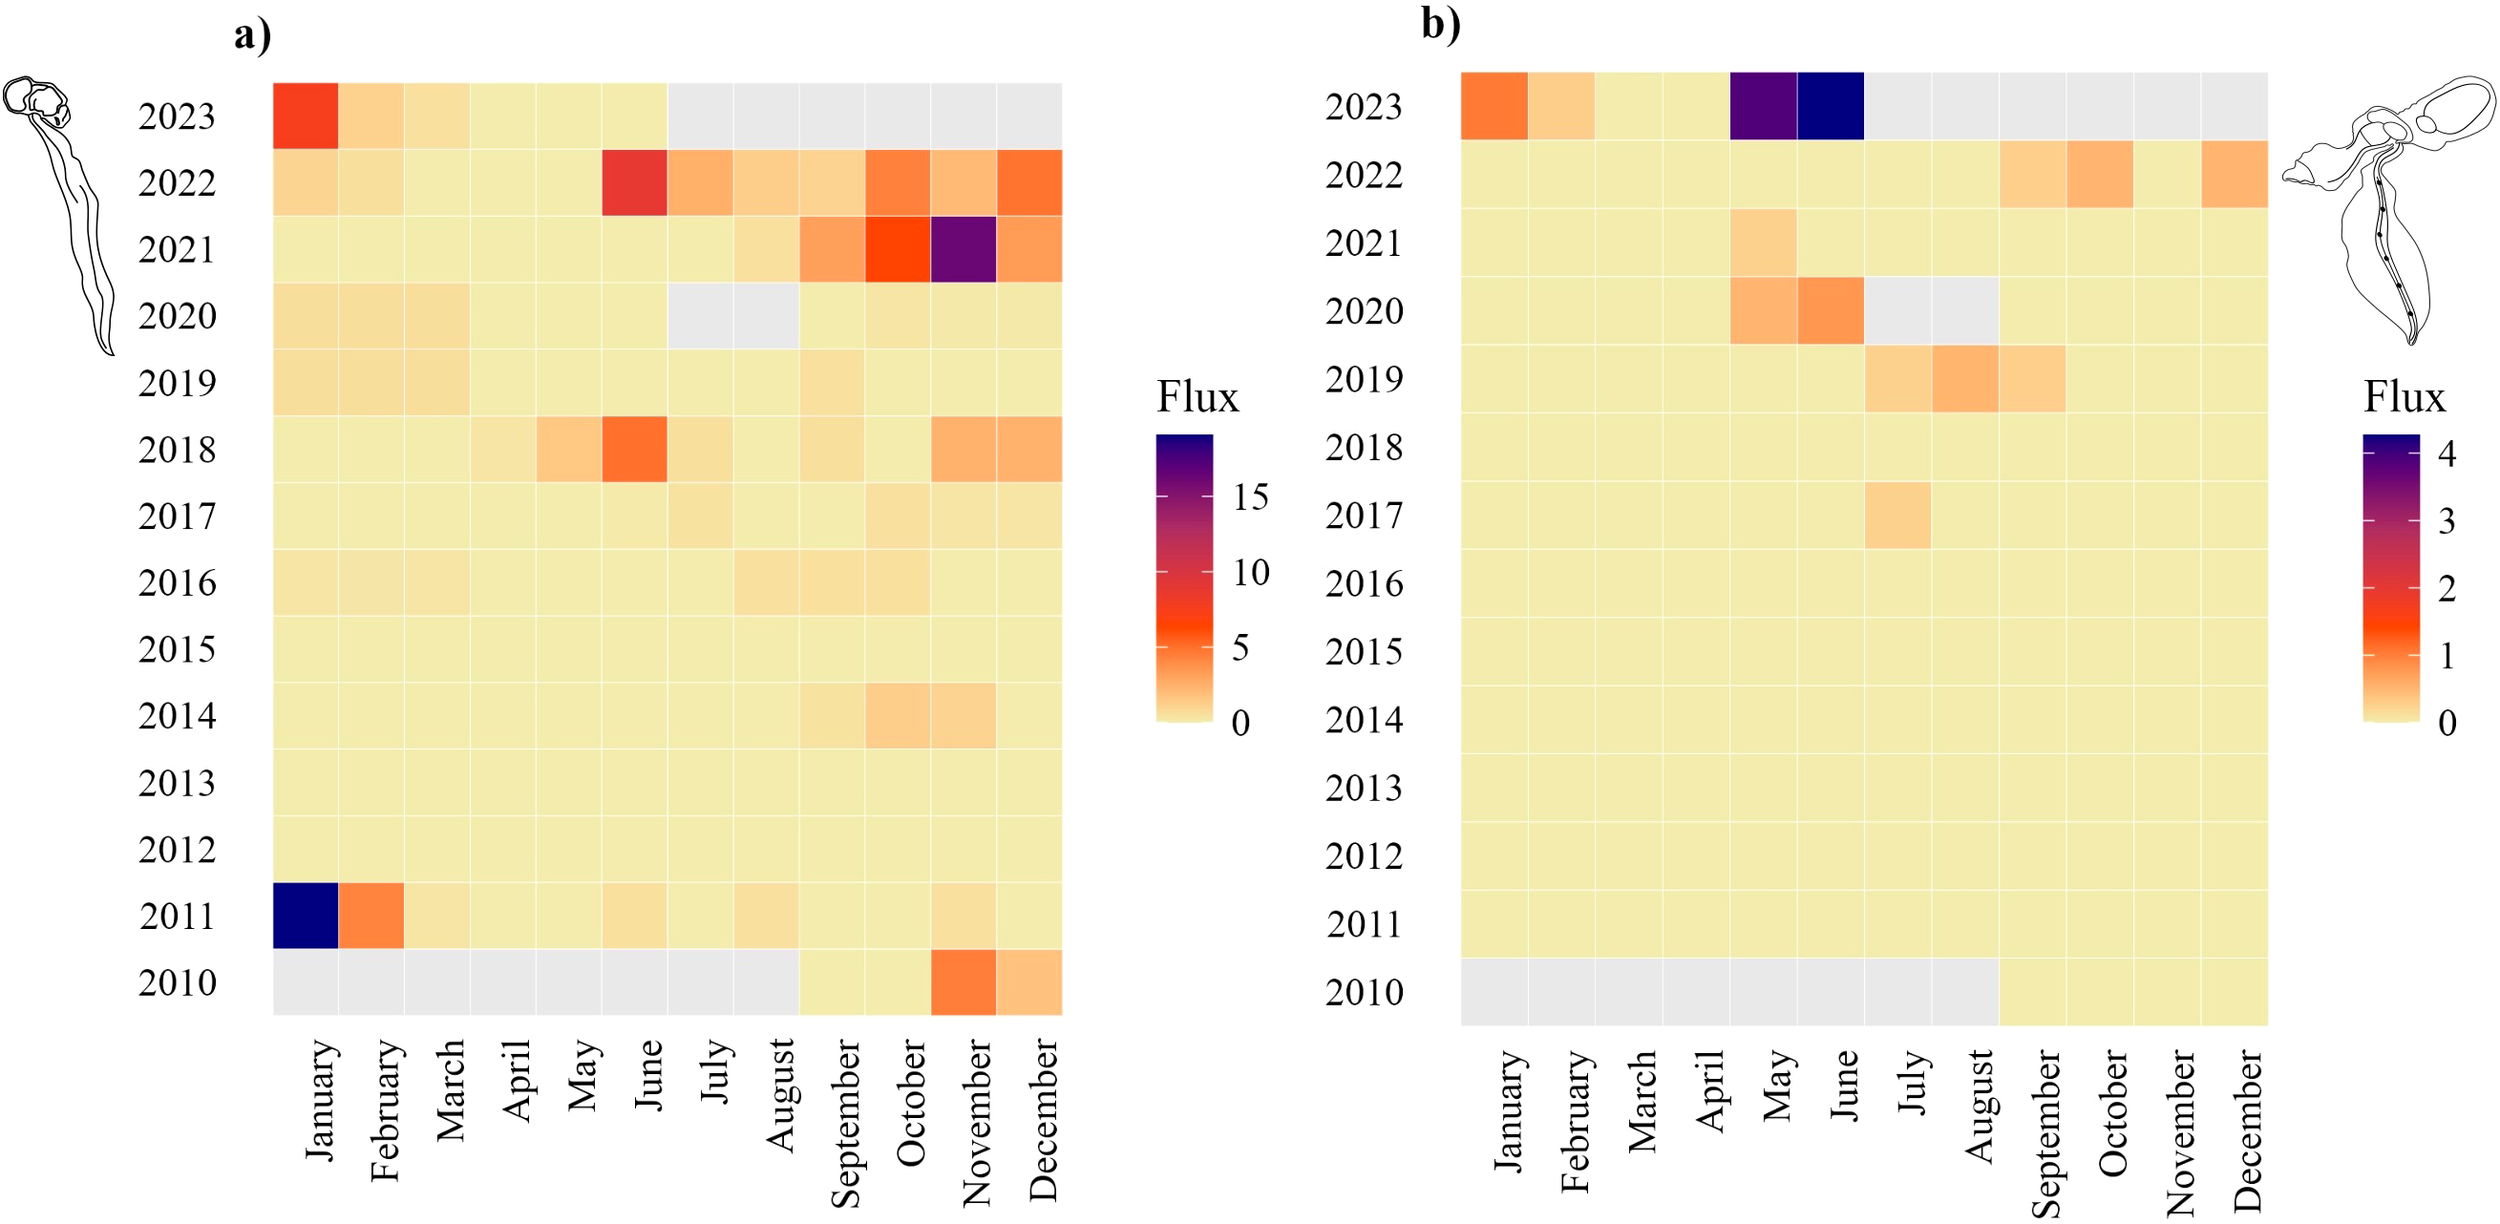
Heatmaps for multi-year flux intensities of (A)Oikopleura vanhoeffeni and (B)Fritillaria borealis. The flux intensity is expressed as ind. m-2 d-1. Grey cells reflect missing data.
PERMANOVA results confirmed statistically significant differences for the occurrence of polar larvaceans (pseudo-F=22.2, p = 0.001) in Kongsfjorden. The correlation between species appeared insignificant (rs = 0.02, p > 0.05).
4.5 Relationships between larvaceans and hydrology
The GAM model on the entire time series for O. vanhoeffeni flux employed a Quasi-Poisson regression to account for data overdispersion, explaining the 63.8% of the variance and capturing the 73.4% of the system deviance (Table 1). Therefore, this model for O. vanhoeffeni explained a substantial portion of the system deviance, indicating a strong fit and suggesting that the selected environmental predictors effectively capture the main drivers of species flux variability.
Table 1
| Family | Link function | Formula | Adjusted R2 | Deviance explained | |
|---|---|---|---|---|---|
| Quasi-Poisson | Log | Oikopleura_flux ~ s(iTEMP) + s(bTEMP) + s(iSAL) + s (bSAL) + Sea ice | 0.64 | 73.4% | |
| Negative Binomial | Log | Fritillaria_flux ~ s(iTEMP) + s(bTEMP) + s(iSAL) + s (bSAL) + Sea ice | 0.34 | 53.3% | |
| Component | Term | Estimate | Std error | t-value | p-value |
| Parametric coefficients | |||||
| Oikopleura (Vexillaria) vanhoeffeni | Intercept | –1.34 | 0.46 | –2.9 | <.001*** |
| Sea ice | 0.73 | 0.26 | 2.8 | <.001*** | |
| Fritillaria borealis | Intercept | –3.67 | 0.86 | –4.24 | <.001*** |
| Sea ice | 1.22 | 0.95 | 1.29 | 0.2 | |
| Smooth terms | Edf | Ref df | F-value | p-value | |
| Oikopleura (Vexillaria) vanhoeffeni | s(iTEMP) | 3.96 | 4.91 | 4.89 | <.001*** |
| s(bTEMP) | 4.35 | 5.37 | 4.68 | <.001*** | |
| s(iSAL) | 3.73 | 4.54 | 6.56 | <.001*** | |
| s(bSAL) | 1.00 | 1.00 | 17.32 | <.001*** | |
| Fritillaria borealis | s(iTEMP) | 3.82 | 4.74 | 8.06 | 0.13 |
| s(bTEMP) | 1.00 | 1.00 | 1.19 | 0.28 | |
| s(iSAL) | 2.05 | 2.57 | 3.14 | 0.29 | |
| s(bSAL) | 1.00 | 1.00 | 3.47 | 0.06 | |
GAM outputs for larvacean fluxes in relation to hydrological data.
The goodness of the model is estimated through the adjusted R2 and the deviance explained. The intensity of each variable in explaining the larvacean fluxes is estimated through the F-value, whereas asterisks (*) show the significance of the relationship, and their numbers express the intensity of the relationship. Acronyms are explained as follows. Edf, effective degrees of freedom; Ref df, reference degrees of freedom; iTEMP, temperature at 30 m; bTEMP, temperature at 90 m; iSAL, salinity at 30 m; bSAL, salinity at 90 m.
Sea ice absence was associated with a lower average predicted flux (1.36 ind. m-2 d-1) compared to sea ice presence (2.00 ind. m-2 d-1), with high statistical significance (p<0.001, Table 1). Among hydrological variables, iSAL exhibited a strong and linear relationship (F = 17.32, p<0.001, Figure 5A) with O. vanhoeffeni flux, while bSAL showed a significant but nonlinear effect (F = 6.56, p<0.001, Figure 5B). Similarly, both iTEMP and bTEMP influenced species flux through nonlinear trends (Figures 5C, D), with high F-values and strong significance (Table 1). Notably, iSAL values above 34.4 PSU were associated with an increase in the O. vanhoeffeni fluxes, whereas bSAL values exceeding 34.8 PSU had a negative predicted effect. O. vanhoeffeni flux appeared sensitive to narrow temperature ranges: iTEMP below 2.5 °C and above 5.0 °C were linked to reduced flux, indicating a limited thermal tolerance. Positive estimated effects were observed at bTEMP between ~1 – 2.2 °C and above 4.0 °C.
Figure 5
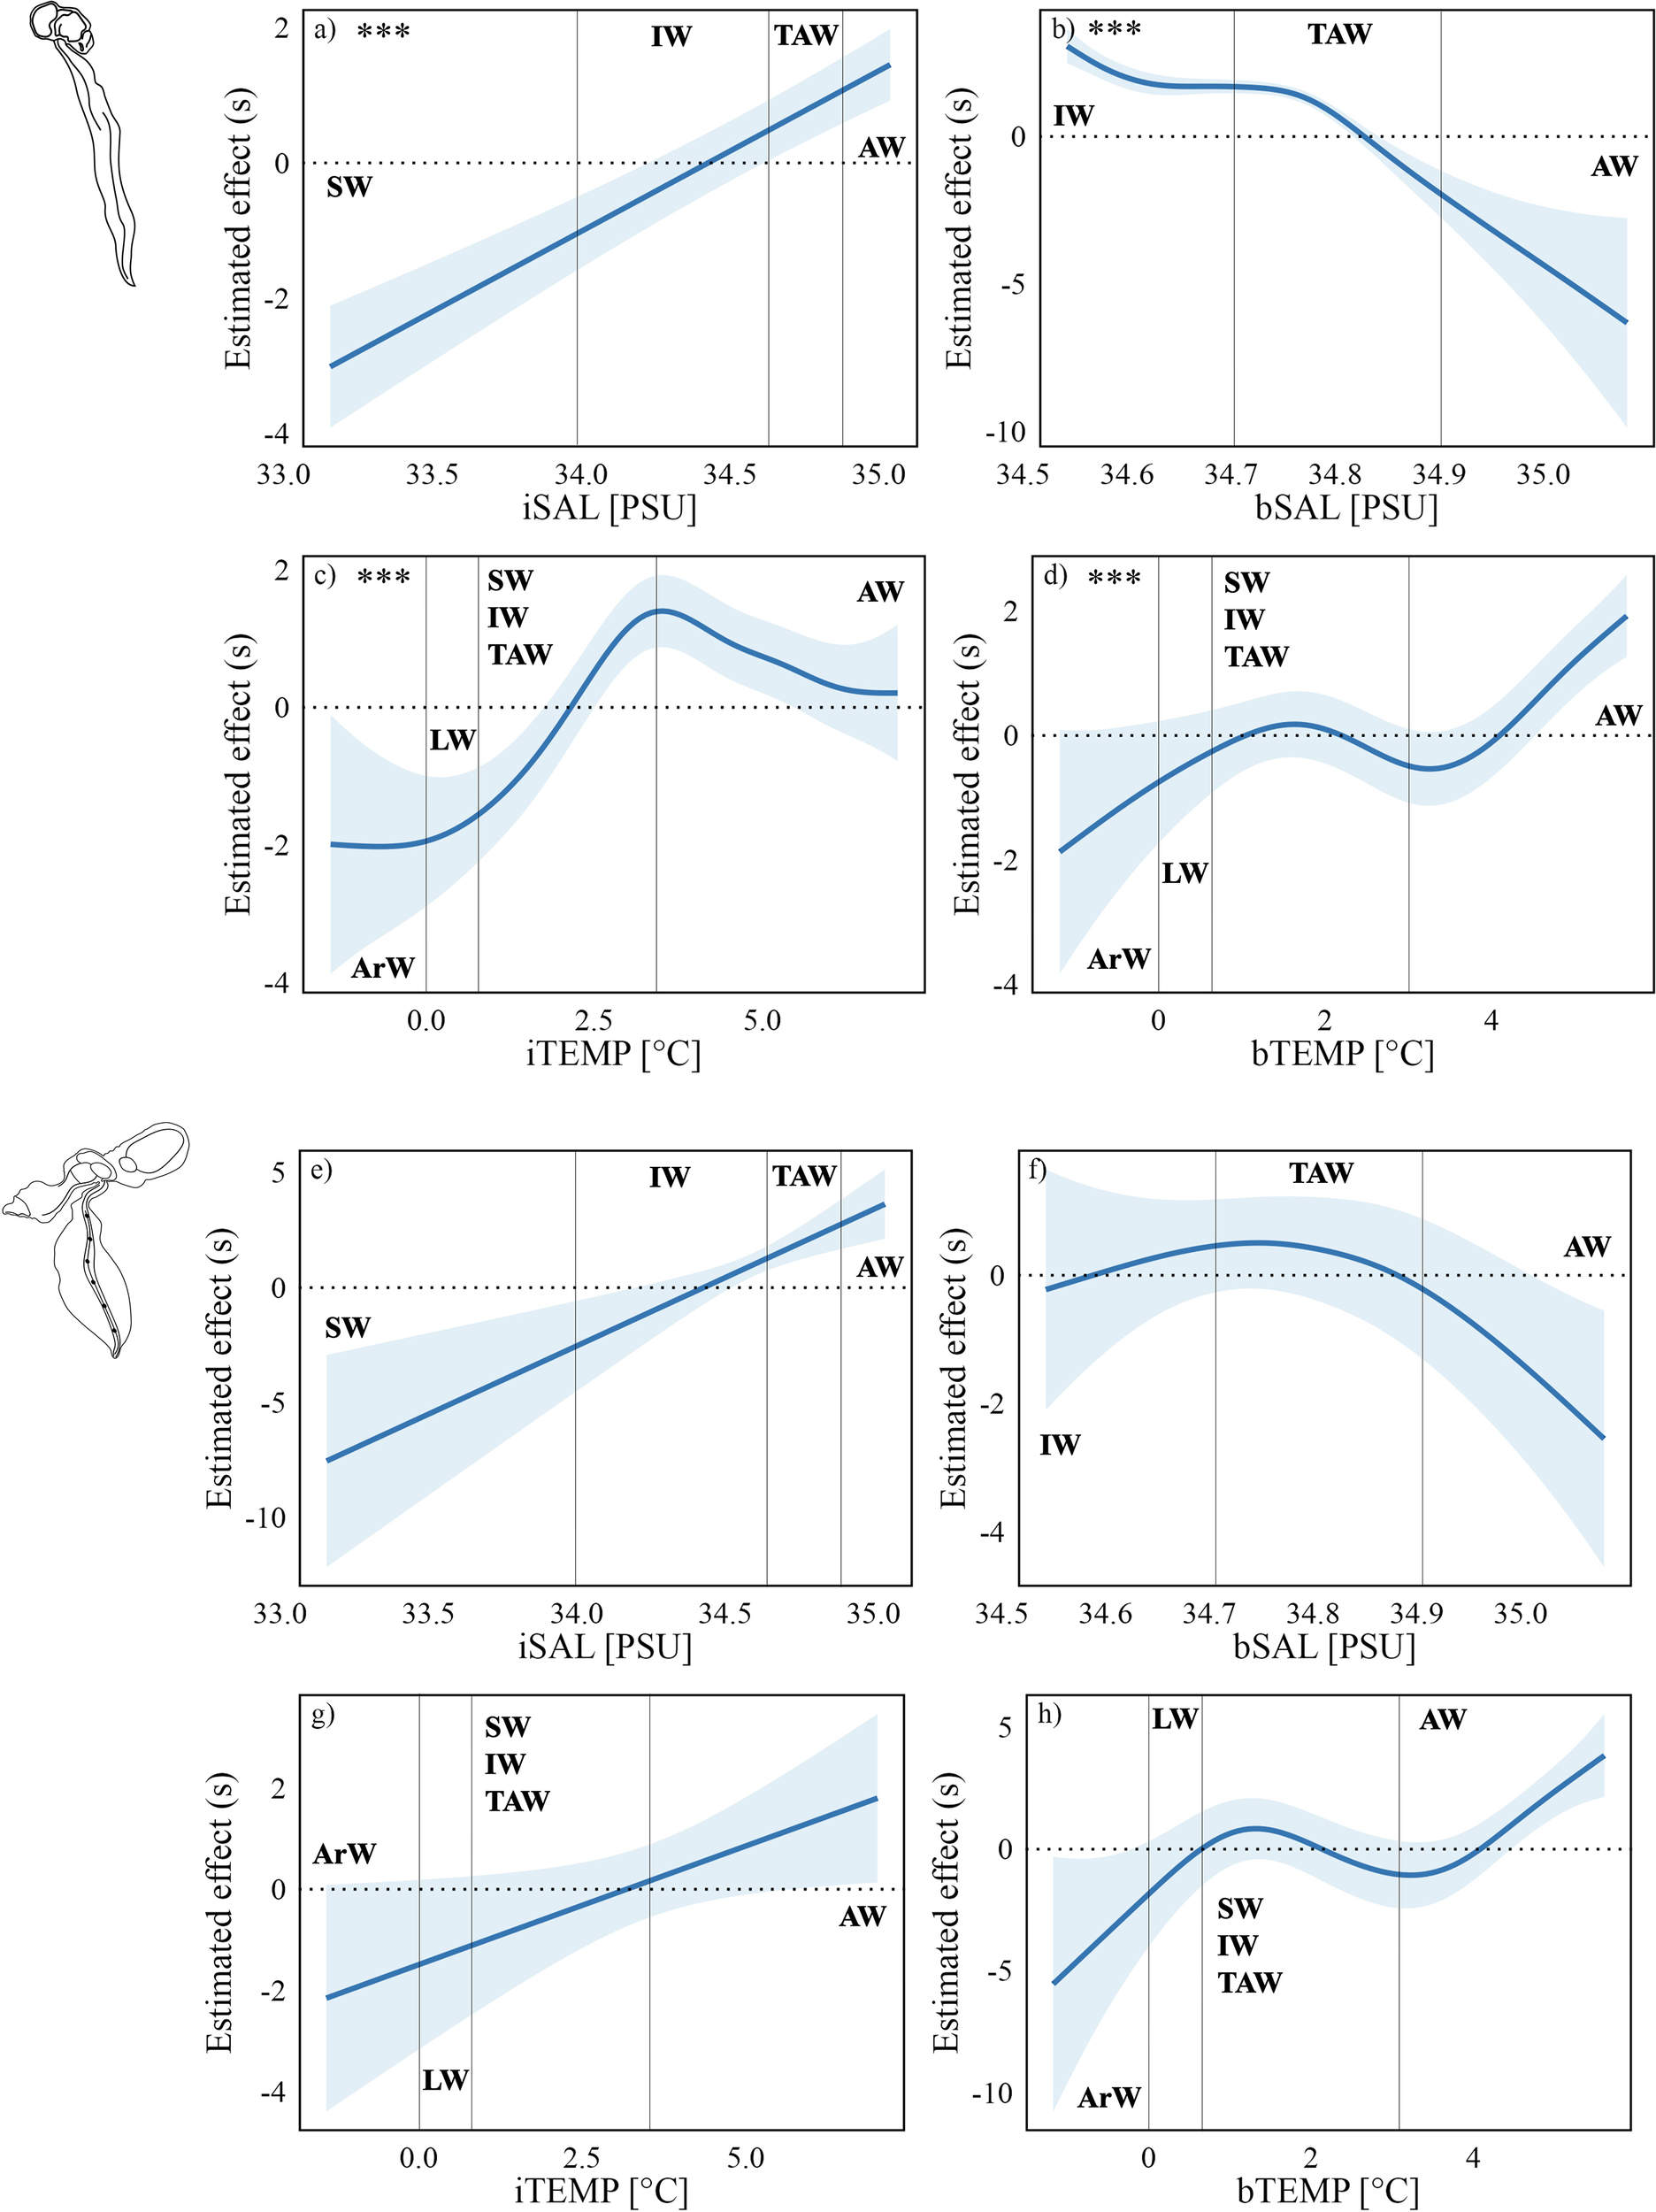
Predicted fluxes of O. vanhoeffeni (Quasi-Poisson model) and F. borealis (Negative Binomial model) in relation to salinity levels at 30 m (A, E), and 87 m (B, F) depths, water temperatures at 30 m (C, G) and 87 m (D, H). Asterisks (***) explain the significance of the relationships. Water masses acronyms are indicated as follows. ArW, Arctic Water; LW, Local Water; SW, Surface Water; IW, Intermediate Water; TAW, Transformed Atlantic Water; AW, Atlantic Water.
In contrast, the GAM model for F. borealis performed better using a Negative Binomial regression, explaining the 33.6% of the variance and the 53.3% of the system deviance (Table 1), providing moderate and valuable insights into the ecological responses of the species in a highly variable Arctic environment.
Unlike O. vanhoeffeni, neither sea ice nor hydrological variables showed statistically significant effects on F. borealis flux, as indicated by the low F-values and non-significant p-values (Table 1). Despite sea ice presence was associated with a higher average predicted flux (0.41 ind. m-2 d-1) rather than ice-free conditions (0.12 ind. m-2 d-1), there is no statistical significance (p = 0.2, Table 1). Nonetheless, some trends emerged. iSAL (Figure 5E) and iTEMP (Figure 5G) were associated with linear increases in flux (Table 1), while bSAL (Figure 5F) followed a parabolic pattern and bTEMP (Figure 5H) exhibited a more complex nonlinear response. Specifically, positive flux responses were observed for iSAL>34.4 PSU and iTEMP>2.5 °C. Similarly, bSAL between 34.6–34.9 PSU and bTEMP of 1-2 °C or above 4 °C were also associated with increased F. borealis flux.
The cross-correlation between O. vanhoeffeni flux and turbidity has been performed starting from evident correspondences between species occurrence, surface water characteristics and turbidity fluctuations (Figure 2). Results have shown a significant relationship (R = 0.68, p<0.05) between the species flux and turbidity, with a temporal delay of about 1 month between the peak of turbidity and the O. vanhoeffeni flux peak.
4.6 Population composition and biometric analysis
4.6.1 Oikopleura vanhoeffeni
The population of O. vanhoeffeni comprised 457 individuals, although 97 were not identified due to their advanced degradation state. In the entire time series, juveniles dominated the population (n=300, Figure 6A) whereas mature adults were scarce (n=60, Figure 6A). The distribution of life stages across seasons (Figure 6B) revealed that adults dominated in summer, and juveniles from autumn to winter; both life stages appeared in similar percentages during spring (Figure 6B).
Figure 6
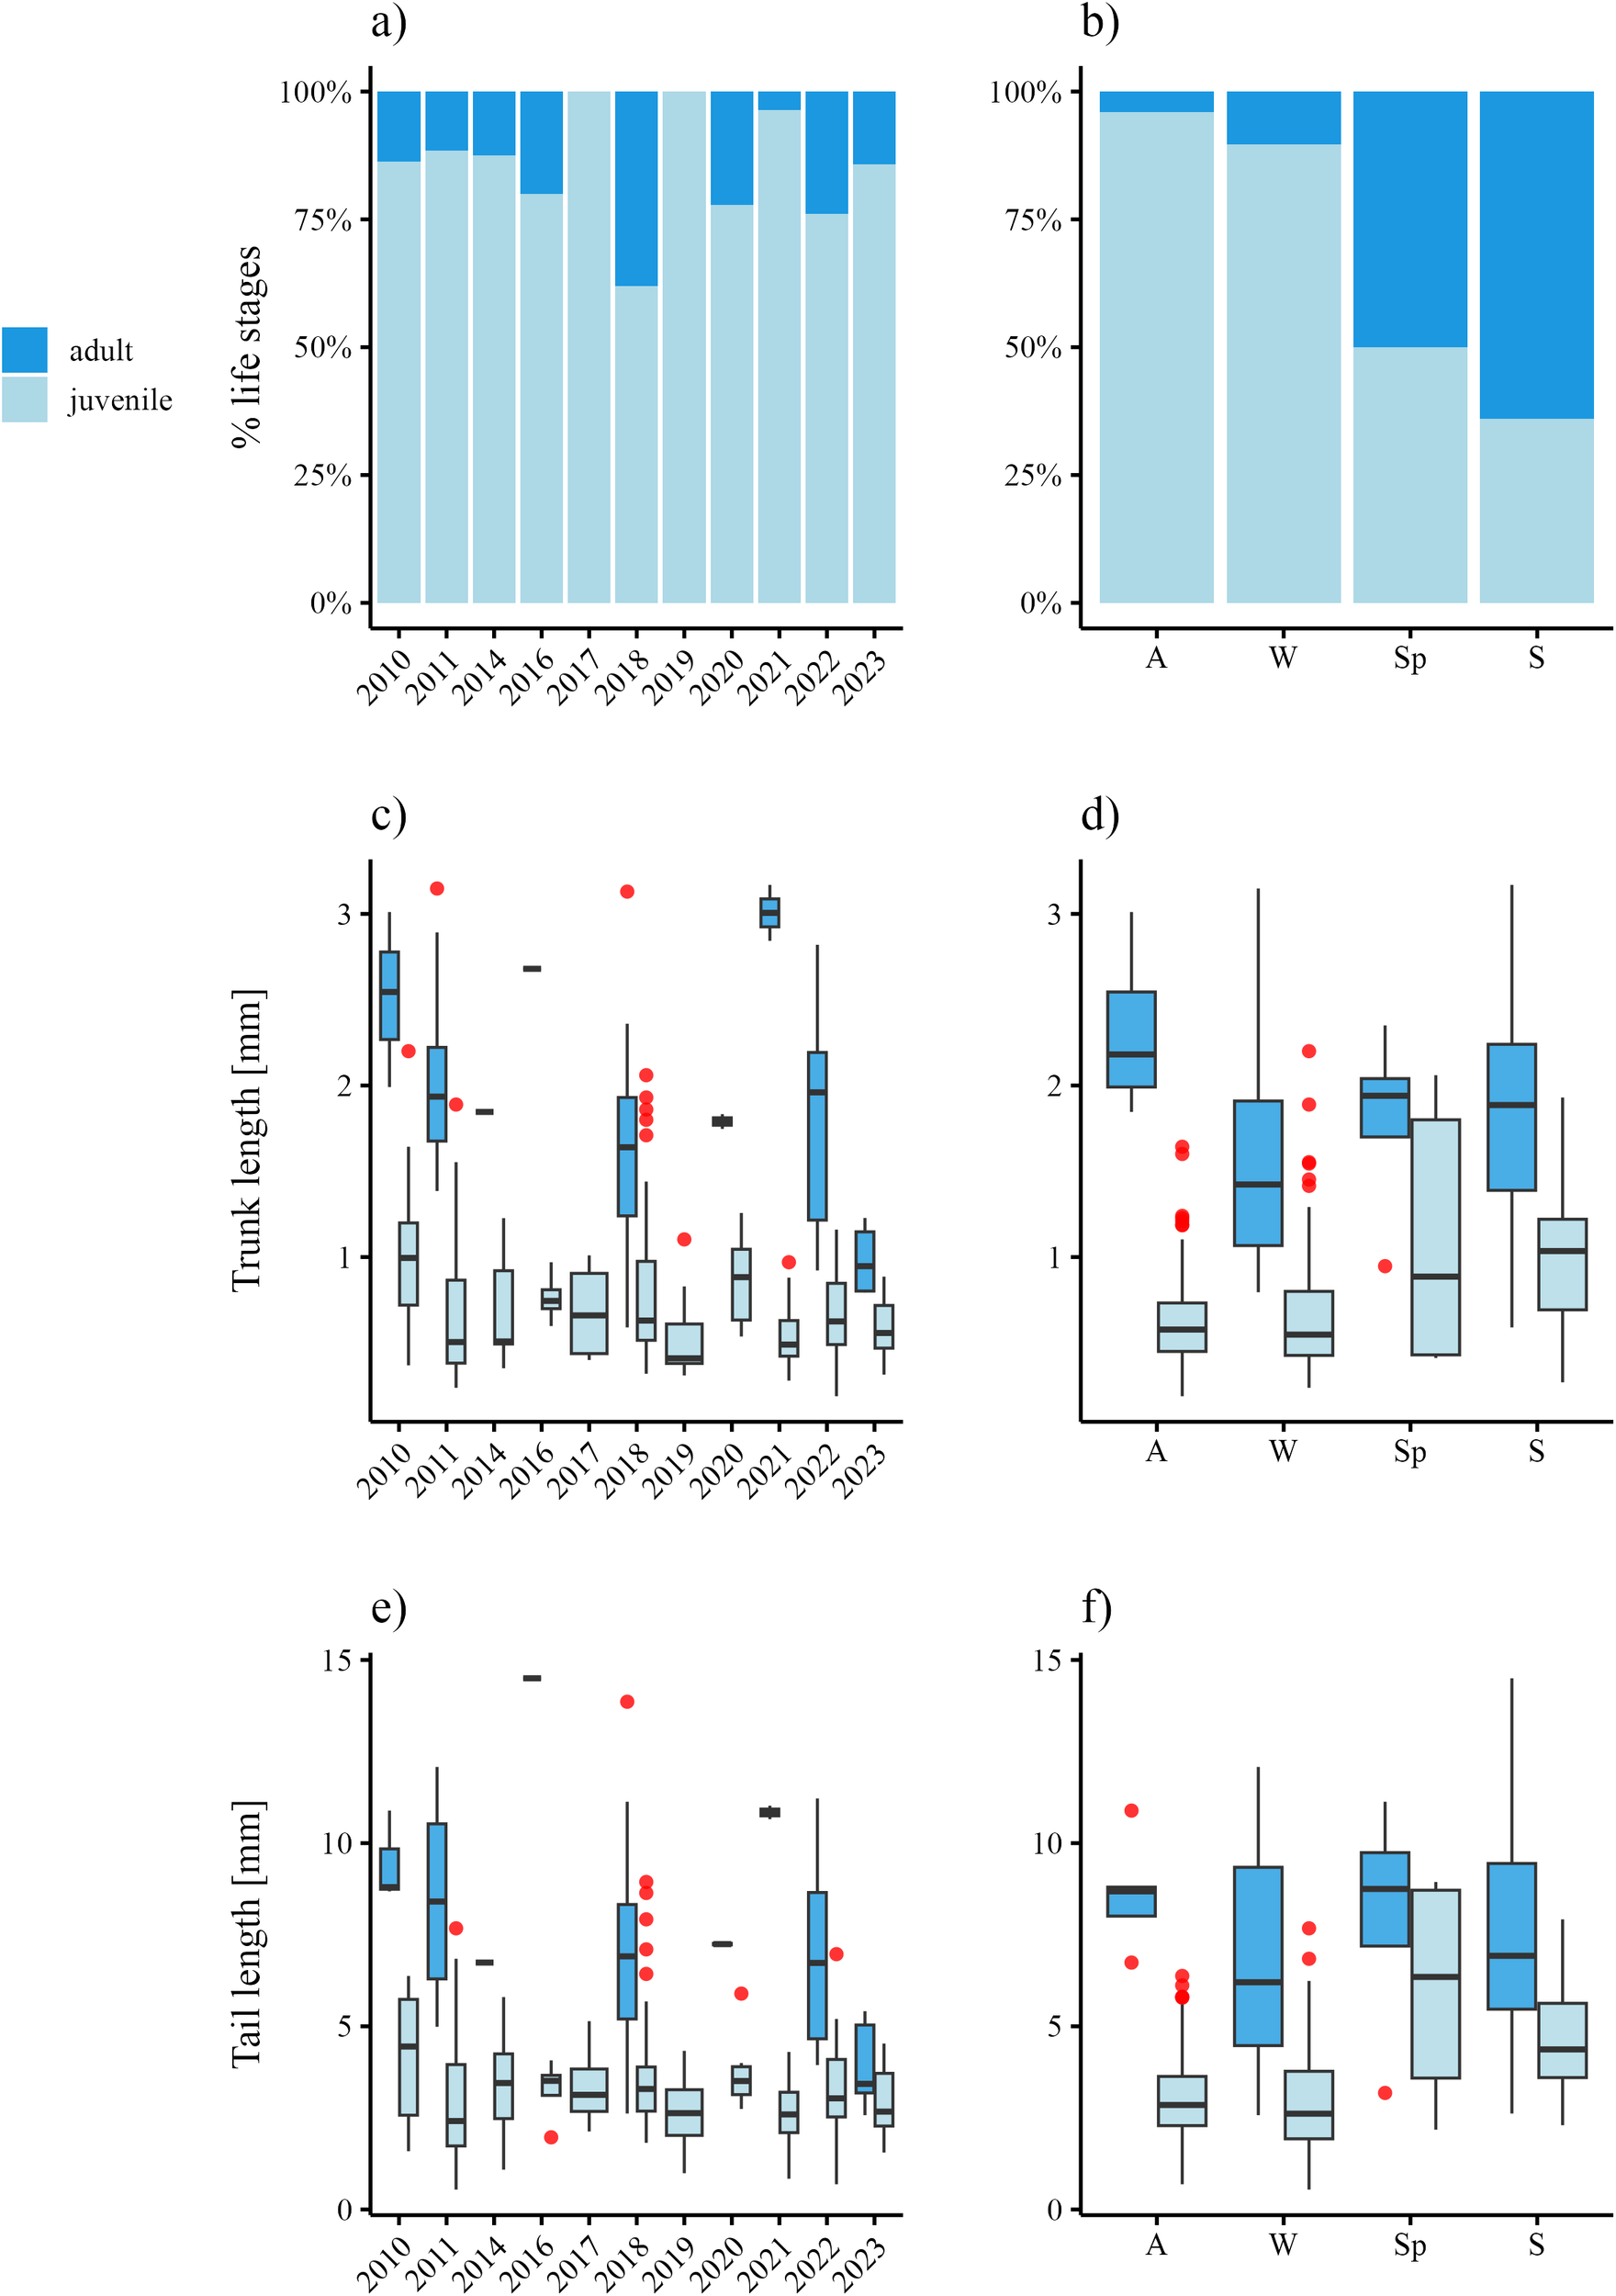
Life stage composition and biometric data visualization for O. vanhoeffeni population sampled in Kongsfjorden during 2010-2023, and distinguished across seasons. Life stage percentage composition in (A) the period 2010–2023 and (B) across seasons. Trunk lengths (C, D) and tail lengths (E, F) of each life stage through the long-term series (C, E) and between seasons (D, F). Red dots show outliers of body measure distribution. A, autumn (SON); W, winter (DJF); Sp, spring (MAM); S, summer (JJA).
Trunk lengths in juveniles were in the range 0.19 – 2.2 mm, whereas adult ones were between 0.59 and 3.17 mm (Figure 6C). Across seasons, the smallest juveniles occurred in autumn (0.19-1.64 mm) and the biggest ones in winter-spring (0.24-2.2 mm, Figure 6D). Mature adults with the large trunk lengths (~ 3 mm) occurred in all seasons except spring (0.95-2.35 mm; Figure 6D), and the highest measured value of 3.17 mm came from a specimen in summer.
Juvenile tail lengths on the temporal series ranged between 0.54 - 8.94 mm, whereas adult tail lengths were between 2.57 to 14.5 mm (Figure 6E). At the seasonal scale, the shortest tail lengths for juveniles appeared in autumn and winter, whereas the biggest ones occurred in spring-summer (Figure 6F). Generally, adults displayed the longest tails in summer and autumn, whereas the shortest ones occurred in winter and spring (Figure 6F).
Kruskall-Wallis tests conducted on the complete dataset revealed significant differences in both trunk and tail lengths of juveniles collected in 2010 compared to those in 2011, and also between 2010 and 2021 (Table 2). Similarly, adult trunk lengths in 2021 and 2023 were statistically different (Table 2). On the seasonal scale, the test showed relevant differences in the biometry of juveniles collected between autumn-summer, and between summer-winter (Table 2).
Table 2
| Factor | Group | Biometric variable | df | Chi-squared | p-value | Significant differences | Pairwise comparisons (Dunn’s post-hoc) |
|---|---|---|---|---|---|---|---|
| Year | Juveniles | Trunk length | 10 | 37.1 | <.001*** | Very high | 2010 vs 2011*, 2010 vs 2021* |
| Tail length | 10 | 27.6 | <.01** | High | |||
| Adults | Trunk length | 8 | 20.1 | <.01** | High | 2021 vs 2023* | |
| Tail length | 8 | 18.4 | <.05* | Low-mid | |||
| Season | Juveniles | Trunk length | 3 | 16.0 | <.001*** | Very high | A vs S*, S vs W* |
| Tail length | 3 | 25.6 | <.001** | Very high | A vs S*, S vs W* | ||
| Adults | Trunk length | 3 | 5.9 | 0.11 | None | ||
| Tail length | 3 | 3.1 | 0.38 | None |
Kruskall-Wallis results and Dunn’s post-hoc comparisons on biometric data of Oikopleura vanhoeffeni across years and seasons for all life stages.
Asterisks (*) indicates the level of significance: low-mid (*), mid-high (**) and very high (***). A: autumn (SON), W: winter (DJF), Sp: spring (MAM), S: summer (JJA).
4.6.2 Fritillaria borealis
The population of F. borealis was composed of a pool of 44 trapped individuals throughout the entire long-term record, but 3 of them were highly degraded and impossible to identify. Adults (n=30) dominated the population along the time series, followed by a small juvenile cohort (n=10, Figure 7A). The seasonal life stage composition revealed a dominance of adult stages throughout the seasons, except for autumn (n=2) and winter (n=1), whereas juveniles were not trapped in summer (Figure 7B).
Figure 7
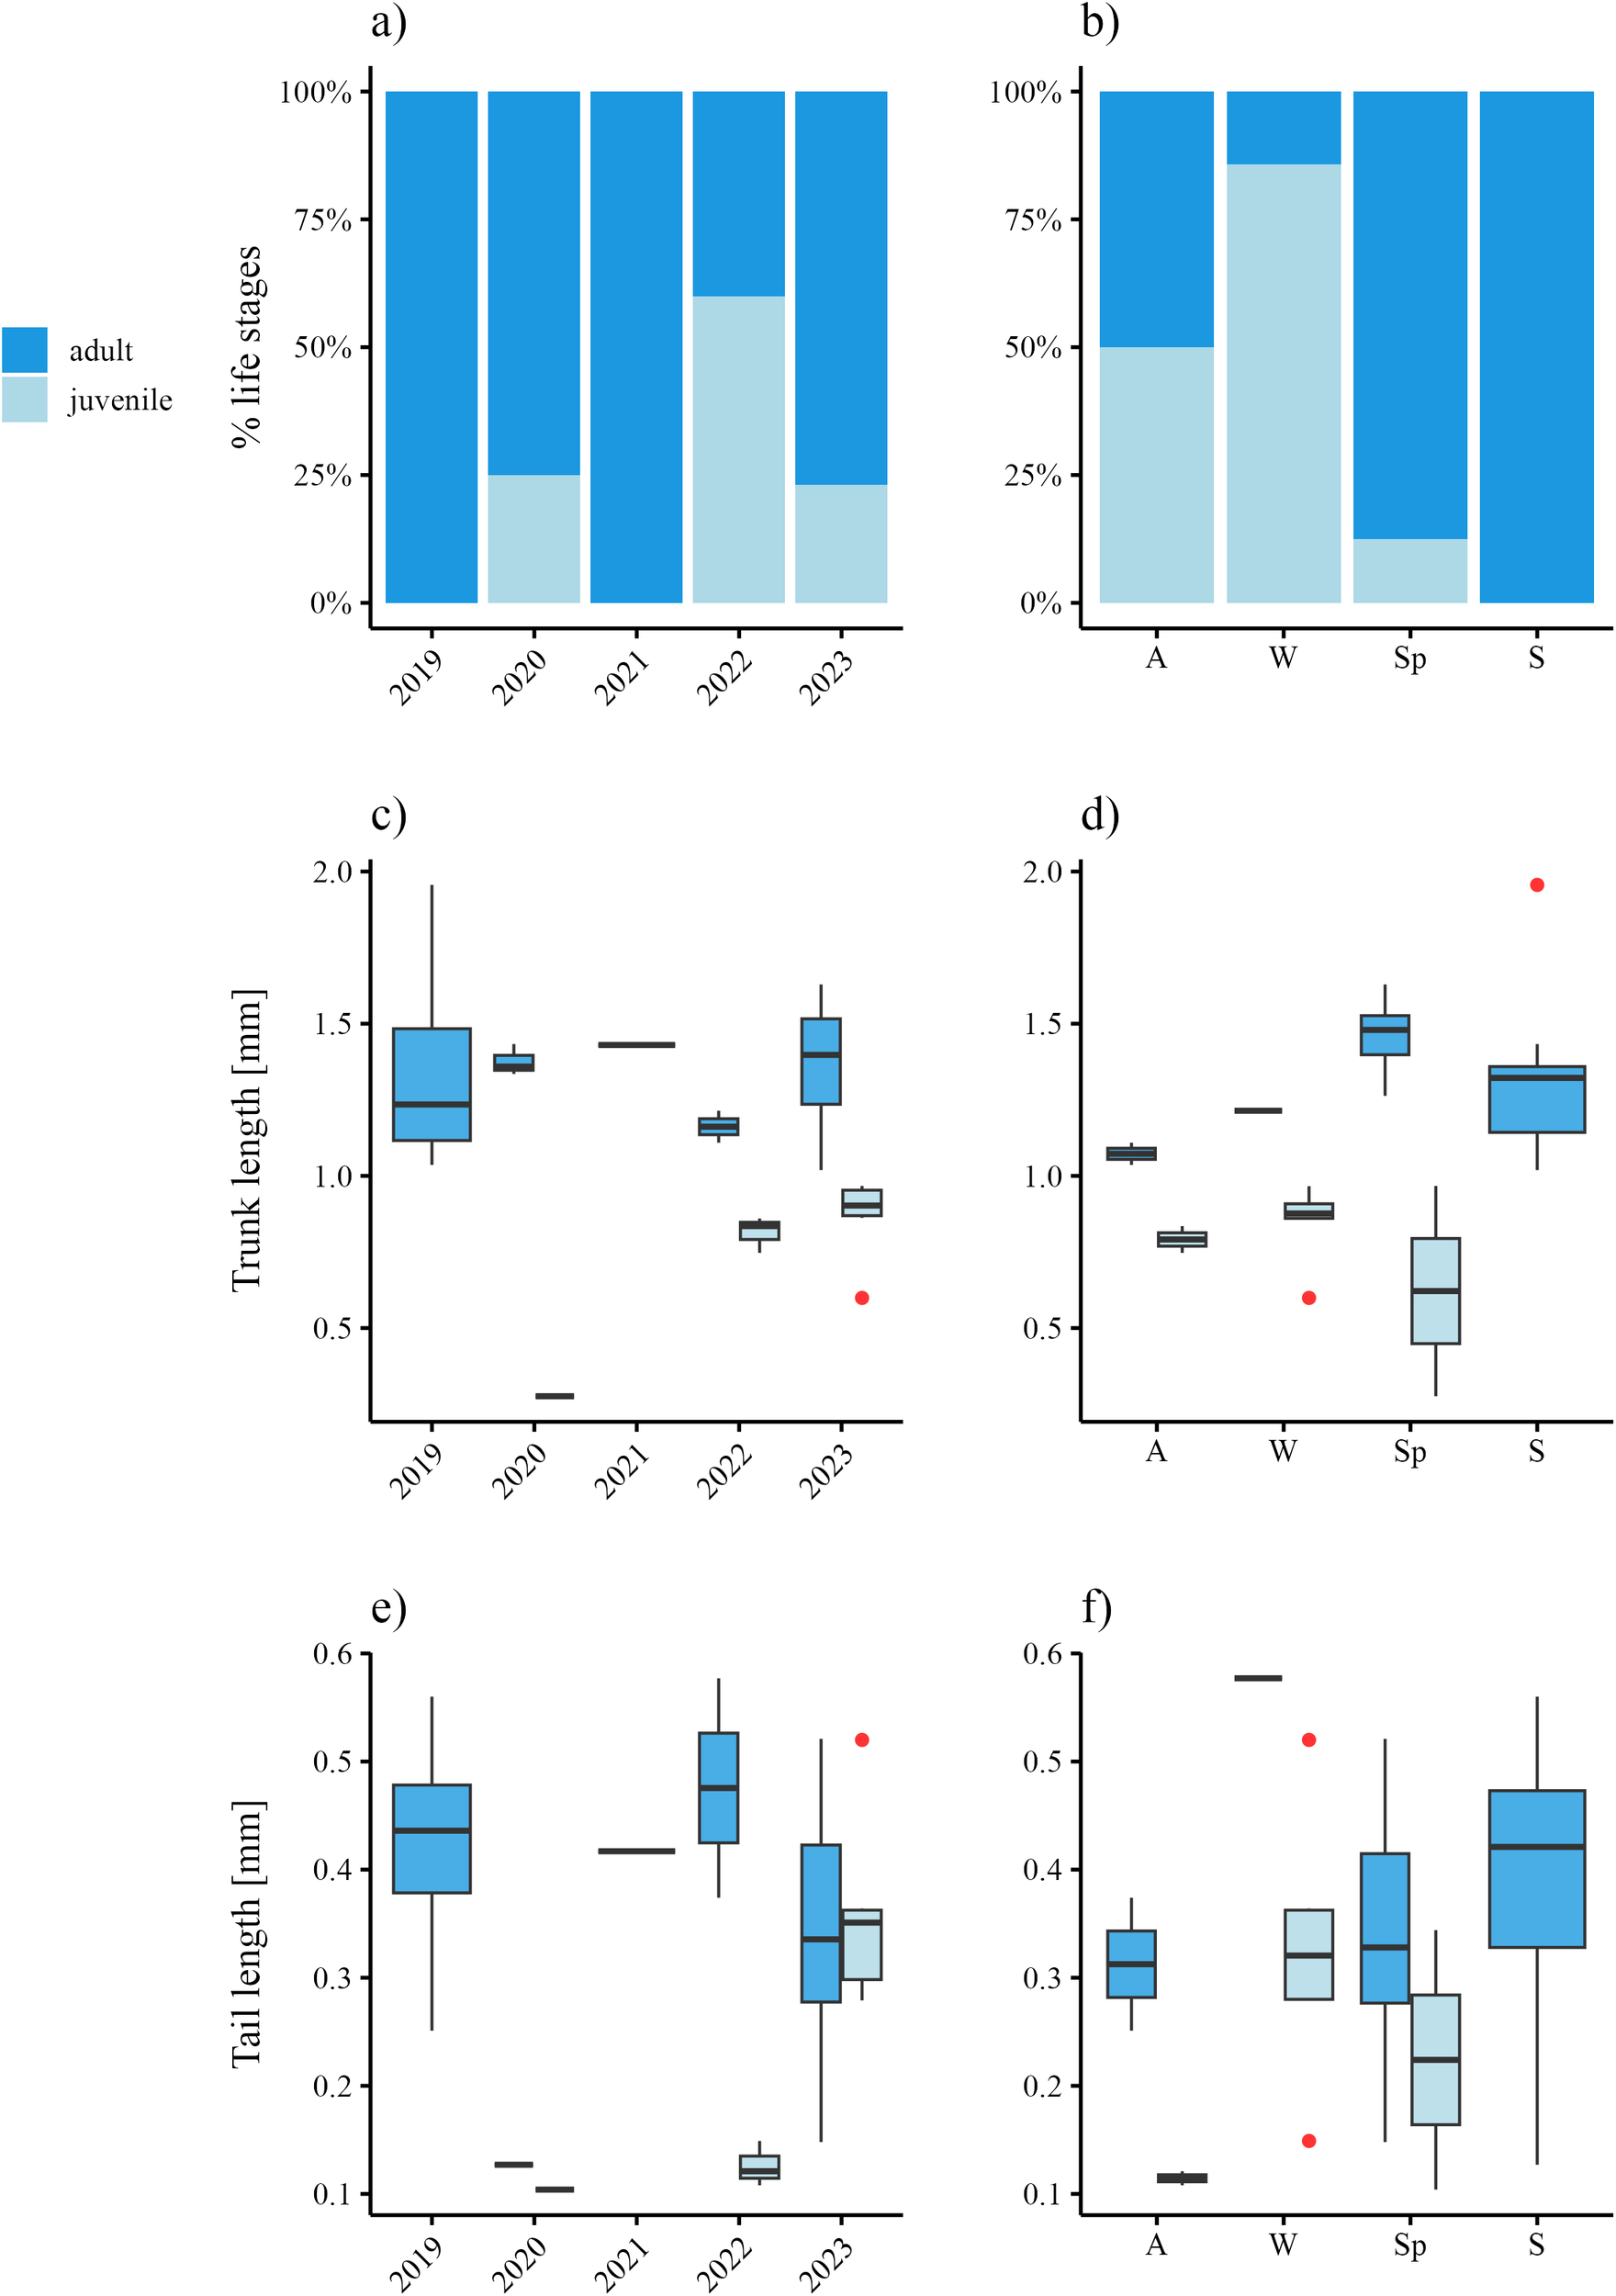
Life stage composition and median biometric data of F. borealis individuals trapped in Kongsfjorden during the period 2010-2023. Percentage population composition across (A) the entire time series and (B) seasons. Boxplots showing trunk (C, D) and tail (E, F) length distributions of life stages through the period 2010-2023 (C, E) and between seasons (D, F). A, autumn (SON); W, winter (DJF); Sp, spring (MAM); S, summer (JJA).
Estimated trunk length in juveniles along the entire series ranged between 0.28–0.97 mm, while adult ones were 1.02–1.96 mm (Figure 7C). On the seasonal scale, juveniles with the smallest trunk lengths appeared in spring (0.28–0.97 mm) and the biggest ones (0.75–0.84 mm) generally occurred in autumn (Figure 7D). Adult trunk lengths showed biggest specimens occurring in spring-summer (1.02–1.96 mm) and smallest ones during the autumn-winter (1.04–1.21 mm) period (Figure 7D).
Tail lengths on the entire time series (Figure 7E) for juveniles ranged in 0.10–0.52 mm, whereas adult ones were slightly longer (0.13–0.58 mm). Seasonal tail lengths (Figure 7F) of juveniles displayed shortest values in spring (0.10–0.34 mm) and longest ones in winter (0.15–0.52 mm). On the other hand, adults with short tails appeared in autumn (0.25–0.37 mm), while the range intervals were similar throughout the other seasons (Figure 7f).
Kruskall-Wallis results on the entire time series revealed significant differences in tail lengths of juveniles, whereas significant differences were estimated in adult trunk lengths (Table 3).
Table 3
| Factor | Group | Biometric variable | df | Chi-squared | p-value | Significant differences | Pairwise comparisons (Dunn’s post-hoc) |
|---|---|---|---|---|---|---|---|
| Year | Juveniles | Trunk length | 2 | 4.4 | 0.11 | None | |
| Tail length | 2 | 6.9 | <.05* | Low-mid | |||
| Adults | Trunk length | 4 | 2.9 | 0.57 | High | ||
| Tail length | 4 | 5.4 | 0.25 | Low-mid | |||
| Season | Juveniles | Trunk length | 2 | 1.2 | 0.56 | Very high | |
| Tail length | 2 | 3.4 | 0.14 | Very high | |||
| Adults | Trunk length | 3 | 13.1 | 0.01** | Mid-high | ||
| Tail length | 3 | 5.6 | 0.13 | None |
Kruskall-Wallis results for biometric data of F. borealis across years and seasons.
Asterisks (*) indicates the level of significance: low-mid (*), mid-high (**) and very high (***).
4.7 Hydrological influence on larvacean body size
The GAM model for O. vanhoeffeni, based on a Quasi-Poisson regression, revealed a non-linear pattern of hydrological influence on individual sizes (SI2). The model explained a large portion of the variance for both trunk and tail lengths (68.1% and 69.3% respectively), accounting for similarly high percentages of system deviance (68.7% and 67.4%). Ice-free conditions were associated with significantly longer average trunk (0.89 mm) and tail (3.96 mm) lengths compared to ice-covered conditions (0.63 and 2.95 mm, respectively; p<0.05, SI2). Significant effects were predicted for all variables except iTEMP (SI2). Positive growth effects were associated with iSAL values between 33.8 and 34.4 PSU. Positive relationships were also observed with bSAL in the ranges 34.5–34.7 PSU and 34.8–35.0 PSU, as well as bTEMP below 4 °C (SI2).
The GAM model for F. borealis biometric data (SI3), also run with a Quasi-Poisson regression, explained substantial variance and deviance for trunk lengths (58.7% and 66.6%, respectively), but less so for tail lengths (19.1% and 34.8%). Presence of sea ice was associated with generally higher predicted trunk lengths (1.28 mm) than open water conditions (1.13 mm), whereas predicted tail lengths were similar (~0.35 mm) across conditions, with no statistical significance (SI3). While linear relationships were predicted between trunk lengths and environmental variables, only bSAL showed a significant effect (F = 21.3, p<0.001) for values above 34.8 PSU (SI3). No significant hydrological predictors were found on tail lengths (SI3).
5 Discussion
5.1 Interannual distribution of Arctic larvaceans
Our results reveal two distinct temporal clusters in the long-term distribution of larvaceans in Kongsfjorden, corresponding to a major oceanographic shift: from a warm, AW-influenced regime beginning in 2010 and peaking in 2017, to a cooling trend starting in 2018, signaling a return to more Arctic-like conditions (Figure 2; De Rovere et al., 2022). While De Rovere et al. (2022) explain the event of 2016–2017 as a consequence of anomalous Atlantic windstorms intruding AW in the Arctic, recent findings by Dey et al. (2024) suggest that AW intruding in Kongsfjorden in 2016–2017 could follow the strengthening and weakening of the Atlantic-Meridional Overturning Circulation (AMOC). The increasing AW intrusion and loss of sea ice in the Arctic are altering the Arctic dense water formation zones, which are the motive force of the AMOC (Wake, 2025).
Between 2010 and 2016, O. vanhoeffeni was generally scarce and F. borealis was absent, as also observed by D’Angelo et al. (2024). A notable exception occurred in 2011, when O. vanhoeffeni peaked extraordinarily, coinciding with the sinking of cold and salty waters to the bottom (D’Angelo et al., 2024) and the highest sea ice coverage recorded during the entire time series (Figure 3; Tverberg et al., 2019; Gerland et al., 2022).
From 2017 to 2023, however, both species increase in occurrence, responding to the reappearance of Surface Waters (SW) in shallower depths and Intermediate Waters (IW) near the bottom (Figure 2), and to the renewed sea ice coverage (Figure 3). In particular, the increased frequency of IW since 2019 (Figure 2) has overlapped with the rise of O. vanhoeffeni (Figure 4a), reinforcing its high affinity for water masses produced by mixing processes between glacial meltwaters, ArW and AW (Svendsen et al., 2002; Tverberg et al., 2019; De Rovere et al., 2022). Its occurrence during ice-covered periods or shortly after ice retreat (Figure 3A) further supports its cryophilic nature. F. borealis appeared from mid-July 2017 and during the summers of 2019, 2020, 2021 and 2023, albeit with low flux intensity (Figure 4B). This is consistent with earlier studies showing low occurrences of this species in the inner fjord using traditional nets (Walkusz et al., 2009; Kwaśniewski and Ronowicz, 2025). Since 2020, the species has been restricted to May-June, likely corresponding to the intrusion of saltier Transformed Atlantic Waters (TAW) and AW; however, some specimens appeared in December 2022-February 2023 when a brief increase in TAW was registered (Figure 2).
Overall, the multi-annual distribution of larvaceans in Kongsfjorden appears to be strongly influenced by local hydrological dynamics and sea ice variability. O. vanhoeffeni appears to benefit from cooler and fresher regimes and increased frequency of SW and IW, F. borealis responds positively to warmer and saltier TAW and AW intrusions. These species may thus serve as biological indicators of the alternating dominance between Arctic-like and Atlantic-type conditions, each responding through distinct patterns of occurrence and distribution.
5.2 Seasonal succession and niche separation of Arctic larvaceans in response to short-term oceanographic variability
Beyond interannual variability, our data also reveal a clear seasonal succession of polar Appendicularia. Notably, no significant correlation was found between O. vanhoeffeni and F. borealis, supporting the idea that these species occupy distinct ecological niches and do not compete during their rare periods of co-occurrence in spring and summer (Figure 4).
O. vanhoeffeni mainly occurred from late autumn to winter, with peaks between November and January, whereas F. borealis appeared from spring to late summer, typically peaking in May-June. These findings align with previous observations in Kongsfjorden and the Fram Strait (Blachowiak-Samolyk et al., 2007; Lischka and Hagen, 2016), despite Oikopleuridae in the fjord having been observed also in July (Lischka and Hagen, 2016; Hop et al., 2019), suggesting some variability in their seasonal occurrence. In contrast, in the Canadian Arctic, O. vanhoeffeni peaks later (spring to early summer), followed by F. borealis into September, while O. labradoriensis dominates in autumn (Choe and Deibel, 2008; Deibel et al., 2017). Similarly, Oikopleuridae are scarce from November to May in the Bering Sea, and F. borealis is rare in the Okhotsk Sea from December to June (Volkov, 2022). The Kongsfjorden succession, therefore, appears to be temporally anticipated compared to other Arctic ecosystems.
The described temporal succession in Kongsfjorden likely reflects a combination of: (i) seasonal shifts in water mass composition, and (ii) species-specific response to turbidity levels.
While O. vanhoeffeni was mostly associated with IW/SW and sea ice coverage or recent retreat, F. borealis did not show consistent trends with hydrological variables or sea ice, instead manifesting a strong association with TAW and AW. However, the general low occurrences of F. borealis in inner Kongsfjorden may be linked to its sensitivity to glacial runoff which decreases salinity, consistent with findings by Capitanio et al. (2018).
Turbidity also plays a key role in shaping O. vanhoeffeni dynamics. The species typically peaks in autumn, roughly 1 month after the summer turbidity maximum (Figure 2B). In the coastal ecosystem of the Canadian Beaufort Sea, O. vanhoeffeni was observed to appear during diffuse plume events from the Mackanzie River, whereas F. borealis mostly occurred in oceanic waters with low turbidity levels (Walkusz et al., 2010). Similarly, previous studies demonstrated turbidity as a factor segregating Oikopleuridae and Fritillaridae in the South Atlantic Ocean (Flores-Coto et al., 2010; Capitanio et al., 2018), possibly due to differences in particle selectivity (Fernandez et al., 2004) or gut morphologies and nutritional adaptations (Brena et al., 2003). According to Flores-Coto et al. (2010), Oikopleuridae tend to dominate in upwelling areas. As Kongsfjorden is part of an upwelling system (Meslard et al., 2018), it can furnish nutrient supply even in winter (De Rovere et al., 2024), potentially enhancing food availability for O. vanhoeffeni.
Taken together, these findings indicate that inner Kongsfjorden is a favorable habitat for O. vanhoeffeni, due to high productivity, glacial freshwater inputs, and upwelling conditions. These specific environmental preferences help explain the distinct flux intensities and temporal succession observed between O. vanhoeffeni and F. borealis, reflecting their contrasting ecological strategies. While O. vanhoeffeni emerges as a stenohaline, eurythermal, and cryophilic species strongly influenced by sea ice and freshwater inputs, F. borealis appears more tolerant to variable oceanographic conditions and less dependent on ice-related processes.
5.3 Phenology of Arctic larvaceans in Kongsfjorden
5.3.1 Oikopleura vanhoeffeni
Long-term monitoring of O. vanhoeffeni body size revealed that larger individuals were mainly associated with SW/IW at intermediate depths. while a more complex pattern emerged near the bottom: the largest specimens occurred in both ArW/LW and in warmer deep masses, suggesting high phenotypic plasticity.
Notably, juveniles collected in 2010 were significantly larger than those trapped in 2011 (Figures 6C, E), a difference possibly linked to the sinking of cold and dense waters, as described by D’Angelo et al. (2024), carrying bigger specimens from surface layers. Such dense water masses, originating from sea ice formation (Cottier et al., 2005; 2010; Tverberg et al., 2019; De Rovere et al., 2022), may represent optimal growth conditions for O. vanhoeffeni. A similar size reduction was observed in 2021 (Figures 6C, E), when TAW/IW occupied greater depths while IW/SW dominated in shallower layers (Figure 2). In this scenario, the stratification of the water column and the little sea ice coverage in spring (Figure 3) may have delayed the seasonal phytoplankton bloom (Hegseth and Tverberg, 2013; Hegseth et al., 2019), acting as preconditioning factors for undersized of O. vanhoeffeni juveniles.
Seasonal biometric analysis revealed the presence of two juvenile stages: the first occurring during autumn-winter (stage I, Figure 8A, Photos 1-2) and the second during spring-summer (stage II, Figure 8A, Photo 3). Stage I juveniles were significantly smaller than those in stage II (Table 2). Mature adults (Figure 8A, Photo 4) were mostly observed in summer, but adult size did not show clear seasonal variation (Table 2). Stage I juveniles were typically associated with an homogeneous vertical mixing of ArW/IW, lower turbidity (Figure 2), and the presence of sea ice (Figure 3), suggesting that hydrological conditions during the polar night strongly affect growth. During this period, feeding likely relies on microorganisms such as marine bacteria (Deibel, 1988) and flagellates (Urban et al., 1992; Acuña et al., 2002; Hegseth et al., 2019). The year-round feeding activity of O. vanhoeffeni, supported by the lack of overwintering behavior (Choe and Deibel, 2011), reinforces this hypothesis.
Figure 8
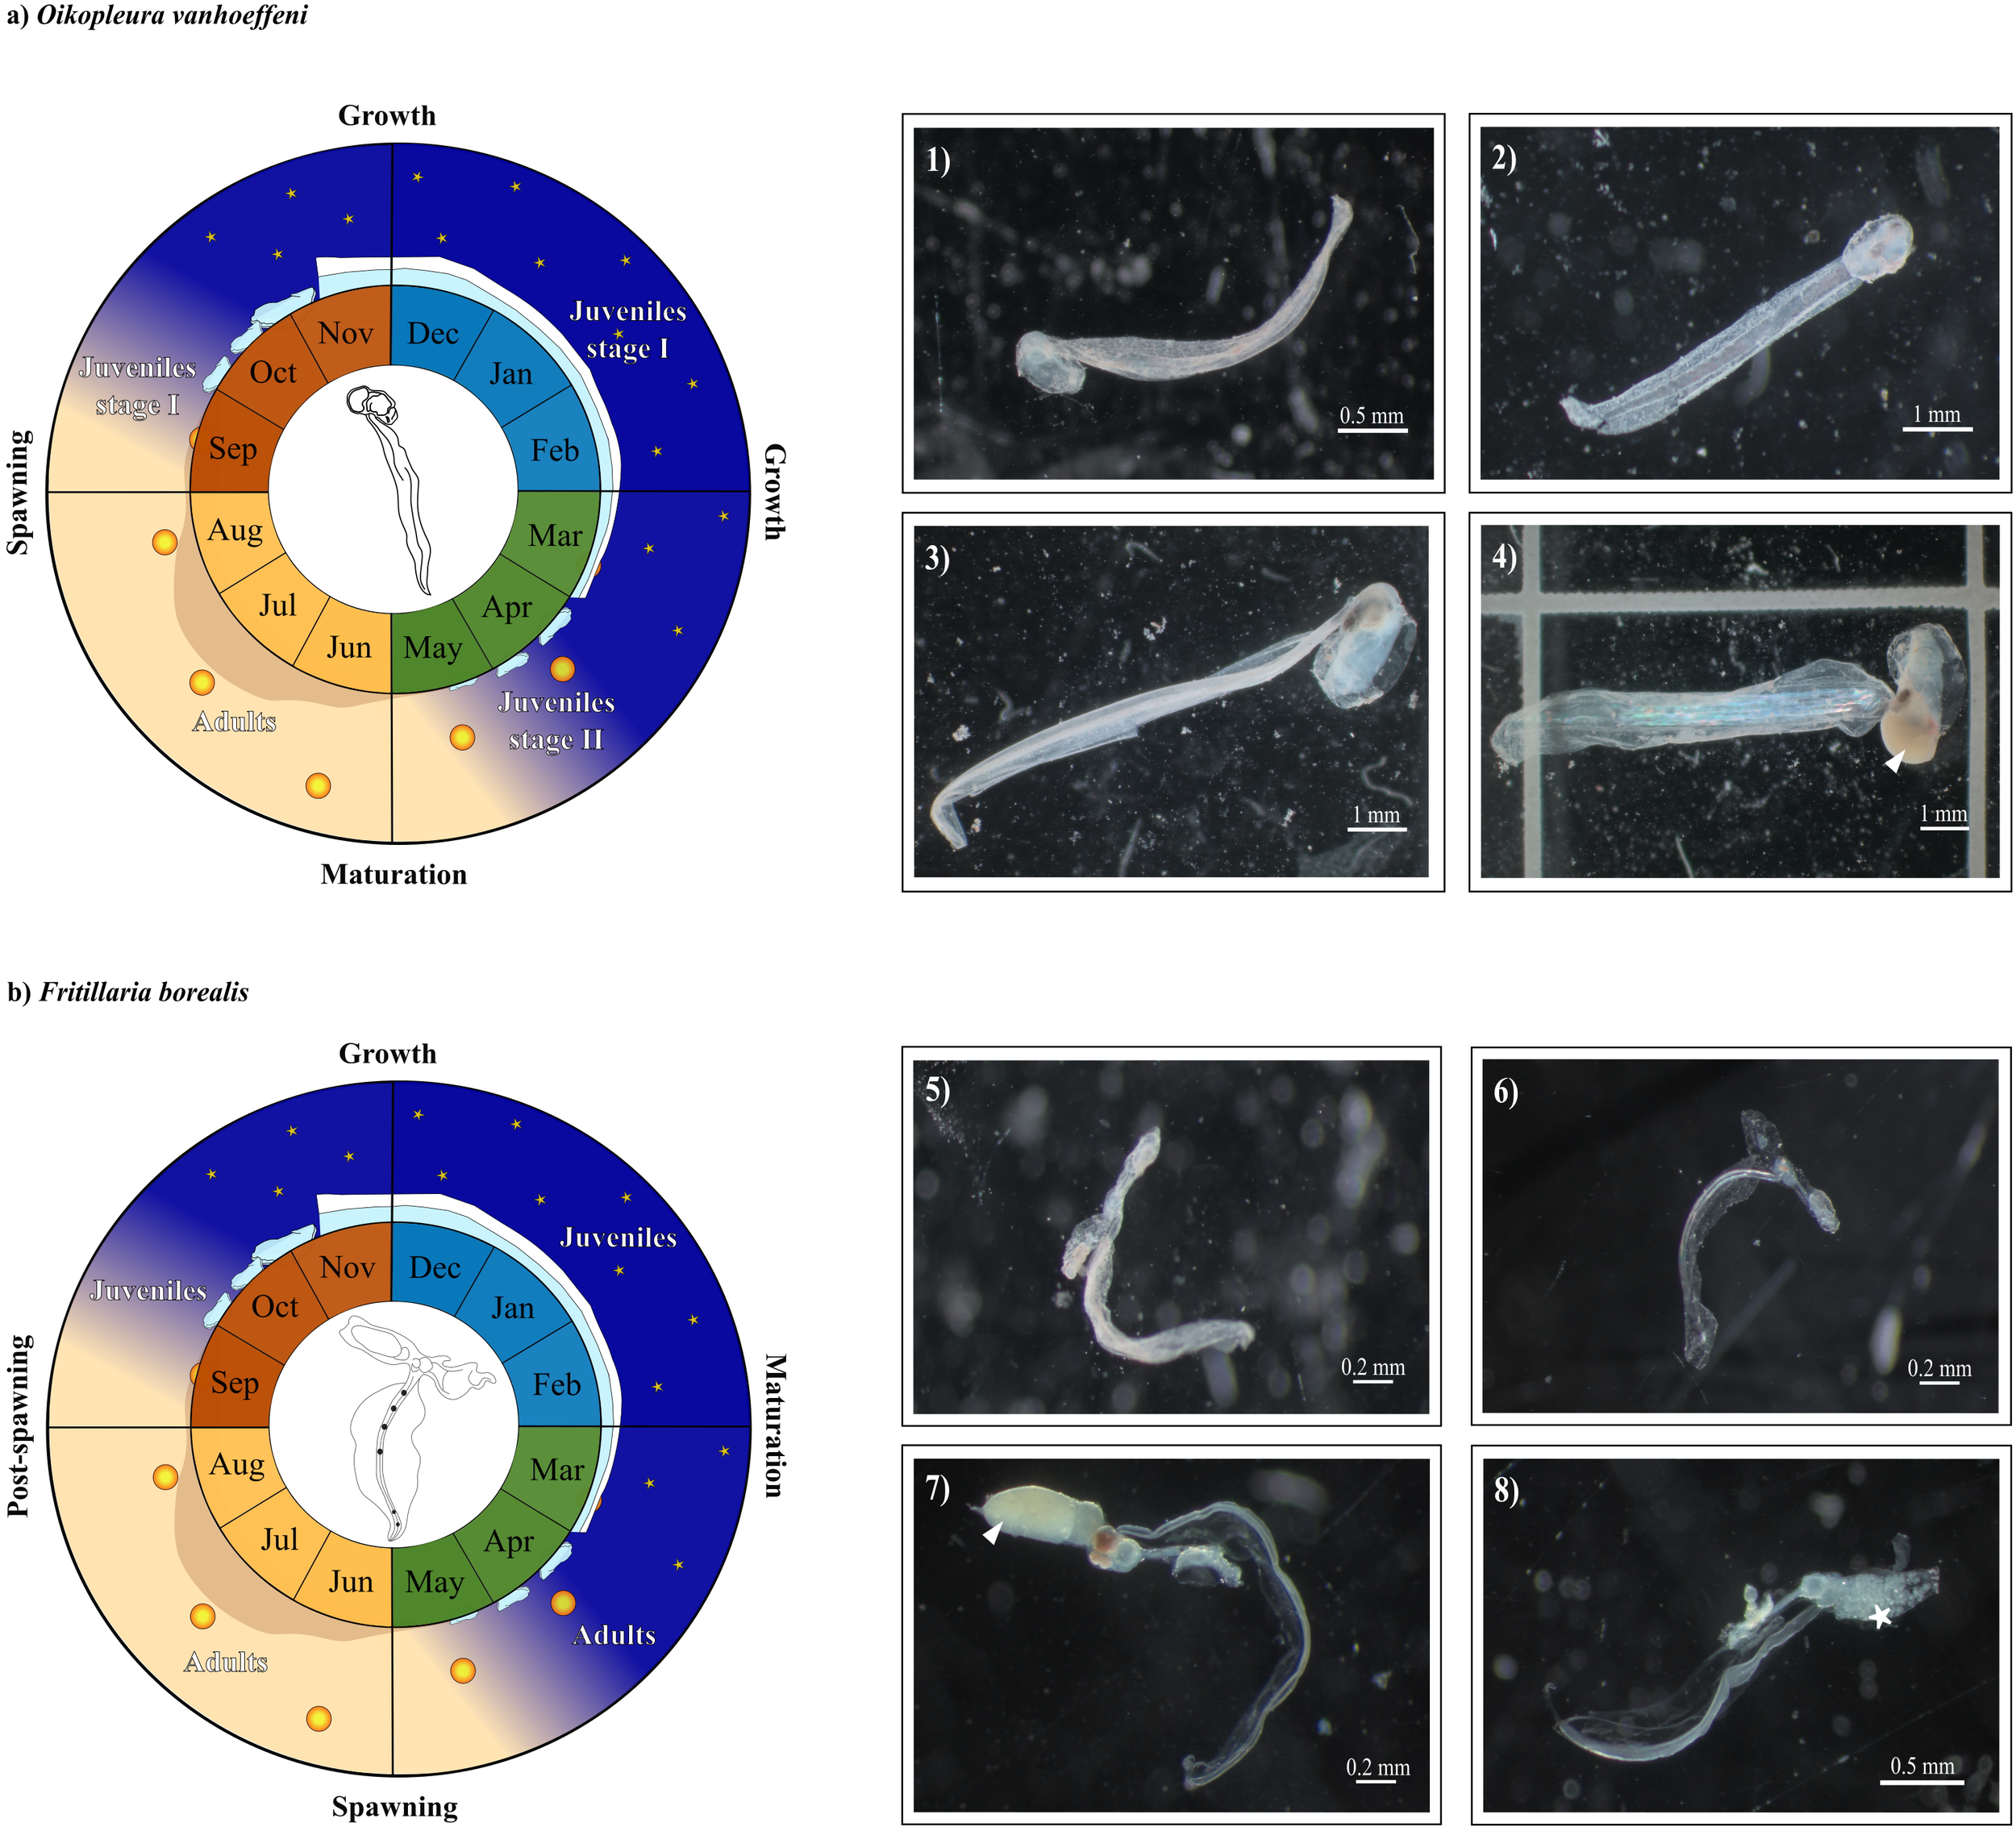
Illustration of (A)Oikopleura vanhoeffeni and (B)Fritillaria borealis phenology in the inner Kongsfjorden. (A) Examples of stage I juveniles of O. vanhoeffeni born in autumn (SON, Photo 1) and winter (DJF, Photo 2), stage II juveniles in spring (MAM, Photo 3), and a mature individual trapped in summer (JJA, Photo 4) with gonads (white triangle). (B) Juveniles of F. borealis in autumn (Photo 5) and winter (Photo 6), mature adult trapped in spring (Photo 7) with prominent gonads (white triangle), and in post-spawning phase (Photo 8) with releasing eggs (*).
Stage II included juveniles collected in spring-summer, during periods characterized by a vertical stratification induced by the intrusion of warmer water masses (Figure 2) and open water conditions following sea ice retreat (Figure 3). These conditions, combined with high turbidity levels (Figure 2) from glacial runoff and enhanced primary productivity, likely created favorable conditions for growth and maturation. This interpretation aligns with previous studies (Fenaux, 1976; Flores-Coto et al., 2010; Capitanio et al., 2018; Chitkara et al., 2024) highlighting the role of spring food availability and temperature in accelerating larvacean development.
Based on these patterns, we propose a 1-year phenological cycle for O. vanhoeffeni in inner Kongsfjorden (Figure 8A). Reproduction occurs in summer, followed by the development of stage I during the polar night. These juveniles live by feeding on microorganisms and, with the onset of the spring bloom, transition into stage II, which matures and reproduces in summer (Figure 8A).
5.3.2 Fritillaria borealis
Tail length variability among F. borealis juveniles (Figure 8B, Photos 5-6) showed significant interannual differences, although no significant pairwise distinctions emerged (Table 3), and hydrological variables did not significantly predict body size (SI3). This may be due to the limited number of juvenile specimens collected throughout the long-term series, which likely reduced statistical power. Moreover, the short and rapid generation time of F. borealis (Fenaux, 1976; Presta et al., 2015; Henriet et al., 2022) contribute to explain the high variability in growth patterns.
Despite these limitations, longer tails offer ecological advantages to juveniles, enhancing swimming efficiency, which is crucial for filter feeding (Conley et al., 2018; Hoover et al., 2021). Therefore, individuals with longer tails may thus be more effective at filtering large volumes of seawater and capturing fine particles, providing a competitive edge in spring-summer, when phytoplankton biomass and fine particulate matter from glacial runoff peak (D’Angelo et al., 2018).
In adults (Figure 8B, Photos 7-8), the longest trunk lengths were observed during summer, supporting the hypothesis that this is the primary reproductive period. The lack of juveniles in summer and adult presence in autumn-winter (Figure 7B) are consistent with a short life cycle and post-spawning mortality (Deibel et al., 1992; Presta et al., 2015). However, due to rapid maturation, mature adults may be found year-round.
In summary, the phenological cycle of F. borealis in inner Kongsfjorden is characterized by a peak of mature adults in spring-summer, followed by post-spawning decline and the emergence of juveniles, whose numbers increase from autumn into winter (Figure 8B).
5.4 Atlantic Water: an oceanographic barrier or a spreading channel?
The first appearance of F. borealis in our samples was recorded in summer 2017 (Figure 4B), following the most intense period of AW intrusion into Kongsfjorden. This observation raises an important ecological question: does AW act as an oceanographic barrier limiting larvacean distribution, or as a vector facilitating their dispersal from the fjord mouth to the inner bay?
While the role of AW in shaping Arctic larvacean biogeography remains unclear, our predictions indicate an overall increase in the occurrence of both O. vanhoeffeni and F. borealis under ongoing Atlantification. Specifically, O. vanhoeffeni is projected to increase at intermediate depths in response to saltier TAW/AW (Figure 5A) and warmer SW/IW (Figure 5C), and at greater depths with increasing IW/TAW (Figures 5B, D) and AW presence (Figure 5D). In contrast, F. borealis shows a strong association with AW, although no clear temporal trends emerge from our predictions. The observed bimodal distribution with bottom temperatures (Figures 5D, H) is associated with a great diversity of water masses in Kongsfjorden. Therefore, the prediction on larvacean abundances could reflect species-specific affinity for O. vanhoeffeni (linked to SW/IW) and F. borealis (affinity for TAW/AW).
Historical data report high densities in outer Kongsfjorden (Weslawski et al., 1991), with episodic summer peaks in the inner fjord following AW intrusions (Walkusz et al., 2009; Lischka and Hagen, 2016). Similar associations have been documented across the Fram Strait and Barents Sea (Arashkevich et al., 2002; Blachowiak-Samolyk et al., 2008, Blachowiak-Samolyk et al., 2007; Hop et al., 2019), and even in Antarctic fjords (Panasiuk and Kalarus, 2021). However, GAM models indicate that Arctic larvaceans benefit from extensive sea ice cover (Table 1), consistent with their current distribution habitat. Accordingly, Pantiukhin et al. (2024b) predicted a northward shift of O. vanhoeffeni into the Central Arctic, as sea ice retreats from lower latitudes, whereas F. borealis is expected to increase in Svalbard following the influx of AW.
These patterns suggest the potential for broader gelatinous larvacean dispersal in a warming Arctic, possibly colonizing northern areas and promoting bloom events under favorable conditions.
Projected responses to Atlantification suggest divergent morphological trends. With the increasing occurrences of open water hotspots, O. vanhoeffeni is expected to increase in body size while F. borealis is predicted to reduce its trunk lengths. These differences likely reflect a shift in phytoplankton communities, from diatom-dominated assemblages to nano- and picoplankton, and a transition from well-mixed, nutrient-rich waters to more stratified, oligotrophic conditions (Piquet et al., 2014; Van de Poll et al., 2021). In stratified open waters, delayed spring phytoplankton blooms caused by the reduced vertical mixing (Payne and Roesler, 2019; Szeligowska et al., 2022), may extend periods of food scarcity, potentially leading to a decrease in the S/V ratio and explaining smaller predicted sizes of F. borealis. This hypothesis aligns with general physiological models for filter-feeders, where body shape and S/V ratio are adjusted to optimize feeding efficiency under nutrient-limited conditions and in presence of nano- and picoplankton blooms. However, a flatter body plan like those of F. borealis (elongated trunk and forked tail) would represent an advantageous trait for food intake due to the lower S/V ratio compared to O. vanhoeffeni body plan (rounded trunk and ribbon-like tail). The hypothesis for such plasticity in larvaceans is supported by work showing tunicate responses to bloom dynamics at the molecular level (Sordino et al., 2019), and analogous morphological adaptations in other filter feeders such as echinopluteus larvae (Adams et al., 2011). Nevertheless, under scenarios of prolonged AW and TAW presence, both O. vanhoeffeni and F. borealis may increase their body sizes reflecting earlier gonadal development and anticipated breeding phases, as already proposed in sub-Antarctic waters (Capitanio et al., 2018; Kalarus and Panasiuk, 2021; Alves et al., 2025) and predicted for other gelatinous zooplankton (Pantiukhin et al., 2024b). On a general ecosystem scale, the predicted increase in abundance of F. borealis over O. vanhoeffeni in Kongsfjorden would evolve in a lower biomass availability in the community. In contrast to Oikopleuriids, F. borealis does not need to abandon its houses for escaping from predators, decreasing the sinking rates of houses and their contributions to the biological pump and benthic-pelagic coupling (Flood, 2003; Choe and Deibel, 2008; Flores-Coto et al., 2010; Jaspers et al., 2023). In fact, F. borealis produces houses with elastic properties, an advantageous energy-saving mechanism allowing for the preservation of secreted houses for a longer time compared to O. vanhoeffeni (Flood, 2003). Moreover, F. borealis has lower lipid contents than O. vanhoeffeni (Deibel et al., 1992; Båmstedt et al., 2005), therefore its predicted spreading under Atlantification in Kongsfjorden would decrease the energetic storage in the ecosystem, sensibly reducing the energy transfer through the food-web chain and involving from other secondary producers i.e., carnivorous copepods, amphipods, ctenophores and jellyfishes) to higher trophic levels, like seabirds feeding in the inner bay of the fjord (Hop et al., 2023). Similar conclusions emerged from Pettitt-Wade et al. (2020), and for other shifts as in the case of Themisto libellula/T. abyssorum (Arctic/Atlantic) (Kraft et al., 2012; Hop et al., 2019), and between Calanus glacialis/C. finmarchicus (Arctic/Atlantic) (Hop et al., 2019 and references in).
Therefore, in a context of Atlantification, we suggest that larvacean distribution, phenology and ecosystem impacts are shaped by an interplay of water mass properties, sea ice retreat, and phytoplankton community shifts resulting in species-specific morphological adaptations and changes in reproductive timing. In line with this interpretation, AW emerges as a key driver of Arctic larvacean biogeography: O. vanhoeffeni is expected to retreat poleward toward sea ice-covered regions, while F. borealis will likely expand into Kongsfjorden, tracking the increasing advection of AW/TAW and the dominance of smaller phytoplankton assemblages. By combining predicted effects on both abundance and body size of larvaceans, regional and species-related energetic net effects are expected to come: (i) energy-depletion in Kongsfjorden due to the increase of the significantly smaller F. borealis, and (ii) energy-rich communities following the spreading of the larger O. vanhoffeni in the Central Arctic.
This dual role of AW - as both a dispersal vector and environmental filter - highlights the complex, niche-specific responses of Arctic larvaceans to Atlantification and the cascading effects in their communities.
5.5 Effectiveness of sediment traps for larvacean sampling
Sediment trap sampling proved highly effective in this study for capturing pelagic tunicates. GAMs indicated that O. vanhoeffeni responded to changes in hydrological conditions at both 30 m and 90 m depths (Figures 5A-D), supporting the hypothesis that environmental gradients play a key role in shaping its vertical distribution. Notably, nearly all well-preserved specimens were collected in deep waters, suggesting that individuals were alive at the time of capture.
Larvaceans typically inhabit the upper 0–100 m of the water column, with peak occurrences in the photic layer (0–50 m) where food availability is highest (Mańko et al., 2020; Giménez et al., 2023), and they are highly tolerant of elevated food-particle concentrations (Acuña and Kiefer, 2000; Capitanio et al., 2018). Although weak swimmers, larvaceans are capable of active movements via tail beating (Hiebert et al., 2023) and respond to various environmental stimuli, including chemical signals (Deibel, 1986; Rigon et al., 2013; Van Le et al., 2023). In this context, sediment traps may function as attractants for larvaceans by concentrating both organic and inorganic particles (Aguiñiga et al., 2010; Makabe et al., 2016; Mańko et al., 2020; Ramondenc et al., 2023). We hypothesize that larvaceans may detect chemical cues in the water column potentially including those associated with particle rich-areas, or even the trap themselves, via ciliated olfactory cells as they actively swim and filter water (Poncelet and Shimeld, 2020; Hielbert et al., 2023). This hypothesis is supported by observations of Lombard et al. (2011), therefore traps may act as chemically detectable microhabitats for larvaceans. Another plausible explanation for the deep occurrence of larvaceans relates to the formation of dense water masses, as observed during the winters of 2010 and 2011 by D’Angelo et al. (2024). These conditions may promote the vertical transport of larvaceans or favor their survival in deeper waters.
Importantly, the use of formalin in the traps ensured immediate fixation of collected specimens, preserving delicate larvacean tissues in good conditions. This is demonstrated by comparing the sizes of F. borealis and O. vanhoeffeni of this study with biometric data acquired from Shiga (1976) and Maekakuchi et al. (2018), who adopted different sampling methods. This underscores the utility of sediment traps in studying the ecology and phenology of gelatinous zooplankton, which is often damaged or underestimated in traditional net sampling, without generating significant alterations in morphology and biometry.
6 Conclusion
The distribution of Arctic appendicularians in Kongsfjorden reflects a dynamic interplay between oceanographic variability, sea ice coverage and trophic conditions. O. vanhoeffeni is closely associated with fresher and warm SW and IW, while F. borealis appears linked to occasional intrusions of saltier TAW and AW, on both interannual and seasonal scales. However, the absence of F. borealis sightings before 2019 could reflect: (i) a patchy distribution of the species, or (ii) episodic mismatch between AW pulses and our sampling. In this perspective, further investigation is needed using environmental DNA (eDNA) technologies, allowing for a more sensible detection of F. borealis presence in the inner Kongsfjorden. Phenological patterns indicate an annual cycle for O. vanhoeffeni and semiannual rhythms for F. borealis, led by seasonal water mass variability, turbidity and sea ice dynamics. These results support the view of Kongsfjorden as a favorable habitat for the cryophilic, stenohaline O. vanhoeffeni while high turbidity levels and freshwater discharge from tidewater glaciers likely limit the occurrence of the more euryhaline F. borealis. Further studies regarding the biochemical composition and vertical fluxes of suspended particles, the relationships between chlorophyll-a concentration and larvaceans in the fjord, as well as their clearance rates of larvaceans are needed to disentangle the gaps between the species, primary production and turbidity impacts.
The divergent responses of the two species underscore their ecological plasticity and potential as indicators of climate-driven environmental shifts in Arctic marine ecosystems. Under the ongoing Atlantification, larvacean abundances are expected to increase in both space and time, contributing to the “Jellification” of polar waters. However, their biogeographical distribution will remain species-specific: O. vanhoeffeni is predicted to retreat poleward with ice edge, while F. borealis will likely expand further into Arctic fjords under warming and stratification. Differences in their sizes would promote cascading effects on marine communities, potentially decreasing their contribution in Kongsfjorden due to the smaller biomass of F. borealis. By contrast, the predicted poleward spreading of O. vanhoeffeni could generate an increase in the total zooplankton biomass in high-Arctic marine communities, not affected by warm AW intrusions.
To anticipate these changes, long-term series and predictive models are essential for capturing species-specific dynamics and improving our understanding of planktonic tunicate responses in a rapidly transforming Arctic Ocean.
Statements
Data availability statement
The oceanographic datasets used in this study can be found in the following repositories:MDI Mooring CTD data at 30 m [https://doi.org/10.53132/CNR-ISP.2024.DAT.GCC.OCE.ART.52], MDI Mooring CTD data at 90 m [https://doi.org/10.53132/CNR-ISP.2024.DAT.GCC.OCE.ART.54]. Biological dataset is published in the repository: Composition and morpho-functional traits of 753 zooplankton swimmers and sinkers collected by "Mooring Dirigibile Italia" sediment trap. Version 1.12. [https://ipt.vliz.be/cnr-isp/resource?r=kairos_dto_bioflow&v=1.12].
Ethics statement
The manuscript presents research on animals that do not require ethical approval for their study.
Author contributions
AN: Conceptualization, Data curation, Formal Analysis, Methodology, Writing – original draft. FP: Conceptualization, Data curation, Formal Analysis, Funding acquisition, Investigation, Methodology, Project administration, Resources, Software, Supervision, Validation, Visualization, Writing – review & editing. GI: Data curation, Investigation, Methodology, Resources, Validation, Writing – review & editing. LL: Conceptualization, Funding acquisition, Investigation, Methodology, Resources, Supervision, Writing – review & editing. TT: Funding acquisition, Methodology, Writing – review & editing. JT: Data curation, Methodology, Validation, Writing – review & editing. PG: Conceptualization, Data curation, Formal Analysis, Funding acquisition, Methodology, Validation, Writing – original draft, Writing – review & editing.
Funding
The author(s) declare financial support was received for the research and/or publication of this article. This paper represents a contribution from the DTO-BioFlow – HORIZON-MISS-2022-OCEAN-01 – 101112823 - FSTP Grant Agreement Projects “KAIROS - ZooplanKton data from Arctic marIne time-seRies to understand biOdiversity dynamicS”; HORIZON-CL6-2023-Zero Pollution “ICEBERG - Innovative Community Engagement for Building Effective Resilience and Arctic Ocean pollution-control Governance in the context of climate change” (CUP B63C23001840006); and EU-Next Generation Project-IR0000032 “PNRR-ITINERIS - Italian Integrated Environmental Research Infrastructures System” - (CUP B53C22002150006).
Acknowledgments
We express our sincere gratitude to CNR Arctic Station Dirigibile Italia and Kings Bay AS for their invaluable logistic support in Ny-Ålesund (Svalbard Island). Special thanks are extended to Dr. S. Miserocchi, Dr. F. Giglio, and to the captain of MS Teisten for their invaluable assistance during the field works, and mooring deployment and recovery.
Conflict of interest
The authors declare that the research was conducted in the absence of any commercial or financial relationships that could be construed as a potential conflict of interest.
Generative AI statement
The author(s) declare that no Generative AI was used in the creation of this manuscript.
Any alternative text (alt text) provided alongside figures in this article has been generated by Frontiers with the support of artificial intelligence and reasonable efforts have been made to ensure accuracy, including review by the authors wherever possible. If you identify any issues, please contact us.
Publisher’s note
All claims expressed in this article are solely those of the authors and do not necessarily represent those of their affiliated organizations, or those of the publisher, the editors and the reviewers. Any product that may be evaluated in this article, or claim that may be made by its manufacturer, is not guaranteed or endorsed by the publisher.
Supplementary material
The Supplementary Material for this article can be found online at: https://www.frontiersin.org/articles/10.3389/fmars.2025.1664196/full#supplementary-material
References
1
Acuña J. L. Deibel D. Saunders P. A. Booth B. Hatfield E. Klein B. et al . (2002). Phytoplankton ingestion by appendicularians in the North Water. Deep. Sea. Res. II.: Top. Stud. Oceanogr.49, 5101–5115. doi: 10.1016/S0967-0645(02)00180-7
2
Acuña J. L. Kiefer M. (2000). Functional response of the appendicularian Oikopleura dioica. Limnol. Oceanogr.45, 608–618. doi: 10.4319/lo.2000.45.3.0608
3
Adams D. K. Sewell M. A. Angerer R. C. Angerer L. M. (2011). Rapid adaptation to food availability by a dopamine-mediated morphogenetic response. Nat. Commun.2, 592. doi: 10.1038/ncomms1603
4
Aguiñiga S. Sanchez A. Silverberg N. (2010). Temporal variations of C, N, δ13C, and δ15N in organic matter collected by a sediment trap at Cuenca Alfonso, Bahía de la Paz, SW Gulf of California. Continent. Shelf. Res.30, 1692–1700. doi: 10.1016/j.csr.2010.07.005
5
Aguirre G. Capitanio F. Viñas M. Esnal G. (2006). Gonadal development, allometric growth and ecological impact of Appendicularia sicula (Appendicularia: Fritillariidae) from the south-western Atlantic Ocean. J. Mar. Biol. Assoc. United. Kingdom.86, 1215–1220. doi: 10.1017/S0025315406014214
6
Aliani S. Sciascia R. Conese I. D’Angelo A. Del Bianco F. Giglio F. et al . (2016). Characterization of seawater properties and ocean heat content in Kongsfjorden, Svalbard Archipelago. Rendiconti. Lincei.27, 155–162. doi: 10.1007/s12210-016-0544-4
7
Alves N. Spinelli M. L. Martin J. Malits A. Capitanio F. L. (2025). Ecological role of pelagic appendicularians in sub-Antarctic coastal and oceanic waters of the Southwest Atlantic Ocean. Polar. Biol.48, 28. doi: 10.1007/s00300-024-03331-z
8
Arashkevich E. Wassmann P. Pasternak A. Riser C. W. (2002). Seasonal and spatial changes in biomass, structure, and development progress of the zooplankton community in the Barents Sea. J. Mar. Syst.38, 125–145. doi: 10.1016/S0924-7963(02)00173-2
9
Atherden F. Slomska A. Manno C. (2024). Sediment trap illustrates taxon-specific seasonal signals in Southern Ocean zooplankton. Mar. Biol.171, 173. doi: 10.1007/s00227-024-04487-2
10
Båmstedt U. Fyhn J. H. Martinussen M. B. Mjavatten O. Grahl-Nielsen O. (2005). “ Seasonal distribution, diversity and biochemical composition of appendicularians in Norwegian fjords,” in Response of Marine Ecosystems to Global Change (Paris: GB Scientific Publisher). Eds. GorskyG.YoungbluthM. J.DeibelD., 227–254.
11
Bensi M. Civitarese G. Borme D. Caroppo C. Caruso G. Cerino F. et al . (2025). The Italian contribution to the Synoptic Arctic Survey programme: the 2021 CASSANDRA cruise (LB21) through the Greenland Sea Gyre along the 75°N transect. Earth Syst. Sci. Data Discuss. 17, 3701–3719. doi: 10.5194/essd-2025-37. preprint in review.
12
Blachowiak-Samolyk K. Kwasniewski S. Dmoch K. Hop H. Falk-Petersen S. (2007). Trophic structure of zooplankton in the Fram Strait in spring and autumn 2003. Deep. Sea. Res. II.: Top. Stud. Oceanogr.54, 2716–2728. doi: 10.1016/j.dsr2.2007.08.004
13
Blachowiak-Samolyk K. Søreide J. E. Kwasniewski S. Sundfjord A. Hop H. Falk-Petersen S. et al . (2008). Hydrodynamic control of mesozooplankton abundance and biomass in northern Svalbard waters (79–81°N). Deep. Sea. Res. II.: Top. Stud. Oceanogr.55, 2210–2224. doi: 10.1016/j.dsr2.2008.05.018
14
Brena C. Cima F. Burighel P. (2003). The exceptional “Blind” Gut of appendicularia sicula (Appendicularia, tunicata). Zool. Anz.242, 169–177. doi: 10.1078/0044-5231-00096
15
Brotz L. Cheung W. W. L. Kleisner K. Pakhomov E. Pauly D. (2012). Increasing jellyfish populations: trends in Large Marine Ecosystems. Hydrobiologia690, 3–20. doi: 10.1007/s10750-012-1039-7
16
Capitanio F. L. Esnal G. B. Fernández-Severini M. D. Alvarez Colom G. (2018). “ Ecological role of common appendicularian species from shelf waters off Argentina,” in Plankton ecology of the Southwestern Atlantic. Eds. HoffmeyerM. S.SabatiniM. E.BrandiniF. P.CalliariD.SantinelliN. H. ( Springer, Cham), 207–224. doi: 10.1007/978-3-319-77869-3_10
17
Chatterjee S. Raj R. P. Bertino L. Skagseth Ø. Ravichandran M. Johannessen O. M. (2018). Role of Greenland Sea gyre circulation on Atlantic Water temperature variability in the Fram Strait. Geophys. Res. Lett.45, 8399–8406. doi: 10.1029/2018GL079174
18
Chiarini F. Capotondi L. Dunbar R. B. Giglio F. Mammì I. Mucciarone D. A. et al . (2013). A revised sediment trap splitting procedure for samples collected in the Antarctic sea. Methods Oceanogr.8, 13–22. doi: 10.1016/j.mio.2014.05.003
19
Chitkara C. Juul-Pedersen T. Krawczyk D. Søreide J. E. Vader A. Gradinger R. et al . (2024). Seasonality in phytoplankton communities and production in three Arctic fjords across a climate gradient. Progr. Oceanogr.227, 103317. doi: 10.1016/j.pocean.2024.103317
20
Choe N. Deibel D. (2008). Temporal and vertical distributions of three appendicularian species (Tunicata) in Conception Bay, Newfoundland. J. Plankton. Res.30, 969–979. doi: 10.1093/plankt/fbn064
21
Choe N. Deibel D. (2011). Life history characters and population dynamics of the boreal larvacean Oikopleura vanhoeffeni (Tunicata) in Conception Bay, Newfoundland. J. Mar. Biol. Assoc. United. Kingdom.91, 1587–1598. doi: 10.1017/S0025315410001876
22
Conley K. R. Gemmell B. J. Bouquet J.-M. Thompson E. M. Sutherland K. R. (2018). A self-cleaning biological filter: How appendicularians mechanically control particle adhesion and removal. Limnol. Oceanogr.63, 927–938. doi: 10.1002/lno.10680
23
Cottier F. Nilsen F. Skogseth R. Tverberg V. Skardhamar J. Svendsen H. (2010). Arctic fjords: A review of the oceanographic environment and dominant physical processes. Geol. Soc Lond. Spec. Publ.344, 35–50. doi: 10.1144/SP344.4
24
Cottier F. Tverberg V. Inall M. Svendsen H. Nilsen F. Griffiths C. (2005). Water mass modification in an Arctic fjord through cross-shelf exchange: The seasonal hydrography of Kongsfjorden, Svalbard. J. Geophys. Res. Oceans.110, 1–18. doi: 10.1029/2004JC002757
25
D’Angelo A. Giglio F. Miserocchi S. Sanchez-Vidal A. Aliani S. Tesi T. et al . (2018). Multi-year particle fluxes in Kongsfjorden, Svalbard. Biogeosciences15, 5343–5363. doi: 10.5194/bg-15-5343-2018
26
D’Angelo A. Mayers K. Renz J. Conese I. Miserocchi S. Giglio F. et al . (2024). Multi-year mesozooplankton flux trends in Kongsfjorden, Svalbard. Polar. Biol.47, 589–605. doi: 10.1007/s00300-024-03251-y
27
Deibel D. (1988). Filter feeding by Oikopleura vanhoeffeni: grazing impact on suspended particles in cold ocean waters. Mar. Biol.99, 177–186. doi: 10.1007/BF00391979
28
Deibel D. Cavaletto J. Riehl M. Gardner W. (1992). Lipid and lipid class content of the pelagic tunicate Oikopleura vanhoeffeni. Mar. Ecol. Prog. Ser.88, 297–302. doi: 10.3354/meps088297
29
Deibel D. Saunders P. A. Stevens C. J. (2017). Seasonal phenology of appendicularian tunicates in the North Water, northern Baffin Bay. Polar. Biol.40, 1289–1310. doi: 10.1007/s00300-016-2053-4
30
Deja K. (2025). Observation of discarded larvacean houses in the benthic and pelagic zones of spitsbergen fjords using drop-camera imagery. doi: 10.21203/rs.3.rs-5921295/v1. preprint.
31
De Rovere F. Langone L. Schroeder K. Miserocchi S. Giglio F. Aliani S. et al . (2022). Water masses variability in inner kongsfjorden (Svalbard) during 2010–2020. Front. Mar. Sci.9. doi: 10.3389/fmars.2022.741075
32
De Rovere F. Zanchettin D. Rubino A. Langone L. Calogiuri F. Ruggieri P. et al . (2024). Winter intrusions of atlantic water in kongsfjorden: oceanic preconditioning and atmospheric triggering. J. Geophys. Res. Oceans.129, e2023JC020095. doi: 10.1029/2023JC020095
33
Dey D. Marsh R. Drijfhout S. Josey A. S. Sinha B. Grist J. et al . (2024). Formation of the Atlantic Meridional Overturning Circulation lower limb is critically dependent on Atlantic-Arctic mixing. Nat. Commun.15, 7341. doi: 10.1038/s41467-024-51777-w
34
Eisner L. B. Napp J. M. Mier K. L. Pinchuk A. I. Andrews A. G. (2014). Climate-mediated changes in zooplankton community structure for the eastern Bering Sea. Deep. Sea. Res. Part II.: Topical. Stud. Oceanogr.109, 157–171. doi: 10.1016/j.dsr2.2014.03.004
35
Fenaux R. (1976). Cycle vital, croissance et production chez Fritillaria pellucida (Appendicularia), dans la baie de Villefranche-sur-Mer, France. Mar. Bio.34, 229–238. doi: 10.1007/BF00388800
36
Fernandez D. Lopez A. Fernandez A. Acuña J. Harris R. (2004). Retention efficiency of 0.2 to 6 µm particles by the appendicularians Oikopleura dioica and Fritillaria borealis. Mar. Ecol. Progr. Ser.266, 89–101. doi: 10.3354/meps266089
37
Fischer P. Happel L. Lienkämper M. Spotowitz L. Brand M. Brix H. (2022). Hydrographical time series data of the littoral zone of Kongsfjorden, Svalbard 2021 [dataset] (PANGAEA: Alfred Wegener Institute - Biological Institute Helgoland). doi: 10.1594/PANGAEA.950174
38
Fischer P. Lienkämper M. Schwanitz M. Brix H. (2024). Hydrographical time series data of the littoral zone of Kongsfjorden, Svalbard 2023 [dataset] (PANGAEA: Alfred Wegener Institute - Biological Institute Helgoland). doi: 10.1594/PANGAEA.967739
39
Fischer P. Posner U. Gattuso J. P. Alliouane S. Spotowitz L. Schwanitz M. et al . (2021). Hydrographical time series data of the littoral zone of Kongsfjorden, Svalbard 2019 [dataset] (PANGAEA: Alfred Wegener Institute - Biological Institute Helgoland). doi: 10.1594/PANGAEA.927607
40
Fischer P. Schwanitz M. Brand M. Posner U. Brix H. Baschek B. (2018). Hydrographical time series data of the littoral zone of Kongsfjorden, Svalbard 2014 [dataset] (PANGAEA: Alfred Wegener Institute - Biological Institute Helgoland). doi: 10.1594/PANGAEA.896821
41
Fischer P. Schwanitz M. Brand M. Posner U. Gattuso J. P. Alliouane S. et al . (2019). Hydrographical time series data of the littoral zone of Kongsfjorden, Svalbard 2018 [dataset] (PANGAEA: Alfred Wegener Institute - Biological Institute Helgoland). doi: 10.1594/PANGAEA.897349
42
Flores-Coto C. Sanvicente L. Vazquez-Gutierrez F. Sanchez-Ramirez M. (2010). Mesoscale distribution of Oikopleura and Fritillaria (Appendicularia) in the Southern Gulf of Mexico: spatial segregation. Rev. Biol. Mar. Oceanogr.45, 379–388. doi: 10.4067/s0718-19572010000300002
43
Franco P. Chen H. Liu G. (2014). Distribution and abundance of pelagic tunicates in the North Yellow Sea. J. Ocean. Univ. China13, 782–790. doi: 10.1007/s11802-014-2376-0
44
Gerland S. Pavlova O. Marnela M. Divine D. Kohler J. Renner A. H. et al . (2022). Sea ice extent variability in Kongsfjorden, Svalbard during 2003-2024, based on visual observations from the mountain Zeppelinfjellet. [Dataset] (Tromsø, Norway: Norwegian Polar Institute). doi: 10.21334/NPOLAR.2022.D6D31F5B
45
Giménez E. M. Nocera A. C. Temperoni B. Winkler G. (2023). Appendicularians and marine snow in situ vertical distribution in Argentinean Patagonia. J. Plankton. Res.45, 239–254. doi: 10.1093/plankt/fbac072
46
Giordano P. Titocci J. Ingrosso G. Nicolai A. Berra G. (2025). Composition and morpho-functional traits of zooplankton swimmers and sinkers collected by “Mooring Dirigibile Italia” sediment trap. Version 1.12. Consiglio Nazionale delle Ricerche, Istituto di Scienze Polari. Samplingevent dataset. Available online at: https://ipt.vliz.be/cnr-isp/resource?r=kairos_dto_bioflow&v=1.12 (Accessed March 01, 2025).
47
Gislason A. Astthorsson O. S. (1992). Zooplankton collected by sediment trap moored in deep water south of Iceland. Sarsia77, 219–224. doi: 10.1080/00364827.1992.10413507
48
Hegseth E. N. Assmy P. Wiktor J. Wiktor J. Kristiansen S. Leu E. et al . (2019). “ Phytoplankton seasonal dynamics in Kongsfjorden, Svalbard and the adjacent shelf,” in The ecosystem of Kongsfjorden, Svalbard. Advances in Polar Ecology, vol. 2 . Eds. HopH.WienckeC. ( Springer, Cham), 173–227. doi: 10.1007/978-3-319-46425-1_6
49
Hegseth E. N. Tverberg V. (2013). Effect of Atlantic water inflow on timing of the phytoplankton spring bloom in a high Arctic fjord (Kongsfjorden, Svalbard). J. Mar. Syst.113–114, 94–105. doi: 10.1016/j.jmarsys.2013.01.003
50
Henriet S. Aasjord A. Chourrout D. (2022). Laboratory study of Fritillaria lifecycle reveals key morphogenetic events leading to genus-specific anatomy. Front. Zool.19, 26. doi: 10.1186/s12983-022-00471-y
51
Hiebert T. C. Gemmel B. J. von Dassow G. Conley K. R. Sutherland K. R. (2023). The hydrodynamics and kinematics of the appendicularian tail underpin peristaltic pumping. J. R. Soc Interface, 2020230404. doi: 10.1098/rsif.2023.0404
52
Hoover A. P. Daniels J. Nawroth J. C. Katija K. (2021). A computational model for tail undulation and fluid transport in the giant larvacean. Fluids6, 88. doi: 10.3390/fluids6020088
53
Hop H. Wold A. Vihtakari M. Assmy P. Kuklinski P. Kwasniewski S. et al . (2023). Tidewater glaciers as “climate refugia” for zooplankton-dependent food web in Kongsfjorden, Svalbard. Front. Mar. Sci.10. doi: 10.3389/fmars.2023.1161912
54
Hop H. Wold A. Vihtakari M. Daase M. Kwasniewski S. Gluchowska M. et al . (2019). “ Zooplankton in kongsfjorden, (1996–2016) in relation to climate change,” in The Ecosystem of Kongsfjorden, Svalbard, Advances in Polar Ecology ( Springer International Publishing, Cham), 229–300. doi: 10.1007/978-3-319-46425-1_7
55
Hopcroft R. R. (2005). “ Diversity in larvaceans: How many species?,” in Response of Marine Ecosystems to Global Change: Ecological Impact of Appendicularians. Eds. GorskyG.YoungbluthM. J.DeibelD. ( Editions Scientifiques, Paris), 45–57.
56
IPCC (2019). Climate Change and Land: an IPCC special report on climate change, desertification, land degradation, sustainable land management, food security, and greenhouse gas fluxes in terrestrial ecosystems. Eds. ShuklaP. R.SkeaJ.Calvo BuendiaE.Masson-DelmotteV.PörtnerH.-O.RobertsD. C.ZhaiP.SladeR.ConnorsS.van DiemenR.et al, In press.
57
Jaspers C. Hopcroft R. R. Kiørboe T. Lombard F. López-Urrutia Á. Everett J. D. et al . (2023). Gelatinous larvacean zooplankton can enhance trophic transfer and carbon sequestration. Trends Ecol. Evol.38, 980–993. doi: 10.1016/j.tree.2023.05.005
58
Kalarus M. Panasiuk A. (2021). Spatial distribution patterns of appendicularians in the drake passage: potential indicators of water masses? Diversity13, 286. doi: 10.3390/d13070286
59
Kwaśniewski S. Ronowicz M. (2025). IO PAN Arctic Zooplankton. Version 1.2 (Sopot, Polonia: Institute of Oceanology Polish Academy of Sciences). Occurrence dataset. doi: 10.15468/jarj63
60
Lindsay M. C. M. Williams G. D. (2010). Distribution and abundance of larvaceans in the southern ocean between 30 and 80°E. Deep. Sea. Res. Part II.57, 905–915. doi: 10.1016/j.dsr2.2009.04.021
61
Lischka S. Hagen W. (2016). Seasonal dynamics of mesozooplankton in the Arctic Kongsfjord (Svalbard) during year-round observations from August 1998 to July 1999. Polar. Biol.39, 1859–1878. doi: 10.1007/s00300-016-2005-z
62
Lohmann H. (1896). Die Appendicularien der Plankton-Expedition. Ergebnisse der Plankton-Expedition der Humboldt-Stiftung. 2 Ec (Kiel & Leipzig: Verlag von Lipsius & Tischer). 148.
63
Lombard F. Selander E. Kiørboe T. (2011). Active prey rejection in the filter-feeding appendicularian Oikopleura dioica. Limnol. Oceanogr.56, 1504–1512. doi: 10.4319/lo.2011.56.4.1504
64
Maekakuchi M. Abe Y. Matsuno K. Hirawake T. Yamaguchi A. (2018). Appendicularian community in the Bering and Chukchi Seas: Horizontal and vertical distribution and population structure during the summer of 2007. Bull. Fisheries. Sci.68, 43–49. doi: 10.14943/bull.fish.68.3.43
65
Makabe R. Hattori H. Sampei M. Darnis G. Fortier L. Sasaki H. (2016). Can sediment trap-collected zooplankton be used for ecological studies? Polar. Biol.39, 2335–2346. doi: 10.1007/s00300-016-1900-7
66
Mańko M. K. Gluchowska M. Weydmann-Zwolicka A. (2020). Footprints of Atlantification in the vertical distribution and diversity of gelatinous zooplankton in the Fram Strait (Arctic Ocean). Prog. Oceanogr.189, 102414. doi: 10.1016/j.pocean.2020.102414
67
Meslard F. Bourrin F. Many G. Kerhervé P. (2018). Suspended particle dynamics and fluxes in an Arctic fjord (Kongsfjorden, Svalbard). Estuar. Coast. Shelf. Sci.204, 212–224. doi: 10.1016/j.ecss.2018.02.020
68
Muilwijk M. Smedsrud L. H. Ilicak M. Drange H. (2018). Atlantic Water heat transport variability in the 20th century Arctic Ocean from a global ocean model and observations. J. Geophys. Res.123, 8159–8179. doi: 10.1029/2018JC014327
69
Nilsen F. Ersdal E. A. Skogseth R. (2021). Wind-driven variability in the Spitsbergen Polar Current and the Svalbard Branch across the Yermak Plateau. J. Geophys. Res.126, e2020JC016734. doi: 10.1029/2020JC016734
70
Paladini F. Miserocchi S. Langone L. Giglio F. Aliani S. Verazzo G. et al . (2024a). MDI Mooring CTD data at 90m (Venezia Mestre, Italy: Italian Arctic Data Center (IADC), Italian National Research Council – Institute of Polar Sciences (CNR–ISP)). doi: 10.53132/CNR-ISP.2024.DAT.GCC.OCE.ART.52
71
Paladini F. Miserocchi S. Langone L. Giglio F. Aliani S. Verazzo G. et al . (2024b). MDI Mooring CTD data at 90m (Venezia Mestre, Italy: Italian Arctic Data Center (IADC), Italian National Research Council – Institute of Polar Sciences (CNR–ISP)). doi: 10.53132/CNR-ISP.2024.DAT.GCC.OCE.ART.54
72
Panasiuk A. Kalarus M. (2021). Appendicularia (Tunicata) in an antarctic glacial fjord–chaotic fjordic structure community or good indicators of oceanic water masses? Diversity13, 675. doi: 10.3390/d13120675
73
Pantiukhin D. Soto-Angel J. J. Hosia A. Hoving H.-J. Havermans C. (2024a). In-situ observations of gelatinous zooplankton aggregations in inshore and offshore Arctic waters. Polar. Biol.47, 1575–1592. doi: 10.1007/s00300-024-03306-0
74
Pantiukhin D. Verhaegen G. Havermans C. (2024b). Pan-Arctic distribution modeling reveals climate-change-driven poleward shifts of major gelatinous zooplankton species. Limnol. Oceanogr.69, 1316–1334. doi: 10.1002/lno.12568
75
Payne C. M. Roesler C. S. (2019). Characterizing the influence of Atlantic water intrusion on water mass formation and phytoplankton distribution in Kongsfjorden, Svalbard. Cont. Shelf. Res.191, 14005. doi: 10.1016/j.csr.2019.104005
76
Pettitt-Wade H. Pearce T. Kuptana D. Gallagher C. Scharffenberg K. Lea E. et al . (2020). ) Inuit observations of a Tunicata bloom unusual for the Amundsen Gulf, western Canadian Arctic. Arct. Sci.6, 340–351. doi: 10.1139/AS-2020-0018
77
Piquet A. M.-T. van de Poll W. H. Visser R. J. W. Wiencke C. Bolhuis H. Buma A. G. J. (2014). Springtime phytoplankton dynamics in Arctic Krossfjorden and Kongsfjorden (Spitsbergen) as a function of glacier proximity. Biogeosciences11, 2263–2279. doi: 10.5194/bg-11-2263-2014
78
Poncelet G. Shimeld S. M. (2020). The evolutionary origins of the vertebrate olfactory system. Open Biol.10, Article 200330. doi: 10.1098/rsob.200330
79
Presta M. L. Hoffmeyer M. S. Capitanio F. (2015). Population structure and maturity stages of Fritillaria borealis (Appendicularia, Tunicata): seasonal cycle in Ushuaia Bay (Beagle Channel). Braz. J. Oceanogr.63, 279–288. doi: 10.1590/S1679-87592015087206303
80
Raj R. P. Nilsen J. E. Ø. Johannessen J. A. Furevik T. Andersen O. B. Bertino L. (2018). Quantifying Atlantic Water transport to the Nordic Seas by remote sensing. Remote Sens. Environ.216, 758–769. doi: 10.1016/j.rse.2018.07.020
81
Ramondenc S. Nothig E. M. Hufnagel L. Bauerfeind E. Busch K. Knuppel N. et al . (2023). Effects of Atlantification and changing sea-ice dynamics on zooplankton community structure and carbon flux between 2000 and 2016 in the eastern Fram Strait. Limnol. Oceanogr.68, S39–S53. doi: 10.1002/lno.12192
82
Rantanen M. Karpechko A. Y. Lipponen A. Nordling K. Hyvärinen O. Ruosteenoja K. et al . (2022). The Arctic has warmed nearly four times faster than the globe since 1979. Commun. Earth Environ.3, Article 168. doi: 10.1038/s43247-022-00498-3
83
Rigon F. Stach T. Caicci F. Gasparini F. Burighel P. Manni L. (2013). Evolutionary diversification of secondary mechanoreceptor cells in tunicata. BMC Evol. Biol.13, 112. doi: 10.1186/1471-2148-13-112
84
Seiler D. Brandt A. (1997). Seasonal occurrence of planktic Crustacea in sediment trap samples at three depth horizons in the Greenland Sea. Polar. Biol.17, 337–349. doi: 10.1007/PL00013375
85
Shiga N. (1976). Maturity stages and relative growth of Oikopleura labradoriensis Lohmann (Tunicata, Appendicularia). Bull. Plankton. Soc. Japan.23, 81–95.
86
Shiga N. (1993a). First record of the appendicularian, Oikopleura vanhoeffeni, in the Northern Bering Sea. Bull. Plankton. Soc. Japan.39, 107–115.
87
Shiga N. (1993b). Regional and vertical distributions of Oikopleura vanhoeffeni on the northern Bering Sea shelf in summer. Bull. Plankton. Soc. Japan.39, 117–126.
88
Skogseth R. Oliviera L. L. A. Nilsen F. Falck E. Fraser N. Tverberg V. et al . (2020). Variability and decadal trends in the Isfjorden (Svalbard) ocean climate and circulation – An indicator for climate change in the European Arctic. Progr. Oceanogr.187, 102394. doi: 10.1016/j.pocean.2020.102394
89
Sordino P. D’Aniello S. Pelletier E. Wincker P. Nittoli V. Stemmann L. et al . (2019). Into the bloom: molecular response of pelagic tunicates to fluctuating food availability. Mol. Ecol.29, 292–307. doi: 10.1111/mec.15321
90
Spinelli M. L. Martos P. Esnal G. B. Capitanio F. L. (2009). Appendicularian assemblages and their space–time variability off the La Plata River, SW Atlantic Ocean. Estuar. Coast. Shelf. Sci.85, 97–106. doi: 10.1016/j.ecss.2009.06.017
91
Svendsen H. Beszczynska-Møller A. Hagen J. O. Lefauconnier B. Tverberg V. Gerland S. et al . (2002). The physical environment of Kongsfjorden–Krossfjorden, an Arctic fjord system in Svalbard. Polar. Res.21, 133–166. doi: 10.3402/polar.v21i1.6479
92
Swanberg N. Båmstedt U. (1991). Ctenophora in the Arctic: the abundance, distribution and predatory impact of the cydippid ctenophore Mertensia ovum (Fabricius) in the Barents Sea. Polar. Res.10, 507–524. doi: 10.3402/polar.v10i2.6762
93
Szeligowska M. Trudnowska E. Boehnke R. Blachowiak-Samolyk K. (2022). Dark plumes of glacial meltwater affect vertical distribution of zooplankton in the Arctic. Sci. Rep.12, 17953. doi: 10.1038/s41598-022-22475-8
94
Tesi T. Muschitiello F. Mollenhauer G. Miserocchi S. Langone L. Ceccarelli C. et al . (2021). Rapid Atlantification along the Fram Strait at the beginning of the 20th century. Sci. Adv.7, eabj2946. doi: 10.1126/sciadv.abj2946
95
Tsujimoto M. Hirawake T. T. T. K. Fukuchi M. (2006). Unusual abundance of appendicularians in the seasonal ice zone (140°E) of the Southern Ocean. Polar. Biosci.19, 133–141. doi: 10.15094/00006246
96
Tverberg V. Skogseth R. Cottier F. Sundfjord A. Walczowski W. Inall M. E. et al . (2019). “ The Kongsfjorden transect: Seasonal and inter-annual variability in hydrography,” in The Ecosystem of Kongsfjorden, Svalbard. Advances in Polar Ecology ( Springer International Publishing, Cham), 49–104. doi: 10.1007/978-3-319-46425-1_3
97
Urban J. L. McKenzie C. H. Deibel D. (1992). Seasonal differences in the content of Oikopleura vanhoeffeni and Calanus finmarchicus faecal pellets: illustrations of zooplankton food web shifts in coastal Newfoundland waters. Mar. Ecol. Prog. Ser.84, 255–264. doi: 10.3354/meps084255
98
Van de Poll W. H. Maat D. S. Fischer P. Visser R. J. W. Brussaard C. P. D. Buma A. G. J. (2021). Solar radiation and solar radiation driven cycles in warming and freshwater discharge control seasonal and inter-annual phytoplankton chlorophyll a and taxonomic composition in a high Arctic fjord (Kongsfjorden, Spitsbergen). Limnol. Oceanogr.66, 1221–1236. doi: 10.1002/lno.11677
99
Van Le M. L. Müller L. M. Stach T. (2023). The oral sensory organs in Bathochordaeus stygius (Tunicata Appendicularia) are unique in structure and homologous to the coronal organ. Front. Zool.20, 40. doi: 10.1186/s12983-023-00518-8
100
Volkov A. F. (2022). Appendicularia in the bering, okhotsk, and chukchi seas and north pacific and their significance for feeding of nekton. Russ. J. Mar. Bio.48, 654–670. doi: 10.1134/S1063074022070148
101
Wake B. (2025). Stable Arctic dense water formation. Nat. Clim. Chang.15, 813. doi: 10.1038/s41558-025-02404-z
102
Walkusz W. Kwasniewski S. Falk-Petersen S. Hop H. Tverberg V. Wieczorek P. et al . (2009). Seasonal and spatial changes in the zooplankton community of Kongsfjorden, Svalbard. Polar. Res.28, 254–281. doi: 10.1111/j.1751-8369.2009.00107.x
103
Walkusz W. Paulić J. E. Kwaśniewski S. Williams J. W. Wong S. Papst H. M. (2010). Distribution, diversity and biomass of summer zooplankton from the coastal Canadian Beaufort Sea. Polar. Biol.33, 321–335. doi: 10.1007/s00300-009-0708-0
104
Wang Q. Wekerle C. Wang X. Danilov S. Koldunov N. Sein D. et al . (2020). Intensification of the Atlantic Water supply to the Arctic Ocean through Fram Strait induced by Arctic sea ice decline. Geophys. Res. Lett.47, e2019GL086682. doi: 10.1029/2019GL086682
105
Weslawski J. M. Jankowski A. Kwasniewski S. Swerpel S. Ryg M. (1991). Summer hydrology and zooplankton in two Svalbard fjords. Polar. Res.12, 445–460.
106
Weydmann-Zwolicka A. Prątnicka P. Łącka M. Majaneva S. Cottier F. Berge J. (2021). Zooplankton and sediment fluxes in two contrasting fjords reveal Atlantification of the Arctic. Sci. Total. Environ.773, 145599. doi: 10.1016/j.scitotenv.2021.145599
107
Willis K. J. Cottier F. R. Kwaśniewski S. (2008). Impact of warm water advection on the winter zooplankton community in an Arctic fjord. Polar. Biol.31, 475–481. doi: 10.1007/s00300-007-0373-0
108
Zaldua-Mendizabal N. Louzao M. Doyle T. K. Cotano U. (2021). Community structure of gelatinous zooplankton in a temperate ecosystem: Spatial patterns and underlying drivers. Reg. Stud. Mar. Sci.43, 101673. doi: 10.1016/j.rsma.2021.101673
Summary
Keywords
Oikopleura vanhoeffeni , Fritillaria borealis , sediment trap, time-series, phenology, Kongsfjorden
Citation
Nicolai A, Paladini de Mendoza F, Ingrosso G, Langone L, Tesi T, Titocci J and Giordano P (2025) Puzzles from the Arctic – deciphering temporal distribution, ecological niche and life history of two Appendicularia species in Kongsfjorden, Svalbard Islands. Front. Mar. Sci. 12:1664196. doi: 10.3389/fmars.2025.1664196
Received
11 July 2025
Accepted
15 October 2025
Published
29 October 2025
Volume
12 - 2025
Edited by
Jan Marcin Weslawski, Polish Academy of Sciences, Poland
Reviewed by
Alberto Sánchez-González, National Polytechnic Institute (IPN), Mexico; Evan Patrohay, University of South Carolina, United States
Updates
Copyright
© 2025 Nicolai, Paladini de Mendoza, Ingrosso, Langone, Tesi, Titocci and Giordano.
This is an open-access article distributed under the terms of the Creative Commons Attribution License (CC BY). The use, distribution or reproduction in other forums is permitted, provided the original author(s) and the copyright owner(s) are credited and that the original publication in this journal is cited, in accordance with accepted academic practice. No use, distribution or reproduction is permitted which does not comply with these terms.
*Correspondence: Alessandro Nicolai, alessandronicolai@cnr.it; Patrizia Giordano, patrizia.giordano@cnr.it
Disclaimer
All claims expressed in this article are solely those of the authors and do not necessarily represent those of their affiliated organizations, or those of the publisher, the editors and the reviewers. Any product that may be evaluated in this article or claim that may be made by its manufacturer is not guaranteed or endorsed by the publisher.