Abstract
Coral reefs are patchily distributed across vast areas of Earth’s tropical and subtropical oceans. Dispersal of individuals between habitat patches is essential to maintain genetic connectivity between subpopulations and plays an important role in population persistence. While the biotic and abiotic factors that influence patterns of dispersal have received a great deal of attention, fundamental questions about genetic connectivity in marine systems remain largely unanswered. Micronesia, in the northern central Pacific, is comprised of over two thousand islands that stretch across 7,400,000 km2 and is thought to provide stepping-stones for dispersal between the central and western Pacific. Despite its size and importance, few phylogeographic studies have focused on Micronesia and none have been conducted in the Mariana Archipelago in northern Micronesia. Here we examined population structure in the peacock grouper Cephalopholis argus across the region. Based on ~15,000 SNPs we found three population clusters: the Mariana Archipelago, western Micronesia (Palau) and eastern Micronesia (Pohnpei and Kwajalein). These findings are largely concordant with two previous studies and taken together they highlight the influence of the North Equatorial Current and the North Equatorial Countercurrent in the Central Pacific and indicate that perhaps broad scale ecosystem level processes and not species-level traits are driving population patterns in the region. Furthermore, we detected little genetic structure across 800 km of the Mariana Archipelago and found that rates of gene flow among the islands were higher in the north but diminished at Anatahan and continued to decrease southward toward Saipan and Guam. Our data also indicate that the Mariana Islands receives more migrants from the Central Micronesian islands to the south then it exports, and that Guam, the southernmost island in the archipelago, may serve as an important gateway from the Central Pacific into the Mariana Islands.
Introduction
Coral reef organisms occupy discrete habitat patches that are often separated by large stretches of unsuitable habitat (Carson et al., 2011; Puckett and Eggleston, 2016). Dispersal among these patches is essential to maintain genetic connectivity between subpopulations and plays a vital role in population persistence (White et al., 2019). Despite the patchy nature of coral reefs, many reef-associated species inhabit vast geographic ranges that span ocean basins (Gaither et al., 2015, 2011a; Ma et al., 2018; Otwoma and Kochzius, 2016). Understanding the factors that shape both short and long-distance dispersal has received a great deal of attention, yet fundamental questions about genetic connectivity in marine organisms remain unanswered. Most marine animals have a planktonic larval phase that permits long distance dispersal, but pelagic larval duration (PLD) does not always accurately predict population structure (Riginos et al., 2011; Weersing and Toonen, 2009). Oceanographic features influence species distributions and patterns of genetic structure (DiBattista et al., 2017, 2013; Gaither et al., 2011a; Riginos and Liggins, 2013), however these patterns can vary across even closely related taxa with similar life history traits (Gaither et al., 2010). Moreover, other variables such as habitat and resource availability and species interactions can also significantly influence population genetic structure (Gonzalez et al., 2016; Riginos and Nachman, 2001).
The Indo-Malay-Philippine Archipelago (the Coral Triangle) is home to the highest diversity of coral reef fishes on the planet (Briggs and Bowen, 2012). Just to the east of this species-rich region is Micronesia; a vast subregion in the north central Pacific Ocean (Figure 1) that is comprised of over two thousand islands that stretch across 7,400,000 km2 and encompass four primary archipelagos: the Caroline Islands in the west, the Marshall Islands in the east, the Mariana Islands in the north, and the Gilbert Islands in the south. Micronesia has a tropical climate and sustains a rich marine biodiversity, including over 1,300 species of reef fishes (Fitzpatrick and Donaldson, 2007; Giovas et al., 2017). Biophysical modeling indicates that these islands, facilitated by the major currents in the region, act as a series of stepping-stones for gene flow between the biodiversity hotspot in the Coral Triangle and other parts of the Central Pacific (Davies et al., 2015), thus facilitating dispersal and connectivity across the tropical Pacific. The region is the northern limit for many tropical species, suggesting it may also play an important role in metapopulation persistence of reef organisms across the north Pacific. Despite its importance and vast size there have been only two phylogeographic studies that examine patterns of genetic connectivity in reef organisms across Micronesia, one looking at two species of scleractinian coral in the genus Acropora (Davies et al., 2015) and the other focusing on the rabbitfish Siganus spinus (Priest et al., 2012). Both studies employed microsatellites and revealed three genetic subpopulations: a western group that included Palau and Yap, an eastern group that included Chuuk, Pohnpei, and Majuro, and a northern group that included Guam in the southern Mariana Islands. Estimates of dispersal across the region indicate a complex pattern of bidirectional gene flow that is substantially influenced by major oceanic currents (Figure 1) (Wang and Wu, 2013). While these studies provide important insights into metapopulation dynamics in the region, they represent only three species in two genera, preventing broader generalizations. Furthermore, while a few phylogeographic studies have included Guam and Saipan within the southern Mariana Archipelago (Gaither et al., 2011b, 2010; Priest et al., 2012), no studies to date have sampled fish populations north of these islands (Timmers et al., 2012).
Figure 1
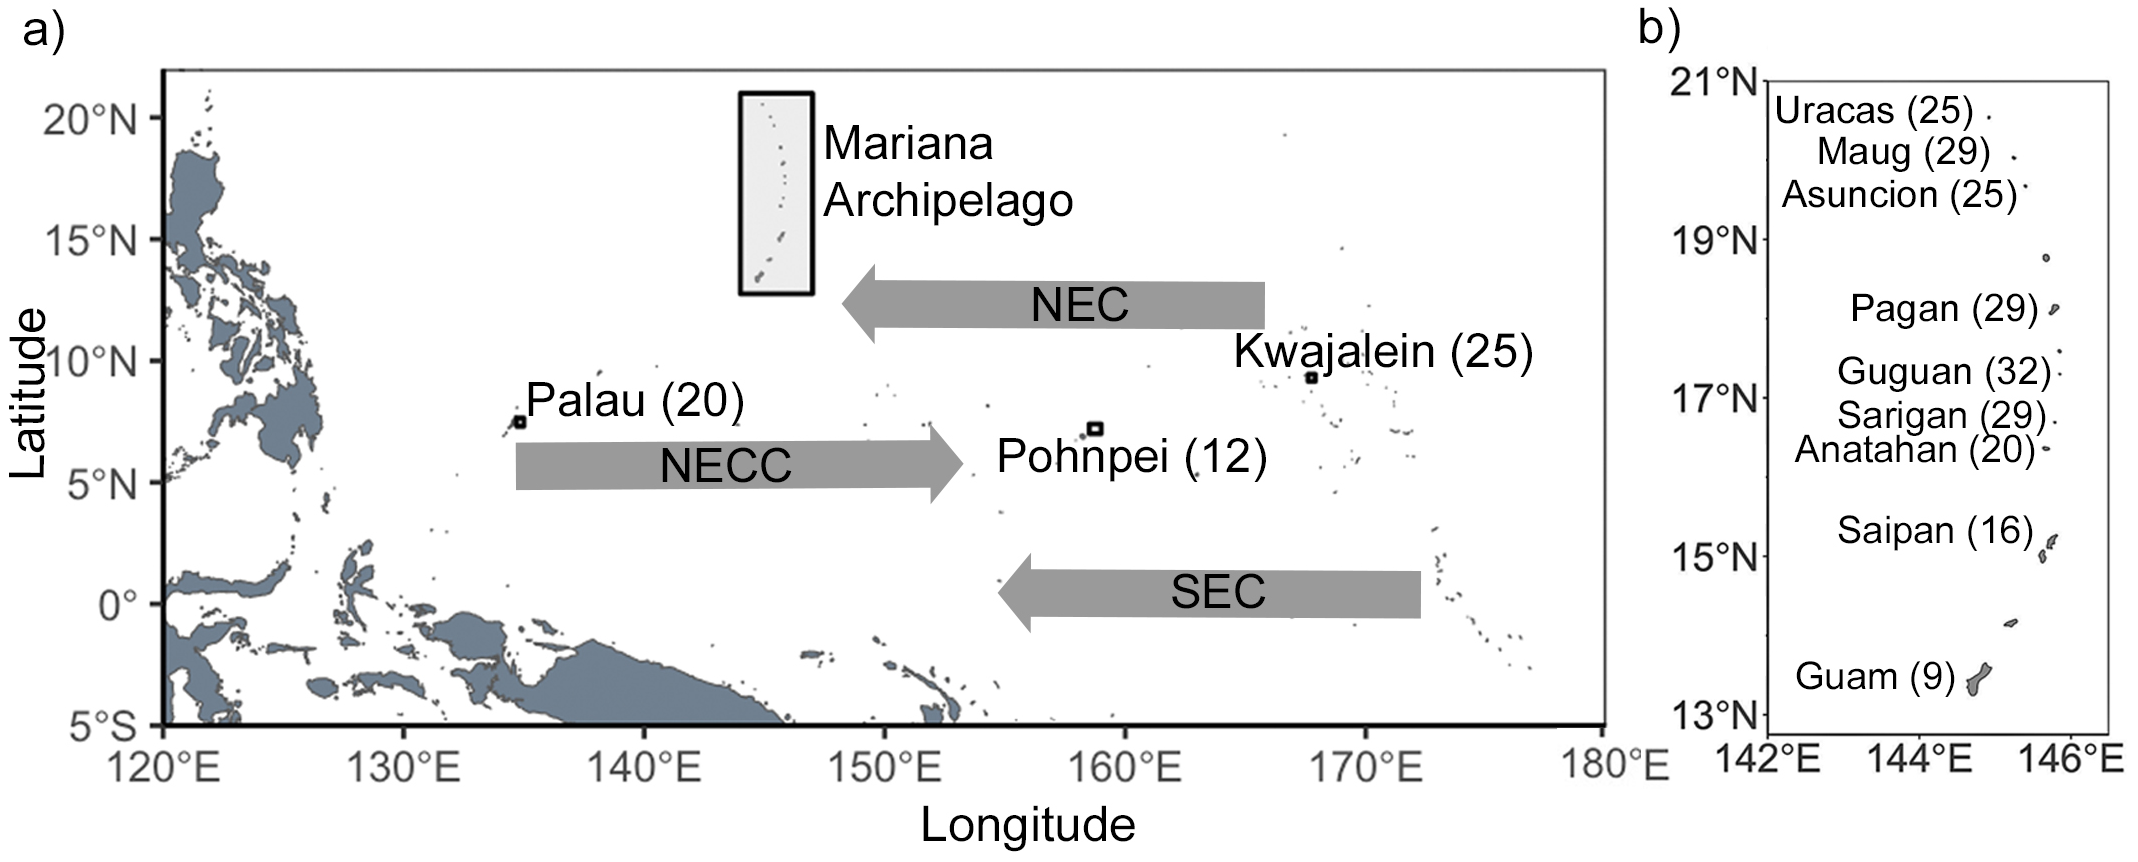
Map of the (a) study region including major ocean currents and a (b) detailed map of the Mariana Archipelago. Numbers in parentheses are sample sizes after quality control.
Here we offer a significant contribution to our understanding of metapopulation dynamics across Micronesia with a population genetic study on the peacock grouper Cephalopholis argus (Bloch and Schneider, 1801), including extensive sampling in the Mariana Islands. The peacock grouper is a demersal reef fish of the family Serranidae. This species occupies reef habitat (2–40 m depth) from the Pitcairn group in the Central Pacific to east Africa and the Red Sea (Randall, 2005). Like other members of the genus, C. argus displays complex social behaviors including territoriality, sequential hermaphroditism, and a haremic social system with males defending territories up to 2,000 m2 that encompass the smaller territories of several females. This species is a broadcast spawner with a pelagic larval duration estimated to be ~40 days (Schemmel et al., 2016). A previous genetic survey on C. argus across the Pacific and Indian Oceans found two distinct genetic clusters, that correspond to the Pacific and Indian Ocean basins, with divergence dating to the mid-Pleistocene. These data suggest that low sea level stands during the Pleistocene, which created a nearly impassable land barrier between the Pacific and Indian Oceans (known as the Indo-Pacific Barrier), had a significant impact on this species (Gaither et al., 2011a) as well as others (Gaither and Rocha, 2013). Within ocean basins, there is evidence of isolation by distance based on mtDNA (Gaither et al., 2011a). While this study included limited sampling in Micronesia, the data do indicate high genetic diversity in the region and evidence of mixing of Pacific and Indian Ocean mtDNA lineages in Palau and Kwajalein. However, there was no evidence of genetic structure across Micronesia in C. argus (Gaither et al., 2011a). Similar findings are reported for a surgeonfish (Gaither et al., 2015) and spiny lobsters (Iacchei et al., 2016). Here we build on this previous study on C. argus by combining regional samples from Gaither et al. (2011a) with extensive new sampling in the Mariana Islands. We developed thousands of single nucleotide polymorphisms (SNPs) using a RADSeq approach to clarify population structure of the peacock grouper across Micronesia, including the thus far unexamined Mariana Islands.
Methods
Sampling and DNA extraction
We obtained 194 tissue samples of C. argus from seven islands (Anatahan, Sarigan, Guguan, Pagan, Asuncion, Maug, Uracas) across the Mariana Archipelago that had been collected as part of NOAA’s Pacific Islands Fisheries Science Center (PIFSC) Territorial Biosampling Program. An additional 83 samples from Saipan, Palau, Pohnpei, and Kwajalein previously analyzed in Gaither et al. (2011a), and 9 new samples from Guam collected in 2022, were also analyzed in this study. Genomic DNA was extracted from all 286 samples using E.Z.N.A. Tissue DNA Kits (Omega Bio-Tek, USA) following the manufacturer’s protocol, eluted in 100 μL of buffer, and stored at -20°C until further processing.
Library preparation and sequencing
For library preparation, we used the double digest restriction site-associated DNA sequencing (ddRADSeq) protocol of Peterson et al. (2012) with slight modifications (Gaither et al., 2015). Briefly, DNA concentrations were quantified using a Qubit 4 Fluorometer (Invitrogen, USA) with the dsDNA HS assay kit. Approximately 300 ng of genomic DNA per sample was digested using the SphI and MluCl restriction endonucleases (New England Biolabs, USA). Thirty-two uniquely barcoded P1 adapters were employed to allow for multiplexing samples. These samples were pooled and a unique Illumina index, that included a 5 bp random oligo to identify PCR duplicates, was added to identify each pool of 32 individuals. Pooled DNA was size-selected between 375–450 bp using a Pippin Prep (Sage Science, USA) and quantified using the NEBNext Library Quantification Kit (New England Biolabs). The concentration of each pool was standardized and pools were then combined and sequenced on a NovaSeq S4 flow cell (2 x 150 base pair) at the University of Florida’s Interdisciplinary Center for Biotechnology Research. Raw ddRADSeq fastq files were deposited in NCBI’s Sequence Read Archive (SRA) (BioProject accession number: PRJNA1283357) while the associated metadata was deposited at the Genomic Observatories Metadatabase [GEOME, http://n2t.net/ark:/21547/Gio2; (Deck et al., 2017; Riginos et al., 2020)].
Data quality control and dataset generation
Using STACKS v2.6, sequences were screened for PCR duplicates using the ‘clone_filter’ function and then demultiplexed using the ‘process_radtags’ function. Individuals with less than 0.9 million reads were omitted. Loci were de novo assembled using STACKS and its component programs (Catchen et al., 2013, 2011; Rochette et al., 2019). Loci were generated by merging of three or more “stacks” (-m), allowing a maximum of five mismatches between loci (-n) when building the catalog, and a maximum of five mismatches when processing a single individual (-M). Stacks in which the numbers of reads were more than two standard deviations above the mean were assumed to be repetitive elements and removed from further consideration. Using the ‘populations’ module of STACKS only the first SNP from each locus was retained. From this dataset only loci present in at least 80% of individuals and in ten of the twelve sample locations (and three of the five locations for the Central Micronesia dataset, see below) were retained. Finally, loci that were in fewer than 50% of all individuals were also excluded. To mitigate potential PCR errors, only loci where rare alleles were observed in at least two individuals were retained (minor allele count of three). From the loci that remained we created plink, vcf, and genepop files for further filtering in external programs.
Following quality control in STACKS we performed tests for linkage disequilibrium (LD) using PLINK v1.9 with the –indep-pairwise option (Chang et al., 2015; Purcell et al., 2007). We used a windows size of 1 kb, step size of 1, and an r2 threshold 0.8. For each pair of loci determined to be out of linkage equilibrium one was randomly chosen and removed from the dataset. Next, we utilized the ‘gl.filter.hwe’ function in the R package dartR (Gruber et al., 2018) to identify loci deviating from Hardy-Weinberg Equilibrium (HWE) using the exact method (Wigginton et al., 2005). Loci that deviated from HWE in more than half of the total sample locations were removed. We independently analyzed two datasets: the total dataset that included samples from all twelve locations and the Central Micronesia dataset that consisted of the samples from Palau, Pohnpei, Kwajalein, Guam, and Saipan (Figure 1; Table 1). This smaller Central Micronesia dataset was created to allow for direct comparisons with previous studies (Davies et al., 2015; Priest et al., 2012), while also controlling for the large sample sizes from the Mariana Islands (N = 214) compared to the rest of Micronesia (N = 57) that might influence interpretation.
Table 1
| Dataset | Total dataset | Central Micronesia |
|---|---|---|
| Total loci | 15,428 | 21,948 |
| Total loci after QC | 15,286 | 20,099 |
| Outlier loci | 318 | 142 |
| OutFLANK | 154 | 68 |
| PCAdapt | 210 | 134 |
| BayeScan | 168 | 70 |
| Neutral loci | 14,968 | 19,957 |
Number of loci resolved for each dataset.
Shown are values based on the total dataset (all twelve sample locations; Figure 1) as well as for the Central Micronesia dataset (Palau, Pohnpei, Kwajalein, Guam, and Saipan). Listed is the number of total loci before and after QC (LD and HWE), and the number of outlier loci detected for each of the three analyses. The number of outlier loci considered here is listed first and includes all outliers detected by at least one program. Neutral loci are those that remain after removing the outliers from the total loci dataset.
For each of the two datasets, we identified outlier loci using three programs: OutFLANK (Whitlock and Lotterhos, 2015), PCAdapt (Luu et al., 2017), and BayeScan (Foll and Gaggiotti, 2008). For OutFLANK, we applied default settings including a left and right trim value of 0.05 for the null distribution of FST, a minimum heterozygosity of 0.1, and designated a False Discovery Rate (FDR) threshold of 0.05 (q-threshold) (Whitlock and Lotterhos, 2015). For the PCAdapt analysis, we began with K = 20 principal components (PCs) and employed a graphical approach using the scree plot elbow method to determine the optimal K value. Using this K value, we then ran PCAdapt with an FDR threshold of 0.05 (Luu et al., 2017). Lastly, we ran BayeScan which employs a Bayesian approach to estimate the posterior probability that a given locus is influenced by selection. The program utilizes two alternative models: one incorporating the effect of selection and the other where selection is excluded. We used default chain parameters, including a sample size of 5,000 and a thinning interval of 10. We ran 20 pilot runs with a length of 5,000 steps each and an additional burn-in of 50,000 (Foll and Gaggiotti, 2008). Convergence of the Markov Chain Monte Carlo (MCMC) simulation was assessed using the coda R package (Plummer et al., 2006). Loci with a false discovery rate (FDR) q-value < 0.05 were identified as outliers. We created a list of the combined loci identified by at least one of the three programs. This list constitutes the outlier loci. We then removed these outliers from the full dataset to create the neutral loci dataset. Note that we do not attempt to annotate the outliers as we are not testing for selection but instead attempting to detect subtle population structure.
Data analyses
For each dataset, we calculated genetic diversity indices including observed and expected heterozygosity, inbreeding coefficient, and allelic richness using the R package hierfstat (Goudet and Jombart, 2015). Hierfstat was also used to calculate pairwise values of Weir and Cockerham’s FST (Weir and Cockerham, 1984). The 95% confidence intervals for the FST values were determined using 1,000 bootstrap replicates. For the isolation-by-distance (IBD) analysis, the genetic distances between pairwise locations were calculated based on linearized FST as FST/(1 − FST) (Rousset, 1997). Geographic distances (great-circle distances) between sampling locations were computed using the ‘distHaversine’ function from the geosphere R package (Hijmans et al., 2017). To evaluate the correlation between genetic and geographic distances we conducted Mantel tests (Mantel, 1967) using the vegan package in R and applying the Pearson method to estimate p-values using 999 permutations (Dixon, 2003). The relationship between genetic and geographic distances was visualized by plotting pairwise genetic distances against geographic distances with a linear regression (Rousset, 1997) and calculating the Mantel correlation coefficient (r) and associated p-value.
We assessed genetic structure between populations using the Bayesian clustering approach implemented in STRUCTURE (Pritchard et al., 2000). Analyses were conducted using an admixture model without a priori population information, with correlated allele frequencies, and default parameter settings. We ran values of K = 1–7 for three independent runs each of 600,000 Markov chain Monte Carlo (MCMC) iterations with the first 100,000 discarded as burn-in. The results were visualized, and the optimal number of distinct genetic clusters was determined using the delta K method of the online tool CLUMPAK (http://clumpak.tau.ac.il) (Evanno et al., 2005; Kopelman et al., 2015). To further investigate population structure, we conducted a Discriminant Analyses of Principal Components (DAPC) (Jombart et al., 2010) utilizing the adegenet package in R (Jombart and Ahmed, 2011). To avoid overfitting the DAPC model, we followed the recommendations outlined by Thia (Thia, 2023) and determined the number of PCs retained based on the K-1 criterion, where K is number of effective populations.
To estimate patterns of gene flow, we conducted a relative migration network analysis for unlinked neutral loci using the ‘divMigrate’ function (Sundqvist et al., 2016) in the diveRsity R package (Keenan et al., 2013) and employing the Nei’s GST method. Migration patterns were visualized using the qgraph package in R (Epskamp et al., 2012). The significance of asymmetric gene flow among sampling sites was tested using 1,000 bootstrap iterations (Sundqvist et al., 2016). Additionally, TreeMix v1.13 analyses were conducted across all 12 sampling locations (Pickrell and Pritchard, 2012). Since TreeMix analysis is sensitive to missing data, we filtered the dataset using the ‘populations’ module of STACKS (Catchen et al., 2013, 2011; Rochette et al., 2019), retaining loci present in at least 90% of all populations (-R 0.90) across the entire dataset and in at least 80% of individuals within each population (-r 0.80). Linkage disequilibrium (LD) filtering was performed on this new dataset using PLINK, applying the same parameters as in previous steps. The TreeMix input file was then generated from LD-pruned loci using the ‘populations’ module of STACKS (Catchen et al., 2013, 2011; Rochette et al., 2019). To determine the optimal number of migration events, we conducted five iterations of TreeMix runs (Pickrell and Pritchard, 2012), testing zero to fifteen migration edges, with a SNP block size of 500 (-k). Each iteration involved subsampling 80% of SNP positions to introduce variation in likelihood estimations. The optimal number of migration events was identified using the Evanno method (Evanno et al., 2005), implemented in the optM R package (Fitak, 2021). For zero migration events, we performed 100 bootstrap replicates in TreeMix (Pickrell and Pritchard, 2012) and constructed an unrooted consensus tree using Phylip 3.697 (Felsenstein, 1981). This consensus tree was then set as the starting tree (-tf) for 100 independent TreeMix runs (Pickrell and Pritchard, 2012). We ran this analysis twice, using previously determined optimal number of migration events (m = 11) and (m = 7), and then selected the tree with the highest likelihood (Dahms et al., 2022). The final migration tree was visualized in R using the BITEV2 package (Milanesi et al., 2017). Bootstrap values for each node were estimated with 100 independent runs. Additionally, the residual matrix was plotted to assess the model fit and included in Supplementary Data.
Results
We prepared ddRADSeq libraries for 286 individuals. Of these, 15 had fewer than 0.9 million reads and were omitted from the dataset. Of the 271 remaining individuals the number of reads ranged from 0.90 – 47.22 million with a mean of 6.26 million. Using the ‘populations’ module of STACKS we resolved 15,428 loci across the total dataset (all twelve sample locations) and 21,948 loci in the Central Micronesia dataset (Table 1). After LD pruning the number of loci retained was 15,304 for the total dataset and 20,128 for Central Micronesia. Analysis of these datasets revealed 18 loci to be out of HWE in the total dataset and 39 to be out of HWE in the Central Micronesia dataset. These loci were omitted as well. Therefore, after QC we retained 15,286 loci for the total dataset and 20,099 for the Central Micronesia dataset (Table 1).
To identify outlier loci we ran Outflank, PCAdapt, and Bayescan, for which we detected 154, 210, and 168 outliers in the total dataset, and 68, 134, and 70 in the Central Micronesia dataset, respectively (Table 1). Comparing the outliers, 77 and 54 outliers were detected by all three programs, 60 and 22 by at least two, and 181 and 66 were detected by only one program in the total and Central Micronesia datasets, respectively. Here the final outlier subset includes all outliers detected by at least one program, therefore, the number of outliers for the total dataset was 318, and 142 for Central Micronesia (Table 1). Based on these results, we divided the datasets into three subsets: all loci, outlier loci, and neutral loci and then analyzed each separately (Table 1). Analyses of all loci and neutral loci produced very similar results in both datasets, and therefore, we only present the results for the neutral and outlier loci datasets in the main manuscript and include the results for all loci in Supplementary Data (Supplementary Figures S1, S2, S4, S7; Supplementary Tables S1–S4).
Diversity metrics and population structure
Total dataset - All twelve sample locations
Diversity metrics indicated higher observed heterozygosity in Palau and Pohnpei compared to populations in the Mariana Islands. The observed heterozygosity for the neutral and outlier subsets, respectively, was Ho = 0.161 and 0.242 for Palau, Ho = 0.165 and 0.276 for Pohnpei, Ho = 0.144 and 0.156 for Guam, and 0.142 and 0.141 for Saipan. Values for other locations in the Mariana Islands ranged between Ho = 0.150 – 0.157 for the neutral loci and 0.145 – 0.185 for the outlier loci (Supplementary Tables S5, S6). The inbreeding coefficient (FIS) calculated across all populations and based on the neutral and outlier loci ranged from -0.001-0.049 and -0.041-0.153, respectively. The lowest FIS values were recorded at Anatahan in the Mariana Islands with FIS = -0.001 for the neutral loci and FIS = -0.041 for the outliers (Supplementary Tables S5, S6). In contrast, Guam had the highest FIS values with FIS = 0.049 and FIS = 0.153 for the neutral and outlier subsets, respectively.
Global FST values were FST = 0.007 for the neutral loci and FST = 0.152 for the outliers. Population pairwise FST values are considered significant when 95% bootstrap confidence intervals do not overlap zero, which was the case for most of our pairwise comparisons. However, the biological relevance of these FST should be considered carefully. Most of the pairwise FST values reported here, while their 95% confidence intervals don’t overlap, they are very low, particularly when the neutral dataset was considered (Figure 2; Supplementary Table S7). Pairwise FST values between Palau and Pohnpei were 0.0042 (neutral) and 0.0854 (outlier); between Palau and Kwajalein, 0.0055 and 0.0977; and between Pohnpei and Kwajalein, 0.0014 and 0.0044, respectively (Figure 2a; Supplementary Tables S7, S8). Of these, only the Pohnpei and Kwajalein pairwise comparison based on the outlier subset had 95% confidence intervals that did overlap zero. Within the Mariana Archipelago, pairwise FST values ranged from 0.00002 to 0.0058 in the neutral dataset and from 0.0106 to 0.1463 in the outliers (Figure 2a; Supplementary Tables S7, S8). Several comparisons of the neutral loci within the Mariana Archipelago overlapped zero, including Saipan-Guam (FST = 0.0018), Saipan-Guguan (FST = 0.0007), Saipan-Asuncion (FST = 0.0009), Guguan-Pagan (FST = 0.00002), Guguan-Ascension (FST = 0.0006), Guguan-Uracas (FST = 0.0001), and Asuncion-Uracas (FST = 0.0005). However, when we compared populations from the Mariana Archipelago (excluding Guam) to other populations in Micronesia, pairwise FST values were higher. Of these, Palau had the highest pairwise FST values which ranged from 0.0221 to 0.0253 for neutral loci and 0.3649 to 0.3891 for outlier loci (Figure 2a; Supplementary Tables S7, S8). Pairwise FST values between Palau and Guam were lower with FST = 0.0119 for neutral loci and FST = 0.2178 for outliers. The optimal number of distinct genetic clusters determined using the delta K method of the online tool CLUMPAK was K = 3 for the neutral loci and K = 2 for outlier loci (Supplementary Figure S3a). The resulting STRUCTURE plots for K = 2 and 3 are shown in Figure 3a (additional values for K are shown in Supplementary Figure S5a, S6a). While the neutral loci showed little population structure, the outlier loci resolved three clusters: western Micronesia (Palau), eastern Micronesia (Pohnpei and Kwajalein), and the Mariana Islands (Figure 3a). This finding was supported by DAPCs (Figure 4a). In both the neutral and outlier datasets Palau, Pohnpei, and Kwajalein clustered separately from the Mariana Islands, with Guam showing overlap between the two primary clusters. The outlier dataset further distinguished Palau from Pohnpei and Kwajalein (Figure 4a).
Figure 2
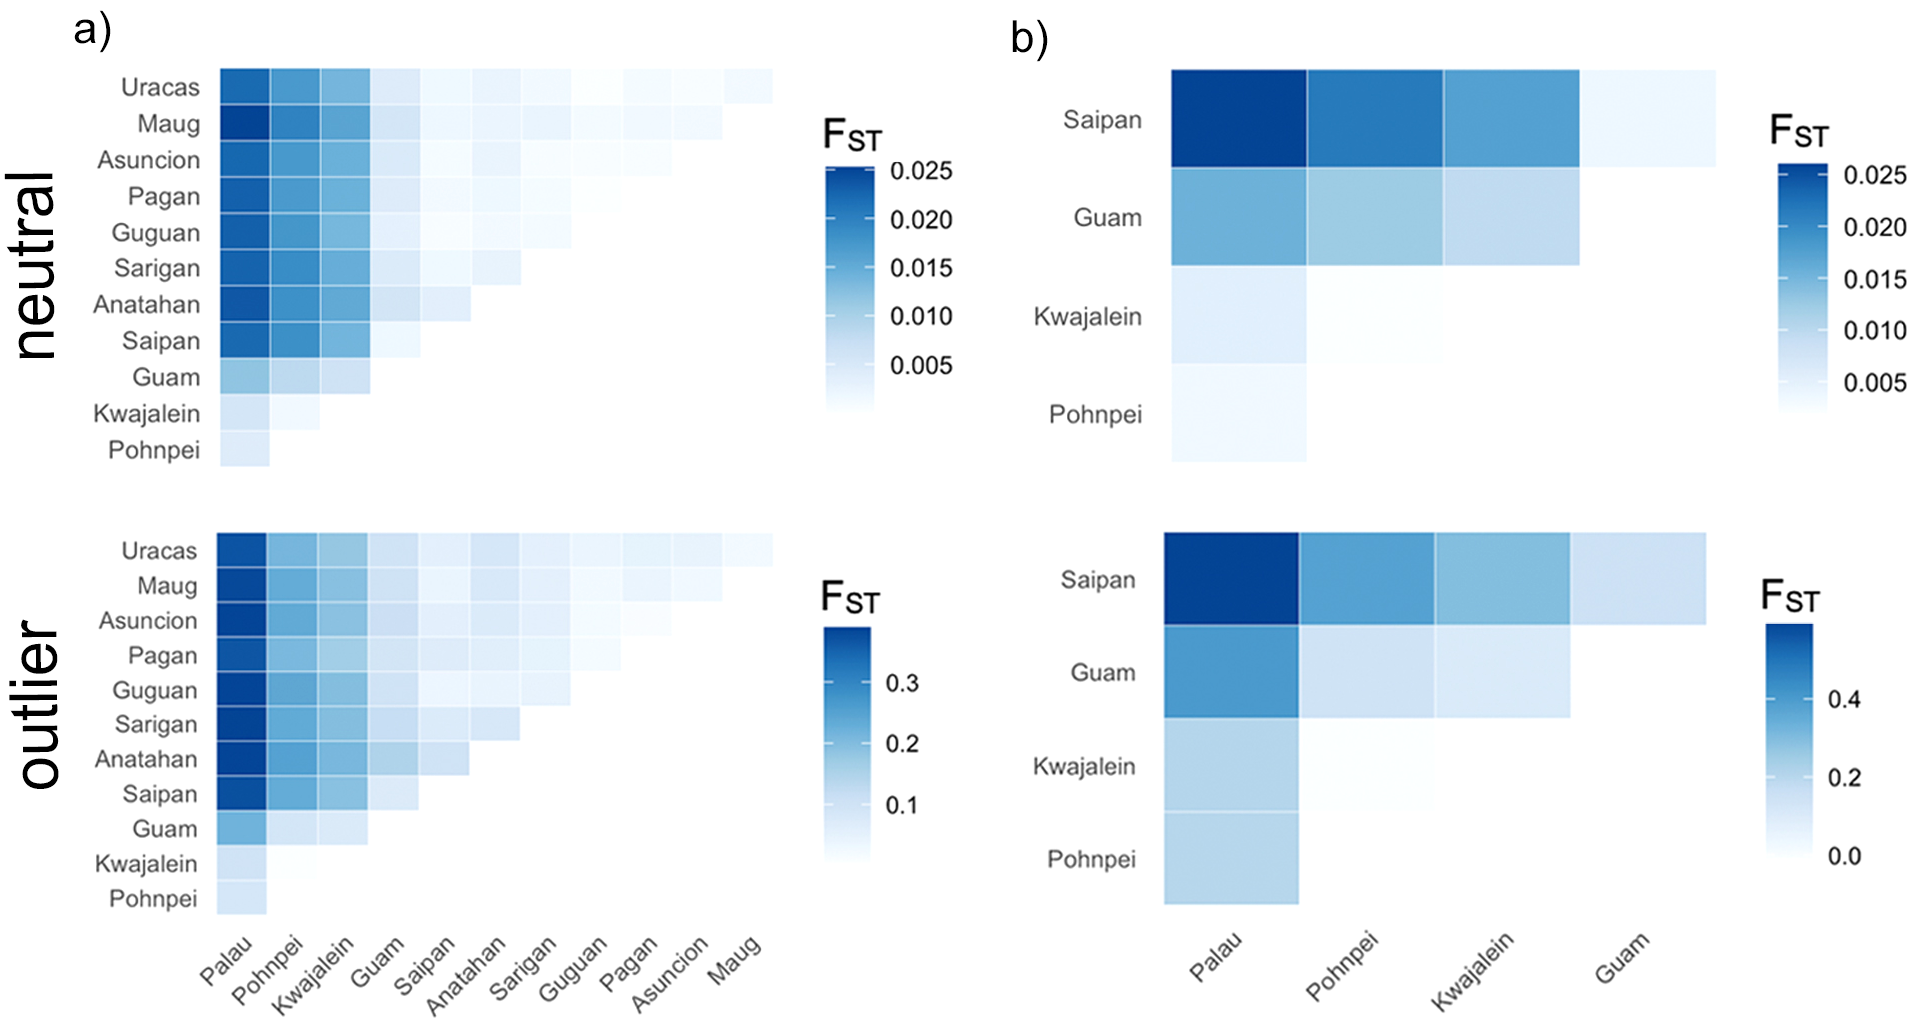
Pairwise FST heatmaps generated using ggplot2 (Wickham, 2016) for the (a) total and (b) Central Micronesia datasets based on the neutral and outlier loci. FST values were calculated using hierfstat (Goudet and Jombart, 2015). Darker colors represent higher pairwise FST values.
Figure 3
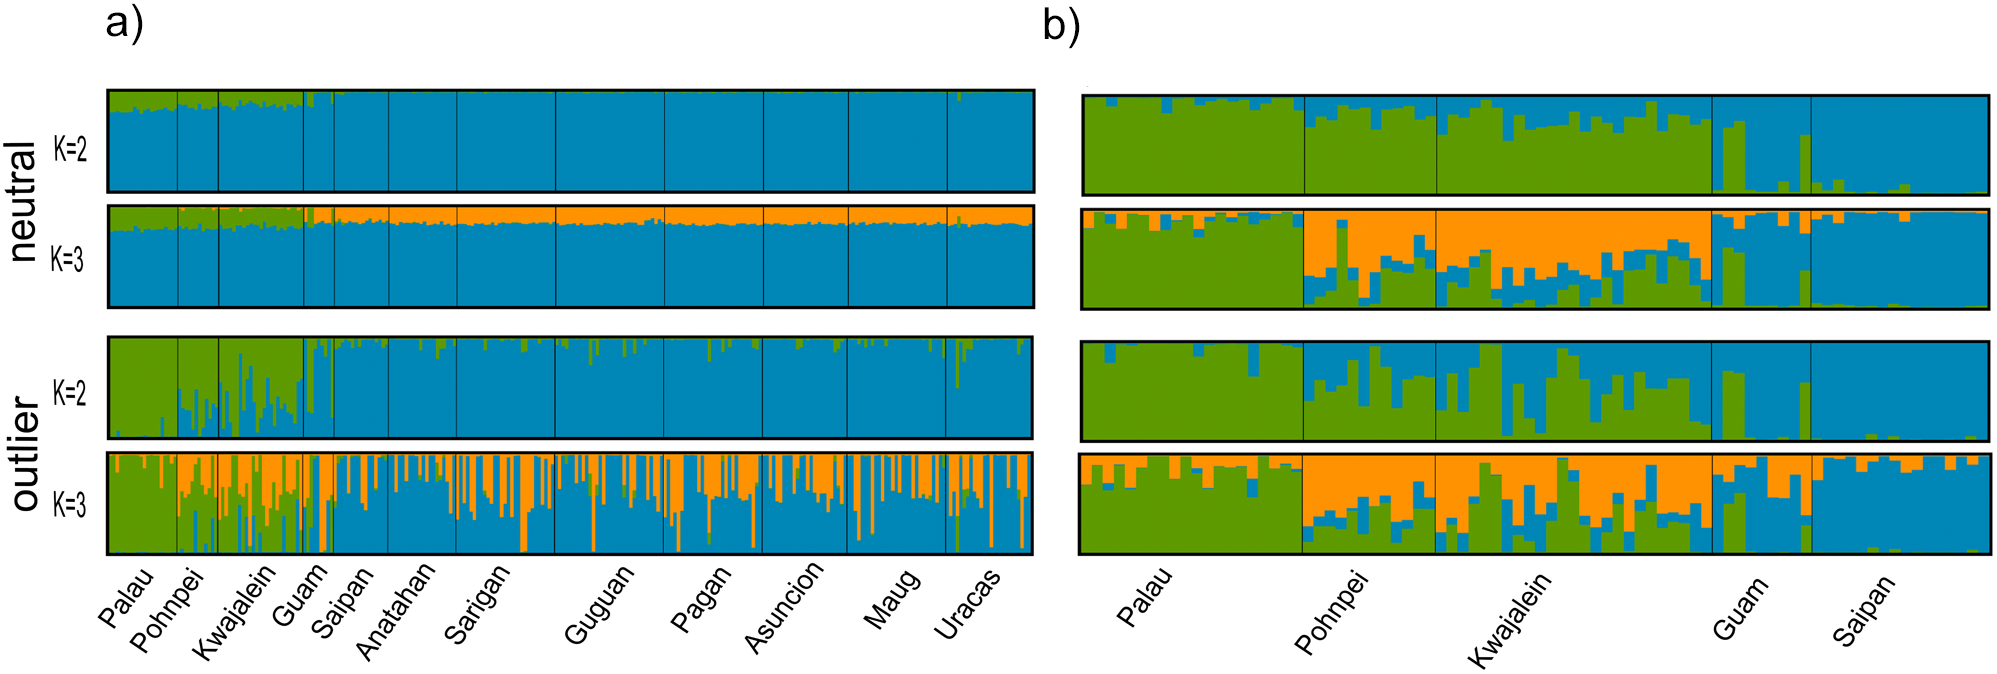
Bar plots based on the Bayesian clustering approach implemented in STRUCTURE (Pritchard et al., 2000) for the (a) total and (b) Central Micronesia datasets. Plots based on neutral and outlier loci are shown. Bar plots were generated using the CLUMPAK web interface (Kopelman et al., 2015). Populations are labeled with each bar representing a single individual.
Figure 4
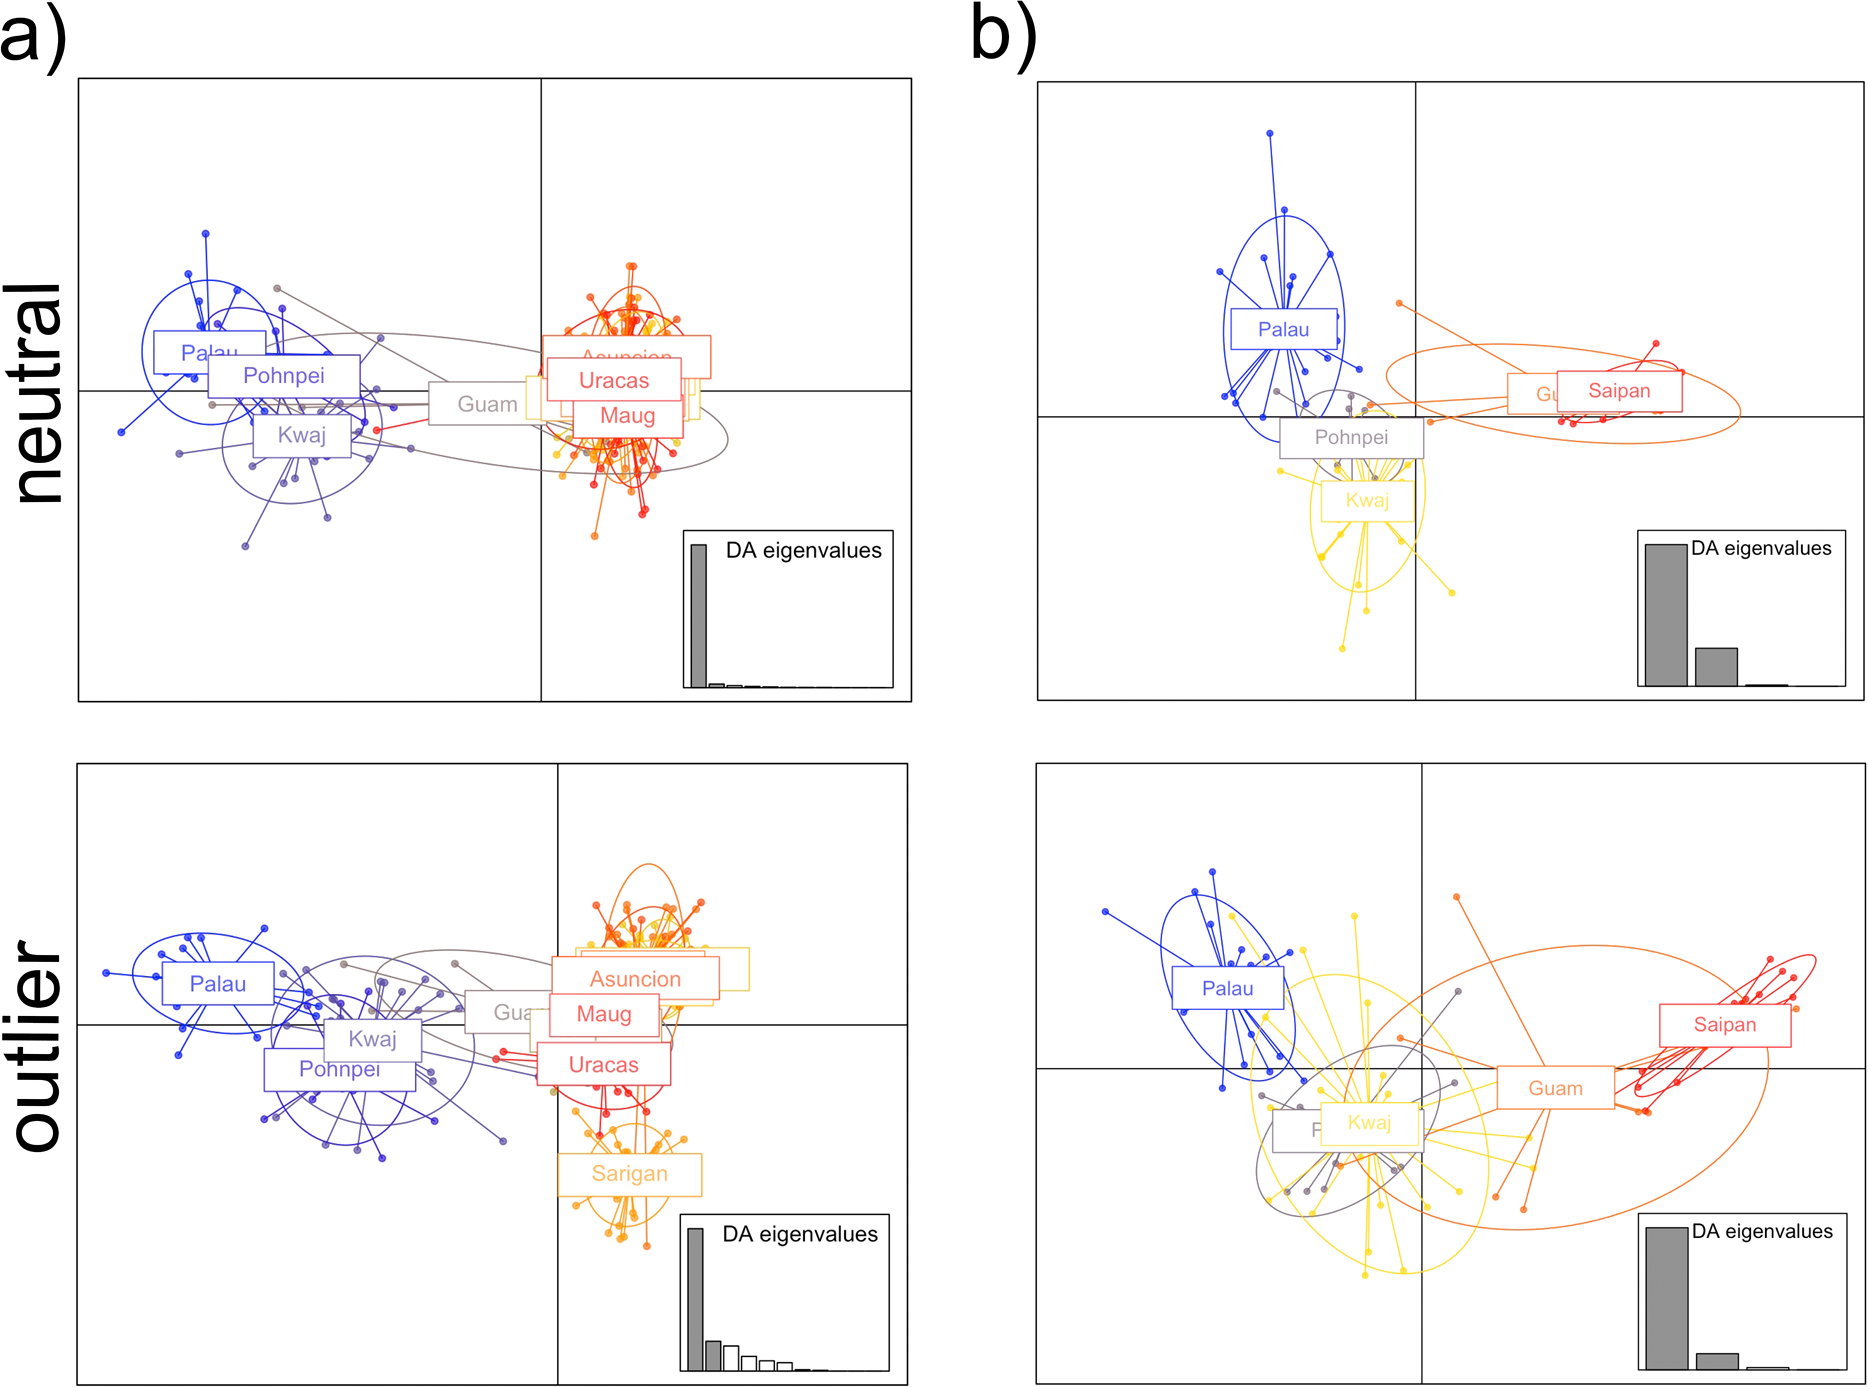
Discriminant Analyses of Principal Components (DAPC) calculated using the adegenet package in R (Jombart and Ahmed, 2011) for the (a) total and (b) Central Micronesia datasets. Plots based on the neutral and outlier loci are shown. Populations are delineated using colored inertia ellipses. Each dot represents an individual, and colored inertia ellipses represent populations.
Central Micronesia
To clarify phylogeographic patterns across Central Micronesia, while also controlling for uneven sampling effort (with intensive sampling conduced in the Mariana Islands), we ran a focused analysis on the five populations of Palau, Pohnpei, Kwajalein, Guam, and Saipan. As with the total dataset we found that diversity metrics for both neutral and outlier loci revealed slightly higher observed heterozygosity in Palau (Ho = 0.229 and 0.260), Pohnpei (Ho = 0.232 and 0.363), and Kwajalein (Ho = 0.223 and 0.306), compared to the two southern Mariana populations of Guam (Ho = 0.204 and 0.193) and Saipan (Ho = 0.201 and 0.170) (Supplementary Tables S9, S10). The lowest inbreeding coefficient (FIS) was recorded in Pohnpei with FIS = 0.010 for the neutral loci and FIS =-0.033 for the outlier loci, while Guam exhibited higher values at FIS = 0.058 for the neutral loci and FIS = 0.281 for the outlier loci.
Global FST values were 0.011 and 0.293 for neutral and outlier loci, respectively. We found the highest pairwise FST values between Saipan and Palau in both the neutral (FST = 0.026) and outlier (FST = 0.598) datasets (Figure 2b; Supplementary Tables S11, S12). Differentiation between Saipan and the eastern Micronesian populations of Pohnpei and Kwajalein was also high, with pairwise FST values of 0.0216 and 0.0175 for neutral loci and 0.3803 and 0.2986 for outlier loci, respectively (Figure 2b; Supplementary Tables S11, S12). Comparisons between Saipan and Guam showed lower differentiation (FST = 0.0038 for neutral loci, FST = 0.1499 for outliers). Pairwise comparison between Guam and Palau were high at FST = 0.0156 for the neutral loci and FST = 0.4018 for the outliers. Comparable pairwise values between Guam and the eastern Micronesia populations of Pohnpei and Kwajalein were FST = 0.0123 and 0.0096 for neutral loci and 0.1409 and 0.1032 for outlier loci, respectively (Figure 2b; Supplementary Tables S11, S12). Among Central Micronesia locations, Pohnpei and Kwajalein displayed minimal differentiation, with FST values of 0.0019 for neutral loci and -0.0089 for the outliers. While comparable values between Palau and Pohnpei were 0.0034 and 0.2037 for the neutral and outlier loci, respectively and 0.0054 and 0.2077 for the comparison between Palau and Kwajalein, respectively (Figure 2b; Supplementary Tables S11, S12). The 95% confidence intervals did not overlap zero for any of these pairwise FST, except for value calculated for the outlier loci between Pohnpei and Kwajalein (FST = -0.0089). The optimal number of distinct genetic clusters determined using the delta K method of CLUMPAK was K = 3 for neutral loci and K = 2 for outlier loci (Supplementary Figure S3b). The resulting STRUCTURE plots for K = 2 and 3 are shown in Figure 3b (additional values for K are shown in Supplementary Figures S5b, S6b). For this dataset both the neutral and outlier loci indicated three clusters: western Micronesia (Palau), eastern Micronesia (Pohnpei and Kwajalein), and Guam and Saipan in the southern Mariana Islands (Figure 3b). At K = 3, Pohnpei and Kwajalein were distinguished from Palau with notable admixture. A few individuals from Guam showed shared ancestry with the more southerly populations, while Saipan was largely distinct (Figure 3b). Consistent with STRUCTURE, the DAPCs resolved three groups including a western Micronesia population in Palau, an eastern Micronesia population that includes Pohnpei and Kwajalein, and the populations within the Mariana Archipelago (Figure 4b). The outlier dataset showed notable overlap between Guam and the more southerly Central Micronesia populations.
Isolation by distance
When considering the total dataset, the Mantel test for isolation by distance detected a significant relationship between genetic distance and geographic distance for both the neutral (r = 0.705, p = 0.005) and outlier loci (r = 0.531, p = 0.025; Figure 5a). However, this finding is primarily driven by low FST values and the corresponding small geographic distances within the Mariana Islands that are anchoring the regression line in Figure 5a. Mantel tests on data from across the Mariana Islands show a significant pattern of isolation by distance in both the neutral loci: (r = 0.569, p = 0.003) and outlier loci (r = 0.470, p = 0.029; Figure 5b). When we examine only the Central Micronesia dataset, IBD is no longer significant (neutral loci: r = -0.06l, p = 0.575; outlier loci; r = -0.106, p = 0.667; Figure 5c).
Figure 5
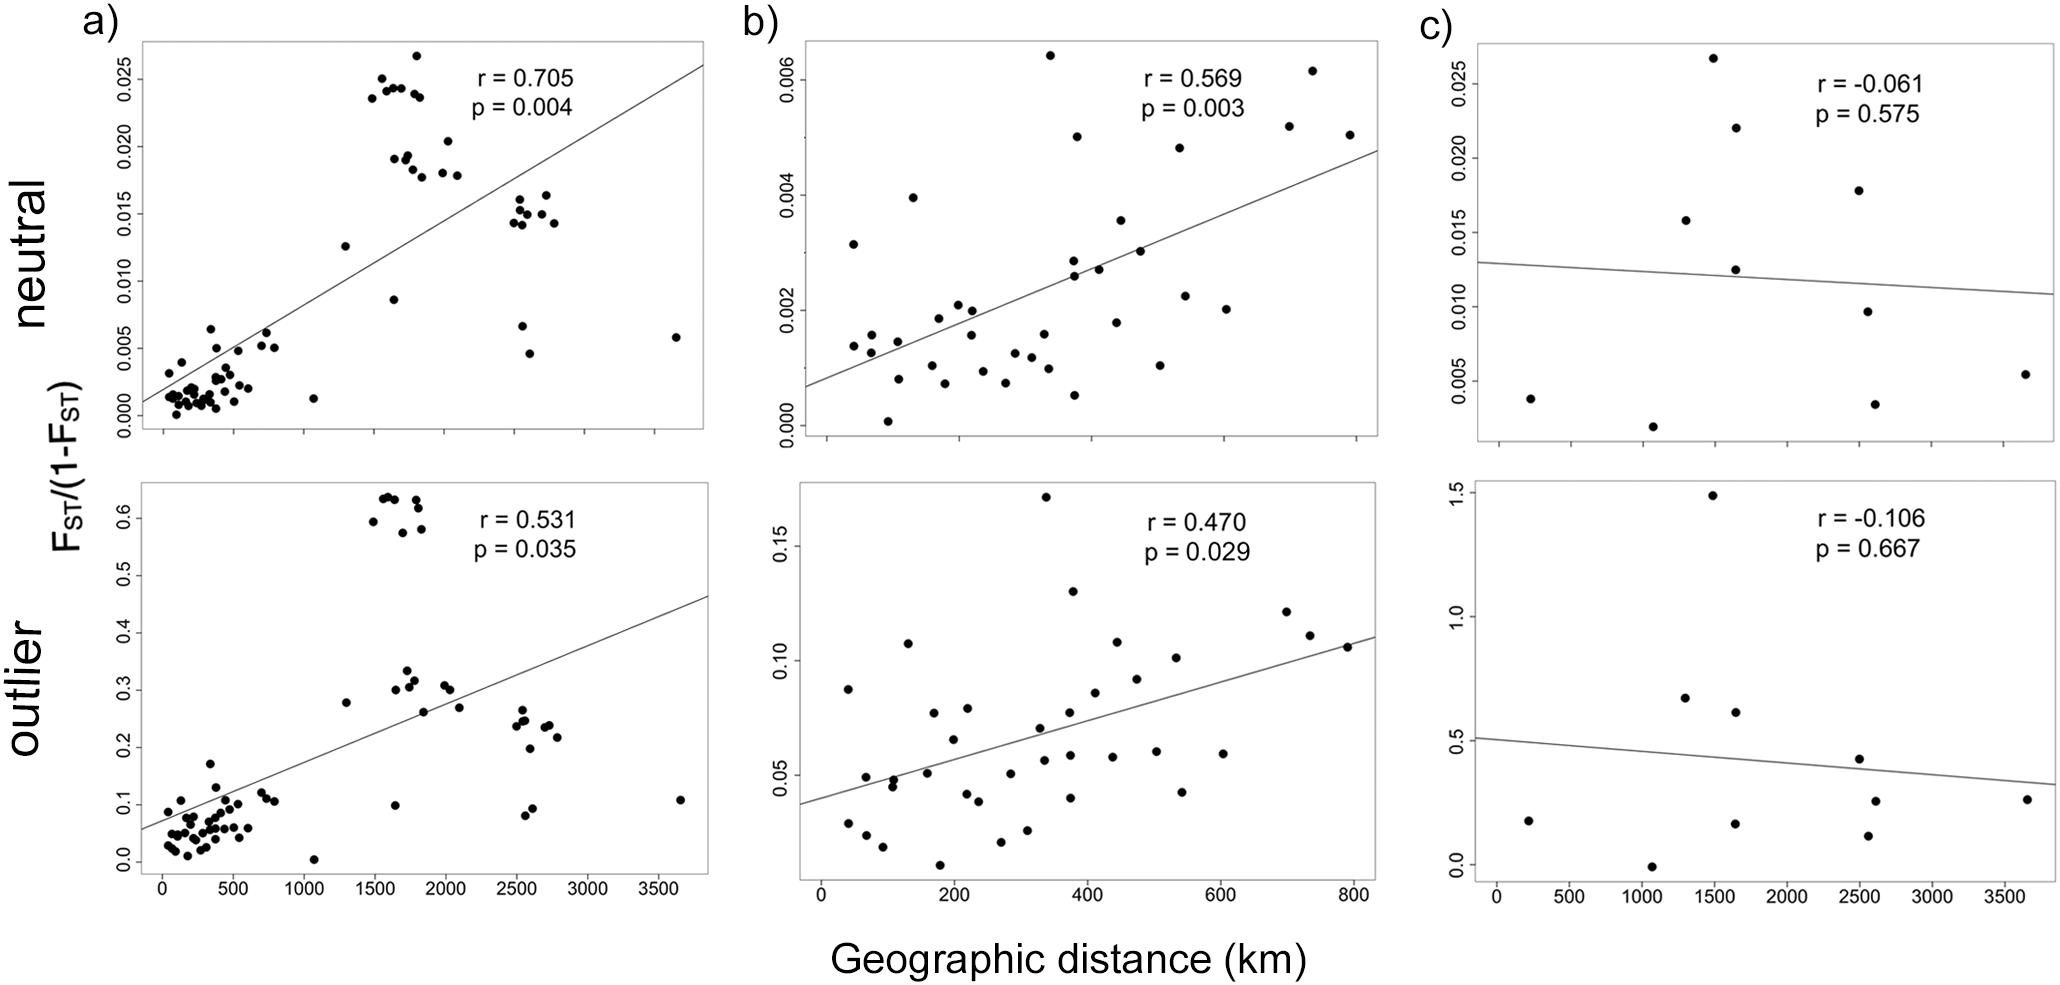
Mantel test of isolation by distance for the (a) total dataset, (b) Mariana Archipelago only, and the (c) Central Micronesia dataset based on neutral and outlier loci.
Migration estimates
The divMigrate analyses was run on the 14,968 neutral loci from the total dataset (all twelve populations; Figure 6). The bootstrap test for asymmetrical migration failed to distinguish evidence of directionality among any sampling sites. We detected moderate and balanced relative rates of migration (similar rates regardless of which was the source vs. recipient population) between Palau and Pohnpei (0.31, 0.36), Palau and Kwajalein (0.49, 0.51), and Kwajalein and Pohnpei (0.37, 0.42) (Figure 6). Migration rates between the Mariana Islands and the other populations in Micronesia were lower. When Palau was considered as the source population migration rates into the Mariana Archipelago ranged from 0.20-0.31, when locations within the Mariana Islands were set as the source population, these values ranged from 0.29-0.38. Comparable numbers with Pohnpei as the source population were 0.19-0.30 and 0.23-0.30 when Pohnpei was the recipient population. Kwajalein demonstrated slightly higher values which ranged from 0.25-0.45 as the source population and between 0.34-0.51 as the recipient population (Figure 6).
Figure 6
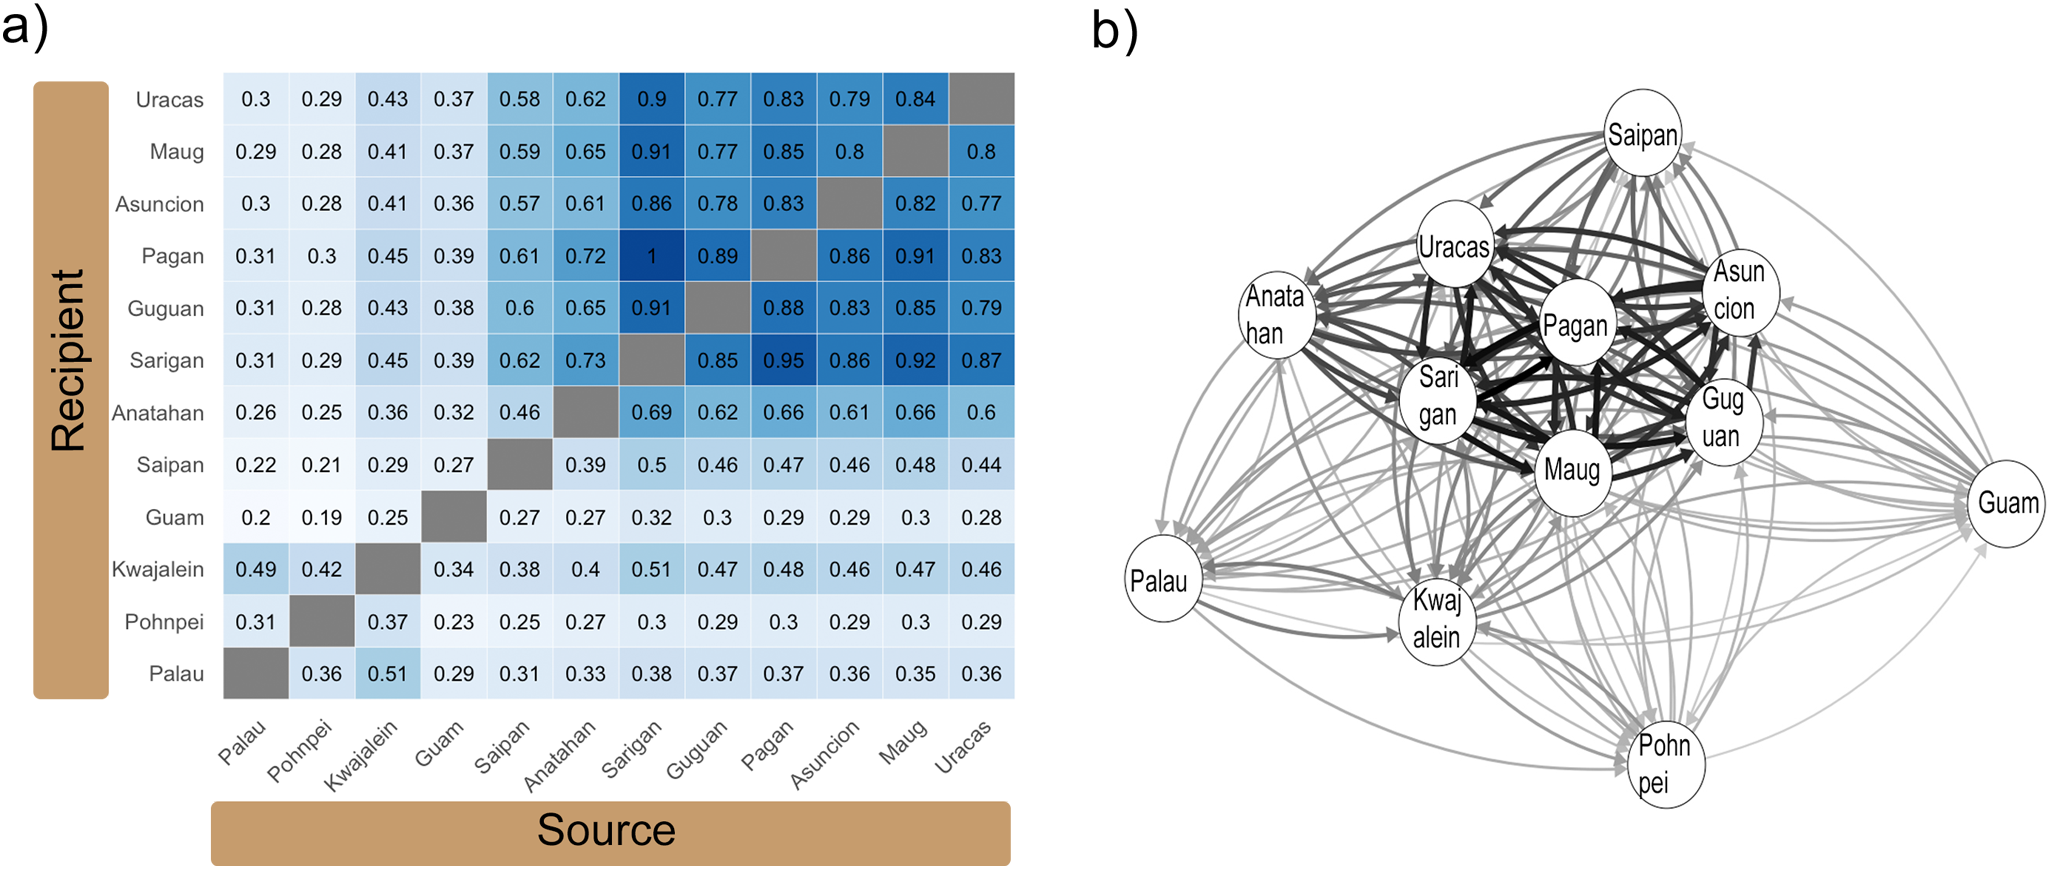
Relative migration rates calculated using divMigrate (Sundqvist et al., 2016) and visualized as (a) heatmap using ggplot2 (Wickham, 2016). Relative migration networks (b) generated using qgraph (Epskamp et al., 2012) are also shown. Data was generated based on neutral loci and calculated using Nei’s GST estimate for the total dataset (all twelve sample locations). Arrows in (b) indicate the direction of migration with arrow thickness representing magnitude of the relative migration rates.
Analysis among the Mariana Islands showed only low levels of gene flow between Guam and the rest of the archipelago, with relative migration rates of 0.27 – 0.39 in either direction (Figure 6). Although no significant asymmetric pattern of gene flow was detected, values for Saipan were slightly higher at 0.46-0.62 when Saipan was a source population and 0.39-0.50 when Saipan was the recipient population indicating a higher level of gene flow from south to north. These values were slightly higher again at Anatahan which is just north of Saipan with northward migration rates of 0.61-0.73 (Figure 6). North of Anatahan (Sarigan to Uracas) migration rates were bi-directional and high, ranging from 0.77-1.0. The highest migration rates recorded were between Sarigan and Pagan at 0.95 and 1.00 (Figure 6).
Our TreeMix analyses based on 5,488 unlinked loci across all twelve sample locations, indicated that the optimal number of migration events (m) was 11 with another peak at 7 events (Figure 7). Bootstrap values from the TreeMix analyses provided moderate to strong support for several key nodes. A major split separating Central Micronesia (Palau, Pohnpei, Kwajalein) from the Mariana clade was strongly supported (90–100%) in both trees. Within the Mariana clade, the Uracas–Maug grouping also showed high support (90–100%) in both trees, whereas several internal nodes received moderate support (50–75%) (Figure 7). The TreeMix analyses based on m = 11 migration events revealed three strong migration events: from Maug to Saipan (migration weight = 0.449), from Central Micronesia to Uracas (migration weight = 0.390), and from Central Micronesia to Guam (migration weight = 0.374). Similarly, the m = 7 analyses identified three migration events with high weight: from Saipan to Guam (migration weight = 0.466), from Central Micronesia and Guam to Uracas (migration weight = 0.441), and from Central Micronesia and Guam to Kwajalein (migration weight = 0.303). While weaker migration events in the m = 7 analysis primarily originated from Central Micronesia to the Mariana Islands, the m = 11 analysis revealed additional north-to-south and south-to-north migrations within the Mariana Archipelago, as well as a low-weight migration from Palau to Pohnpei (Figure 7).
Figure 7
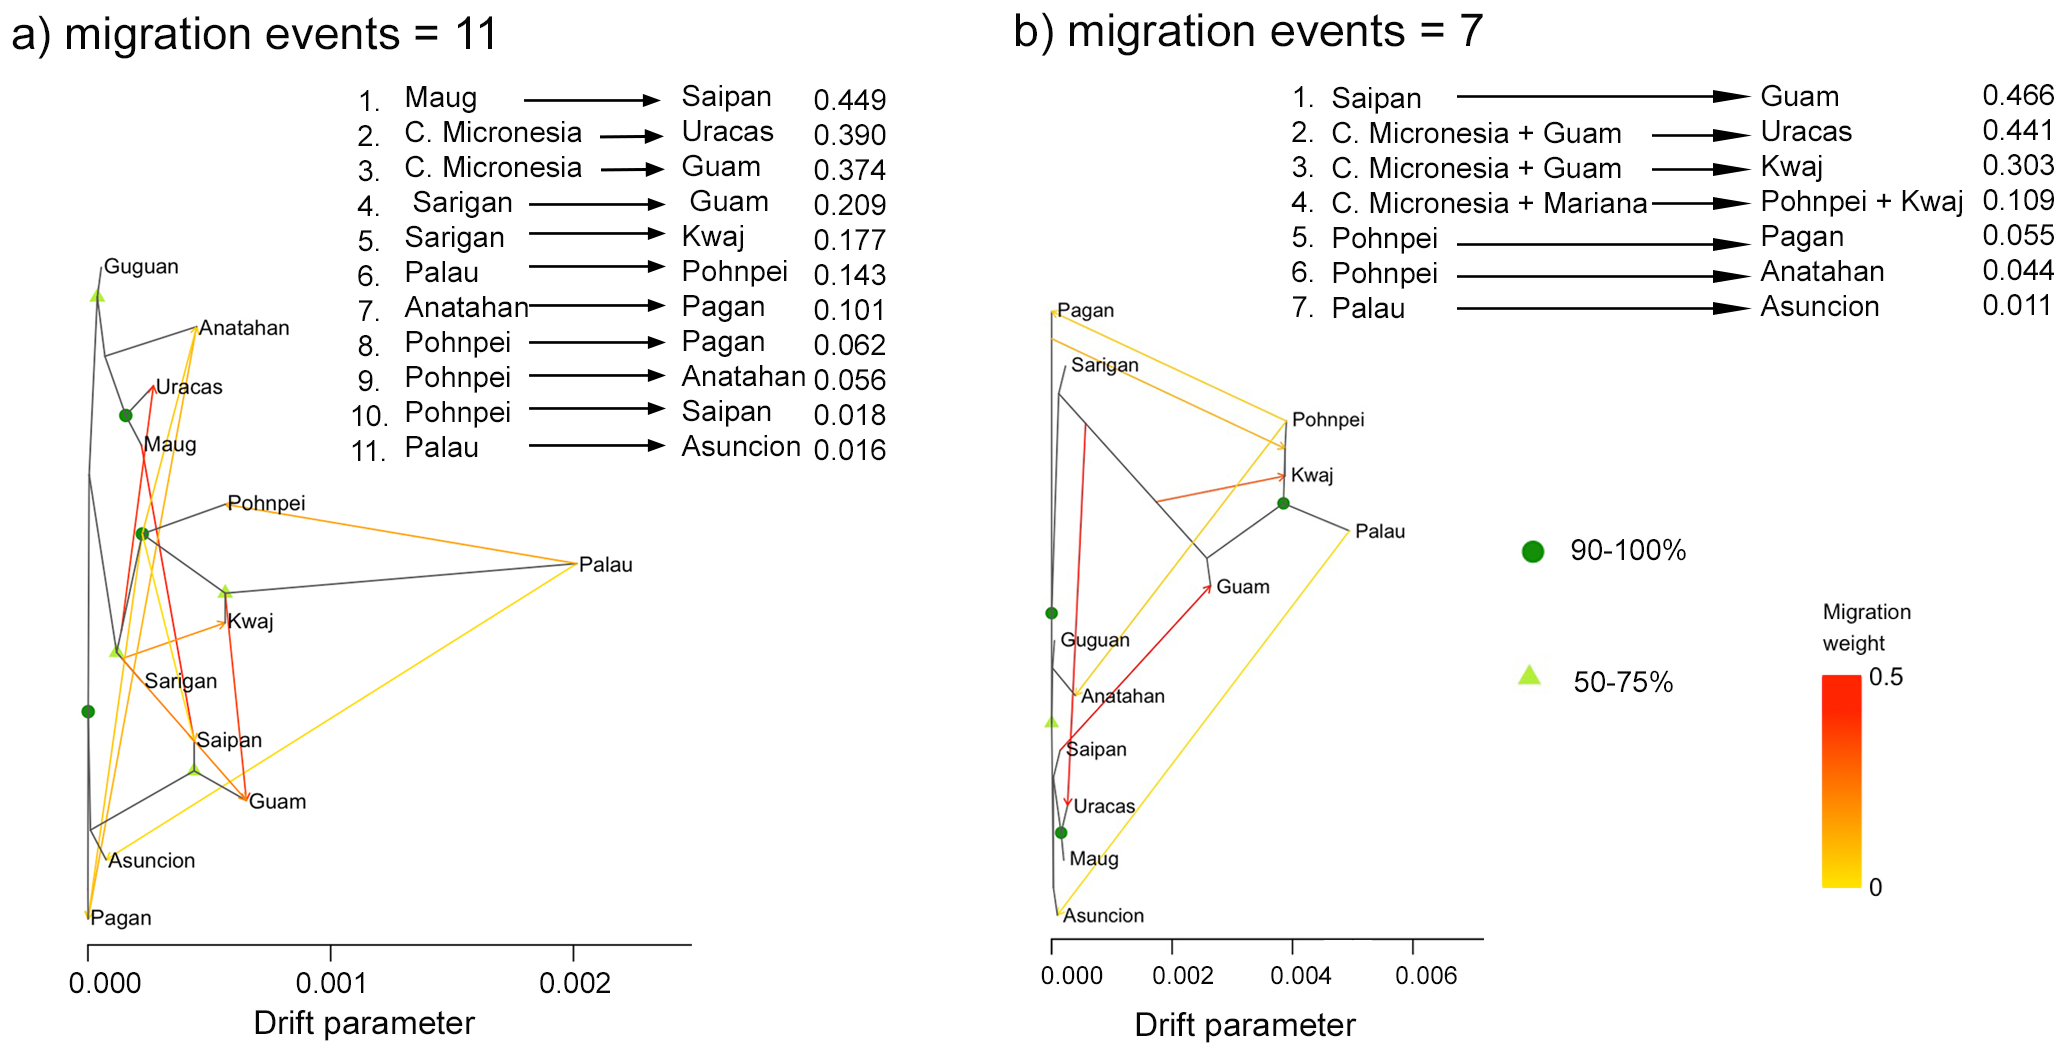
The TreeMix Maximum Likelihood (ML) tree (Pickrell and Pritchard, 2012) generated based on the allelic frequencies of 5,488 unlinked loci. Shown is the (a) tree with m = 11 migration events and the (b) tree with m = 7 migration events. The arrows on the ML tree indicate the directionality of gene flow for each migration edge and the color of the edge reflects the intensity of admixture. Horizontal branch length is proportional to the degree of genetic drift in the branch. Bootstrap support values are indicated at each node. Migration weights are shown at the top of the figure. “C. Micronesia” refers to Central Micronesia (Palau, Pohnpei, and Kwajalein), and “Kwaj” refers to Kwajalein.
Discussion
Despite the vastness of Micronesia, and the supposition that it provides vital stepping-stones between the biodiversity rich coral triangle and the Central Pacific, only two previous population genetic studies have been conducted in this region. Moreover, no phylogeographic assessments have been conducted in the remote Mariana Archipelago, leaving the role that these habitat-rich islands play in metapopulation dynamics of Micronesia unanswered. Here we contribute a genetic survey of the peacock grouper C. argus across Micronesia to improve our understanding of population connectivity in this understudied region. Based on 271 samples from 12 sampling locations, we resolved 15,286 SNPs (20,099 SNPs in the smaller Central Micronesia dataset). Our Bayesian analyses and DAPCs identified three population clusters across the region: one in western Micronesia (Palau), one in eastern Micronesia (Pohnpei and Kwajalein), and a third that distinguishes the Mariana Archipelago. These divisions are concordant with findings in previous studies on two acroporid corals and a rabbitfish. Taken together, these studies highlight the influence of the major currents in the region and indicate that perhaps broad scale ecosystem level processes, and not species-level traits, are driving population level patterns in Micronesia. Furthermore, this first examination of populations across the Mariana Archipelago, indicates high levels of bi-directional gene flow among islands in the northern part of the archipelago that diminishes at the south-centrally located Anatahan and continues to decrease as we move southward to Saipan and Guam. Our data also indicate that the Mariana Islands primarily acts as a sink, receiving more migrants from the other island groups to the south (Palau, Pohnpei, and Kwajalein), with fewer migration events estimated to occur from the Marianas to the southern island groups. Finally, F-statistics and our clustering approaches indicate that Guam, the southernmost island in the Mariana Archipelago, has a greater genetic affinity with the rest of Central Micronesia compared to the northern reaches of the archipelago and may serve as an important stepping-stone from the Central Pacific into the Mariana Islands.
Patterns of isolation by distance and population structure across Central Micronesia
Under genetic equilibrium, theory predicts that intraspecific differences in allele frequencies will correlate with distances between populations, yielding patterns of isolation-by-distance (IBD) (Wright, 1943). In Central Micronesia, IBD has been shown in the corals Acropora hyacinthus and A. digitifera (Davies et al., 2015) as well as the rabbitfish Siganus spinus (Priest et al., 2012). However, the correlation between genetic and geographic (Euclidean) distance was an order of magnitude higher for the corals with r2 values of 0.740 and 0.616, respectively, compared to an r2 value of just 0.068 for the rabbitfish. Here, for C. argus, we found a significant signal of IBD when the entire dataset is considered. Taken alone this finding could imply a distance-decay (clinal) pattern, which can lead clustering algorithms such as STRUCTURE to partition this gradient into distinct groups and result in a misleading interpretation. However, in our case the pattern of IBD across all 12 populations is largely anchored by the low pairwise FST values and corresponding small geographic distances detected within the Mariana Islands (Figure 5a). When these islands are considered in isolation, IBD is significant (r = 0.569, p = 0.003 for the neutral dataset; Figure 5b). Moreover, the absence of significant IBD in the Central Micronesia dataset (Figure 5c) indicates genuine groupings rather than a clinal pattern mistakenly divided into clusters. This finding, in combination with F-statistics and clustering analyses (DAPC) for both the total and Central Micronesia datasets, support our finding of three subpopulations of C. argus across Micronesia, consistent with those reported for both corals and the rabbitfish. In all four species (A.digitifera, A. hyacinthus, S. spinus, and C. argus), Palau (and Yap when sampled) forms a unique western cluster that is distinct from an eastern cluster that includes Pohnpei and Kwajalein (and Chuuk and Kosrae when sampled). For the coral A. digitifera, even greater fine scale population structure was detected in which the eastern population is split into two clusters that included Chuuk and Pohnpei in one and Kosrae, Kwajalein, Majuro and Arno Atoll in another, indicating that in this species there are two populations in the east not detected in its congenic A. hyacinthus. While A. hyacinthus is not found in the Mariana Islands, the population of A. digitifera sampled in Guam formed a distinct genetic cluster, as was detected in both species of fish (S. spinus and C. argus). Together these studies, highlight consistent phylogeographic breaks that distinguish three major subregions across Micronesia: Palau and Yap in the west, Chuuk, Pohnpei, Majuro, and Kwajalein in the east, and the Mariana Islands in the north. Interestingly, Davies et al. (2015) also sampled the two species of Acropora in Kosrae. This island is at the eastern extent of the Caroline Islands and boarders the Marshall Islands. In both species, this location included individuals of mixed west/east ancestry indicating it may be an important stepping-stone between the western and eastern populations of Micronesia.
The biophysical modeling of Davies et al. (2015), indicates that gene flow, both into and out of Guam, is highly influenced by the westerly flowing NEC (Figure 1). This model also estimates that biophysical distances between the other island groups in Central Micronesia, which predominantly lie with the easterly flowing NECC, are similar, promoting the prediction of bidirectional migration with roughly equal migration rates among the islands (Davies et al., 2015). Our migration estimates for C. argus (based on divMigrate) are largely in agreement with the Davies model with evidence of bidirectional gene flow across our Central Micronesian populations in Palau, Kwajalein, and Pohnpei. We found relatively low levels of gene flow connecting these populations to the southern Mariana populations in Guam and Saipan; a finding that aligns with biophysical modeling based on A. digitifera, which predicted greater biophysical distances between Guam and the other archipelagos of Micronesia due to the prevailing westerly NEC (Figure 1) (Davies et al., 2015). Biophysical modeling also predicts that Guam, the southernmost island in the Marianas, receives the highest level of gene flow from areas outside the archipelago (Kendall and Poti, 2015). Indeed, our F-statistics and Bayesian clustering analyses, indicate that the C. argus population in Guam shows a greater genetic affinity with populations in the island groups to the south than to the Northern Mariana Islands which are geographically closer. Its large size and southern position within the NEC may make it an important entry point for migrants into the archipelago coming from the rest of Micronesia. However, it’s important to note that our analyses (TreeMix and divMigrate) also show evidence of migration events from Central Micronesia into the northern reaches of the Mariana Islands, in particular at Uracas in the far north.
Longitudinal patterns of genetic diversity
The Northern Equatorial Current (NEC) is one of the primary currents that generates large scale oceanographic patterns in the region. The NEC runs from east to west and transects Micronesia along the equator and heavily influences the southern Mariana Islands (Figure 1). Biophysical models predict that most of the larvae spawned in Guam are carried westward by the NEC toward the Coral Triangle (Davies et al., 2015; Kendall et al., 2019). South of the NEC is the easterly flowing Northern Equatorial Counter Current (NECC) that strongly influences oceanographic patterns around the more centrally located archipelagos of Micronesia including Palau and Pohnpei in the Caroline Islands and Kwajalein in the Marshall Islands (Figure 1). Studies on the two acroporid corals found that mean genetic diversity decreased with increasing easterly distance from Palau (Davies et al., 2015). Davies et al. (2015) suggest that this finding could, at least in part, be a consequence of biased easterly dispersal, influenced by the NECC [which has been implicated in other taxa; (Gaither et al., 2011a; Treml et al., 2008; Wood et al., 2014)]. This pattern also corresponds with the well-established decline in species diversity along a longitudinal gradient as one moves away from the species-rich Coral Triangle (Veron et al., 2009). While the NECC would seem to provide a mechanism to explain the pattern of eastward decreasing genetic diversity, it could also be the result of decreasing habitat area and corresponding effective population sizes along the same gradient.
Divergence of the population in the Mariana Archipelago
Across datasets there is a consistent and compelling pattern that indicates elevated genetic divergence of populations in the Mariana Islands when compared to the more southernly archipelagos of Micronesia. The Mariana Islands are surrounded by relatively habitat-sparse oceans to the east and west, with extensive island archipelagos to the south. For many species of coral reef organism, the archipelago marks the extent of their northern range (Myers and Shepard, 1980; Paulay, 2003). Large scale phylogeographic studies sometimes include sampling from Guam, and less frequently Saipan (Coppard et al., 2021; Davies et al., 2015; Gaither et al., 2011a, 2010; Priest et al., 2012), because relative to the other islands in the archipelago they are easily accessible. But our study is the first to sample the entire range of emerged islands and put them into a regional context. We found that the island’s geographic isolation is coupled with corresponding lower genetic diversity, lower rates of migration into the archipelago, and higher genetic divergence. In C. argus, we record slightly lower Ho values in the Mariana Islands populations; a finding that is similar to those reported for A. digitifera (Davies et al., 2015) and S. spinus (Priest et al., 2012) in Guam. When compared to other locations in Micronesia, the Mariana Islands were distinguished based on multiple lines of evidence including F-statistics (Figure 2), Bayesian cluster analyses (Figure 3), and DAPCs (Figure 4). We found relatively low estimates of migration rates into or out of the archipelago (Figure 6) with Guam and Saipan in the south acting as important connection points between the Mariana Islands and the rest of Central Micronesia.
The isolation of the Mariana populations is also supported by biophysical modeling. A study modeling dispersal patterns in reef fish predicted that the population of S. spinus in Guam (PLD ~33 day) was largely self-seeding, while two other taxa with longer PLDs: bluespine unicornfish (Naso unicornis, PLD ~94 days), and yellowfin goatfish (Mulloidichthys flavolineatus, PLD ~90 days) (Kendall et al., 2019) were predicted to have biased gene flow to Guam from western Micronesia (Chuuk) with lower rates from eastern Micronesia (Marshall Islands). Moreover, these models estimate the 92-98% of the larval supply of N. unicornis and M. flavolineatus in Guam are from outside sources emphasizing the role of external gene flow into Guam for population persistence. Assignment tests for S. spinus conducted over four recruitment events in Guam and Saipan supported the self-seeding predictions for that species (Priest et al., 2012). Using five microsatellites, and suffering from low power, the authors failed to confidently identify source populations for >90% of the recruits. However, in 9% of cases, they were able to exclude eastern Micronesia populations (Palau and Yap) as the source and for 2% they could exclude the western populations (Chuuk, Pohnpei, and Majuro). This finding, combined with high levels of genetic structure between Guam and Saipan, and other island groups in Micronesia, implies self-recruitment and limited gene flow from both western and eastern Micronesia populations (Priest et al., 2012). In our study, the close ancestry of three out of our nine individuals sampled in Guam to the Central Micronesian populations in Palau, Pohnpei, and Kwajalein (as revealed by DAPC and STRUCTURE plots), further underscores the influence of external gene flow into Guam from these regions.
Migration patterns within the Mariana Islands
Despite its large area and importance to regional fisheries, no genetic studies have been conducted to examine patterns of connectivity within the Mariana Islands. However, NOAA drifter data (Kendall and Poti, 2014) and biophysical models (Kendall and Poti, 2015) predict a strong south-to-north biased pattern of dispersal. Between 1990 and 2011, 145 surface drifters from the NOAA Global Drifter Program passed through the Mariana Archipelago (Kendall and Poti, 2014). Of those drifters that began in the northern islands 90% (31 out of 34) remained there and only three ended up in the southern islands of Saipan/Tinian/Rota. No drifters that started in the northern islands reached Guam. Of the three drifters that originated in Guam two remained there while the other ended up in Saipan. Over 80% of the drifters that began in the southern islands of Saipan/Tinian/Rota (9 out of 11) ended up in the northern islands (Kendall and Poti, 2014). Biophysical modelling simulating current-mediated larval transport and focusing on Guam and the greater Micronesia region also reported northward biased larval movement within the archipelago (based on life history traits of S. spinus, bluespine unicornfish Naso unicornis, and humphead wrasse Cheilinus undulatus) (Kendall and Poti, 2015). In our study we found no evidence of population structure within the archipelago based on F-statistics, but we did detect significant IBD. Our Mantel test resulted in an r value of 0.569 (p = 0.008; based on neutral loci) supporting a stepping-stone model of migration. Our migration estimates (divMigrate) indicate low migration rates between Guam and the rest of the archipelago a finding supported by the NOAA drifter data (Kendall and Poti, 2014). Our migration estimates also indicate increasing levels of south-to-north migration as we move north to Saipan and further to Anatahan (Figure 7). North of Anatahan, from Sarigan to Uracas, migration rates were bi-directional and high. While our data are congruent with the drifter data and biophysical modelling, we did not detect a significant south-to-north bias using divMigrate. Analyses of simulated data by Sundqvist et al. (2016) indicate that under scenarios of high gene flow (FST ≤ 0.005), the power of divMigrate to accurately estimate the direction of migration is low. In our dataset, most FST values in the Mariana Islands fall below this threshold (Figure 2). Our observation of a south-to-north biased gene flow is supported in part by predicted TreeMix migration events (Figure 7a; C. Micronesia + Guam to Uracas).
Conclusion
This study represents an important contribution to our understanding of phylogeographic patterns of marine species across Micronesia. Similar to two previous studies (Priest et al., 2012; Davies et al., 2015) we identified three populations in the peacock grouper C. argus across the region, specifically eastern and western populations and a distinct population in the Mariana Islands. Across all three datasets, there is a consistent east/west split with Palau and Yap in the west and Chuuk, Pohnpei, and Kwajalein in the east forming distinct clusters. Of note is that our study of C. argus and the Davies et al. (2015) study on A. hyacinthus also present evidence for greater genetic differentiation of populations in Palau relative to populations in Pohnpei and Kwajalein (Figures 2-4). In the two fish species, C. argus and S. spinus (Priest et al., 2012) this eastern cluster extends to the Marshall Islands (Kwajalein and Majuro) while in the coral A. digitifera (Davies et al., 2015), populations in the Marshall Islands form a distinct group. Moreover, across datasets, the Mariana Islands are differentiated from the rest of Micronesia, a finding supported by biophysical modelling (Kendall and Poti, 2014). However, isolation of the Marianas is not complete, with evidence of migration into the Mariana Archipelago from eastern Micronesia primarily supported by the NEC. Collectively, our findings combined with the other studies in the region highlight the vital role of genetic connectivity between Guam and Central Micronesia, despite the overall low levels of gene flow between regions. Lastly, when we focus on the Mariana Islands, we found lower levels of gene flow in the southern Marianas (from Guam and Anatahan), but substantially higher gene flow amongst the northern islands (from Sarigan to Uracas). Notably, there are multiple lines of evidence indicating that the directionality of gene flow in the Mariana Islands is northward-biased, which has important implications for resource management in the archipelago. Careful management of these southern populations is warranted, as exploitation of these populations is likely to impact the entire archipelago.
Statements
Data availability statement
The datasets presented in this study can be found in online repositories. The names of the repository/repositories and accession number(s) can be found below: https://www.ncbi.nlm.nih.gov/, PRJNA1283357. Associated metadata is available at GEOME [http://n2t.net/ark:/21547/Gio2; (Deck et al., 2017)].
Ethics statement
The animal study was approved by the Institutional Animal Care and Use Committee (IACUC). The study was conducted in accordance with the local legislation and institutional requirements.
Author contributions
PA: Conceptualization, Data curation, Formal Analysis, Methodology, Writing – original draft, Writing – review & editing. SG: Formal Analysis, Methodology, Writing – review & editing. JMO: Conceptualization, Data curation, Funding acquisition, Writing – review & editing. ES: Conceptualization, Data curation, Funding acquisition, Writing – review & editing. VM: Methodology, Writing – review & editing. MG: Conceptualization, Data curation, Funding acquisition, Project administration, Writing – review & editing.
Funding
The author(s) declare that financial support was received for the research of this article. Saltonstall-Kennedy Grant from NOAA Fisheries award number NA21NMF4270345.
Acknowledgments
Some support for personnel came from the National Science Foundation Award #2334797 to Dr. Michelle Gaither. Samuel Greaves was supported on a National Science Foundation Graduate Research Fellowship. Samples from CNMI were from the Pacific Islands Fisheries Science Center, 2025: CNMI Commercial Fisheries BioSampling (CFBS), https://www.fisheries.noaa.gov/inport/item/5633 and the Pacific Islands Fisheries Science Center, 2025: BioSampling Data from LHP Cruises, https://www.fisheries.noaa.gov/inport/item/32856. We sincerely thank Dr. Terry Donaldson, Kelsie Ebling-Whited, Andrew McInnis, and Nanny for providing samples from Guam and the fishers and staff that worked with the NOAA Commercial Fisheries Biosampling program for providing samples from CNMI. We also thank Dr. Frank Camacho at the University of Guam for thoughtful discussions when planning the overall Saltonstall-Kennedy project. Article processing charges were provided in part by the UCF College of Graduate Studies Open Access Publishing Fund.
Conflict of interest
The authors declare that the research was conducted in the absence of any commercial or financial relationships that could be construed as a potential conflict of interest.
Generative AI statement
The author(s) declare that no Generative AI was used in the creation of this manuscript.
Any alternative text (alt text) provided alongside figures in this article has been generated by Frontiers with the support of artificial intelligence and reasonable efforts have been made to ensure accuracy, including review by the authors wherever possible. If you identify any issues, please contact us.
Publisher’s note
All claims expressed in this article are solely those of the authors and do not necessarily represent those of their affiliated organizations, or those of the publisher, the editors and the reviewers. Any product that may be evaluated in this article, or claim that may be made by its manufacturer, is not guaranteed or endorsed by the publisher.
Supplementary material
The Supplementary Material for this article can be found online at: https://www.frontiersin.org/articles/10.3389/fmars.2025.1665295/full#supplementary-material
References
1
Briggs J. C. Bowen B. W. (2012). A realignment of marine biogeographic provinces with particular reference to fish distributions. J. Biogeogr.39, 12–30. doi: 10.1111/j.1365-2699.2011.02613.x
2
Carson H. S. Cook G. S. López-Duarte P. C. Levin L. A. (2011). Evaluating the importance of demographic connectivity in a marine metapopulation. Ecology, 92, 1972–1984. doi: 10.1890/11-0488.1
3
Catchen J. M. Amores A. Hohenlohe P. Cresko W. Postlethwait J. H. (2011). Stacks: building and genotyping Loci de novo from short-read sequences. G3 (Bethesda)1, 171–182. doi: 10.1534/g3.111.000240
4
Catchen J. M. Hohenlohe P. A. Bassham S. Amores A. Cresko W. A. (2013). Stacks: an analysis tool set for population genomics. Mol. Ecol.22, 3124–3140. doi: 10.1111/mec.12354
5
Chang C. C. Chow C. C. Tellier L. C. A. M. Vattikuti S. Purcell S. M. Lee J. J. (2015). Second-generation PLINK: Rising to the challenge of larger and richer datasets. Gigascience4. doi: 10.1186/s13742-015-0047-8
6
Coppard S. E. Jessop H. Lessios H. A. (2021). Phylogeography, colouration, and cryptic speciation across the Indo-Pacific in the sea urchin genus Echinothrix. Sci. Rep.11, 16568. doi: 10.1038/s41598-021-95872-0
7
Dahms C. Kemppainen P. Zanella L. N. Zanella D. Carosi A. Merilä J. et al . (2022). Cast away in the Adriatic: Low degree of parallel genetic differentiation in three-spined sticklebacks. Mol. Ecol.31, 1234–1253. doi: 10.1111/mec.16295
8
Davies S. W. Treml E. A. Kenkel C. D. Matz M. V. (2015). Exploring the role of Micronesian islands in the maintenance of coral genetic diversity in the Pacific Ocean. Mol. Ecol.24, 70–82. doi: 10.1111/mec.13005
9
Deck J. Gaither M. R. Ewing R. Bird C. E. Davies N. Meyer C. et al . (2017). The Genomic Observatories Metadatabase (GeOMe): A new repository for field and sampling event metadata associated with genetic samples. PloS Biol.15, e2002925. doi: 10.1371/journal.pbio.2002925
10
DiBattista J. D. Berumen M. L. Gaither M. R. Rocha L. A. Eble J. A. Choat J. H. et al . (2013). After continents divide: comparative phylogeography of reef fishes from the Red Sea and Indian Ocean. J. Biogeogr.40, 1170–1181. doi: 10.1111/jbi.12068
11
DiBattista J. D. Gaither M. R. Hobbs J.-P. A. Saenz-Agudelo P. Piatek M. J. Bowen B. W. et al . (2017). Comparative phylogeography of reef fishes from the Gulf of Aden to the Arabian Sea reveals two cryptic lineages. Coral Reefs36, 625–638. doi: 10.1007/s00338-017-1548-y
12
Dixon P. (2003). VEGAN, a package of R functions for community ecology. J. Veg. Sci.14, 927–930. doi: 10.1111/j.1654-1103.2003.tb02228.x
13
Epskamp S. Cramer A. O. J. Waldorp L. J. Schmittmann V. D. Borsboom D. (2012). qgraph: network visualizations of relationships in psychometric data. JSS J. Stat. Softw.48, 1–18 doi: 10.18637/jss.v048.i04
14
Evanno G. Regnaut S. Goudet J. (2005). Detecting the number of clusters of individuals using the software structure: a simulation study. Mol. Ecol.14, 2611–2620. doi: 10.1111/j.1365-294X.2005.02553.x
15
Felsenstein J. (1981). Evolutionary trees from DNA sequences: A maximum likelihood approach. J. Mol. Evol.17, 368–376. doi: 10.1007/BF01734359
16
Fitak R. R. (2021). OptM: estimating the optimal number of migration edges on population trees using Treemix. Biol. Methods Protoc.6, bpab017. doi: 10.1093/biomethods/bpab017
17
Fitzpatrick S. M. Donaldson T. J. (2007). Anthropogenic impacts to coral reefs in Palau, western Micronesia during the Late Holocene. Coral Reefs26, 915–930. doi: 10.1007/s00338-007-0226-x
18
Foll M. Gaggiotti O. (2008). A genome-scan method to identify selected loci appropriate for both dominant and codominant markers: A Bayesian perspective. Genetics180, 977–993. doi: 10.1534/genetics.108.092221
19
Gaither M. R. Bernal M. A. Coleman R. R. Bowen B. W. Jones S. A. Simison W. B. et al . (2015). Genomic signatures of geographic isolation and natural selection in coral reef fishes. Mol. Ecol24, 1543–1557. doi: 10.1111/mec.13129
20
Gaither M. R. Bowen B. W. Bordenave T.-R. Rocha L. A. Newman S. J. Gomez J. A. et al . (2011a). Phylogeography of the reef fish Cephalopholis argus(Epinephelidae) indicates Pleistocene isolation across the indo-pacific barrier with contemporary overlap in the coral triangle. BMC Evol. Biol.11, 189. doi: 10.1186/1471-2148-11-189
21
Gaither M. R. Jones S. A. Kelley C. Newman S. J. Sorenson L. Bowen B. W. (2011b). High Connectivity in the Deepwater Snapper Pristipomoides filamentosus (Lutjanidae) across the Indo-Pacific with Isolation of the Hawaiian Archipelago. PloS One6, e28913. doi: 10.1371/journal.pone.0028913
22
Gaither M. R. Rocha L. A. (2013). Origins of species richness in the Indo-Malay-Philippine biodiversity hotspot: evidence for the centre of overlap hypothesis. J. Biogeogr.40, 1638–1648. doi: 10.1111/jbi.12126
23
Gaither M. R. Toonen R. J. Robertson D. R. Planes S. Bowen B. W. (2010). Genetic evaluation of marine biogeographical barriers: perspectives from two widespread Indo-Pacific snappers (Lutjanus kasmira and Lutjanus fulvus). J. Biogeogr.37, 133–147. doi: 10.1111/j.1365-2699.2009.02188.x
24
Giovas C. M. Lambrides A. B. J. Fitzpatrick S. M. Kataoka O. (2017). Reconstructing prehistoric fishing zones in Palau, Micronesia using fish remains: A blind test of inter-analyst correspondence. Archaeol. Ocean52, 45–61. doi: 10.1002/arco.5119
25
Gonzalez E. B. Knutsen H. Jorde P. E. (2016). Habitat discontinuities separate genetically divergent populations of a rocky shore marine fish. PloS One11, e0163052. https://doi.org/10.1371/journal.pone.0163052
26
Goudet J. Jombart T. (2015). hierfstat: estimation and tests of hierarchical F-statistics. R Packag.
27
Gruber B. Unmack P. J. Berry O. F. Georges A. (2018). dartr: An r package to facilitate analysis of SNP data generated from reduced representation genome sequencing. Mol. Ecol. Resour.18, 691–699. doi: 10.1111/1755-0998.12745
28
Hijmans R. J. Williams E. Vennes C. Hijmans M. R. J. (2017). Package ‘geosphere.’. Spherical Trigonometry1, 1–45.
29
Iacchei M. Gaither M. R. Bowen B. W. Toonen R. J. (2016). Testing dispersal limits in the sea: range-wide phylogeography of the pronghorn spiny lobster Panulirus penicillatus. J. Biogeogr.43, 1032–1044. doi: 10.1111/jbi.12689
30
Jombart T. Ahmed I. (2011). adegenet 1.3-1: New tools for the analysis of genome-wide SNP data. Bioinformatics27, 3070–3071. doi: 10.1093/bioinformatics/btr521
31
Jombart T. Devillard S. Balloux F. (2010). Discriminant analysis of principal components: A new method for the analysis of genetically structured populations. BMC Genet.11. doi: 10.1186/1471-2156-11-94
32
Keenan K. McGinnity P. Cross T. F. Crozier W. W. Prodöhl P. A. (2013). diveRsity: An R package for the estimation and exploration of population genetics parameters and their associated errors. Methods Ecol. Evol.4, 782–788. doi: 10.1111/2041-210X.12067
33
Kendall M. S. Poti M. (2014). Potential larval sources, destinations, and self-seeding in the Mariana Archipelago documented using ocean drifters. J. Oceanogr.70, 549–557. doi: 10.1007/s10872-014-0251-7
34
Kendall M. S. Poti M. (Eds.) (2015). “ Transport pathways of marine larvae around the mariana archipelago,” in NOAA Technical Memorandum NOS NCCOS 193 ( Silver Spring, MD).
35
Kendall M. S. Poti M. Winship A. (2019). Is Guam a regional source, destination, or stepping-stone for larvae of three fisheries species? Fish. Oceanogr.28, 159–170. doi: 10.1111/fog.12399
36
Kopelman N. M. Mayzel J. Jakobsson M. Rosenberg N. A. Mayrose I. (2015). Clumpak: A program for identifying clustering modes and packaging population structure inferences across K. Mol. Ecol. Resour.15, 1179–1191. doi: 10.1111/1755-0998.12387
37
Luu K. Bazin E. Blum M. G. B. (2017). pcadapt: an R package to perform genome scans for selection based on principal component analysis. Mol. Ecol. Resour. 67–77. doi: 10.1111/1755-0998.12592
38
Ma K. Y. Van Herwerden L. Newman S. J. Berumen M. L. Choat J. H. Chu K. H. et al . (2018). Contrasting population genetic structure in three aggregating groupers (Percoidei: Epinephelidae) in the Indo-West Pacific: the importance of reproductive mode. BMC Evol. Biol.18, 180. doi: 10.1186/s12862-018-1284-0
39
Mantel N. (1967). The detection of disease clustering and a generalized regression approach. Cancer Res.27, 209–220.
40
Milanesi M. Capomaccio S. Vajana E. Bomba L. Garcia J. F. Ajmone-Marsan P. et al . (2017). BITE: an R package for biodiversity analyses. bioRxiv. doi: 10.1101/181610
41
Myers R. F. Shepard J. W. (1980). New records of fishes from Guam, with notes on the ichthyofauna of the southern Marianas. Micronesica16, 305–347.
42
Otwoma L. M. Kochzius M. (2016). Genetic population structure of the coral reef sea star Linckia laevigata in the Western Indian Ocean and Indo-West Pacific. PloS One11, e0165552. doi: 10.1371/journal.pone.0165552
43
Paulay G. (2003). Marine biodiversity of Guam and the Marianas: overview. Micronesica35, 3–25.
44
Peterson B. K. Weber J. N. Kay E. H. Fisher H. S. Hoekstra H. E. (2012). Double digest RADseq: An inexpensive method for de novo SNP discovery and genotyping in model and non-model species. PloS One7. doi: 10.1371/journal.pone.0037135
45
Pickrell J. K. Pritchard J. K. (2012). Inference of population splits and mixtures from genome-wide allele frequency data. PloS Genet.8. doi: 10.1371/journal.pgen.1002967
46
Plummer M. Best N. Cowles K. Vines K. (2006). CODA: convergence diagnosis and output analysis for MCMC. R News6, 7–11.
47
Priest M. A. Halford A. R. McIlwain J. L. (2012). Evidence of stable genetic structure across a remote island archipelago through self-recruitment in a widely dispersed coral reef fish. Ecol. Evol.2, 3195–3213. doi: 10.1002/ece3.260
48
Pritchard J. K. Stephens M. Donnelly P. (2000). Inference of population structure using multilocus genotype data. Genetics155, 945–959. doi: 10.1093/genetics/155.2.945
49
Puckett B. J. Eggleston D. B. (2016). Metapopulation dynamics guide marine reserve design: Importance of connectivity, demographics, and stock enhancement. Ecosphere7. doi: 10.1002/ecs2.1322
50
Purcell S. Neale B. Todd-Brown K. Thomas L. Ferreira M. A. R. Bender D. et al . (2007). PLINK: A tool set for whole-genome association and population-based linkage analyses. Am. J. Hum. Genet.81, 559–575. doi: 10.1086/519795
51
Randall J. E. (2005). Reef and shore fishes of the South Pacific Honolulu: Sea Grant College Program (Honolulu: Univ. Hawai’i Press).
52
Riginos C. Crandall E. D. Liggins L. Gaither M. R. Ewing R. B. Meyer C. et al . (2020). Building a global genomics observatory: Using GEOME (the Genomic Observatories Metadatabase) to expedite and improve deposition and retrieval of genetic data and metadata for biodiversity research. Mol. Ecol. Resour.20, 1458–1469. doi: 10.1111/1755-0998.13269
53
Riginos C. Douglas K. E. Jin Y. Shanahan D. F. Treml E. A. (2011). Effects of geography and life history traits on genetic differentiation in benthic marine fishes. Ecography (Cop.)34, 566–575. doi: 10.1111/j.1600-0587.2010.06511.x
54
Riginos C. Liggins L. (2013). Seascape genetics: populations, individuals, and genes marooned and adrift. Geogr. Compass7, 197–216. doi: 10.1111/gec3.12032
55
Riginos C. Nachman M. W. (2001). Population subdivision in marine environments: the contributions of biogeography, geographical distance and discontinuous habitat to genetic differentiation in a blennioid fish, Axoclinus nigricaudus. Mol. Ecol10, 1439–1453. doi: 10.1046/j.1365-294X.2001.01294.x
56
Rochette N. C. Rivera-Colón A. G. Catchen J. M. (2019). Stacks 2: Analytical methods for paired-end sequencing improve RADseq-based population genomics. Mol. Ecol.28, 4737–4754. doi: 10.1111/mec.15253
57
Rousset F. (1997). Genetic differentiation and estimation of gene flow from F-statistics under isolation by distance. Genetics145, 1219–1228. doi: 10.1093/genetics/145.4.1219
58
Schemmel E. M. Donovan M. K. Wiggins C. Anzivino M. Friedlander A. M. (2016). Reproductive life history of the introduced peacock grouper Cephalopholis argus in Hawaii. J. Fish Biol.89, 1271–1284. doi: 10.1111/jfb.13036
59
Sundqvist L. Keenan K. Zackrisson M. Prodöhl P. Kleinhans D. (2016). Directional genetic differentiation and relative migration. Ecol. Evol.6, 3461–3475. doi: 10.1002/ece3.2096
60
Thia J. A. (2023). Guidelines for standardizing the application of discriminant analysis of principal components to genotype data. Mol. Ecol. Resour.23, 523–538. doi: 10.1111/1755-0998.13706
61
Timmers M. A. Bird C. E. Skillings D. J. Smouse P. E. Toonen R. J. (2012). There’s no place like home: Crown-of-thorns outbreaks in the central pacific are regionally derived and independent events. PloS One7. doi: 10.1371/journal.pone.0031159
62
Treml E. A. Halpin P. N. Urban D. L. Pratson L. F. (2008). Modeling population connectivity by ocean currents, a graph-theoretic approach for marine conservation. Landsc. Ecol.23, 19–36. doi: 10.1007/s10980-007-9138-y
63
Veron J. E. N. Devantier L. M. Turak E. Green A. L. Kininmonth S. Stafford-Smith M. et al . (2009). Delineating the coral triangle. Galaxea J. Coral Reef Stud.11, 91–100. doi: 10.3755/galaxea.11.91
64
Wang L. C. Wu C. R. (2013). Contrasting the flow patterns in the equatorial pacific between two types of El Niño. Atmos. Ocean51, 60–74. doi: 10.1080/07055900.2012.744294
65
Weersing K. Toonen R. J. (2009). Population genetics, larval dispersal, and connectivity in marine systems. Mar. Ecol. Prog. Ser.393, 1–12. doi: 10.3354/meps08287
66
Weir B. S. Cockerham C. C. (1984). Estimating F-statistics for the analysis of population structure. Evol. (N. Y.)38, 1358–1370. doi: 10.2307/2408641
67
White J. W. Carr M. H. Caselle J. E. Washburn L. Woodson C. B. Palumbi S. R. et al . (2019). Connectivity, dispersal, and recruitment. Spec. ISSUE PISCO Partnersh. Interdiscip. Stud. Coast. Ocean32, 50–59. doi: 10.2307/26760082
68
Whitlock M. C. Lotterhos K. E. (2015). Reliable detection of loci responsible for local adaptation: inference of a null model through trimming the distribution of FST. Am. Nat.186, S24–S36. doi: 10.1086/682949
69
Wickham H. (2016). ggplot2: Elegant Graphics for Data Analysis ( Cham: Springer). doi: 10.1007/978-3-319-24277-4
70
Wigginton J. E. Cutler D. J. Abecasis G. R. (2005). A note on exact tests of hardy-Weinberg equilibrium. Am. J. Hum. Genet76, 887–893. doi: 10.1086/429864
71
Wood S. Paris C. B. Ridgwell A. Hendy E. J. (2014). Modelling dispersal and connectivity of broadcast spawning corals at the global scale. Glob. Ecol. Biogeogr.23, 1–11. doi: 10.1111/geb.12101
72
Wright S. (1943). Isolation by distance. Genetics28, 114–138. doi: 10.1093/genetics/28.2.114
Summary
Keywords
Mariana Islands, RADseq, SNPs, divMigrate, TreeMix, phylogeography, CNMI
Citation
Amirthalingam P, Greaves S, O’Malley JM, Schemmel E, Marciante V and Gaither MR (2025) Phylogeographic analyses detect population structure and limited gene flow in the Peacock Grouper Cephalopholis argus across Micronesia. Front. Mar. Sci. 12:1665295. doi: 10.3389/fmars.2025.1665295
Received
14 July 2025
Revised
07 November 2025
Accepted
10 November 2025
Published
10 December 2025
Volume
12 - 2025
Edited by
Lutfi Afiq-Rosli, King Abdullah University of Science and Technology, Saudi Arabia
Reviewed by
Tammy Iwasa-Arai, State University of Campinas, Brazil
Julia Tovar Verba, Ludwig Maximilian University of Munich, Germany
Updates
Copyright
© 2025 Amirthalingam, Greaves, O’Malley, Schemmel, Marciante and Gaither.
This is an open-access article distributed under the terms of the Creative Commons Attribution License (CC BY). The use, distribution or reproduction in other forums is permitted, provided the original author(s) and the copyright owner(s) are credited and that the original publication in this journal is cited, in accordance with accepted academic practice. No use, distribution or reproduction is permitted which does not comply with these terms.
*Correspondence: Pavithiran Amirthalingam, Pavithiran.Amirthalingam@ucf.edu; Michelle Gaither, Michelle.Gaither@ucf.edu
Disclaimer
All claims expressed in this article are solely those of the authors and do not necessarily represent those of their affiliated organizations, or those of the publisher, the editors and the reviewers. Any product that may be evaluated in this article or claim that may be made by its manufacturer is not guaranteed or endorsed by the publisher.