Abstract
The Mediterranean Sea has experienced pronounced warming over the past few decades, but since 2022 this trend has accelerated markedly, culminating in 2024, the hottest and most dynamically energetic year of the last four decades. Record-high sea surface temperatures (SSTs) were observed across both the Western and Eastern subbasins. This study examines the spatio-temporal variability of the 2024 temperature anomaly and its driving mechanisms using satellite observations of SST and sea level, surface fluxes from atmospheric reanalysis, Citizen Science in-situ coastal data, and ocean reanalysis products from the Copernicus Marine Service. Following the strong ocean heat uptake during summer 2023, a prolonged phase of reduced ocean-to-atmosphere heat loss maintained SSTs well above climatology through autumn 2023 and winter–spring 2024. In February 2024, SSTs exceeded 15°C in the Western Mediterranean and nearly 18°C in the Eastern basin. During summer 2024, the Eastern Mediterranean underwent an exceptional marine heatwave, with surface temperatures reaching about 29°C by late August. This anomaly was mainly driven by intense air–sea heat fluxes acting on an unusually shallow mixed layer, which amplified upper-ocean heat storage and persistence. Altimeter and model data reveal that 2024 also marked a sharp increase in mean and eddy kinetic energy (EKE), particularly in the Algerian, Northwestern, and Levantine basins, where the strongest SST anomalies were observed. We found that basin-scale geostrophic kinetic energy has increased markedly from 1993 to 2024, with 2024 standing out as an exceptionally energetic year that deviates from the long-term linear trend. Overall, 2024 represents a year of exceptional oceanic conditions in the Mediterranean, with a strong link between the surface warming and enhanced oceanic kinetic energy.
1 Introduction
The Mediterranean region (Figure 1) has been identified as a “climate hotspot” (Giorgi, 2006) and is particularly vulnerable to the effects of rising global temperatures due to its unique geographic and climatic characteristics (Tuel and Eltahir, 2020). Over the period from the 1980s to 2024, the European region has experienced a markedly higher rate of air temperature increase compared to the global mean, with average temperatures rising by approximately +2.3°C above pre-industrial levels, nearly twice the global warming of around +1.5°C during the same period (eg Copernicus Climate Change Service (C3S), 2024; Bevacqua et al., 2025).
Figure 1
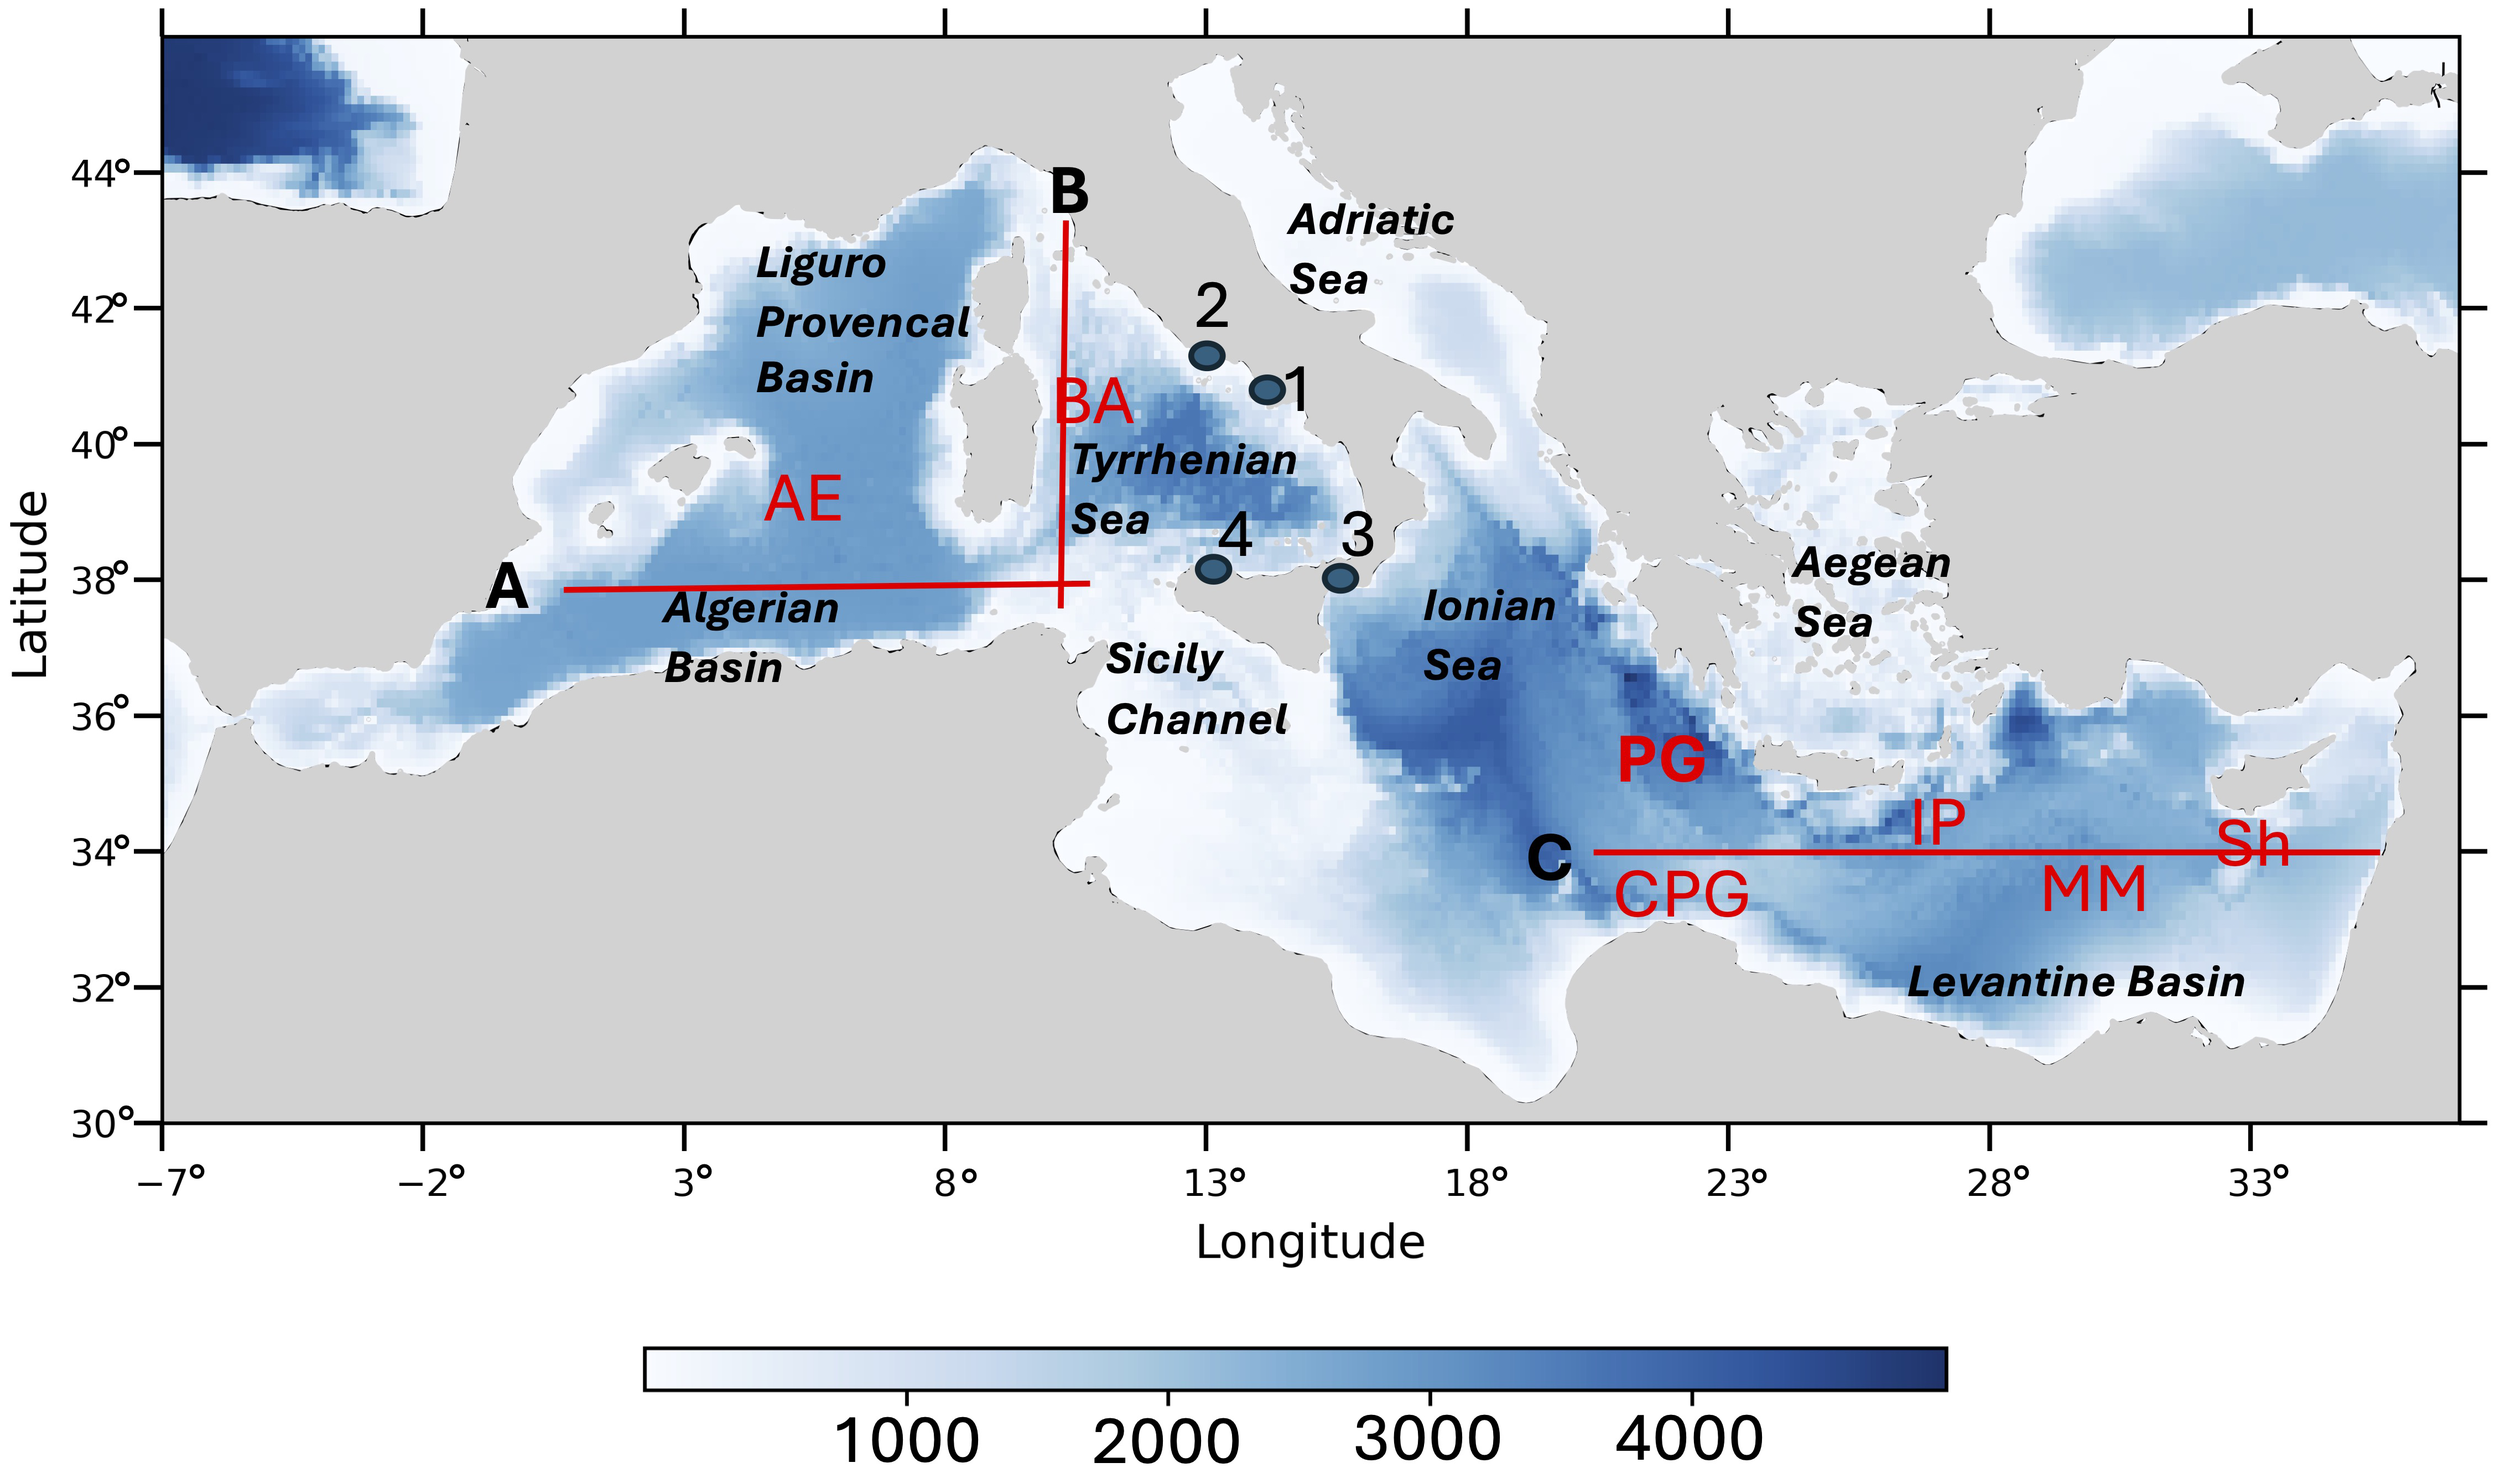
Bathymetry of the Mediterranean Sea. Black dots indicate the locations where citizen science observations were collected: 1 – Banco di Santa Croce (Gulf of Naples), 2 – Anzio, 3 – Scilla, 4 – Palermo. Sections (A–C) mark the transects from which vertical temperature sections were extracted from the CMEMS model, (see Section 3.3). Regions of quasi-permanent structures: BA, Bonifacio Anticyclone; AE, Algerian Eddies; CPG, Cretan Passage gyre; IP, Iera Petra; MM, Mersha Matruth; Sh, Shikmona are the location of quasi-permanet Gyre.
This accelerated warming rate, compared to other regions, highlights the significant climate transformations occurring in the Mediterranean and the potential consequences for both ecosystems and human activities (MedECC, 2020). Specifically, the Mediterranean Sea has experienced a consistent increase in Sea Surface Temperature (SST) over the past few decades (e.g., Nykjaer, 2009; Vargas-Yáñez et al., 2017; Iona et al., 2018; Pisano et al., 2020; Juza et al., 2022; Kubin et al., 2023), with an average increase of about 1.5°C in the last forty years.
In terms of the ocean interior, a century’s worth of oceanographic data has shown a steady increase in both temperature and salinity within the Mediterranean’s water masses (e.g., Bethoux and Gentili, 1999; Krahmann and Schott, 1998). However, since 2005, there has been a notable shift in the structure of the intermediate and deep layers (Schroeder et al., 2016): The western Mediterranean has experienced changes of the thermohaline variability, with significant formation of warmer, saltier, and denser deep waters. Recent research conducted by Skliris et al. (2025) has reported new findings on air-sea exchanges over the past years. The study focused on trends in air-sea freshwater and heat fluxes, as well as hydrographic properties in the Mediterranean from 1979 to 2023, in order to evaluate changes in dense water formation rates. The results of the study show an acceleration in evaporation, an increase in winter latent heat flux in the eastern Mediterranean, and a decrease in sensible heat flux in the western Mediterranean, the latter attributed to a more rapid warming of the air compared to sea surface temperatures.
The Mediterranean basin is also characterized by higher-frequency transient events occurring on shorter time scales, including marine heatwaves (MHWs) [EEA (European Environment Agency), 2024]. These events are typically defined as periods of at least five consecutive days where SSTs exceed the 90th percentile of historical “normal conditions” SST values (Hobday et al., 2016, 2018). In recent decades, these events have intensified in terms of frequency, intensity, and duration (e.g., Amaya et al., 2023; Darmaraki et al., 2019; Pastor and Khodayar, 2023; Ibrahim et al., 2021; Juza and Tintoré, 2021; Hamdeno and Alvera-Azcarate, 2023; Dayan et al., 2023). In a recent study, Marullo et al. (2023) found that the Mediterranean experienced unusually long MHWs beginning from spring of 2022 to the end of 2023. However, the standard definition of MHWs, which specifies a limited duration, makes it difficult to classify these extended warming periods as heatwaves (Berthou et al., 2024).
This prolonged warming in the Mediterranean Sea appears to be part of a broader pattern of oceanic and atmospheric anomalies. Terhaar et al. (2025) report that, between 2023 and 2024, ocean surface temperatures reached record levels, rising by 0.25°C above the previous peak. The authors suggest that such a sudden increase is extremely rare in the absence of global warming.
Recent studies focusing on basins adjacent to the Mediterranean have also documented anomalous phenomena, particularly in the North Atlantic, where unusual oceanographic conditions have been observed over the past two years (2023–2024). For instance, Carton et al. (2025) described a remarkable basin-wide warming of the North Atlantic in 2023, highlighting anomalously high SSTs across extensive areas, driven by a combination of oceanic heat accumulation and reduced atmospheric heat loss. They also emphasized the roles of both mean and eddy heat fluxes.
Moreover, Berthou et al. (2024) documented how exceptional atmospheric conditions over northwestern Europe in June 2023 generated a regional marine heatwave, contributing to unprecedented land temperature records.
In this context, Samset et al. (2024) argue that the exceptional 2023 surface temperatures in the North Atlantic were not isolated anomalies but rather the outcome of long-term global warming interacting with natural variability. Their analysis supports the hypothesis that recent marine thermal extremes, whether in the Atlantic or the Mediterranean, reflect the combined influence of sustained ocean warming and short-term variability.
Supporting this interpretation, Guinaldo et al. (2025) show that the 2023 North Atlantic marine heat extreme was primarily driven by internal climate variability intensified by anthropogenic warming. Their findings illustrate how the interaction between natural ocean–atmosphere dynamics and a steadily warming climate background can result in record-breaking SST anomalies across broad marine regions.
More recently, England et al. (2025) provided new insights into the physical mechanisms underlying the 2023 North Atlantic marine heatwave. By combining observationally constrained reanalysis, ocean data, and model simulations, they showed that the event was driven primarily by air–sea heat fluxes acting on an unusually shallow surface mixed layer, rather than by anomalous ocean heat transport. Anomalously weak winds were identified as the main cause of the mixed-layer shoaling, leading to a rapid and intense surface warming. In addition, regional solar radiation anomalies, contributed locally to the warming.
Motivated by data from the Copernicus Climate Change Service (C3S) showing that global temperatures in 2024 were the highest on record since 1850, this study investigates the variability of sea surface temperatures in the Mediterranean basin during that year, aiming to understand the thermal response of the region’s surface waters to this unprecedented global warming event. To achieve this goal, we compare satellite-retrieved SST data in the period 1 January-31 December 2024 with a reference (1991-2020) climatology and data from the preceding two years (2022 and 2023). Additionally, we utilize the NEMO-COPERNICUS model data to examine the changes in the temperature over the entire water column, including deep layers. Data from coastal seabeds, collected through citizen science initiatives, were also used. These measurements show that thermal anomalies were present on the seafloor at the sampling sites.
Furthermore, we examine heat fluxes at the air-sea interface by using ERA5 reanalysis data, and explore the role of circulation in the redistribution of heat within the surface layers using altimeter data.
This study makes use of a comprehensive framework to investigate the drivers of the 2024 marine heat anomaly, by combining the analysis of air–sea heat fluxes with the contribution of ocean circulation processes. This framework allows for a more comprehensive understanding of the mechanisms driving marine heat anomalies, which is essential for improving both the identification of their causes and the ability to predict their occurrence.
In Section 2, we present the data sources and methods employed in this study, including both observational datasets and model outputs. Section 3 contains the results and discussion: in 3.1 we analyze temperature variability from satellite observations, in 3.2 we examine in situ measurements, and in 3.3 we assess outputs from the Copernicus NEMO model. The role of air–sea exchanges is addressed in 3.4, while 3.5 focuses on the role of ocean circulation. Finally, Section 4 presents the main conclusions of the study.
2 Data and methods
We use a gap-free, reprocessed daily SST dataset from the Copernicus Marine Service (CMEMS) (product: SST_MED_PHY_L3S_MY_010_042), covering the period 1982–2025 with a nominal resolution of 4 km. Details on the dataset construction from single-sensor satellite measurements are provided in Pisano et al. (2016) and in the product description available on the Copernicus website. This dataset is currently the reference dataset for the Mediterranean basin, used in several studies on the SST variability of the basin (e.g., Marullo et al., 2023). We used sea level anomaly and geostrophic velocity fields from the AVISO product SEALEVEL_EUR_PHY_L4_MY_008_068, distributed through the CMEMS portal. The dataset provides observations for the Mediterranean Sea at 1/8° spatial resolution, covering the period 1993–2024, and includes both Delayed-Time and Near Real-Time products. Currents and temperature in the ocean interior are obtained from the NEMO-based product MEDSEA_ANALYSISFORECAST_PHY_006_013, distributed by the CMEMS. This dataset, produced with the Nucleus for European Modelling of the Ocean (NEMO) model, has a horizontal resolution of 1/24° (~4 km) and 141 vertical levels. It assimilates temperature and salinity profiles together with satellite sea level anomalies through a 3DVAR scheme, and explicitly accounts for tidal dynamics. The product provides three-dimensional fields of potential temperature, salinity, and velocity components, along with surface variables such as sea surface height and mixed layer depth.
Air-sea fluxes were obtained from the ERA5 reanalysis dataset, produced by the European Centre for Medium-Range Weather Forecasts (ECMWF) on behalf of the Copernicus Climate Change Service (CDS). ERA5 provides hourly estimates of atmospheric, ocean-wave, and land-surface variables at a spatial resolution of approximately 31 km. The dataset includes 137 vertical levels, extending from the surface up to about 80 km altitude. It covers the period from 1940 to the present, offering a comprehensive record of historical weather and climate data. ERA5 assimilates a wide range of observational data using a 4D-Var data assimilation system, ensuring a consistent and accurate representation of atmospheric conditions.
We also utilize in situ temperature data available from 2016 to 2024 obtained in the context of the MedFever project. In 2021, MedSharks and ENEA (de Sabata et al., 2022) established a growing network of small observatories in the Tyrrhenian Sea, building upon the experience gained from an observation point established in 2016 in the Gulf of Naples. High-frequency measurements (at 15-minute intervals) were taken at standard depths of 5, 15, and 35 meters, with occasional measurements at 10, 20, 25, 30, 50, and 60 meters) were obtained by volunteer diving centers using calibrated HOBO sensors, with an accuracy of approximately ±0.1°C after calibration. The sensors were positioned at 12 stations evenly distributed across the Tyrrhenian Sea. For this study, we have utilized data from sensors positioned over the bottom relief at four sites with continuous recordings, including data up to 2024. These sites are Banco di Santa Croce in the Gulf of Naples (at a depth of 36 meters), Scilla near the Messina Strait (at a depth of 50 meters), Anzio (at a depth of 42 meters), and the site of La Formica near Palermo (at a depth of 50 meters) (see Figure 1).
3 Results and discussion
3.1 Satellite observations
Figure 2 shows the monthly time series of satellite-derived sea surface temperature (SST) anomalies from 1982 to 2024, averaged over the basin. The anomalies were calculated by using as baseline climatology the period from 1991 to 2020, following the guidelines of the World Meteorological Organization (WMO). The time series reveals a linear warming trend up to 2021, which is consistent with CMEMS data (e.g. Pisano et al., 2020, see also https://data.marine.copernicus.eu/product/MEDSEA_OMI_TEMPSAL_sst_area_averaged_anomalies/). This trend is followed by a significant increase over the next three years, with 2024 marking the highest recorded anomalies. The years 2022, 2023, and 2024 form distinct clusters, with unprecedented anomalies in sea surface temperatures. However, the extreme 2023 event stands out as the most significant peak in sea surface temperatures before this period. Figure 3A shows the time series of the seasonal cycle of SST averaged over the entire Mediterranean Sea.
Figure 2

Monthly time series of satellite-derived sea surface temperature (SST) anomalies averaged over the Mediterranean basin from 1982 to 2024.
Figure 3
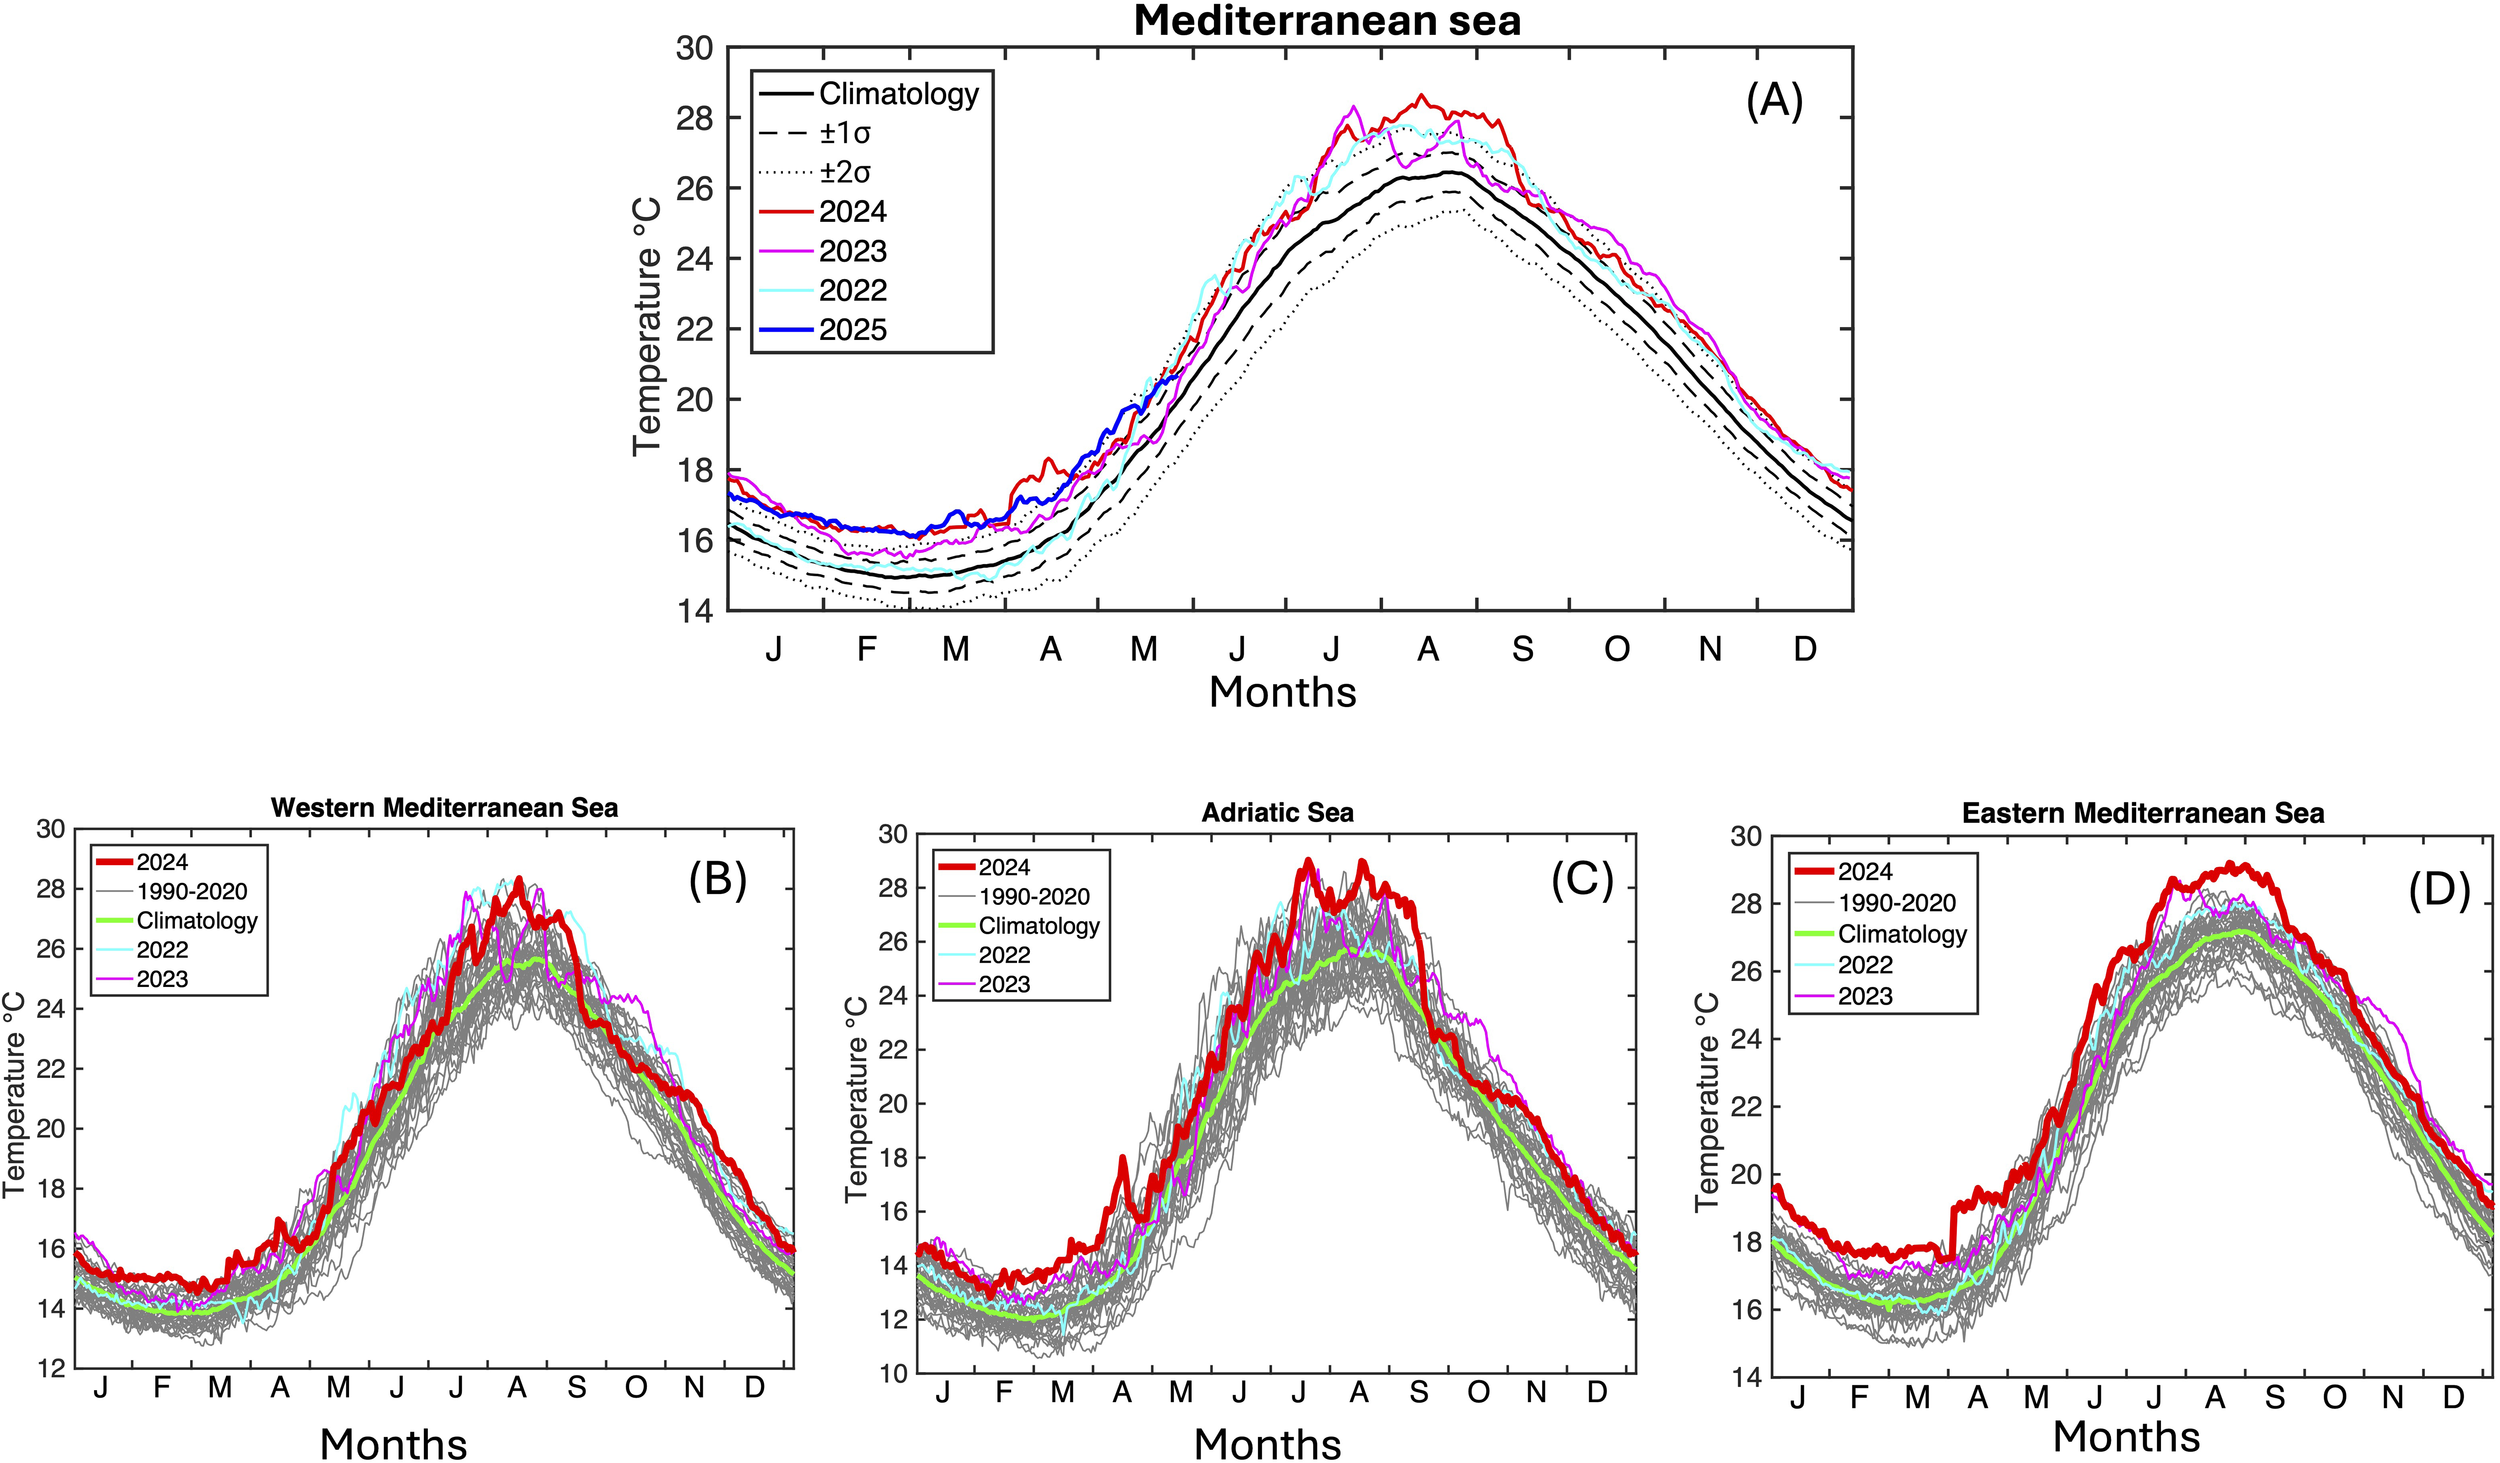
(A) Daily SST in the Mediterranean Sea for 2022–2024, and the 1991–2020 daily climatology (black line). Dashed and dotted lines show the ±1σ and ±2σ ranges. The SST values for the first five months of 2025 are also displayed (blue curve). Daily Sea Surface Temperature (SST) variability in the three main Mediterranean sub-basins: (B) the Western Mediterranean (WMED), (C) the Adriatic Sea and (D) the Eastern Mediterranean (EMED) for the years 2022, 2023, and 2024. Grey lines represent daily SST values from individual years between 1991 and 2020, and the green line shows their multi-year average.
Here we present the seasonal cycle for SST data using the same approach adopted by Marullo et al., 2023. Figure 3A presents the seasonal cycle of the daily Mediterranean SST for the years 2022, 2023, and 2024, compared with the 1991–2020 climatological baseline (black solid line). The dashed and dotted lines indicate the ±1σ and ±2σ (standard deviations) envelopes, respectively. In 2022, the SST values are close to the climatological ones till May and then strongly increase, reaching the +2σ threshold, and remaining well above the climatology till the end of the year. Even though this warming has been described as a heatwave (e.g, Marullo et al., 2023), anomalously long by Mediterranean standards, the figure shows that similar levels of warming have occurred in 2023, setting the stage for the extreme SST anomalies of 2024. In this context, the winter of 2024 stands out, exhibiting the highest SST anomalies recorded in the past four decades. During the February-April period, and during summer, the SST values frequently exceeded the +2σ threshold. Overall, the SST values of 2023 and 2024 are only sporadically lower than those of the second half of 2022, highlighting a persistent anomalous warming of the basin. The warming appears to extend even further; see the blue curve in the figure which reports values through May 2025, which is the last available at the time of this writing.
Figures 3B, C, D show the daily evolution of Sea Surface Temperature (SST) in the three principal sub-basins of the Mediterranean Sea: (B) the Western Mediterranean, (C) the Adriatic Sea, and (D) the Eastern Mediterranean. Baseline climatologies (1991-2020) were computed independently for each sub-basin to properly represent their distinct mean thermal states and regional variability.
The Figures show that in 2024, the EMED experienced the strongest anomalies, with particularly high temperature peaks both during the winter months in April and from August to mid-September (peaking at around 29°C), while the WMED had its highest temperature in February and November.
The data from the two past years shows SST values significantly above the climatological averages, particularly from spring to late summer. This supports recent findings that suggest a strengthening of warming trends starting in 2022 (Marullo et al., 2023). It is important to note that while the figure displays area averages, local temperatures in the northern Adriatic and the EMED reached unprecedented levels of nearly 30°C during the summer 2024. In the Western Mediterranean, winter temperatures in February exceeded 15°C, marking the highest winter values recorded in the region over the past 40 years.
We will now analyze the horizontal distribution of the monthly temperature anomalies with respect to the monthly baseline climatology (1991-2020). Figure 4 shows maps of SST monthly anomalies for 2024 during selected months when the Mediterranean basin experiences particularly warm temperatures, as indicated in Figure 3. These anomalies are mainly concentrated within mesoscale structures, with well-known, quasi-permanent structures such as the Algerian eddies (eg Testor et al., 2005), the Pelops gyre (36°N,20°E), and the eddies in the Levantine basin easily recognizable (see arrow in the February map and their positions in Figure 1). High anomalies are also observed in the Adriatic Sea and Aegean Sea but do not appear related to specific dynamical structures.
Figure 4
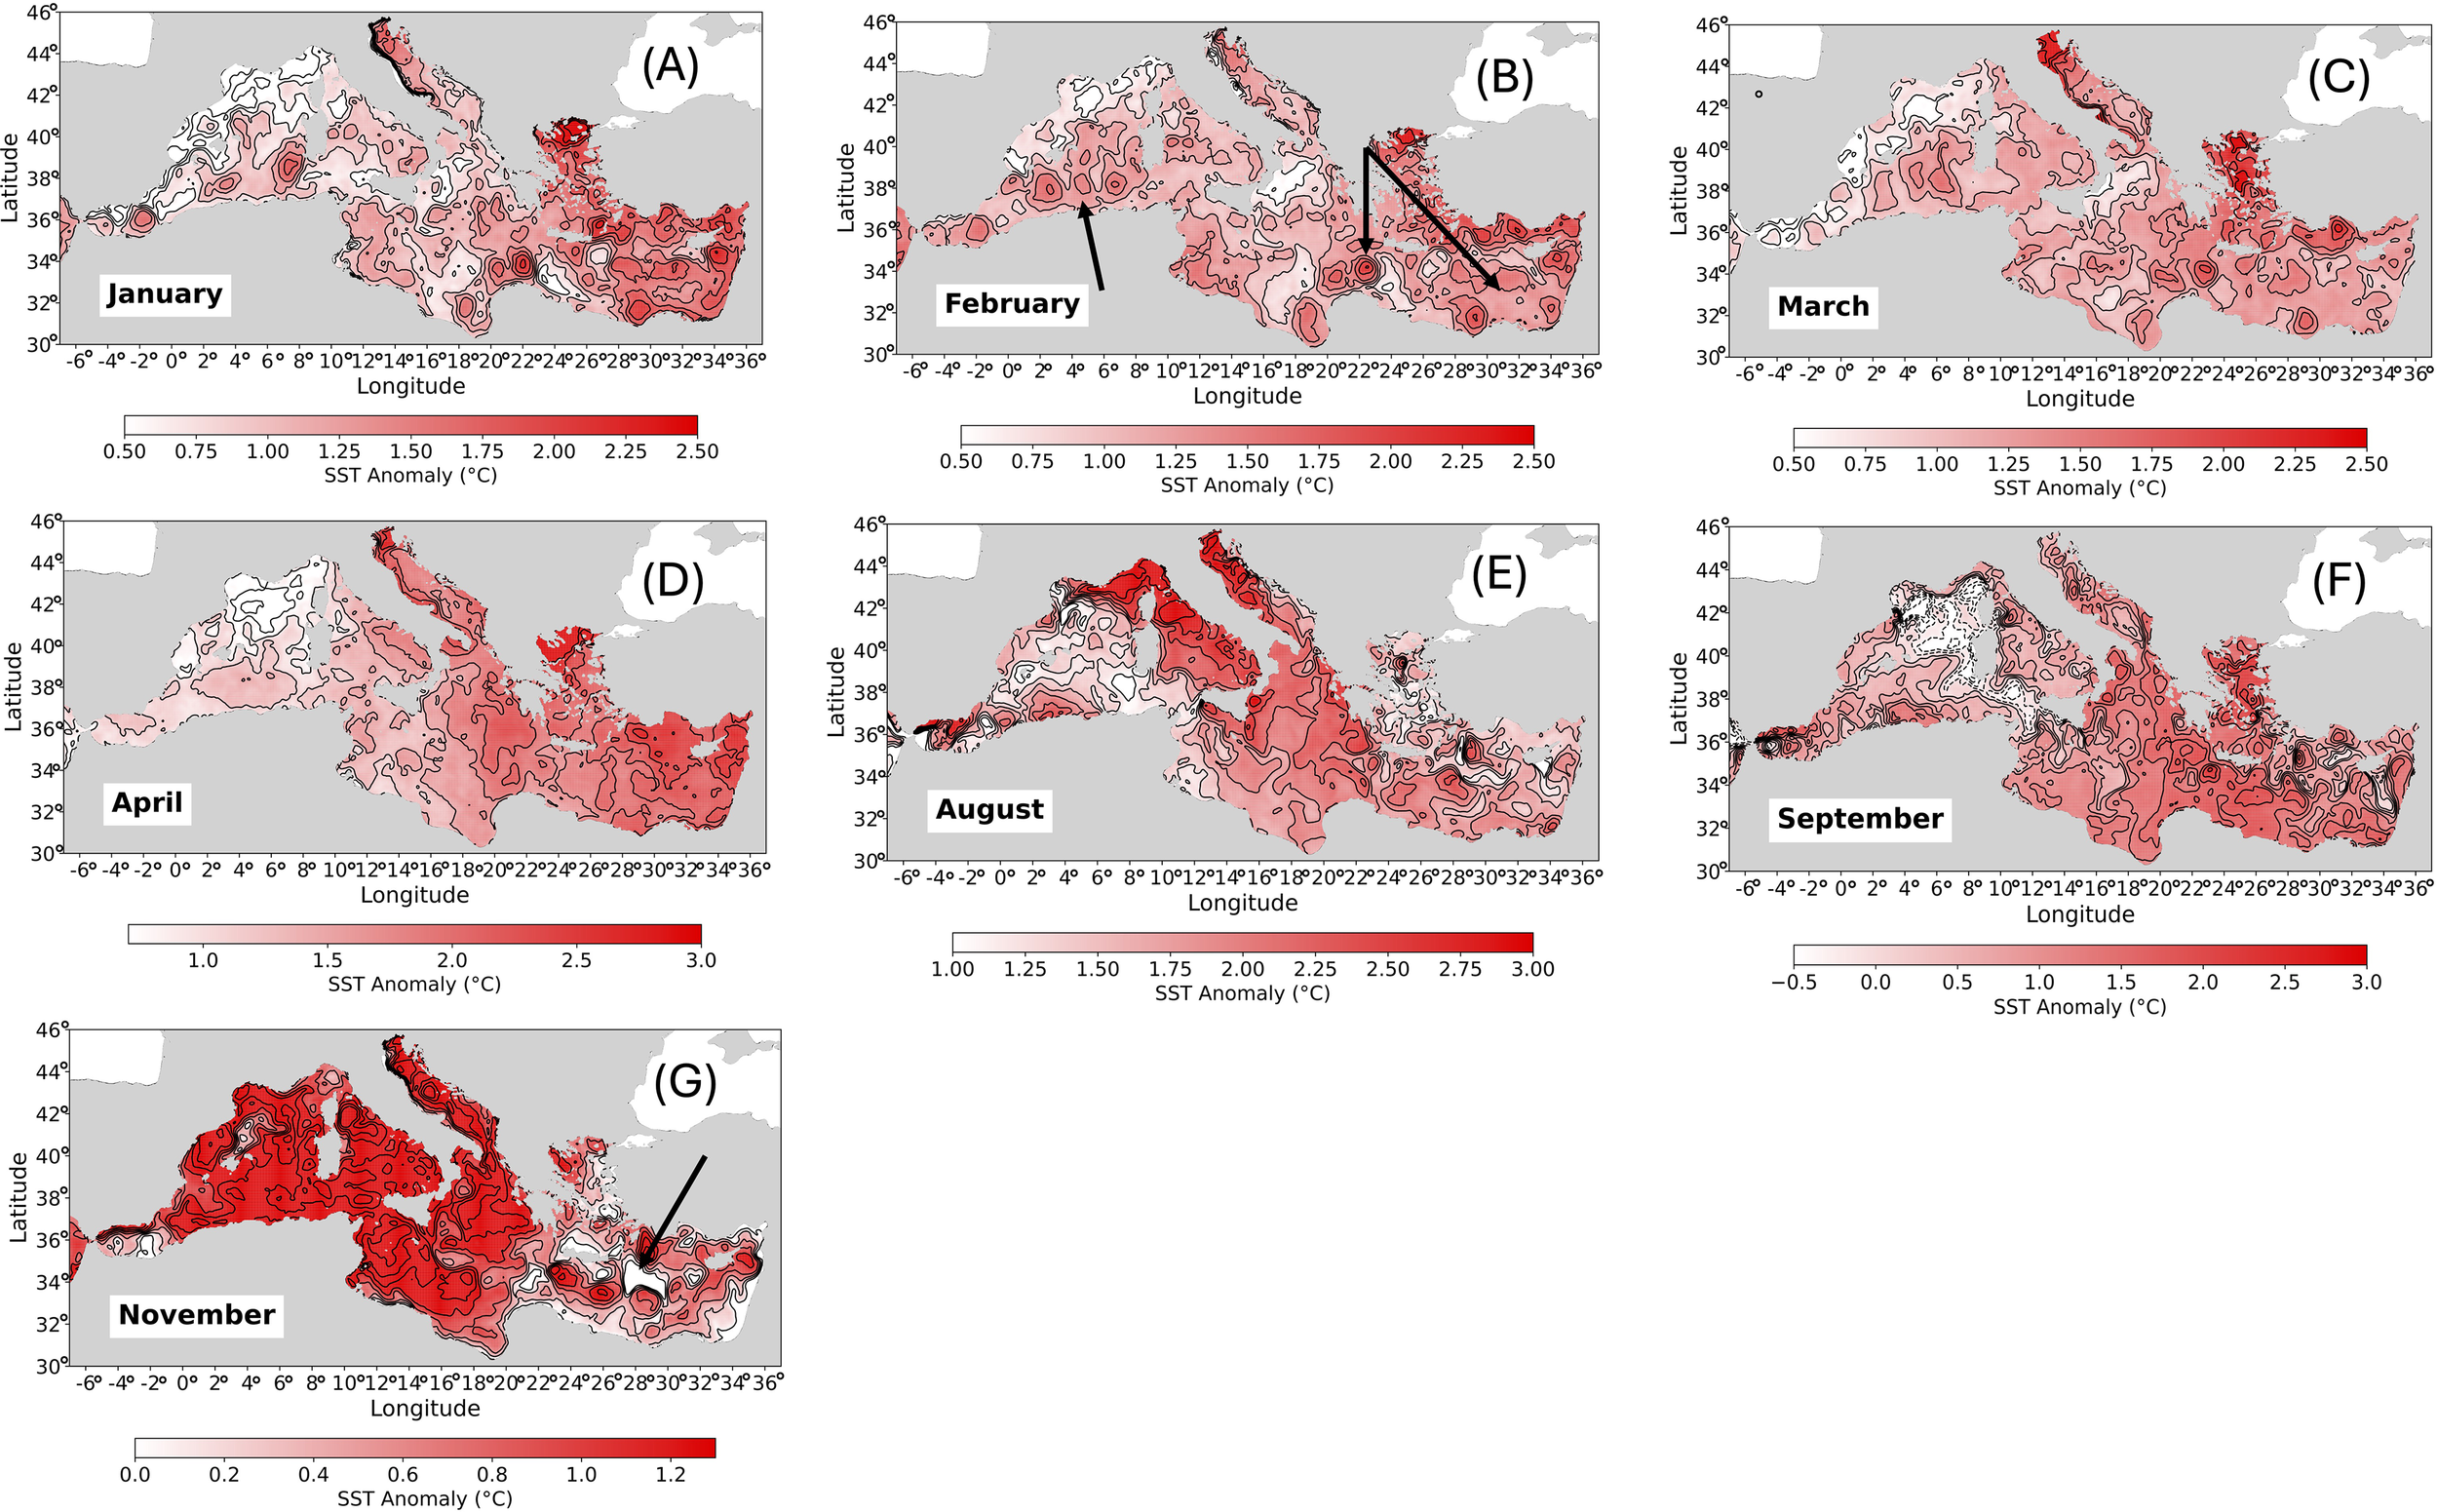
SST anomaly maps for January (A), February (B), March (C), April (D), August (E), September (F) and November (G). Arrows indicates quasi-permanent mesoscale features of the basin, in particular the Algerian, and Levantine eddies.
The temperature anomaly maps suggest that ocean circulation plays a significant role in the distribution and intensity of temperature anomalies, particularly through sub-basin structures and mesoscale eddies. The concentration of heat within eddies can be attributed to several factors. For example, eddies have the ability to trap and transport water with distinct temperature characteristics, potentially bringing warmer waters into certain regions and resulting in positive anomalies. Conversely, cold eddies may moderate local temperatures. Furthermore, these structures may also affect the vertical stratification of the water column. Stronger stratification can hinder the mixing of heat with deeper, cooler waters, potentially amplifying SST anomalies within the eddy. Additionally, eddies can impact local air-sea interactions, potentially influencing heat fluxes at the surface and contributing to the persistence or intensification of SST anomalies within them.
Moreover Figure 4 shows that the deep-water formation regions (the Gulf of Lions and the southern Adriatic Pit) do not exhibit positive SST anomalies when active, since the intense vertical heat transport and upwelling of cool deep waters act to mitigate surface warming anomalies.
Figure 4 indicates also that the role of the circulation and eddy activity has been particularly pronounced in 2024.
3.2 MEDFEVER coastal data in the Tyrrhenian Sea
Seafloor temperatures recorded as part of the MEDFEVER (de Sabata et al., 2022) initiative are shown at four sites in the shallow coastal regions of the Tyrrhenian Sea (see Figure 5). At the Gulf of Naples site (Banco di Santacroce), measurements have been available since 2016, while at the Silla, Anzio, and Palermo sites, data are available only from 2021. At each measurement site, minimum temperatures are reached between February and March, while maximum values typically occur in autumn, specifically from late September to November. This is due to the breakdown of the seasonal thermocline, which transfers the heat accumulated during summer to deeper depths.
Figure 5
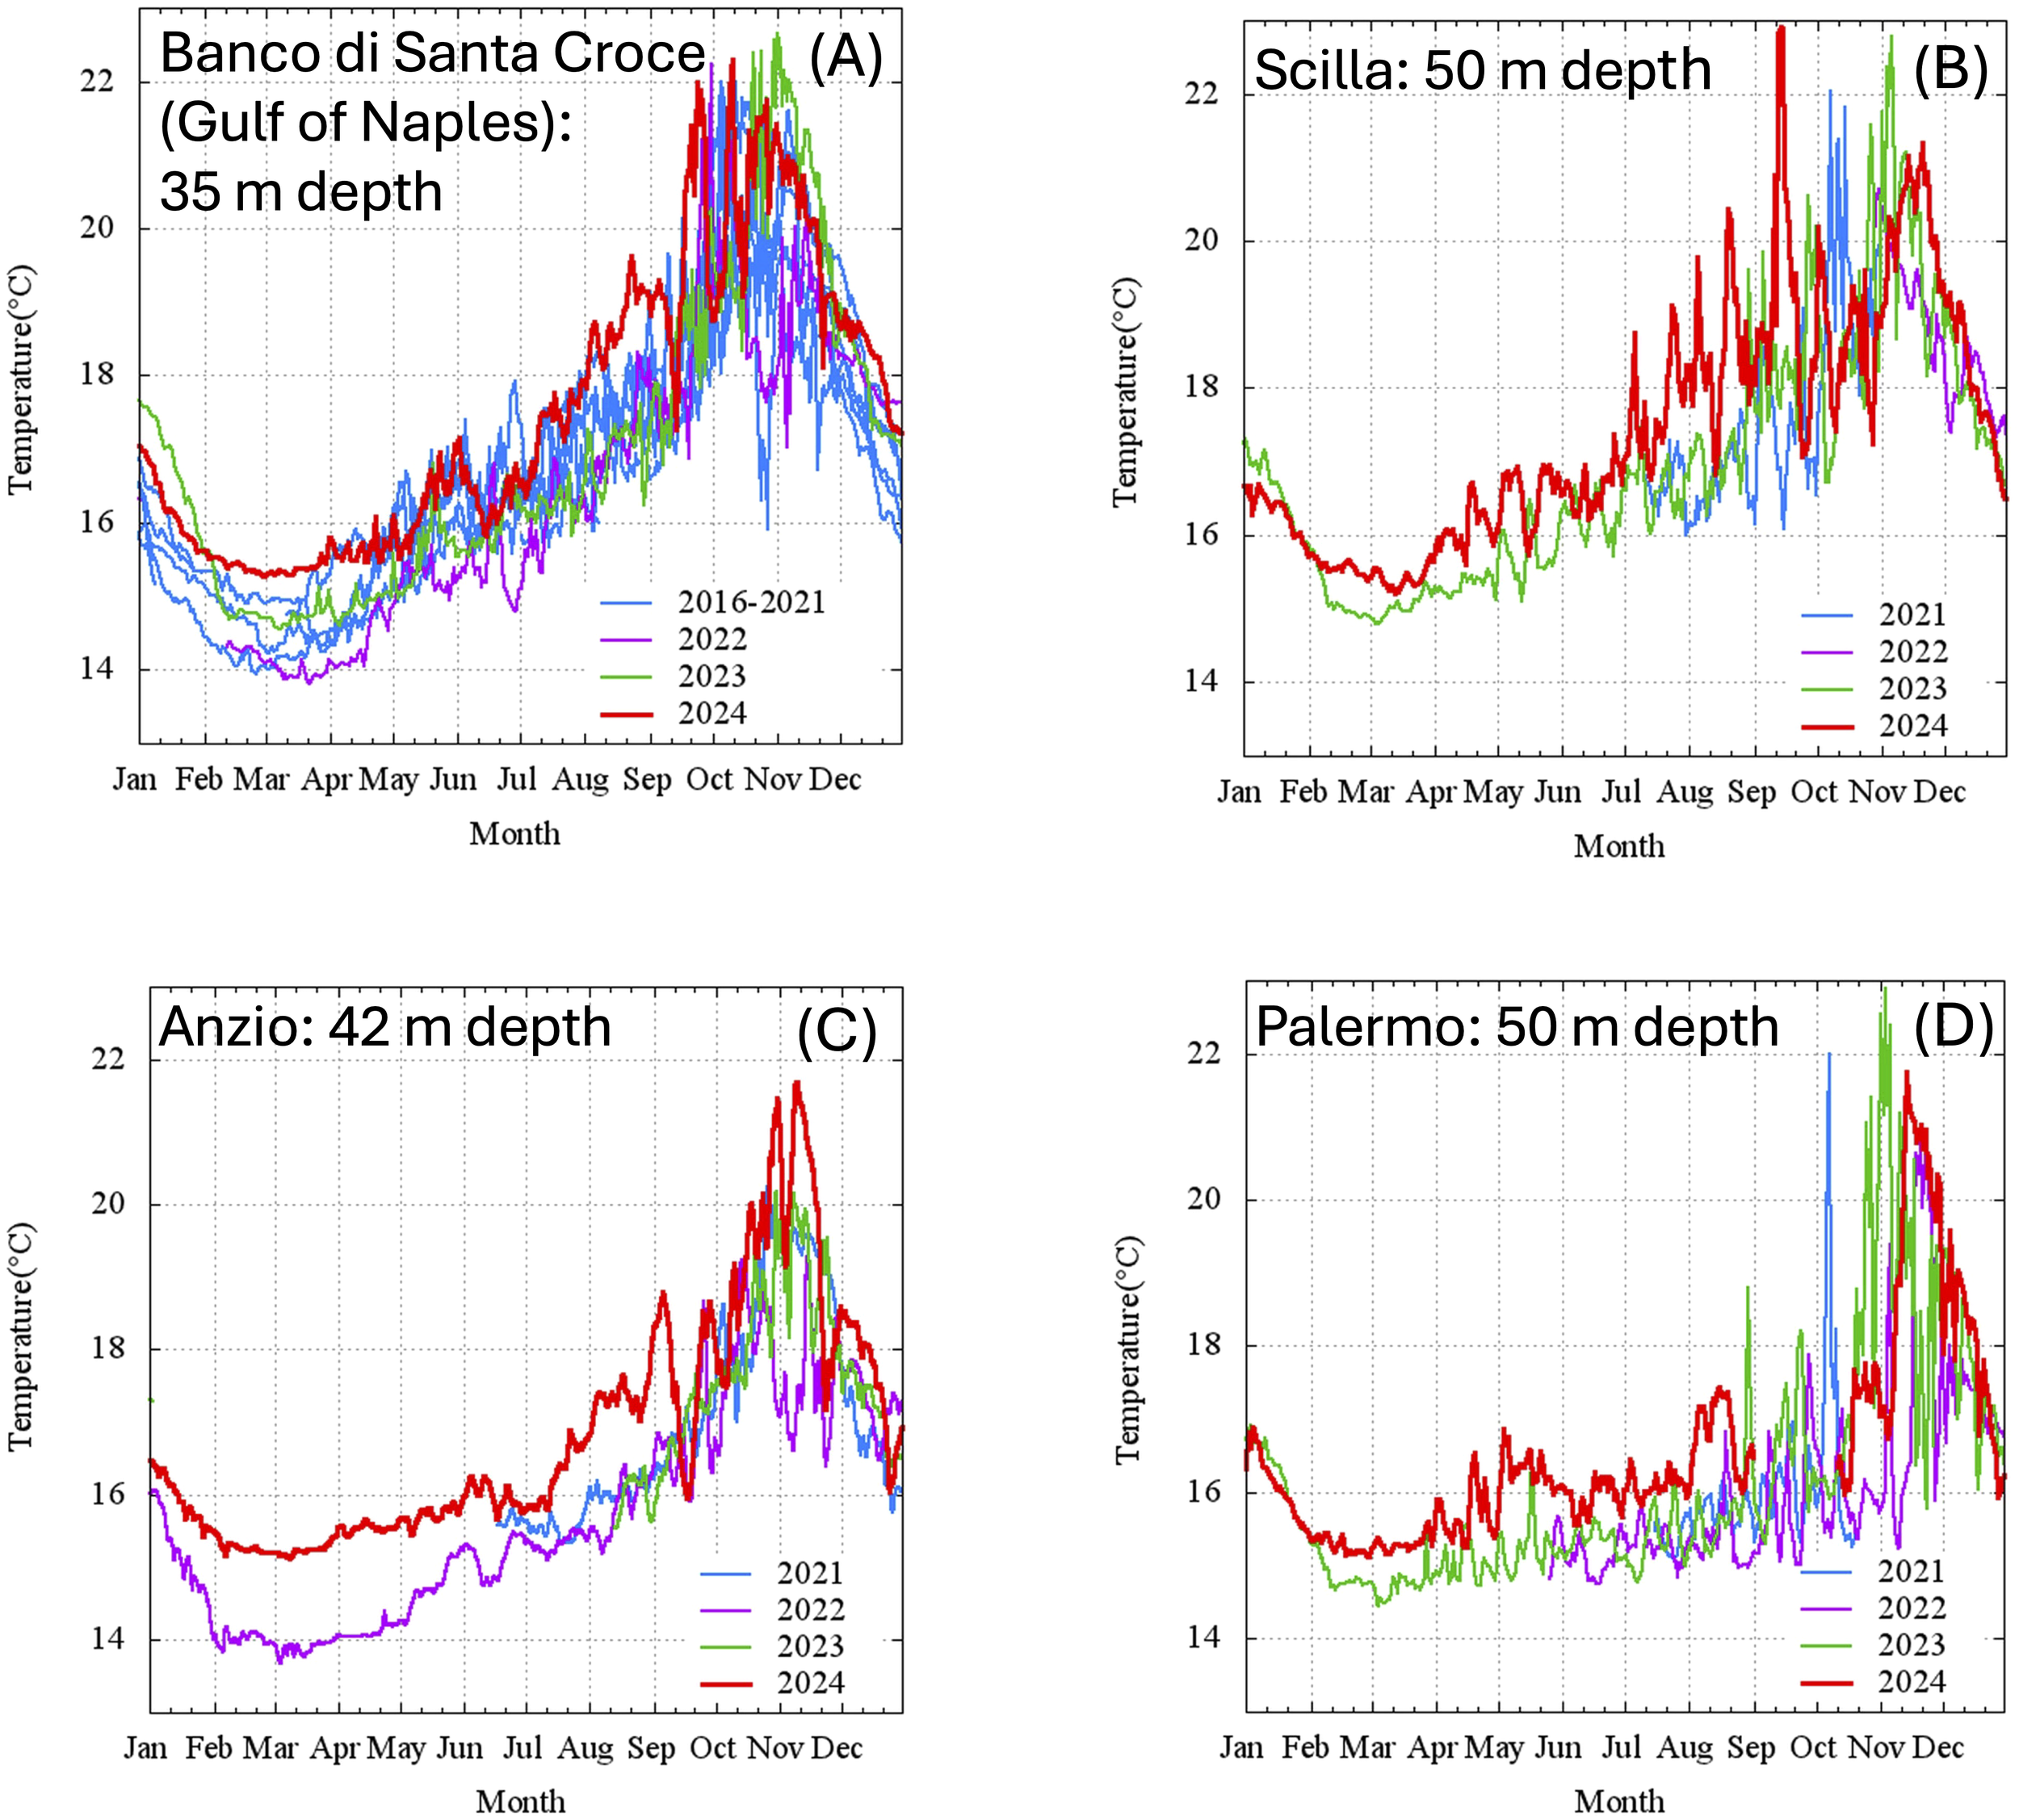
Seafloor temperatures recorded at four sites in the shallow coastal regions of the Tyrrhenian Sea as part of the MEDFEVER initiative. (A) Banco di Santa Croce (Gulf of Naples), (B) Scilla, (C) Anzio, (D) Palermo.
High-frequency temperature fluctuations are driven by site-specific dynamics, reflecting the influence of local oceanographic conditions.
At Banco di Santa Croce in the Gulf of Naples (Figure 5A), high-frequency variability is primarily driven by tidal forcing and sea breeze-induced internal wave activity. These factors are particularly effective at transferring heat to deeper layers, as shown by previous studies (e.g., de Sabata et al., 2022). The 2024 temperature record at 36 meters depth (red line) shows higher values compared to the 2016–2023 period, both in winter and summer. From February to the end of March, temperatures remained above 15 °C which is the highest maxima recorded in the past eight years. Also in August, exceptionally high temperatures were recorded with values exceeding 19°C, a level not observed over the previous nine years.
At the other sites, Scilla (50 m depth, Figure 5B), Anzio (42 m depth, Figure 5C), and Palermo (50 m depth, Figure 5D), temperature measurements are only available from 2021 onward and are collected at greater depths compared to Banco di Santacroce in the Gulf of Naples.
However, at these sites in 2024, the seabed temperatures were higher than in previous years, especially during winter and summer. At the Scilla site, a temperature peak of nearly 23°C was observed in September and at the Anzio site, two temperature peaks were recorded at the end of October and in November, when bottom-relief temperatures reached values just below 22°C.
However, despite the widespread warm anomalies in 2024, the absolute annual temperature maxima were recorded in early November 2023 at two sites: the Gulf of Naples (Figure 5A) and Palermo (Figure D), where bottom temperatures exceeded 22°C. This provides additional evidence that the 2024 anomaly was partly the result of sustained warming from 2022 and 2023.
3.3 Nemo-CMEMS data
To gain further insight of the Mediterranean Sea thermal conditions in the 2024 we will now analyze the outputs from NEMO Copernicus model.
Figure 6 shows the average temperature of the Mediterranean Sea water column (from surface to bottom) from 2014 to 2024, as obtained from the NEMO Copernicus model. Figure A illustrates the mean temperature over the entire water column, indicating a significant increase in 2024. Figure B focusses on temperatures below 100 meters, showing recurring peaks caused by the warming of deeper layers during late autumn vertical mixing, followed by a temperature increase in the recent year.
Figure 6
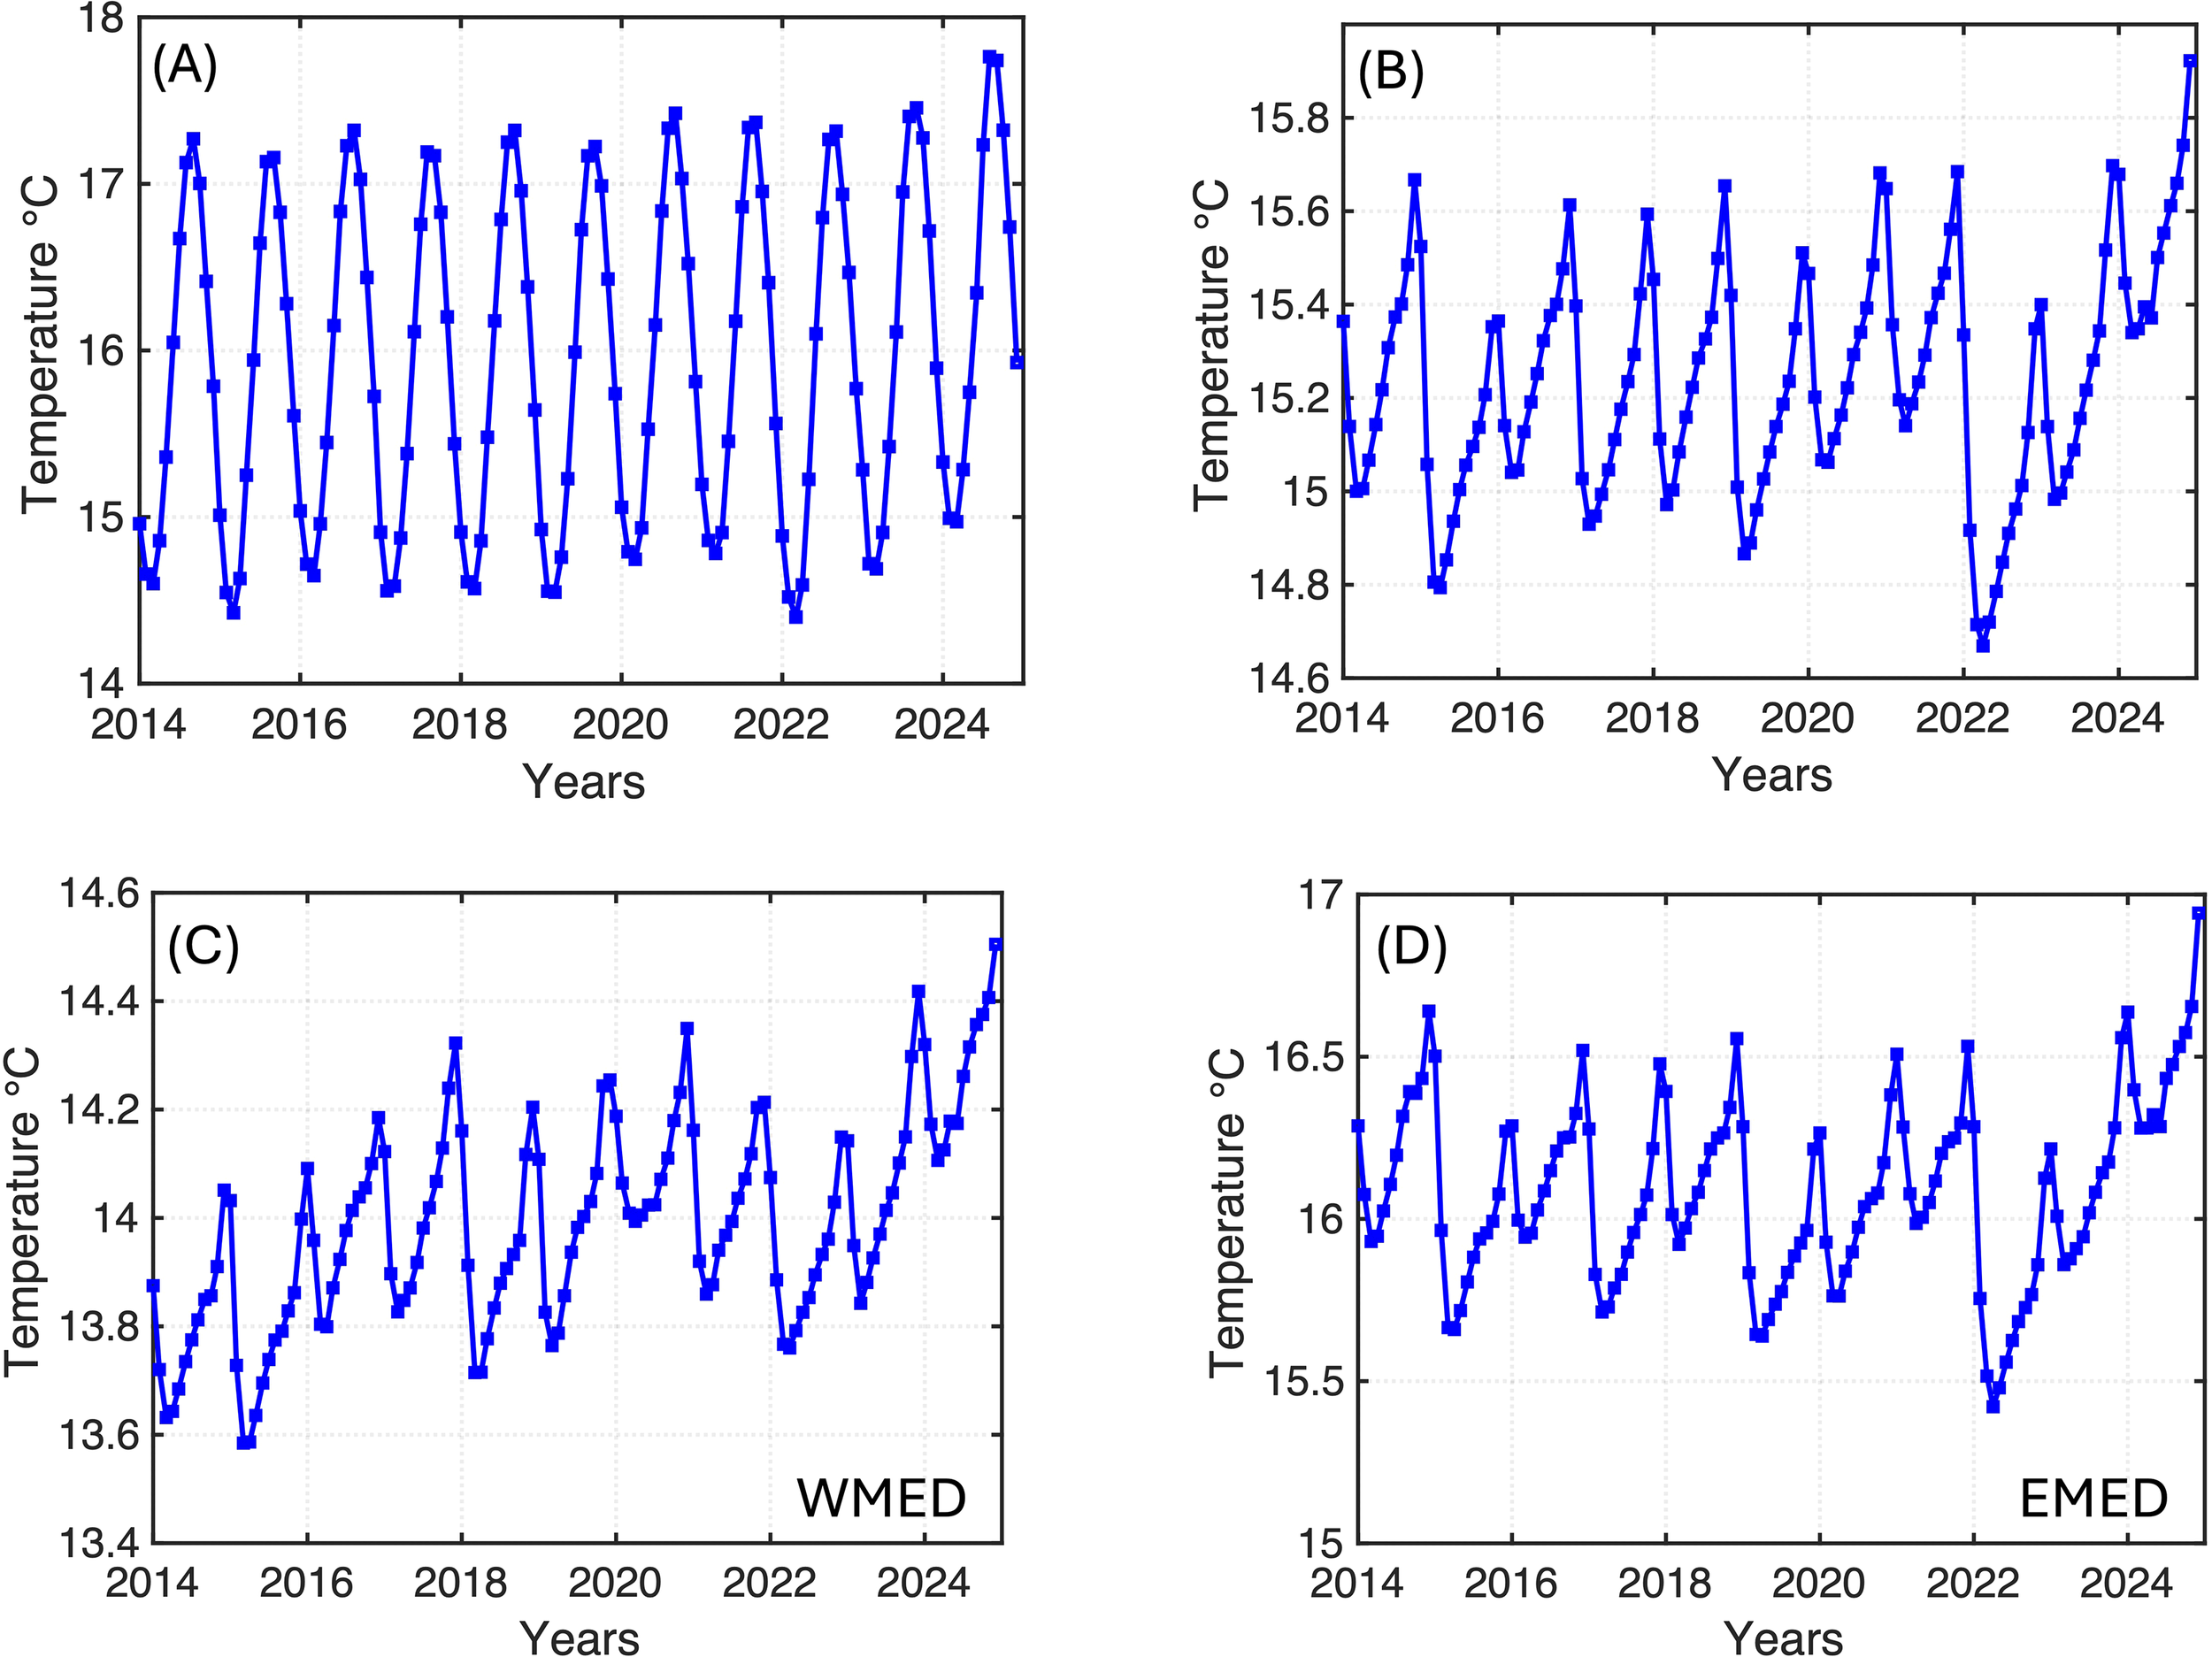
Average temperature of the Mediterranean Sea water column from 2014 to 2024 based on the NEMO Copernicus model. (A) Mean temperature of the entire water column of the whole Mediterranean sea (B) Temperature below 100 meters of the whole Mediterranean sea, (C, D) Temperature below 100 meters for WMED and EMED.
The panels C and D of Figure 6 show average temperatures in the deeper layer (average 100 m to the bottom) for the WMED and EMED, respectively. The WMED experiences a progressive heat increase in the deeper layers during the late autumn phase between 2014 and 2018, followed by a stable phase until 2022 and then a sharp increase up to 2024. In contrast, the EMED exhibits a relatively stable behavior until 2022, when a sharp decrease in temperature occurs during the winter. This is consistent with Figure 3D, which shows that the SST is in line with climatology, if not even below it, during the month of March. In 2022, EMED experiences a strong heat loss from January to March.
It is commonly accepted that the heat in the deeper layers is primarily transferred through vertical mixing processes, which are driven by wind and buoyancy loss in convection regions (eg. Marshall and Schott, 1999). However, it is also important to note that vertical transport processes within sub-basin and mesoscale structures can also have an impact. Figure 7 shows three transects for the month of February in 2022, 2023 and 2024, obtained from three sections in the Algerian Basin, the Tyrrhenian Sea, and the Levantine Basin. The locations of these sections and structures are indicated in Figure 1.
Figure 7

Vertical transects along the sections indicated in Figure 1. Algerian section (upper panels), Tyrrhenian section (middle panels), Levantine section (lower panels). In the right-lower panel CPG indicates the Cretan Passage Gyre (CPG), IP, Iera Petra Gyre; MM, Mersha Mathruth Gyre; Sh, Shikmona Gyre (see position of these structures in Figure 1).
In the Algerian Basin (Figure 7, upper panels), the influence of anticyclonic eddies is evident, particularly in the structure between 6-8° E.
This is a well-known anticyclonic eddy characterized by significant downward vertical velocities (eg Van Haren et al., 2006). In the Tyrrhenian Sea (Figure 7 middle panels), the Bonifacio Anticyclone plays a key role in driving strong downward heat transport and is particularly intense in 2024. Focusing on the Levantine Basin (Figure 7 lower panels), the downward heat transport in 2024 is localized within quasi-permanent anticyclonic features like the Cretan Passage Gyre, Ierapetra, Mersa Matruh, and Shikmona gyres. The particular efficiency of dynamic structures in transferring heat to the deeper layers during 2024 suggests that they are particularly energetic.
3.4 Air–sea heat fluxes derived by ERA5 data
Building on the assessment of the 2024 temperature anomalies presented in Section 3.1, this section investigates their potential causes by focusing on air-sea exchange processes. To this end, ERA5 air-sea fluxes are analyzed to evaluate the influence of surface heat fluxes on SST variability.
Figure 8 shows the monthly mean time series of total net heat flux (THF, panel A), as well as its four components: latent heat flux (LHF, panel B), sensible heat flux (SHF, panel C), net shortwave radiation (SWR, panel D), and net longwave radiation (LWR, panel E), all obtained from the ERA5 reanalysis of the Mediterranean Sea. All monthly mean values are plotted alongside the corresponding long-term monthly climatology for 1991–2020. The monthly climatology has been computed separately for each sub-basin, following the same procedure applied to SST in Section 3.1, allowing a direct comparison between the seasonal cycle of each year and the long-term mean.
Figure 8
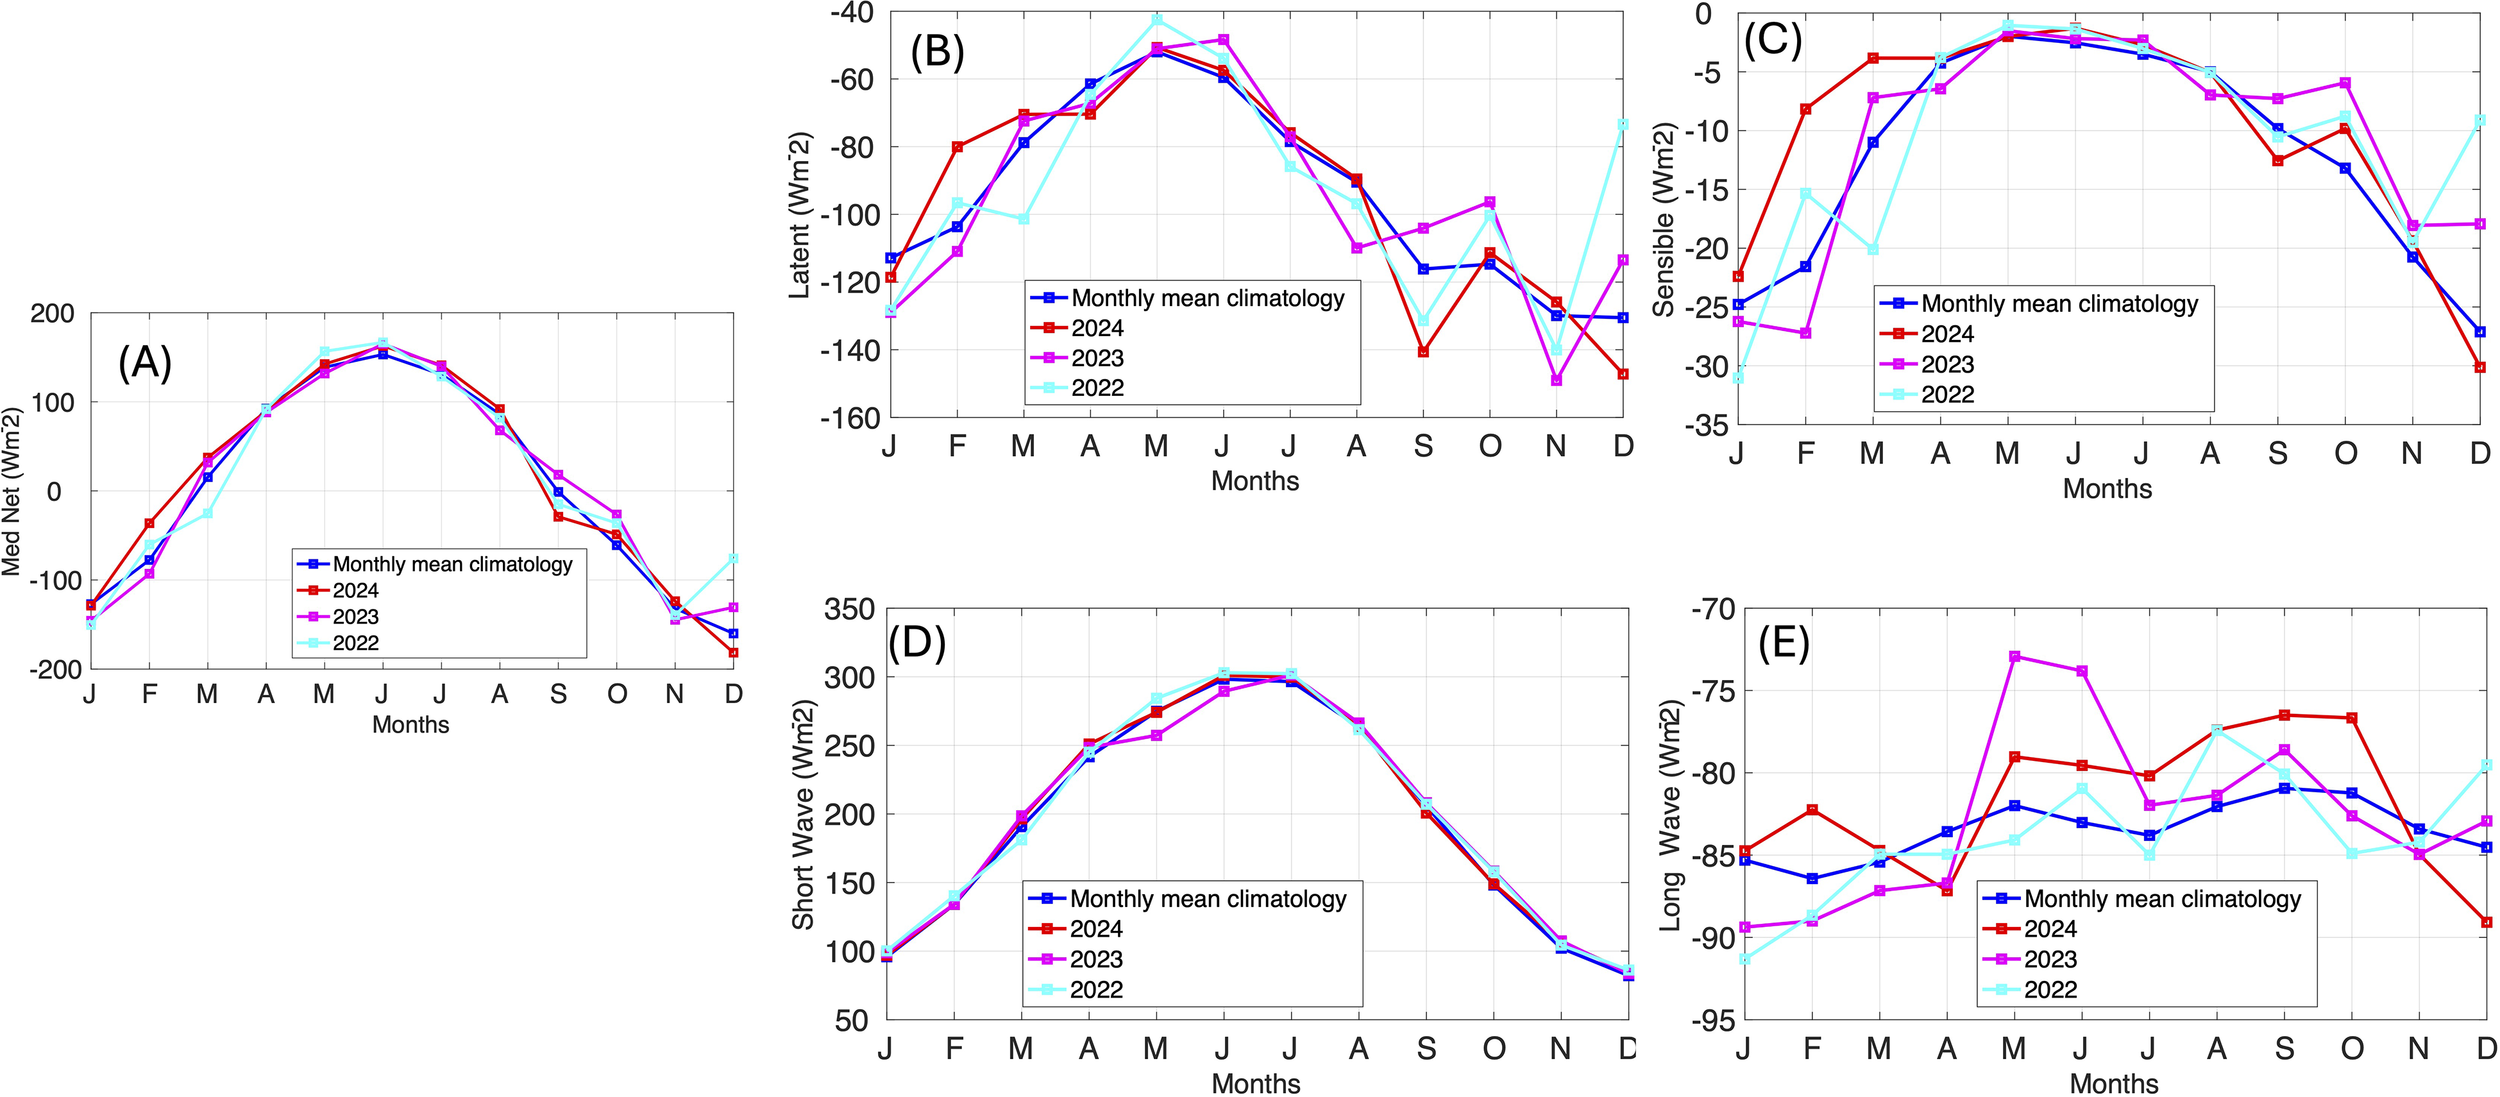
Seasonal time series of total net heat flux (THF, A) and its four components: latent heat flux (LHF, B), sensible heat flux (SHF, C), net shortwave radiation (SWR, D), and net longwave radiation (LWR, E), all derived from the ERA5 reanalysis over the Mediterranean Sea (data are in Wm-2).
Panel A shows that the 2024 THF significantly deviates from the climatology in winter. This is due to a decrease in heat loss from the Mediterranean Sea, which is due to a reduced heat loss of both LHF and SHF (panels B and C). These fluxes are directly linked to the wind stress characteristics and temperature difference between the air and sea, as well as relative humidity. On the other hand, the SWR (panel D) shows that during the spring-summer period of 2024, the Mediterranean Sea did not gain more heat compared to previous years. The maximum SWR recorded in June and July 2024 was around 300 W/m², which is comparable to the climatological average. Furthermore, the LWR is weaker during the spring and summer months, indicating that the Mediterranean is emitting less heat within the infrared spectrum.
Since wind controls the latent and sensible heat fluxes, analyzing its characteristics is crucial to understanding and estimating its effects on the mixed layer (ML), which is the region where short-term heat exchange between the ocean and the atmosphere take place. Namely, a shallow ML tends to store more heat near the surface, amplifying SST responses, whereas in a deeper ML surface temperature variability may be reduced. Figure 9 shows wind stress anomalies (with respect to the mean over 1991-2020) derived from ERA5, for the months of February (9A) and August (9B), along with the mixed layer depth (MLD) anomalies (9C, D) for the same months, calculated from the CMEMS Mixed-layer dataset. In February, except for the Algerian basin, the wind stress anomaly is negative. The largest negative values are found in the Liguro-Provençal Basin, the Levantine Basin, and the Aegean Sea. The reduction of the wind stress is associated with a shoaling of the mixed layer, very pronounced in the convection regions, namely the Liguro Provencal basin, the Southern Adriatic, the Rhodes Gyre and the Aegean Sea (Figure 9C). On the other hand, along the path of the Atlantic Water Stream, the reduction in MLD is largely mitigated, suggesting a role of the circulation in controlling the mixed layer dynamics. For example, the cyclonic and anticyclonic structures present along the stream may modulate the MLD, leading to its deepening and shoaling, respectively. In August, the reduction in wind stress is overall less pronounced (Figure 9B), with stronger anomalies in the Northern Tyrrhenian Sea, the Ligurian Sea, and in part of the Levantine basin. In these regions, negative anomalies of the MLD are present (Figure 9D), which appear consistent with the local positive SST anomalies (Figure 4). Although the Mediterranean accumulates an amount of heat during summer comparable to the climatological average, the heat is confined within a shallower mixed layer than usual. As a result, the upper ocean experiences amplified warming, producing exceptionally strong positive temperature anomalies at the surface.
Figure 9
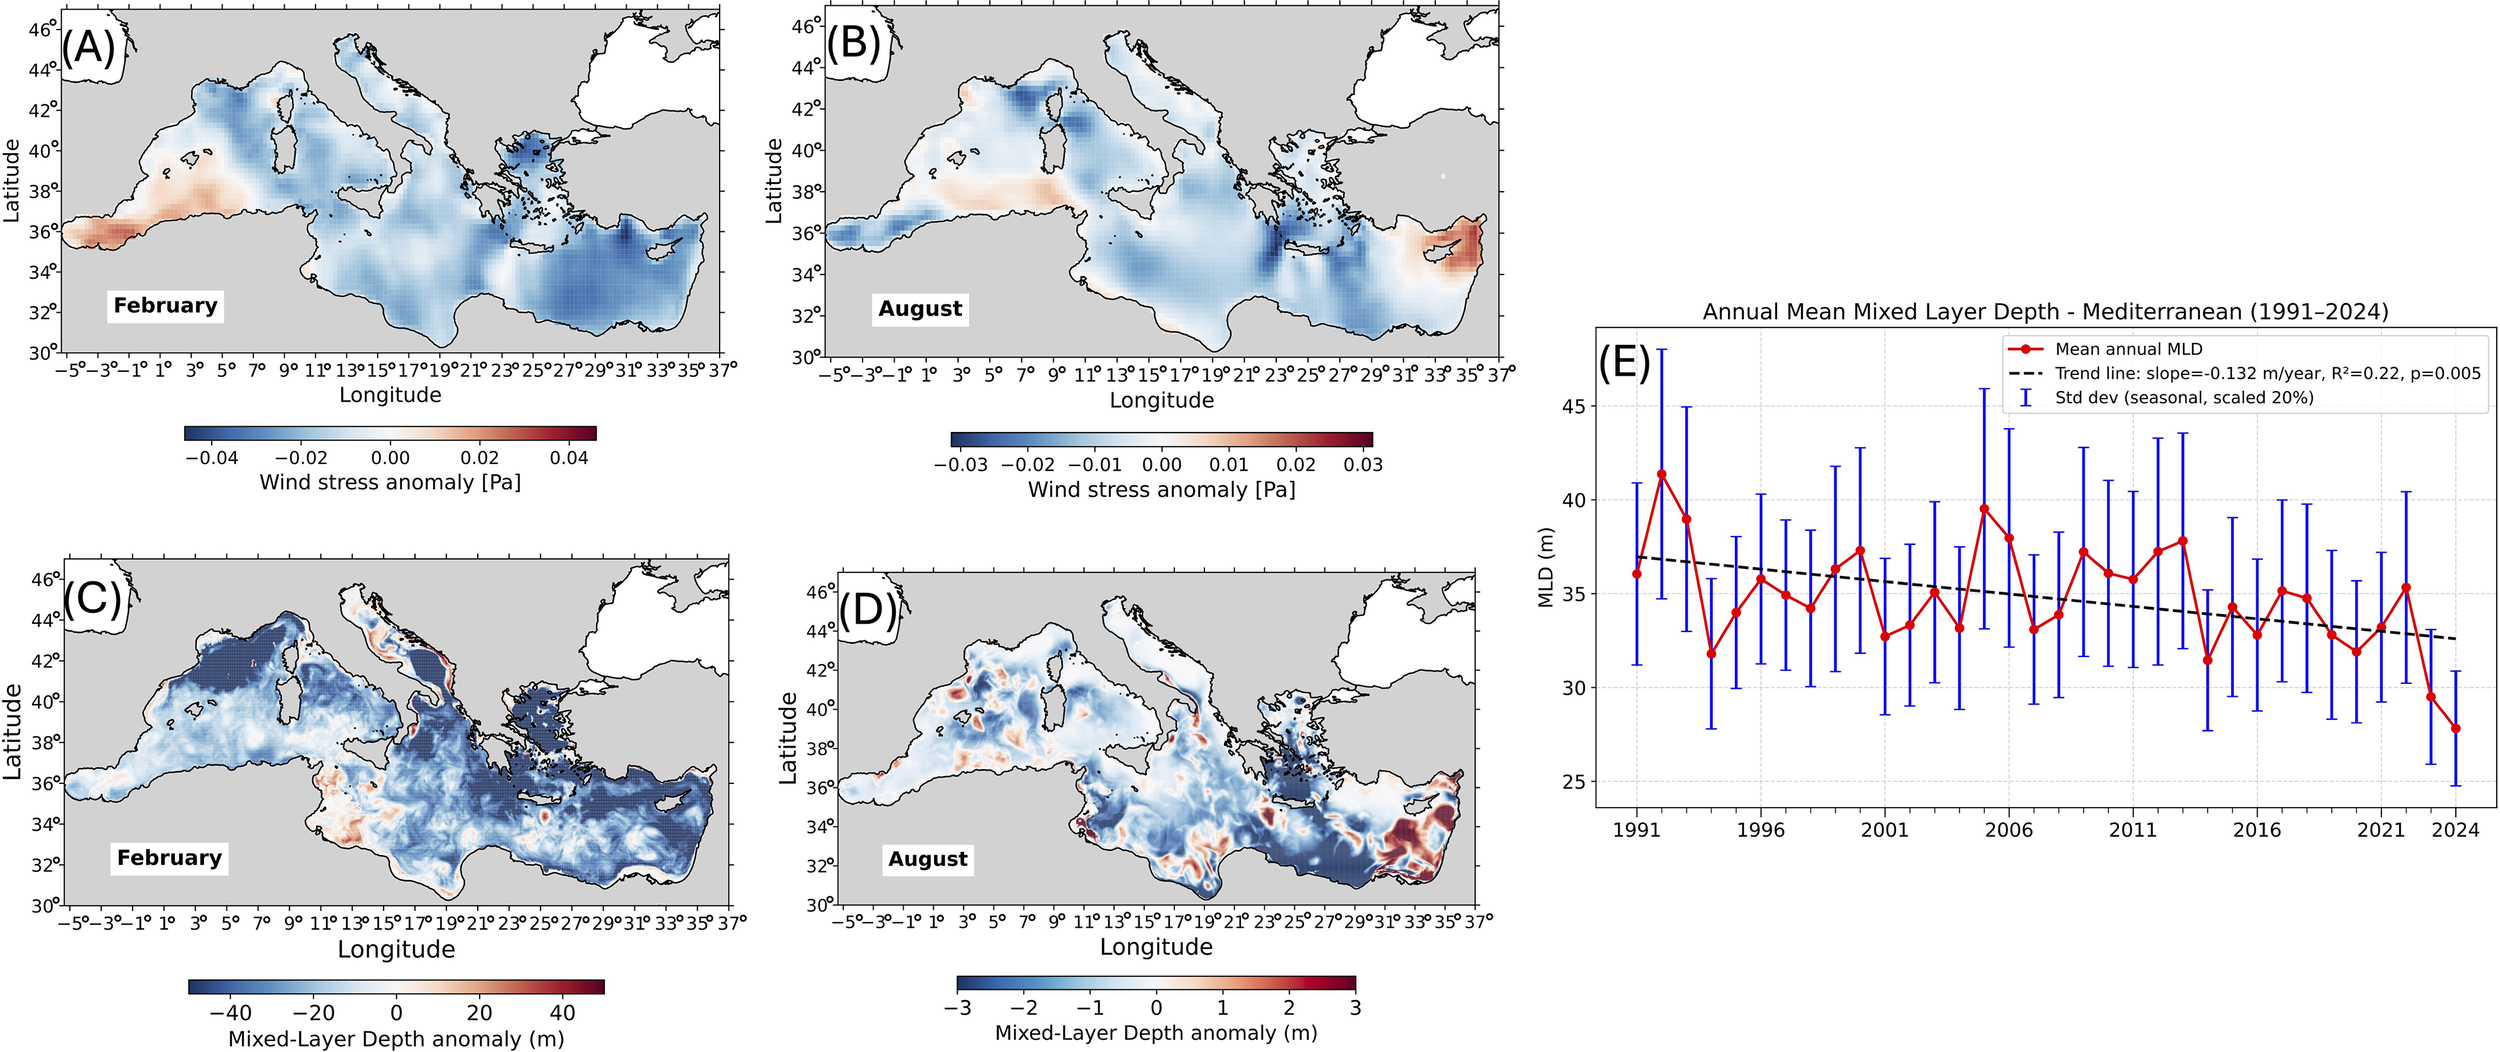
Wind stress anomalies from ERA5 for February (A) and August (B), and mixed layer depth (MLD) anomalies from the CMEMS Mixed-layer dataset for the same months: February (C) and August (D). (E) Time series of the annual mean of the Mixed-Layer depth (1991-2024).
To provide a broader temporal context for mixed layer variability, Figure 9E shows the basin-scale yearly mean mixed layer depth (MLD) from 1991 to 2024. Each yearly mean is overlaid with its standard deviation, representing the seasonal variability. The figure reveals a weak statistically significant trend (R² = 0.22, p = 0.05, with the p-value obtained from a two-tailed t-test on the slope of the least-squares linear regression) from 1991 to 2022, followed by a sharper shoaling of the mixed layer between 2023 and 2024, with 2024 exhibiting the shallowest MLD of the past 33 years.
In Figure 10, we look at the spatial distribution of the THF seasonal anomalies for the years 2023 and 2024, calculated using the 1991–2020 seasonal climatology as a baseline.
Figure 10

Seasonal anomalies of the total heat flux for 2023 and 2024.
It is important to note that a positive surface heat flux anomaly during winter (when the mean flux is negative) indicates a decrease in oceanic heat loss to the atmosphere, whereas a negative anomaly during summer (when the mean heat flux is positive) indicates a diminished net heat gain by the sea surface.
The figure shows that both the heat gain during summer 2023 and the reduction in heat loss of the following autumn are fairly homogeneous across the basin. In contrast, in winter 2024, the reduction in heat loss is mainly confined to the western Mediterranean and the Ionian Sea, while in spring it becomes apparent only in the eastern basin. During summer 2024, the Mediterranean Sea experienced a basin-wide reduction in net surface heat gain. Nonetheless, the persistence of anomalously warm and shallow mixed layers enhanced the sensitivity of the upper ocean to atmospheric forcing. As a result, even moderate air–sea heat fluxes were sufficient to sustain or amplify surface warming anomalies, through mechanisms analogous to those documented in the North Atlantic during summer 2023 (England et al., 2025). Finaly in autumn a heterogeneous pattern of positive and negative anomalies emerges, indicating pronounced spatial variability in heat exchange processes.
Figure 10 shows that the period from autumn 2023 to winter 2024 (October–March) was characterized by a marked positive anomaly, likely associated with large-scale atmospheric patterns such as the Eastern Atlantic (EA) index. As reported by Criado-Aldeanueva and Soto-Navarro (2020); Josey et al, 2011, the positive phase of the EA pattern is typically linked to reduced surface heat loss across the entire Mediterranean basin. This relationship is consistent with the EA index time series (available from 1950 to September 2025) provided by the NOAA Climate Prediction Center (https://www.cpc.ncep.noaa.gov/), which reached its highest positive values during winter 2024, with a seasonal mean of 1.81. The strongly positive EA phase indicates enhanced high-pressure conditions over central and western Europe, favoring stable and dry weather over the western Mediterranean. Consequently, the prevailing large-scale atmospheric circulation favored warmer and drier conditions throughout the Mediterranean basin.
3.5 The role of the circulation
In this section, we will examine the role of ocean circulation on the spatial distribution of heat within the surface layer of the basin.
The results of Section 3.1 (Figure 4) indicate that circulation patterns played a significant role in shaping the temperature anomalies observed in 2024, particularly in the Algerian Basin, the Levantine Basin, and in the northwestern Mediterranean. Further evidence of this is provided by Figure 11, which shows the geostrophic circulation patterns derived from AVISO data for February and August 2004 (Figures 11A, B), along with the maps of eddy kinetic energy (EKE) computed from geostrophic velocity anomalies. Well-known circulation features, such as the Atlantic Stream, the Liguro-Provencial and the Northern Tyrrhenian gyres in the WMED, and the South Adriatic, the Pelops, Ierapetra, and Rhodes gyres, and the meandering of the Mid Mediterranean Jet (MMJ) in the EMED, dominate the circulation.
Figure 11
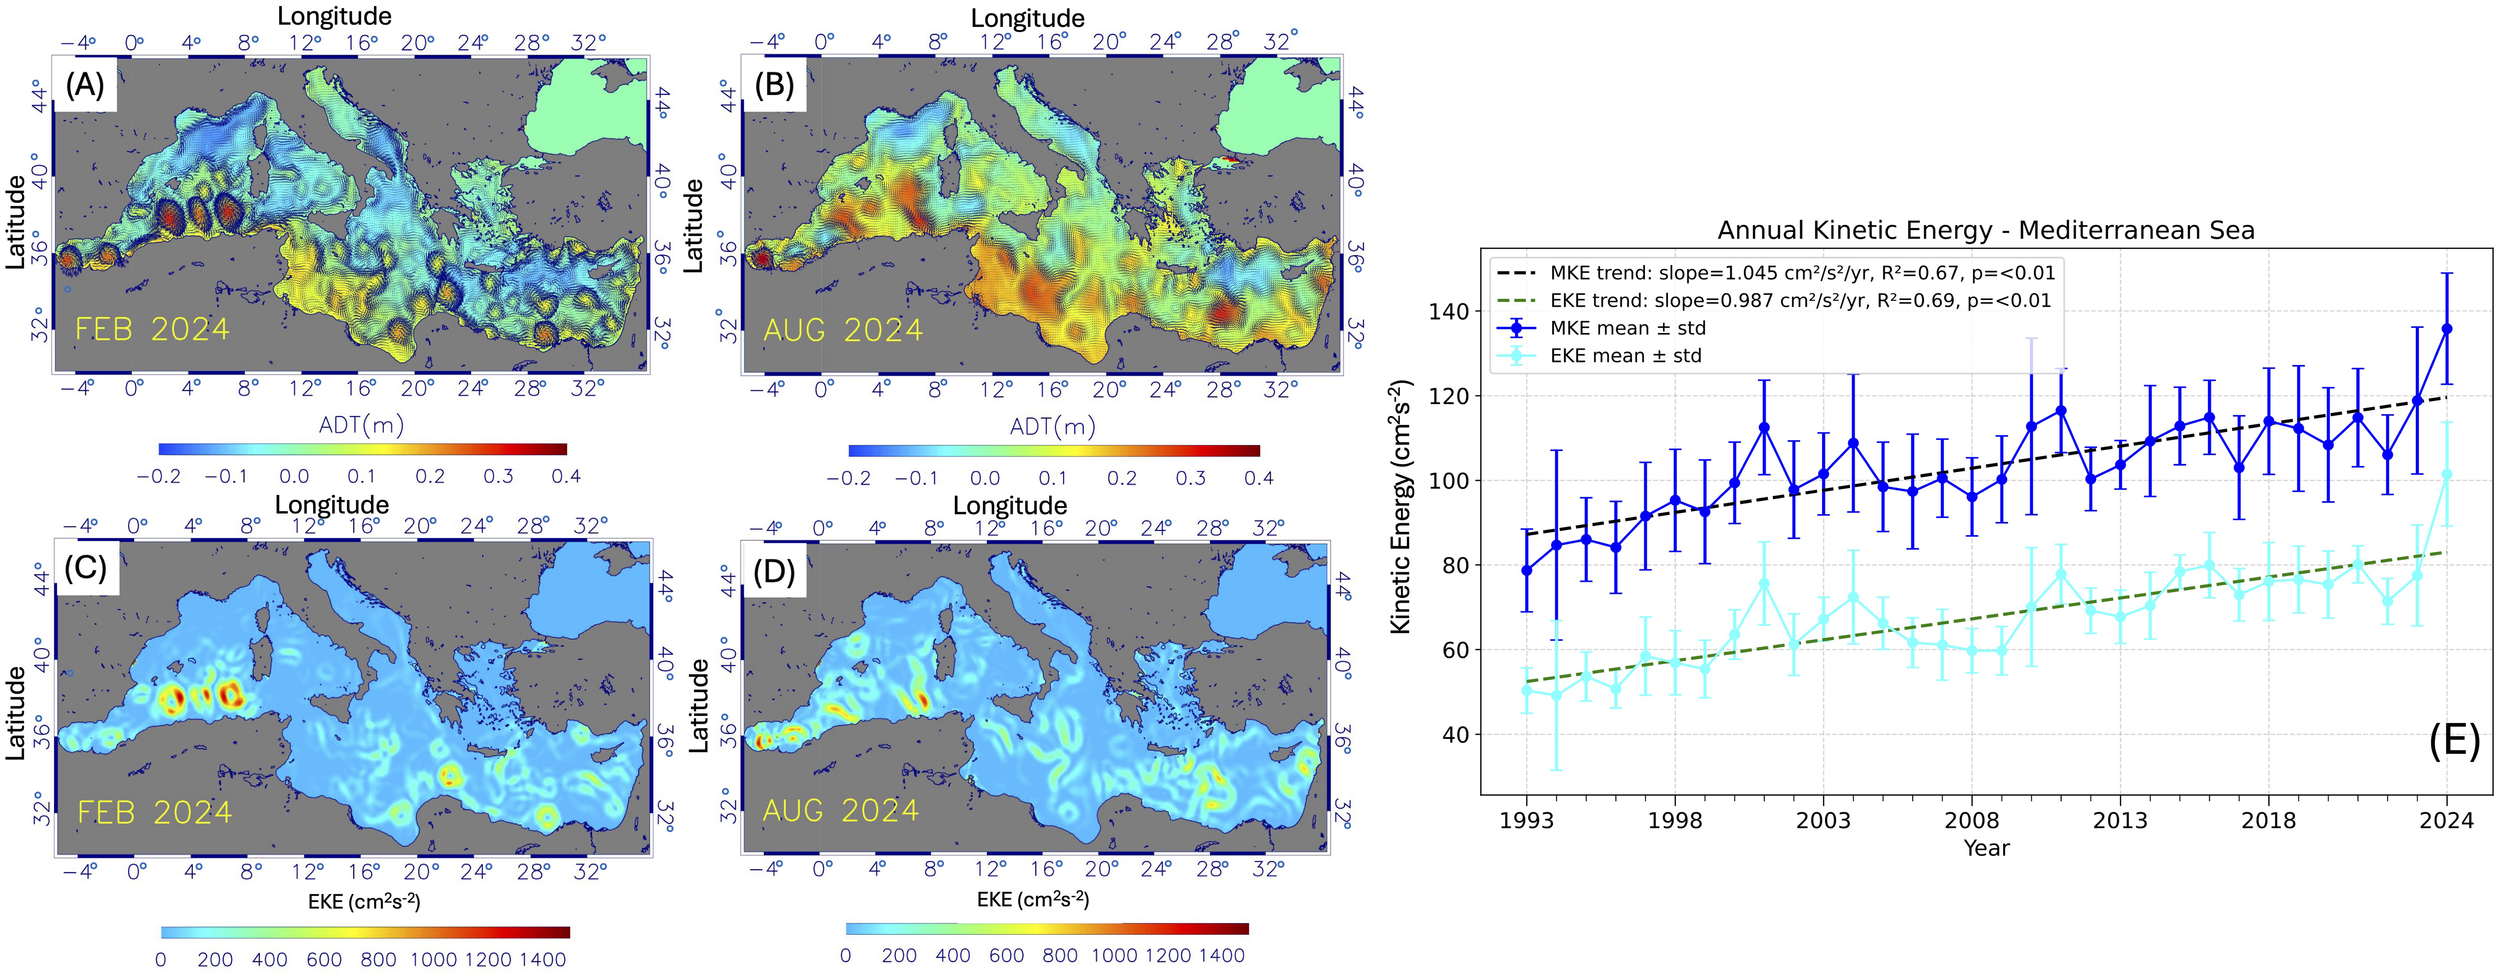
Geostrophic velocity and Absolute Dynamic Topography (A, B) and Eddy Kinetic Energy (C, D) for February and August, derived from the AVISO dataset. (E) Time series of the annual Mean and Eddy Kinetic Energy (1993 - 2024)
Circulation patterns and EKE fields reveal that the Algerian eddies are particularly intense, with high energetic signatures also evident in the North Tyrrhenian dipole, the Eastern Ionian gyre, and the Levantine eddies. Long-term trends in the basin-scale geostrophic kinetic energy, computed from AVISO data from 1993 to 2024, are presented in Figure 11E. Annual means are shown with their corresponding standard deviations, representing the seasonal variability. The time series reveals a clear and robust upward trend in both mean kinetic energy (MKE) and eddy kinetic energy (EKE), and identifies 2024 as the most energetic year in the record (Both the MKE and the EKE show statistically significant increasing trends over 1993–2024 (MKE: R² = 0.67, p< 0.01; EKE: R² = 0.69, p< 0.01, the p-values were obtained from a two-tailed t-test on the slope of the least-squares linear regression.) To further investigate the intensity of ocean circulation in 2024, Figure 12 show time series of MKE and EKE from 2022 onward. This short-term focus is based on monthly means, shown both at the basin scale (Figure 12A) and for two sub-basins: the Algerian Basin (Figure 12B) and the Levantine Basin (Figure 12C). This approach allows a detailed assessment of recent year-to-year variability.
Figure 12
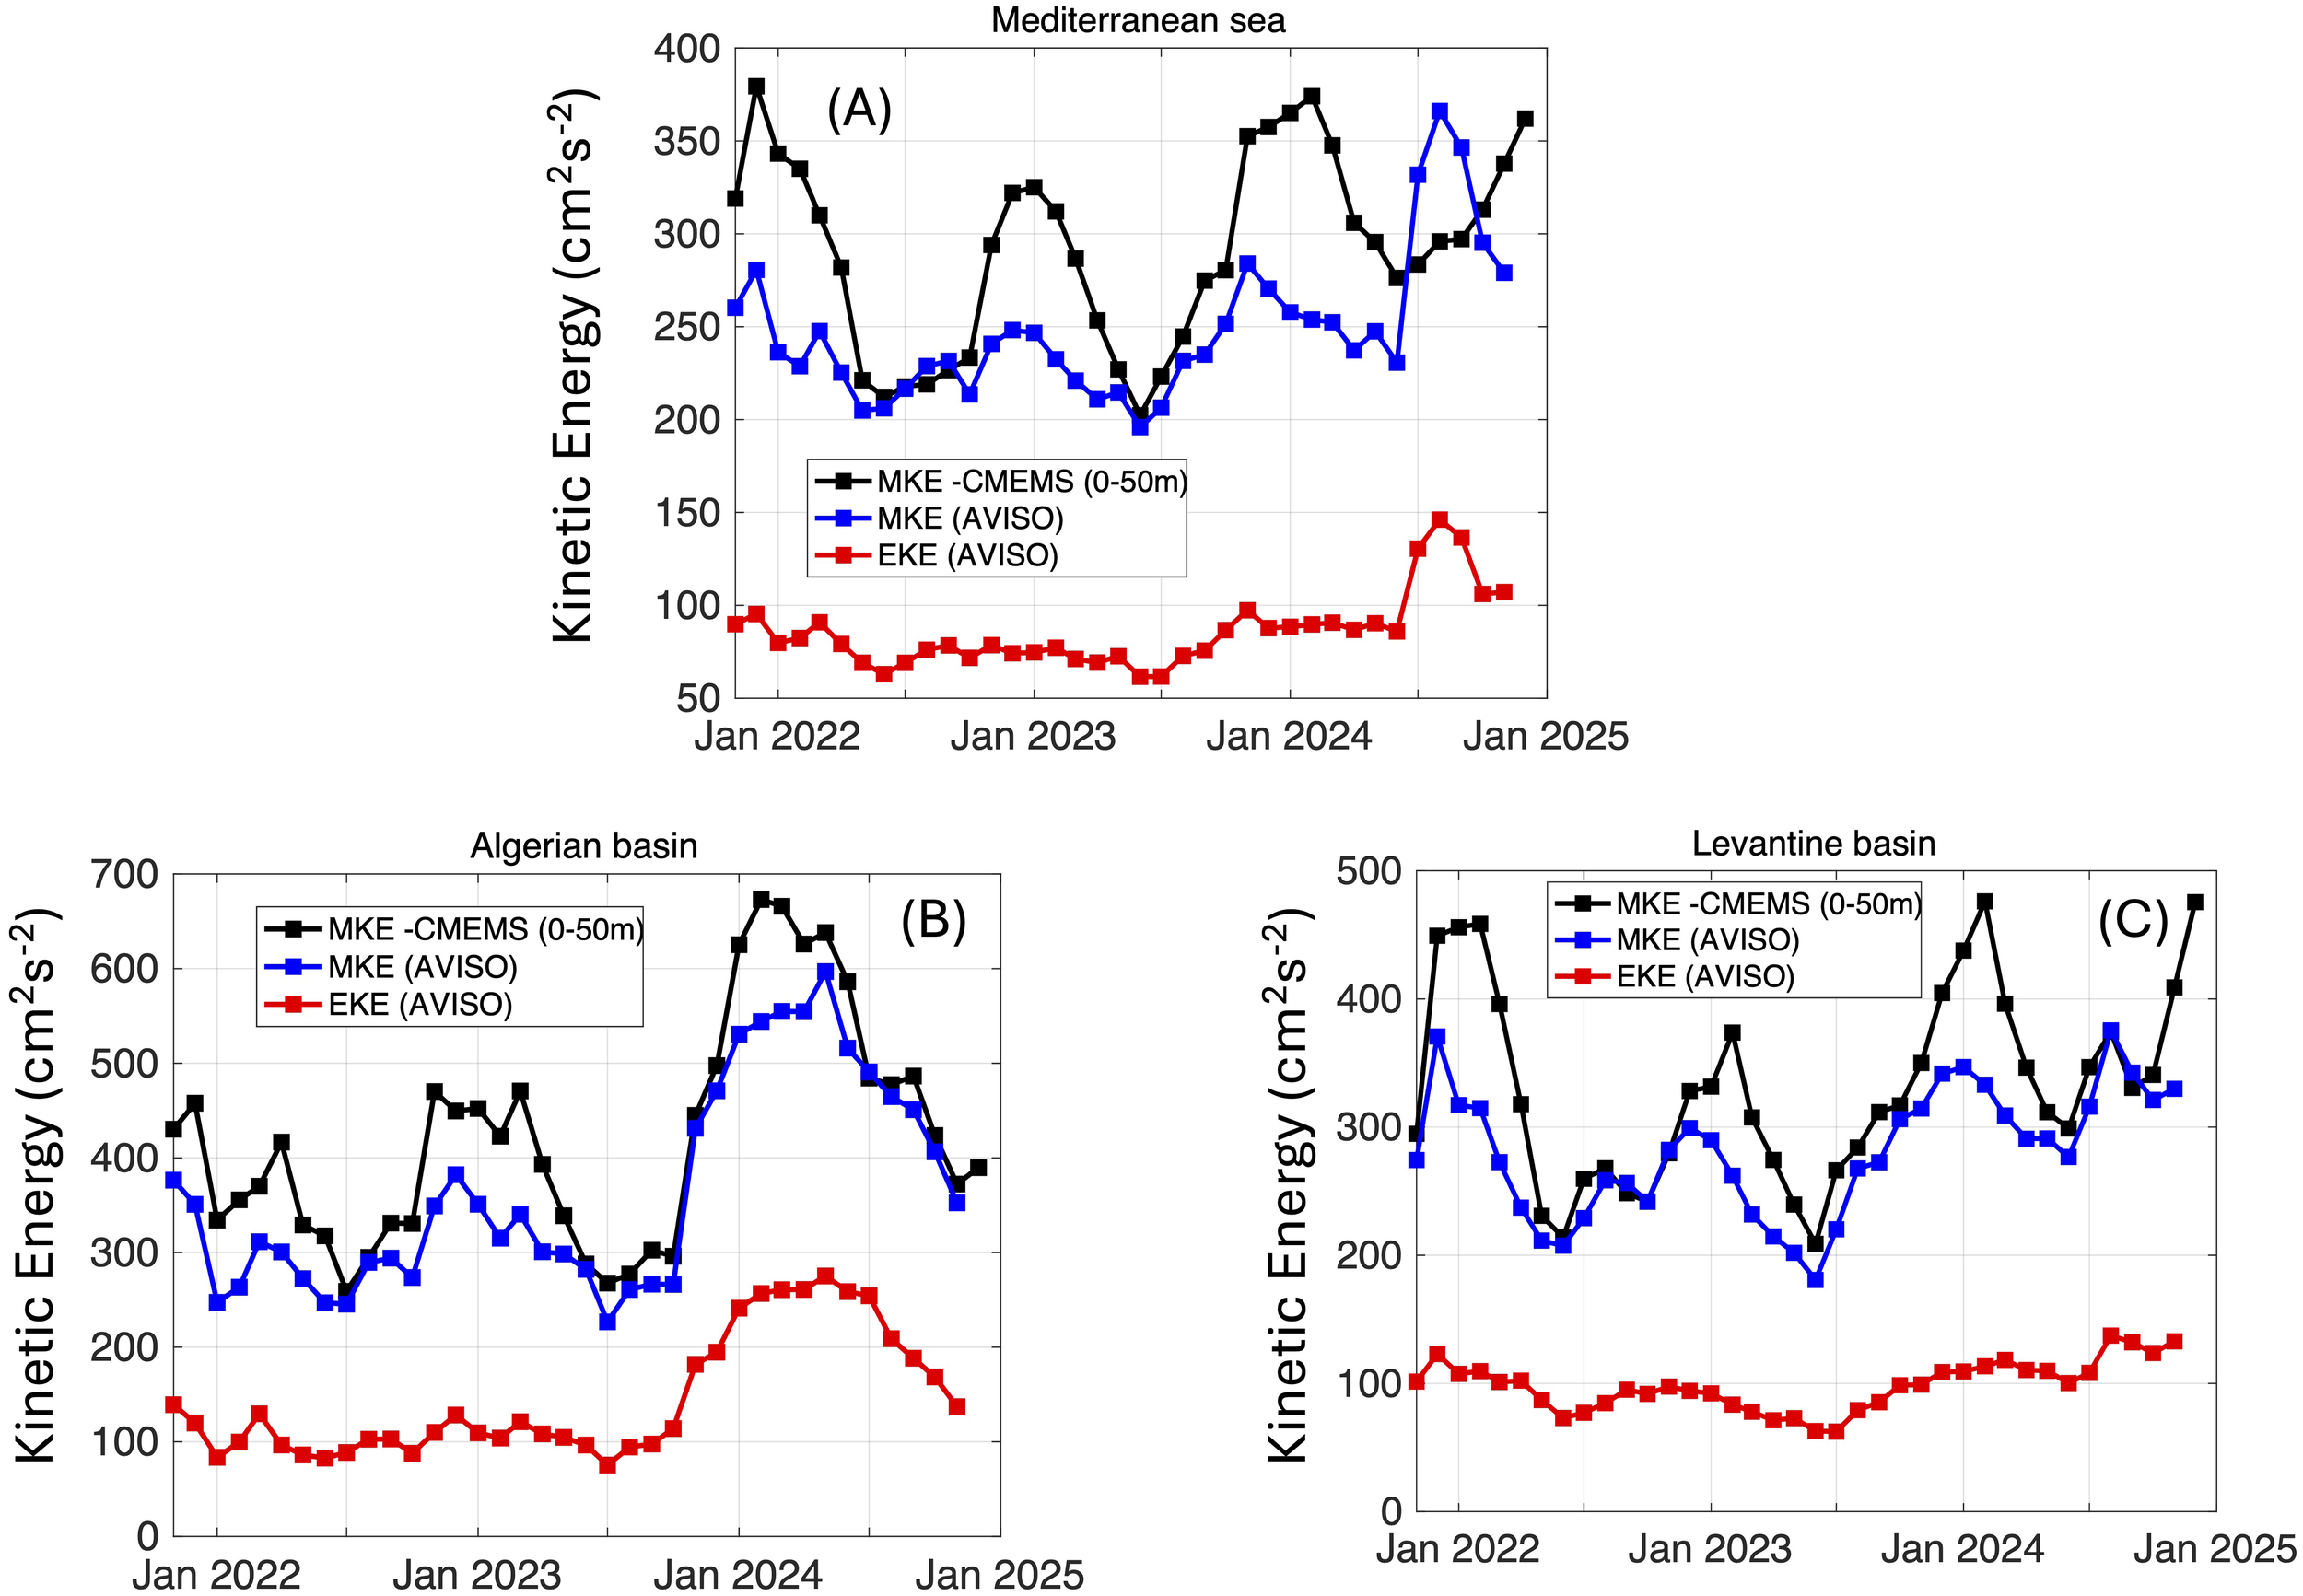
Time series of Mean Kinetic Energy (MKE) and Eddy Kinetic Energy (EKE) from 2022. (A) shows data for the Mediterranean Sea, (B) for the Algerian basin, and (C) for the Levantine basin. MKE includes an additional estimate from CMEMS NEMO model velocities averaged over the upper 50 meters.
For the MKE, we include an additional estimate derived from CMEMS NEMO model velocity data, averaged over the upper 50 meters of the water column.
The time series indicates that 2024 was the most energetic year out of the past three years. Although the energy levels during winter in 2024 were similar to those in winter 2022, the MKE and EKE remained higher throughout the rest of the year. This variability is especially noticeable in the Algerian Basin and Levantine Basin as shown in Figures 12B and 12C.
To further highlight the role of the strongest anticyclonic structures, in Figure 13 we show time series of the enstrophy and the Okubo-Weiss (OW) parameter, averaged over the Algerian basin (0°-9° E, 36°-40° N) and over the Pelops gyre region (20°-24°E, 33°-36° N). We recall that the OW parameter, originally introduced by Okubo in an oceanographic context (Okubo, 1970) and widely used in the study of two-dimensional turbulence (Weiss, 1991), allows to separate elliptic regions of the flow, dominated by vorticity, from the hyperbolic, shear dominated ones. The OW parameter has also often been used in the analysis of altimeter data (e.g., Isern-Fontanet et al., 2006) to identify the cores of the geostrophic vortices, where it takes strongly negative values. Figure 13 shows that, from autumn 2023 to spring 2024, the values of the enstrophy and of the OW parameter in the regions considered stand out, with maximum values that are about twice as strong than in the previous period. This provides additional evidence of the exceptional role that anticyclones neighboring the southern boundary of the Mediterranean have had in shaping the basin dynamics over this period.
Figure 13

Time series of enstrophy (A, C) and Okubo-Weiss (OW) parameter (B, D), averaged over the Algerian Basin (A, B) and the Pelops gyre region (C, D).
Having established that the circulation during 2024 was particularly intense, our focus shifts to understanding its impact on heat distribution in the surface layers of the Mediterranean Sea. It is widely acknowledged that the horizontal eddy heat flux plays a very important role in the ocean (e.g. Wunsch, 1997; Macdonald and Wunsch, 1996; Stammer, 1998), accounting for up to 20% of the mean flux in certain regions of the world’s ocean. To further investigate this concept we use the standard decomposition of mean and eddy heat fluxes. Following the methodology of Pan and Sun (2018), we estimate these fluxes for the Mediterranean Sea’s mixed layer using AVISO geostrophic velocity data, satellite-derived SST, and reanalysis data for mixed-layer depths:
where and are the mean and eddy component of the geostrophyc field provided by AVISO, is the water density (taken as 1025 kg/m3), is the specific seawater heat capacity, and H is the mixed layer depth and T and are the mean and anomaly of the mixed layer temperature in °C. The horizontal distributions of these quantities are shown in Figure 13.
Figure 14 displays the monthly average mean (A, B) and eddy (C, D) heat flux for February and August, respectively. The maps reveal high values in specific regions, specifically over the Algerian anticyclones, in the Levantine basin, and in the northwestern Mediterranean. This can be attributed to large-scale circulation patterns that in these areas are highly efficient in transporting and accumulating heat within the mixed layer. Furthermore, the presence of sub-basin and mesoscale structures in the northwestern Mediterranean intensifies this heat transport, as seen in the bottom panels of Figures 14C, D. These panels clearly show an increase in eddy heat flux in the regions of the Algerian anticyclones, the Levantine Basin, and the northwestern Mediterranean during both months. These results emphasize the significant role of mesoscale eddies in redistributing heat within the mixed layer across these areas.
Figure 14
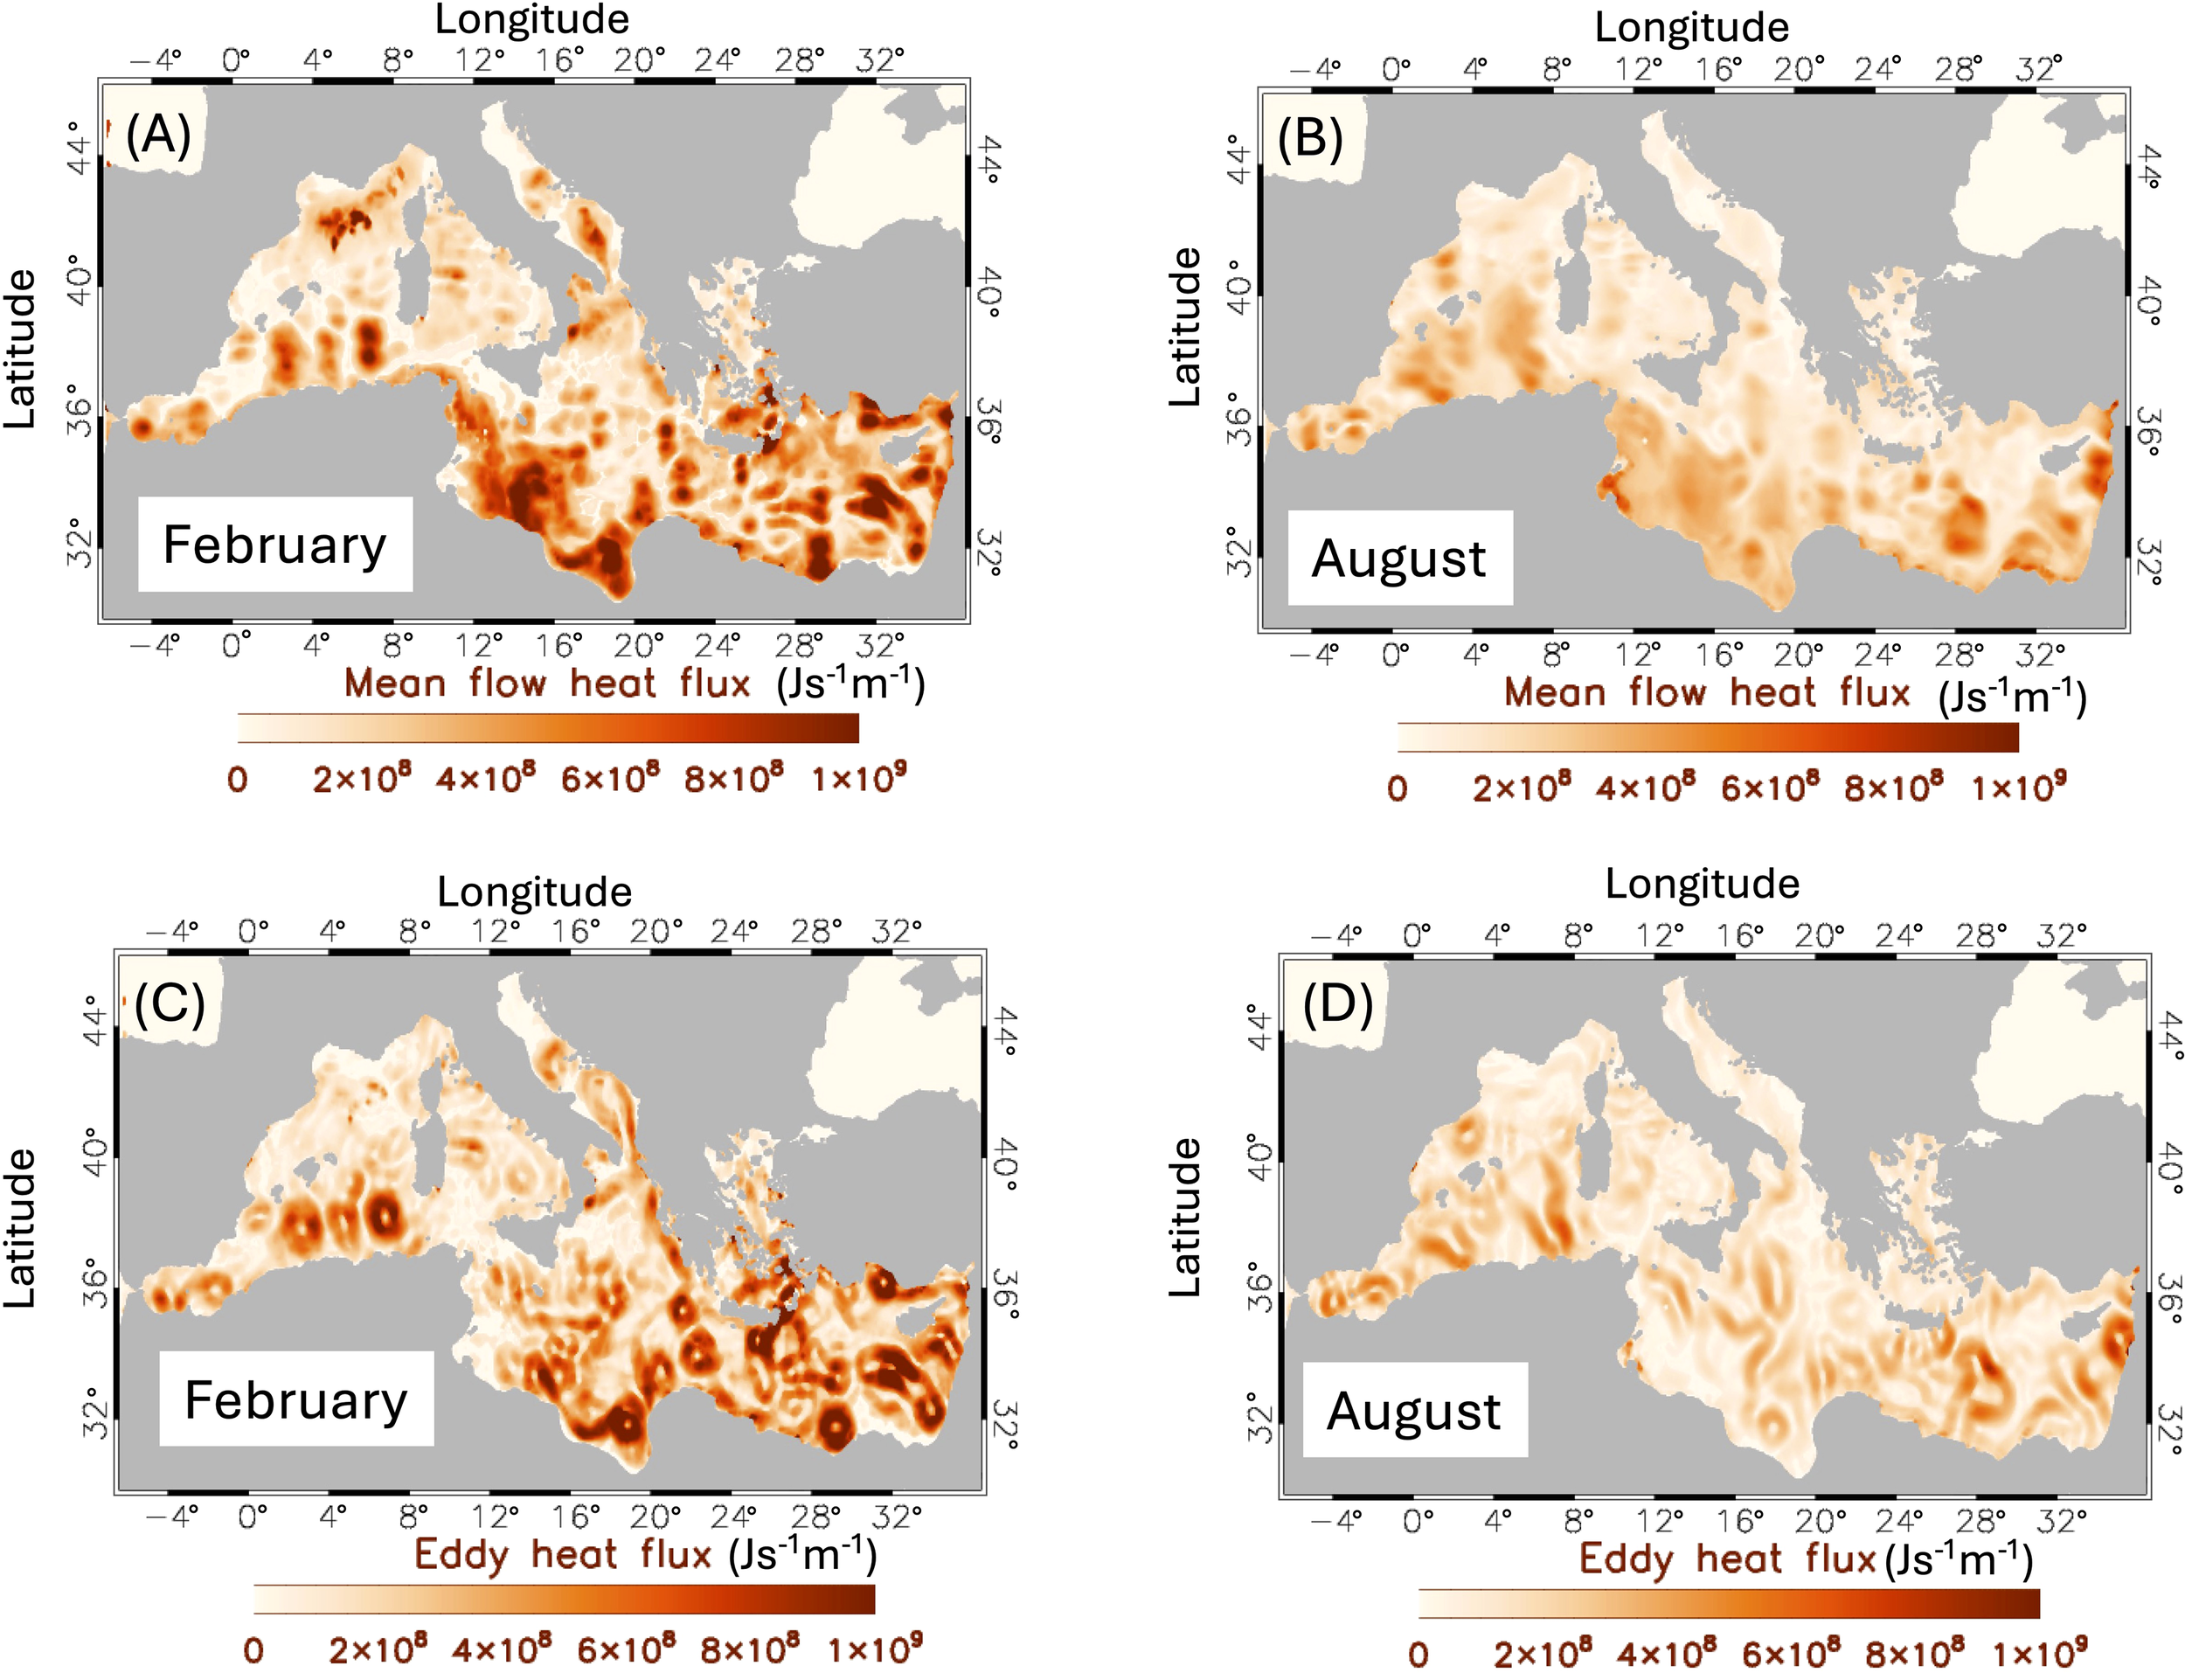
Monthly average of the mean (A, B) and eddy momentum flux (C, D).
Through the comparison of the February and August maps, we can note seasonal variations in the magnitude and spatial distribution of both mean and eddy heat fluxes, although the overall patterns of fluxes in the aforementioned regions appear consistent across both months. This suggests that circulation in Mediterranean Sea contributes significantly to the heat transport and accumulation within the mixed layer throughout the year.
Figure 15 shows the temporal evolution of average mean and eddy heat fluxes in the three Mediterranean sub-basins over the period 2022–2024. Starting from autumn 2023, there is a noticeable rise in heat transport in both the Algerian (Figure 15A) and Levantine basins (Figure 15C). This increase can be attributed to a stronger transport caused by the mean flow and mesoscale eddies. The observed rise in heat fluxes is accompanied by an increase in kinetic energy in these regions, indicating a highly dynamic circulation pattern.
Figure 15

Time series of monthly area-averaged mean and eddy momentum fluxes for the Algerian Basin (A), the Northwestern Mediterranean (B), and the Levantine Basin (C).
In the northwestern Mediterranean (Figure 15B), both mean and eddy heat fluxes reach elevated values during the summer and autumn seasons. Particularly strong eddy contributions were observed in summer and autumn of 2024. These findings suggest that the pronounced thermal anomalies recorded in August are also driven by circulation-induced heat redistribution, highlighting the key role of mesoscale processes in modulating upper-ocean thermal space-time variability in this region.
4 Conclusions
In this work, we investigated the exceptionally strong positive temperature anomalies observed in the Mediterranean in 2024, often exceeding the highest values recorded over the past four decades. Satellite-derived SST data extending through May 2025 (Figure 3) indicate that these anomalously high temperatures have persisted over the past three years, highlighting a sustained warming phase.
ERA5-derived air–sea fluxes show that, from autumn 2023 until the end of winter 2024, the Mediterranean lost substantially less heat than in previous years. During late spring and summer, the basin gained heat at rates close to the climatological mean. The resulting temperature anomalies are modulated by two key factors. First, the particularly energetic gyres and eddies, evident from AVISO and reanalysis data, efficiently redistribute heat throughout the upper ocean in both seasons. Second, during summer, the heat gained from the atmosphere, although near the climatological mean, is retained in a shallower mixed layer, further enhancing positive surface temperature anomalies. Altimeter observations highlight that these quasi-permanent circulation structures were stronger in 2024 than in previous years, both in terms of kinetic energy and enstrophy. Estimates of mean and eddy momentum fluxes indicate that these structures are highly effective in redistributing excess heat within the upper ocean. Additionally, changes in water column stratification were particularly pronounced at deep convection sites, where mixed layer depth anomalies were strongly negative, supporting the role of baroclinic forcing in intensifying mesoscale eddies through baroclinic instability.
Furthermore, over the past three decades, basin-scale geostrophic kinetic energy has shown a substantial linear increase, with 2024 standing out as an exceptionally energetic year. As altimetry primarily reflects the first baroclinic mode of the ocean (e.g., Wunsch, 1997), the geostrophic kinetic energy derived from altimetric data is intrinsically connected to the basin’s baroclinic structure. Notably, wind stress anomalies in 2024 were slightly negative across the basin, suggesting that wind forcing does not explain the observed energy increase. This further supports the hypothesis that internal baroclinic processes, with potential contributions from energy inflow through the Strait of Gibraltar, are key drivers of the observed energy enhancement.
While changes in the Mediterranean’s thermohaline structure have been documented over the past four decades, since 2022 the system appears to be undergoing a more abrupt transformation. Building on the exceptional 2022/2023 heatwave reported by Marullo et al. (2023), our results indicate that, whereas early anomalies were largely modulated by atmospheric forcing and wind-driven vertical mixing, starting from summer 2023 the Mediterranean entered a prolonged phase of internal heat redistribution. This phase is mediated by enhanced mesoscale circulation structures and increased stratification, suggesting a shift from externally driven to internally dominated mechanisms controlling SST variability. Similar prolonged warming events and enhanced stratification have been reported globally and in the North Atlantic (Terhaar et al., 2025; England et al., 2025), indicating that the processes observed in the Mediterranean may reflect broader oceanic responses to sustained thermal forcing.
This study also highlights aspects of the warming related to coastal regions. Data from the Medfever initiative further show that, in shallow coastal regions, heat anomalies are efficiently transferred below the seasonal thermocline to the seafloor via local coastal dynamics. Vertical transects offshore (Figure 8) reveal that vertical advection within particularly energetic anticyclonic structures can transport heat effectively despite enhanced stratification.
Finally, the most intense warming observed since 2022 has already caused widespread ecological consequences, as documented in recent studies (e.g., Garrabou et al., 2022; Martínez et al., 2023; Li et al., 2024). These impacts provide evidence of increasing vulnerability of Mediterranean marine ecosystems to the combined pressures of climate change and local stressors, including pollution, overfishing, and habitat degradation. Our findings emphasize that numerical models of physical–biological processes governing ecosystem responses to thermal stress must resolve mesoscale circulation structures to accurately capture the effects of these extreme events.
Overall, our study underscores the importance of considering not only air–sea interactions but also surface ocean circulation when investigating SST variability. Changes in the intensity of mesoscale dynamical structures and variations in mixed layer thickness—potentially driven by shifts in stratification—can play a decisive role in shaping surface temperature anomalies, as demonstrated in the Mediterranean Sea.
Statements
Data availability statement
Publicly available datasets were analyzed in this study. This data can be found here: https://marine.copernicus.eu/it, https://cds.climate.copernicus.eu.
Author contributions
EN: Conceptualization, Data curation, Formal Analysis, Investigation, Methodology, Software, Supervision, Validation, Writing – original draft, Writing – review & editing. AC: Writing – original draft, Writing – review & editing. RI: Writing – original draft, Writing – review & editing. MS: Writing – original draft, Writing – review & editing. AdA: Writing – original draft, Writing – review & editing. MP: Writing – original draft, Writing – review & editing. SM: Data curation, Writing – original draft. ED: Writing – original draft, Writing – review & editing. AB: Writing – original draft, Writing – review & editing. GB: Writing – original draft, Writing – review & editing.
Funding
The author(s) declare financial support was received for the research and/or publication of this article. This work was supported by the project “Detection and Threats of Marine Heat Waves” (CAREHeat), within the framework of the “Earth Observation Science for Society” initiative, funded under the ESA FutureEO-1 Grand Science Challenges program (2020–2022).
Conflict of interest
The authors declare that the research was conducted in the absence of any commercial or financial relationships that could be construed as a potential conflict of interest.
Generative AI statement
The author(s) declare that no Generative AI was used in the creation of this manuscript.
Any alternative text (alt text) provided alongside figures in this article has been generated by Frontiers with the support of artificial intelligence and reasonable efforts have been made to ensure accuracy, including review by the authors wherever possible. If you identify any issues, please contact us.
Publisher’s note
All claims expressed in this article are solely those of the authors and do not necessarily represent those of their affiliated organizations, or those of the publisher, the editors and the reviewers. Any product that may be evaluated in this article, or claim that may be made by its manufacturer, is not guaranteed or endorsed by the publisher.
References
1
Amaya D. J. Jacox M. G. Fewings M. R. Saba V. S. Stuecker M. F. Rykaczewski R. R. et al . (2023). Marine heatwaves need clear definitions so coastal communities can adapt. Nature616, 29–32. doi: 10.1038/s41586-023-05780-y
2
Bethoux J. P. Gentili B. (1999). Functioning of the Mediterranean Sea: past and present changes related to freshwater input and climatic changes. J. Mar. Syst.20, 33–47. doi: 10.1016/S0924-7963(98)00069-4
3
Bevacqua E. Schleussner C. F. Zscheischler J. (2025). A year above 1.5 °C signals that Earth is most probably within the 20-year period that will reach the Paris Agreement limit. Nat. Clim. Change15, 262–265. doi: 10.1038/s41558-025-02246-9
4
Berthou S. Renshaw R. Smyth T. Tinker J. Grist J. P. Wihsgott J. U. et al . (2024). Exceptional atmospheric conditions in June 2023 generated a northwest European marine heatwave which contributed to breaking land temperature records. Communications Earth & Environment5, 287.
5
Carton J. A. Chepurin G. A. Hackert E. C. Huang B. (2025). Remarkable 2023 north atlantic ocean warming. Geophys. Res. Lett.52, e2024GL112551. doi: 10.1029/2024GL112551
6
Copernicus Climate Change Service (C3S) (2024). European state of the climate 2023. Reading, United Kingdom: European Centre for Medium-Range Weather Forecasts (ECMWF). doi: 10.24381/cds.eesoclimate.2023
7
Criado-Aldeanueva F. Soto-Navarro J. (2020). Climatic indices over the Mediterranean Sea: A review. Appl. Sci.10, 5790. doi: 10.3390/app10175790
8
Darmaraki S. Somot S. Sevault F. Nabat P. Cabos Narvaez W. D. Cavicchia L. et al . (2019). Future evolution of marine heatwaves in the Mediterranean Sea. Clim. Dyn.53, 1371–1392. doi: 10.1007/s00382-019-04661-z
9
Dayan H. McAdam R. Juza M. Masina S. Speich S. (2023). Marine heat waves in the Mediterranean Sea: An assessment from the surface to the subsurface to meet national needs. Front. Mar. Sci.10, 1045138. doi: 10.3389/fmars.2023.1045138
10
de Sabata E. Bordone A. Belluscio A. Ciuffardi T. Iacono R. Mancini G. et al . (2022). MedFever: An expanding network of citizen-run observatories monitoring shallow coastal underwater temperatures in Italy ( SEANOE) Sea scientific open data publication. doi: 10.17882/86403
11
EEA (European Environment Agency) (2024). European climate risk assessment – executive summary. Copenhagen, Denmark: European Environment Agency. doi: 10.28100/204249
12
England M. H. Li Z. Huguenin M. F. Kiss A. E. Sen Gupta A. Holmes R. M. et al . (2025). Drivers of the extreme North Atlantic marine heatwave during 2023. Nature, 1–8. doi: 10.1038/s41586-025-07000-y
13
Garrabou J. Gómez-Gras D. Medrano A. Cerrano C. Ponti M. Schlegel R. et al . (2022). Marine heatwaves drive recurrent mass mortalities in the Mediterranean Sea. Glob. Change Biol.28, 5708–5725. doi: 10.1111/gcb.16252
14
Giorgi F. (2006). Climate change hot spots. Geophys. Res. Lett.33. doi: 10.1029/2006GL025734
15
Guinaldo T. Cassou C. Sallée J. B. Liné A. (2025). Internal variability effect doped by climate change drove the 2023 marine heat extreme in the North Atlantic. Commun. Earth Environ.6, 291. doi: 10.1038/s43247-024-01111-0
16
Hamdeno M. Alvera-Azcarate A. (2023). Marine heatwaves characteristics in the Mediterranean Sea: Case study the 2019 heatwave events. Front. Mar. Sci.10, 1093760. doi: 10.3389/fmars.2023.1093760
17
Hobday A. J. Alexander L. V. Perkins S. E. Smale D. A. Straub S. C. Oliver E. C. et al . (2016). A hierarchical approach to defining marine heatwaves. Prog. Oceanogr.141, 227–238. doi: 10.1016/j.pocean.2015.12.014
18
Hobday A. J. Oliver E. C. Gupta A. S. Benthuysen J. A. Burrows M. T. Donat M. G. et al . (2018). Categorizing and naming marine heatwaves. Oceanography31, 162–173. doi: 10.5670/oceanog.2018.205
19
Ibrahim O. Mohamed B. Nagy H. (2021). Spatial variability and trends of marine heat waves in the eastern mediterranean sea over 39 years. J. Mar. Sci. Eng.9, 643. doi: 10.3390/jmse9060643
20
Iona A. Theodorou A. Sofianos S. Watelet S. Troupin C. Beckers J. M. (2018). Mediterranean Sea climatic indices: monitoring long-term variability and climate changes. Earth System Sci. Data10, 1829–1842. doi: 10.5194/essd-10-1829-2018
21
Isern-Fontanet J. García-Ladona E. Font J. (2006). Vortices of the Mediterranean Sea: An altimetric perspective. J. Phys. Oceanogr.36, 87–103. doi: 10.1175/JPO2840.1
22
Josey S. A. Somot S. Tsimplis M. (2011). Impacts of atmospheric modes of variability on Mediterranean Sea surface heat exchange. J. Geophysical Research: Oceans116.
23
Juza M. Fernández-Mora À. Tintoré J. (2022). Sub-Regional marine heat waves in the Mediterranean Sea from observations: Long-term surface changes, Subsurface and coastal responses. Front. Mar. Sci.9. doi: 10.3389/fmars.2022.785771
24
Juza M. Tintoré J. (2021). Multivariate Sub-regional ocean indicators in the Mediterranean Sea: From event detection to climate change estimations. Front. Mar. Sci.8, 610589. doi: 10.3389/fmars.2021.610589
25
Krahmann G. Schott F. (1998). Long-term increases in western Mediterranean salinities and temperatures: anthropogenic and climatic sources. Geophys. Res. Lett.25, 4209–4212. doi: 10.1029/1998GL900144
26
Kubin E. Menna M. Mauri E. Notarstefano G. Mieruch S. Poulain P.-M. (2023). Heat content and temperature trends in the Mediterranean Sea as derived from Argo float data. Front. Mar. Sci.10. doi: 10.3389/fmars.2023.1271638
27
Li M. Organelli E. Serva F. Bellacicco M. Landolfi A. Pisano A. et al . (2024). Phytoplankton spring bloom inhibited by marine heatwaves in the Northwestern Mediterranean Sea. Geophys. Res. Lett.51, e2024GL109141. doi: 10.1029/2024GL109141
28
Macdonald A. M. Wunsch C. (1996). An estimate of global ocean circulation and global heat fluxes. Nature382, 436–439. doi: 10.1038/382436a0
29
Marshall J. Schott F. (1999). Open-ocean convection: Observations, theory, and models. Rev. Geophys.37, 1–64. doi: 10.1029/98RG02739
30
Martínez J. Leonelli F. E. García-Ladona E. Garrabou J. Kersting D. K. Bensoussan N. et al . (2023). Evolution of marine heatwaves in warming seas: the Mediterranean Sea case study. Front. Mar. Sci.10, 1193164.
31
Marullo S. Serva F. Iacono R. Napolitano E. di Sarra A. Meloni D. et al . (2023). Record-breaking persistence of the 2022/23 marine heatwave in the Mediterranean Sea. Environ. Res. Lett.18. doi: 10.1088/1748-9326/ad02ae
32
MedECC (2020). Climate and environmental change in the mediterranean basin – current situation and risks for the future. First mediterranean assessment report (Plan Bleu, Union for the Mediterranean, Plan Bleu, UNEP/MAP). doi: 10.5281/zenodo.4768833
33
Nykjaer L. (2009). Mediterranean Sea surface warming 1985–2006. Clim. Res.39, 11–17. doi: 10.3354/cr00794
34
Okubo A. (1970). Horizontal dispersion of floatable particles in the vicinity of velocity singularities such as convergences. Deep Sea Res. Oceanogr. Abstr.17, 445–454. doi: 10.1016/0011-7471(70)90059-8
35
Pan J. Sun Y. (2018). Estimation of horizontal eddy heat flux in upper mixed-layer in the South China Sea by using satellite data. Sci. Rep.8, 15527. doi: 10.1038/s41598-018-33803-2
36
Pastor F. Khodayar S. (2023). Marine heat waves: characterizing a major climate impact in the Mediterranean. Sci. Total Environ.861, 160621. doi: 10.1016/j.scitotenv.2022.160621
37
Pisano A. Nardelli B. B. Tronconi C. Santoleri R. (2016). The new Mediterranean optimally interpolated pathfinder AVHRR SST Dataset (1982–2012). Remote Sensing of Environment176, 107–116.
38
Pisano A. Marullo S. Artale V. Falcini F. Yang C. Leonelli F. E. et al . (2020). New evidence of Mediterranean climate change and variability from sea surface temperature observations. Remote Sens.12, 132. doi: 10.3390/rs12010132
39
Samset B. H. Lund M. T. Fuglestvedt J. S. Wilcox L. J. (2024). 2023 temperatures reflect steady global warming and internal sea surface temperature variability. Commun. Earth Environ.5, 460. doi: 10.1038/s43247-024-01103-0
40
Schroeder K. Chiggiato J. Bryden H. L. Borghini M. Ben Ismail S. (2016). Abrupt climate shift in the Western Mediterranean Sea. Scientific Reports6, 23009.
41
Skliris N. Marsh R. Breedon M. Josey S. A. (2025). Accelerated warming and salinification of the Mediterranean Sea: Implications for dense water formation. J. Mar. Sci. Eng.13, 25.
42
Stammer D. (1998). On eddy characteristics, eddy transports, and mean flow properties. J. Phys. Oceanogr.28, 727–739. doi: 10.1175/1520-0485(1998)028<0727:OECETA>2.0.CO;2
43
Terhaar J. Burger F. A. Vogt L. Frölicher T. L. Stocker T. F. (2025). Record sea surface temperature jump in 2023–2024 unlikely but not unexpected. Nature639, 942–946. doi: 10.1038/s41586-024-07102-3
44
Testor P. Send U. Gascard J. C. Millot C. Taupier-Letage I. Béranger K. (2005). The mean circulation of the southwestern Mediterranean Sea: Algerian Gyres. Journal of Geophysical Research: Oceans110 (C11).
45
Tuel A. Eltahir E. A. (2020). Why is the Mediterranean a climate change hot spot? J. Clim.33, 5829–5843. doi: 10.1175/JCLI-D-19-0910.1
46
Van Haren H. Millot C. Taupier-Letage I. (2006). Fast deep sinking in Mediterranean eddies. Geophysical Research Letters33 (4).
47
Vargas-Yáñez M. García-Martínez M. C. Moya F. Balbín R. López-Jurado J. L. Serra M. et al . (2017). Updating temperature and salinity mean values and trends in the Western Mediterranean: The RADMED project. Prog. Oceanography157, 27–46. doi: 10.1016/j.pocean.2017.09.004
48
Weiss J. (1991). The dynamics of enstrophy transfer in two-dimensional hydrodynamics. Physica D Nonlinear Phenom.48, 273–294. doi: 10.1016/0167-2789(91)90088-Q
49
Wunsch C. (1997). The vertical partition of oceanic horizontal kinetic energy and the spectrum of global variability. J. Phys. Oceanogr.27, 1770–1794. doi: 10.1175/1520-0485(1997)027<1770:TVPOHK>2.0.CO;2
Summary
Keywords
Mediterranean Sea, sea surface temperature, marine heatwave, mesoscale variability, air-sea exchange
Citation
Napolitano E, Carillo A, Iacono R, Struglia MV, dell’Aquila A, Palma M, Marullo S, De Sabata E, Bordone A and Borzelli GE (2025) Unprecedented Mediterranean Sea warming in 2024: analysis of the driving mechanisms. Front. Mar. Sci. 12:1668204. doi: 10.3389/fmars.2025.1668204
Received
17 July 2025
Accepted
23 October 2025
Published
07 November 2025
Volume
12 - 2025
Edited by
Borja Aguiar-González, University of Las Palmas de Gran Canaria, Spain
Reviewed by
Tien Anh Tran, Seoul National University, Republic of Korea
Elisabeth Kubin, Independent Researcher, Italy
Vladimir Santos da Costa, Foundation Euro-Mediterranean Center on Climate Change (CMCC), Italy
Updates
Copyright
© 2025 Napolitano, Carillo, Iacono, Struglia, dell’Aquila, Palma, Marullo, De Sabata, Bordone and Borzelli.
This is an open-access article distributed under the terms of the Creative Commons Attribution License (CC BY). The use, distribution or reproduction in other forums is permitted, provided the original author(s) and the copyright owner(s) are credited and that the original publication in this journal is cited, in accordance with accepted academic practice. No use, distribution or reproduction is permitted which does not comply with these terms.
*Correspondence: Ernesto Napolitano, ernesto.napolitano@enea.it
Disclaimer
All claims expressed in this article are solely those of the authors and do not necessarily represent those of their affiliated organizations, or those of the publisher, the editors and the reviewers. Any product that may be evaluated in this article or claim that may be made by its manufacturer is not guaranteed or endorsed by the publisher.