Abstract
Understanding the dynamics of the phytoplankton community in the marginal seas of the Southern Ocean is crucial for delineating its role in global carbon cycling. This study investigated spatiotemporal variations in phytoplankton community structure and organic carbon pools in the Cosmonaut Sea, East Antarctica, with an emphasis on spatial heterogeneity and environmental drivers during late austral summer (February). Water samples were collected from 15 stations during the 40th Chinese Antarctic Research Expedition (CHINARE-40, February 2024), and nutrient, pigment, particulate organic carbon (POC), and dissolved organic carbon (DOC) concentrations were quantified. The CHEMTAX analysis revealed that the phytoplankton community was dominated by diatoms (38% ± 16%), dinoflagellates (22% ± 12%), and Prymnesiophyceae Phaeocystis antarctica (12% ± 10%). Diatoms and P. antarctica contributed significantly to POC (r = 0.36, p < 0.01) and DOC (r = 0.69, p < 0.01), respectively. Spatial distribution patterns displayed pronounced heterogeneity; large ice-edge diatoms dominated cold, high-light, and shallow mixed-layer regions, while small pelagic diatoms and dinoflagellates dominated in stratified, nutrient-limited, and low-light environments. Comparative analysis with adjacent Southern Ocean sectors further highlighted how distinct water masses shape niche competition. Furthermore, our results suggest a trend toward phytoplankton miniaturization, with increasing prevalence of dinoflagellates and P. antarctica under projected positive phases of the Southern Annular Mode, potentially diminishing biological carbon pump efficiency and weakening carbon sequestration. Collectively, these findings clarify how the Cosmonaut Sea phytoplankton community responds to environmental variability, providing essential insights into biogeochemical cycling and carbon budget dynamics in the Southern Ocean under climate change.
1 Introduction
As an amplifier of global environmental change (Ludescher et al., 2019), the Southern Ocean plays a significant role in the global carbon cycle, accounting for approximately 40% of oceanic CO2 uptake and exhibiting exceptional carbon sequestration potential (Frölicher et al., 2015; Deppeler and Davidson, 2017). However, climate-driven regime shifts, including the poleward migration of the westerlies, weakened water column mixing, shortened annual sea ice duration, and intensified Amundsen Sea Low anomalies (Rintoul et al., 2018; Wang et al., 2023), thereby profoundly impacting polar ecosystems. These environmental changes directly alter euphotic zone planktonic ecosystems by modifying hydrodynamic conditions and water physicochemical properties, thereby exerting both direct and indirect effects on Southern Ocean food webs and further impacting the magnitude and efficiency of the biological carbon pump (BCP).
Phytoplankton responses in the euphotic zone are central to these ecosystem changes. As the foundation of the marine food web, phytoplankton drive carbon fixation and export (Deppeler and Davidson, 2017; Petrou et al., 2016), with diatoms and Phaeocystis antarctica dominating in the Southern Ocean but fulfilling distinct ecological roles (Tréguer et al., 2018). Diatom-dominated communities achieve high BCP efficiency via siliceous particle export (Sarthou et al., 2005), whereas P. antarctica-dominated assemblages exhibit enhanced primary production within the euphotic zone (Li et al., 2025). Phytoplankton growth responds to environmental constraints, including light availability, sea ice dynamics, and nutrient supply, and is particularly sensitive to bioavailable iron from meltwater and upwelling (Alderkamp et al., 2015, 2019). As a high-nutrient, low-chlorophyll region, the Southern Ocean is subject to significant constraints on phytoplankton primary production, primarily stemming from the scarcity of micronutrients such as iron (Bazzani et al., 2023; Heidemann et al., 2024). Notably, within the Cosmonaut Sea—a maritime area characterized by low primary productivity—iron limitation occurring during the late phase of sea ice ablation can even lead to the miniaturization of phytoplankton communities (Li, 2024). Although phytoplankton biomass across the Southern Ocean has increased over the past two decades, primary production at the mixed-layer base has declined (Pinkerton et al., 2021), and ongoing warming may further reduce productivity (Moore et al., 2018). Understanding phytoplankton dynamics is, therefore, key to predicting BCP efficiency and regional carbon budgets.
During the austral summer, the Southern Annular Mode (SAM) and climate warming drive marked changes in Antarctic marine environments and phytoplankton succession. In the Weddell Sea, rapid sea ice loss since 2016 has altered phytoplankton and zooplankton communities (Turner et al., 2020; Feng et al., 2022b), while the Cosmonaut Sea—despite recent sea ice expansion (Ludescher et al., 2019)—displays shrinking krill habitats and rising picoplankton dominance (Lin et al., 2022; Han et al., 2022). Late summer (February) features high photosynthetically active radiation (PAR) but reduced daylength, substantial freshwater influx from sea ice melt, and enhanced surface warming (Nardelli et al., 2023), resulting in distinct phytoplankton communities compared to early summer (Fan et al., 2024; Kang et al., 2024; Li et al., 2024). Studying these late-summer assemblages is thus essential to understanding seasonal succession under changing conditions. To address these issues, we analyzed samples collected from 15 stations in the Cosmonaut Sea in February 2024, integrating hydrographic data, nutrients, phytoplankton pigments, biogenic silica (BSi) measurements, organic carbon assessments, remote sensing, and historical records. Our study aimed to 1) characterize spatial heterogeneity in dominant phytoplankton groups and organic carbon pools, 2) evaluate community succession throughout the austral summer, and 3) compare coastal and offshore phytoplankton responses across different Southern Ocean sectors using historical data and project future BCP efficiency and carbon budgets in the Cosmonaut Sea. These insights are vital for predicting polar ecosystem and carbon cycle responses in a warming world.
2 Methods
2.1 Study area and sampling
The Cosmonaut Sea (30°E–80°E, 60°S–68°S), located in the Indian Ocean sector of East Antarctica, occupies the Weddell–Enderby Basin and is bounded by the Weddell Sea to the west and the Cooperation Sea to the east (Figure 1, Williams et al., 2010). Its circulation system is characterized by the Prydz Bay Gyre and the Weddell Gyre along the western/eastern margins, the eastward-flowing Antarctic Circumpolar Current (ACC) to the north, and the westward Antarctic Slope Current (ASC) to the south (Wakatsuchi et al., 1994; Li et al., 2024). Water masses in this region primarily comprise the Antarctic Surface Water (AASW), Circumpolar Deep Water (CDW), and Antarctic Bottom Water (AABW) (Li et al., 2024). Interactions between the Weddell Gyre and the relatively slow-moving ACC (~15 cm s−1) in the northern Cosmonaut Sea drive the upwelling of Warm Deep Water (WDW). The Southern Boundary (SB) of the ACC lies south of 60°S, with its southern frontal jet (sACCf) entering the sea near 50°E. The ASC (>25cm s−1 core velocity) significantly modulates sea ice dynamics and cross-shelf nutrient transport, culminating in its retroflection at Cape Ann (Meijers et al., 2010). During the 40th Chinese Antarctic Research Expedition (CHINARE-40; February 5–25, 2024), seawater samples were collected at 15 stations spanning 40°E–60°E in the Cosmonaut Sea (Figure 1, Supplementary Table S1). Hydrographic profiles (temperature, salinity, and density) were obtained using a pre-calibrated Sea-Bird SBE 9/11 CTD system (Bellevue, WA, USA). A rosette sampler (General Oceanics, Miami Gardens, FL, USA) equipped with Niskin bottles was employed to collect water from discrete depths (5, 25, 50, 75, 100, 150, and 200m). For biogeochemical analysis, 1.5–4.0 L of seawater was filtered through pre-combusted GF/F filters (Whatman, Wilmington, DE, USA) under low-light conditions, with filters stored at −80°C until laboratory processing.
Figure 1
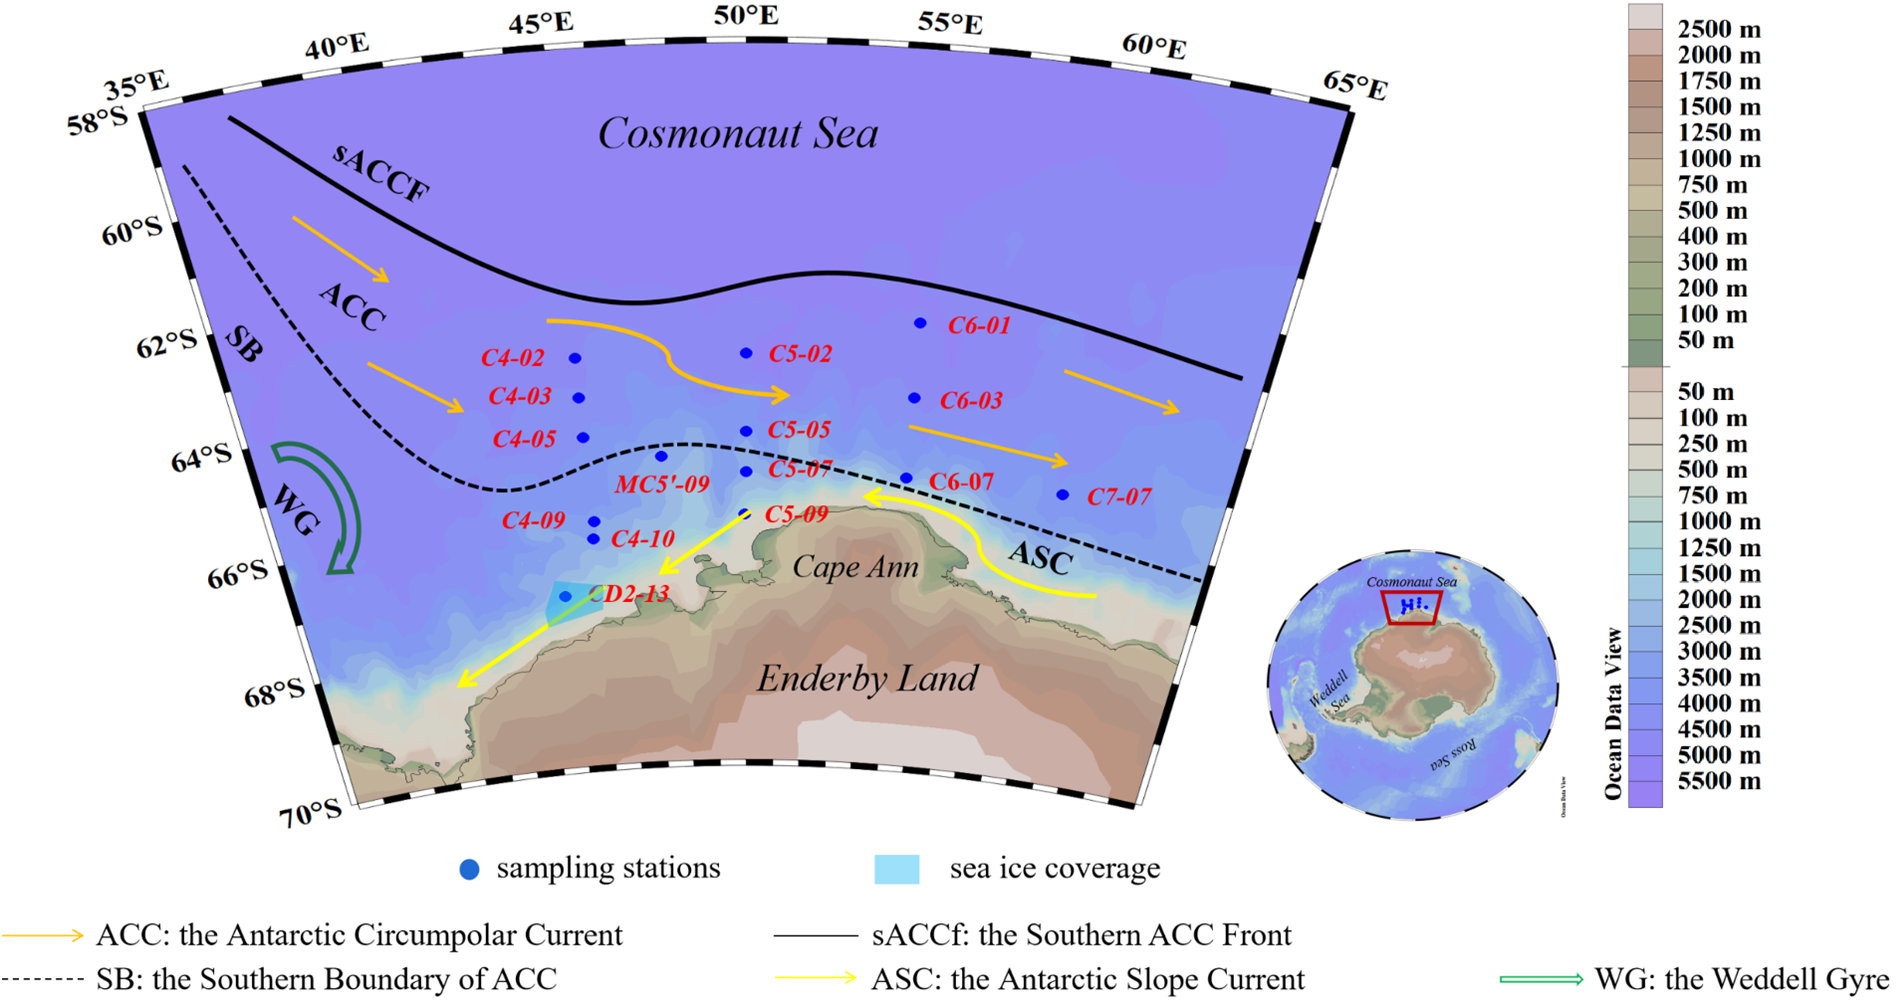
A map of the Cosmonaut Sea, Antarctic, showing water depths and ocean circulation patterns.
2.2 Remote sensing data and physical hydrological parameters
PAR and euphotic depth (Zeu) data were obtained from the ESA GlobColour platform (http://oceancolor.gsfc.nasa.gov) at a spatial resolution of 4 × 4km and an 8-day temporal resolution.
Mixed layer depth (MLD) and sea surface temperature (SST) data were obtained from the Copernicus Marine Service (https://data.marine.copernicus.eu/). MLD data had a spatial resolution of 27.8 × 27.8km (monthly temporal resolution), while SST data had a spatial resolution of 5.5 × 5.5km (daily temporal resolution).
The sea ice concentration (SIC%) was acquired from the University of Bremen’s sea ice portal (https://data.seaice.uni-bremen.de) at a spatial resolution of 3.125 × 3.125km and a daily temporal resolution. The meltwater fraction (MW%), a key metric for quantifying the influence of sea ice, was calculated as follows (Mendes et al., 2017):
where Ssurface and Sdeep represent the salinity of the surface water and deep water (≈300-m depth), respectively.
2.3 Pigment analyses
Phytoplankton pigments were analyzed following Feng et al. (2022b). Briefly, filters were extracted with 3 mL acetone, sonicated in an ice bath for 30 s, and subsequently stored at −20°C for 2h. The extract was filtered through a polytetrafluoroethylene syringe filter (4-mm diameter, 0.22-μm pore size) and evaporated to dryness under a gentle stream of nitrogen. The dried residue was then re-dissolved in 300 μL of a methanol:water mixture (9:1, v/v). Pigment extracts were analyzed using an ultra-performance liquid chromatography (UPLC) system (ACQUITY UPLC®) equipped with a BEH C18 column (50 × 2.1mm, 1.7-μm particle size), a photodiode array detector, and a fluorescence detector. Pigments were identified and quantified based on retention times, absorption maxima, and response factors determined from authentic standards. The analytical method had a precision of 0.26 mg m−3 and a detection limit of 2.2 mg m−3.
The relative contributions of different phytoplankton groups to the total chlorophyll a (Chl a) biomass were estimated using the CHEMTAX software (Wright et al., 2010), which applies class-specific pigment ratios to characterize phytoplankton community structure and abundance relative to total Chl a (Table 1). The groups considered in this study included two diatom subgroups (Feng, 2022)—Fragilariopsis spp. (Diat-A), a group of large-celled cold-water diatoms, and Pseudo-nitzschia spp. (Diat-B), a group of small pelagic diatoms—as well as P. antarctica [distinguished as high-iron (Hapt-HiFe) and low-iron (Hapt-LoFe) ecotypes], dinoflagellates (Dino), cryptophytes (Crypto), prasinophytes (Prasi), cyanobacteria (Cyano), and chlorophytes (Chloro).
Table 1
| Class | Chl c3 | Chl c1 | Peri | Fuco | Neo | Pras | Viola | Hex-fuco | Allo | Lut | Chl b |
|---|---|---|---|---|---|---|---|---|---|---|---|
| Initial ratio matrix | |||||||||||
| Prasi | 0 | 0 | 0 | 0 | 0.03 | 0.097 | 0.056 | 0 | 0 | 0.006 | 0.62 |
| Chloro | 0 | 0 | 0 | 0 | 0.062 | 0 | 0.031 | 0 | 0 | 0.22 | 0.18 |
| Crypto | 0 | 0 | 0 | 0 | 0 | 0 | 0 | 0 | 0.22 | 0 | 0 |
| Diat-A | 0 | 0.04 | 0 | 0.52 | 0 | 0 | 0 | 0 | 0 | 0 | 0 |
| Diat-B | 0.033 | 0 | 0 | 0.61 | 0 | 0 | 0 | 0 | 0 | 0 | 0 |
| Dino | 0 | 0 | 0.54 | 0 | 0 | 0 | 0 | 0 | 0 | 0 | 0 |
| Hapt-HiFe | 0.13 | 0 | 0 | 0.08 | 0 | 0 | 0 | 0.4 | 0 | 0 | 0 |
| Hapt-LoFe | 0.27 | 0 | 0 | 0.01 | 0 | 0 | 0 | 1.1 | 0 | 0 | 0 |
| Final ratio matrix | |||||||||||
| Prasi | 0 | 0 | 0 | 0 | 0.07 | 0.09 | 0.049 | 0 | 0 | 0.0066 | 0.55 |
| Chloro | 0 | 0 | 0 | 0 | 0.071 | 0 | 0.032 | 0 | 0 | 0.23 | 0.15 |
| Crypto | 0 | 0 | 0 | 0 | 0 | 0 | 0 | 0 | 0.21 | 0 | 0 |
| Diat-A | 0 | 0.21 | 0 | 1.04 | 0 | 0 | 0 | 0 | 0 | 0 | 0 |
| Diat-B | 0.016 | 0 | 0 | 0.83 | 0 | 0 | 0 | 0 | 0 | 0 | 0 |
| Dino | 0 | 0 | 0.82 | 0 | 0 | 0 | 0 | 0 | 0 | 0 | 0 |
| Hapt-HiFe | 0.34 | 0 | 0 | 0.13 | 0 | 0 | 0 | 0.43 | 0 | 0 | 0 |
| Hapt-LoFe | 0.13 | 0 | 0 | 0.01 | 0 | 0 | 0 | 1.21 | 0 | 0 | 0 |
Phytoplankton pigment matrix in the Cosmonaut Sea.
The following pigment standards were included in the analysis: chlorophyll c3 (Chl c3), chlorophyll c1 (Chl c1), neoxanthin (Neo), violaxanthin (Viola), fucoxanthin (Fuco), 19′-hexanoyloxyfucoxanthin (Hex-fuco), alloxanthin (Allo), peridinin (Peri), lutein (Lut), prasinoxanthin (Pras), and chlorophyll b (Chl b). The phytoplankton community was included in the analysis: prasinophytes (Prasi), chlorophytes (Chloro), cryptophytes (Crypto), a group of large-celled cold-water diatoms (Diat-A), a group of small pelagic diatoms (Diat-B), dinoflagellates (Dino), and Phaeocystis antarctica [distinguished as high-iron (Hapt-HiFe) and low-iron (Hapt-LoFe) ecotypes].
2.4 Organic carbon, nutrient, and BSi analyses
Samples were analyzed to determine the organic carbon content, including particulate organic carbon (POC) and dissolved organic carbon (DOC). For POC analysis (Li, 2024), filters were fumigated with 12 mol/L HCl vapor for 12h to remove inorganic carbon, rinsed with ultrapure water to eliminate residual acid, and dried at 55°C. The processed samples were analyzed using a Shimadzu TOC-LCPH-SSM5000 analyzer (Shimadzu, Kyoto, Japan). The standard material utilized (GBW07314) was supplied by the Certified Reference Materials Center of the Second Institute of Oceanography, Ministry of Natural Resources, China. The instrument precision was better than 0.1%, and the detection limit was 4 μg/L.
DOC concentrations were determined using a Shimadzu TOC-L high-temperature combustion analyzer (Shimadzu, Japan). Milli-Q water was utilized as a blank to establish the baseline. DOC measurement reference standards were obtained from the University of Miami’s deep seawater reference material. Analytical errors were kept within 5% based on at least three replicate measurements per sample.
The nutrient concentrations of seawater samples were determined following the method described by Grasshoff et al. (2009). Samples were filtered through cellulose acetate membranes (0.45-μm pore size) and stored at −20°C. Analyses were performed using a continuous-flow automated nutrient analyzer (San++, Skalar, Breda, Netherlands) with detection limits of 0.1 μmol/L for nitrate, 0.1 μmol/L for silicate, and 0.03 μmol/L for phosphate.
The BSi content was analyzed according to the method of Tréguer et al. (1992). Filters were extracted with 0.2 mol/L NaOH in a water bath at 95°C for 45 minutes. The solution was cooled to room temperature (approximately 25°C), neutralized with HCl, and centrifuged. The silicic acid concentration was spectrophotometrically determined using the molybdate blue method at 380 nm following the “Marine Survey Specifications” (General Administration of Quality Supervision, Inspection and Quarantine of the People’s Republic of China and Standardization Administration of China, 2007). The detection limit for BSi was above 0.1 μmol/L.
2.5 Integrated water column analysis
To minimize statistical errors caused by uneven sampling, the concentrations of phytoplankton pigment, organic carbon, and BSi were integrated over the upper 200m of the water column to evaluate the distribution patterns of phytoplankton products (Feng et al., 2022b). The integrated concentration in the water column was calculated as follows:
where Dn is the sampling depth and Cn is the concentration of parameter n at that depth.
Historically integrated data for the average contributions of different phytoplankton groups to the Chl a concentrations at each station were employed to calculate the abundance of various phytoplankton groups at each station (Wright et al., 2010).
2.6 Statistical analyses
The Origin 2021 (OriginLab, Northampton, MA, USA) and Ocean Data View 4 (Alfred Wegener Institute, Bremerhaven, Germany) software were used to perform statistical analyses and the graphical visualization of horizontal and vertical distributions. Correlations between parameters were examined based on two-tailed t-tests and Pearson’s correlation analyses in SPSS 20 (IBM, Armonk, NY, USA).
3 Results
3.1 Physical environments
The average seawater temperature in the 0–200-m layer of the Cosmonaut Sea study area was 0.1°C ± 1.2°C (Supplementary Figure S1a). Vertically, the seawater temperature generally decreased with increasing depth, with the lowest temperatures at most stations observed in the 50-m layer. Horizontally, at all sampled depths, seawater temperature displayed a marked increasing trend from nearshore to offshore waters. The average salinity of the water column above 200m in the Cosmonaut Sea research area was 34.1‰ ± 0.3‰ (Supplementary Figure S1b). Salinity increased with depth. Horizontally, for all sampled depths, the nearshore salinity was consistently lower than that in offshore waters, and the salinity was higher in the western section of the Enderby Land nearshore region than in the east.
During the February 2024 sampling period, only southwestern nearshore stations CD2–13 in the Cosmonaut Sea retained sea ice, with a SIC% of 47%, while almost no sea ice was observed in other parts of the study area (Figure 2d). The mean SST was 0.8°C ± 0.7°C (Figure 2e) and was negatively correlated with the SIC% (r = −0.63, p < 0.05; Figure 3). The MLD ranged from 15 to 52m, with an average of 31 ± 9m, exhibiting a general spatial pattern of shallower layers in the south and deeper layers in the north (Figure 2c). The mean MW% was 3.0% ± 0.4% (Figure 2f), with higher values distributed in the northern open waters of Enderby Land and the southwestern nearshore Cosmonaut Sea. The MW% was significantly negatively correlated with the average salinity (r = −0.69, p < 0.01) and negatively correlated with the SST (r = −0.53, p < 0.05; Figure 3). The highest levels of PAR were observed in the eastern Enderby Land region (Figure 2a). The shallowest Zeu values were detected in the northern coastal area of Cape Ann, with relatively high Zeu values found at the southern ice edge of the Cosmonaut Sea and in the northern open waters of Cape Ann, and Zeu was positively correlated with the MW% (r = 0.56, p < 0.05; Figure 3).
Figure 2
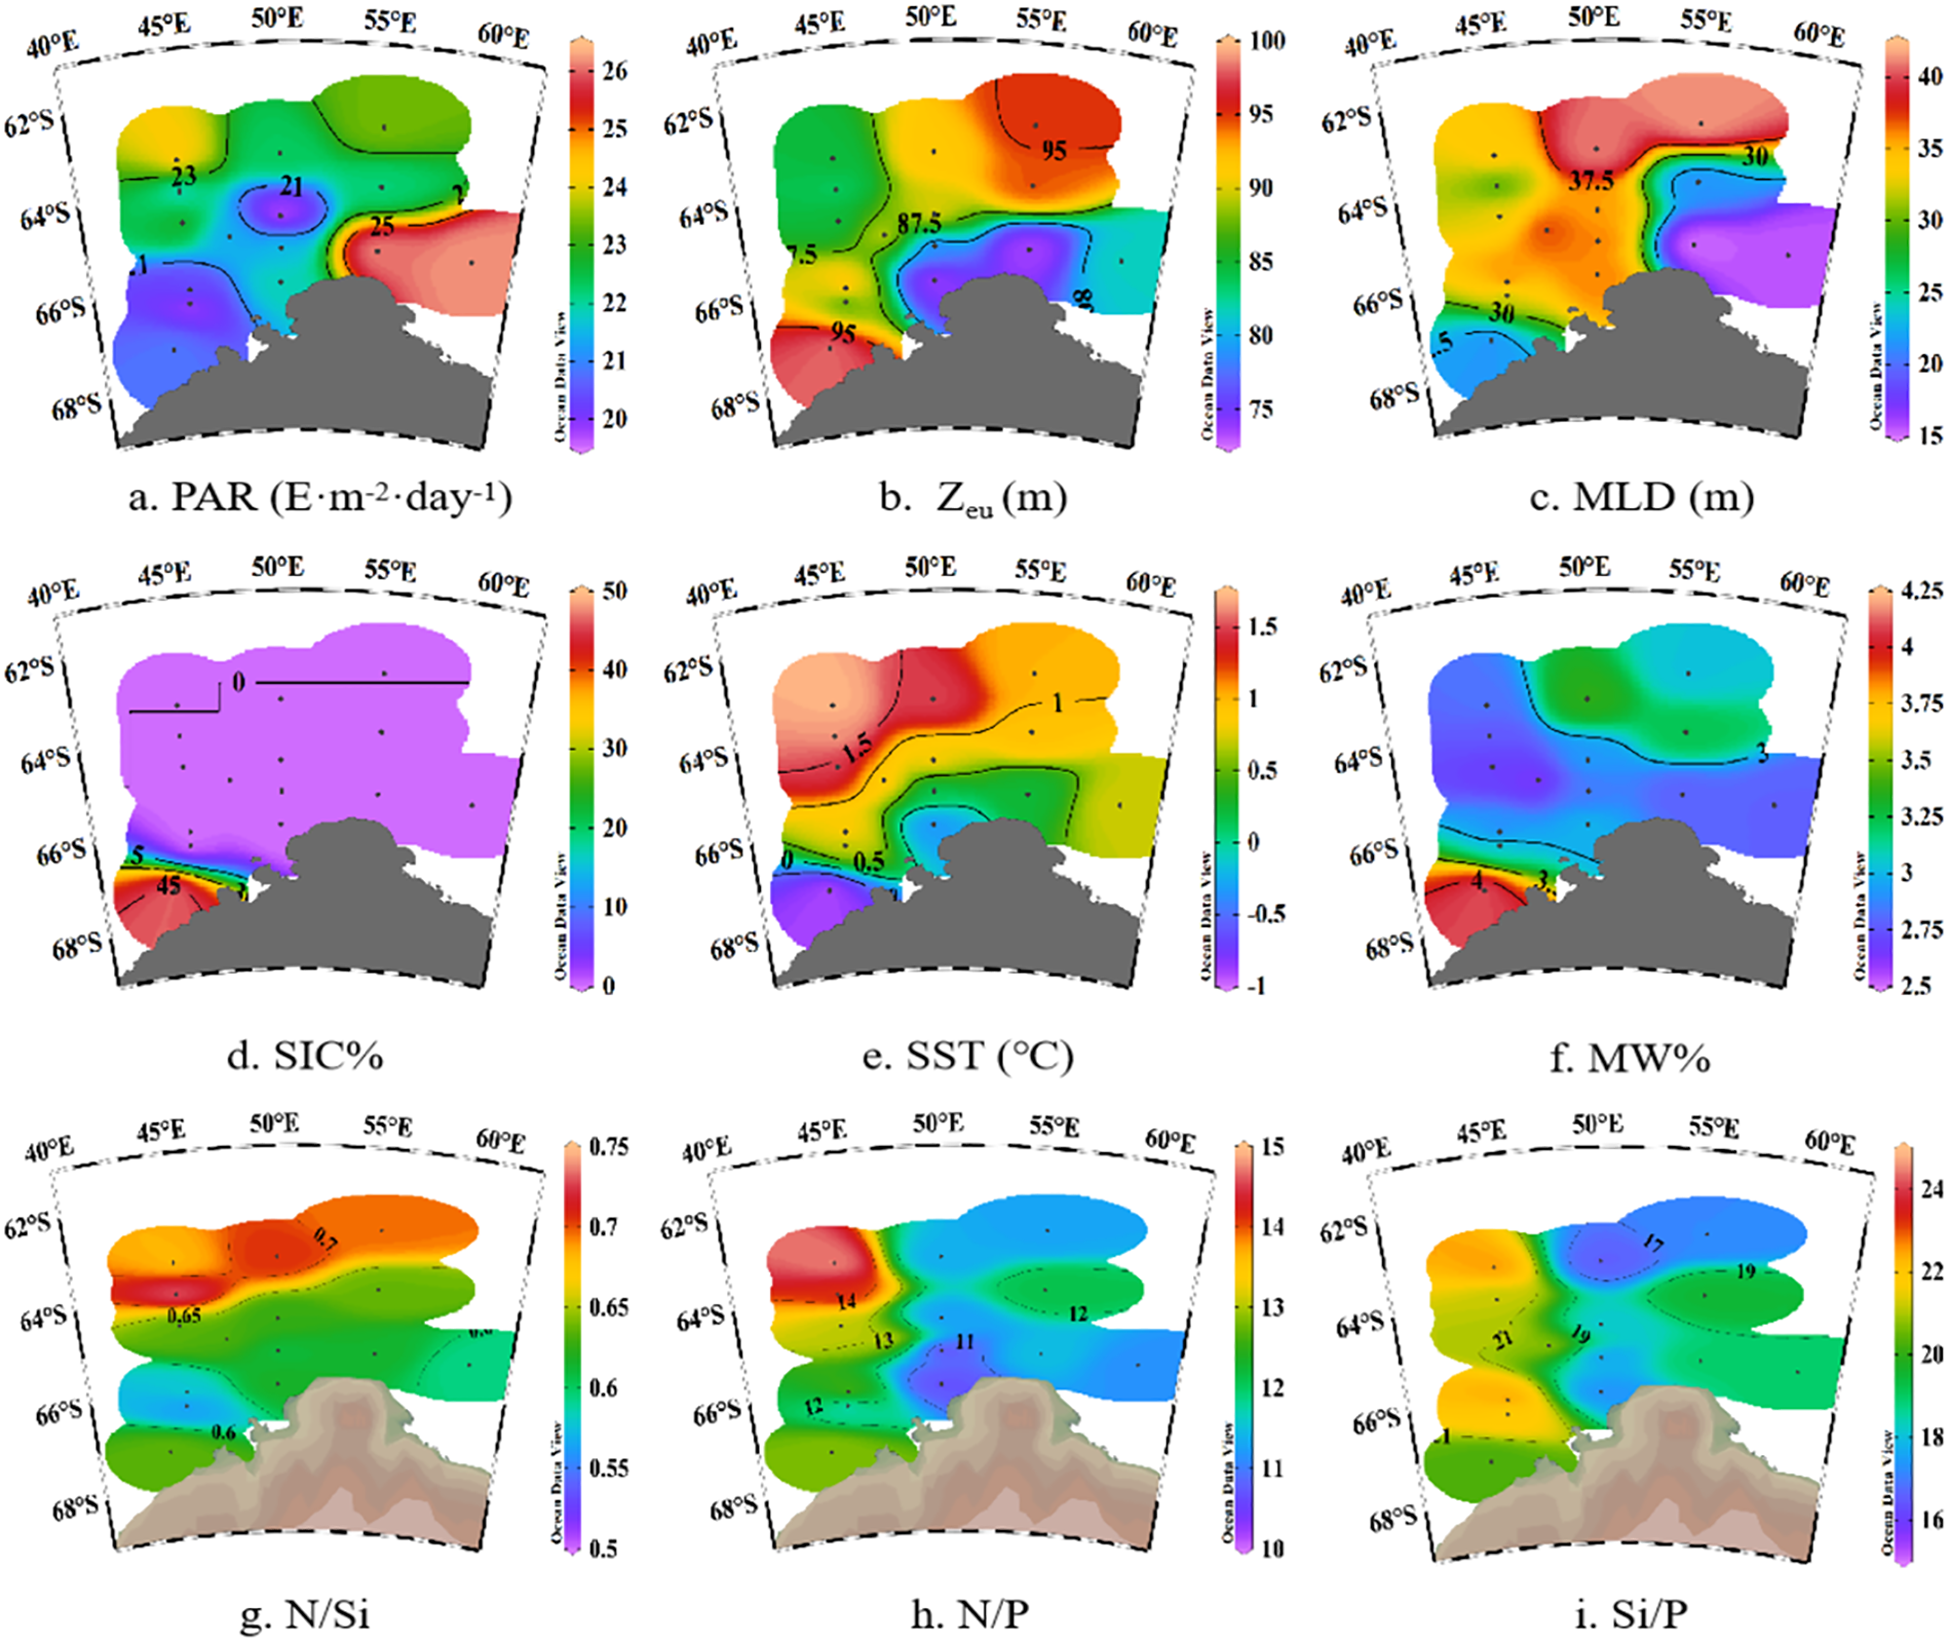
Ocean Data View plots of physiochemical parameters in the Cosmonaut Sea, Antarctic. (a) PAR, photosynthetically active radiation; (b) Zeu, euphotic depth; (c) MLD, mixed layer depth; (d) SIC%, sea ice concentration; (e) SST, sea surface temperature; (f) MW%, meltwater fraction; (g) N/Si, average N:Si ratio; (h) N/P, average N:P ratio; (i) Si/P, average Si:P ratio.
Figure 3
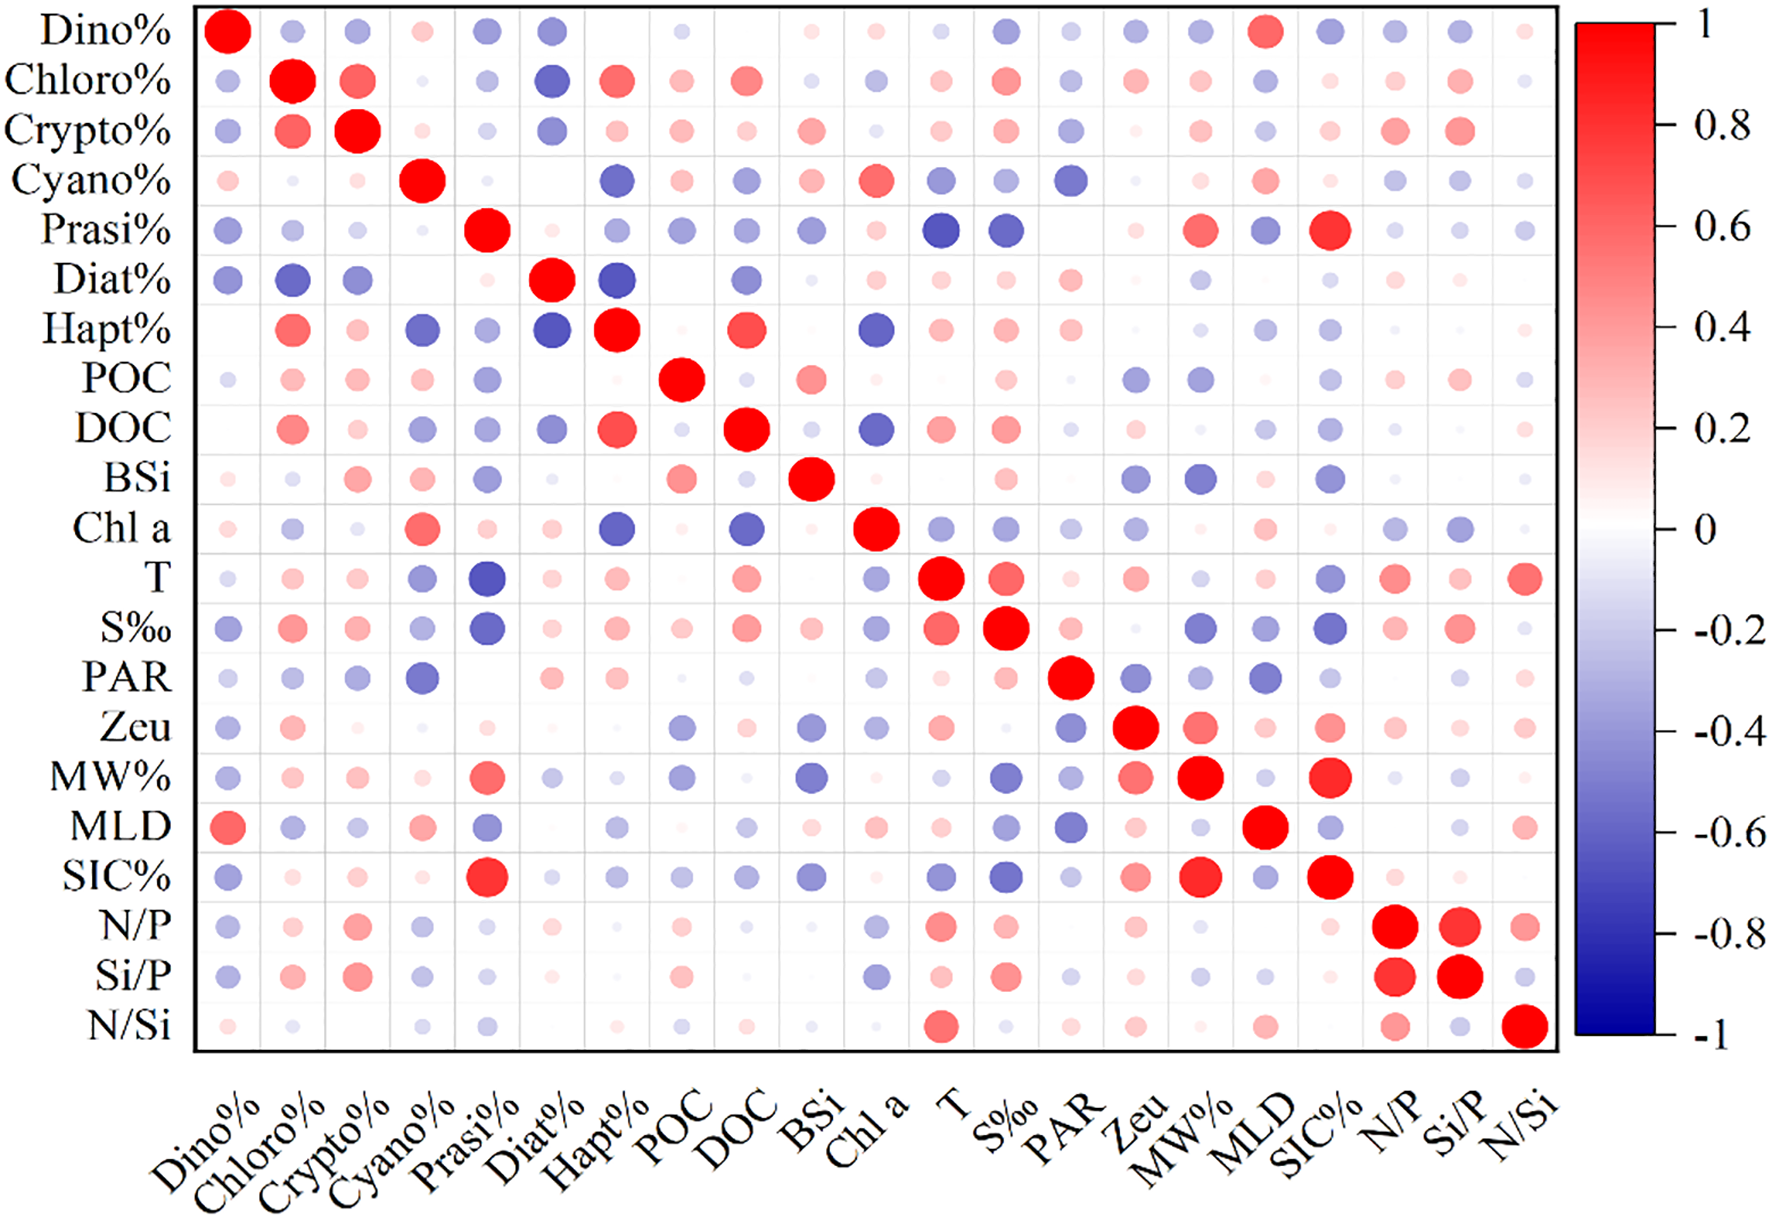
Correlations between depth-integrated phytoplankton biomass and environmental factors in the water column. Dino%, percentage of dinoflagellates; Chloro%, percentage of chlorophytes; Crypto%, percentage of cryptophytes; Cyano%, percentage of cyanobacteria; Prasi%, percentage of prasinophytes; Diat%, percentage of diatoms; Hapt%, percentage of Phaeocystis antarctica; POC, depth-integrated particulate organic carbon; DOC, depth-integrated dissolved organic carbon; BSi, depth-integrated biogenic silica; Chl a, depth-integrated chlorophyll a; T, average temperature; S‰, average salinity; PAR, photosynthetically active radiation; Zeu, euphotic depth; MW%, meltwater fraction; MLD, mixed layer depth; SIC%, sea ice concentration; N/P, average N:P ratio; Si/P, average Si:P ratio; N/Si, average N:Si ratio.
3.2 Nutrient concentrations and ratios
The nitrate concentrations in the Cosmonaut Sea ranged from 16.2 to 33.3 μmol/L, with an average of 25.4 ± 3.5 μmol/L (Supplementary Figure S1c). Phosphate concentrations ranged from 1.3 to 2.9 μmol/L, averaging 2.2 ± 0.4 μmol/L (Supplementary Figure S1d). Silicate concentrations varied between 23.3 and 69.1 μmol/L, with a mean value of 44.7 ± 12.2 μmol/L (Supplementary Figure S1e). The concentrations of all three nutrients were significantly positively correlated with salinity (nitrate, r = 0.70, p < 0.01; phosphate, r = 0.57, p < 0.01; silicate, r = 0.83, p < 0.01). The spatial distribution of nutrients generally exhibited an increasing trend from nearshore to offshore regions, as well as a vertical increase with depth. However, elevated surface (5m) nutrient concentrations were observed at nearshore stations CD2–13 in the southwestern sector of the Cosmonaut Sea.
The nitrogen-to-silicon ratio (N/Si) in the study area was 0.4–0.9, with an average of 0.6 ± 0.1 (Figure 2g). The nitrogen-to-phosphorus ratio (N/P) was 9.9–15.7, with a mean of 12.2 ± 1.4 (Figure 2h). The silicon-to-phosphorus ratio (Si/P) was 13.5–32.6, averaging 19.6 ± 3.8 (Figure 2i). The Si/P was significantly positively correlated with salinity (r = 0.73, p < 0.01), while the N/Si was significantly negatively correlated with salinity (r = −0.67, p < 0.01; Figure 3). No significant vertical trends were observed in nutrient ratios, but on a horizontal scale, higher ratios were detected in the open northwest sector of the Cosmonaut Sea, while lower values were distributed in the northern ridge region of Enderby Land.
3.3 Spatial distributions of organic carbon, BSi, and Chl a concentrations
The POC concentration in the 0–200-m layer of the Cosmonaut Sea study area ranged from 4.8 to 46.9 μg/L, with an average of 19.1 ± 9.4 μg/L (Supplementary Figure S2a). POC concentrations generally declined with increasing depth, with high values found in the surface layers. Spatially, higher POC concentrations were observed on the western side of Cape Ann compared to the eastern side, and in the southwestern sector of the Cosmonaut Sea compared to the northeast. The depth-integrated water column POC concentration averaged 3.4 ± 0.6 g/m2, ranging from 2.1 to 5.0 g/m2 (Figure 4a), with a distribution similar to that of surface POC, being higher in the southwestern open waters and lower in the northeast.
Figure 4
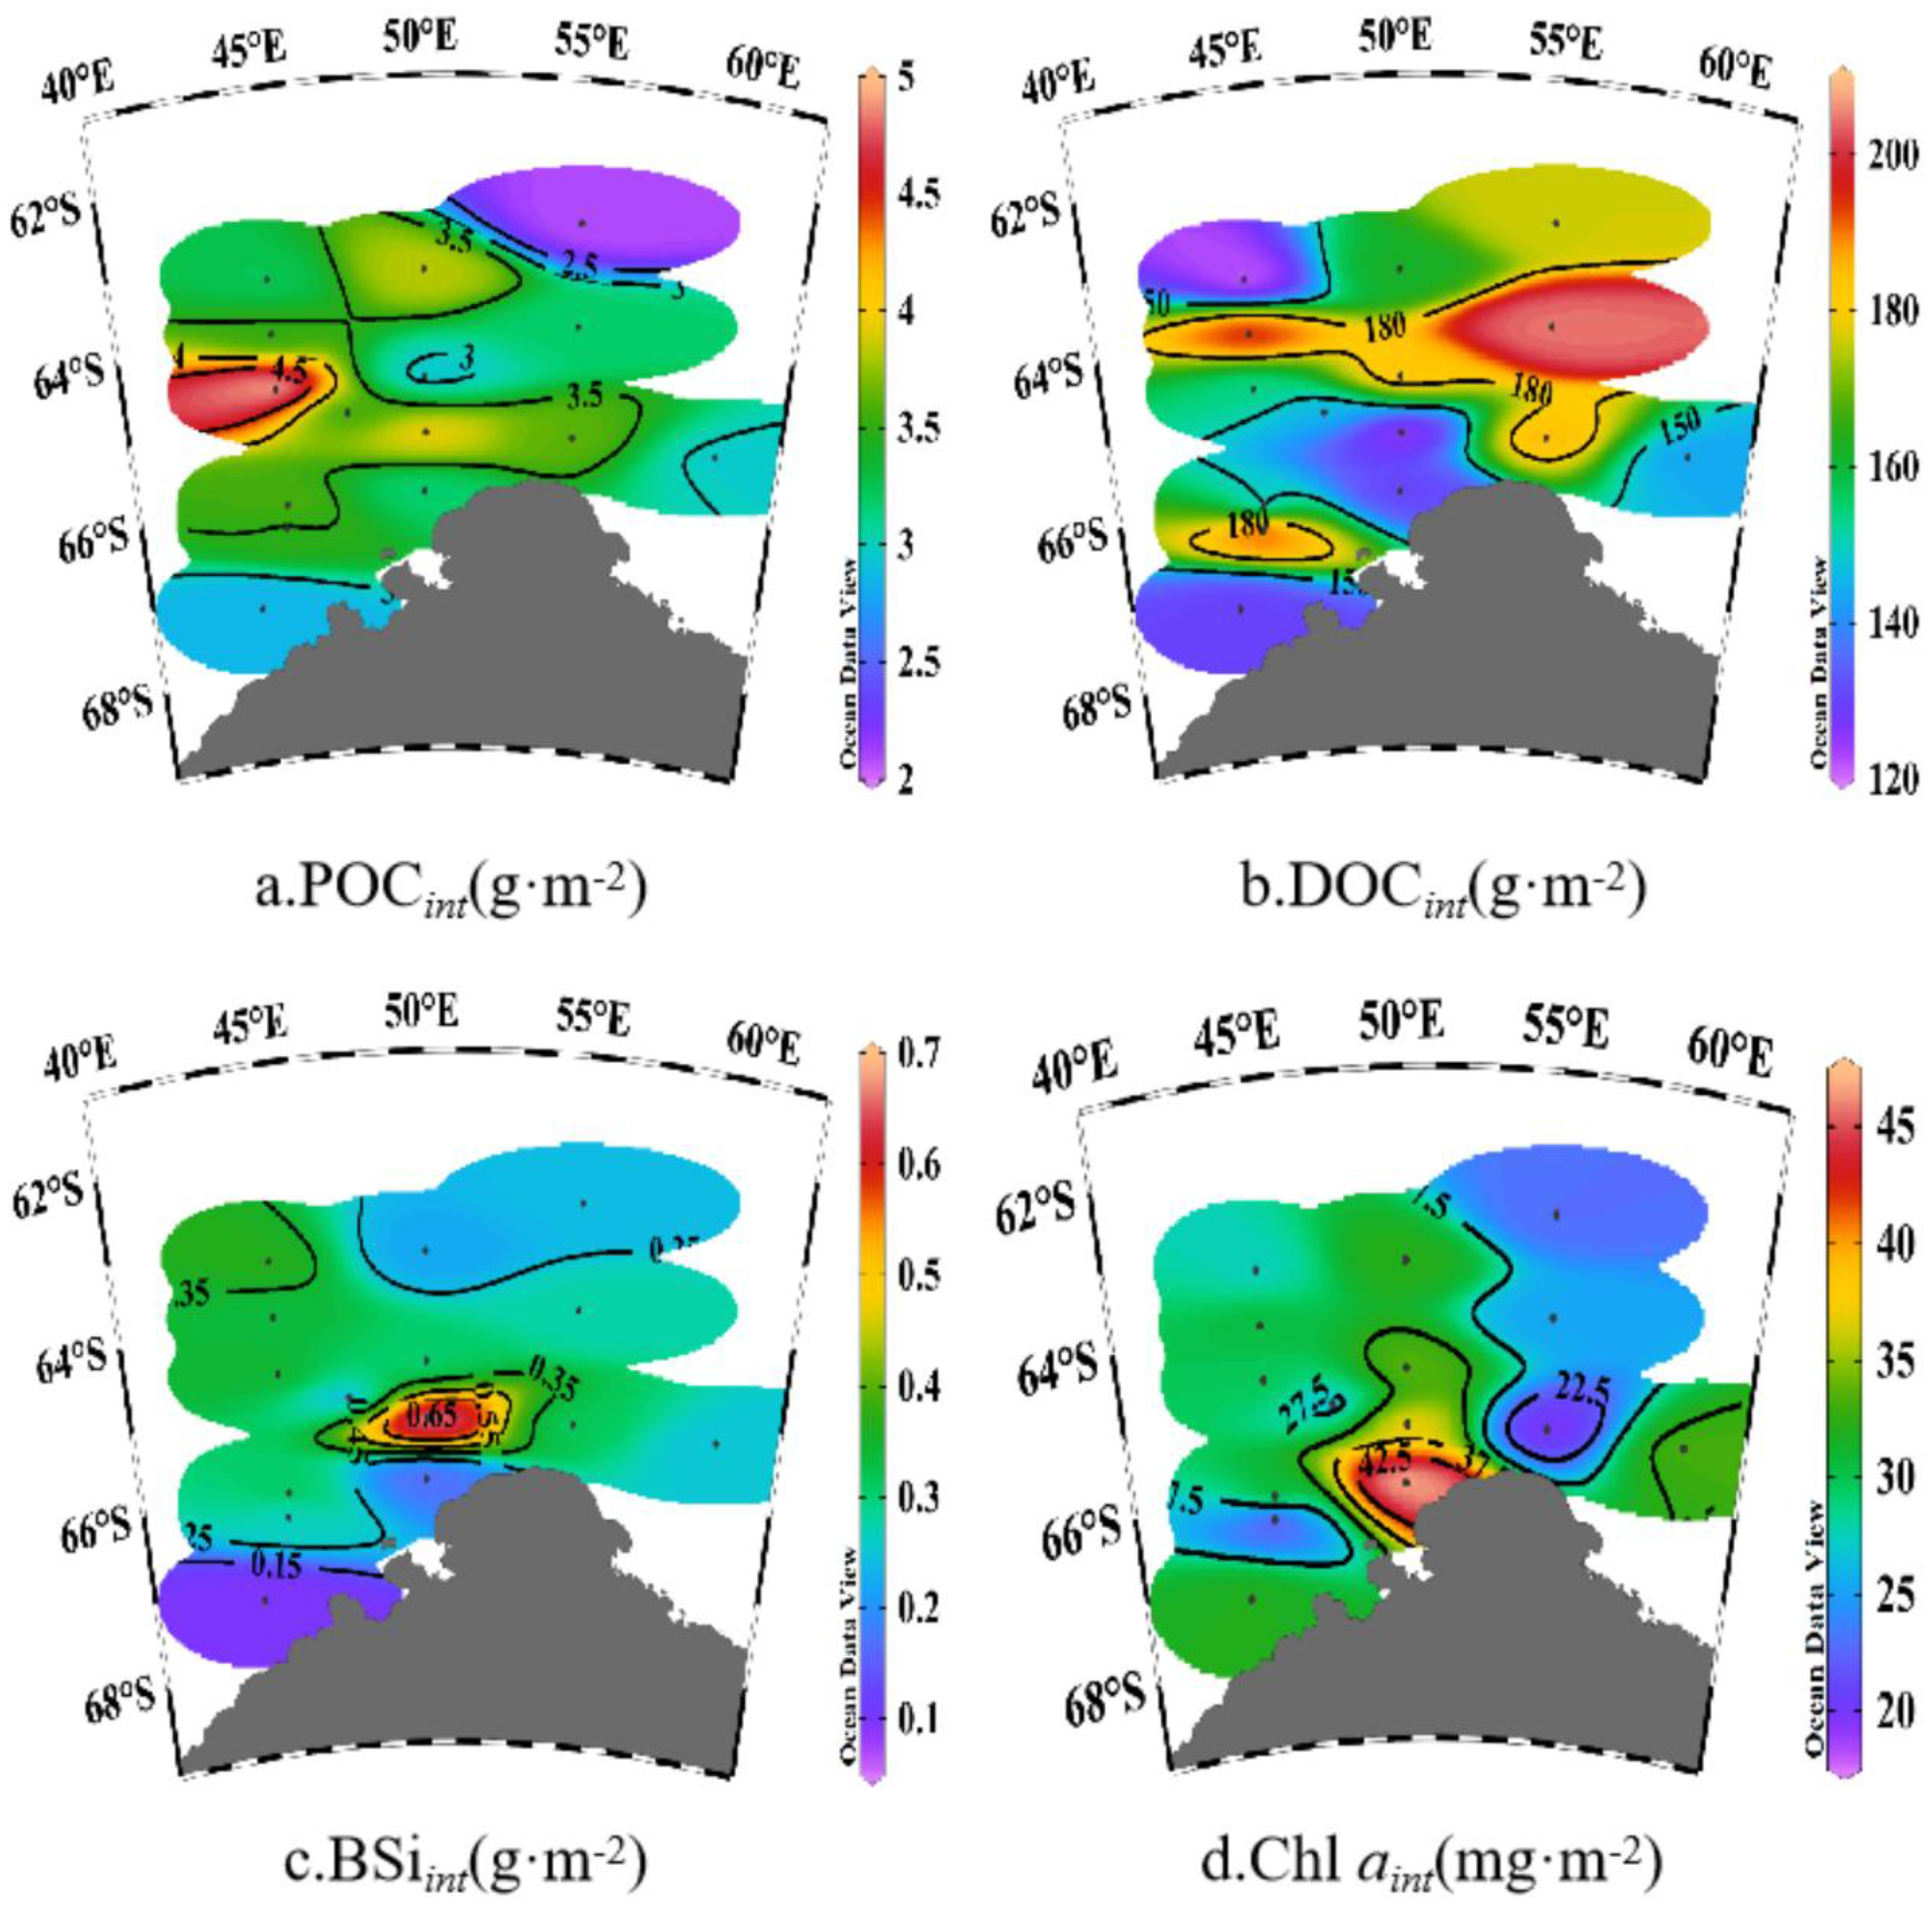
Spatial variation in depth-integrated phytoplankton crops of (a) particulate organic carbon (POCint), (b) dissolved organic carbon (DOCint), (c) biogenic silica (BSiint), and (d) chlorophyll a (Chl aint) in the water column.
The DOC concentrations in the 0–200-m layer ranged from 453.8 to 1,942.0 μg/L, with an average of 815.3 ± 224.8 μg/L (Supplementary Figure S2b). Overall, surface DOC concentrations were higher in offshore waters compared to nearshore areas and higher on the western side of Cape Ann than on the east. The integrated DOC concentration averaged 159.8 ± 27.6 g/m2, with a range of 121.4 to 204.6 g/m2 (Figure 4b), displaying a decreasing trend from the south of the Cosmonaut Sea toward the coast.
BSi concentrations in the 0–200-m layer ranged from 0.1 to 10.1 μmol/L, with a mean value of 1.6 ± 1.4 μmol/L (Supplementary Figure S2c). Vertically, BSi concentrations initially rose with increasing depth before decreasing at a depth of 50m (Supplementary Figure S2c). Horizontally, high BSi values were mainly observed in the offshore waters south of the Cosmonaut Sea and at stations CD2–13 in the southwest, where sea ice had not yet fully melted (Figure 2d). The depth-integrated BSi concentration averaged 1.0 ± 0.5 mmol/m2, with a range of 0.5 to 2.7 mmol/m2 (Figure 4c), exhibiting a spatial pattern opposite to that of SIC%. Low values were detected in the southwestern nearshore area where sea ice persisted, while higher values appeared near the ice edge in Enderby Land.
The concentrations of Chl a in the 0–200-m layer ranged from 0.4 to 677.3 ng/L, with an average of 177.9 ± 171.2 ng/L (Supplementary Figure S2e). Chl a concentrations were positively correlated with POC (r = 0.59, p < 0.01) and BSi (r = 0.34, p < 0.01). High concentrations of Chl a were primarily found in the western ridge region of Enderby Land, with a spatial pattern of higher Chl a concentrations nearshore than offshore and a vertical distribution characterized by Chl a concentrations that initially increased with depth before decreasing. The integrated Chl a concentration averaged 30.1 ± 6.9 mg/m2, ranging from 19.6 to 47.1 mg/m2 (Figure 4d), with the highest values detected in the western Enderby Land ridge area.
4 Discussion
4.1 Spatial patterns of phytoplankton and organic carbon pools
Dominant phytoplankton species in the Cosmonaut Sea displayed clear spatial variability. The major groups comprised diatoms (38% ± 16%), dinoflagellates (22% ± 12%), and P. antarctica (12% ± 10%) (Figure 5; Supplementary Figure S3), with the Diat-A (25%) subgroup being the most prevalent. Horizontally, the Diat-A subgroup, which is adapted to polar cold-water conditions (Pančić et al., 2015), was abundant in the southwestern nearshore, peaking at station C7–07 in the eastern coastal section of Enderby Land (Figure 5a), which features low temperature (mean 0.18°C), the highest PAR (26.22 E m−2 day−1), and the shallowest MLD (15.7m) in the study area (Figures 2a–c). In contrast, the Diat-B subgroup (mainly Pseudo-nitzschia) was more abundant offshore (Figure 5c), reflecting its adaptation to higher SST in the open ocean (Zhu et al., 2017). Dinoflagellates, the second most abundant group (Figure 5b), displayed a significant positive correlation with the MLD (r = 0.59, p < 0.05; Figure 3), which was consistent with the ability of dinoflagellates to adjust photosynthetic pigment composition in deeper, low-light mixed layers (Carvalho, 2017; Anschütz et al., 2022) coupled with the reduced grazing pressure and interspecific competition in deeper MLDs (Feng et al., 2022a). P. antarctica was mainly found in regions influenced by the upwelling of the modified CDW (Figure 5d; Supplementary Figure S4), thriving under strong mixing (Van Leeuwe et al., 2020) and fluctuating light (Henley et al., 2017). Moreover, according to Henley et al. (2017), the cellular N/P of P. antarctica (ranging from approximately 9 to 13) closely matches the CDW (N/P of approximately 12–13), enabling P. antarctica to efficiently utilize micronutrients (Zn, Cd, and Fe) supplied by CDW upwelling (Henley et al., 2017; Tian et al., 2023).
Figure 5
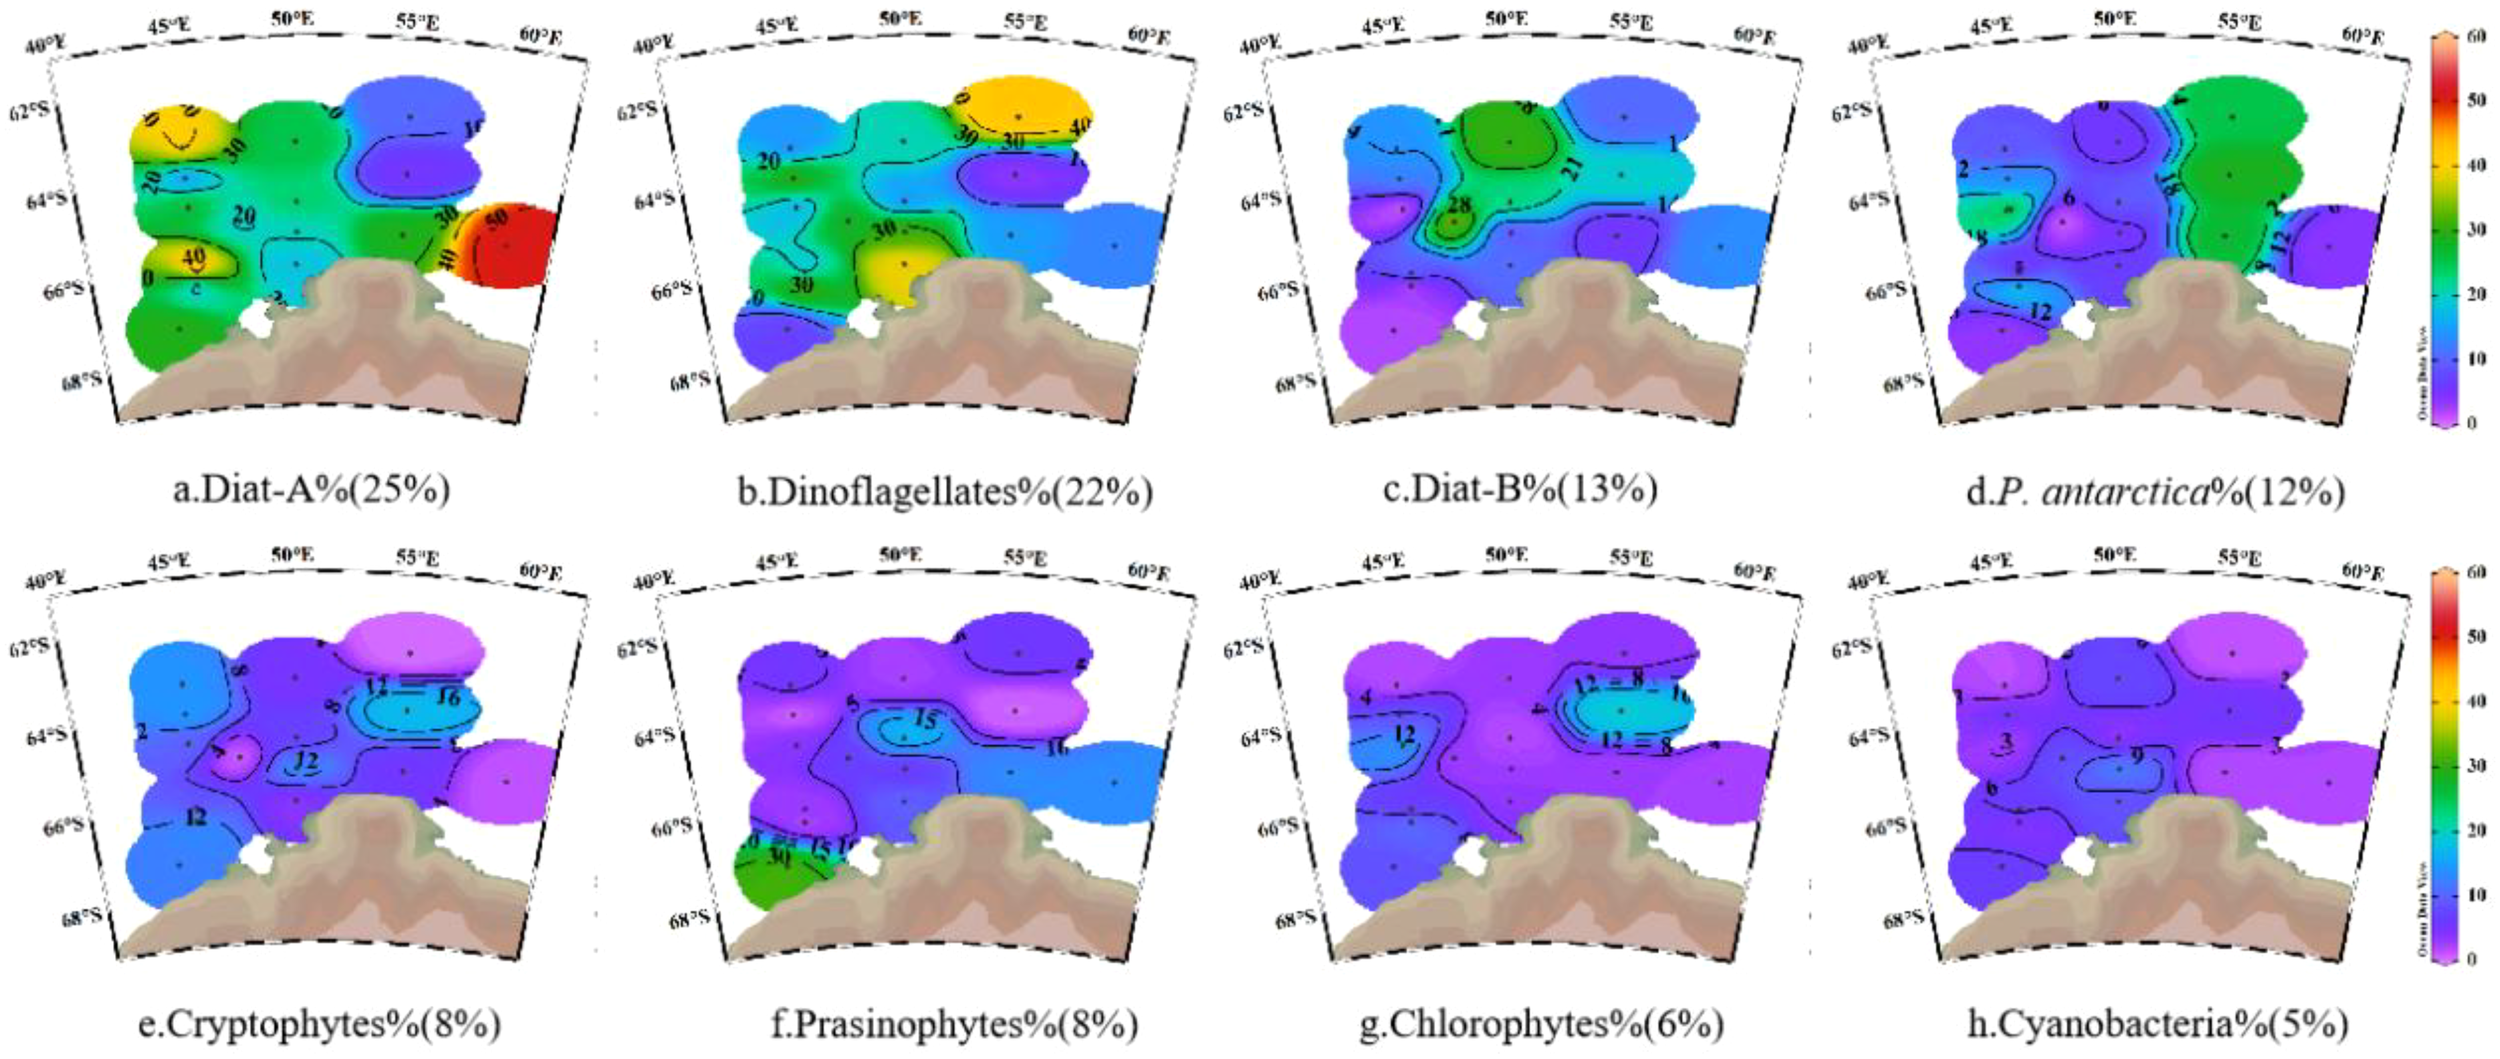
Spatial variation in phytoplankton taxonomic composition in the Cosmonaut Sea. (a) Diat-A%; (b) Dinoflagellates%; (c) Diat-B%; (d) P. antarctica%; (e) Cryptophytes%; (f) Prasinophytes%; (g) Chlorophytes%; (h) Cyanobacteria%. Diat-A, a group of large-celled cold-water diatoms; Diat-B, a group of small pelagic diatoms; P. antarctica, Phaeocystis antarctica.
A significant positive correlation was observed between organic carbon content and dominant phytoplankton groups, highlighting the central role of the phytoplankton community in regulating the Cosmonaut Sea organic carbon pool. Diatom crops were strongly correlated with the concentrations of both POC and BSi in the 0–200-m water column (r = 0.36, p < 0.01; r = 0.29, p < 0.01), underscoring the major contribution of diatoms to the POC pool. This phenomenon is consistent with previous reports that diatoms dominate Southern Ocean POC production, contributing approximately 40% of primary production and significantly influencing the POC pool (Tréguer et al., 2018; Misic et al., 2024). This is attributed to the secretion of sticky exopolysaccharides by diatoms and the protective role of their siliceous frustules in the preservation of organic matter (Tréguer et al., 2018; Blain et al., 2021). In contrast, the P. antarctica crop was significantly positively correlated with the depth-integrated DOC concentration (r = 0.69, p < 0.01; Figure 3), reflecting a strong effect on the DOC pool in the Cosmonaut Sea. This aligns with findings of elevated DOC following P. antarctica blooms in other Antarctic regions (Kim et al., 2022, 2023), likely due to exopolysaccharide release during colony formation and post-bloom cell lysis (Marchant et al., 1991; Kwon et al., 2021).
In summary, our findings indicate that diatoms represent a significant contributor to POC. Specifically, Diat-A dominates in cold, high-irradiance, and shallow mixed-layer regions, whereas Diatom-B is prevalent in warmer environments. In contrast, P. antarctica contributes primarily to DOC pools and exhibits a preference for CDW habitats, likely attributable to the close alignment between its cellular N/P ratio and that of the CDW.
4.2 Seasonal succession of the phytoplankton community in the Cosmonaut Sea
We integrated historical survey data with our expedition results to construct a conceptual diagram illustrating the seasonal succession of phytoplankton communities in the Cosmonaut Sea (Figure 6a). During austral autumn (March–May), sea ice expands north and diatoms dominate at the ice edge, as indicated by high POC and BSi inventories (Smith and Nelson, 1990). During winter (June–August), when sea ice cover peaks, Chaetoceros (a diatom genus) prevails in shallow mixed layers, while P. antarctica dominates in deeper mixed layers, except within sea ice (Spiridonov et al., 1996). During spring (September–November), shallower MLDs and cold, fresh meltwater favor large diatoms and other >10-μm phytoplankton at the ice edge (accounting for 42%), while picophytoplankton (<2 μm) contribute 50%–61% of the total Chl a in offshore deep layers (MLDs > 200m; Fiala et al., 2002). During summer (December–February), continuous sea ice melt introduces nutrient-rich, lower-salinity water, and the combination of shallower mixed layers and higher PAR drives intense phytoplankton blooms co-dominated by diatoms and P. antarctica (Wright et al., 2010; Figure 6b). Li et al. (2024) showed that P. antarctica (45%) and diatoms (31%, with the contribution of Diat-A being four times that of Diat-B) dominated in January 2021, while our February 2024 data revealed that diatoms (38%, with the contribution of Diat-A twice that of Diat-B) and dinoflagellates (22%) predominated. Overall, seasonal succession in the Cosmonaut Sea mirrors that of the West Antarctic Peninsula (Nardelli et al., 2023). Sea ice algae initiate the spring diatom bloom; diatoms and P. antarctica co-dominate during summer; nutrient depletion and mixed layer deepening in late summer to autumn favor mixed flagellates and small diatoms, with diatoms maintaining autumnal dominance (Figure 6a).
Figure 6
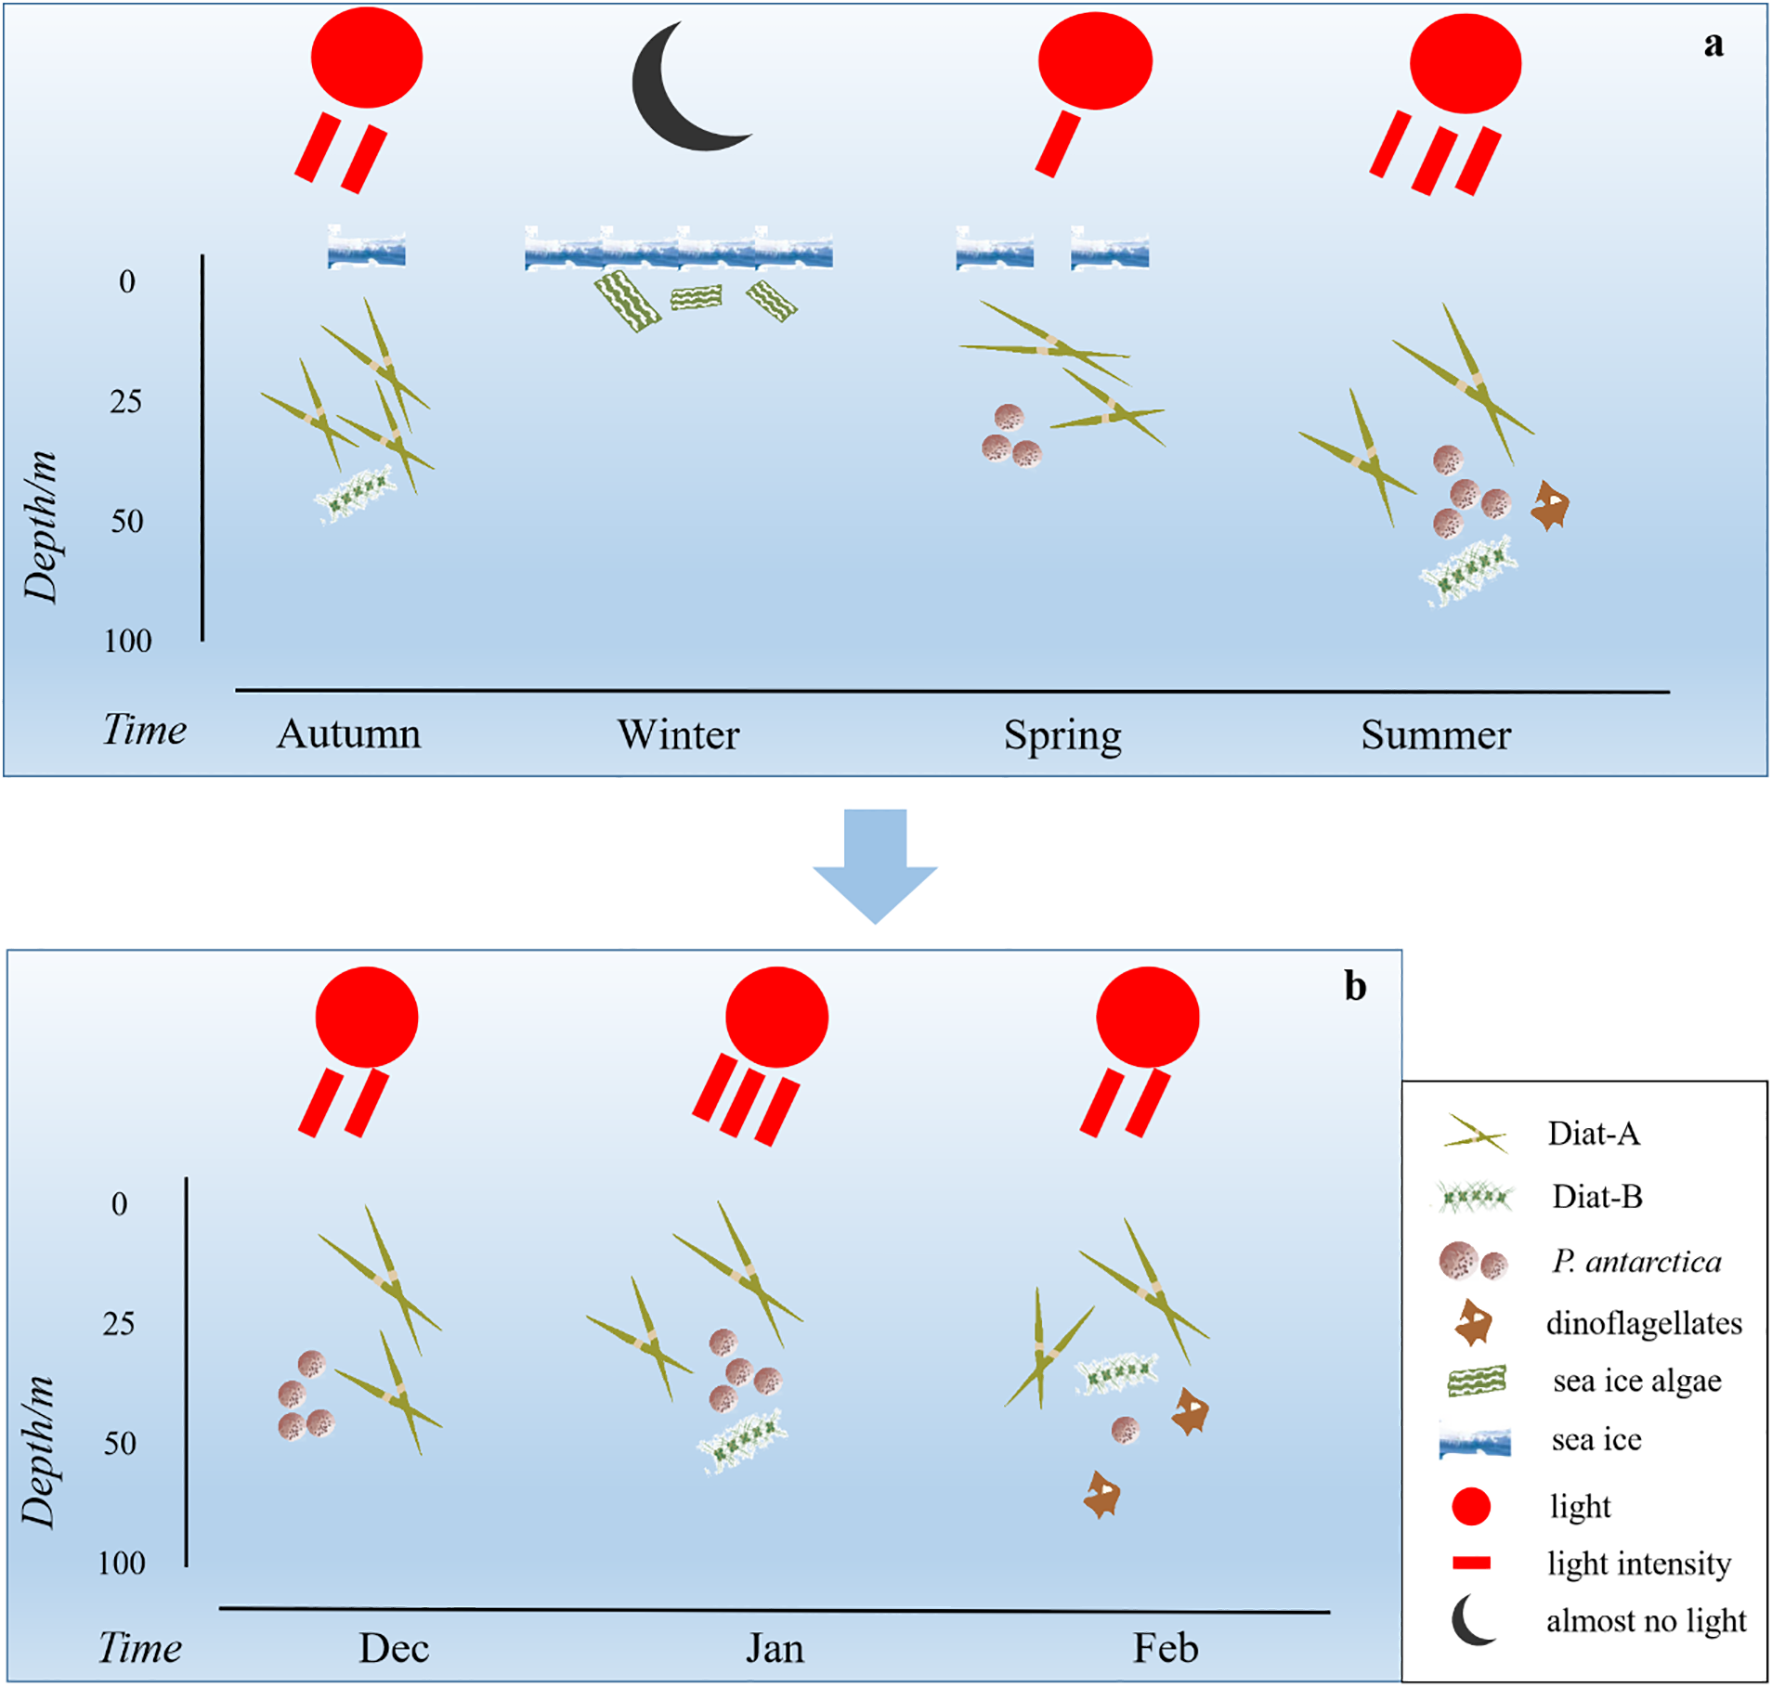
Schematic model of dominant phytoplankton functional groups in the Cosmonaut Sea. (a) Autumn (Smith and Nelson, 1990), winter (Spiridonov et al., 1996), spring (Fiala et al., 2002), and summer (Wright et al., 2010). (b) December (unpublished), January (Li et al., 2024), and February (this study). Diat-A, a group of large-celled cold-water diatoms; Diat-B, a group of small pelagic diatoms; P. antarctica, Phaeocystis antarctica.
In this study, shifts in dominant phytoplankton groups during the austral summer in the Cosmonaut Sea were mainly driven by nutrient limitation and sea ice dynamics. First, due to the spring seeding effect from sea ice algae and rapid growth in the early summer, nutrient levels—especially silicate—were depleted by February (Blain et al., 2002; Nardelli et al., 2023), favoring mixotrophic dinoflagellates and Diat-B, which are better adapted to low silicate availability (Kang and Fryxell, 1992; Jeong et al., 2012; Ruggiero et al., 2024). Second, most of the region, except southwestern Enderby Land, was characterized by low SIC%, with only stations C4–12 having SIC% > 40% (Figure 2d), resulting in low dissolved iron (dFe) levels (0.09–0.33 nM, late January to February; Blain et al., 2002). Under such low iron conditions, P. antarctica was unable to maintain the Hapt-HiFe morphotype, leading to a >300% decrease in biomass compared to that in January 2021 (Figure 7c), with Hapt-LoFe becoming dominant (DiTullio et al., 2007; Henley et al., 2017; Bender et al., 2018; Van Leeuwe et al., 2020). Concurrently, sea ice retreat led to surface warming (by 1–2 °C; Figure 2e) in the northern open ocean, which enhanced the competitive advantage of Diat-B (mainly Pseudo-nitzschia) and favored the increase of Diat-B with deepening mixed layers (Sun et al., 2003; Mendes et al., 2013; Pančić et al., 2015; Zhu et al., 2017; Morioka and Behera, 2021). Thus, the following succession patterns were observed in the Cosmonaut Sea during February: Diat-A remained a major dominant group but lost some competitive advantage due to surface warming, silicate depletion, and deeper MLD, while the broader ecological tolerance and higher silicate utilization of Diat-B led to nearly a twofold increase in its biomass relative to that in January 2021 (Figure 7b); under nutrient-limited conditions, the biomass of small mixotrophic dinoflagellates increased significantly; finally, low dFe resulted in a marked decline in P. antarctica biomass, with a reduced abundance of the Hapt-HiFe morphotype.
Figure 7
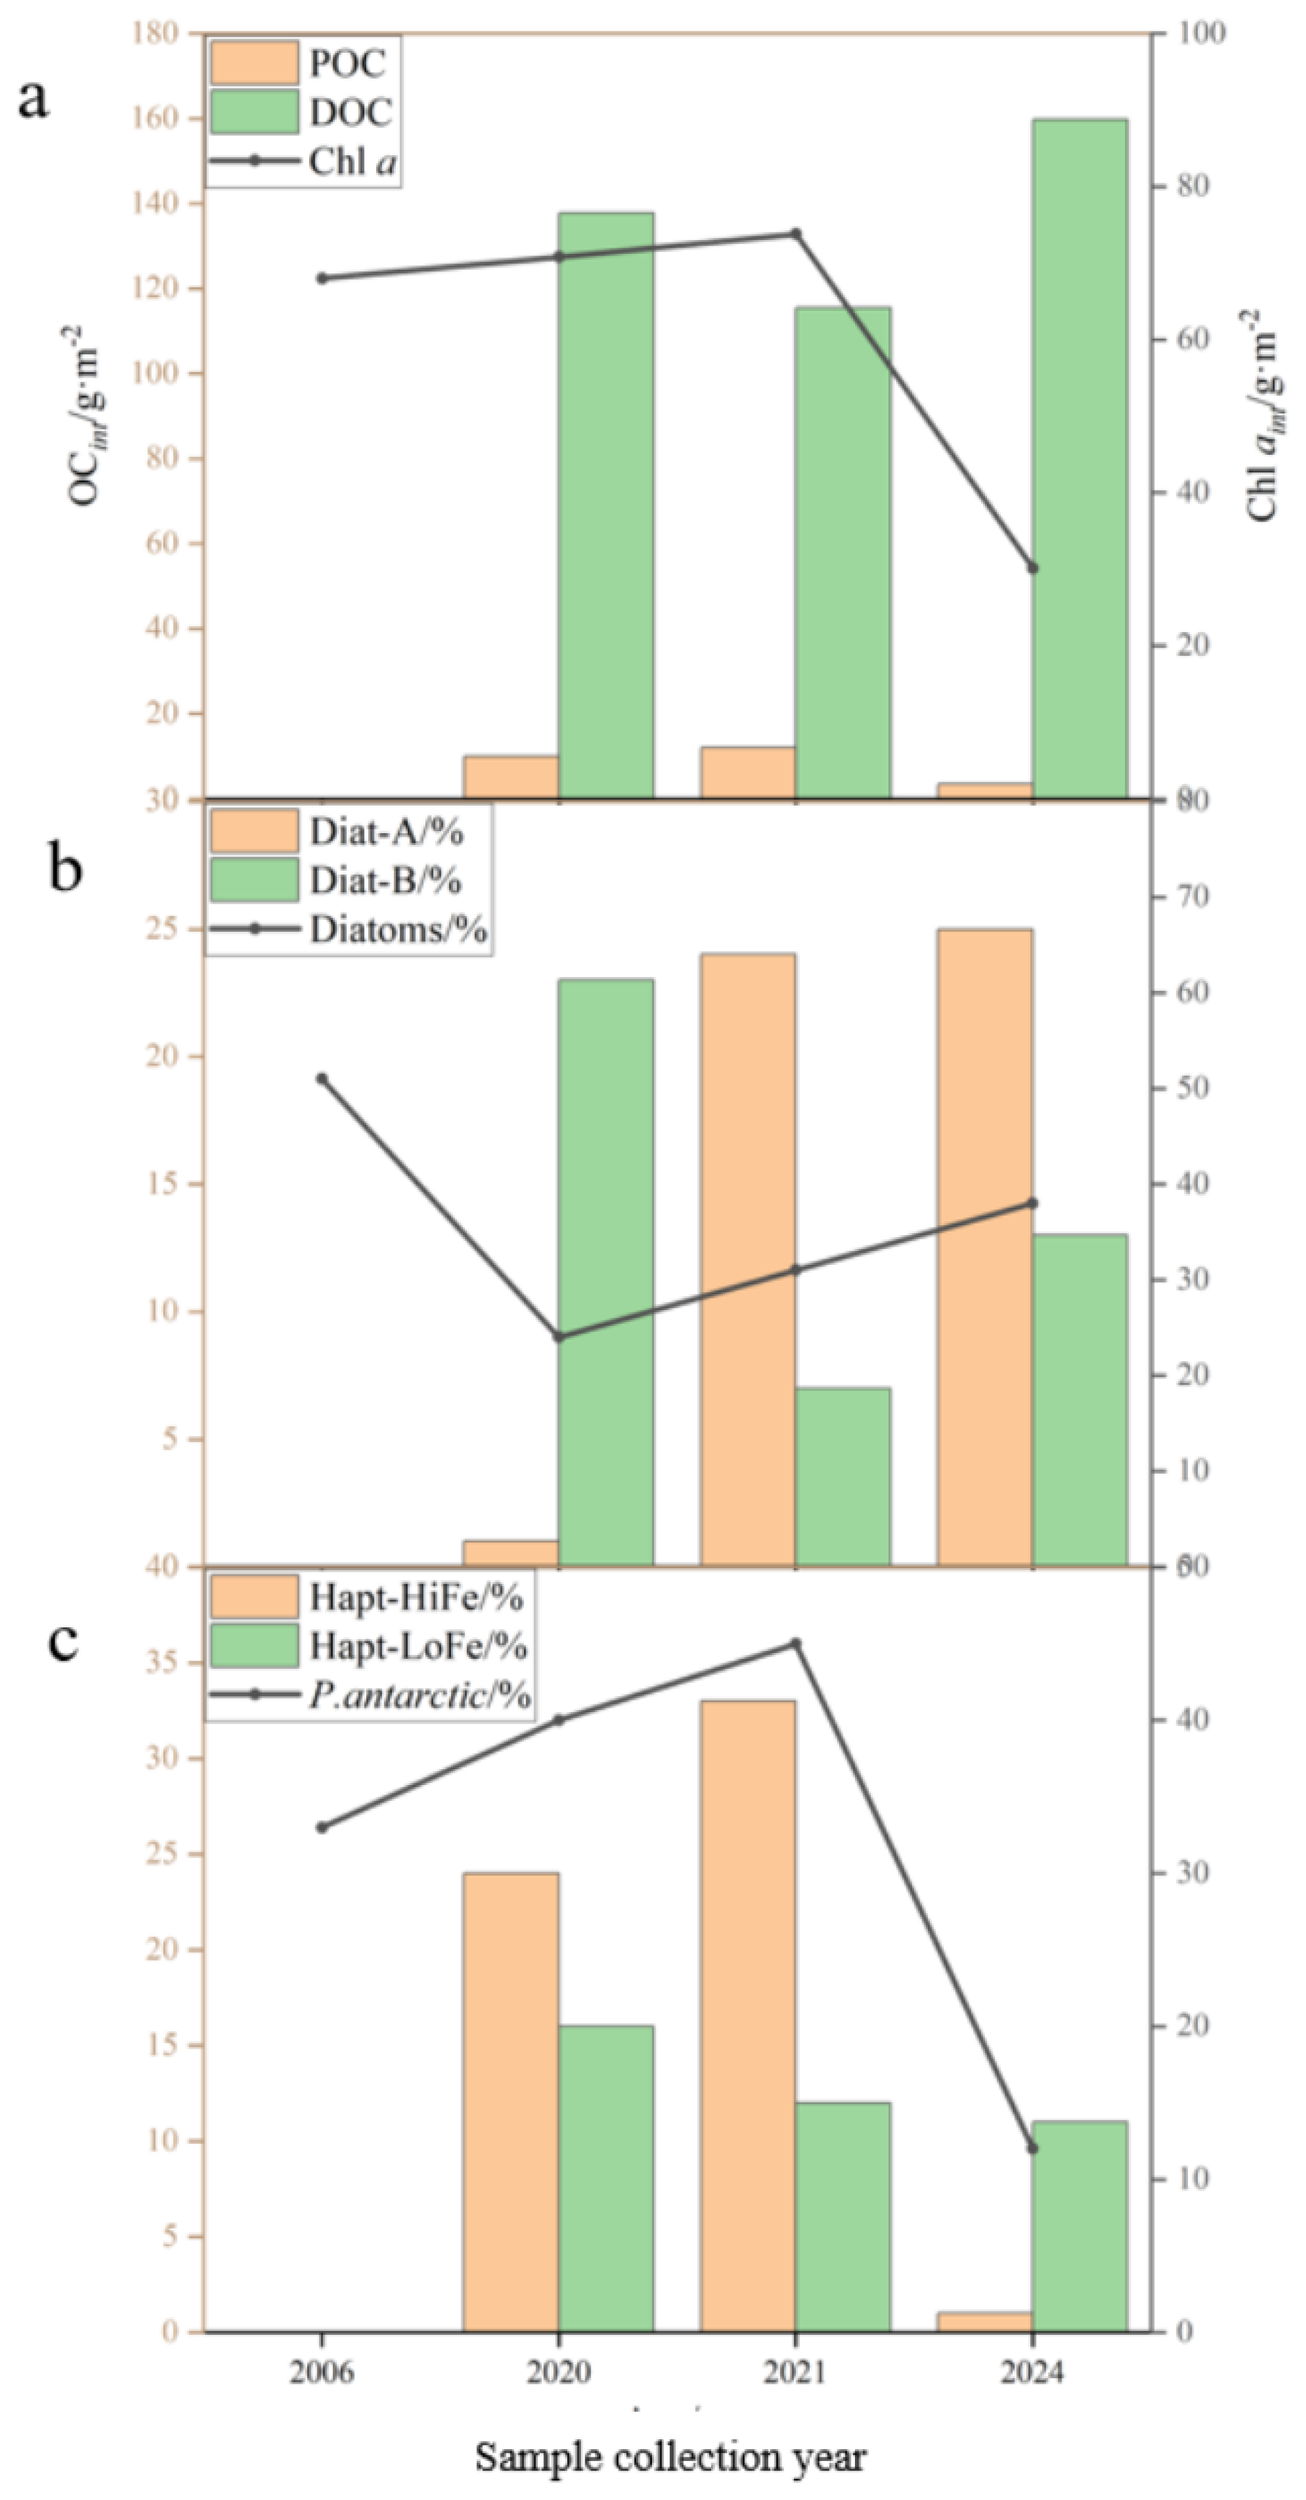
Historical depth-integrated concentrations of total organic carbon, chlorophyll a, and dominant phytoplankton functional groups in the Cosmonaut Sea. Data were obtained from the years 2006 (Wright et al., 2010), 2020 (unpublished), 2021 (Li et al., 2024), and 2024 (this study). (a) Phytoplankton production interannual variability, (b) diatom interannual variability, and (c)Phaeocystis antarctica interannual variability. OCint, including depth-integrated particulate organic carbon (POC) and depth-integrated dissolved organic carbon (DOC); Chl aint, depth-integrated chlorophyll a; Diat-A, a group of large-celled cold-water diatoms; Diat-B, a group of small pelagic diatoms; P. antarctica, Phaeocystis antarctica [distinguished as high-iron (Hapt-HiFe) and low-iron (Hapt-LoFe) ecotypes].
4.3 Comparative analysis of phytoplankton distribution across Antarctic marginal seas
Significant shifts in sea ice, stratification, and light conditions cause the late summer Southern Ocean water column to differ markedly compared to the water column during spring and early summer, resulting in substantial changes in phytoplankton communities and BCP dynamics. Understanding succession mechanisms during this period is key to clarifying BCP behavior. Therefore, this study collected and integrated historical data and recent observations to compare the late-summer spatial patterns and environmental drivers of phytoplankton across ecological hotspots, including the Cosmonaut Sea, Prydz Bay, Ross Sea, Amundsen Sea, and Antarctic Peninsula, along with its adjacent seas (Figure 8). Nevertheless, we must acknowledge that the available data for comparison are limited, as our sampling period was constrained to February–March. In the absence of observational data from the Eastern Antarctic Peninsula during February–March, we selected the Weddell Sea—adjacent to the Cosmonaut Sea—to serve as a surrogate for the eastern region of the Antarctic Peninsula. February datasets from Antarctic marginal seas were compiled from years other than 2024 (the year of our study), thereby introducing potential interannual variability.
Figure 8
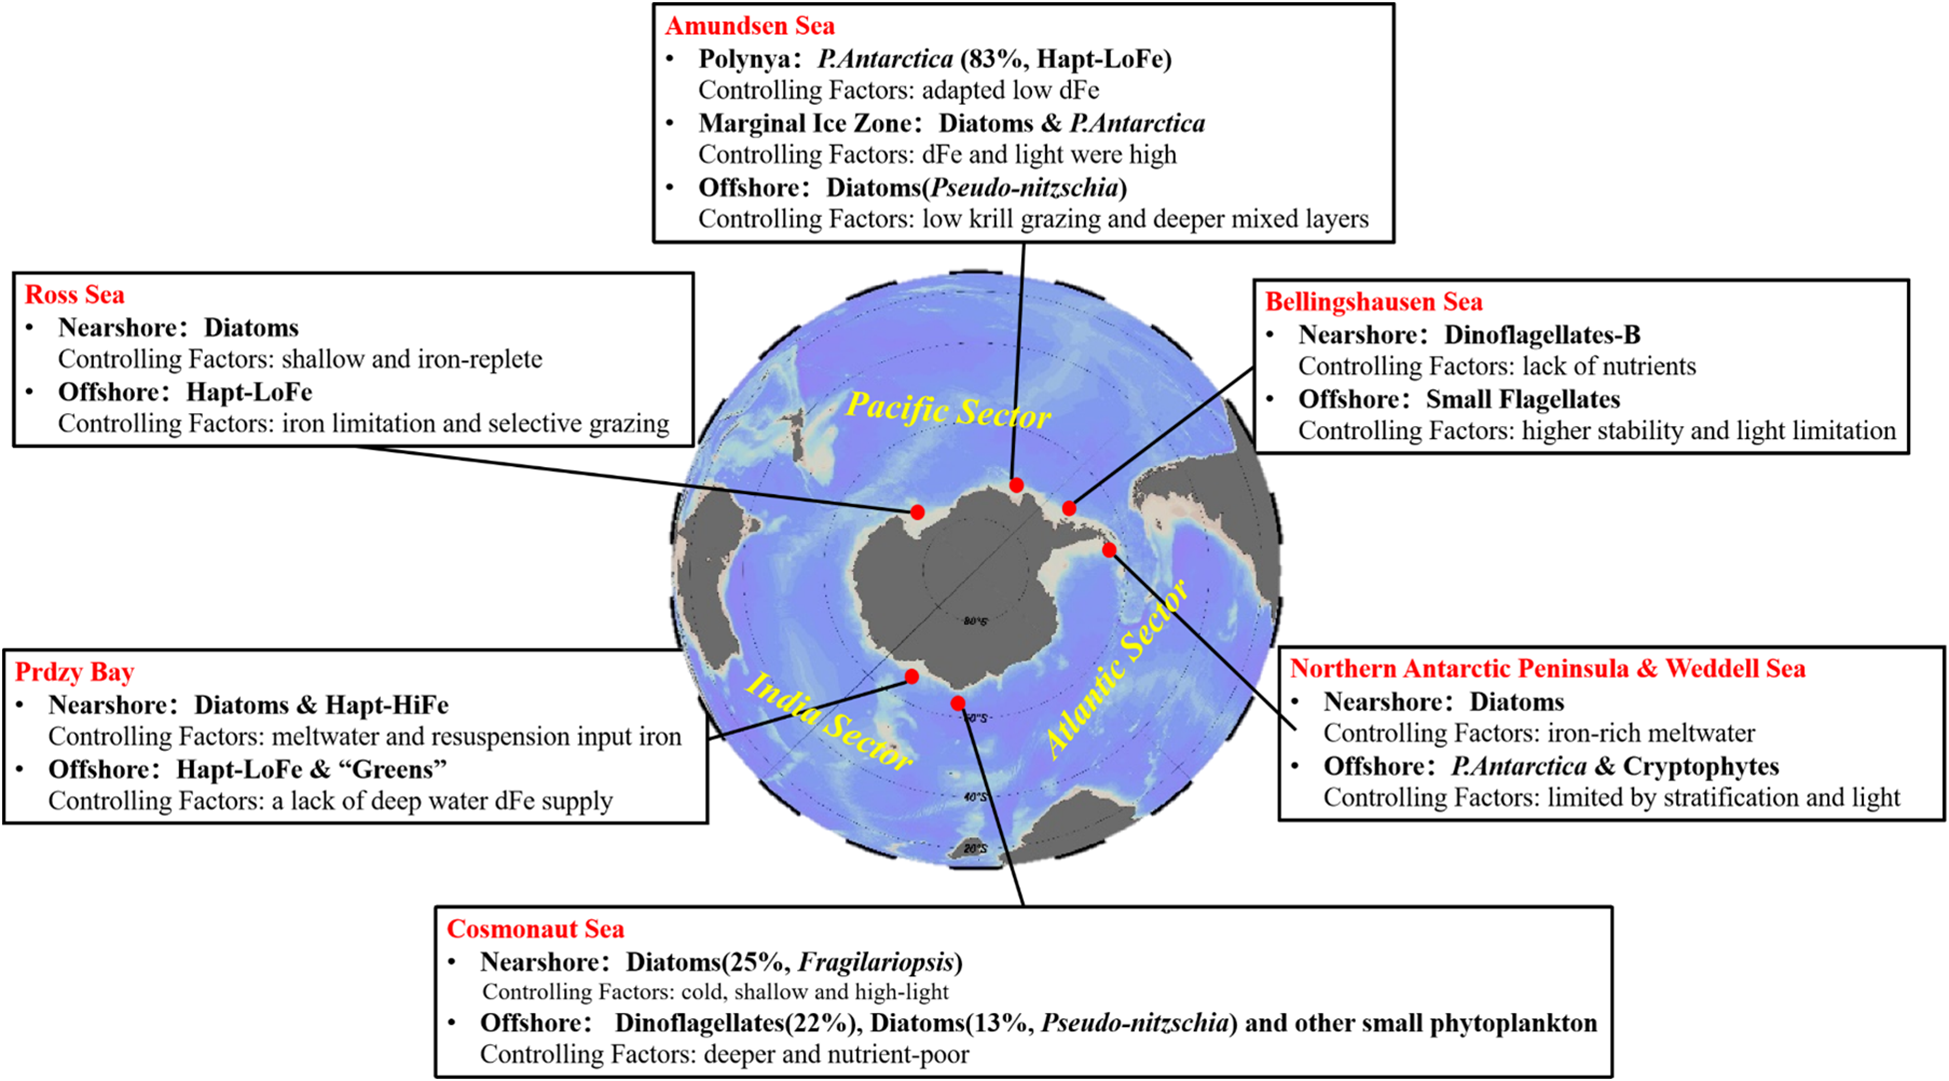
Dominant phytoplankton functional groups in typical Antarctic seas during late summer (i.e., February). Highlighted regions include the Cosmonaut Sea (this study), Prydz Bay (Heidemann et al., 2024), Ross Sea (Jo et al., 2021), Amundsen Sea (Alderkamp et al., 2012), Antarctic Peninsula, Weddell Sea (Mendes et al., 2012), and Bellingshausen Sea (Costa et al., 2020). P. antarctica, Phaeocystis antarctica [distinguished as high-iron (Hapt-HiFe) and low-iron (Hapt-LoFe) ecotypes]; “greens”, chlorophytes and prasinophytes (Heidemann et al., 2024); dFe, dissolved iron.
In late February, Cosmonaut Sea phytoplankton were dominated by diatoms (38%) and dinoflagellates (22%) (Figure 5; Supplementary Figure S3). The Diat-A subgroup thrived in cold, shallow, high-light nearshore waters, while Diat-B and dinoflagellates gained an edge in deeper, nutrient-poor offshore areas. Diatoms, P. antarctica, and green algae dominated in the Prydz Bay. In the nearshore continental shelf waters, glacial melt, ice shelf disintegration, and sediment resuspension enhance dFe inputs, favoring the Hapt-HiFe form of P. antarctica and diatom growth, whereas a lack of deep water dFe supply in the open ocean favors “greens” (including chlorophytes and prasinophytes) and Hapt-LoFe (Heidemann et al., 2024). Similarly, the results showed that diatoms and P. antarctica dominated in West Antarctic marginal seas, especially in the Ross Sea (together accounting for 99.6% of the total phytoplankton biomass), with diatoms abundant in shallow, iron-replete coastal waters and Hapt-LoFe P. antarctica prevailing offshore due to iron limitation and selective grazing (Jo et al., 2021). For example, in the northern open waters of the Ross Sea, where krill super-swarms selectively graze on diatoms, a lower Si:N ratio (5.1) along with evident iron limitation promotes the dominance of single-celled Hapt-LoFe P. antarctica (Jo et al., 2021). The ice edge region of the Amundsen Sea features mixed blooms of diatoms and P. antarctica where dFe and light are high. In the Pine Island polynya and Amundsen Sea polynya, P. antarctica (83% ± 14%) dominates, particularly the Fe-stress-adapted Hapt-LoFe form, while small diatoms (Pseudo-nitzschia) prevail in open waters with low krill grazing and deeper mixed layers (Alderkamp et al., 2012). Moreover, in the Antarctic Peninsula and its adjacent seas, such as the Weddell Sea, diatoms, cryptophytes, and P. antarctica predominate, supported by iron-rich meltwater in the nearshore zones but limited by stratification and light in open waters, where conditions favor small phytoplankton (Mendes et al., 2012; Alcamán-Arias et al., 2018). Differently, in the nearshore zones of the Bellingshausen Sea, the massive input of ice-melt water gives rise to a highly stable thin layer that impedes vertical mixing and reduces the upward flow of nutrients toward the surface, resulting in a shift from diatoms to dinoflagellates (Costa et al., 2020).
Overall, similar phytoplankton spatial distribution patterns are evident across the marginal seas of the Southern Ocean during late February (Figure 9): 1) higher dFe in the nearshore waters due to melt and resuspension support diatoms (generally large forms such as Fragilariopsis) and Hapt-HiFe P. antarctica; 2) environmental pressure from zooplankton (e.g., krill) grazing enhances nearshore diatom dominance while promoting small diatoms such as Pseudo-nitzschia in offshore waters due to grazing selectivity (Xue and Zhu, 2021); and 3) as the MLD increases from the coast to the open ocean, the deeper MLD in offshore regions limits light and restricts vertical nutrient supply, enabling small phytoplankton with higher specific surface areas to better adapt to these conditions, while large diatoms thrive in shallower, well-lit nearshore waters (Peloquin and Smith, 2007). Furthermore, in the nearshore zones where diatoms and P. antarctica are the dominant species, the BCP is more efficient and contributes more significantly to the organic carbon pool; in the open ocean dominated by small phytoplankton, the microbial food web makes a larger contribution to the organic carbon pool, while the material and energy transfer efficiency is lower, resulting in a less efficient BCP.
Figure 9
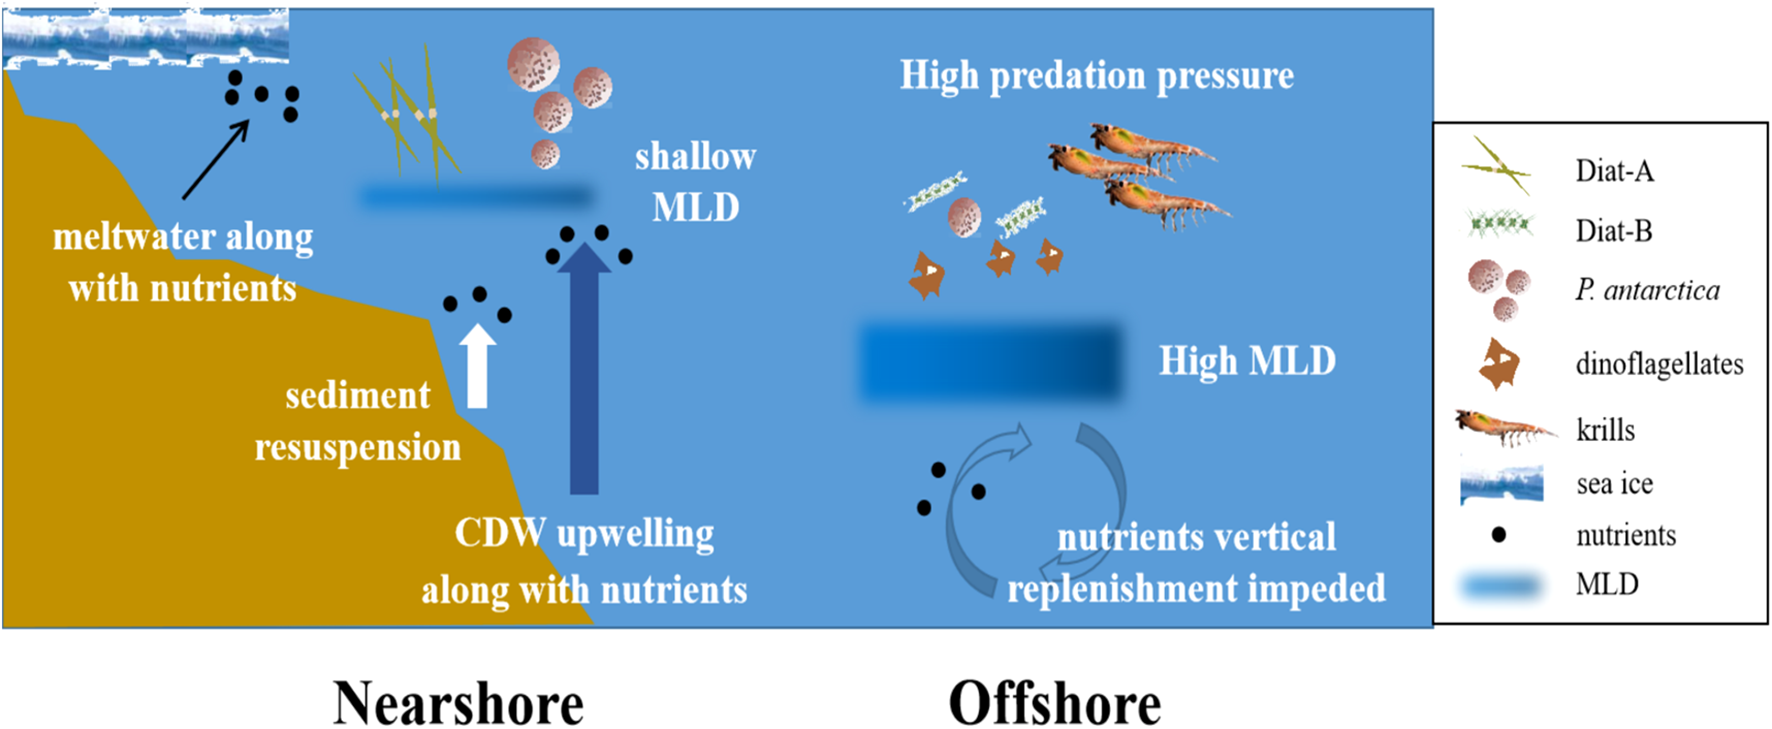
Schematic model potentially illustrating differences in phytoplankton community structure between coastal and offshore water environments. Diat-A, a group of large-celled cold-water diatoms; Diat-B, a group of small pelagic diatoms; MLD, mixed layer depth; CDW, Circumpolar Deep Water.
4.4 Ecological and biogeochemical implications of phytoplankton community shifts
Rising anthropogenic CO2 emissions have intensified stratospheric cooling and driven a positive SAM (pSAM), resulting in stronger, poleward-shifted Southern Hemisphere westerlies (Bitz and Polvani, 2012; Ludescher et al., 2019). However, the effects of the pSAM are zonally variable due to Antarctic asymmetry (Noh et al., 2021). For example, while the Amundsen Sea off West Antarctica experiences increased coastal SST and sea ice melt due to warm air and water intrusions (Zheng et al., 2025), East Antarctic regions such as the Cosmonaut Sea and Prydz Bay display intensified Ekman transport, reduced subsurface upwelling, and weakened oceanic heat transfer, promoting higher SIC% and lower SST (Zhang, 2007; Ludescher et al., 2019; Morioka and Behera, 2021; Noh et al., 2021). This positive feedback sustains pSAM conditions in the Cosmonaut Sea (Lovenduski et al., 2007).
These environmental changes profoundly reshape phytoplankton communities, carbon export, and BCP efficiency in the Cosmonaut Sea. Sea ice expansion and reduced CDW upwelling maintain low temperatures and restricted nutrient supply (Moore et al., 2018), partly contributing to significantly lower phytoplankton biomass (<50% of 2006 levels; Figure 7a). Ice-edge diatoms (Diat-A) decline due to light and nutrient limitations (Pančić et al., 2015), and even the small oceanic Diat-B subgroup loses its competitive advantage under cold, low-nutrient conditions; the results indicate that the diatom biomass has dropped by 200% compared to that in 2006 (Figure 7b). Although higher SIC% favors P. antarctica in low-light environments (Alderkamp et al., 2010), limited dFe availability due to weak upwelling reduces the Hapt-HiFe form of P. antarctica (Figure 7c). However, dinoflagellates persist in nutrient-poor settings via mixotrophy (Deshmukh et al., 2024).
Such phytoplankton shifts ripple through the food web and BCP. The declining abundance of diatoms, which are key for Antarctic krill, impacts krill biomass and thus top predators such as penguins and seals (Atkinson et al., 2004; Hunt et al., 2007). The proliferation of small autotrophs, such as P. antarctica, redirects the food web toward salp-dominated pathways, thereby reducing carbon export and siliceous pump (with a relatively high POC export) efficiency and ultimately weakening the BCP function (Murphy et al., 2007; Zhu et al., 2017). The dominance of small autotrophs favors microbial loop activity (Han et al., 2022), leading to the further retention of organic carbon and limiting energy transfer to higher trophic levels, thus reducing overall carbon sequestration in the Cosmonaut Sea.
5 Conclusion
This study reveals marked spatial and temporal heterogeneity in phytoplankton communities in the Cosmonaut Sea during late austral summer. The Diat-A subgroup dominated in cold, well-lit nearshore waters, while small Diat-B diatoms and dinoflagellates thrived in nutrient-poor, deeper mixed layers offshore. P. antarctica benefited from nutrients supplied by CDW upwelling. Diatoms provided the main contribution to the POC pool, whereas P. antarctica enhanced DOC through exopolymer release. Seasonally, phytoplankton followed a clear succession pattern from spring ice-algae seeding, to summer diatom and P. antarctica blooms, to the co-occurrence of diatoms and smaller taxa during autumn. Across the Southern Ocean during the late austral summer, environmental gradients also shaped distinct phytoplankton assemblages, as follows: meltwater-enriched, iron-rich nearshore waters with low SST, shallow mixing, abundant light, and low krill grazing favored large diatoms and Hapt-HiFe P. antarctica, while the nutrient-poor deeper mixed layers in the open ocean supported smaller phytoplankton with a high specific surface area. In the Cosmonaut Sea, future pSAM-driven changes, such as expanding sea ice, reduced upwelling, and declining nutrients may reduce the abundance of diatoms and favor smaller phytoplankton, risking diminished BCP efficiency and carbon sequestration. Overall, this study fills an important observational gap, clarifies dominant species transitions, and advances the understanding of seasonal ecosystem and carbon cycling responses in the Southern Ocean.
Statements
Data availability statement
The original contributions presented in the study are included in the article/Supplementary Material. Further inquiries can be directed to the corresponding authors.
Author contributions
GW: Formal analysis, Software, Writing – original draft. DL: Conceptualization, Supervision, Visualization, Writing – review & editing. JZ: Project administration, Resources, Writing – review & editing. JP: Supervision, Visualization, Writing – review & editing. JH: Investigation, Methodology, Writing – review & editing. PY: Conceptualization, Resources, Writing – review & editing. WS: Data curation, Methodology, Software, Writing – review & editing. HZ: Formal analysis, Investigation, Resources, Writing – review & editing. CZ: Resources, Visualization, Writing – review & editing. CL: Methodology, Writing – review & editing.
Funding
The author(s) declare financial support was received for the research and/or publication of this article. This study was supported by the Ministry of Natural Resources and the Chinese Arctic and Antarctic Administration. Financial support was provided by the National Natural Science Foundation of China (Grant Nos. 42176227, 42276255, 42076243, 41976228, and 41976227), the “Impact and Response of Antarctic Seas to Climate Change” National Polar Special Program (Grant Nos. IRASCC 01-01–02 and IRASCC 02-02), and the Key International Cooperation Project of the Ministry of Science and Technology (Grant No. 2022YFE0136500).
Acknowledgments
The authors gratefully acknowledge the crew of the R/V Xuelong for their assistance with sample collection and the Physical Ocean Group for providing hydrological data.
Conflict of interest
The authors declare that the research was conducted in the absence of any commercial or financial relationships that could be construed as a potential conflict of interest.
Generative AI statement
The author(s) declare that no Generative AI was used in the creation of this manuscript.
Any alternative text (alt text) provided alongside figures in this article has been generated by Frontiers with the support of artificial intelligence and reasonable efforts have been made to ensure accuracy, including review by the authors wherever possible. If you identify any issues, please contact us.
Publisher’s note
All claims expressed in this article are solely those of the authors and do not necessarily represent those of their affiliated organizations, or those of the publisher, the editors and the reviewers. Any product that may be evaluated in this article, or claim that may be made by its manufacturer, is not guaranteed or endorsed by the publisher.
Supplementary material
The Supplementary Material for this article can be found online at: https://www.frontiersin.org/articles/10.3389/fmars.2025.1669264/full#supplementary-material
References
1
Alcamán-Arias M. E. Farías L. Verdugo J. Alarcon-Schumacher T. Díez B. (2018). Microbial activity during a coastal phytoplankton bloom on the Western Antarctic Peninsula in late summer. FEMS Microbiol. Lett.365, fny090. doi: 10.1093/femsle/fny090
2
Alderkamp A.-C. de Baar H. J. W. Visser R. J. W. Arrigo K. R. (2010). Can photoinhibition control phytoplankton abundance in deeply mixed water columns of the Southern Ocean? Limnology Oceanography55, 1248–1264. doi: 10.4319/lo.2010.55.3.1248
3
Alderkamp A.-C. Mills M. M. van Dijken G. L. Laan P. Thuroczy C.-E. Gerringa L. J. et al . (2012). Iron from melting glaciers fuels phytoplankton blooms in the Amundsen Sea (Southern Ocean): Phytoplankton characteristics and productivity. Deep Sea Res. Part II: Topical Stud. Oceanography71, 32–48. doi: 10.1016/j.dsr2.2012.03.005
4
Alderkamp A.-C. Van Dijken G. L. Lowry K. E. Connelly T. L. Lagerström M. Sherrell R. M. et al . (2015). Fe availability drives phytoplankton photosynthesis rates during spring bloom in the Amundsen Sea Polynya, Antarctica. Elementa3, 43. doi: 10.12952/journal.elementa.000043
5
Alderkamp A.-C. Van Dijken G. L. Lowry K. E. Lewis K. M. Joy-Warren H. L. van De Poll W. et al . (2019). Effects of iron and light availability on phytoplankton photosynthetic properties in the Ross Sea. Mar. Ecol. Prog. Ser.621, 33–50. doi: 10.3354/meps13000
6
Anschütz A.-A. Flynn K. J. Mitra A. (2022). Acquired phototrophy and its implications for bloom dynamics of the Teleaulax-Mesodinium-Dinophysis-complex. Front. Mar. Sci.8. doi: 10.3389/fmars.2021.799358
7
Atkinson A. Siegel V. Pakhomov E. Rothery P. (2004). Long-term decline in krill stock and increase in salps within the Southern Ocean. Nature432, 100–103. doi: 10.1038/nature02996
8
Bazzani E. Lauritano C. Saggiomo M. (2023). Southern ocean iron limitation of primary production between past knowledge and future projections. J. Mar. Sci. Eng.11, 272. doi: 10.3390/jmse11020272
9
Bender S. J. Moran D. M. McIlvin M. R. Zheng H. McCrow J. P. Badger J. et al . (2018). Colony formation in Phaeocystis Antarctica: connecting molecular mechanisms with iron biogeochemistry. Biogeosciences15, 4923–4942. doi: 10.5194/bg-15-4923-2018,2018
10
Bitz C. Polvani L. (2012). Antarctic climate response to stratospheric ozone depletion in a fine resolution ocean climate model. Geophysical Res. Lett.39, L20705. doi: 10.1029/2012GL053393
11
Blain S. Rembauville M. Crispi O. Obernosterer I. (2021). Synchronized autonomous sampling reveals coupled pulses of biomass and export of morphologically different diatoms in the Southern Ocean. Limnology Oceanography66, 753–764. doi: 10.1002/lno.11638
12
Blain S. Sedwick P. Griffiths F. Queguiner B. Bucciarelli E. Fiala M. et al . (2002). Quantification of algal iron requirements in the Subantarctic Southern Ocean (Indian sector). Deep Sea Res. Part II: Topical Stud. Oceanography49, 3255–3273. doi: 10.1016/S0967-0645(02)00082-6
13
Carvalho A. F. M. (2017). Coupled physical and phytoplankton dynamics in coastal Antarctica (Rutgers The State University of New Jersey, School of Graduate Studies). doi: 10.7282/T30G3P1S
14
Costa R. R. Mendes C. R. B. Tavano V. M. Dotto T. S. Kerr R. Monteiro T. et al . (2020). Dynamics of an intense diatom bloom in the Northern Antarctic Peninsula, February 2016. Limnology Oceanography65, 2056–2075. doi: 10.1002/lno.11437
15
Deppeler S. L. Davidson A. T. (2017). Southern Ocean phytoplankton in a changing climate. Front. Mar. Sci.4, 40. doi: 10.1016/j.jplph.2016.05.004
16
Deshmukh P. D. George J. V. Naik R. K. Patil S. M. Soares M. A. Bhadran A. et al . (2024). Phytoplankton community structure during the melting phase of the land-fast ice in Prydz Bay, east Antarctica. Polar Sci.40, 101046. doi: 10.1016/j.polar.2024.101046
17
DiTullio G. Garcia N. Riseman S. Sedwick P. (2007). Effects of iron concentration on pigment composition in Phaeocystis Antarctica grown at low irradiance. Biogeochemistry83, 71–81. doi: 10.1007/s10533-007-9080-8
18
Fan L. Chen M. Yang Z. Zheng M. Qiu Y. (2024). Alleviated photoinhibition on nitrification in the Indian Sector of the Southern Ocean. Acta Oceanologica Sin.43, 52–69. doi: 10.1007/s13131-024-2379-7
19
Feng Y. (2022). Pigment composition of phytoplankton in marginal seas of the Antarctic Ocean and its implications (Hangzhou (ZJ: Second Institute Of Oceanography, MNR).
20
Feng Y. Li D. Zhao J. (2022a). Effects of sea ice melt water input on phytoplankton biomass and community structure in the eastern Amundsen Sea. Adv. Polar Sci.33, 14–27. doi: 10.13679/j.advps.2021.0017
21
Feng Y. Li D. Zhao J. Han Z. Pan J. Fan G. et al . (2022b). Environmental drivers of phytoplankton crops and taxonomic composition in northeastern Antarctic Peninsula adjacent sea area. Acta Oceanologica Sin.41, 99–117. doi: 10.1007/s13131-021-1865-4
22
Fiala M. MaChado M.-C. Oriol L. (2002). Phytoplankton distribution in the Indian sector of the Southern Ocean during spring. Deep Sea Res. Part II: Topical Stud. Oceanography49, 1867–1880. doi: 10.1016/S0967-0645(02)00016-4
23
Frölicher T. L. Sarmiento J. L. Paynter D. J. Dunne J. P. Krasting J. P. Winton M. (2015). Dominance of the Southern Ocean in anthropogenic carbon and heat uptake in CMIP5 models. J. Climate28, 862–886. doi: 10.1175/JCLI-D-14-00117.1
24
General Administration of Quality Supervision, Inspection and Quarantine of the People’s Republic of China and Standardization Administration of China (2007). Specifications for oceanographic survey – Part 4: Survey of chemical parameters in sea water: GB/T 12763.4―2007 (Beijing: Standards Press of China).
25
Grasshoff K. Kremling K. Ehrhardt M. (2009). Methods of seawater analysis (John Wiley & Sons). doi: 10.1002/9783527613984.ch12
26
Han M. Cao S. Luo G. He J. Liang Y. Chen X. et al . (2022). Distributions of virio-and picoplankton and their relationships with ice-melting and upwelling in the Indian Ocean sector of East Antarctica. Deep Sea Res. Part II: Topical Stud. Oceanography197, 105044. doi: 10.1016/j.dsr2.2022.105044
27
Heidemann A. C. Westwood K. J. Foppert A. Wright S. W. Klocker A. Vives C. R. et al . (2024). Drivers of phytoplankton distribution, abundance and community composition off East Antarctica, from 55–80 E (CCAMLR Division 58.4. 2 East). Front. Mar. Sci.11. doi: 10.3389/fmars.2024.1454421
28
Henley S. F. Tuerena R. E. Annett A. L. Fallick A. E. Meredith M. P. Venables H. J. et al . (2017). Macronutrient supply, uptake and recycling in the coastal ocean of the west Antarctic Peninsula. Deep Sea Res. Part II: Topical Stud. Oceanography139, 58–76. doi: 10.1016/j.dsr2.2016.10.003
29
Hunt B. P. V. Pakhomov E. A. Trotsenko B. G. (2007). The macrozooplankton of the Cosmonaut Sea, east Antarctica (30°E–60°E), 1987–1990. Deep Sea Res. Part I Oceanographic Res. Papers54, 1042–1069. doi: 10.1016/j.dsr.2007.04.002
30
Jeong H. J. Yoo Y. D. Kang N. S. Lim A. S. Seong K. A. Lee S. Y. et al . (2012). Heterotrophic feeding as a newly identified survival strategy of the dinoflagellate Symbiodinium. Proc. Natl. Acad. Sci.109, 12604–12609. doi: 10.1073/pnas.1204302109
31
Jo N. La H. S. Kim J.-H. Kim K. Kim B. K. Kim M. J. et al . (2021). Different biochemical compositions of particulate organic matter driven by major phytoplankton communities in the northwestern Ross Sea. Front. Microbiol.12. doi: 10.3389/fmicb.2021.623600
32
Kang S.-H. Fryxell G. A. (1992). Fragilariopsis cylindrus (Grunow) Krieger: the most abundant diatom in water column assemblages of Antarctic marginal ice-edge zones. Polar Biol.12, 609–627. doi: 10.1007/BF00236984
33
Kang J. Hao Q. Cao S. Zhao J. Yang Z. Tang Z. et al . (2024). Stable carbon isotopic composition of particulate organic matter in the Cosmonaut and Cooperation Seas in summer. Prog. Oceanography229, 103363. doi: 10.1016/j.pocean.2024.103363
34
Kim B. Kim S.-H. Min J.-O. Lee Y. Jung J. Kim T.-W. et al . (2022). Bacterial metabolic response to change in phytoplankton communities and resultant effects on carbon cycles in the Amundsen Sea Polynya, Antarctica. Front. Mar. Sci.9. doi: 10.3389/fmars.2022.872052
35
Kim J. La H. S. Kim J.-H. Jo N. Lee J. Kim B. K. et al . (2023). Spatio-temporal variations in organic carbon composition driven by two different major phytoplankton communities in the Ross Sea, Antarctica. Sci. Total Environ.891, 164666. doi: 10.1016/j.scitotenv.2023.164666
36
Kwon Y. S. La H. S. Jung J. Lee S. H. Kim T. W. Kang H. W. et al . (2021). Exploring the roles of iron and irradiance in dynamics of diatoms and Phaeocystis in the Amundsen Sea continental shelf water. J. Geophysical Research: Oceans126, e2020JC016673. doi: 10.1029/2020JC016673
37
Li Y. (2024). The responses of biological pump processes to the spatio-temporal of phytoplankton biomass and community in the Cosmonaut Sea, Antarctica (Hangzhou (ZJ: Second Institute Of Oceanography, MNR).
38
Li H. Li B. Guo X. Xi Y. Chen C. (2024). An study on the change characteristics of summer hydrographic structure in the Cosmonaut Sea [in Chinese. Mar. Sci. Bull.43, 21–34. doi: 10.11840/j.issn.1001-6392.2024.01.002
39
Li D. Zhao J. Hu J. Pan J. He J. Sun Y. et al . (2025). Spatial dynamics of phytoplankton assemblages and organic carbon stock in the highly productive Amundsen Sea Polynya and adjacent seasonal ice zone. Acta Oceanologica Sin. 44, 1–20. doi: 10.1007/s13131-024-2458-9
40
Li Y. Zhao J. Li D. Pan J. He J. Hu J. et al . (2024). Factors controlling the phytoplankton crops, taxonomic composition, and particulate organic carbon stocks in the Cosmonaut Sea, East Antarctica. J. Oceanology Limnology42, 1895–1908. doi: 10.1007/s00343-024-3198-6
41
Lin S. Zhao L. Feng J. (2022). Predicted changes in the distribution of Antarctic krill in the Cosmonaut Sea under future climate change scenarios. Ecol. Indic.142, 109234. doi: 10.1016/j.ecolind.2022.109234
42
Lovenduski N. S. Gruber N. Doney S. C. Lima I. D. (2007). Enhanced CO2 outgassing in the Southern Ocean from a positive phase of the Southern Annular Mode. Global Biogeochemical Cycles21, GB2026. doi: 10.1029/2006GB002900
43
Ludescher J. Yuan N. Bunde A. (2019). Detecting the statistical significance of the trends in the Antarctic sea ice extent: an indication for a turning point. Climate dynamics53, 237–244. doi: 10.1007/s00382-018-4579-3
44
Marchant H. Davidson A. Kelly G. (1991). UV-B protecting compounds in the marine alga Phaeocystis pouchetii from Antarctica. Mar. Biol.109, 391–395. doi: 10.1007/BF01313504
45
Meijers A. Klocker A. Bindoff N. Williams G. Marsland S. (2010). The circulation and water masses of the Antarctic shelf and continental slope between 30 and 80∘ E. Deep Sea Res. Part II: Topical Stud. Oceanography57, 723–737. doi: 10.1016/j.dsr2.2009.04.019
46
Mendes C. R. B. de Souza M. S. Garcia V. M. T. Leal M. C. Brotas V. Garcia C. A. E. (2012). Dynamics of phytoplankton communities during late summer around the tip of the Antarctic Peninsula. Deep Sea Res. Part I: Oceanographic Res. Papers65, 1–14. doi: 10.1016/j.dsr.2012.03.002
47
Mendes C. R. B. Tavano V. M. Kerr R. Dotto T. S. Maximiano T. Secchi E. R. (2017). Impact of sea ice on the structure of phytoplankton communities in the northern Antarctic Peninsula[J]. Deep Sea Research Part II: Topical Studies in Oceanography. 149, 111-123. doi: 10.1016/j.dsr2.2017.12.003
48
Mendes C. R. B. Tavano V. M. Leal M. C. de Souza M. S. Brotas V. Garcia C. A. E. (2013). Shifts in the dominance between diatoms and cryptophytes during three late summers in the Bransfield Strait (Antarctic Peninsula). Polar Biol.36, 537–547. doi: 10.1007/s00300-012-1282-4
49
Misic C. Bolinesi F. Castellano M. Olivari E. Povero P. Fusco G. et al . (2024). Factors driving the bioavailability of particulate organic matter in the Ross Sea (Antarctica) during summer. Hydrobiologia851, 2657–2679. doi: 10.1007/s10750-024-05482-w
50
Moore J. K. Fu W. Primeau F. Britten G. L. Lindsay K. Long M. et al . (2018). Sustained climate warming drives declining marine biological productivity. Science359, 1139–1143. doi: 10.1126/science.aao6379
51
Morioka Y. Behera S. K. (2021). Remote and local processes controlling decadal sea ice variability in the Weddell Sea. J. Geophysical Research: Oceans126, e2020JC017036. doi: 10.1029/2020JC017036
52
Murphy E. J. Trathan P. N. Watkins J. L. Reid K. Meredith M. P. Forcada J. et al . (2007). Climatically driven fluctuations in Southern Ocean ecosystems. Proc. R. Soc. B: Biol. Sci.274, 3057–3067. doi: 10.1098/rspb.2007.1180
53
Nardelli S. C. Gray P. C. Stammerjohn S. E. Schofield O. (2023). Characterizing coastal phytoplankton seasonal succession patterns on the West Antarctic Peninsula. Limnology oceanography68, 845–861. doi: 10.1002/lno.12314
54
Noh K. M. Lim H.-G. Kug J.-S. (2021). Zonally asymmetric phytoplankton response to the Southern annular mode in the marginal sea of the Southern ocean. Sci. Rep.11, 10266. doi: 10.1038/s41598-021-89720-4
55
Pančić M. Hansen P. J. Tammilehto A. Lundholm N. (2015). Resilience to temperature and pH changes in a future climate change scenario in six strains of the polar diatom Fragilariopsis cylindrus. Biogeosciences12, 4235–4244. doi: 10.5194/bg-12-4235-2015
56
Peloquin J. A. Smith J. W. O. (2007). Phytoplankton blooms in the Ross Sea, Antarctica: Interannual variability in magnitude, temporal patterns, and composition. J. Geophys. Res112, C08013. doi: 10.1029/2006JC003816
57
Petrou K. Kranz S. A. Trimborn S. Hassler C. S. Ameijeiras S. B. Sackett O. et al . (2016). Southern Ocean phytoplankton physiology in a changing climate. J. Plant Physiol.203, 135–150. doi: 10.1016/j.jplph.2016.05.004
58
Pinkerton M. H. Boyd P. W. Deppeler S. Hayward A. Höfer J. Moreau S. (2021). Evidence for the impact of climate change on primary producers in the Southern Ocean. Front. Ecol. Evol.9. doi: 10.3389/fevo.2021.592027
59
Rintoul S. R. Chown S. L. DeConto R. M. England M. H. Fricker H. A. Masson-Delmotte V. et al . (2018). Choosing the future of Antarctica. Nature558, 233–241. doi: 10.1038/s41586-018-0173-4
60
Ruggiero J. A. Scherer R. P. Mastro J. Lopez C. G. Angus M. Unger-Harquail E. et al . (2024). Population morphometrics of the Southern Ocean diatom Fragilariopsis kerguelensis related to sea surface temperature. J. Micropalaeontology43, 323–336. doi: 10.5194/jm-43-323-2024
61
Sarthou G. Timmermans K. R. Blain S. Tréguer P. (2005). Growth physiology and fate of diatoms in the ocean: a review. J. sea Res.53, 25–42. doi: 10.1016/j.seares.2004.01.007
62
Smith J. W. Nelson D. M. (1990). Phytoplankton growth and new production in the Weddell Sea marginal ice zone in the austral spring and autumn. Limnology Oceanography35, 809–821. doi: 10.4319/lo.1990.35.4.0809
63
Spiridonov V. Nöthig E.-M. Schröder M. Wistozki A. (1996). The onset of biological winter in the eastern Weddell Gyre (Antarctica) planktonic community. J. Mar. Syst.9, 211–230. doi: 10.1016/S0924-7963(95)00049-6
64
Sun J. Liu D.-Y. Ning X.-R. Liu C.-G. (2003). Phytoplankton in the Prydz Bay and the adjacent Indian sector of the Southern Ocean during the austral summer 2001/2002. Oceanologia limnologia Sin.34, 519–532. doi: 10.3321/j.issn:0029-814X.2003.05.007
65
Tian H.-A. van Manen M. Wille F. Jung J. Lee S. Kim T.-W. et al . (2023). The biogeochemistry of zinc and cadmium in the Amundsen Sea, coastal Antarctica. Mar. Chem.249, 104223. doi: 10.1016/j.marchem.2023.104223
66
Tréguer P. Bowler C. Moriceau B. Dutkiewicz S. Gehlen M. Aumont O. et al . (2018). Influence of diatom diversity on the ocean biological carbon pump. Nat. Geosci.11, 27–37. doi: 10.1038/s41561-017-0028-x
67
Tréguer P. Nelson D. Brzezinski M. (1992). Protocol for determination of biogenic and lithogenic silica in particulate matter. SO-JGOFS core parameter Int. Rep.4.
68
Turner J. Guarino M. V. Arnatt J. Jena B. Marshall G. J. Phillips T. et al . (2020). Recent decrease of summer sea ice in the Weddell Sea, Antarctica. Geophysical Res. Lett.47, e2020GL087127. doi: 10.1029/2020GL087127
69
Van Leeuwe M. A. Webb A. L. Venables H. J. Visser R. J. Meredith M. P. Elzenga J. T. M. et al . (2020). Annual patterns in phytoplankton phenology in Antarctic coastal waters explained by environmental drivers. Limnology Oceanography65, 1651–1668. doi: 10.1002/lno.11477
70
Wakatsuchi M. Ohshima K. I. Hishida M. Naganobu M. (1994). Observations of a street of cyclonic eddies in the Indian Ocean sector of the Antarctic Divergence. J. Geophysical Research: Oceans99, 20417–20426. doi: 10.1029/94JC01478
71
Wang S. Liu J. Cheng X. Yang D. Kerzenmacher T. Li X. et al . (2023). Contribution of the deepened Amundsen sea low to the record low Antarctic sea ice extent in February 2022. Environ. Res. Lett.18, 054002. doi: 10.1088/1748-9326/acc9d6
72
Williams G. D. Nicol S. Aoki S. Meijers A. J. Bindoff N. L. Iijima Y. et al . (2010). Surface oceanography of BROKE-West, along the Antarctic margin of the south-west Indian Ocean (30–80∘ E). Deep Sea Res. Part II: Topical Stud. Oceanography57, 738–757. doi: 10.1016/j.dsr2.2009.04.020
73
Wright S. W. van den Enden R. L. Pearce I. Davidson A. T. Scott F. J. Westwood K. J. (2010). Phytoplankton community structure and stocks in the Southern Ocean (30–80 E) determined by CHEMTAX analysis of HPLC pigment signatures. Deep Sea Res. Part II: Topical Stud. Oceanography57, 758–778. doi: 10.1016/j.dsr2.2009.06.015
74
Xue M. Zhu G. (2021). Stomach content analysis and feeding habit of the Antarctic krill Euphausia superba: A review [in Chinese. J. Fishery Sci. China28, 1238–1250. doi: 10.3724/SP.J.1118.2021-0067
75
Zhang J. (2007). Increasing Antarctic sea ice under warming atmospheric and oceanic conditions. J. Climate20, 2515–2529. doi: 10.1175/JCLI4136.1
76
Zheng X. Bai Y. Zhang Y. He X. Li T. Gong F. (2025). Diversity mechanisms of long-term changes in phytoplankton biomass and productivity in the Southern Ocean: comparison in the Amundsen and Cosmonaut Seas. Front. Mar. Sci.12. doi: 10.3389/fmars.2025.1547082
77
Zhu Z. Qu P. Gale J. Fu F. Hutchins D. A. (2017). Individual and interactive effects of warming and CO 2 on Pseudo-nitzschia subcurvata and Phaeocystis Antarctica, two dominant phytoplankton from the Ross Sea, Antarctica. Biogeosciences14, 5281–5295. doi: 10.5194/bg-14-5281-2017
Summary
Keywords
Cosmonaut Sea, phytoplankton community structure, organic carbon, environmental drivers, biological carbon pump
Citation
Wu G, Li D, Zhao J, Pan J, Hu J, Yu P, Sun W, Zhang H, Zhu C and Li C (2025) Spatial heterogeneity and seasonal succession of phytoplankton community in the Cosmonaut Sea, East Antarctica: driving forces and implications. Front. Mar. Sci. 12:1669264. doi: 10.3389/fmars.2025.1669264
Received
19 July 2025
Accepted
18 August 2025
Published
03 September 2025
Volume
12 - 2025
Edited by
Zhaohui Zhang, Zhejiang University, China
Reviewed by
Martina Mascioni, National University of La Plata, Argentina
Minkyoung Kim, Kyungpook National University, Republic of Korea
Updates
Copyright
© 2025 Wu, Li, Zhao, Pan, Hu, Yu, Sun, Zhang, Zhu and Li.
This is an open-access article distributed under the terms of the Creative Commons Attribution License (CC BY). The use, distribution or reproduction in other forums is permitted, provided the original author(s) and the copyright owner(s) are credited and that the original publication in this journal is cited, in accordance with accepted academic practice. No use, distribution or reproduction is permitted which does not comply with these terms.
*Correspondence: Dong Li, lidong@sio.org.cn; Jianming Pan, jmpan@sio.org.cn
Disclaimer
All claims expressed in this article are solely those of the authors and do not necessarily represent those of their affiliated organizations, or those of the publisher, the editors and the reviewers. Any product that may be evaluated in this article or claim that may be made by its manufacturer is not guaranteed or endorsed by the publisher.