Abstract
Introduction:
In arid regions such as Wadi Araba, Egypt, water scarcity is a significant challenge, driven by the complex hydrogeological settings and limited field data, all while demand continues to grow for water for domestic, agricultural, and industrial needs. Additionally, the basin flows westward into the Gulf of Suez, generating a slight deltaic fan connecting inland recharge movement with coastal sedimentary and hydrological activities.
Methods:
The groundwater recharge potential in Wadi Araba was mapped using the Analytic Hierarchy Process (AHP) within a GIS framework, which is the research objective. Using ArcGIS 10.8, ten thematic layers were weighted and combined to create a groundwater potential map that shows how surface, climate, and structure affect it.
Results:
The study revealed that Wadi Araba has three distinct categories of groundwater potential: low (28.45%) in the northern and southern zones, intermediate (56.9%) in the middle and western sections, and high (14.65%) in the northeastern basin near the Gulf of Suez. These patterns match up with changes in slope, soil permeability, rainfall, and the number of structural elements like drainage and lineaments. Finally, ROC -AUC analysis using 13 field-verified locations was used to check the accuracy of the derived zones, and the results indicated that the prediction accuracy was 78.7%. Accordingly, accessible sites are groundwater indicators in this arid area with few wells and springs.
Discussion:
This study is the first to use an AHP-GIS-based method to map the potential for groundwater in Wadi Araba, Egypt. The results provide an excellent basis for planning sustainable groundwater use in similar arid regions with little field data.
1 Introduction
Wadi Araba is situated in Egypt’s Northern Eastern Desert and experiences severe aridity. This Wadi relies heavily on groundwater to fulfill its agricultural, domestic, and industrial needs (Ganapuram et al., 2009). The groundwater in the study area is contained within a complex network of aquifers formed by the geological interaction of Precambrian basement rocks and more recent sedimentary deposits (Obiefuna and Sheriff, 2011; Oikonomidis et al., 2015). The assessment of groundwater supply in a geologically varied environment requires understanding the topographic, geological, and climatic aspects (Senapati and Das, 2021).The Nubian Sandstone Aquifer System (NSAS) represents the primary groundwater reservoir in the area and is recognized as one of the largest fossil groundwater systems in the whole world. Certain regions provide fresh groundwater suitable for agricultural and domestic use, while others with high salinity and mineral concentrations that pose challenges and require sustainable management (Salem et al., 2021, 2024). The CEDARE/IFAD regional program found that Egypt’s aquifers include around 970,390 km³ of stored freshwater, with a recoverable capacity estimated at 349,700 km³. The NSAS underlies parts of Egypt, Sudan, Chad, and Libya (Supplementary 1b) covering approximately 2.5 million square kilometers. In Egypt, it stretches under the Western and Eastern Deserts, encompassing the study area, where groundwater flows from southwest to northeast, affected by the regional topographic gradient and structural elements. The disparity between the substantial reserves of the NSAS and its limited and variable uses highlights the need for strategic planning and resource management (UNESCO, 2001). The additional hydrogeological characteristics of the NSAS in the Wadi Araba Basin are discussed in detail in the hydrogeological setting, including its thickness, water level depth, recharge mechanisms, and groundwater flow trends.Recent research shows that mapping the potential zones for groundwater in arid areas is much improved by combining satellite remote sensing data (GIS) and multi-criteria analysis such as the Analytical Hierarchy Process (AHP). (Smida et al., 2022) employed GIS-based analysis to assess fractured limestone aquifers in Tunisia. These methods complement the approach used in the present work to evaluate the potential of groundwater in the structurally complex setting of Wadi Araba. (Chavda et al., 2024) used an integrated technique in the Narmada area Gujarat in India, combining eleven thematic layers including slope, drainage density, and lineament density to identify groundwater potential zones. Their results emphasized the method’s accuracy in classifying terrain sections with varying groundwater potential. (Pawar et al., 2024) studied the Marathwada area in india using frequency ratio and statistical index models to underlining the effectiveness og quantitative geospatial methods in areas with limited hydrological data. (Chen et al., 2025) Used a hybrid GIS, AHP, and fuzzy-AHP technique in southern China focusing on the need to integrate fuzzy logic with conventional AHP to improve the accuracy of groundwater potential maps. Most studies in the area focus on hydrogeological descriptions or water quality evaluations without using advanced spatial analytic approaches.
2 Area of investigation
Although many studies on groundwater few have applied GIS-based AHP framework to map potential areas for groundwater resources within the Wadi Araba basin in Egypt. This highlights the novelty and importance of the present study. Unlike preceding research mainly on wide hydrogeological settings or water quality, this study notably employs a spatially integrated AHP–GIS model to comprehensively map groundwater potential zones in Wadi Araba, where such analytical integration has not been previously employed (Freeg et al., 2025) employed the GMS model to investigate aquifer sustainability in Wadi Araba, identifying depletion and salinization risks. (Khalil et al., 2021) used an integrated structural and geochemical approach to examine fault-controlled groundwater dynamics. (Wannous and Siebert, 2025) Categorized Eastern Desert groundwater into geochemical types, stressing effects from halite dissolution, weathering of Na-bearing mineral substances, and brine contributions connected with deep fault systems. (Wannous et al., 2021) Employed satellite imaging, hydrochemistry, and isotopic data to uncover structurally regulated recharge dynamics in Wadi Araba and varying spring behaviors. Recent research in India has illustrated the complicated combination of machine learning and geospatial techniques for assessing groundwater contamination risk and predicting water quality ( (Barad et al., 2025; Pati et al., 2025b, a) illustrating the accuracy of these data-driven methodologies in arid and semi-arid regions characterized by scarce field data. These advancements provided an efficient scientific foundation to apply comparable integrated methodologies within the specific hydrogeological and climatic framework of Wadi Araba.This study aims to investigate the hydrogeological characteristics of the Wadi Araba region that focus on the groundwater storage and recharge processes across different aquifers. The main objective of this study is to identify the best locations for groundwater accumulation in the Wadi Araba Basin using the AHP-GIS methodology. It also aims to evaluate the hydrological and geological factors that affect the presence of groundwater and the recharge of the aquifer in the area. The hypothesis is that AHP-GIS integration with geological and hydrogeological data can accurately identify areas of groundwater potential in the Wadi Araba and guide sustainable water resource management. As a result, understanding the region’s climate as well as its geomorphological and geographical properties are necessary when creating reliable groundwater maps.
The Wadi Araba is located in Egypt’s Northeastern Desert and spans approximately 2800 km² (Supplementary 1). Its geographical boundaries extend between latitudes of 28° 49′ North to 29° 10′ North and longitudes of 31° 50′ East to 32° 30′ East. This arid valley stretches from the northern area of Beni Suef to Za’farana on the coast of the Gulf of Suez, intersecting the northern and southern Galala plateaus that form a prominent geomorphological feature in the Eastern Desert (Supplementary 1). Climatically, The Wadi Araba area has hot summers and mild winters. Rare and irregular precipitation falls mostly in the winter (October to April). Although most precipitation events are minor usually<6 mm/day rare storms may produce major flooding, as shown by the flash flood in Ras Ghareb in 2016 that topped 100mm in a single event (Saber et al., 2020). Relative humidity is approximately 47% yearly, while evaporation rates peak in summer with daily means up to 10.1mm in June. Morphologically, Wadi Araba is a curved Wadi, 110-km-long. The landscape features rugged escarpments, deeply incised valleys, and conical karst landforms, especially in the northern plateau. The Southern Galala Plateau is characterized by block faulting, landslides, and eroded Wadi systems, which enhance surface runoff and support localized groundwater recharge. Fractured carbonate rocks and Wadi deposits are essential for the capture and channeling of precipitation and floodwater. Consequently Wadi Araba area have four main aquifers that derive the groundwater: Carboniferous (Nassim, 1990), Quaternary, Upper Cretaceous, and Lower Cretaceous (Nubian Sandstone). While the Quaternary aquifer is locally refilled by infrequent flash floods, the Nubian Sandstone is the most productive and recharged mainly during the late Pleistocene (Sturchio et al., 1996; Gat and Issar, 1974) during the Last Glacial Maximum, climatic conditions were much wetter, allowing for deeper penetration through exposed formation layers (Abouelmagd et al., 2014). Karstified limestone within the Galala Plateaus controls the occurrence of springs and wells structurally through faults and fractures. Aquifer type and depth significantly affect the salinity of groundwater, which ranges from 1,000 to 8,000 ppm. Groundwater flow and spring distribution are strongly affected by karstification and tectonic activity (Khalil et al., 2021).
2.1 Tectonics and geological setting
The Eastern Desert’s central massifs, which include Wadi Araba, are geologically connected to the central Sinai massifs, from which they are separated by the Suez Gulf. This gulf represents a significant and elongated tectonic depression, reflecting the complex tectonic framework of the study area. This tectonic depression developed through several rifting phases in the Late Oligocene–Miocene, characterized by extensional faulting, block tilting (horsts and grabens), and strike-slip adjustments along transfer zones (Lyberis, 1988; Khalil and McClay, 2001).
The area of investigation comprises a variety of sedimentary rock formations ranging in age from the Carboniferous, Permo-Triassic, and Cretaceous to the Eocene, Oligocene, Miocene, Pliocene, and Quaternary. This diversity contributes to making the region’s structural framework particularly intricate and significant for groundwater studies (Figures 1a, b).
Figure 1
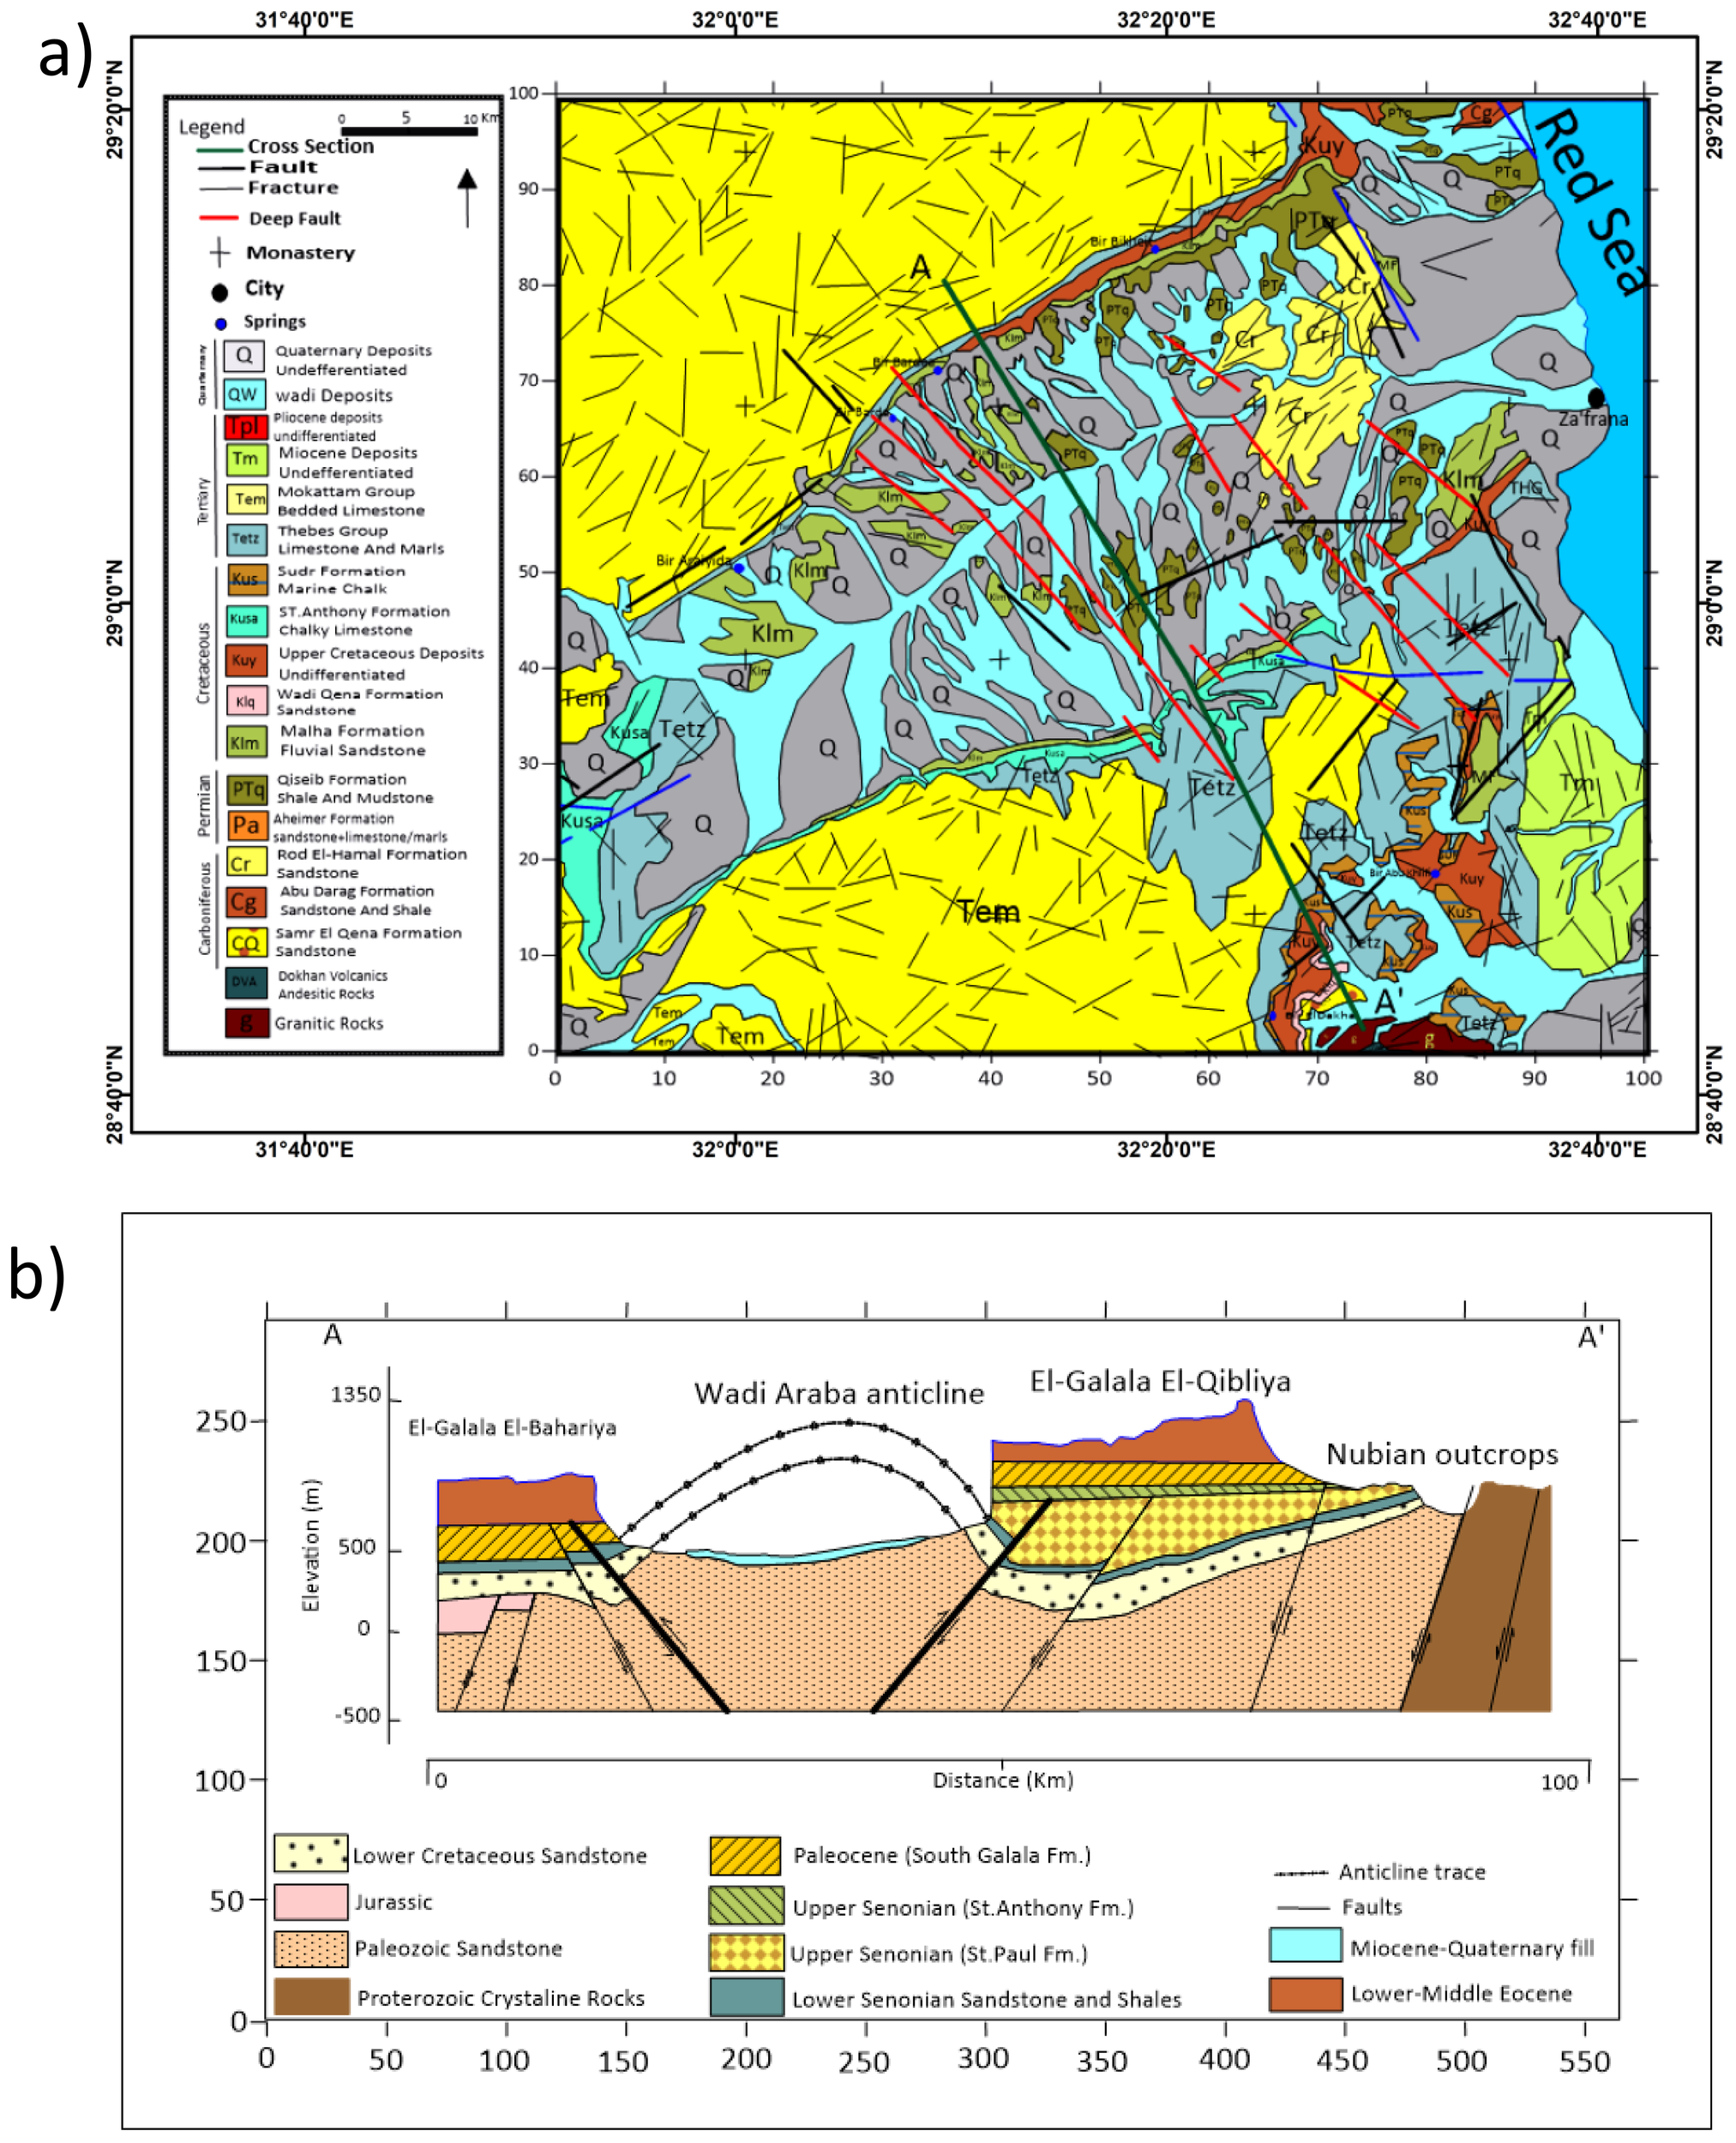
(a) Wadi Araba’s geologic map was modified after (Klitzsch and Wycisk, 1987). (b) A cross section illustrating the structural and stratigraphic history of the Wadi Araba area (Khalil et al., 2021).
Wadi Araba is defined as a tectonic basin that is controlled by structural fault systems. These structural dynamics are primarily driven by the ongoing tectonic activity linked to the opening of the Red Sea, which started in the Miocene and persists to the present (Chowdhury et al., 2010). The regional stratigraphy is subdivided into three major tectono-stratigraphic units: the Pre-Oligocene (pre-rift unit), the Late Oligocene to Middle Miocene (syn-rift unit), and the Late Miocene/Pliocene to Quaternary (post-rift unit) (Swetha et al., 2017; Bhunia, 2020). Therefore, these units are structurally and geologically related to the tectonic evolution of both the Red Sea and the Suez Gulf (Figure 1a).
2.2 Hydrogeological setting
According to its site in a predominantly arid environment, Wadi Araba heavily relies on its groundwater reserves which are stored in a multi-layered aquifer system associated with both Precambrian basement rocks and overlying sedimentary formations (Rugmini Ammal et al., 2018).
There is a wide variety of rock types present in the geological environment of Wadi Araba which from volcanic and metamorphic Precambrian basement rocks to recent sedimentary layers of sandstones, shales, and carbonates (Salem et al., 2021, 2022, 2024). These lithological units affect groundwater movement, storage capacity, and water quality. The fractured and weathered carbonate rocks serve as natural conduits for groundwater flow which enable water to infiltrate into deeper aquifers. Meanwhile, the overlying sedimentary layers particularly the porous sandstone formations provide substantial storage capacity for groundwater (Shata, 1982). Wadi Araba is a structurally controlled basin resulting from Red Sea rifting from the Miocene to the present (Bosworth and Durocher, 2017) while the stratigraphy formed during Paleozoic to Quaternary according to the pre-rift, syn-rift, and post-rift formations. The basin is divided into three fault systems: Northwest- Southeast, North-South, and East-west which influence both surface and subsurface water circulation. Additionally deep-seated dykes divided the area into a shallow eastern zone and a deep western zone (Khalil et al., 2021)(Figure 1). The hydrological map of the study area illustrates a spatial connection between geological formations and groundwater flow rates (Supplementary 2).
In the Wadi Araba region the carbonate aquifer system mainly composed of fractured Eocene limestone which is a key source of groundwater and the thickness of the aquifer varies between 50 to 150 meters depending on lithological and tectonic variations. The area has been affected by tectonic activity related to the Red Sea rift system which has created faults and fractures that enhance groundwater storage and flow by increasing secondary porosity.
The Wadi Araba aquifer is typically unconfined to semi-confined, with groundwater flowing through fractures and karstic features. Transmissivity ranges from about 10 to 100 m²/day, while storativity remains low due to the consolidated and fractured rock matrix. Groundwater salinity varies, with TDS (total dissolved solids) levels ranging from 500 to 3000 mg/L, depending on recharge rate and water-rock interactions.
In specific areas, extensive alluvial deposits within the wadi enhance recharge potential by improving water retention and infiltration, although deeper confined aquifers also exist, holding older and fossil groundwater reserves (Abdel Moneim, 2005). Several previous hydrogeological studies have reported significant spatial variability in groundwater quality across the Wadi Araba region. While some areas provide fresh water suitable for agricultural and domestic use. Others exhibit higher salinity and mineral content. This variation is often attributed to prolonged evaporation and limited recharge in certain areas (Arulbalaji et al., 2019; Freeg et al., 2023).
Research has highlighted substantial groundwater reserves in both shallow and deep aquifers within this system, while hydrochemical analyses indicate that while the groundwater is generally suitable for agricultural, elevated salinity in specific locations may necessitate adaptive management strategies to ensure its sustainability (Arulbalaji et al., 2019).
The groundwater recharge primarily occurs through short-lived but intense rainfall events which lead to flash floods which infiltrate the Wadi sediments and surrounding aquifers. However, the recharge rates and groundwater quality exhibit considerable spatial variability and posing challenges to sustainable water resource management (Elbeih and Zaghloul, 2021; Salem et al., 2021, 2022, 2024). This geological heterogeneity underscores the need for geospatial analysis tools to identify areas with a higher potential for groundwater accumulation and recharge.
Besides these basin-wide approximations, recent site-specific studies reveal important local NSAS characteristics in Wadi Araba including variability in aquifer depth, flow direction, and recharge dynamics. In this region, maximum depth of the aquifer can exceed 1000 meters in some areas, though wells usually tap shallower sections (~200–500 m) (Regional Strategy for the Utilisation of the Nubian Sandstone Aquifer System, 2005). Water table levels vary, but are generally deep due to hyper-arid conditions and limited recharge, often found below 100 meters. Recharge is extremely limited, mostly from sporadic rainfall and possible minor leakage from adjacent fractured rocks or wadis during flash floods (Mohamed et al., 2022). Discharge occurs mainly through pumping wells for agricultural and domestic use; natural discharge remains minimal. Aquifer thickness varies but may range from several hundreds to over 1000 meters, depending on the structural setting. Groundwater flow direction in Wadi Araba is generally from southwest to northeast, aligned with regional structural trends and topographic gradients, ultimately draining toward the Suez Gulf (Mohamed et al., 2022). Due to the fossil nature of the aquifer, sustainability is a concern, making strategic planning essential for ensuring long-term groundwater availability (Regional Strategy for the Utilisation of the Nubian Sandstone Aquifer System, 2005).
According to recent research (Bakhbakhi, 2006; Thorweihe et al., 1990b; Patterson et al., 2005; Voss and Soliman, 2014) the Nubian Aquifer System (NAS), which covers roughly 2.2 × 10⁶ km², was previously thought to have limited recharging due to hyper-arid conditions. Nevertheless, recent evidence derived from GRACE satellite data indicates that the response to climatic variability is more dynamic, with an annual recharge exceeding 5 × 10⁹ m³ (Abdelmohsen et al., 2020). This recharging is considered to occur mostly as turbulent flow through fractures and karst characteristics which are especially significant to structurally complicated places like Wadi Araba.
3 Materials and methods
Mapping groundwater potential in arid environments remains challenging due to the limited availability of conventional field data. However the integration of remote sensing (RS) and geographic information system (GIS) techniques facilitates the creation of thematic layers which are critical for groundwater assessment. This study employs a geospatial framework supported by multi-criteria decision-making techniques, to delineate zones with groundwater potential.
Several geospatial datasets were incorporated, including the Shuttle Radar Topography Mission (SRTM) Digital Elevation Model (DEM) for analyzing elevation, slope, and hillshade, as well as Esri Sentinel-2 Land cover Explorer platform (https://livingatlas.arcgis.com) for land use/land cover (LULC) mapping. Additional spatial layers included geological maps (lithological units), soil classifications, and climatic data such as precipitation, air temperature, and land surface temperature.
All raster and vector layers were resampled to a 30m resolution using ArcGIS 10.8 capabilities, including ‘Resample’, ‘Polygon to Raster’, and ‘Interpolation’. The thematic layers were categorized and weighted using the Analytical Hierarchy Process (AHP), which included pairwise comparisons and expert evaluations. The Consistency Ratio (CR) was kept below 0.1 to ensure the reliability of the matrix. A weighted overlay analysis was then used to generate the final groundwater potential map.
The ten thematic layers were selected for their hydrogeological significance. A pairwise comparison matrix was constructed using expert evaluations and assigning relative importance values on scale from 1 to 9. The normalized eigenvector was then calculated to drive the final weight of each factor. The Consistency of the matrix was verified by calculating the consistency Ratio (CR) which confirmed the validity of the weights.
Validation was performed using georeferenced field observation from thirteen locations within the study area. These points were spatially overlaid on the groundwater potential map to verify the correspondence with zones of high, moderate, and low recharge. The complete methodological workflow is illustrated in Supplementary 3 that outlines the major steps from data acquisition to final map validation.
3.1 Rainfall data
Rainfall serves as a primary source of groundwater recharge with its contribution largely influenced by the surface lithology and topographic slopes. In this study rainfall data spanning the period from 2011 to 2021 were obtained from the CRU TS v4.07 dataset (available at (www.uea.ac.uk, n.d) www.uea.ac.uk) to provide a historical climate overview. The data were processed using the Inverse Distance Weighted (IDW) interpolation method to generate a spatial rainfall distribution map across the study area through this years (Nigussie et al., 2019). Precipitation data from NASA/POWER CERES/MERRA-2 were utilized for integration and spatial analysis in the Geographic Information System as it offers higher spatial resolution and aligns with the region’s thematic layers.
The results indicate considerable spatial variability in precipitation. Annual rainfall values ranged from a minimum of 12.26mm in the western region to a maximum of 46.69mm in the eastern part of the study area (Figure 2). This variability show the influence of spatial rainfall distribution on groundwater recharge potential within Wadi Araba.
Figure 2
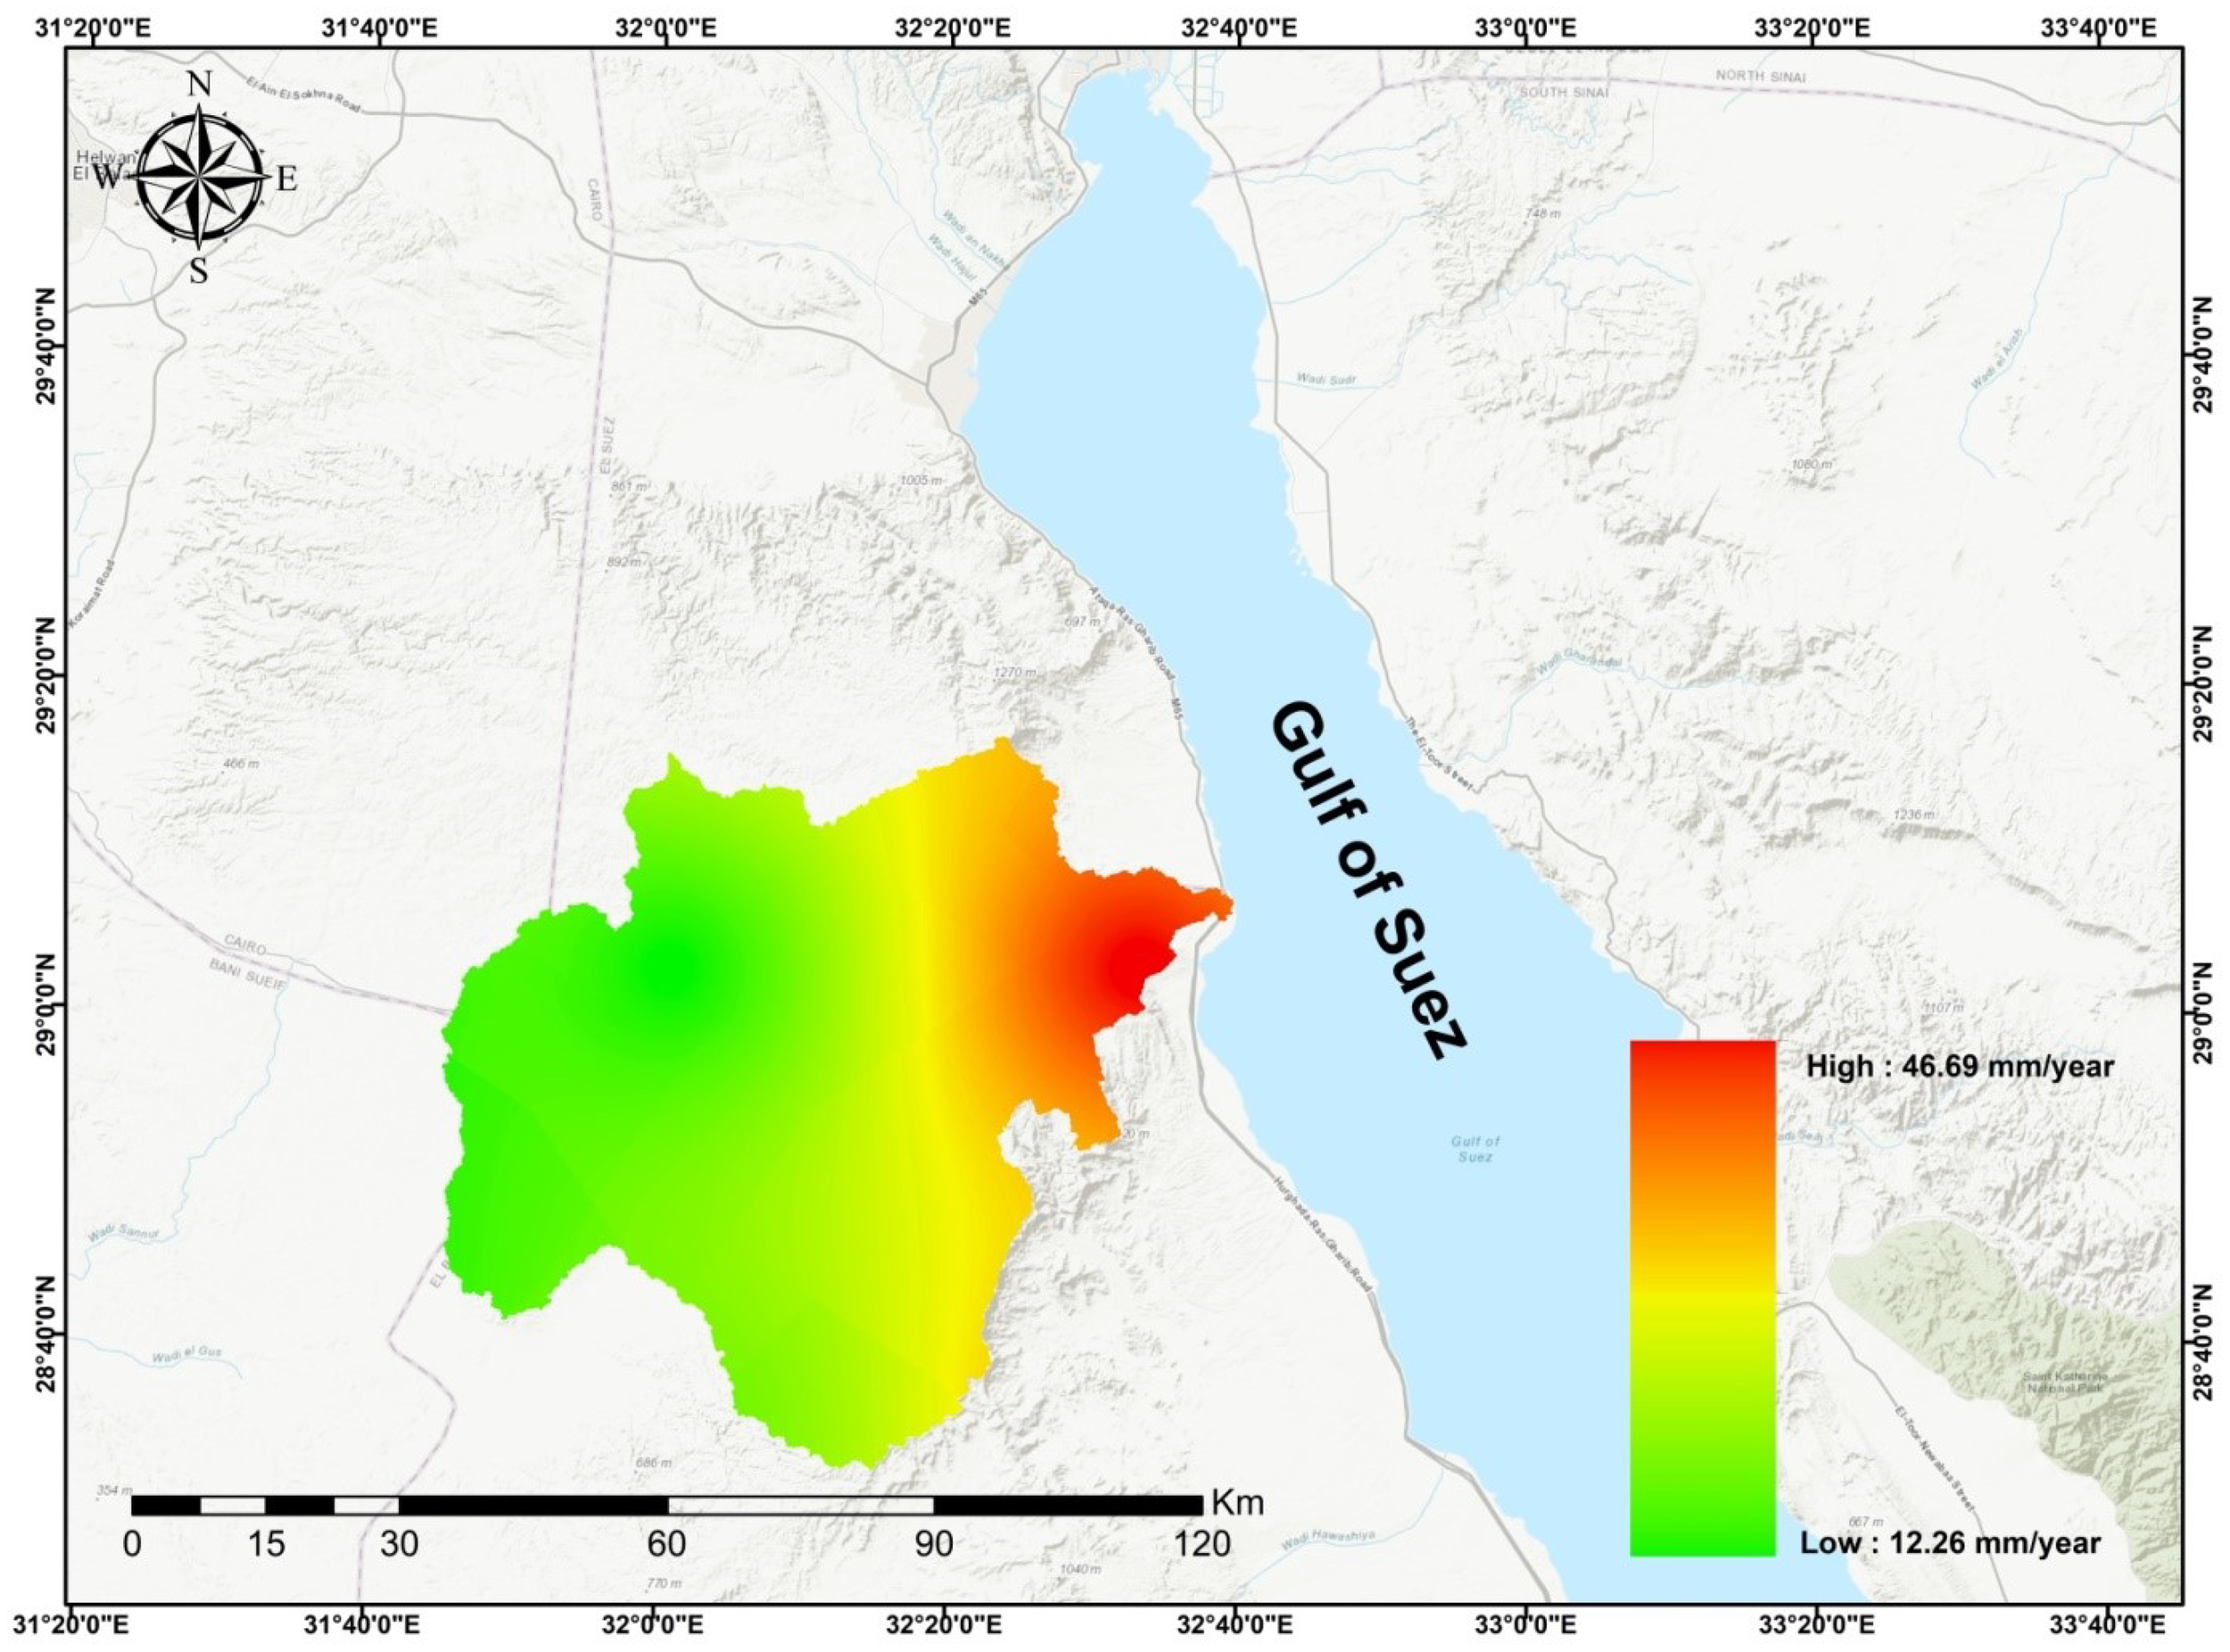
The amount of rainfall in Wadi Araba (2011-2021) source: CRU TS v4.07 dataset (available at www.uea.ac.uk).
3.2 Precipitation
Precipitation is essential to the dynamics of hydrological systems especially in arid and semi-arid zones. These locations have considerable difficulties with water resource management due to the complexity of hydrological processes and the limited availability of ground-based hydro meteorological observation networks (El Kenawy, 2024).
In this study the precipitation data used in the GIS model and the assessment of rainfall within the study area were generated using MERRA-2 precipitation data (Kuswanto and Naufal, 2019). It offers global coverage with approximately 0.5° x 0.625° spatial resolution allowing for the representation of regional climate variability (Reichle et al., 2017). This dataset provides precipitation information from 1981 to 2020, with the study focusing on data from 2000 to 2020 (Figure 3a). Total precipitation across Egypt during this period is illustrated in Figure 3b.
Figure 3
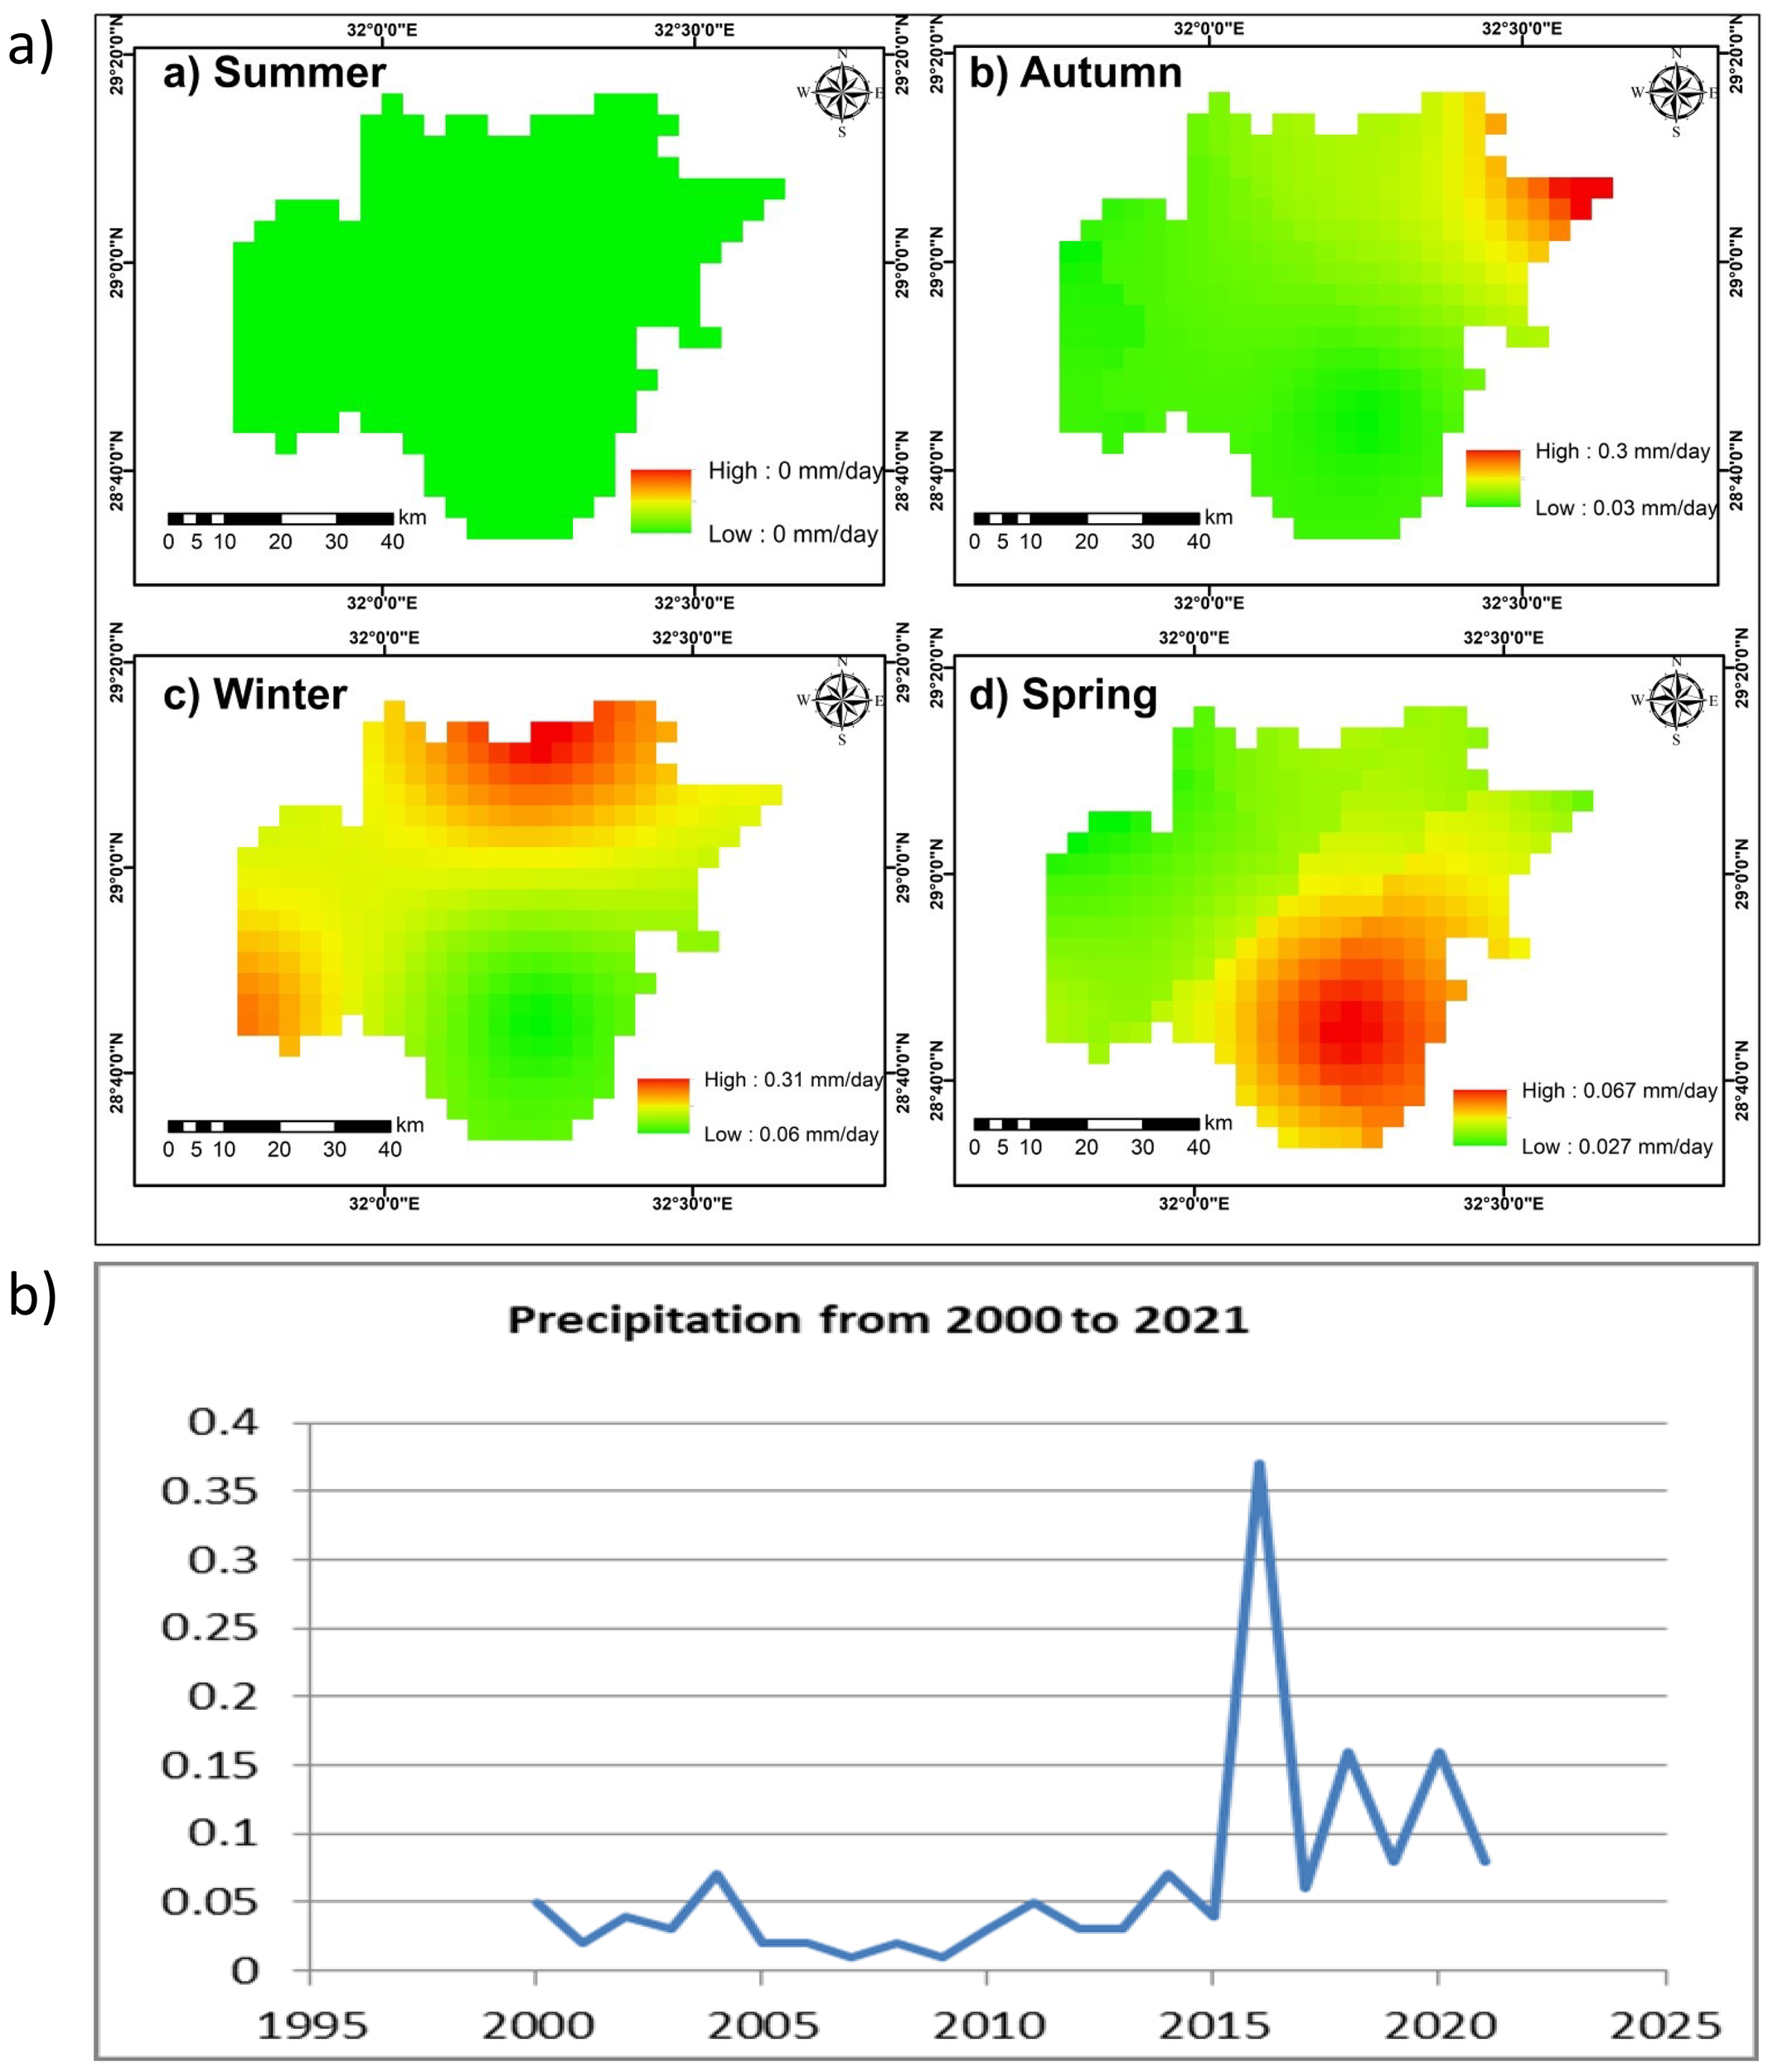
(a) Seasonal distribution of rainfall over Wadi Araba: (a) Summer, (b) Autumn, (c) Winter, and (d) Spring from 2000 to 2020. (Source: NASA/POWER CERES/MERRA2). (b) Annual precipitation trend from 2000 to 2021. Data source: CRU TS v4.07 dataset.
In the Wadi Araba area, maximum precipitation occurs during winter, with rates reaching up to 0.31 mm/day in the northern and southwestern parts, gradually decreasing toward the southern regions to 0.06 mm/day. In autumn, precipitation rates range between 0.03 and 0.3 mm/day. Summer exhibits the lowest precipitation, with rates dropping to zero mm/day. These findings highlight the seasonal variability of precipitation and its effects on hydrological processes and Water resource administration in the investigation area.
3.2.1 Humidity
Humidity is an important measure in atmospheric research. Specific humidity indicates the proportion of water vapor mass to the entire mass of air. Surface humidity is influenced by factors beyond rising temperatures, including land-use changes such as irrigation and reservoir construction, as well as shifts in air circulation patterns driven by climatic changes (Marquart, 2003; Changnon, 2005).
As illustrated in Figure 4, the seasonal variation in specific humidity is evident. Summer recorded the highest specific humidity in the study area, ranging from a maximum of 9.69 g/kg to a minimum of 7.98 g/kg. Autumn followed with the second-highest specific humidity values, ranging from 9.27 g/kg to 7.23 g/kg. In spring, specific humidity ranged from 6.43 g/kg at its highest to 5.04 g/kg at its lowest values. Winter have the lowest specific humidity values with a maximum of 5.75 g/kg and a minimum of 4.65 g/kg.
Figure 4
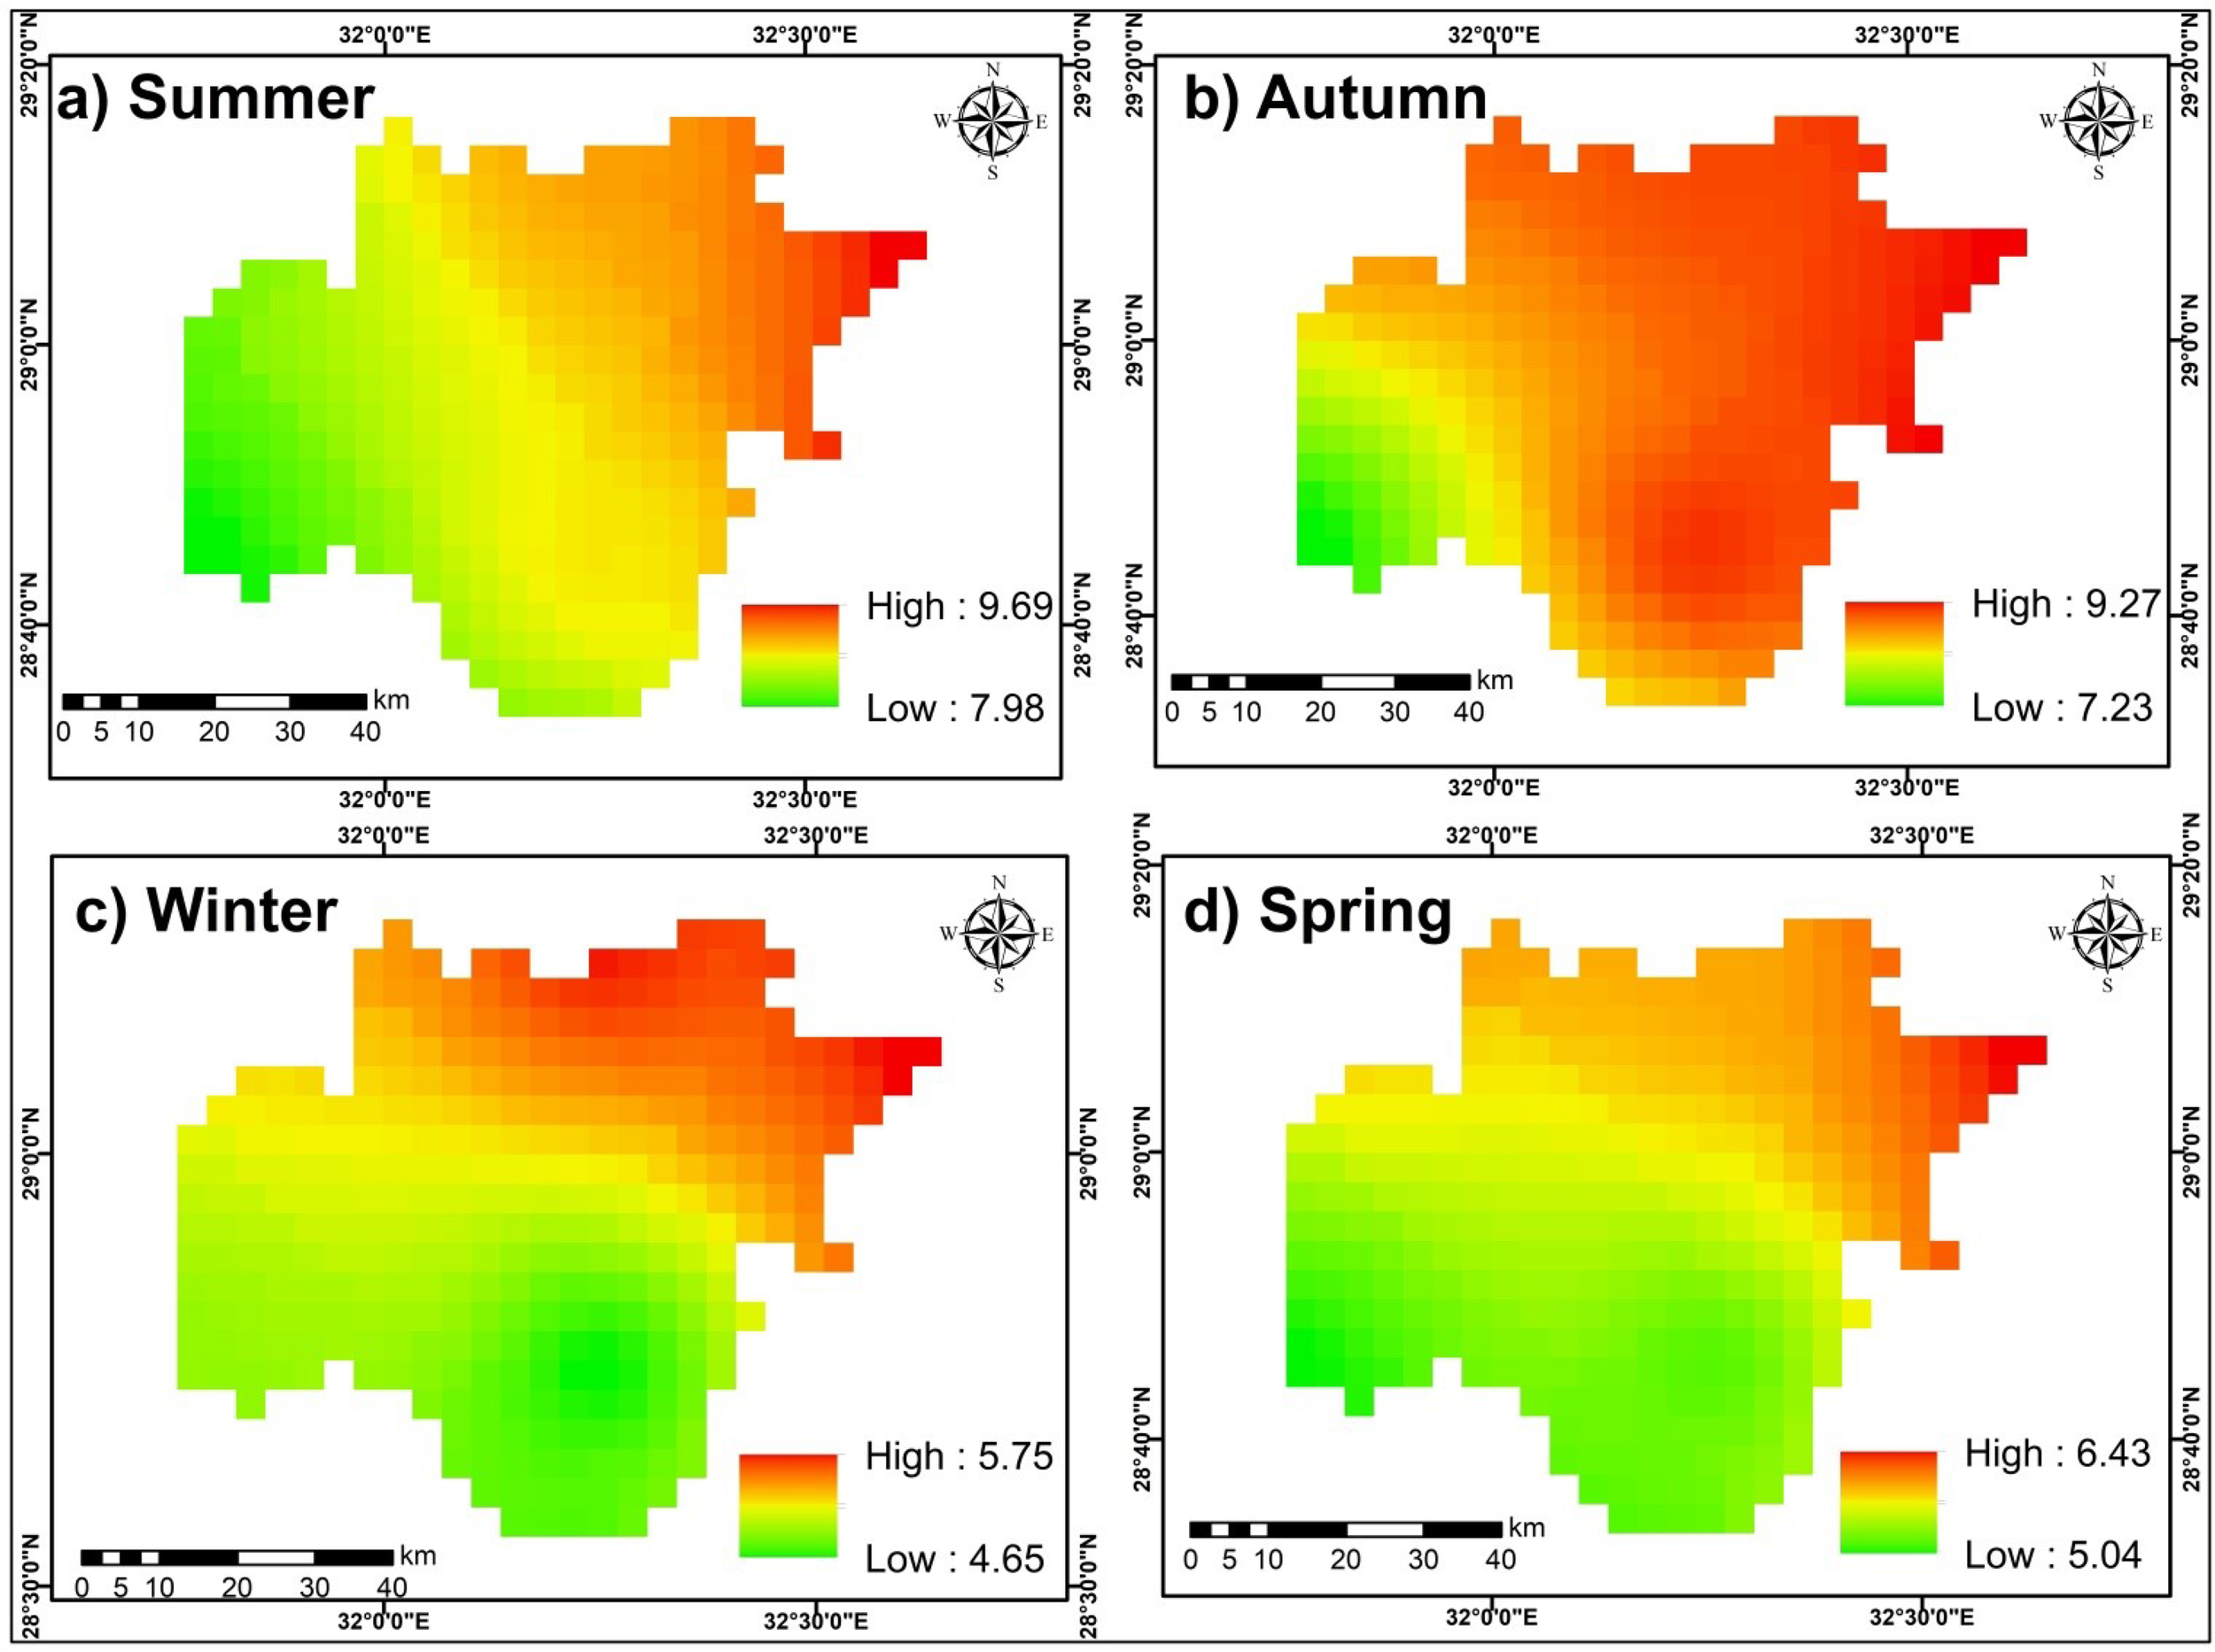
Average of humidity through the years 2000 to 2020 by g/kg (source: NASA/POWER CERES/MERRA2 Native Resolution Monthly and Annual): (a) Summer, (b) Autumn, (c) Winter, and (d) Spring.
These findings highlight the significant seasonal variability of specific humidity in the region, influenced by a combination of meteorological and environmental factors.
3.3 Temperature data
Temperature data were obtained from the NASA/POWER CERES/MERRA-2 dataset and covering the period from 2000 to 2020 with a spatial resolution of 0.5° x 0.625° latitude and longitude. This data illustrates seasonal temperature variations across the study area.
3.3.1 Land Surface Temperature
Land Surface Temperature (LST) has a critical role in influencing processes related to water precipitation and climate. Changes in LST significantly impact vegetation growth and evapotranspiration which are essential components of the hydrological and climatic systems (An Leeuwen, 2015; Potić et al., 2017; Saha et al., 2018).
Over the 21-year study period significant variations in LST were observed in the research area. As illustrated in Figure 5a summer and spring recorded increases in LST in certain locations, while winter and autumn exhibited decreases or minimal changes. Using the IDW (Inverse Distance Weighted) interpolation method LST values from 2000 to 2020 were analyzed to map these changes.
Figure 5
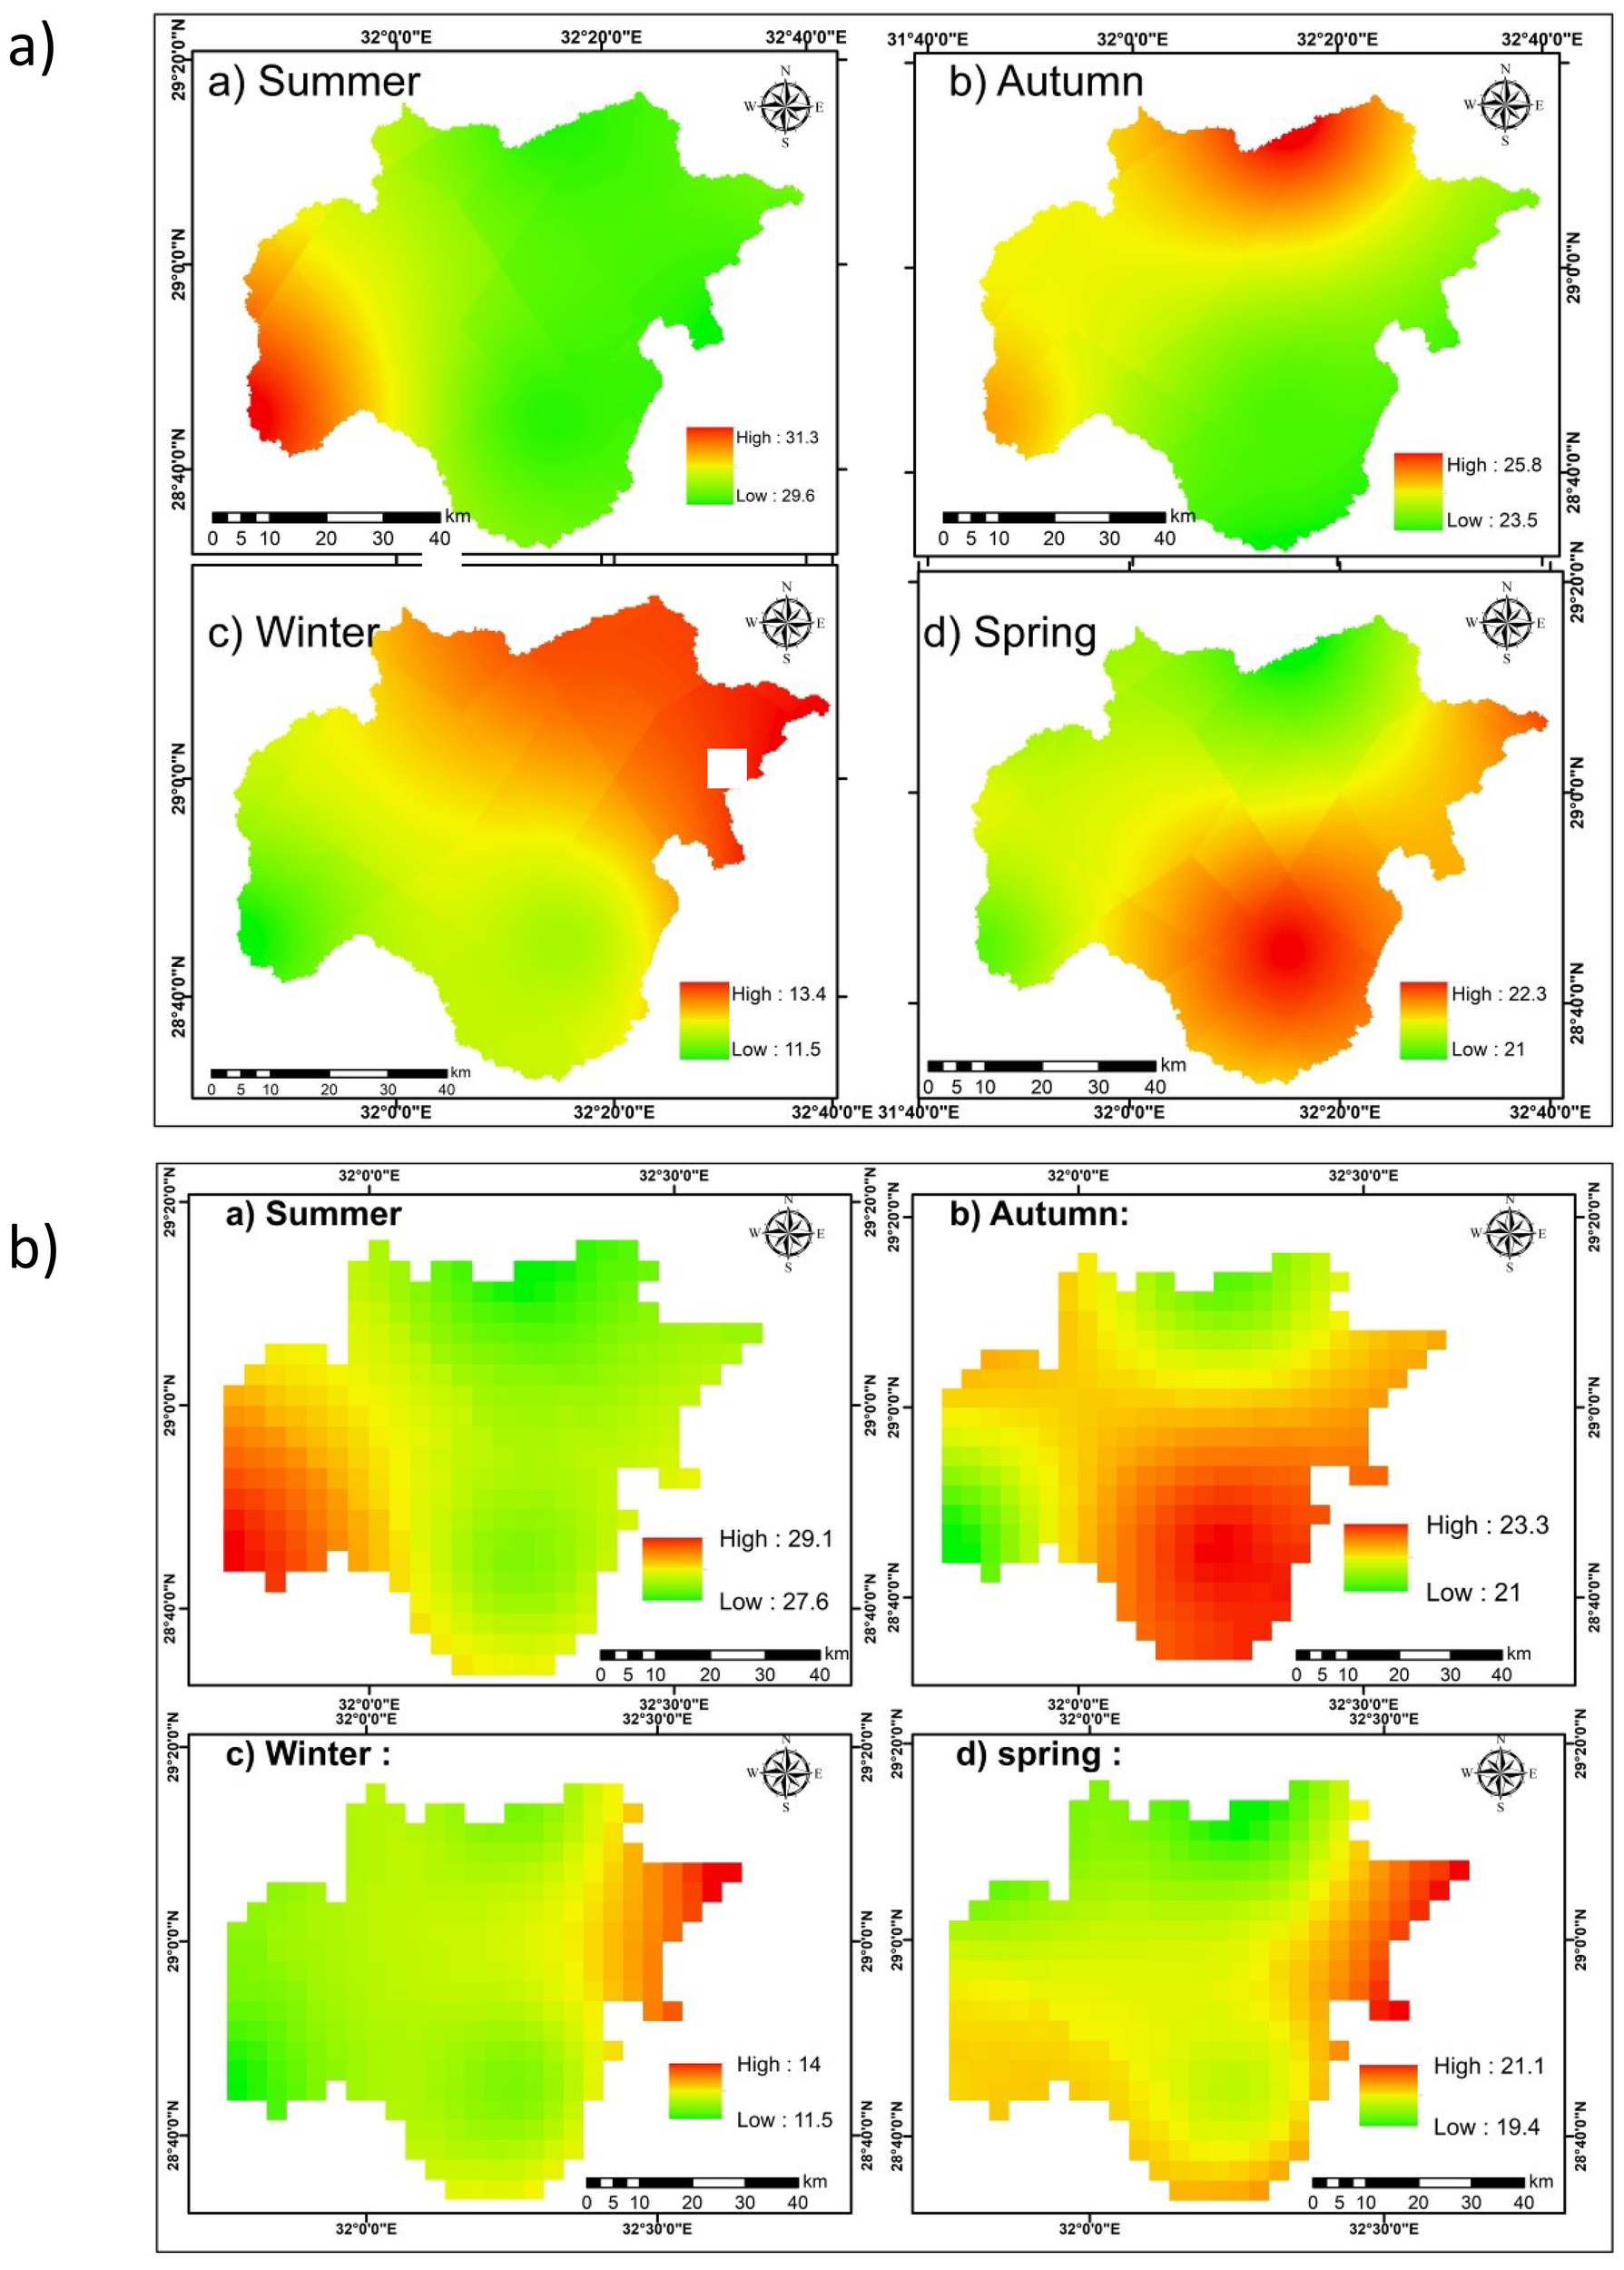
(a) The average in land surface temperatures in the four seasons in Wadi Araba area from 2000 to 2020. (b) shows the average in Air temperatures in the four seasons in Wadi Araba area from 2000 to 2020. (Source: NASA/POWER CERES/MERRA2 Native Resolution Monthly and Annual).
During summer, LST ranged from a maximum of 31.3°C to a minimum of 29.6°C. In autumn, the highest recorded temperature was 25.8°C, with the lowest being 23.5°C. Spring temperatures varied between 22.3°C and 21°C, while winter exhibited the lowest LST values, ranging from a maximum of 13.4°C to a minimum of 11.5°C.
3.3.2 Air temperature at 2m
Air temperature monitoring is essential for numerous environmental applications that include hydrology (Naseer et al., 2019), agriculture (Gornall et al., 2010; Hatfield et al., 2011), climate change studies (Forest et al., 2002) and climatology (Legates and Willmott, 1990). Meteorological stations provide precise and high temporal resolution observations of air temperature at a standard altitude approximately 2 meters above the ground level (Benali et al., 2012). However, in ground measurements often fail to capture the regional variability of air temperature across areas with significant spatial heterogeneity (Vancutsem et al., 2010).
Monthly and yearly air temperature data for the years 2000–2020 were collected from the NASA/POWER CERES/MERRA-2 database. The Inverse Distance Weighted (IDW) interpolation approach was used to depict the spatial and seasonal variations in air temperature throughout the research region (Figure 5b).
The investigation found significant seasonal temperature changes. Summer temperatures vary from 27.6°C 29.1°C, while fall temperatures ranged from 21.0°C to 23.3°C. In the spring, air temperatures varied between 19.4°C and 21.1°C. Winter experienced the lowest temperatures, ranging from 11.5°C to 14.0°C.
3.4 Remote sensing data and analysis
3.4.1 Digital Elevation Model
The elevation in the region ranges from -4 to 1481 meters, as shown in Figure 6a. The Digital Elevation Model (DEM) is a foundational tool to estimate surface morphological characteristics, including slope, aspect, curvature, and drainage area. It also provides a robust basis for the three-dimensional representation and analysis of geographical data (Zhou and Liu, 2004).
Figure 6

Surface analysis of Wadi Araba Area (a) Elevation of study area (SOURCE: USGS; Earth explorer). (b) Aspect (c) Curvature (d) Hillshade (e) Contour lines. (f) Slope.
The slope aspect in Figure 6b ranges from -1 to 359.9. Curvature, represented as the second derivatives of a given surface, often indicates the rate of change in the slope. Positive curvature values indicate an upward-inclined surface at the corresponding cell (Figure 6c).
Hillshading is a technique used to visualize topography by simulating shadows based on illumination. In this study, Hillshading was computed using a traditional method with a single-direction light source. The sun’s position was defined by an altitude angle of 45 degrees and an azimuth angle of 315 degrees, producing a detailed hillshade map ranging from 0 to 180 degrees, as shown in Figure 6d.
Contour mapping was also applied using a contour interval of 300 meters to represent elevation data from the DEM. The resulting contour map, displayed in Figure 6e, illustrates elevation variations within the research region, ranging from 0 to 1200 meters.
3.4.2 Slope
Slope significantly affects the recharge of groundwater and runoff direction. According to (Ibrahim-Bathis and Ahmed, 2016), areas with lower slopes, which are often flat allow surface water to be absorbed over longer periods of time than locations with steep or moderate slopes, which have more runoff. The resulting slope map (Figure 6f) demonstrates that the research region has gentle, moderate, and severe slopes (slope ranges from 0 to 74.405). The southern and northern Wadi Araba region’s cliffs or the North and South Galala Plateaus higher rock exposures are the major sources of steep slopes, while the middle area is generally flat.
3.4.3 Lineaments
Lineaments defined as linear or curvilinear structural features, are typically associated with fault and fracture zones that enhance secondary porosity and permeability (Nag and Ghosh, 2013; Naghibi et al., 2016). These features are effectively recognized from remote sensing data due to their distinct alignments (Huang et al., 2013; Yeh et al., 2016). In this study, lineaments in the research area were manually derived using hillshade layers, as shown in Figure 7a (Arulbalaji et al., 2019).
Figure 7
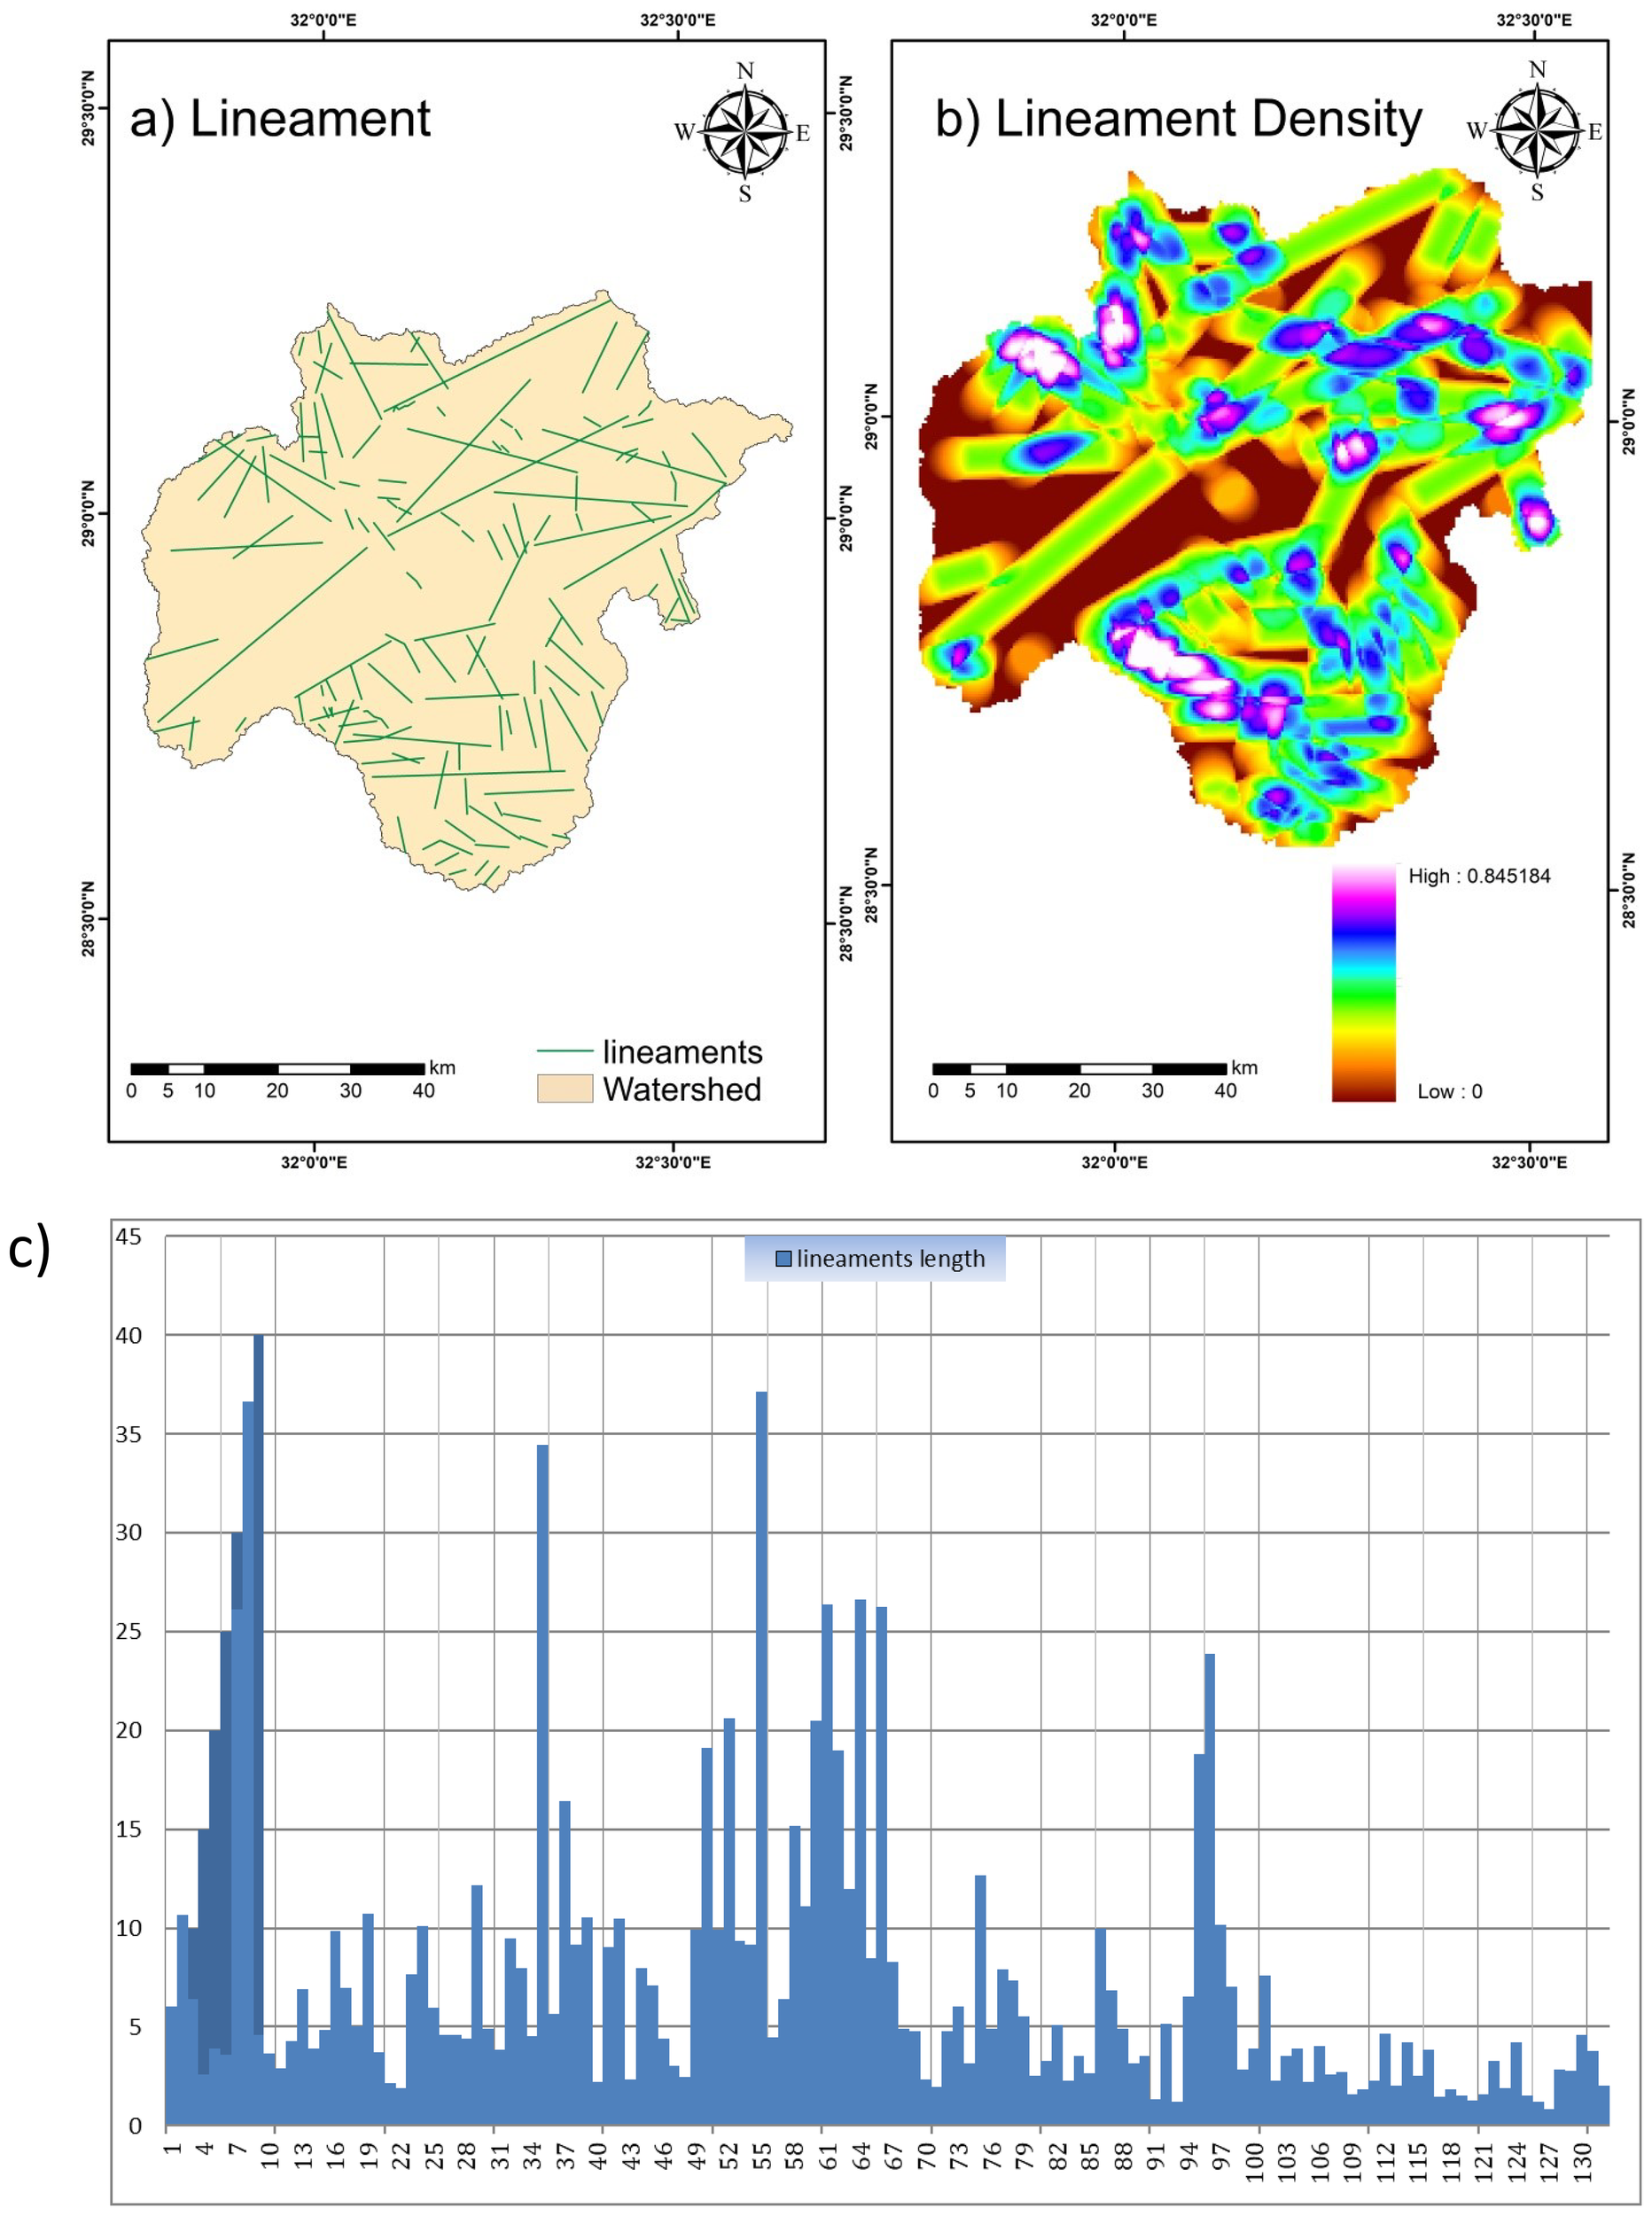
Structural analysis of Wadi Araba Basin (a) Lineament (b) Lineament Density. (c) Lineament statistics.
The extracted lineaments exhibit lengths ranging from 0.82km to 37.16km, with a mean length of 7.20km and a standard deviation of 7.10km (Figure 7c, Table 1). A rose diagram (Figure 8) was created to analyze the primary orientation of these lineaments, revealing a dominant northwest trend, with additional trends oriented northeast. These structural patterns are primarily attributed to faulting and fracturing within the geological formations of the Wadi Araba region (Emekwi et al., 2024).
Table 1
| Count of lineament | Minimum | Maximum | Sum | Mean | Standard deviation |
|---|---|---|---|---|---|
| 134.00 | 0.82 | 37.16 | 965.41 | 7.20 | 7.10 |
Statistics of lineament length of the study area.
Figure 8
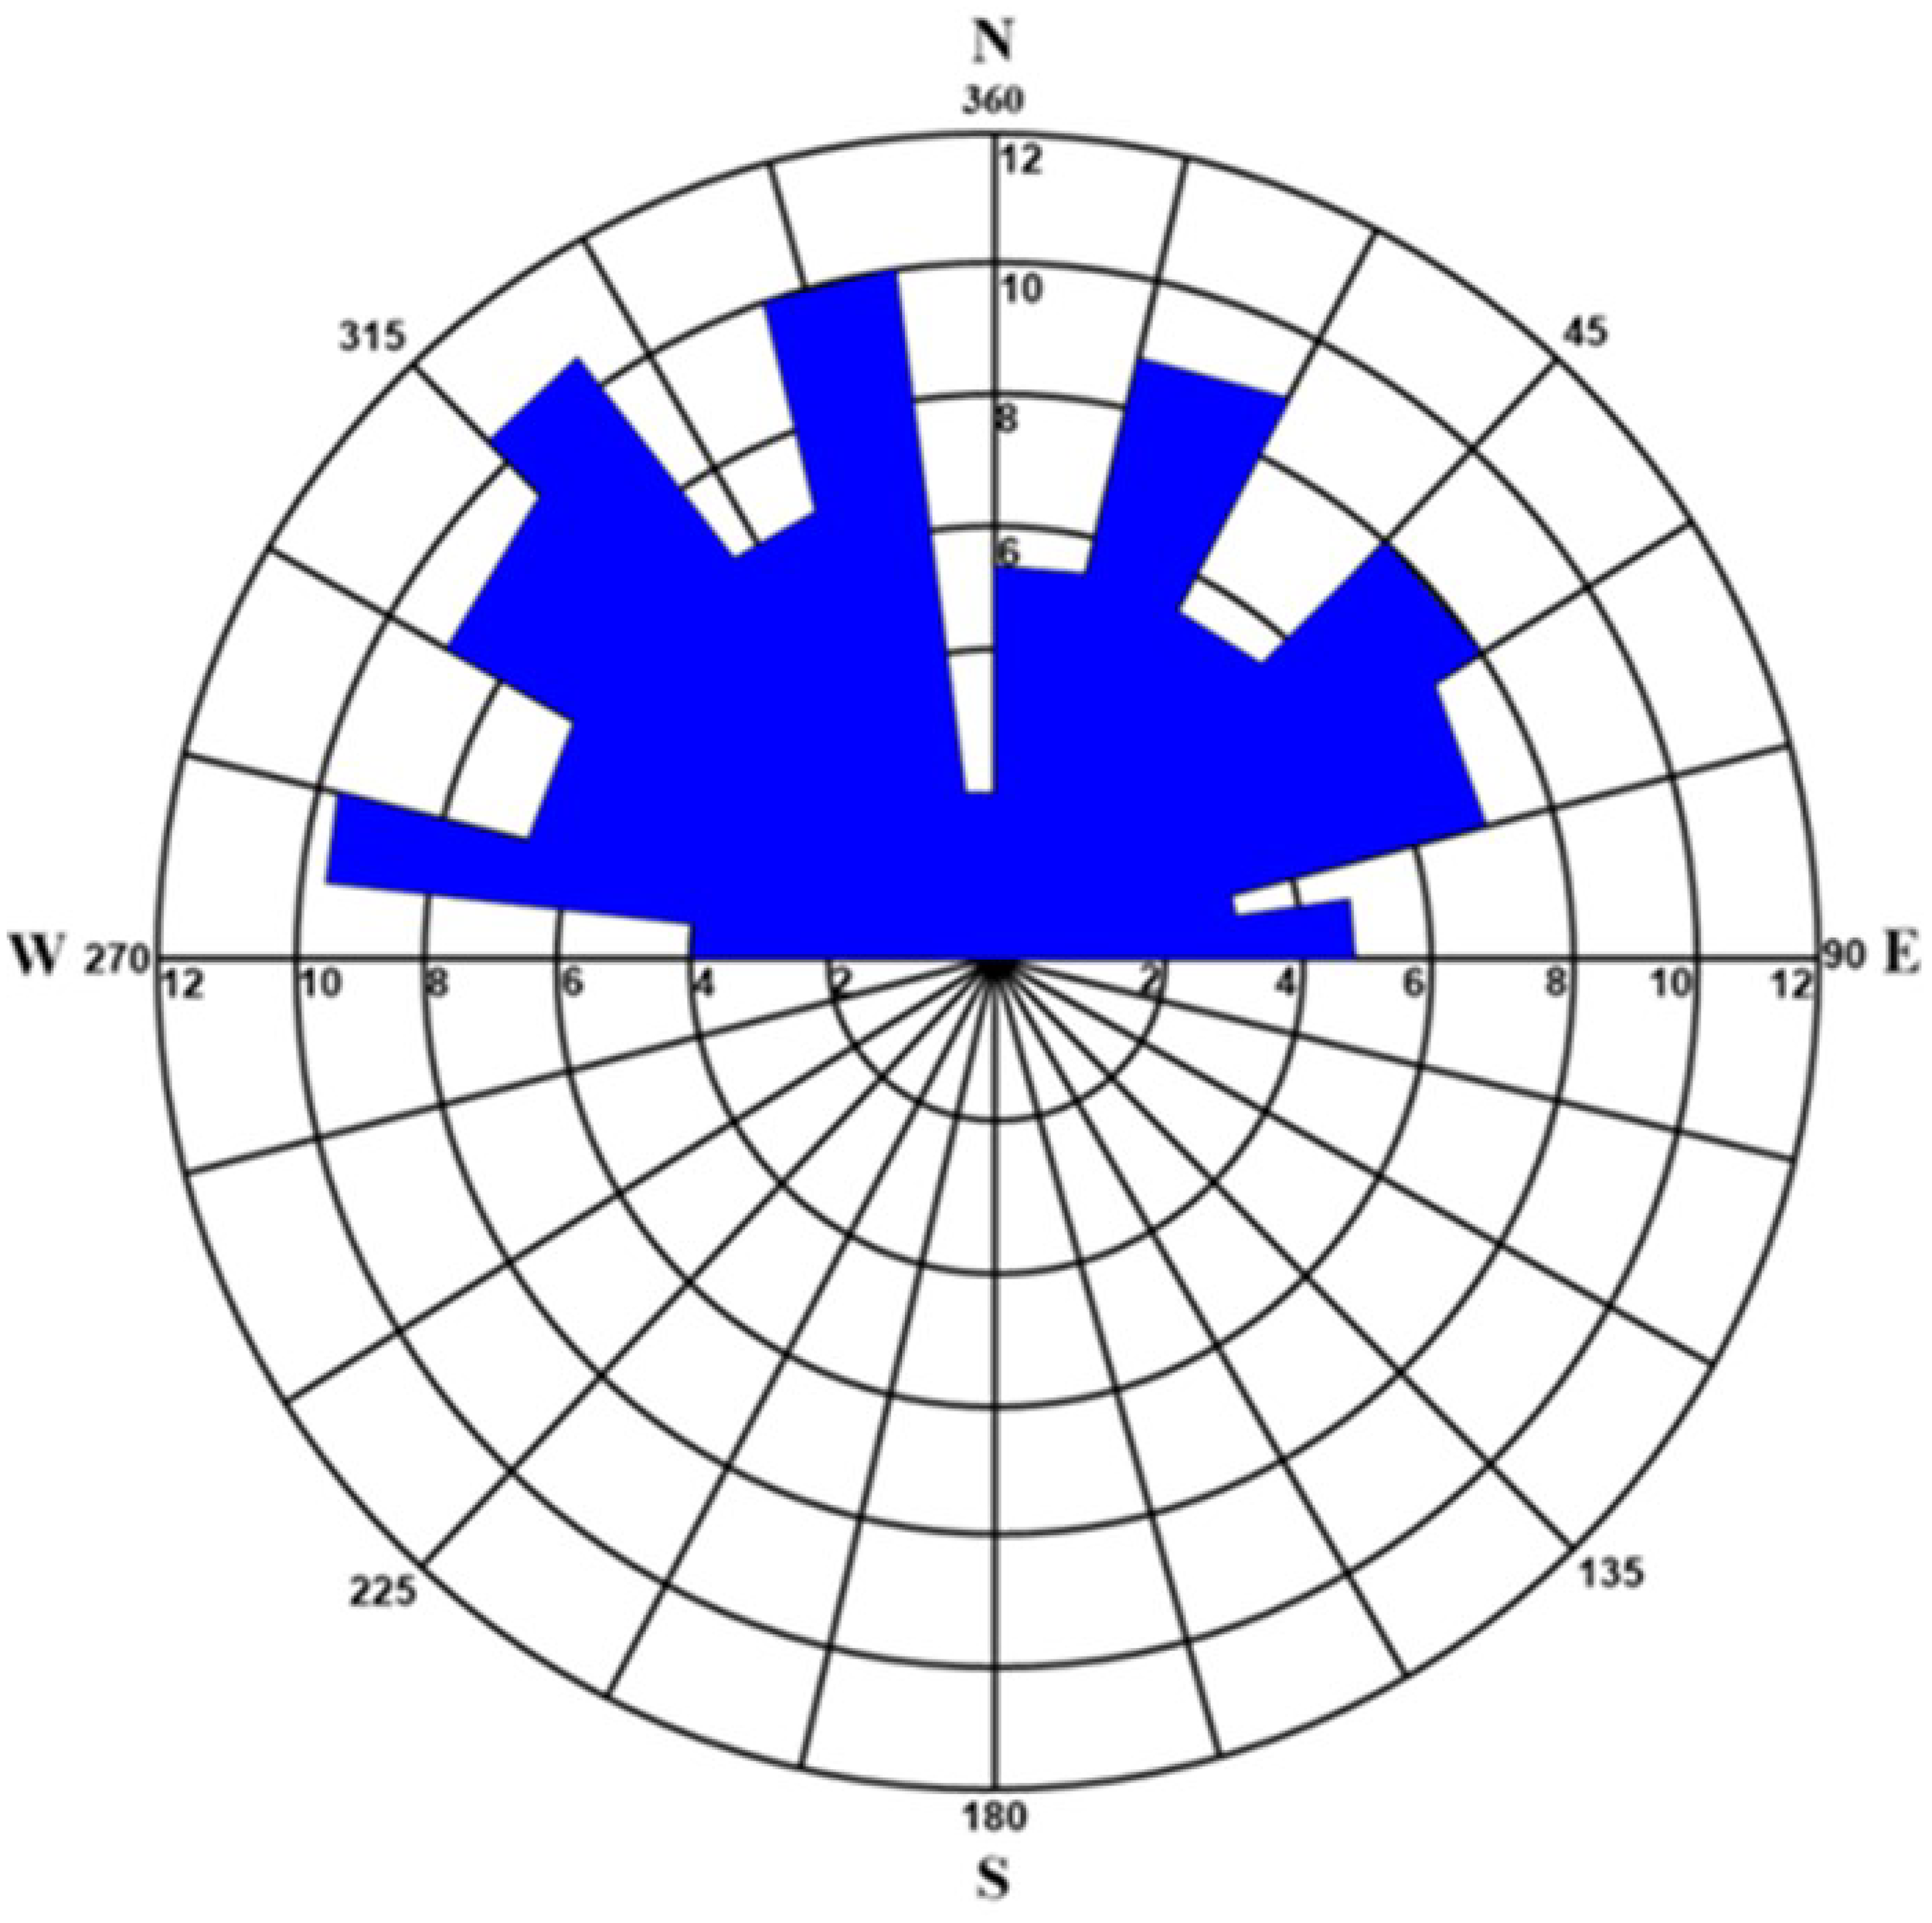
Lineament direction in the Wadi Araba Basin depicted by a rose diagram.
Lineament density is important in defining permeability zones because it provides subsurface flow channels that are necessary for groundwater movement. Higher lineament density is often related to larger groundwater potential since lineaments allow for enhanced flow and storage of subsurface water (Satapathy and Syed, 2015; Varade et al., 2018). Equation 1 expresses the mathematical connection between lineament density, total lineament length, and total region area.
The relationship between lineament density (LD), unit area (A), and lineament length (Li) is defined as follows:
High porosity is shown by highly dense lineaments, which denotes a favorable groundwater region (Figure 7b). Runoff quickly penetrates high-density lineament areas due to the interconnection of pores, indicating a significant potential for groundwater development. These places serve as effective groundwater reservoirs and provide springs with an outlet. ArcGIS determined the lineament density for the Wadi Araba Basin to be 0.23.
3.4.4 Land use land cover
Land Use and Land Cover (LULC) data were gathered from the Esri Sentinel-2 Landcover Explorer platform (https://livingatlas.arcgis.com) and processed using ArcGIS 10.8. A LULC map was created using a visual interpretation approach based on Sentinel-2A data at a spatial resolution of 10m. This interpretation was corroborated with high-resolution satellite images from Google Earth, yielding the LULC map shown in Figure 9.
Figure 9
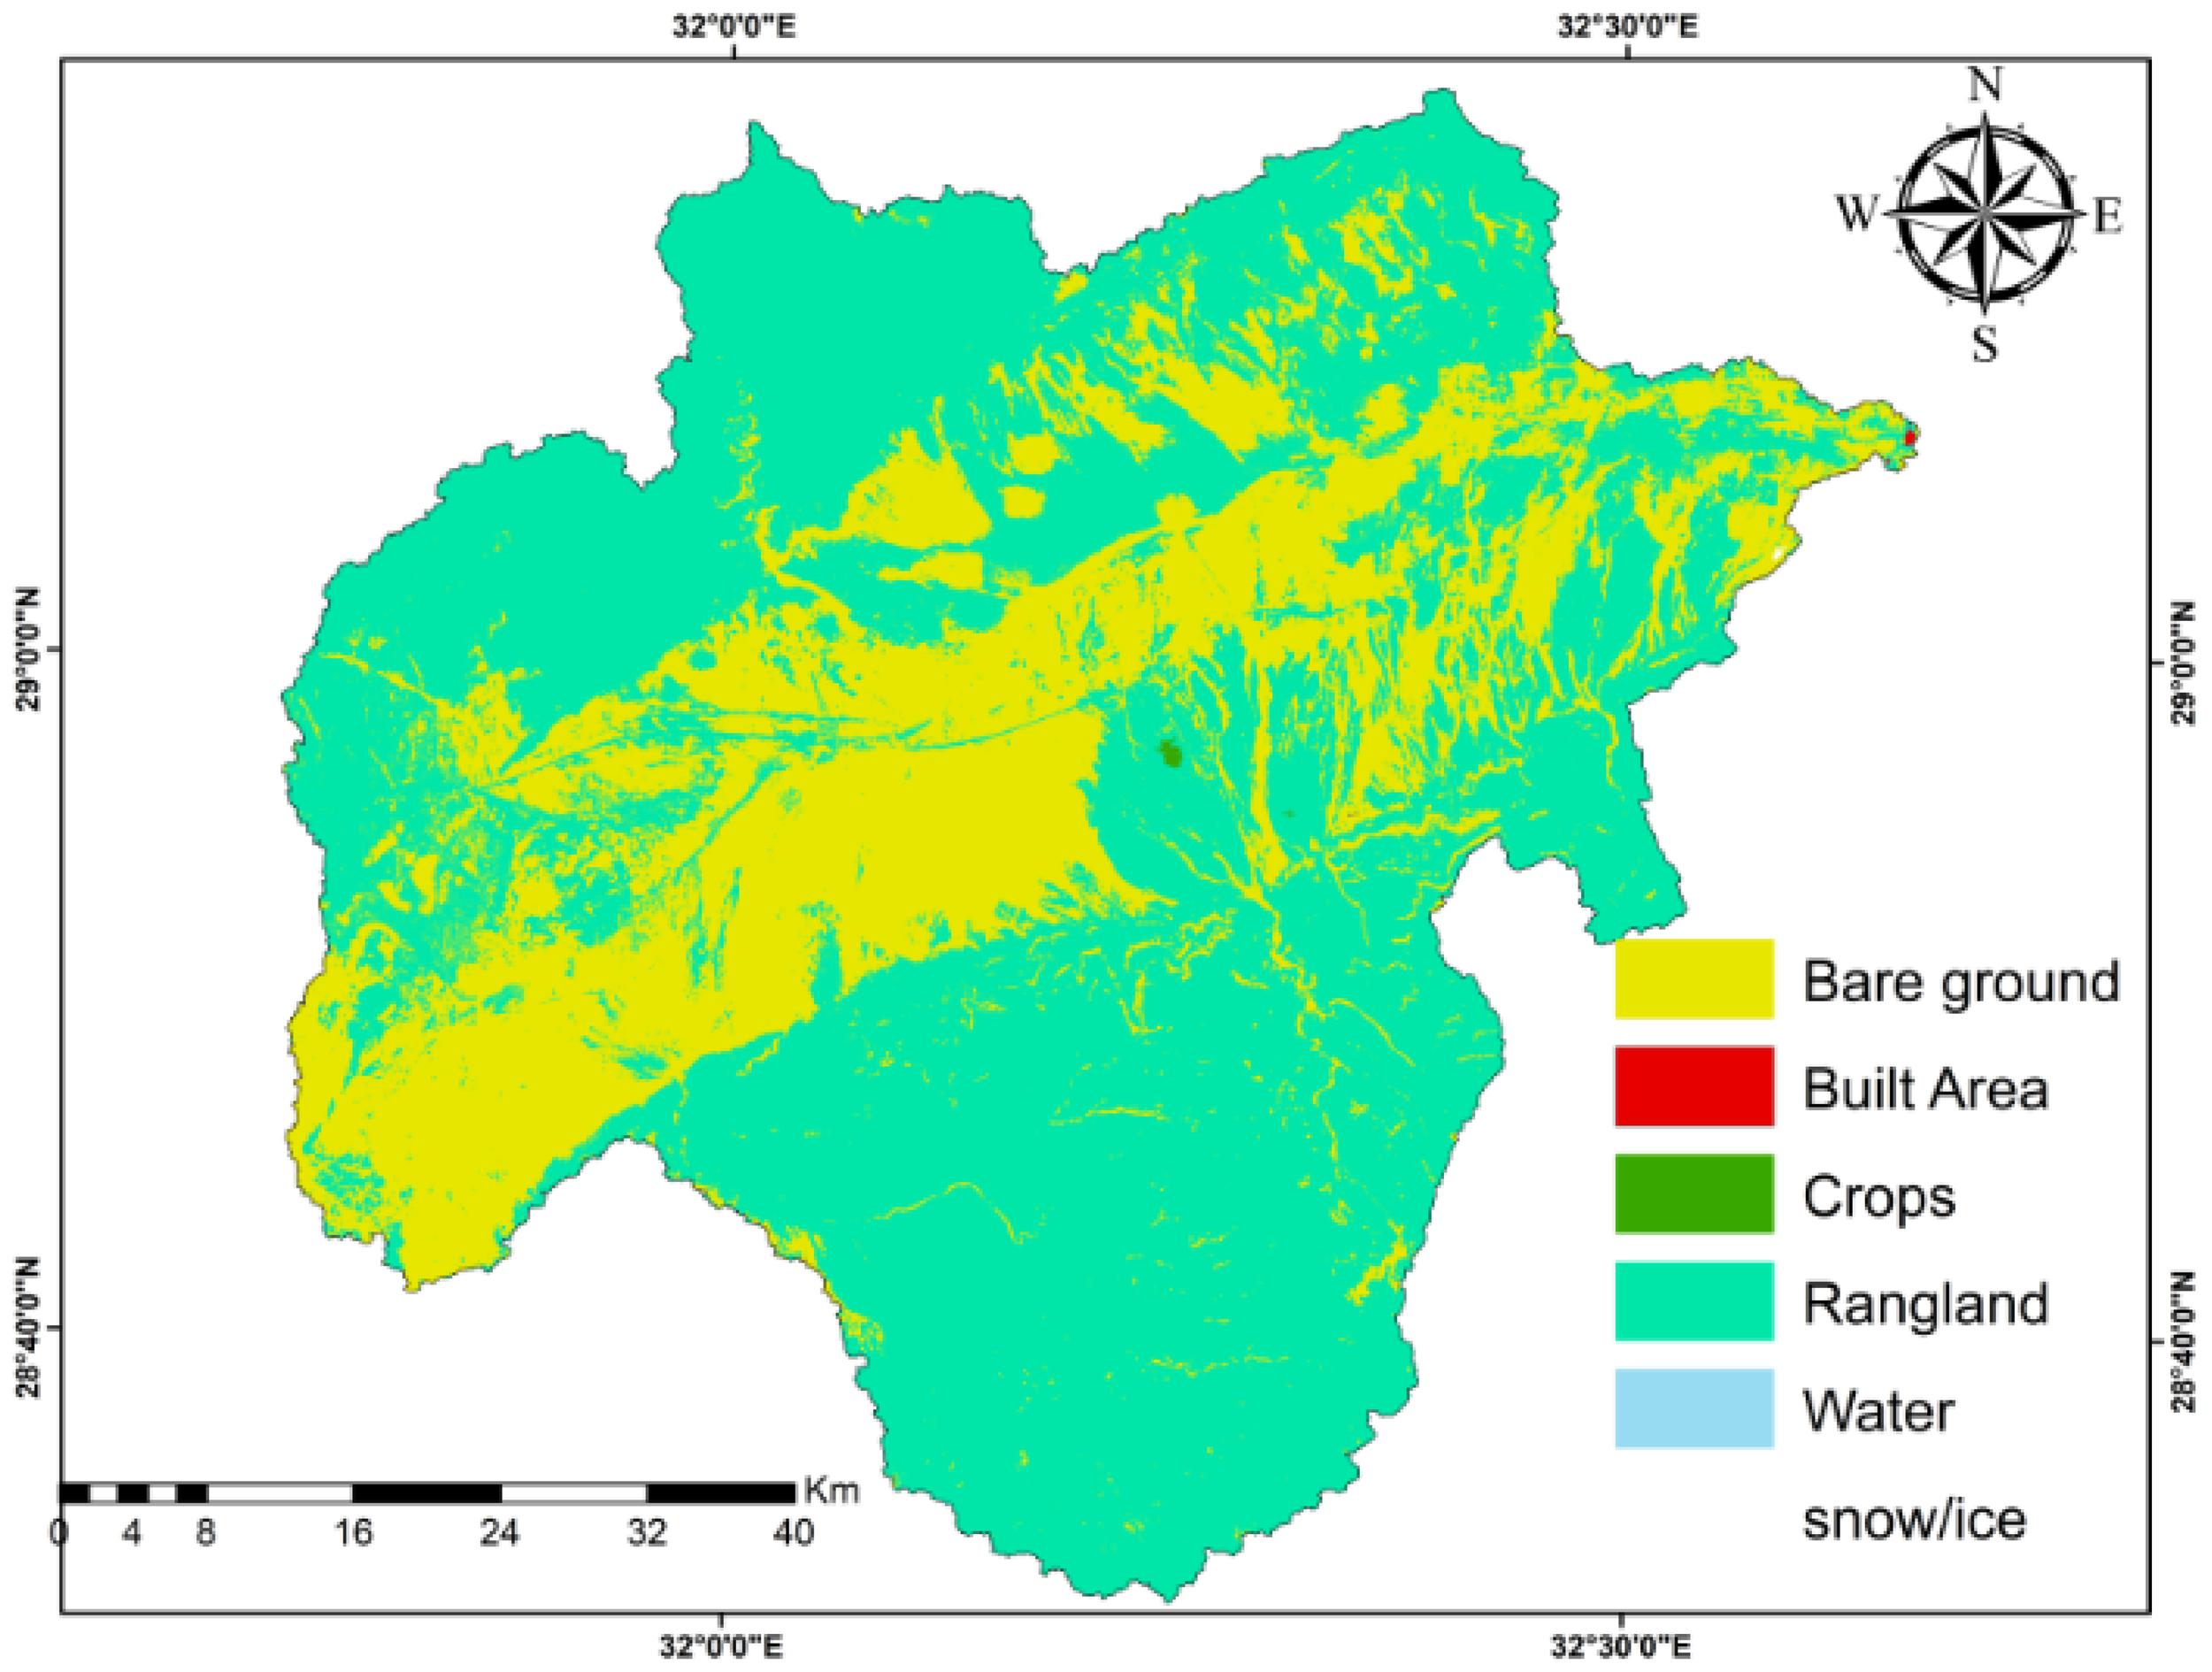
Landuse landcover classification (https://livingatlas.arcgis.com).
LULC influences hydrological processes such as evapotranspiration, infiltration, surface runoff, and water absorption, all of which contribute to groundwater recharge (Kumar et al., 2014). Land cover classes influence groundwater recharge in diverse ways, where rangelands and crops often increase infiltration because of the vegetative cover and soil permeability, while bare lands and built-up regions limit recharge due to heavy runoff or impermeable surfaces. Water bodies may locally enhance soil moisture, but they contribute little to subsurface recharging (Huang et al., 2013; Yeh et al., 2016).
The study area includes five primary LULC classifications, covering areas of 1379.2 km² for bare lands, 0.56 km² for built up areas, 1.3 km² for crops, 2811.98 km² for rangland and 0.24 km² for water bodies. These classifications reflect the diversity of land cover types and their varying impacts on regional hydrology of any study area.
3.4.5 Hydrological analysis
The morphometric properties of the Wadi Araba watershed were analyzed by GIS modeling and remote sensing approaches. Watershed boundaries and drainage patterns were derived from Shuttle Radar Topography Mission (SRTM) data and DEM. The analysis began by removing sinks from the DEM using the Fill tool in ArcGIS, resulting in elevation values ranging from 0 to 1481 meters (Figure 10a). Flow direction, which determines the path of water movement across the surface, was calculated using the Flow Direction tool, producing a raster map with values between 1 and 128 (Figure 10b) (Kaburi and Odera, 2014). The Flow Accumulation tool was then applied to aggregate the number of cells flowing into each downslope cell, creating a raster with values ranging from 0 to 5 (Figure 10c).
Figure 10
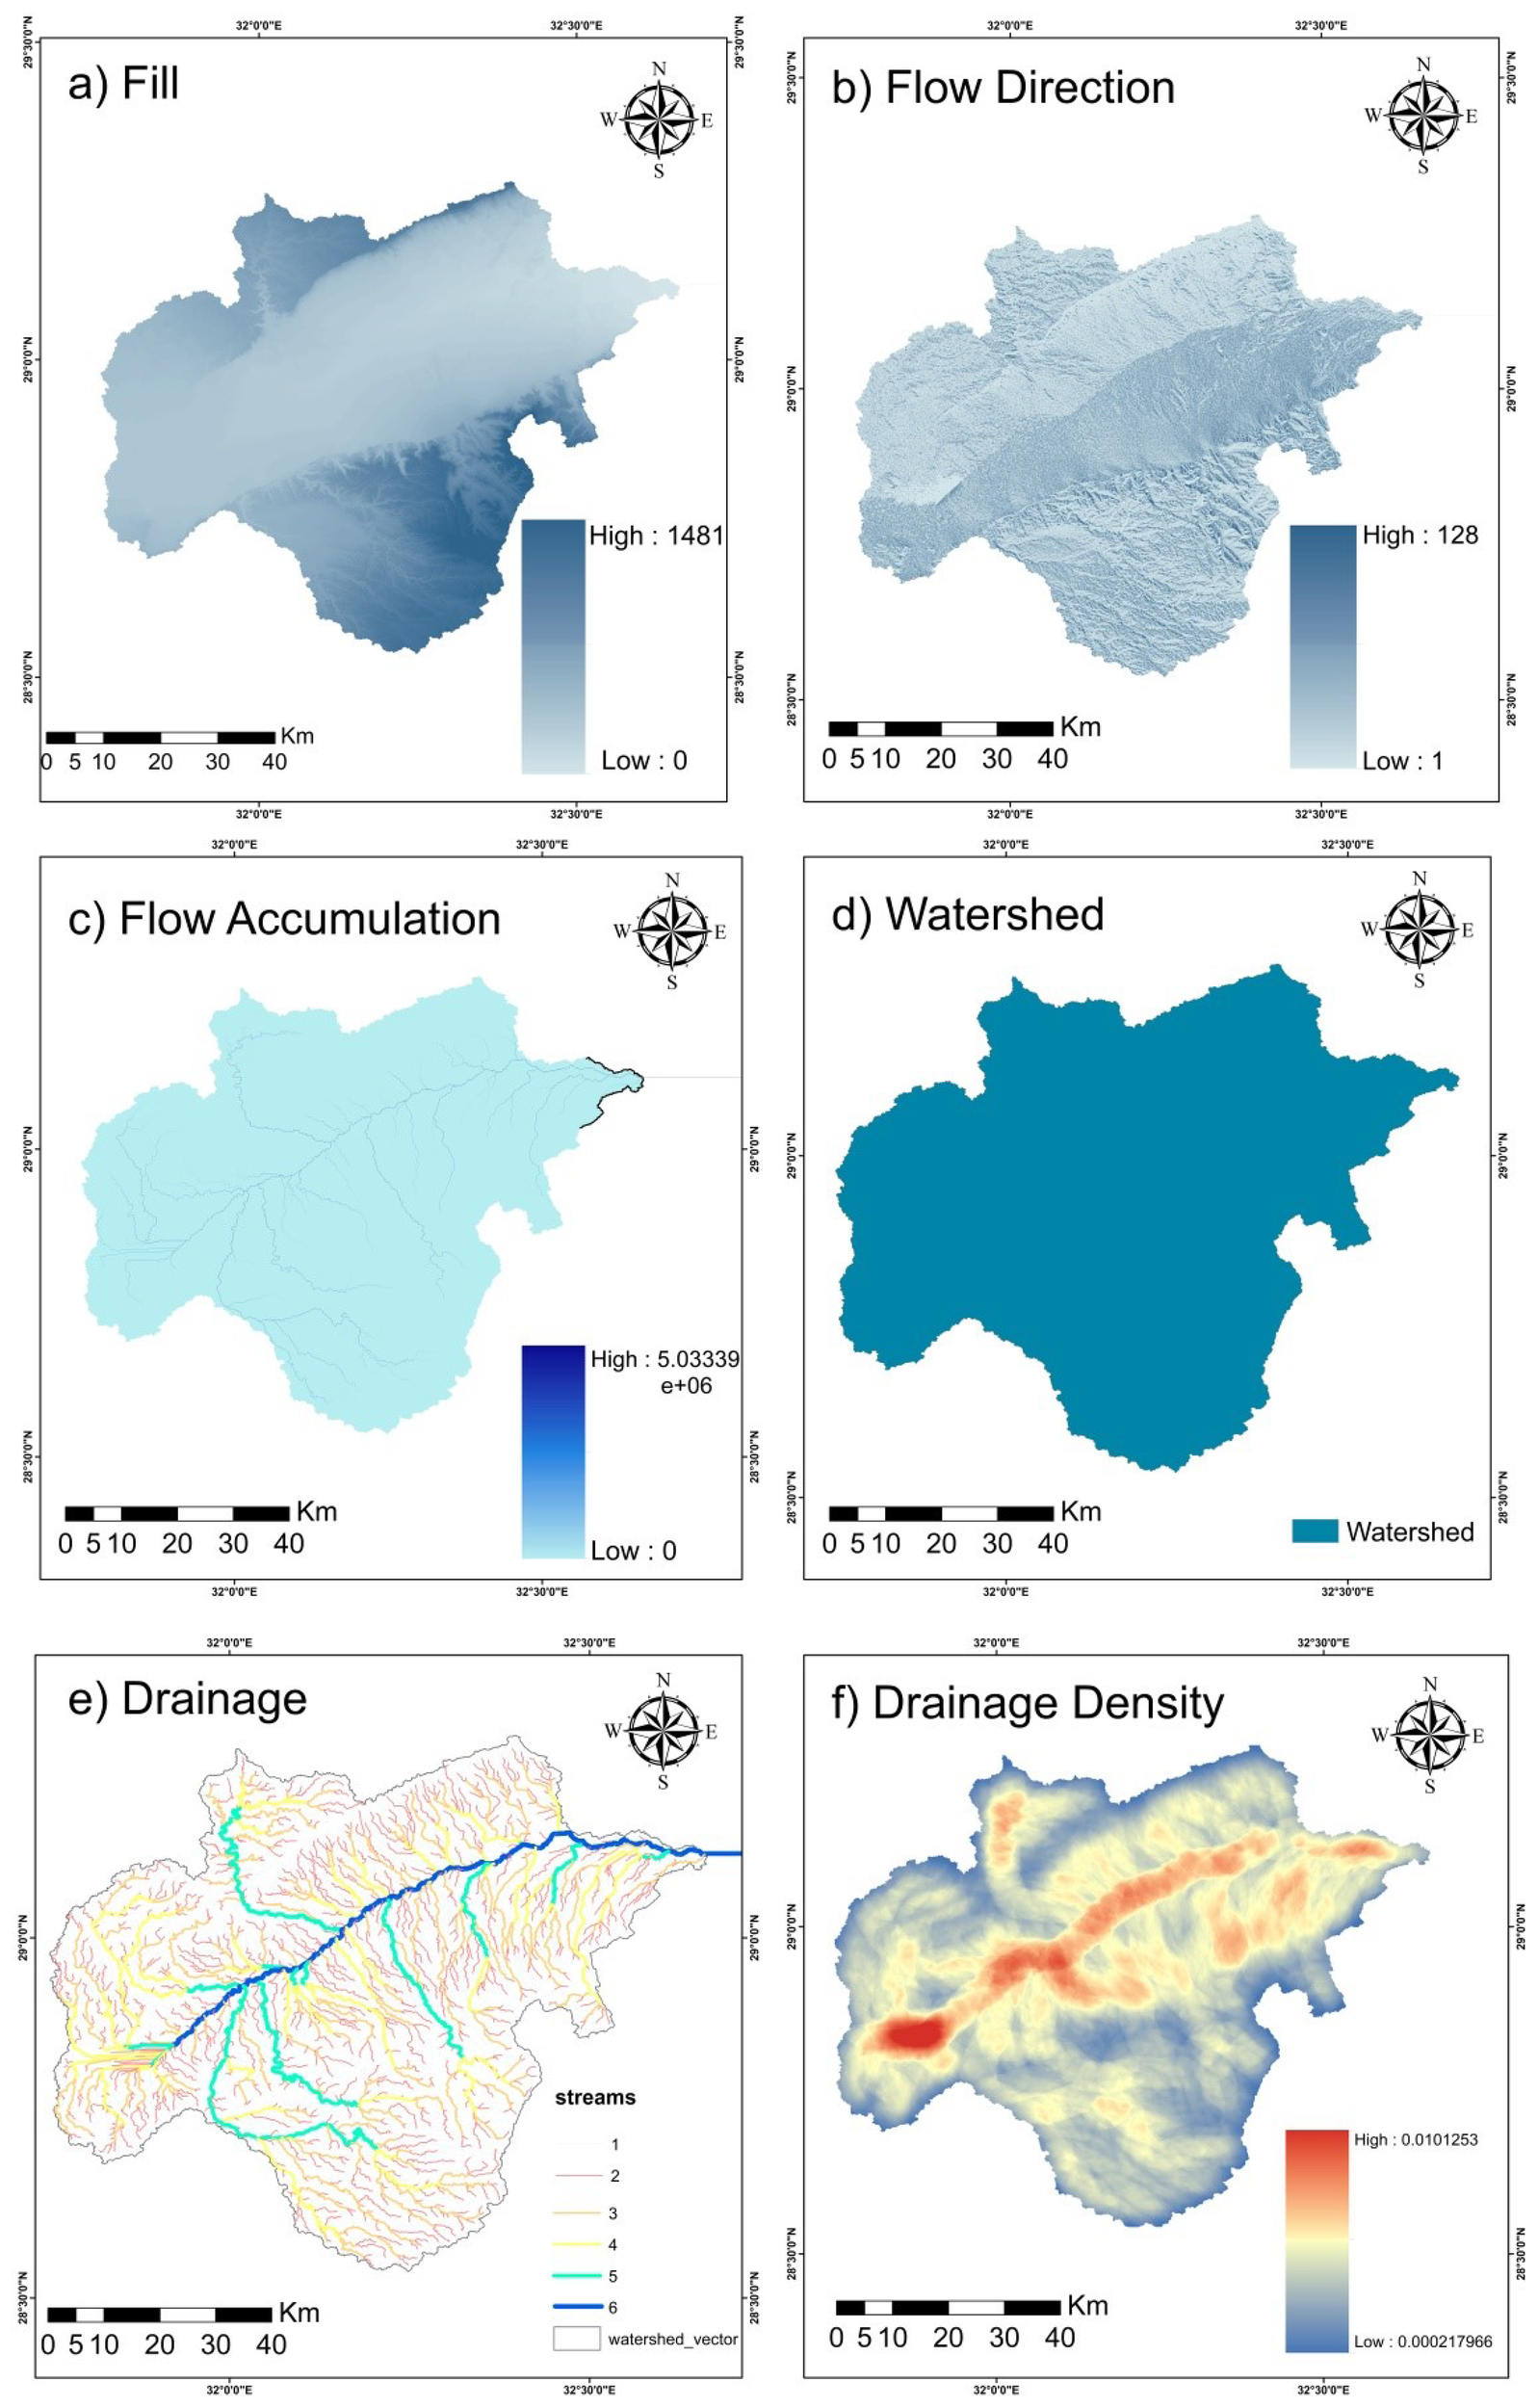
Hydrological analysis of Wadi Araba Basin (a) Fill, (b) Flow Direction, (c) Flow Accumulation, (d) Watershed, (e) Drainage and (f) Drainage Density.
Watershed:
A watershed is an area of land that collects and channels water from streams and rivers into larger bodies such as seas, rivers, or oceans. Watersheds not only separate drainage basins but also serve an important role in groundwater recharge, water filtering, and flood protection during high rainfall occurrences. This analysis found that the Wadi Araba watershed covers 4193.391 km² (Figure 10d).
Drainage system or Stream orders:
Strahler’s technique was used for assessing stream order, which is a measure of a river system’s complexity (Horton, 1945, 1952). This method classifies unbranched streams as first-order streams, and an intersection of two first-order streams results in a second-order stream. Similarly, higher-order streams emerge from the union of two streams of the same order. When streams with different orders intersect, the higher order is retained. Figure 10e shows the distribution of stream orders within the Wadi Araba watershed.
Drainage Density:
Drainage density, indicating the overall length of streams for each unit area, is an essential metric for evaluating surface runoff and groundwater potential. Regions exhibiting reduced drainage density exhibit increased infiltration rates and enhanced groundwater potential, whereas regions with greater drainage density are marked by inadequate infiltration and increased surface runoff (Yeh et al., 2009; Ansari et al., 2012; Pinto et al., 2017). Equation 2 (Horton, 1945) was employed to determine the drainage density of the Wadi Araba watershed, which was then categorized into five groups (Figure 10f). Values ranged from 0.000217966 (low) to 0.0101253 (high). High drainage density, observed primarily in the western part of the basin, indicates low groundwater potential, while medium and low-density areas, particularly along the mainstream paths, suggest moderate to high groundwater potential.
In this context, DD means drainage density, Dl signifies the length of the streams, and A represents the area of the watershed.
3.4.6 Geological units layer
The significance of geology in groundwater recharge has been consistently highlighted, as the porosity and permeability of subsurface resources are largely controlled by the nature of the subsurface rock units (Pande et al., 2018; Benjmel et al., 2020; Ifediegwu, 2022). Geological maps of the study area, scaled at 1:100,000, were acquired from the Earth Explorer platform (USGS; https://earthexplorer.usgs.gov) and then analyzed using ArcGIS 10.8. The maps were georeferenced using the UTM/WGS1984 geographic coordinates to ensure spatial accuracy.
The Wadi Araba basin comprises three primary sequences of pre-rift deposits overlying Precambrian crystalline basement rocks. These sequences arranged from the oldest to the youngest, include the Upper Cretaceous sequence, consisting of mixed clastic, carbonate, and chalk formations in Raha, Wata, Matulla, Sudr, and t. Anthony. The Cambrian-Lower Cretaceous sandstone sequence as Araba, Naqus, Abu Thora, Qiseib, and Malha formations, and the Paleocene-Eocene carbonate sequence in South Galala, Esna, and Thebes formations (Höntzsch et al., 2011; Moustafa and Khalil, 2017). The cliffs of the northern and southern Galala plateaus prominently expose rocks from the Lower Cretaceous to the Eocene, which surround and form the geological formations of the Wadi Araba basin (Supplementary 4a).
Field and satellite image analyses have shown that groundwater discharge in the Wadi Araba Basin is significantly influenced by the geological and structural settings. Springs are concentrated where the steeply dipping Lower Cretaceous–Senonian sandstones and shales intersect with the gently dipping Upper Senonian chalk and carbonates. This angular contrast places the high-conductivity sandstone aquifers next to the low-permeability carbonate and shale units, leading to preferential discharge zones along escarpments such as the southern Galala plateau and northern Galala plateau. Moreover, impermeable fault cores and highly conductive fault zones have been shown to compartmentalize the groundwater system and channel flow, producing localized variations in spring elevations and discharge patterns (Khalil et al., 2021).
3.4.7 Soil layer
Soil data for the Wadi Araba area were sourced from the (FAO) Division of Water and Land Resource Development (https://www.fao.org/land-water). Soils are essential in regulating the spatial distribution of underground water in the unsaturated zone, affecting processes including infiltration, retention, and movement. The Eastern Desert, which includes the Wadi Araba region, is predominantly covered by the Red Sea Mountains. These mountains are composed of metamorphic and igneous rocks, with surface Quaternary deposits forming alluvial hills and terraces. These deposits are primarily made up of gravel, sand, and fine clay minerals, further shaping the region’s hydrological dynamics.
According to (Rawls et al., 1983) Rawls et al.’s (1982) texture-hydraulic conductivity relationships, Calcaric Fluvisols (sandy texture) have greater permeability ranges (Ks = 10-4-10-5 m/s), which support recharging. Eutric Regosols (sandy loam) have a considerable permeability (Ks ≈ 10-6-10-5 m/s), while Calcic Yermosols (loam) have lower values (Ks ≈ 10-7-10-6). Lithosols, often shallow and clayey, have extremely poor permeability (<10-7 m/s). These results are compatible with global pedotransfer datasets and support the weighting approach (5, 3, 1, 1) used in the AHP matrix.
The soil in the Wadi Araba region is classified into four main categories according to geological zones (Baxter, 2007). The first group comprises Calcaric Fluvisols, characterized as sandy soils and gravelly lithosols located in arid plains and rocky hills. These soils are generally coarse textured and promoting rapid drainage that limit water recharge. The second category is Eutric Regosols consists of gravelly and sandy soils that dominate beach areas and include exposed rock outcrops. This provides moderate infiltration potential within the study area. The third class is Calcic Yermosols (Yk) which represents soils with a calcic horizon about 125cm of the surface act as arid zones. These soils are often associated with reduced permeability which can restrict water infiltration. The final category encompasses other soils primarily found on dissected limestone plateaus with lithosols. These soils are shallow, fragmented, and limited in their capacity to support substantial groundwater recharge. The distribution and characteristics of these soil types are mapped in Supplementary 4b and detailed further in Table 2. These classifications illustrate the relationship between soil properties and geological formations for the evaluation of groundwater recharge in the area.
Table 2
| Soil type | Area (Km²) |
|---|---|
| Calcic Yermosols (Yk) | 343.23 |
| Eutric Regosols (Re) | 65.09 |
| Calcaric Fluvisols (Jc) | 1730.92 |
| Lithosols (I) | 2053.42 |
Area of soil types in Wadi Araba.
3.5 GIS-based hydrological potential model
The identification of groundwater potential zones in the study area was achieved through the application of GIS-weighted overlay analysis, developed using the multi-criteria Analytical Hierarchy Process (AHP) approach. This method integrates various geospatial and environmental factors to delineate zones with differing groundwater recharge potential. The study area was classified into three primary categories of groundwater potential: low, intermediate, and high recharge zones. As depicted in Supplementary 5 and detailed in Table 3, these zones cover 1143.957 km² (28.45%), 2287.447 km² (56.9%), and 588.95 km² (14.65%) of the total surface area, respectively. The intermediate zone comprises the predominant portion of the studied region, but the high-potential recharging zones, despite their limited spatial coverage, are essential for targeted groundwater resource management.
Table 3
| Class | Area (Km²) | Percentage (%) |
|---|---|---|
| Low | 1143.957 | 28.45% |
| Moderate | 2287.447 | 56. 9% |
| High | 588.95 | 14.65% |
The groundwater potential zone’s area and percentage (%) are provided.
3.5.1 Thematic layers
The groundwater potential in this research area was evaluated through the combination of ten thematic layers in ArcMap 10.8, which represent critical environmental and geospatial factors: elevation, slope, land use/land cover (LULC), density of drainage, the soil, the density of lineaments, geology, air temperature, rainfall and land surface temperature (Figure 11). Each layer contributes to understanding the dynamics of groundwater recharge, with elevation and slope influencing water flow and infiltration, while LULC, soil, and geology affect water retention and permeability. Drainage and lineament densities highlight areas of surface runoff and structural features enhancing subsurface flow. Rainfall serves as the primary recharge source, while air and land surface temperatures impact evapotranspiration and soil moisture dynamics. This technique ensures an all-encompassing comprehension of the hydrological processes shaping groundwater potential, supporting effective resource management. Since rainfall is the primary source of groundwater recharge in arid basins, it was given the highest weight (30%) in the AHP study. However, the hyper-arid climate and the coarse resolution of the available datasets limit the geographical variability of rainfall across Wadi Araba (Figure 11f). Therefore, rainfall is a major determinant of the overall recharge potential, but its spatial distribution has a negligible impact in comparison to other controlling variables like slope, lithology, and lineament density. This difference explains why the weighting scheme emphasises rainfall, even though the map itself only displays a small amount of geographic variation.
Figure 11
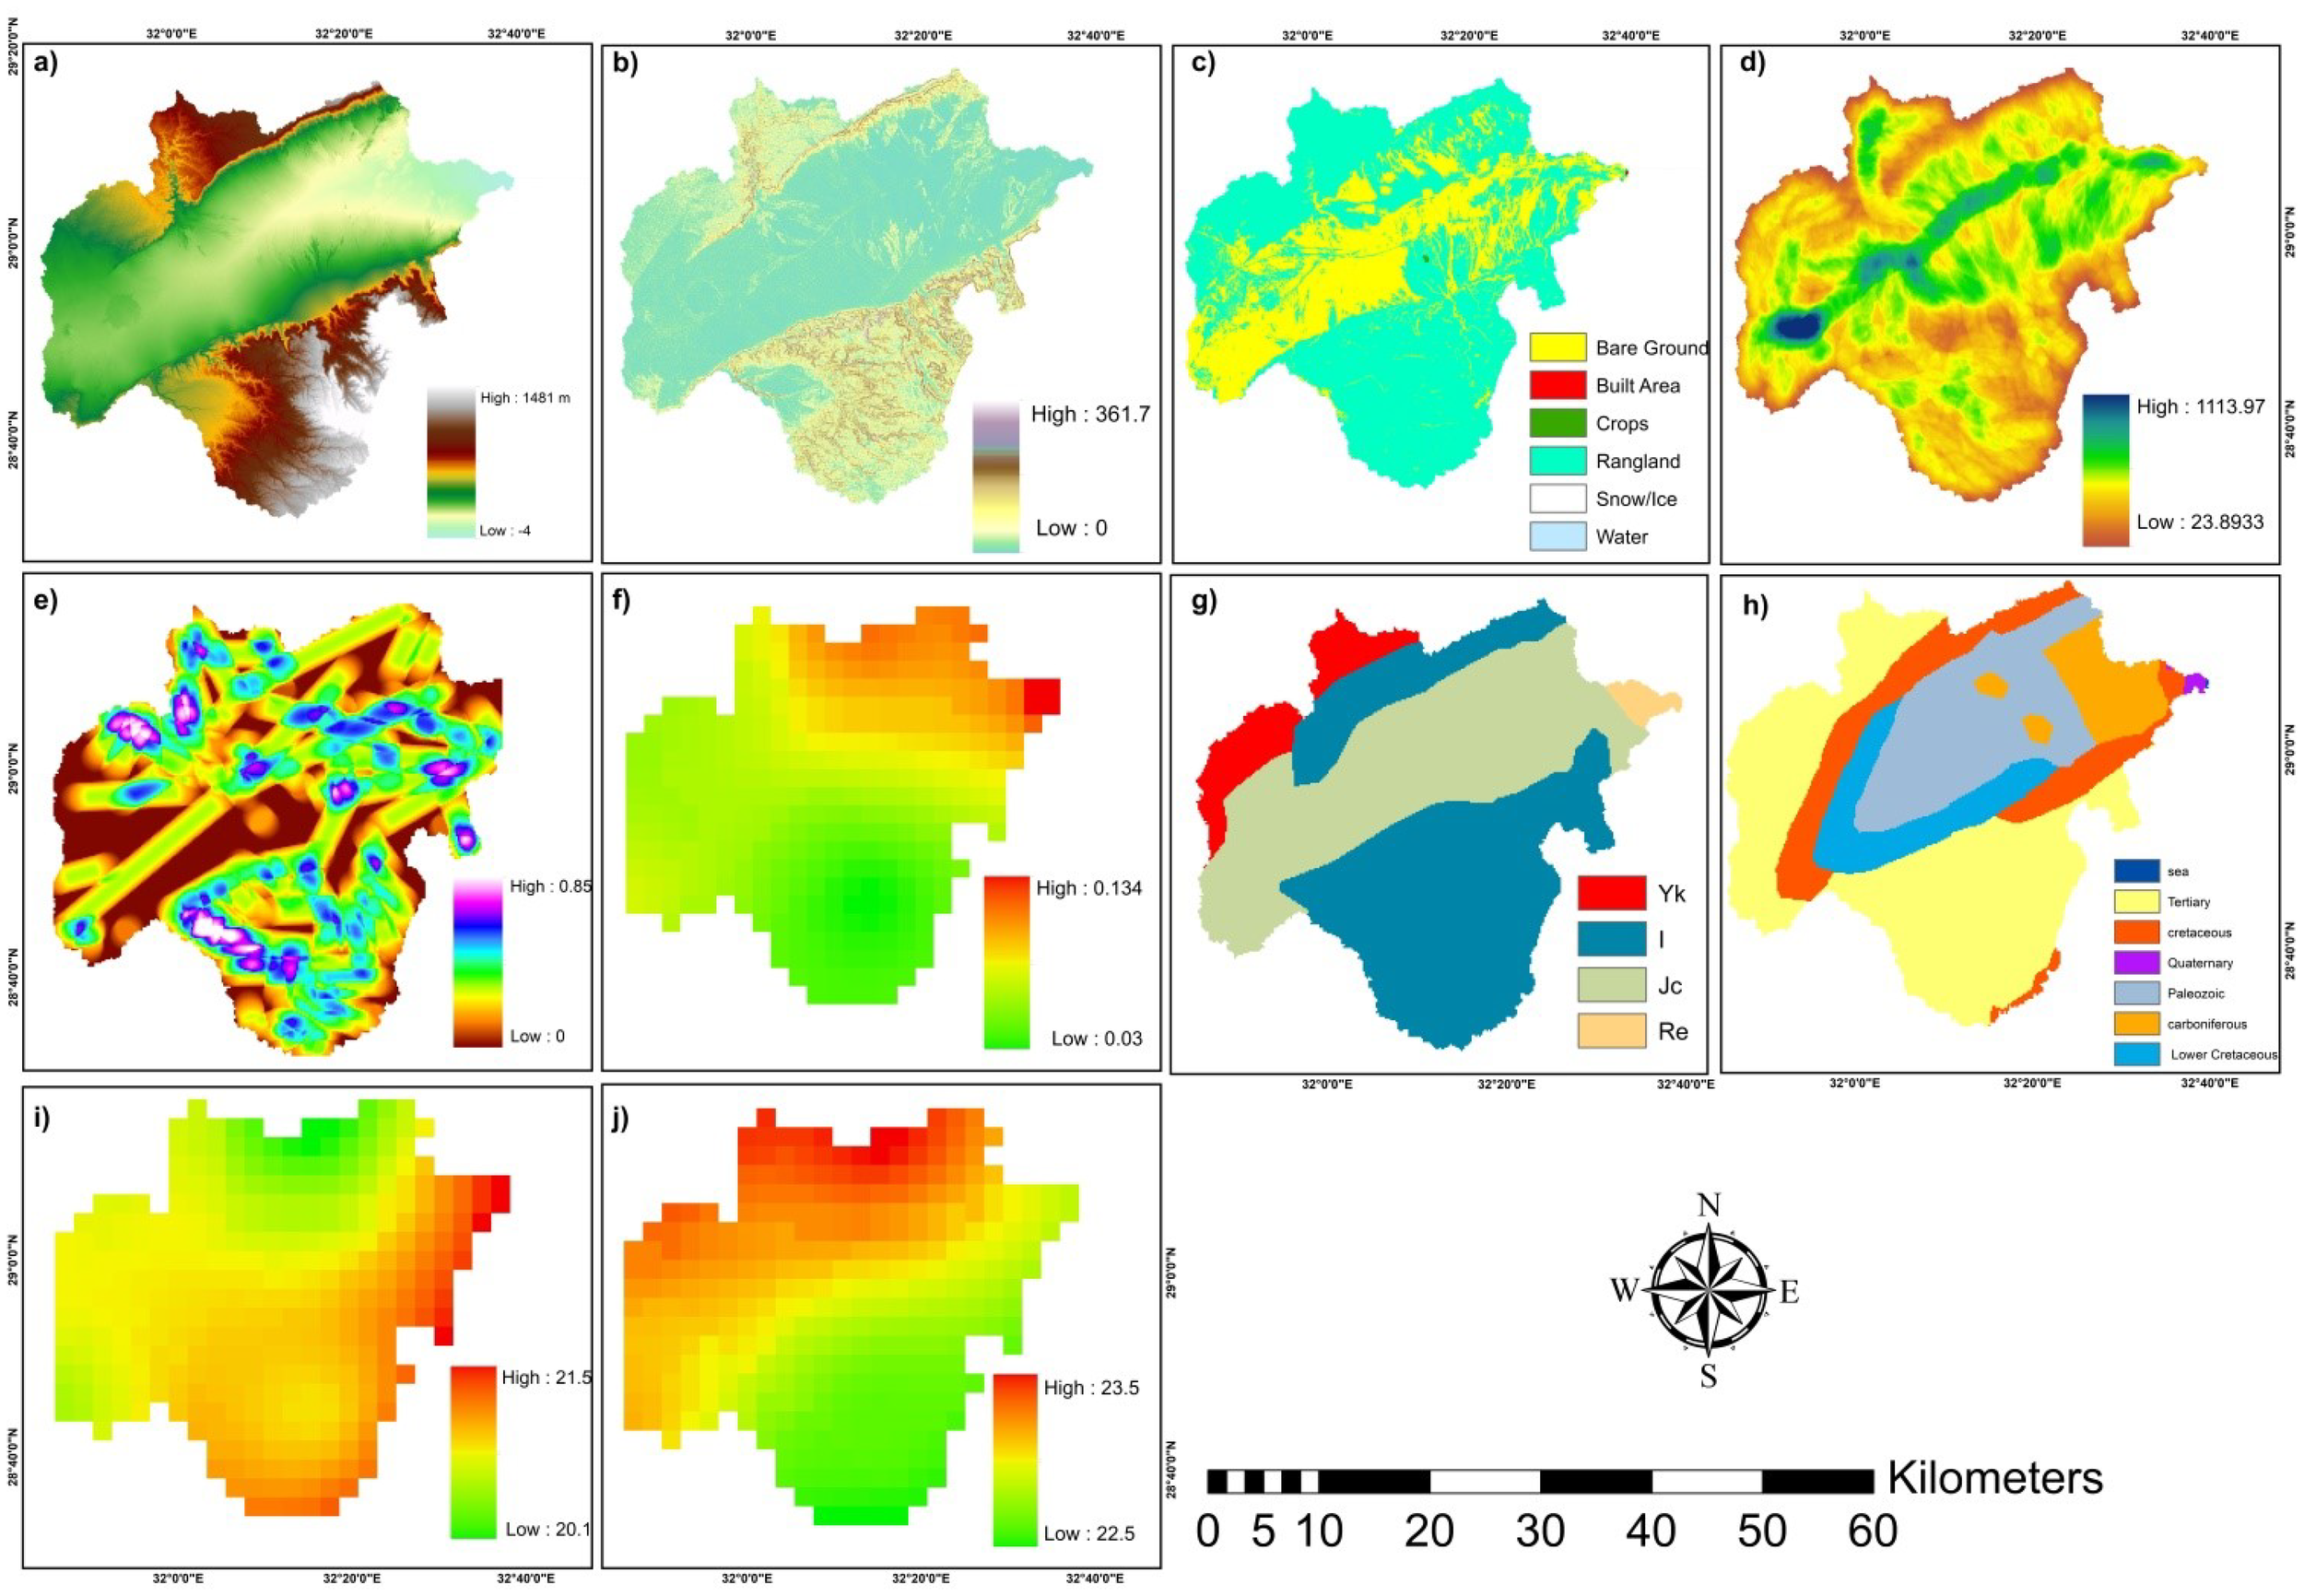
The 10 thematic layers used in AHP method. (a) Elevation, (b) Slope, (c) LULC, (d) Drainage Density, (e) lineament Density, (f) Rainfall, (g) soil, (h) Geology, (i) Air Temperature and (j) Surface Land Temperature.
3.5.2 Reclassification of thematic layers
The ten variables were reclassified using the spatial analyst tool in the arc toolbox in order to obtain the 5 classes of the same cell size of 30m (Figure 12).
Figure 12
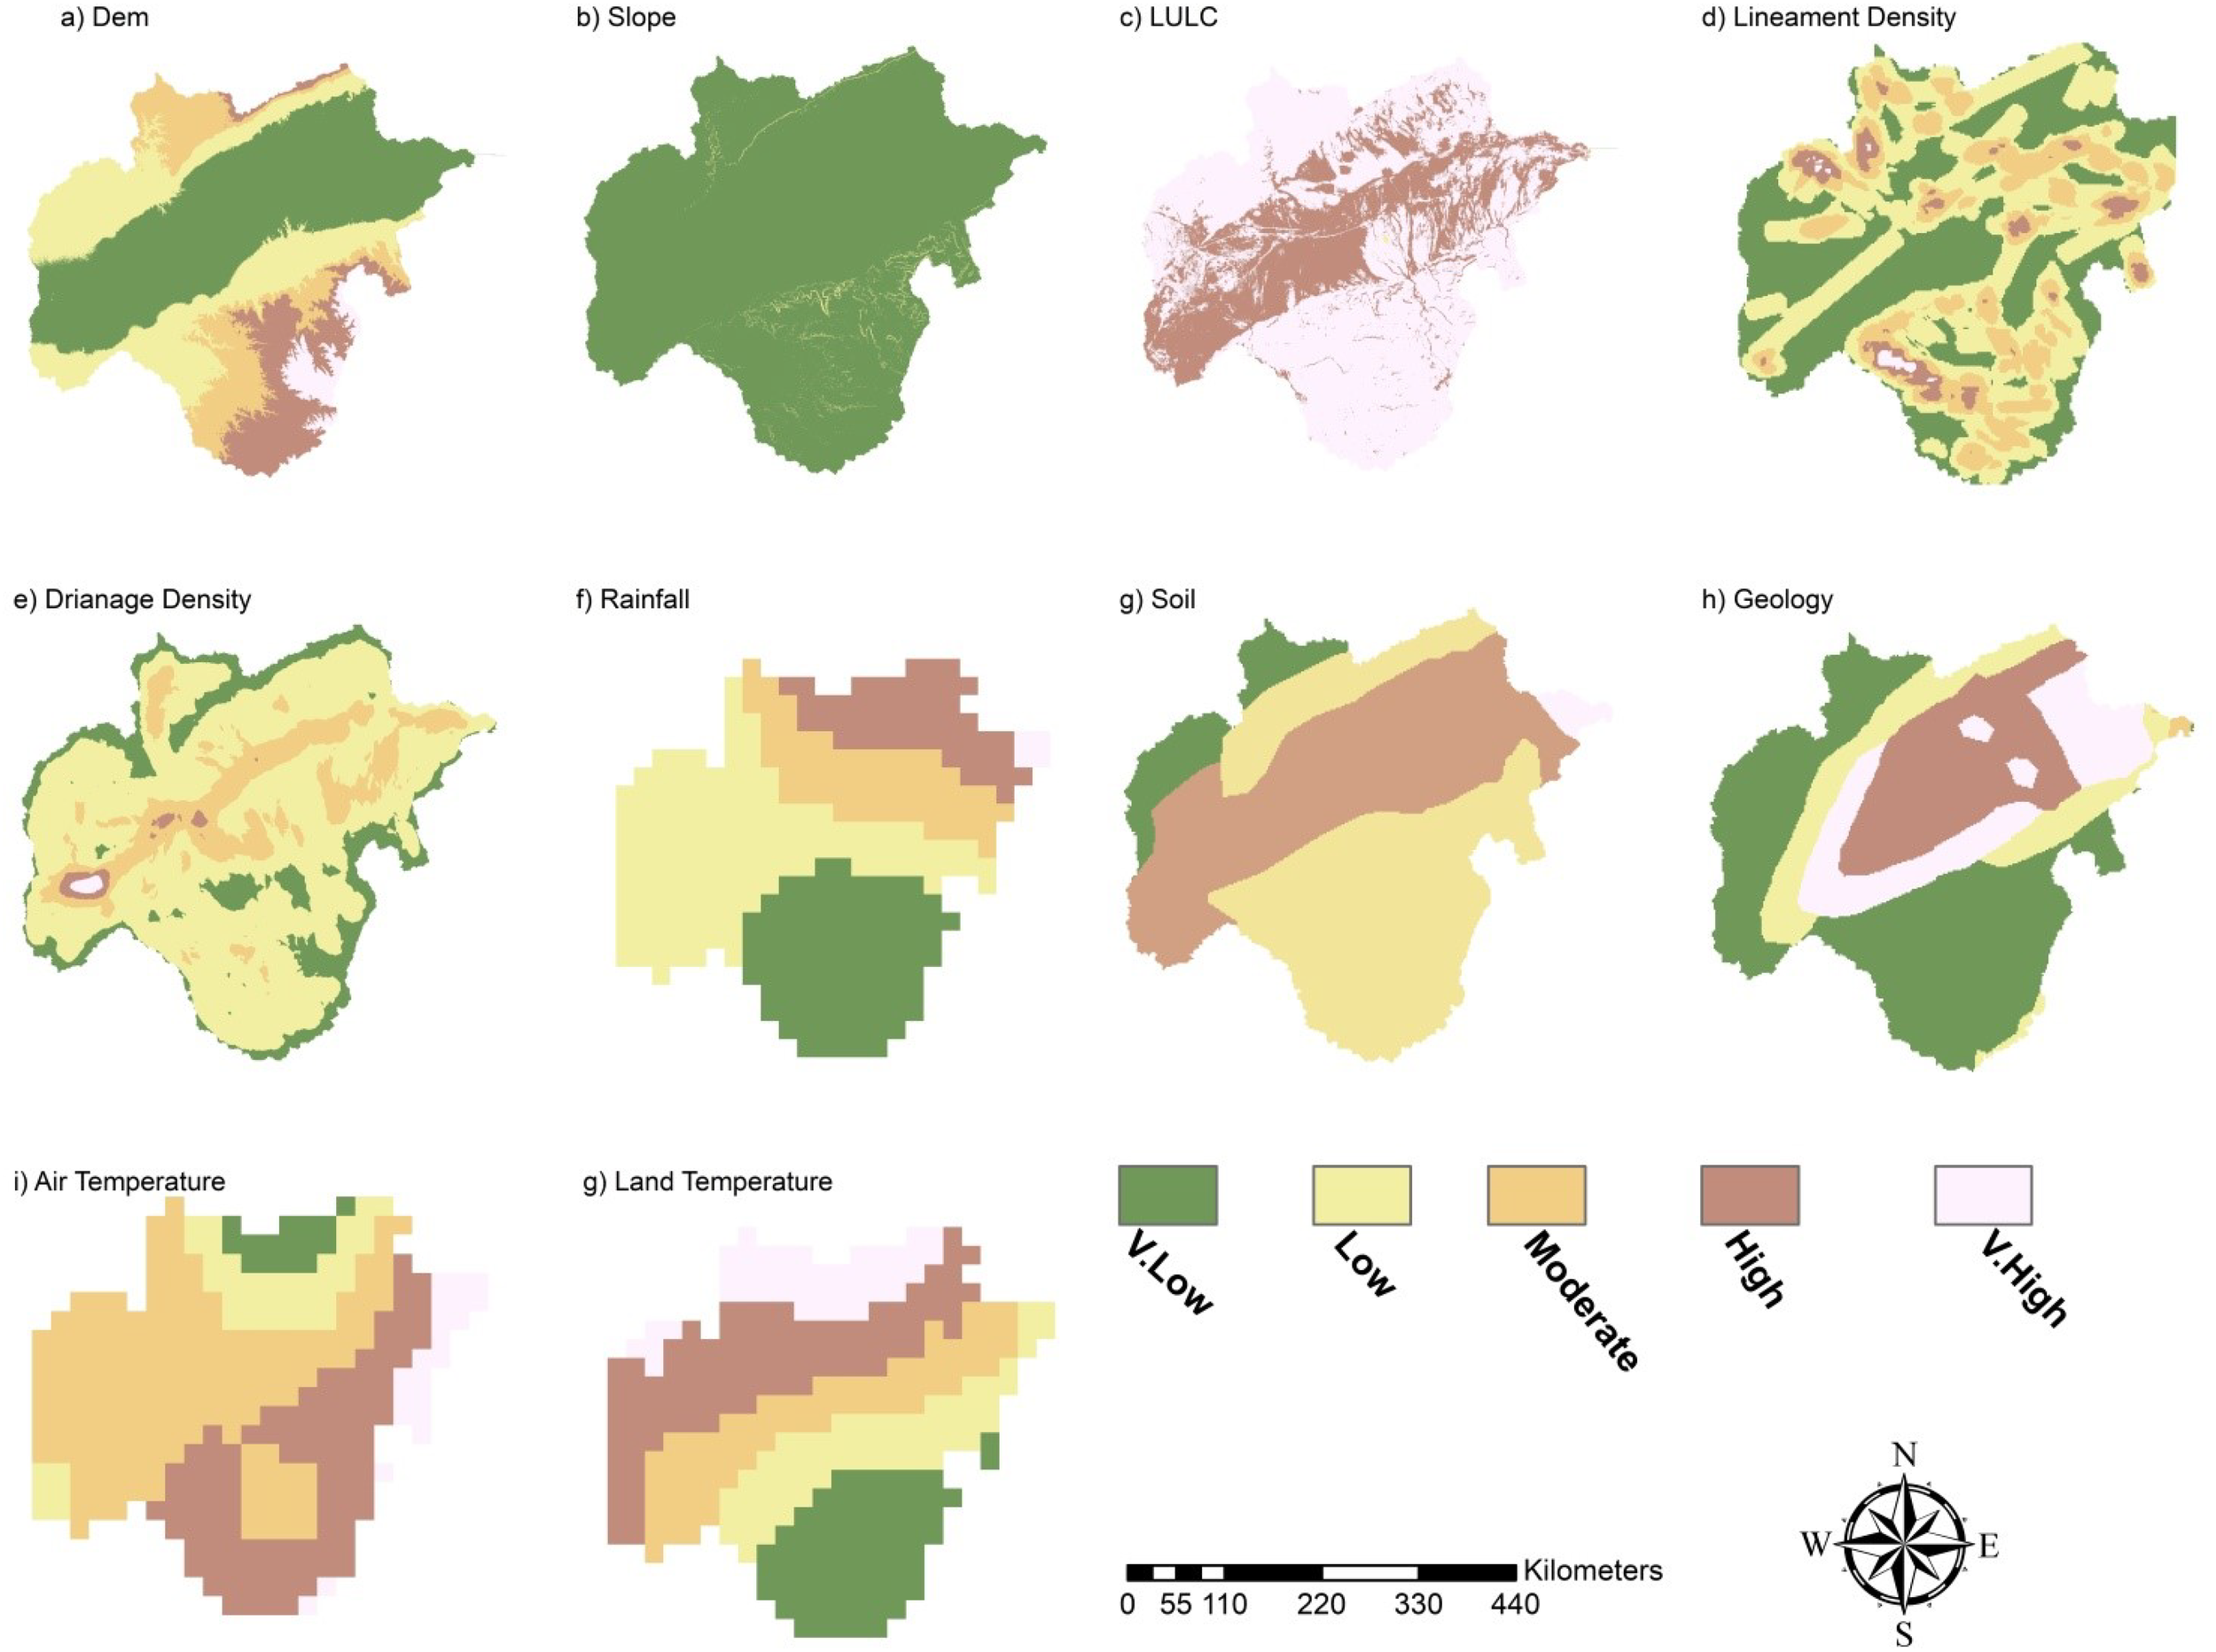
The ten thematic layers that were reclassified into five classes: (a) DEM, (b) Slope, (c) LULC, (d) Lineament Density, (e) Drainage Density, (f) Rainfall, (g) Soil, (h) Geology, (i) Air Temperature, and (j) Land Temperature.
3.5.3 Normalized thematic layer weights and rank
The weights attributed to the thematic maps were determined using the Analytical Hierarchy Process (AHP) technique (Saaty, 2008). As the influence of each layer on groundwater potential varies (Figure 13) a weighting scale ranging from 1 to 9 was applied to each layer based on its relative significance and capacity for water recharge (Table 4). These weights were informed by prior research conducted in various regions worldwide, incorporating field-based observations and expertise (Tables 5, 6) (Mu and Pereyra-Rojas, 2016).
Figure 13
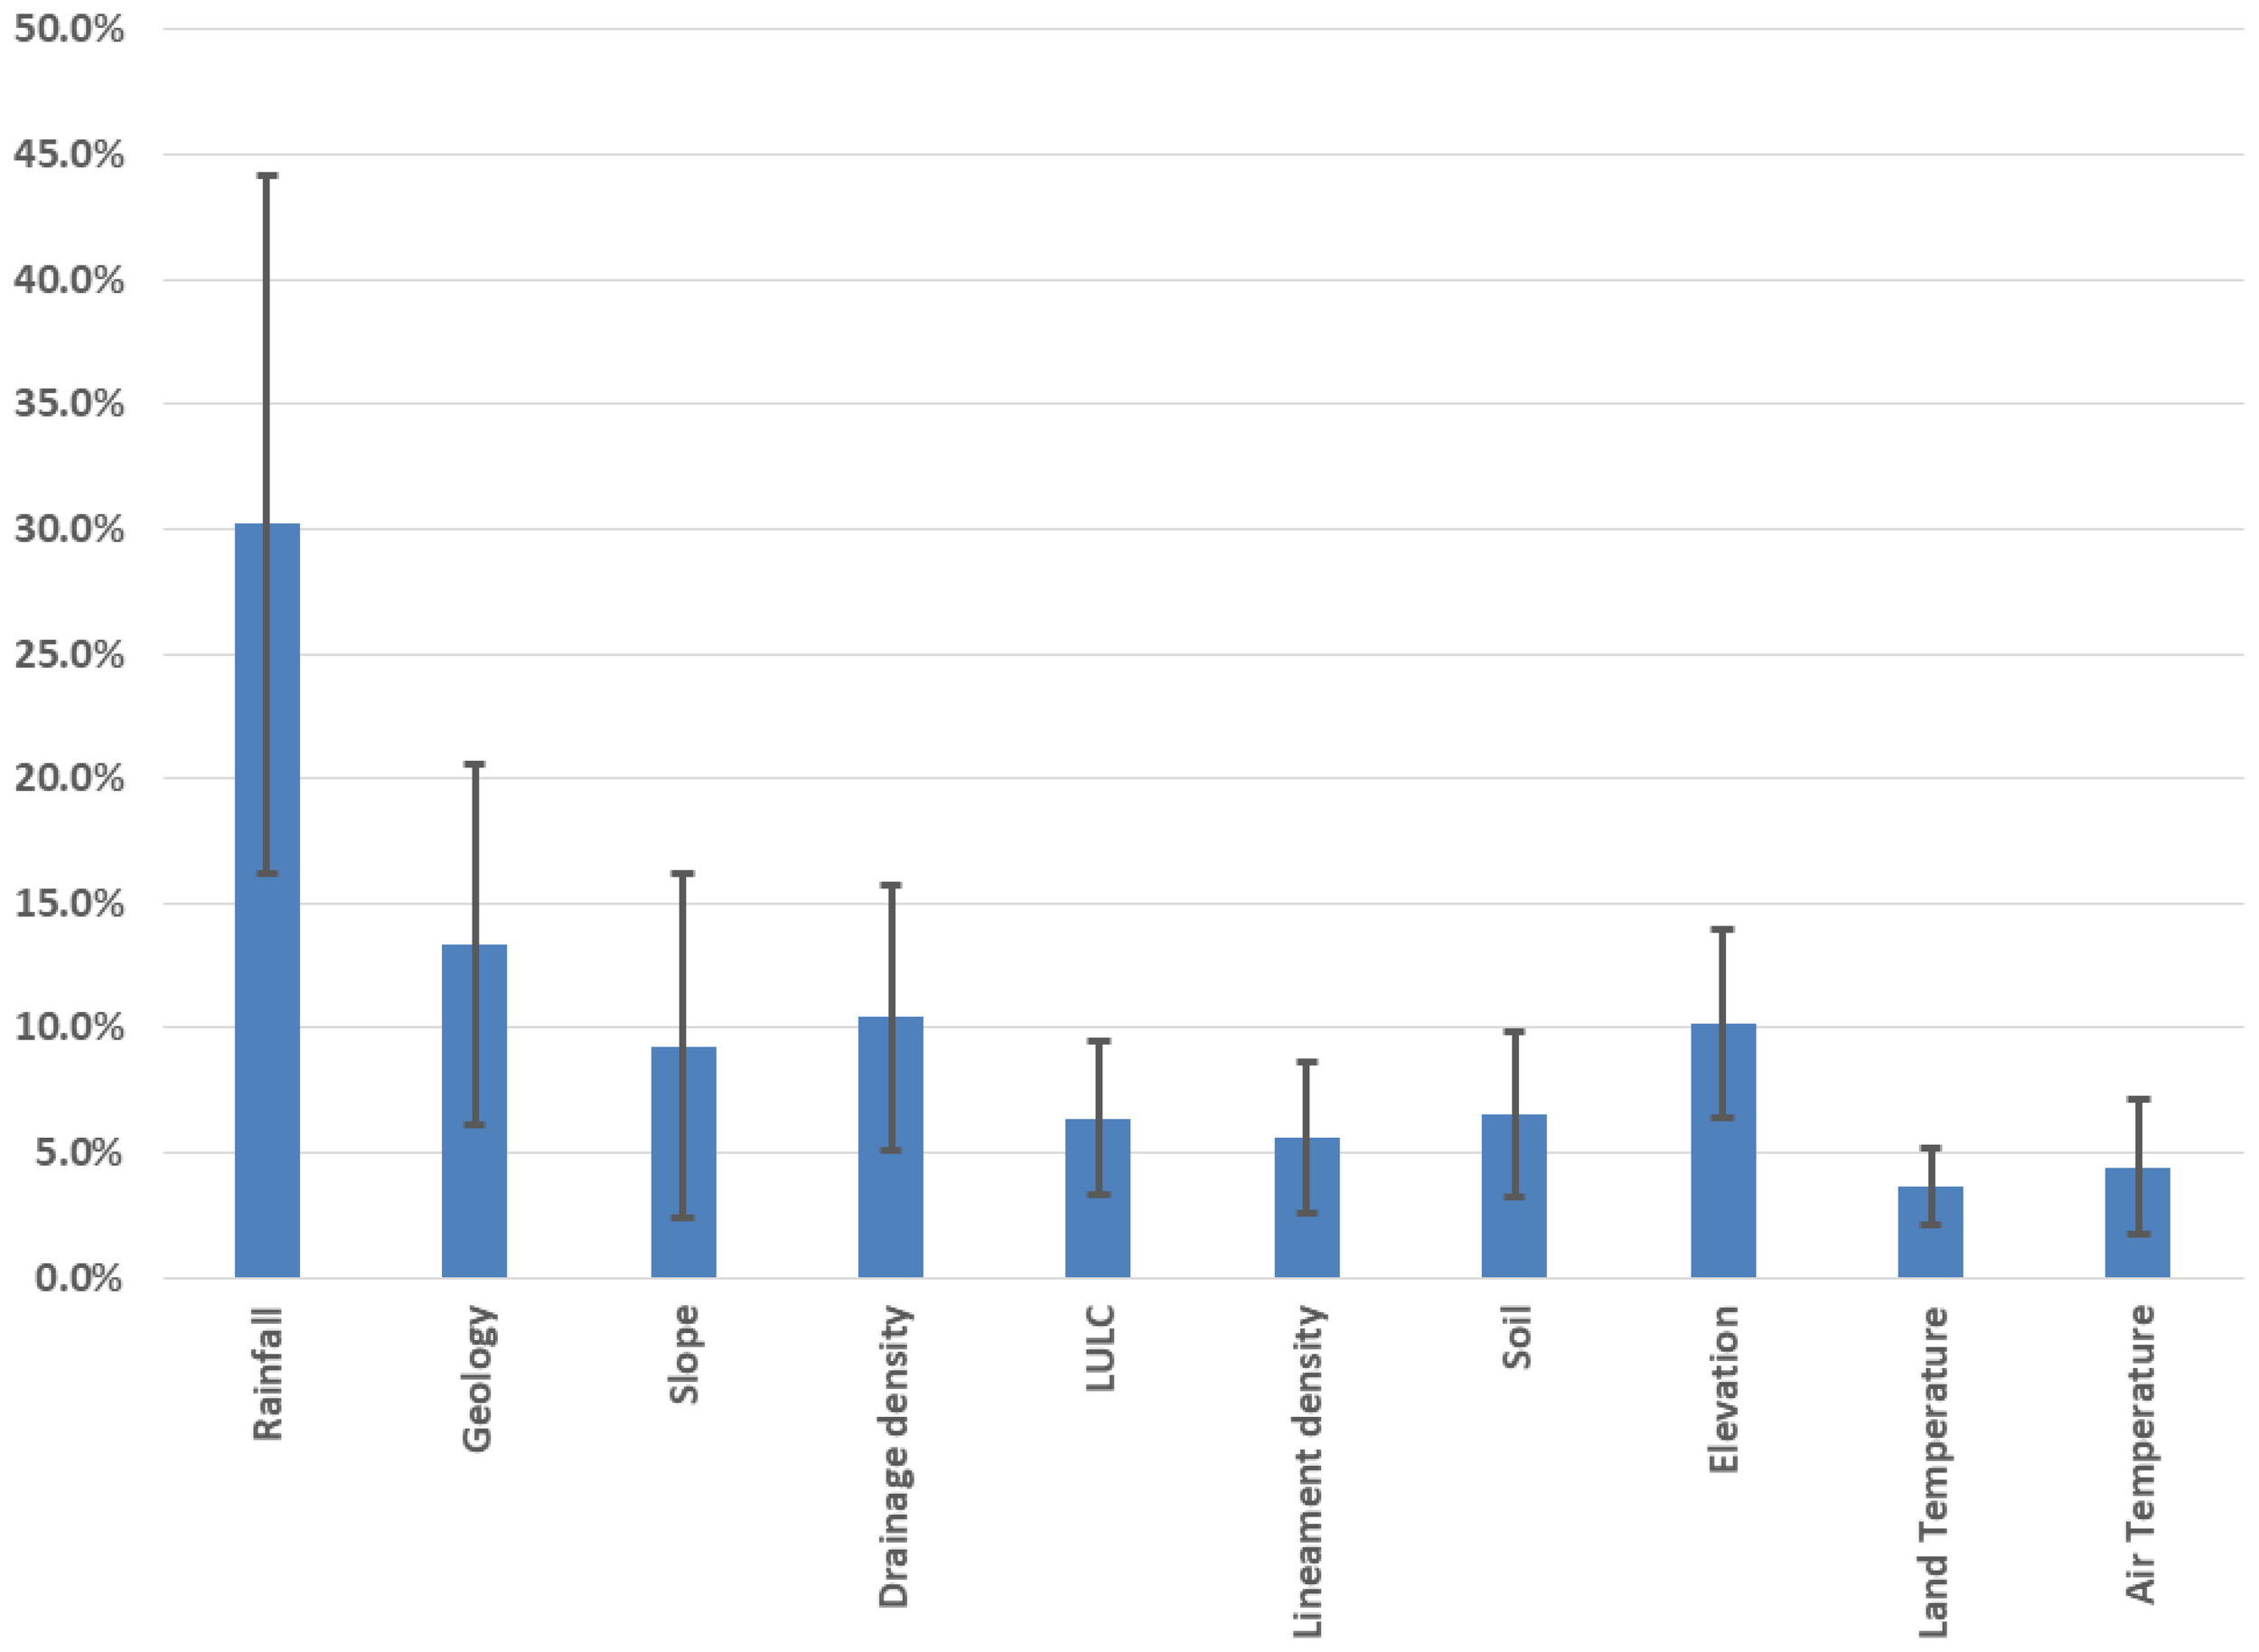
The thematic layers’ weights that were normalized and given for creating the groundwater potential map.
Table 4
| Scales | Degree of preferences |
|---|---|
| 1 | Equally important |
| 3 | Moderate important |
| 5 | Strong importance |
| 7 | Very Strong importance |
| 9 | Extreme importance |
| 2,4,6,8 | Intermediate Values |
Saaty scales are described for pairwise comparison using the AHP technique.
Table 5
| Factors | Classes | Rank | Weight |
|---|---|---|---|
| Elevation | 0 - 293 | 10 | 5 |
| 293 - 590 | 4 | ||
| 590 - 887 | 3 | ||
| 887 - 1,184 | 2 | ||
| 1,184 - 1,481 | 1 | ||
| Slope | 0 - 72.33 | 10 | 5 |
| 72.33 - 144.67 | 4 | ||
| 144.67 - 217.015 | 3 | ||
| 217.015 - 289.35 | 2 | ||
| 289.35 - 361.69 | 1 | ||
| LULC | Vegetation | 6 | 5 |
| Water bodies | 5 | ||
| Agriculture | 4 | ||
| Bareland | 1 | ||
| Buildings | 1 | ||
| Lineament Density | 0 - 0.169 | 6 | 1 |
| 0.169 - 0.338 | 2 | ||
| 0.338 - 0.507 | 3 | ||
| 0.507 - 0.676 | 4 | ||
| 0.676 - 0.845 | 5 | ||
| Drainage Density | 0 - 241.9 | 10 | 5 |
| 241.9 - 459.92 | 4 | ||
| 459.92 - 677.94 | 3 | ||
| 677.94 - 895.95 | 2 | ||
| 895.95 - 1,113.97 | 1 | ||
| Rainfall | 0 - 19.14 | 30 | 1 |
| 19.14 - 26.028 | 2 | ||
| 26.028 - 32.912 | 3 | ||
| 32.912 - 39.79 | 4 | ||
| 39.79 - 46.68 | 5 | ||
| Soil | Calcic Yermosols (Yk) | 6 | 1 |
| Eutric Regosols (Re) | 3 | ||
| Calcaric Fluvisols (Jc) | 5 | ||
| LITHOSOLS (I) | 5 | ||
| Geology | Tertiary | 13 | 1 |
| cretaceous | 3 | ||
| Quaternary | 5 | ||
| Paleozoic | 3 | ||
| carboniferous | 5 | ||
| Air Temperature | 0 - 20.4 | 5 | 5 |
| 20.4 - 20.7 | 4 | ||
| 20.7 - 20.9 | 3 | ||
| 20.9 - 21.22 | 2 | ||
| 21.22 - 21.5 | 1 | ||
| Land Temperature | 0 - 22.74 | 4 | 5 |
| 22.74 - 22.95 | 4 | ||
| 22.95 - 23.15 | 3 | ||
| 23.15 - 23.36 | 2 | ||
| 23.36 - 23.57 | 1 |
Weight and rank classification.
Table 6
| Matrix | Rainfall | Geology | Slope | Drainage density | LULC | Lineament density | Soil | Elevation | Land temperature | Air temperature | Normalized principal Eigenvector |
|---|---|---|---|---|---|---|---|---|---|---|---|
| Rainfall | 1 | 5 | 3 | 5 | 3 | 5 | 7 | 3 | 5 | 5 | 30.19% |
| Geology | 1/5 | 1 | 3 | 1 | 3 | 5 | 3 | 1 | 2 | 2 | 13.35% |
| Slope | 1/3 | 1/3 | 1 | 3 | 1 | 2 | 1 | 1 | 3 | 1 | 9.28% |
| Drainage density | 1/5 | 1 | 1/3 | 1 | 2 | 3 | 3 | 2 | 3 | 1 | 10.43% |
| LULC | 1/3 | 1/3 | 1 | 1/2 | 1 | 1 | 1/2 | 1/3 | 3 | 3 | 6.37% |
| Lineament density | 1/5 | 1/5 | 1/2 | 1/3 | 1 | 1 | 1 | 1/3 | 3 | 3 | 5.58% |
| Soil | 1/7 | 1/3 | 1 | 1/3 | 2 | 1 | 1 | 1 | 1 | 3 | 6.52% |
| Elevation | 1/3 | 1 | 1 | 1/2 | 3 | 3 | 1 | 1 | 3 | 3 | 10.17% |
| Land Temperature | 1/5 | 1/2 | 1/3 | 1/3 | 1/3 | 1/3 | 1 | 1/3 | 1 | 1 | 3.66% |
| Air Temperature | 1/5 | 1/2 | 1 | 1 | 1/3 | 1/3 | 1/3 | 1/3 | 1 | 1 | 4.44% |
Thematic layers, pairwise comparison matrix, and consistency confirmation.
The AHP was adopted in this study for its structured and transparent approach to integrating expert assessments with spatial data. This method facilitated the prioritization of groundwater-influencing factors by assigning relative weights based on their significance. To maintain the logical soundness of the weighting process, the consistency ratio (CR) was calculated. Although other multi-criteria evaluation techniques such as Fuzzy AHP and the Multi-Influencing Factor (MIF) method are well-documented in the literature, AHP was selected as the most appropriate method due to the availability of expert input, the nature of the thematic layers, and the specific goals of the research (Saaty, 2004).
3.5.4 Analysis of weighted overlays
ArcGIS 10.8 helped combine the ten thematic layers, measuring their important impacts based on set weight criteria to outline the final potential zone (Figure 14). All of the layers were transformed into an integrated raster to get them. Equation 3, which was utilized for calculating the groundwater potential zone (GWPI), is:
Figure 14
Groundwater potential zones in Wadi Araba Area.
GE describes geology; SC is for soil cover; DD indicates drainage density; SL is for slope; LC indicates land use and land cover; LD stands for density of lineament; Rf denotes rainfall; EL indicates elevation; AT signifies air temperature; and LT indicates land temperature. The abbreviations ‘w’ and ‘r’ show the weight and rate of every feature subtype, respectively, as determined by their associated groundwater potentiality values. The groundwater storage potential was assessed on a scale of 1 to 5, with values of 1, 2, 3, 4, and 5 representing very poor, poor, moderate, high, and very high capacities, respectively (Kumar et al., 2014).
As shown in Equation 4, a CR value below 1.0 indicates an appropriate consistency value (Senapati and Das, 2021).
Where CR is Consistency ratio, C.I is the Consistency Index and, RCI is the Random Consistency Index.
Equation 5 defines the Consistency Index (CI) as:
Where n is the number of variables and λ max is the principal Eigenvalue.
The estimated value of CR is 0.096, which is considered acceptable (<0.1), suggesting a satisfactory level of consistency in the pairwise comparison matrix. This indicates that the weights assigned to the thematic layers are accurate and increase the reliability of the groundwater potential model.
4 Results and discussion
4.1 Groundwater potential of Wadi Araba Basin
The results show that groundwater is more readily accessible in the northeastern region of the study area. These parts are suitable for development of sustainable wells and future water infrastructure planning especially for the presence of new Galala city and the urban expansion it will need. This development will support the national development goals for an essential dimension for mapping the groundwater potentials. The groundwater potential zone aligns with the drainage direction in the basin. The regions with modest potential are situated in the central and western areas, where zones with severely low potential predominate in the basin’s northern and southern parts (Figure 14).
4.2 Validation of groundwater potential zones
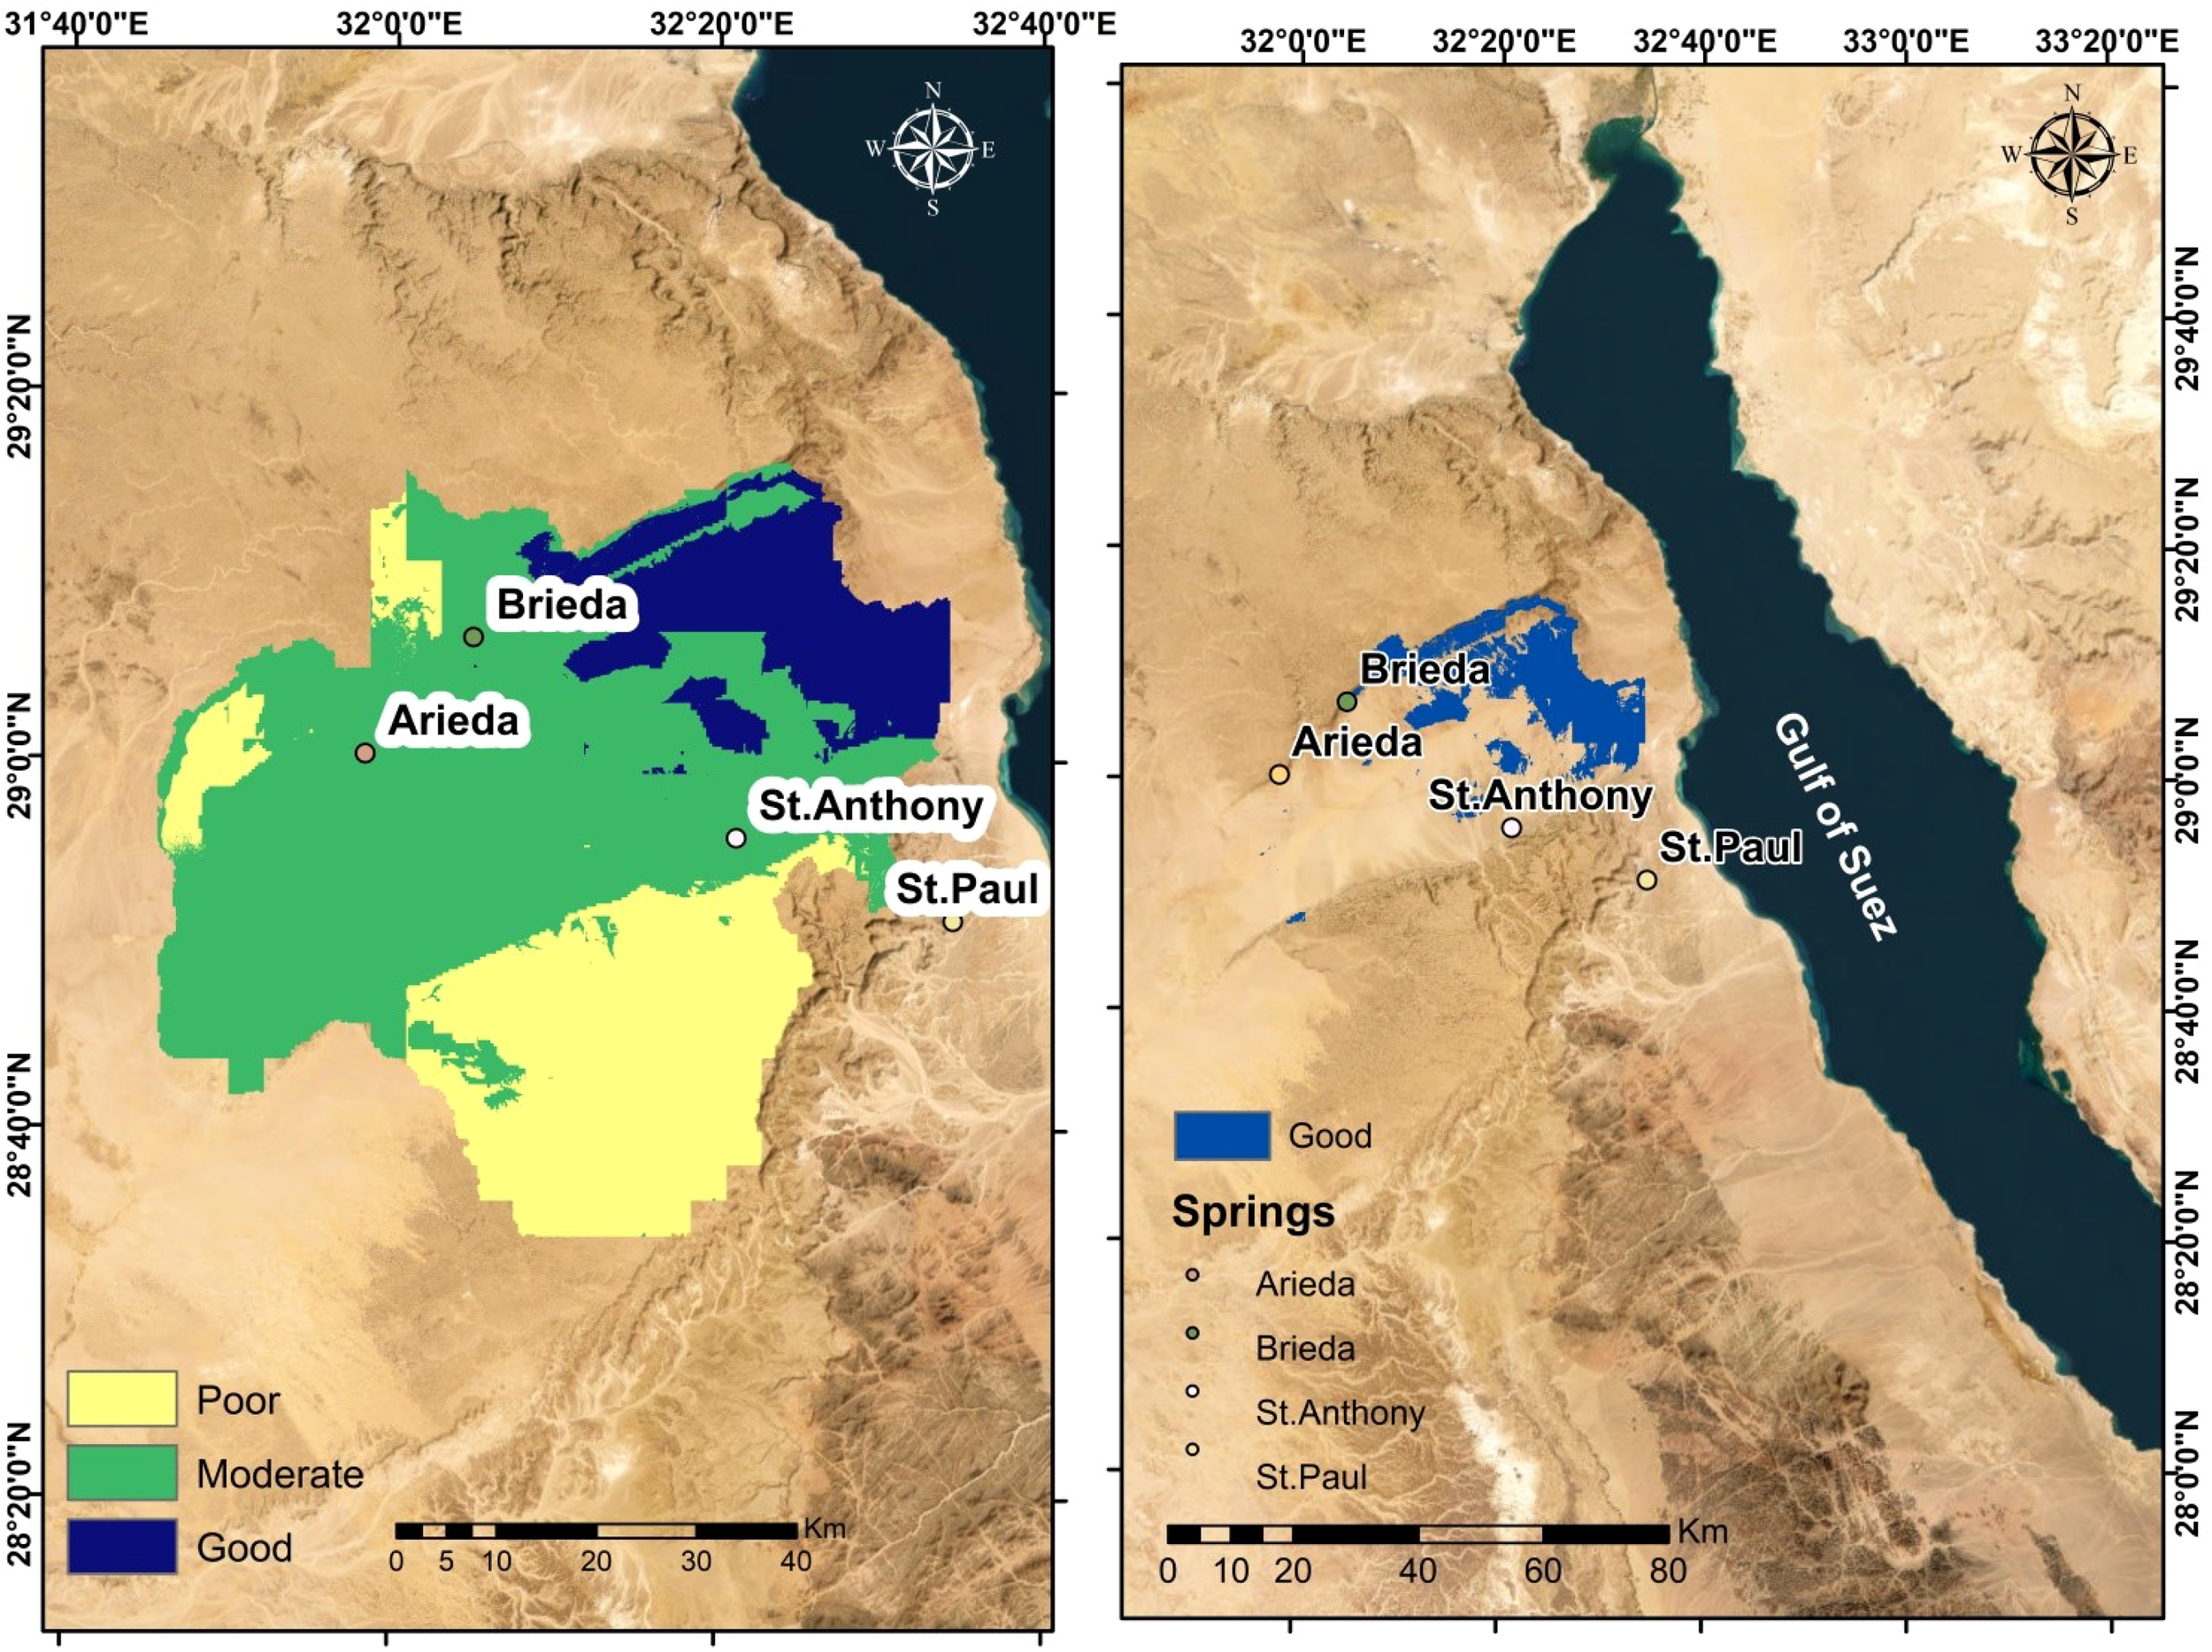
The verification of the AHP model’s predictions was performed using the ROC and AUC graphs, which are considered among the most dependable methods for evaluating model effectiveness (Moghaddam et al., 2015; Naghibi et al., 2016; Tamesgen et al., 2023). The AUC measures the independence of multiple categories, while the ROC provides an estimate of a probability curve (Nam and D’Agostino, 2002). The AUC ranges from 0 to 1, with its correlation to prediction accuracy are summarized in Table 7. To verify the delineated groundwater potential zones, 13 confirmation points including springs and wells were collected from the study area. Wells and springs distributed across all groundwater potential zones formed the 13 field validation points used in the ROC–AUC analysis (Figure 15a): three in high-potential zones near to the Gulf, four in moderate-potential zones of the central basin, two in the northern Galala Plateau cliff, two in the southern Galala Plateau, and one in low-potential zones along the southern margin. The dataset contained natural springs that emerged along fault-controlled outcrops, deeper drilled wells (40–90 m) that exploited fractured limestone aquifers, and shallow hand-dug wells (<30m) in Quaternary alluvial deposits. The ROC–AUC validation is well-supported by the spatial and hydrogeological diversity observed in the dataset (AUC=0.787, Figure 15b). The ROC method was applied to evaluate the accuracy of the AHP-derived maps against these water sample points (Figure 15a). The ROC curve for the proposed model, shown in Figure 15b, yielded an AUC of 0.787 (78.7%), demonstrating that the underground water potential zones delineated by the technique of the present research had substantial predictive validity. To enhance assurance in the chosen model, the ROC results were analysed in relation to spatial alignment with actual groundwater characteristics. The AUC value achieved demonstrates a strong level of predictive accuracy, underscoring the efficacy of combining AHP with GIS for mapping groundwater potential zones. Subsequently, field verification was performed to validate the locations of wells and springs in the study area (Supplementary 6). Water table levels were recorded at these locations to support the remote sensing-based results of suitable groundwater potential zones.
Table 7
| Suitability | AUC Range |
|---|---|
| Poor | 0.5-0.6 |
| Medium | 0.6-0.7 |
| Good | 0.7-0.8 |
| Very good | 0.8-0.9 |
| Excellent | 0.9-1 |
Shows the AUC curve classification.
Figure 15

(a) The study area’s validity map. (b) ROC curves to validate Groundwater potential zones.
This accuracy in the results confirms that the model is very useful in the region, not only for hydrogeological studies but also for making developmental decisions related to infrastructure, agriculture, and urban planning in environments that face water scarcity, such as the Wadi Araba region.
4.3 Quantitative analysis of Wadi Araba Basin
4.3.1 Basin area
The watershed’s basin area (A) refers to the topographically defined portion of the watershed and is a critical parameter in hydrologic design. It is calculated in ArcGIS using computed geometry. The basin area is as significant as the watershed length in determining the volume of water flow. A correlation exists between watershed size and stream length, with larger watersheds typically associated with longer streams. The aggregate area of the watershed under study is 4193.39 km². As shown by Sen (2008), the drainage basin falls within a classification of extensive geographical regions (Table 8). This large basin area naturally contributes to a substantial volume of runoff directed into the main watercourse. This, naturally, results in a substantial volume of runoff flowing into the main waterway.
Table 8
| Area of basin | Class |
|---|---|
| 5 km² | small |
| 5–99 km² | medium |
| 100–1000 km² | large |
| > 1000 km² | very large |
Classification of area of the basin.
4.3.2 Basin length
The basin length refers to the longest dimension of the watershed, measured along the main drainage line from the furthest point in the basin to the mouth of the valley. This parameter is critical as it represents the longest flow path of water within the watershed and is directly associated with the volume of water flow (Majeed and Amin, 2020). In the current study the basin length is calculated to be 96.837km. This length suggests that a substantial volume of runoff is conveyed through the watershed over a relatively short time frame, highlighting the importance of this parameter in hydrological modeling and water resource management.
4.3.3 Basin perimeter
The perimeter of a watershed represents the total length of the boundary enclosing the drainage basin which reflects the relationship between the basin’s size and its geometric dimensions. This measurement involves tracing a line that delineates the watershed boundary that offers a detailed representation of the basin’s shape and extent (Singh et al., 2021). In the current study, the watershed perimeter is approximately 441.24km, classifying it as a large basin. This significant perimeter suggests a higher potential for water storage within the basin, making it an essential parameter in hydrological studies and water resource planning.
4.3.4 Mean basin width
The mean basin width (W) mathematically relates the drainage basin area (A) to its maximum length (L), providing insights into the shape of the basin and its implications for groundwater recharge. This parameter is particularly useful for elongated watersheds as smaller width values typically indicate higher potential for groundwater recharge due to increased infiltration opportunities and slower runoff (Khakhlari, 2016).
Given the variability in watershed shapes and the distribution of points along their perimeters, the mean basin width was calculated using Equation 6:
For the Wadi Araba basin the calculated mean basin width is 43.3km (Table 9). This relatively small value reflects the elongated outline of the basin, suggesting favorable conditions for groundwater recharge in the region.
Table 9
| Area (km²) | Length (km) | Perimeter (km) | Mean width (km) |
|---|---|---|---|
| 4193.39 | 96.84 | 441.25 | 43.30 |
Statistics of Wadi Araba Basin.
The shape and size of the Wadi Araba provide valuable information about the way water moves in the area. With a total area of 4,100 km², there is enough land for collecting rainwater and allowing water to penetrate the subsurface layers as a recharge. The basin’s length (about 97km) allows water to travel deeper and possibly infiltrate into the soil. The edges of the basin extend for more than 440 kilometers, increasing the potential for water to reach the basin from various locations. And since the average width is tiny, water tends to concentrate in tighter pathways rather than spreading out and evaporating fast. Taken together, these traits help explain why specific sections of the basin have a higher potential for groundwater storage, and they confirm the zoning conclusions obtained by the spatial analysis.
4.4 Quantitative analysis of Wadi Araba Streams
The analysis of stream networks permits extra information to be obtained via recharge patterns and drainage systems, regardless of the basin-level characteristics that are being considered.
4.4.1 Stream length
Higher-order streams are often shorter, whereas lower-order streams are frequently longer, indicating an inverse relationship between order of streams and length (Singh et al., 2021). In the research area, the total stream length was calculated to be 7728.55km, as detailed in Table 10. The breakdown of stream lengths by order reveals that the streams of the first order dominate having a cumulative length of 3667.28km. This is followed by the second-order streams with a length of 2000km, third-order streams at 1125.5km, fourth-order streams at 554km, fifth-order streams at 249km, and sixth-order streams at 135km. The detailed distribution of stream lengths by stream order is presented in Table 11, highlighting the progressive decrease in stream length as stream order increases. The stream length data in this table is derived from GIS output (Table 10), while Table 11 demonstrates the same data in order for simple comparison.
Table 10
| Stream order | Count streams | Minimum(m) | Maximum(m) | Average(m) | Sum(km) | St. deviation (m) |
|---|---|---|---|---|---|---|
| 1 | 4157 | 40.499 | 10325.978 | 882.193 | 3667.28 | 866.097 |
| 2 | 1944 | 27.074 | 7781.648 | 1028.868 | 2000.12 | 883.91 |
| 3 | 1139 | 27.077 | 7353.968 | 988.22 | 1125.58 | 836.967 |
| 4 | 586 | 27.012 | 6413.353 | 940.725 | 551.27 | 862.254 |
| 5 | 288 | 27.096 | 4853.509 | 865.276 | 249.20 | 794.108 |
| 6 | 176 | 40.956 | 33139.953 | 767.64 | 135.10 | 2497.158 |
Statistics of stream length in Wadi Araba Basin.
Table 11
| Stream order | Stream length |
|---|---|
| 1 | 3667.27 |
| 2 | 2000.12 |
| 3 | 1125.58 |
| 4 | 551.27 |
| 5 | 249.20 |
| 6 | 135.10 |
Stream length according to the stream order.
4.4.2 Long path length
The longest flow path in the Wadi Araba basin was calculated to be 131.676km (Supplementary 7). The longer the flow path, the more infiltration occurs due to the longtime of water passing through the land of the Wadi.
4.4.3 Stream number
Stream number has an important impact on runoff due to the widths and sizes of the branches (Noori et al., 2019). Several variables determine the quantity of rivers and streams, including geology, rock type, gradient, weather, and topography (Majeed and Amin, 2020). Table 12 shows that the Wadi Araba basin has 5333 streams in order: 4153, 900, 211, 54, 14, and 1 in the sixth order.
Table 12
| Stream order | Stream number |
|---|---|
| 1 | 4153 |
| 2 | 900 |
| 3 | 211 |
| 4 | 54 |
| 5 | 14 |
| 6 | 1 |
the stream number according to the orders of the streams.
5 Discussion
These stream characteristics offer more than just numbers they tell the story of how water moves through the Wadi Araba watershed. The total stream length, which exceeds 7700km, reflects an intricate drainage system that helps spread water over wide areas during rainfall events. The large number of first-order streams, in particular, suggests that water can infiltrate locally in multiple places across the basin. The longest flow path, stretching over 131km, means that water has time to interact with the soil and rock along its way, which increases the chances for infiltration and groundwater recharge. When taken together, these patterns explain how the natural structure of the basin supports its ability to capture and store water, especially in an arid environment where every drop counts.
The Wadi Araba basin that is located between the North and South Galala Plateaus in Egypt’s Eastern Desert has a significant importance in regional groundwater exploration. This study confirms the efficacy of integrating remote sensing data with multi-criteria decision analysis-specifically the Analytical Hierarchy Process (AHP) in identifying groundwater potential zones in hyper-arid environments where field data are often limited. Given the increasing demand for freshwater and reliance on alternative sources such as desalinated Red Sea water, the identification of local groundwater reserves in Wadi Araba becomes crucial. The integration of thematic layers including digital elevation models (DEMs), land use/land cover (LULC), rainfall, slope, drainage density, lineament density, and temperature proved effective in delineating zones of varying groundwater potential. The spatial analysis revealed that lineament density and topography have a significant role in controlling groundwater accumulation, particularly in fractured limestone aquifers.
Moreover very important for groundwater potential are the geomorphological features of the Wadi Araba basin: especially its large size (4193.39 km²), extended form (mean width 43.3km), and notable stream network (total length of 7728.55km). Greater basin size and longer flow routes improve infiltration prospects, particularly in zones where the lithological characteristics and slope allow percolation. The extended basin shape reduces runoff, giving more time for water to penetrate along with the higher groundwater potential in central and northeastern areas. These geomorphological markers support the geographical patterns found in the groundwater potential map and confirm the relevance of GIS–based multi-criteria approaches for groundwater investigation in dry environment such as Wadi Araba.
In light of Egypt’s growing need for freshwater and reliance on other supplies such as desalinated Red Sea water, identifying local groundwater reserves in Wadi Araba is strategically significant. The study’s results provide practical insights for land reclamation, sustainable agriculture, and domestic water use in arid zones. The identified high-potential zones could serve as priority areas for drilling, which is particularly important in light of Egypt’s water scarcity and climate variability. While the northeastern high-potential zones (14.65%) provide large groundwater prospects, their coastal location creates seawater intrusion issues that must be carefully managed. The detected fault systems (NW-SE and N-S trends) may promote seawater movement under high pumping conditions, especially given the area’s proximity to the Gulf of Suez. As a result, groundwater development in these zones necessitates the establishment of hydrochemical monitoring networks focused on major ions and electrical conductivity as seawater intrusion indicators, sustainable extraction rates that maintain protective hydraulic gradients, and integration with natural recharge enhancement during flash flood events. These safeguards are especially important given regional development pressures and increased water demand ( (Abd-Elhamid and Javadi, 2011; Werner et al., 2013). Furthermore, the observed relationship between structural controls and recharge mechanisms aligns with previous studies in similar arid terrains, such as those in the Sinai Peninsula and eastern Sudan, supporting the broader applicability of the adopted approach.
For instance, (Magesh et al., 2012) in Tamil Nadu, India, and (Rahmati et al., 2015) in Iran applied AHP and GIS techniques to delineate groundwater potential zones, using comparable thematic layers such as slope, geology, lineament density, and land use. Our study aligns with these approaches but is distinct in its application to the fractured limestone watershed in Wadi Araba, a previously under investigated region. Unlike the aforementioned studies, our research integrates updated rainfall data (NASA/POWER CERES/MERRA-2) and a customized weighting scheme suited to the hydrogeological characteristics of the Eastern Desert of Egypt. Furthermore, (Kar and Patel, 2025) incorporated remote sensing and field validation in semi-arid regions of India. In contrast, our study extends this approach by considering local geological structures and drainage characteristics unique to the Wadi Araba basin, aiming to support site-specific planning for water management in Egypt’s emerging urban and agricultural expansions. This comparison reinforces the applicability of our methodology while highlighting the novelty of its implementation in a new geographical and geological context.
Although our methodological framework resembles those of studies in Tamil Nadu (Magesh et al., 2012), Iran (Rahmati et al., 2015), and semi-arid India (Kar and Patel, 2025), the hydrogeological and climatic conditions of Wadi Araba require a unique weighting and validation approach. Despite the region’s hyper-arid conditions, rainfall was given the highest weight (30%) due to its occurrence mostly as short yet intense flash floods, which serve as the most efficient recharging method for fractured limestone aquifers. This differs from semi-arid environments, where precipitation occurs more often but is less efficient in facilitating quick penetration. The fractured limestone aquifers enhance the significance of lineament density and drainage features, while the basin’s coastal location poses a risk of seawater intrusion, necessitating validation methods that include hydrochemical monitoring with geographical analysis. The distinctive characteristics necessitate the tailored weighting technique utilized in this work and underscore the requirement for site-specific validation approaches beyond those employed in other areas.
Ultimately, this study contributes a reproducible and adaptable framework for groundwater exploration in data-scarce regions. The methodological approach and findings can inform national and regional water management strategies, particularly under the pressures of population growth and climate-induced stress on natural water resources planning.
The findings of this study provide valuable insights into groundwater potential mapping in arid regions especially in areas with arid conditions like Wadi Araba. The developed groundwater potential zones can serve as a critical decision-making tool for water resource planners to identify optimal locations for drilling wells and managing groundwater extraction sustainably, agricultural developers to inform land-use planning and irrigation strategies based on water availability, Urban and rural development authorities to facilitate infrastructure planning by avoiding areas with low groundwater potential, and disaster risk managers to enhance drought resilience through improved groundwater monitoring and allocation.
However, limitations of the study include the lack of field-based validation and the dependence on remote sensing-derived proxies, the reliability of the outcomes is partly determined by the resolution and precision of the input information, especially rainfall and structural data. The use of static weights in the AHP process may obscure seasonal fluctuations or localized hydrological conditions. For improving the GIS-based results, field validation methods such as geophysical surveys and borehole drilling are essential to achieve more accurate, site-specific evaluations.
Future perspectives include integrating additional field data such as borehole logs and pumping test results to improve model accuracy and validation. Moreover, coupling this geospatial approach with climate models could provide predictive assessments of groundwater vulnerability under future climate scenarios.
6 Conclusions
In this study, an integrated GIS-AHP model is applied for the first time in Wadi Araba in order to designate groundwater potential zones in a desert environment that is structurally complex. The model included ten thematic layers, indicating that the northeastern region had the most groundwater potential, while the northern and southern areas have low potential. These results support long-term water resource planning, especially considering regional development projects such as New Galala City. These findings are useful for agricultural site selection, urban growth, and developing water infrastructure. In response to the problem stated at the beginning, the research achieved its aim of identifying areas with groundwater potential in a structurally complex arid area.
The methodology also validates the utility of GIS-based spatial analysis in identifying groundwater potential zones, providing a replicable model for similar geological settings globally. Practically, the results support evidence-based decision-making in groundwater management. The delineated potential zones can guide groundwater exploration, optimize well-siting, and support planning for sustainable land and water use. Moreover, by visualizing groundwater availability, stakeholders, including government agencies and local communities can prioritize investment and mitigation efforts in vulnerable areas.The findings demonstrated both the practical significance and the scientific contribution of groundwater management in the study area. The ROC–AUC validation, utilizing 13 field verification points, suggests a satisfactory prediction capability; however, the restricted quantity, spatial distribution, and observed hydrogeological data underscore the necessity for more comprehensive and systematic field validation. This validation, encompassing a greater number of wells scattered throughout all prospective zones and incorporating precise lithological and hydrochemical analyses, would yield a more thorough evaluation of groundwater potential within the entire basin.
Future research should include geophysical examination, aquifer recharge simulation, and an assessment of the impact of future climate scenarios on groundwater sustainability. Geophysical validation approaches (e.g. ERT or TEM surveys), geographical assessment of groundwater quantity and quality, and modeling of recharge scenarios under climate change projection are recommended to improve the accuracy of future assessments. This will help with regional sustainable water resource planning and increase the accuracy of groundwater potential estimations. Additionally, future efforts should consider integrating digital groundwater flow simulations using tools like MODFLOW. This method allows for the representation of subsurface hydraulic dynamics in three dimensions, aiding in the simulation of groundwater movement under various climatic, structural, and human scenarios. The use of such a model would further clarify the behavior of aquifers over time, strengthen conceptual hydrogeological models, and support evidence-based decision-making for long-term water resource management in regions with limited data like the Wadi Araba area.
Statements
Data availability statement
The original contributions presented in the study are included in the article/Supplementary Material. Further inquiries can be directed to the corresponding author.
Author contributions
ZS: Conceptualization, Data curation, Investigation, Resources, Supervision, Writing – original draft, Writing – review & editing. AA: Formal Analysis, Investigation, Methodology, Resources, Software, Visualization, Writing – review & editing. TA: Data curation, Formal Analysis, Funding acquisition, Methodology, Project administration, Supervision, Writing – review & editing. MM: Conceptualization, Data curation, Formal Analysis, Investigation, Methodology, Project administration, Resources, Software, Validation, Visualization, Writing – original draft, Writing – review & editing. AF: Conceptualization, Data curation, Formal Analysis, Investigation, Methodology, Project administration, Resources, Software, Supervision, Visualization, Writing – original draft, Writing – review & editing.
Funding
The author(s) declare financial support was received for the research and/or publication of this article. This paper is based upon work supported by Science, Technology & Innovation Funding Authority (STDF) under grant no (48506), Egypt. Open access publication fee was provided by UiT. The Arctic University of Norway.
Conflict of interest
The authors declare that the research was conducted in the absence of any commercial or financial relationships that could be construed as a potential conflict of interest.
Generative AI statement
The author(s) declare that no Generative AI was used in the creation of this manuscript.
Any alternative text (alt text) provided alongside figures in this article has been generated by Frontiers with the support of artificial intelligence and reasonable efforts have been made to ensure accuracy, including review by the authors wherever possible. If you identify any issues, please contact us.
Publisher’s note
All claims expressed in this article are solely those of the authors and do not necessarily represent those of their affiliated organizations, or those of the publisher, the editors and the reviewers. Any product that may be evaluated in this article, or claim that may be made by its manufacturer, is not guaranteed or endorsed by the publisher.
Supplementary material
The Supplementary Material for this article can be found online at: https://www.frontiersin.org/articles/10.3389/fmars.2025.1670000/full#supplementary-material
References
1
Abd-Elhamid H. F. Javadi A. A. (2011). A cost-effective method to control seawater intrusion in coastal aquifers. Water Resour Manage25, 2755–2780. doi: 10.1007/s11269-011-9837-7
2
Abdelmohsen K. Sultan M. Save H. Abotalib A. Z. Yan E. (2020). What can the GRACE seasonal cycle tell us about lake-aquifer interactions? Earth-Science Rev.211, 103392. doi: 10.1016/j.earscirev.2020.103392
3
Abdel Moneim A. A. (2005). Overview of the geomorphological and hydrogeological characteristics of the Eastern Desert of Egypt. Hydrogeol J.13, 416–425. doi: 10.1007/s10040-004-0364-y
4
Abouelmagd A. Sultan M. Sturchio N. C. Soliman F. Rashed M. Ahmed M. et al . (2014). Paleoclimate record in the Nubian sandstone aquifer, Sinai Peninsula, Egypt. Quat. Res.81, 158–167. doi: 10.1016/j.yqres.2013.10.017
5
An Leeuwen B. (2015). GIS workflow for continuous soil moisture estimation based on medium resolution satellite data (Boca Raton, Florida: CRC Press).
6
Ansari Z. R. Rao L. A. K. Yusuf A. (2012). GIS based morphometric analysis of Yamuna drainage network in parts of Fatehabad area of Agra district, Uttar Pradesh. J. Geol Soc. India79, 505–514. doi: 10.1007/s12594-012-0075-2
7
Arulbalaji P. Padmalal D. Sreelash K. (2019). GIS and AHP Techniques Based Delineation of Groundwater Potential Zones: a case study from Southern Western Ghats, India. Sci. Rep.9, 2082. doi: 10.1038/s41598-019-38567-x
8
Bakhbakhi M . (2006). “ Nubian sandstone aquifer system,” in Non-renewable groundwater resources: A guidebook on socially sustainable management for water-policy makers. (Paris: United Nations Educational, Scientific and Cultural Organization (IHP-VI series on groundwater 10)), 75–81.
9
Barad S. Thakur R. R. Nandi D. Bera D. K. Sahu P. C. Mishra P. et al . (2025). Hydrogeochemical and geospatial insights into groundwater contamination: fluoride and nitrate risks in western Odisha, India. Water17, 1514. doi: 10.3390/w17101514
10
Baxter S. (2007). World Reference Base for Soil Resources. World Soil Resources Report 103. Rome: Food and Agriculture Organization of the United Nations, (2006), pp. 132, US$22.00 (paperback). ISBN 92-5-10511-4. Ex. Agric.43, 264–264. doi: 10.1017/s0014479706394902
11
Benali A. Carvalho A. C. Nunes J. P. Carvalhais N. Santos A. (2012). Estimating air surface temperature in Portugal using MODIS LST data. Remote Sens. Environ.124, 108–121. doi: 10.1016/j.rse.2012.04.024
12
Benjmel K. Amraoui F. Boutaleb S. Ouchchen M. Tahiri A. Touab A. (2020). Mapping of groundwater potential zones in crystalline terrain using remote sensing, GIS techniques, and multicriteria data analysis (Case of the Ighrem region, western anti-atlas, Morocco). Water12, 471. doi: 10.3390/w12020471
13
Bhunia G. S. (2020). An approach to demarcate groundwater recharge potential zone using geospatial technology. Appl. Water Sci.10, 138. doi: 10.1007/s13201-020-01231-1
14
Bosworth W. Durocher S. (2017). Present-day stress fields of the Gulf of Suez (Egypt) based on exploratory well data: Non-uniform regional extension and its relation to inherited structures and local plate motion. J. Afr. Earth Sci.136, 136–147. doi: 10.1016/j.jafrearsci.2017.04.025
15
Changnon S. A. (2005). “ Applied climatology,” in Encyclopedia of World Climatology. Ed. OliverJ. E. ( Springer Netherlands, Dordrecht), 54–58. doi: 10.1007/1-4020-3266-8_12
16
Chavda Z. K. Kakwani D. Singh N. (2024). Delineation of groundwater potential zones in Narmada district Gujarat (India) using GIS and AHP techniques. Water Conserv. Sci. Eng.9, 7. doi: 10.1007/s41101-024-00238-y
17
Chen M. Zhang S. Liu S. Li M. Zhang T. Wu T. et al . (2025). Mapping the groundwater potential zones in mountainous areas of Southern China using GIS, AHP, and fuzzy AHP. Sci. Rep.15, 17159. doi: 10.1038/s41598-025-01837-y
18
Chowdhury A. Jha M. K. Chowdary V. M. (2010). Delineation of groundwater recharge zones and identification of artificial recharge sites in West Medinipur district, West Bengal, using RS, GIS and MCDM techniques. Environ. Earth Sci.59, 1209–1222. doi: 10.1007/s12665-009-0110-9
19
Doke A. B. Zolekar R. B. Patel H. Das S. (2021). Geospatial mapping of groundwater potential zones using multi-criteria decision-making AHP approach in a hardrock basaltic terrain in India. Ecol. Indic.127, 107685. doi: 10.1016/j.ecolind.2021.107685
20
Elbeih S. F. Zaghloul E. A. (2021). “ Hydrologeological and hydrological conditions of Dakhla Oasis,” in Sustainable Water Solutions in the Western Desert, Egypt: Dakhla Oasis. Eds. IwasakiE.NegmA. M.ElbeihS. F. ( Springer International Publishing, Cham), 185–201. doi: 10.1007/978-3-030-64005-7_11
21
El Kenawy A. M. (2024). “ Hydroclimatic extremes in arid and semi-arid regions: status, challenges, and future outlook,” in Hydroclimatic Extremes in the Middle East and North Africa (Amsterdam: Elsevier), 1–22. doi: 10.1016/B978-0-12-824130-1.00012-6
22
Emekwi P. L. Mariita N. O. Kariuki P. C. (2024). Structural controls analysis and its correlation with geothermal occurrence at barrier volcanic complex (BVC), Turkana, Kenya. IJG15, 231–245. doi: 10.4236/ijg.2024.153014
23
Forest C. E. Stone P. H. Sokolov A. P. Allen M. R. Webster M. D. (2002). Quantifying uncertainties in climate system properties with the use of recent climate observations. Science295, 113–117. doi: 10.1126/science.1064419
24
Freeg A. Nassar A. A. Hassan N. A. Riad P. (2025). Preliminary study regarding the long-term assessment of Wadi Araba’s aquifer potential for sustainable development using the GMS model: a case study in an arid area, Egypt, eastern desert. Water Pract. Technol.20, 1005–1022. doi: 10.2166/wpt.2025.053
25
Freeg A. Riad P. Hassan N. A. Nassar A. A. (2023). Appraisal of multilayer aquifer system for sustainable groundwater management in Wadi Araba, Eastern desert, Egypt. Groundwater Sustain. Dev.21, 100942. doi: 10.1016/j.gsd.2023.100942
26
Ganapuram S. Kumar G. T. V. Krishna I. V. M. Kahya E. Demirel M. C. (2009). Mapping of groundwater potential zones in the Musi basin using remote sensing data and GIS. Adv. Eng. Software40, 506–518. doi: 10.1016/j.advengsoft.2008.10.001
27
Gat J. Issar A. (1974). Desert isotopes hydrology, water sources of the Sinai Desert. Geochim Cosmochim Acta38, 1117–1131. doi: 10.1016/0016-7037(74)90008-8
28
Gornall J. Betts R. Burke E. Clark R. Camp J. Willett K. et al . (2010). Implications of climate change for agricultural productivity in the early twenty-first century. Phil. Trans. R. Soc B365, 2973–2989. doi: 10.1098/rstb.2010.0158
29
Hatfield J. L. Boote K. J. Kimball B. A. Ziska L. H. Izaurralde R. C. Ort D. et al . (2011). Climate impacts on agriculture: implications for crop production. Agron. J.103, 351–370. doi: 10.2134/agronj2010.0303
30
Höntzsch S. Scheibner C. Kuss J. Marzouk A. M. Rasser M. W. (2011). Tectonically driven carbonate ramp evolution at the southern Tethyan shelf: the Lower Eocene succession of the Galala Mountains, Egypt. Facies57, 51–72. doi: 10.1007/s10347-010-0229-x
31
Horton R. E. (1945). Erosional development of streams and their drainage basins; hydrophysical approach to quantitative morphology. Geol Soc. America Bull.56, 275. doi: 10.1130/0016-7606(1945)56[275:EDOSAT]2.0.CO;2
32
Huang C.-C. Yeh H.-F. Lin H.-I. Lee S.-T. Hsu K.-C. Lee C.-H. (2013). Groundwater recharge and exploitative potential zone mapping using GIS and GOD techniques. Environ. Earth Sci.68, 267–280. doi: 10.1007/s12665-012-1737-5
33
Ibrahim-Bathis K. Ahmed S. A. (2016). Geospatial technology for delineating groundwater potential zones in Doddahalla watershed of Chitradurga district, India. Egyptian J. Remote Sens. Space Sci.19, 223–234. doi: 10.1016/j.ejrs.2016.06.002
34
Ifediegwu S. I. (2022). Assessment of groundwater potential zones using GIS and AHP techniques: a case study of the Lafia district, Nasarawa State, Nigeria. Appl. Water Sci.12, 10. doi: 10.1007/s13201-021-01556-5
35
Kaburi A. Odera P. A. (2014). “ Mapping and analysis of landcover changes in the upper Gucha catchment using GIS and remote sensing” in Proceedings of the Sustainable Research and Innovation Conference, 172–177. doi: 10.13140/2.1.5148.7688
36
Kar R. Patel P. (2025). Assessment of the vulnerability of land and water resources at the sub-basin scale of one of the sensitive catchments of the Mahanadi river basin, India. Environ. Modeling Assessment, 1–24. doi: 10.1007/s10666-025-10046-w
37
Khakhlari M. (2016). Morphometric analysis of barapani river basin in Karbi Anglong district, Assam. Int. J. Sci. Res. Publications6, 238–249. Available online at: https://www.academia.edu/66091870/Morphometric_Analysis_of_Barapani_River_Basin_In_Karbi_Anglong_District_Assam (Accessed October 13, 2025).
38
Khalil M. M. Hamer K. Pichler T. Abotalib A. Z. (2021). Fault zone hydrogeology in arid environments: The origin of cold springs in the Wadi Araba Basin, Egypt. Hydrological Processes35, e14176. doi: 10.1002/hyp.14176
39
Khalil S. M. McClay K. R. (2001). Tectonic evolution of the NW Red Sea-Gulf of Suez rift system. SP187, 453–473. doi: 10.1144/gsl.sp.2001.187.01.22
40
Klitzsch E. Wycisk P. (1987). Geology of the sedimentary basins of northern Sudan and bordering areas.
41
Kumar T. Gautam A. K. Kumar T. (2014). Appraising the accuracy of GIS-based Multi-criteria decision making technique for delineation of Groundwater potential zones. Water Resour Manage28, 4449–4466. doi: 10.1007/s11269-014-0663-6
42
Kuswanto H. Naufal A. (2019). Evaluation of performance of drought prediction in Indonesia based on TRMM and MERRA-2 using machine learning methods. MethodsX6, 1238–1251. doi: 10.1016/j.mex.2019.05.029
43
Legates D. R. Willmott C. J. (1990). Mean seasonal and spatial variability in global surface air temperature. Theor. Appl. Climatol41, 11–21. doi: 10.1007/BF00866198
44
Lyberis N. (1988). Tectonic evolution of the gulf of suez and the gulf of Aqaba. Tectonophysics153, 209–220. doi: 10.1016/0040-1951(88)90016-9
45
Magesh N. S. Chandrasekar N. Soundranayagam J. P. (2012). Delineation of groundwater potential zones in Theni district, Tamil Nadu, using remote sensing, GIS and MIF techniques. Geosci. Front.3, 189–196. doi: 10.1016/j.gsf.2011.10.007
46
Majeed S. A. Amin H. N. M. (2020). Morphometric analysis of Abbasan watershed between (Iraq – Iran), using (Gis) technique. Earth Sci. Malays.5, 86–92. doi: 10.26480/esmy.02.2021.86.92
47
Marquart S. (2003). Klimawirkung von Kondensstreifen: Untersuchungen mit einem globalen atmosphärischen Zirkulationsmodell (Munich, Germany: Ludwig-Maximilians-Universität München). doi: 10.5282/EDOC.1341
48
Moghaddam D. D. Rezaei M. Pourghasemi H. R. Pourtaghie Z. S. Pradhan B. (2015). Groundwater spring potential mapping using bivariate statistical model and GIS in the Taleghan Watershed, Iran. Arabian J. Geosciences8, 913–929. doi: 10.1007/s12517-013-1161-5
49
Mohamed A. Ahmed E. Alshehri F. Abdelrady A. (2022). The Groundwater Flow Behavior and the Recharge in the Nubian Sandstone Aquifer System during the Wet and Arid Periods. Sustainability14, 1–20. doi: 10.3390/su14116823
50
Moustafa A. R. Khalil S. M. (2017). Control of extensional transfer zones on syntectonic and post-tectonic sedimentation: implications for hydrocarbon exploration. JGS174, 318–335. doi: 10.1144/jgs2015-138
51
Mu E. Pereyra-Rojas M . (2016). Practical decision making: an introduction to the Analytic Hierarchy Process (AHP) using super decisions V2 (USA: Springer).
52
Nag S. K. Ghosh P. (2013). Delineation of groundwater potential zone in Chhatna Block, Bankura District, West Bengal, India using remote sensing and GIS techniques. Environ. Earth Sci.70, 2115–2127. doi: 10.1007/s12665-012-1713-0
53
Naghibi S. A. Pourghasemi H. R. Dixon B. (2016). GIS-based groundwater potential mapping using boosted regression tree, classification and regression tree, and random forest machine learning models in Iran. Environ. Monit Assess.188, 44. doi: 10.1007/s10661-015-5049-6
54
Nam B.-H. D’Agostino R. B. (2002). “ Discrimination index, the area under the ROC curve,” in Goodness-of-Fit Tests and Model Validity. Eds. Huber-CarolC.BalakrishnanN.NikulinM. S.MesbahM. ( Birkhäuser Boston, Boston, MA), 267–279. doi: 10.1007/978-1-4612-0103-8_20
55
Naseer A. Koike T. Rasmy M. Ushiyama T. Shrestha M. (2019). Distributed hydrological modeling framework for quantitative and spatial bias correction for rainfall, snowfall, and mixed-phase precipitation using vertical profile of temperature. JGR Atmospheres124, 4985–5009. doi: 10.1029/2018JD029811
56
Nassim A. (1990). Geological and hydrogeological studies on Wadi Araba Area, north Eastern Desert, Egypt (Al Minufya, Egypt: Menoufia University).
57
Nigussie W. Hailu B. T. Azagegn T. (2019). Mapping of groundwater potential zones using sentinel satellites (–1 SAR and -2A MSI) images and analytical hierarchy process in Ketar watershed, Main Ethiopian Rift. J. Afr. Earth Sci.160, 103632. doi: 10.1016/j.jafrearsci.2019.103632
58
Noori A. M. Pradhan B. Ajaj Q. M. (2019). Dam site suitability assessment at the Greater Zab River in northern Iraq using remote sensing data and GIS. J. Hydrology574, 964–979. doi: 10.1016/j.jhydrol.2019.05.001
59
Obiefuna G. I. Sheriff A. (2011). Assessment of shallow ground water quality of Pindiga Gombe area, Yola Area, NE, Nigeria for irrigation and domestic purposes. Res. J. Environ. Earth Sci.3, 131–141. Available online at: https://www.researchgate.net/publication/268358109_Assessment_of_Shallow_Ground_Water_Quality_of_Pindiga_Gombe_Area_Yola_Area_NE_Nigeria_for_Irrigation_and_Domestic_Purposes (Accessed October 13, 2025).
60
Oikonomidis D. Dimogianni S. Kazakis N. Voudouris K. (2015). A GIS/Remote Sensing-based methodology for groundwater potentiality assessment in Tirnavos area, Greece. J. Hydrology525, 197–208. doi: 10.1016/j.jhydrol.2015.03.056
61
Pande C. B. Khadri S. F. R. Moharir K. N. Patode R. S. (2018). Assessment of groundwater potential zonation of Mahesh River basin Akola and Buldhana districts, Maharashtra, India using remote sensing and GIS techniques. Sustain. Water Resour. Manage.4, 965–979. doi: 10.1007/s40899-017-0193-5
62
Pati A. K. Tripathy A. R. Nandi D. Thakur R. R. Ðurin B. Dogančić D. et al . (2025a). Fluoride risk prognostication: A pioneering ensemble machine learning approach for groundwater contamination prediction in parts of the east coast of India. Water17, 909. doi: 10.3390/w17060909
63
Pati A. K. Tripathy A. R. Nandi D. Thakur R. R. Pandey M. (2025b). Irrigation water quality prognostication: An innovative ensemble architecture leveraging deep learning and machine learning for enhanced SAR and ESP estimation in the east coast of India. J. Environ. Chem. Eng.13, 116433. doi: 10.1016/j.jece.2025.116433
64
Patterson L. J. Sturchio N. C. Kennedy B. M. Van Soest M. C. Sultan M. Lu Z. et al . (2005). Cosmogenic, radiogenic, and stable isotopic constraints on groundwater residence time in the Nubian Aquifer, Western Desert of Egypt. Geochem Geophys Geosyst6, 2004GC000779. doi: 10.1029/2004GC000779
65
Pawar U. Suppawimut W. Rathnayake U. (2024). Mapping of groundwater potential zones in a drought prone Marathwada Region using frequency ratio and statistical index methods, India. Results Eng.22, 101994. doi: 10.1016/j.rineng.2024.101994
66
Pinto D. Shrestha S. Babel M. S. Ninsawat S. (2017). Delineation of groundwater potential zones in the Comoro watershed, Timor Leste using GIS, remote sensing and analytic hierarchy process (AHP) technique. Appl. Water Sci.7, 503–519. doi: 10.1007/s13201-015-0270-6
67
Potić I. Bugarski M. Matić-Varenica J. (2017). Soil moisture determination using remote sensing data for the property protection and increase of agriculture production (Washington, DC: The World Bank).
68
Rahmati O. Nazari Samani A. Mahdavi M. Pourghasemi H. R. Zeinivand H. (2015). Groundwater potential mapping at Kurdistan region of Iran using analytic hierarchy process and GIS. Arab J. Geosci8, 7059–7071. doi: 10.1007/s12517-014-1668-4
69
Rawls W. J. Brakensiek D. L. Miller N. (1983). Green-ampt infiltration parameters from soils data. J. Hydraul. Eng.109, 62–70. doi: 10.1061/(ASCE)0733-9429(1983)109:1(62
70
Regional Strategy for the Utilisation of the Nubian Sandstone Aquifer System (2005). Centre For Environment & Development For The Aab Region And Europe (Cairo, Egypt: International Fund For Agricultural Development [CEDARE/IFAD]). Available online at: https://web.cedare.org/ (Accessed October 14, 2025).
71
Reichle R. H. Liu Q. Koster R. D. Draper C. S. Mahanama S. P. P. Partyka G. S. (2017). Land surface precipitation in MERRA-2. J. Climate30, 1643–1664. doi: 10.1175/JCLI-D-16-0570.1
72
Rugmini Ammal P. Prajila M. Joseph A. (2018). Physicochemical studies on the inhibitive properties of a 1,2,4-triazole Schiff’s base, HMATD, on the corrosion of mild steel in hydrochloric acid. Egyptian J. Petroleum27, 307–317. doi: 10.1016/j.ejpe.2017.05.002
73
Saaty T. L. (2008). Decision making with the analytic hierarchy process. IJSSCI1, 83. doi: 10.1504/IJSSCI.2008.017590
74
Saaty T. L. (2004). Decision making—the analytic hierarchy and network processes (AHP/ANP). J. Syst. Sci. Syst. Eng.13 (1), 1–35. doi: 10.1007/s11518-006-0151-5
75
Saber M. Abdrabo K. I. Habiba O. M. Kantosh S. A. Sumi T. (2020). Impacts of triple factors on flash flood vulnerability in Egypt: urban growth, extreme climate, and mismanagement. Geosciences10, 24. doi: 10.3390/geosciences10010024
76
Saha A. Patil M. Goyal V. C. Rathore D. S. (2018). “ Assessment and impact of soil moisture index in agricultural drought estimation using remote sensing and GIS techniques,” in ECWS-3, vol. 2. (Basel, Switzerland: MDPI). doi: 10.3390/ECWS-3-05802
77
Salem Z. E. Abdelazeem M. Khalifa M. M. Fathy M. S. (2024). Integrated stratigraphical, hydrogeochemical, and geophysical studies to characterize the shallow groundwater aquifers in Wadi Araba area, western Gulf of Suez, Egypt. Appl. Water Sci.14, 83. doi: 10.1007/s13201-024-02125-2
78
Salem Z. E.-S. Fathy M. S. Helal A.-F. I. Afifi S. Y. Attiah A. M. (2021). “ Groundwater quality for irrigation as an aspect of sustainable development approaches: A case study of semi-arid area around ismailia canal, eastern Nile Delta, Egypt,” in Groundwater in Egypt’s Deserts. Eds. NegmA.ElkhoulyA. ( Springer International Publishing, Cham), 295–326. doi: 10.1007/978-3-030-77622-0_12
79
Salem Z. E. Sefelnasr A. Hasan S. S. (2022). “ As a water resources management tool, groundwater quality assessment for irrigation in the young alluvial plain of western Nile delta, Egypt,” in Sustainability of Groundwater in the Nile Valley, Egypt. Eds. NegmA. M.El-RawyM. ( Springer International Publishing, Cham), 179–199. doi: 10.1007/978-3-031-12676-5_8
80
Satapathy I. Syed T. H. (2015). Characterization of groundwater potential and artificial recharge sites in Bokaro District, Jharkhand (India), using remote sensing and GIS-based techniques. Environ. Earth Sci.74, 4215–4232. doi: 10.1007/s12665-015-4474-8
81
Sen Z. (2008). Wadi Hydrology (Istanbul, Turkey: Wadi hydrology). doi: 10.1201/9781420061550
82
Senapati U. Das T. K. (2021). Assessment of basin-scale groundwater potentiality mapping in drought-prone upper Dwarakeshwar River basin, West Bengal, India, using GIS-based AHP techniques. Arab J. Geosci14, 960. doi: 10.1007/s12517-021-07316-8
83
Shata A. A. (1982). Hydrogeology of the Great Nubian Sandstone basin, Egypt. Q. J. Eng. Geology15, 127–133. doi: 10.1144/GSL.QJEG.1982.015.02.04
84
Singh S. Jaiswal M. K. Kanhaiya S. Singh A. (2021). The Application of Morphometric Parameters in River Watershed Management: A Case Study of Rihand River, India (New York, USA: Nova Science Publishers). Available online at: https://www.researchgate.net/publication/352707147_The_Application_of_Morphometric_Parameters_in_River_Watershed_Management_A_Case_Study_of_Rihand_River_India (Accessed October 14, 2025).
85
Smida H. Dassi L. Boukhachem K. Masrouhi A. (2022). Satellite remote sensing and GIS-based multi-criteria analysis for the assessment of groundwater potentiality in fractured limestone aquifer: Case study of Maknassy Basin, central Tunisia. J. Afr. Earth Sci.195, 104643. doi: 10.1016/j.jafrearsci.2022.104643
86
Strahler A. N. (1952). Dynamic basis of geomorpholog. Geol. Soc. Am. Bull. 63, 923–938.
87
Sturchio N. Arehart G. Sultan M. Sano Y. Abokamar Y. Sayed M. (1996). Composition and origin of thermal waters in the Gulf of Suez area, Egypt. Appl. Geochemistry11, 471–479. doi: 10.1016/S0883-2927(96)00025-X
88
Swetha T. V. Gopinath G. Thrivikramji K. P. Jesiya N. P. (2017). Geospatial and MCDM tool mix for identification of potential groundwater prospects in a tropical river basin, Kerala. Environ. Earth Sci.76, 428. doi: 10.1007/s12665-017-6749-8
89
Tamesgen Y. Atlabachew A. Jothimani M. (2023). Groundwater potential assessment in the Blue Nile River catchment, Ethiopia, using geospatial and multi-criteria decision-making techniques. Heliyon9, e17616. doi: 10.1016/j.heliyon.2023.e17616
90
Thorweihe U. Brinkmann P. J. Heinl M. Sonntag C. (1990). Hydrological and hydrogeological investigations in the Darfur area, western Sudan. Berl. Geowiss. Abh., Reihe A.120, 279–326.
91
UNESCO (2001). Groundwater resources assessment: Principles, methods, and applications (Paris, France: United Nations Educational, Scientific and Cultural Organization).
92
Vancutsem C. Ceccato P. Dinku T. Connor S. J. (2010). Evaluation of MODIS land surface temperature data to estimate air temperature in different ecosystems over Africa. Remote Sens. Environ.114, 449–465. doi: 10.1016/j.rse.2009.10.002
93
Varade A. M. Khare Y. D. Yadav P. Doad A. P. Das S. Kanetkar M. et al . (2018). ‘Lineaments’ the potential groundwater zones in hard rock area: A case study of basaltic terrain of WGKKC-2 watershed from Kalmeswar tehsil of Nagpur district, central India. J. Indian Soc. Remote Sens46, 539–549. doi: 10.1007/s12524-017-0716-4
94
Voss C. I. Soliman S. M. (2014). The transboundary non-renewable Nubian Aquifer System of Chad, Egypt, Libya and Sudan: classical groundwater questions and parsimonious hydrogeologic analysis and modeling. Hydrogeology J.22, 441–468. doi: 10.1007/s10040-013-1039-3
95
Wannous M. Siebert C. (2025). Groundwater of the eastern Egyptian desert: Age and salinity patterns. Appl. Geochemistry184, 106367. doi: 10.1016/j.apgeochem.2025.106367
96
Wannous M. Theilen-Willige B. Troeger U. Falk M. Siebert C. Bauer F. (2021). Hydrochemistry and environmental isotopes of spring water and their relation to structure and lithology identified with remote sensing methods in Wadi Araba, Egypt. Hydrogeol J.29, 2245–2266. doi: 10.1007/s10040-021-02343-x
97
Werner A. D. Bakker M. Post V. E. A. Vandenbohede A. Lu C. Ataie-Ashtiani B. et al . (2013). Seawater intrusion processes, investigation and management: Recent advances and future challenges. Adv. Water Resour.51, 3–26. doi: 10.1016/j.advwatres.2012.03.004
98
. www.uea.ac.uk (n.d.).
99
Yeh H.-F. Cheng Y.-S. Lin H.-I. Lee C.-H. (2016). Mapping groundwater recharge potential zone using a GIS approach in Hualian River, Taiwan. Sustain. Environ. Res.26, 33–43. doi: 10.1016/j.serj.2015.09.005
100
Yeh H.-F. Lee C.-H. Hsu K.-C. Chang P.-H. (2009). GIS for the assessment of the groundwater recharge potential zone. Environ. Geology58, 185–195. doi: 10.1007/s00254-008-1504-9
101
Zhou Q. Liu X. (2004). Analysis of errors of derived slope and aspect related to DEM data properties. Comput. Geosciences30, 369–378. doi: 10.1016/j.cageo.2003.07.005
Summary
Keywords
Wadi Araba, Gulf of Suez Coast and Deltas, remote sensing, GIS modeling, groundwater potentiality, AHP techniques, climate change
Citation
Salem ZE, Al Temamy AM, Abu‐Alam TS, Mesallam MA and Fahil AS (2025) Integration of geospatial technology and AHP model for assessing groundwater potentiality in Arid Regions: a case study in Wadi Araba Basin, Western Coast of Gulf of Suez, Egypt. Front. Mar. Sci. 12:1670000. doi: 10.3389/fmars.2025.1670000
Received
21 July 2025
Accepted
30 September 2025
Published
21 October 2025
Volume
12 - 2025
Edited by
Aijun Wang, State Oceanic Administration, China
Reviewed by
Rakesh Ranjan Thakur, KIIT University, India; Mona Kaiser, Suez Canal University, Egypt
Updates
Copyright
© 2025 Salem, Al Temamy, Abu‐Alam, Mesallam and Fahil.
This is an open-access article distributed under the terms of the Creative Commons Attribution License (CC BY). The use, distribution or reproduction in other forums is permitted, provided the original author(s) and the copyright owner(s) are credited and that the original publication in this journal is cited, in accordance with accepted academic practice. No use, distribution or reproduction is permitted which does not comply with these terms.
*Correspondence: Tamer S. Abu‐Alam, tamer.abu-alam@uit.no; Mona A. Mesallam, m.a.mesallam1992@gmail.com
§ORCID: Amr S. Fahil, orcid.org/0000-0003-1259-4267
Disclaimer
All claims expressed in this article are solely those of the authors and do not necessarily represent those of their affiliated organizations, or those of the publisher, the editors and the reviewers. Any product that may be evaluated in this article or claim that may be made by its manufacturer is not guaranteed or endorsed by the publisher.