 Botao Xie1
 Hang Sun
 Weifang Jin
 Linxi Meng
 Yuntao Wang
- 1China National Offshore Oil Corporation (CNOOC) Research Institute Ltd, Beijing, China
- 2Ocean College, Zhejiang University, Zhoushan, China
- 3State Key Laboratory of Satellite Ocean Environment Dynamics, Second Institute of Oceanography, Ministry of Natural Resources, Hangzhou, China
- 4College of Oceanography, Hohai University, Nanjing, China
The South China Sea (SCS) has undergone multiple marine heatwaves (MHWs) over the past few decades. Daily reanalyzed sea surface temperature (SST) data are applied to identify major MHWs in the northwest SCS over 1982–2021. The MHWs have increased in frequency, intensity, and spatial extent during recent decades, but the strongest 2015/2016 winter MHWs occurring in our study region have not been fully explained. In situ observations revealed a strong dependence of the formation of MHWs on interannual variability, i.e., the El Niño. A prominent difference in SST was identified in winters between the El Niño (2015/2016) and a normal year (2016/2017), as well as marine dynamical processes in wind and current. Due to the teleconnections of extreme El Niño, the weakened monsoon wind led to reduced basin-scale wind field anomalies and vertical currents, acting as pre-conditioning for extreme MHW events. Additionally, local oceanographic dynamics, especially upper ocean circulation and mesoscale eddies, play an important role in different MHWs during their formation and intensification by driving horizontal currents and advection. In particular, the northward flow from the tropics is favorable for the generation of MHWs. A heat budget analysis was performed, which agrees with observations, showing both enhanced solar radiation and weakened wind depressed oceanic turbulent mixing, leading to more heat being concentrated in a shallower mixed layer and resulting in the record-breaking MHW. The in situ observations offer a comprehensive insight into the formation of extreme MHWs in the SCS.
1 Introduction
The South China Sea (SCS) is a large semi-enclosed marginal ocean basin located in the western Pacific Ocean. The SCS has experienced accelerated warming with the climate change during past decades (Wu et al., 2012; Yao and Wang, 2021) where prolonged extreme sea surface temperature (SST) anomalies, also known as marine heatwaves (MHWs; Hobday et al., 2016), have been observed in the recent years (Li et al., 2019; Xiao et al., 2018, 2020; Yao et al., 2020; Yao and Wang, 2021; Tan et al., 2022; Wang et al., 2022a, 2022b; Song et al., 2023). MHWs can induce devastating impacts on large-scale ecosystems, fisheries, and human activities (Oliver et al., 2018). An overall negative effect of MHWs was detected on ecological impacts (Smale et al., 2019). For example, the development of strong positive temperature anomalies in the Northeast Pacific during the 2013–2014 boreal winter triggered two cascading ecological responses: first, these thermal anomalies suppressed chlorophyll concentrations by the late winter/spring of 2014 through stratification induced nutrient limitation; second, the prolonged warm conditions coincided with anomalous biological phenomena across multiple trophic levels, including atypical species distributions, disrupted predator–prey interactions, and mass mortality events observed throughout the spring to autumn of 2014 (Bond et al., 2015). Heat accumulated in the subsurface layer during winter may be released and cause a secondary disastrous impact on the ecosystem in the following summer (Schaeffer and Roughan, 2017; Chen et al., 2021b). This is particularly true for the SCS, where harmful algal blooms occurred (He et al., 2023) and the coral environment was threatened by the increasing risk of thermal stress with MHWs (Mo et al., 2022; Lyu et al., 2024), and even a massive coral bleaching event occurred (Chen et al., 2021a; Feng et al., 2022; Zhao et al., 2023).
The evolution of MHWs is complex and attributed to multiple physical drivers. Atmospheric forcing plays a significant role in triggering MHWs. For instance, persistent high-pressure systems over the Yellow and East China Seas split from the western Pacific subtropical high (WPSH) in 2004, 2006, and 2016 enhanced solar radiation and weakened surface winds, leading to extreme summer warming events (Yan et al., 2020). Similarly, a strong MHW event on Australia’s North West Shelf during the austral summer of 2012–2013 was attributed to delayed and weakened Australian monsoon winds over the region during the 2012/2013 Ningaloo El Niño (Maggiorano et al., 2021). Ocean dynamics modulate MHW development through circulation patterns and thermal processes. For example, the unprecedented 2015–2016 Tasman Sea MHW (>8-month duration) coincided with persistently enhanced southward currents that advected anomalously warm water masses into the region, sustaining prolonged warming (Oliver et al., 2017). Specifically, the wind introduced weaker currents, which carried cooler water from the south, and resulted in a decrease in mixing between the upper ocean and the colder layer underneath during the 2012/2013 Australian MHW event (Maggiorano et al., 2021). These dynamics often interact with atmospheric forcing, creating feedback loops that amplify temperature extremes. Climate drivers and remote teleconnections provide a large-scale context for MHW formation. Most Indo-Pacific MHWs are linked to climate modes such as El Niño-Southern Oscillation (ENSO), the Indian Ocean Dipole (IOD), the Madden–Julian Oscillation, and Interdecadal Pacific Oscillation. For example, MHWs in the tropical Pacific are closely linked to ENSO events, particularly strong El Niño episodes (e.g., 1997/1998 and 2015/2016), which trigger extensive MHWs and influence the Indian Ocean and western Pacific regions through atmospheric teleconnections (Holbrook et al., 2019). The 2015/2016 El Niño exhibited distinct tropical–extratropical teleconnections compared to historic events (e.g., 1982/1983 and 1997/1998), with sustained North Pacific Oscillation forcing since 2013 amplifying the Victoria Mode’s contribution to northeast Pacific warming (Tseng et al., 2017). Notably, the record-breaking 2013–2015 Northeast Pacific “Blob” events were tied to tropical–extratropical interactions: the 2014 event correlated with the North Pacific Gyre Oscillation, while the 2015 warming aligned with a phase shift in the Pacific Decadal Oscillation (Di Lorenzo and Mantua, 2016). Such teleconnections modify regional atmospheric patterns and precondition oceanic thermal states through basin-scale adjustments.
For the SCS, previous studies have proposed that several processes were responsible for the variability and change of ocean temperature anomalies, especially the East Asian Monsoon (EAM) at the seasonal scale (Wu et al., 1998). Seasonal SST variation correlates well with the changes in the EAM; e.g., warm (cold) temperature induced by current occurs during southwesterly summer (northeasterly winter) winds (Wu and Chan, 1995; Liu and Xie, 1999; Gan et al., 2006). Most of the SCS MHW events were documented in summer (Yao and Wang, 2021; Cao et al., 2022; Chen et al., 2022; Feng et al., 2022; Mo et al., 2022; Tan et al., 2022; Han et al., 2023; Song et al., 2023; Zhao et al., 2023), but only a few were reported during winter (Cai et al., 2017; Liu et al., 2022; Meng et al., 2024). In winter, the whole basin-scale upper ocean circulation pattern turns into a cyclonic gyre, characterized by an energetic western boundary current (WBC) with numerous mesoscale eddies. Weak SCS currents in winter can be easily reversed by eddies, which transport water temperature from the tropics via anomalous horizontal advection, leading to extraordinary warming in certain regions in the SCS (Wang et al., 2021).
Climatic modes modulating oceanic variability are complex in the WBC regions, with few studies investigating the impact of climatic modes on winter MHWs in these regions (Holbrook et al., 2019). ENSO can significantly modulate SCS SST at the interannual variability via atmospheric Rossby wave responses (Wang et al., 2000), where the El Niño enhances the anticyclonic anomalies over the western North Pacific, leading to warm SCS through air–sea interactions (Fang et al., 2006; Wang et al., 2006). For example, the cyclonic circulation in the basin of the SCS is always weakened (Chao et al., 1996; Wang et al., 2000; Zhao and Zhu, 2016; Wang et al., 2018, 2019), and a significantly reduced WBC and a closed cyclonic eddy in the southern SCS during winter monsoon were attributed to the weakened EAM after the maturity of El Niño (Zu et al., 2018). Wang et al. (2006) found a double peak pattern (in February [+1] and August [+1]) of the SCS SST in response to El Niño. SCS SST has also shown different responses to El Niño (Liu et al., 2014; Tan et al., 2016), where their highest correlation was observed with a lag of 3–6 months for SST due to the propagation of signals from the tropical Pacific (Klein et al., 1999). The ENSO signal can propagate to the SCS through the Luzon Strait and affect the thermal state of the SCS (Xiao et al., 2018). In particular, SCS MHWs on the basin scale had been classified into different categories, including one category of El Niño during the first warming peak of El Niño from September to the following February (Liu et al., 2022). However, most studies have focused on ENSO’s impact on the basin-scale SCS, but the role of El Niño in driving MHWs in the northwest SCS during winter remains unclear and needs further studies.
Recent studies have highlighted that the trend of longer-lasting, more frequent, extensive, and intensive MHWs will increase under global warming in most regions of the world (Frölicher et al., 2018), especially in the WBC regions (Oliver et al., 2018; Yao et al., 2022). The MHWs in the SCS have shown that even during the global warming hiatus after 1998, MHW frequency increases at a rate of 1.13 events per decade, 2.5 times the global mean rate (Li et al., 2019). A correspondingly significant increase in this trend has been observed in the SCS (Tan et al., 2022), which will continue to increase in future decades (Yao et al., 2020). During the super El Niño of 2015/2016 (Santoso et al., 2017), extreme warm events have been widely analyzed around global oceans, including the North Pacific (Di Lorenzo and Mantua, 2016; Scannell et al., 2020), across tropical Australia (Benthuysen et al., 2018), the SCS (Xiao et al., 2020), the Yellow Sea (Li et al., 2022), and the East China Sea (Gao et al., 2020). For the SCS basin, Liu et al. (2022) pointed out that two extreme MHWs during 25 October–27 December 2015 and 2 January–2 February 2016 occurred, associated with the 2015/2016 super El Niño event, and their prominent features were first investigated in the satellite-observed record across 1982–2018. They found that MHWs in winter were jointly contributed by the increased net shortwave radiation over the southwestern SCS and the positive latent heat flux anomalies over the northern SCS (Liu et al., 2022). Nevertheless, the possible relationship between winter MHWs and the local drivers, e.g., SCS WBC and mesoscale eddies, has not yet been sufficiently addressed. Zhao and Zhu (2016) found that the MHWs in WBC regions of the SCS cannot be explained by the surface net heat flux alone but may be attributed to the weakest SCS WBC and strong eddy activities.
Given the lack of vertical observation that can directly relate to MHWs in WBC systems, it is not possible to investigate local drivers for MHWs. In this paper, we explore in more detail the 2015/2016 winter MHWs using a 2-year mooring observation, which includes a dataset with high temporal and vertical spatial resolution. Meanwhile, we analyzed MHW events during 1982–2021 and their driving forces, especially the relative contribution of local wind (wind stress), upper ocean circulation, and full-water-column currents on SST anomalies in winter (November–February) during the El Niño year (2015/2016) and normal year (2016/2017) with in situ observations. Furthermore, we provide insights into the mechanisms of MHWs in the SCS WBC region in addition to the previous findings of Zhao and Zhu (2016) and Liu et al. (2022). The remaining part of the paper is organized as follows: Section 2 describes the data and methods, Section 3 presents the observed characteristics of MHWs from 1982 to 2021 and evidence of local oceanographic dynamics during the winter of 2015/2016, Section 4 presents the discussion of the potential mechanisms, and Section 5 summarizes the paper.
2 Data and methods
2.1 In situ and satellite observations
In this study, a combination of in situ and satellite observations was employed to assess the occurrence of MHWs. The daily Optimum Interpolation SST (OISST) version 2.1 dataset with 0.25° × 0.25° resolution grid was sourced from the US National Oceanic and Atmospheric Administration (NOAA), over the period 1982 to present (Xiao et al., 2020). The surface wind data at 6-hour intervals with a 0.25° × 0.25° resolution were obtained from the Cross-Calibrated Multi-Platform (CCMP) ocean surface wind product, spanning the period from 1987 to the present. The daily sea surface height (SSH) and associated surface geostrophic currents, e.g., geostrophic meridional and zonal currents, with 0.25° horizontal resolution were provided by the Copernicus Marine Environment Monitoring Service (CMEMS), covering the period from 1993 to present. For each variable, the daily climatology was computed over its respective baseline period: 1982–2021 for SST, 1988–2021 for wind, and 1993–2021 for SSH. Furthermore, SST anomalies (SSTAs), wind anomalies, and SSH anomalies (SSHAs) were calculated by subtracting the corresponding climatological values.
For the calculation of the heat fluxes in the heat budget, the ERA5 reanalysis was employed, provided by the European Centre for Medium-Range Weather Forecasts (ECMWF), which includes variables such as longwave radiation, shortwave radiation, latent heat flux, and sensible heat flux at the sea surface, with a spatial resolution of 0.25° and a daily temporal resolution, covering the period from 1950 to present. For the exploration of subsurface temperature profiles and dynamic processes, the requisite subsurface data were derived from Ocean General Circulation Model for the Earth Simulator (OFES) product, which encompasses variables such as temperature and three-dimensional currents (zonal, meridional, and vertical components) with 54 vertical levels at approximately 5-m interval in the upper ocean, a spatial resolution of 0.1°, and a 3-day temporal resolution (Yan et al., 2020). The simulation covers the quasi-global ocean from 75°S to 75°N (excluding the Arctic Ocean) and a long-time series (1950 to present) (Sasaki et al., 2008). To adapt to the daily resolution required for the heat budget diagnosis in this study, the 3-day data were linearly interpolated to daily intervals.
In order to study the impact of ENSO on MHWs, the bi-monthly Multivariate ENSO Index Version 2 (MEI.v2) from the National Oceanic and Atmospheric Administration Physical Sciences Research Laboratory was utilized. The MEI is a single index and an assessment of ENSO activity, which was derived from the leading combined Empirical Orthogonal Function of five different variables, including sea level pressure, SST, zonal and meridional components of the surface wind, and outgoing longwave radiation over the tropical Pacific basin (30°S–30°N and 100°E–70°W). Here, an El Niño (La Niña) event was defined when MEI exceeded +0.5 °C (−0.5 °C) and lasted for at least three consecutive months (Zhao and Zhu, 2016). Based on this criterion, 11 El Niño events were identified from 1982 to 2021: 1982/1983, 1987/1988, 1991/1992, 1992/1993, 1994/1995, 1997/1998, 2002/2003, 2006/2007, 2009/2010, 2015/2016, and 2018/2019.
This study focused on the geographic domain 8°–24°N, 104°–122°E, encompassing the entire Northern South China Sea (NSCS) (Figure 1). Within this region, a subsurface mooring was deployed at 110.64°E, 17.45°N (black pentagram in Figure 1), with a water depth of ∼1,445 m. The mooring was deployed over a 2-year period from August 2015 to November 2017, with batteries replaced every 6 months during periodic maintenance. Its configuration for the current-measuring system included the following: three Teledyne RD Instruments acoustic Doppler current profilers (ADCPs) and three Aanderaa current meters (SeaGuard). There were an upward‐looking 300‐kHz ADCP and a downward‐looking 75‐kHz ADCP at a nominal depth of 80 m, and a downward‐looking 600‐kHz ADCP at 25 m above the seabed. Three SeaGuard meters were at nominal depths of 695, 945, and 1,195 m. The 300‐kHz ADCP (75‐kHz ADCP) measured velocity every 3 minutes in 25 (35) bins at 4-m (16-m) intervals during the entire period. The few measurements with missing values were filled with linear interpolation from the nearest vertical measurements. Then, the velocity data from the 300-kHz ADCP and 75-kHz ADCP were linearly interpolated vertically at a standard interval of 10 m. The velocity data were filtered using a 48-hour low-pass filter to remove high-frequency signals and then averaged daily.
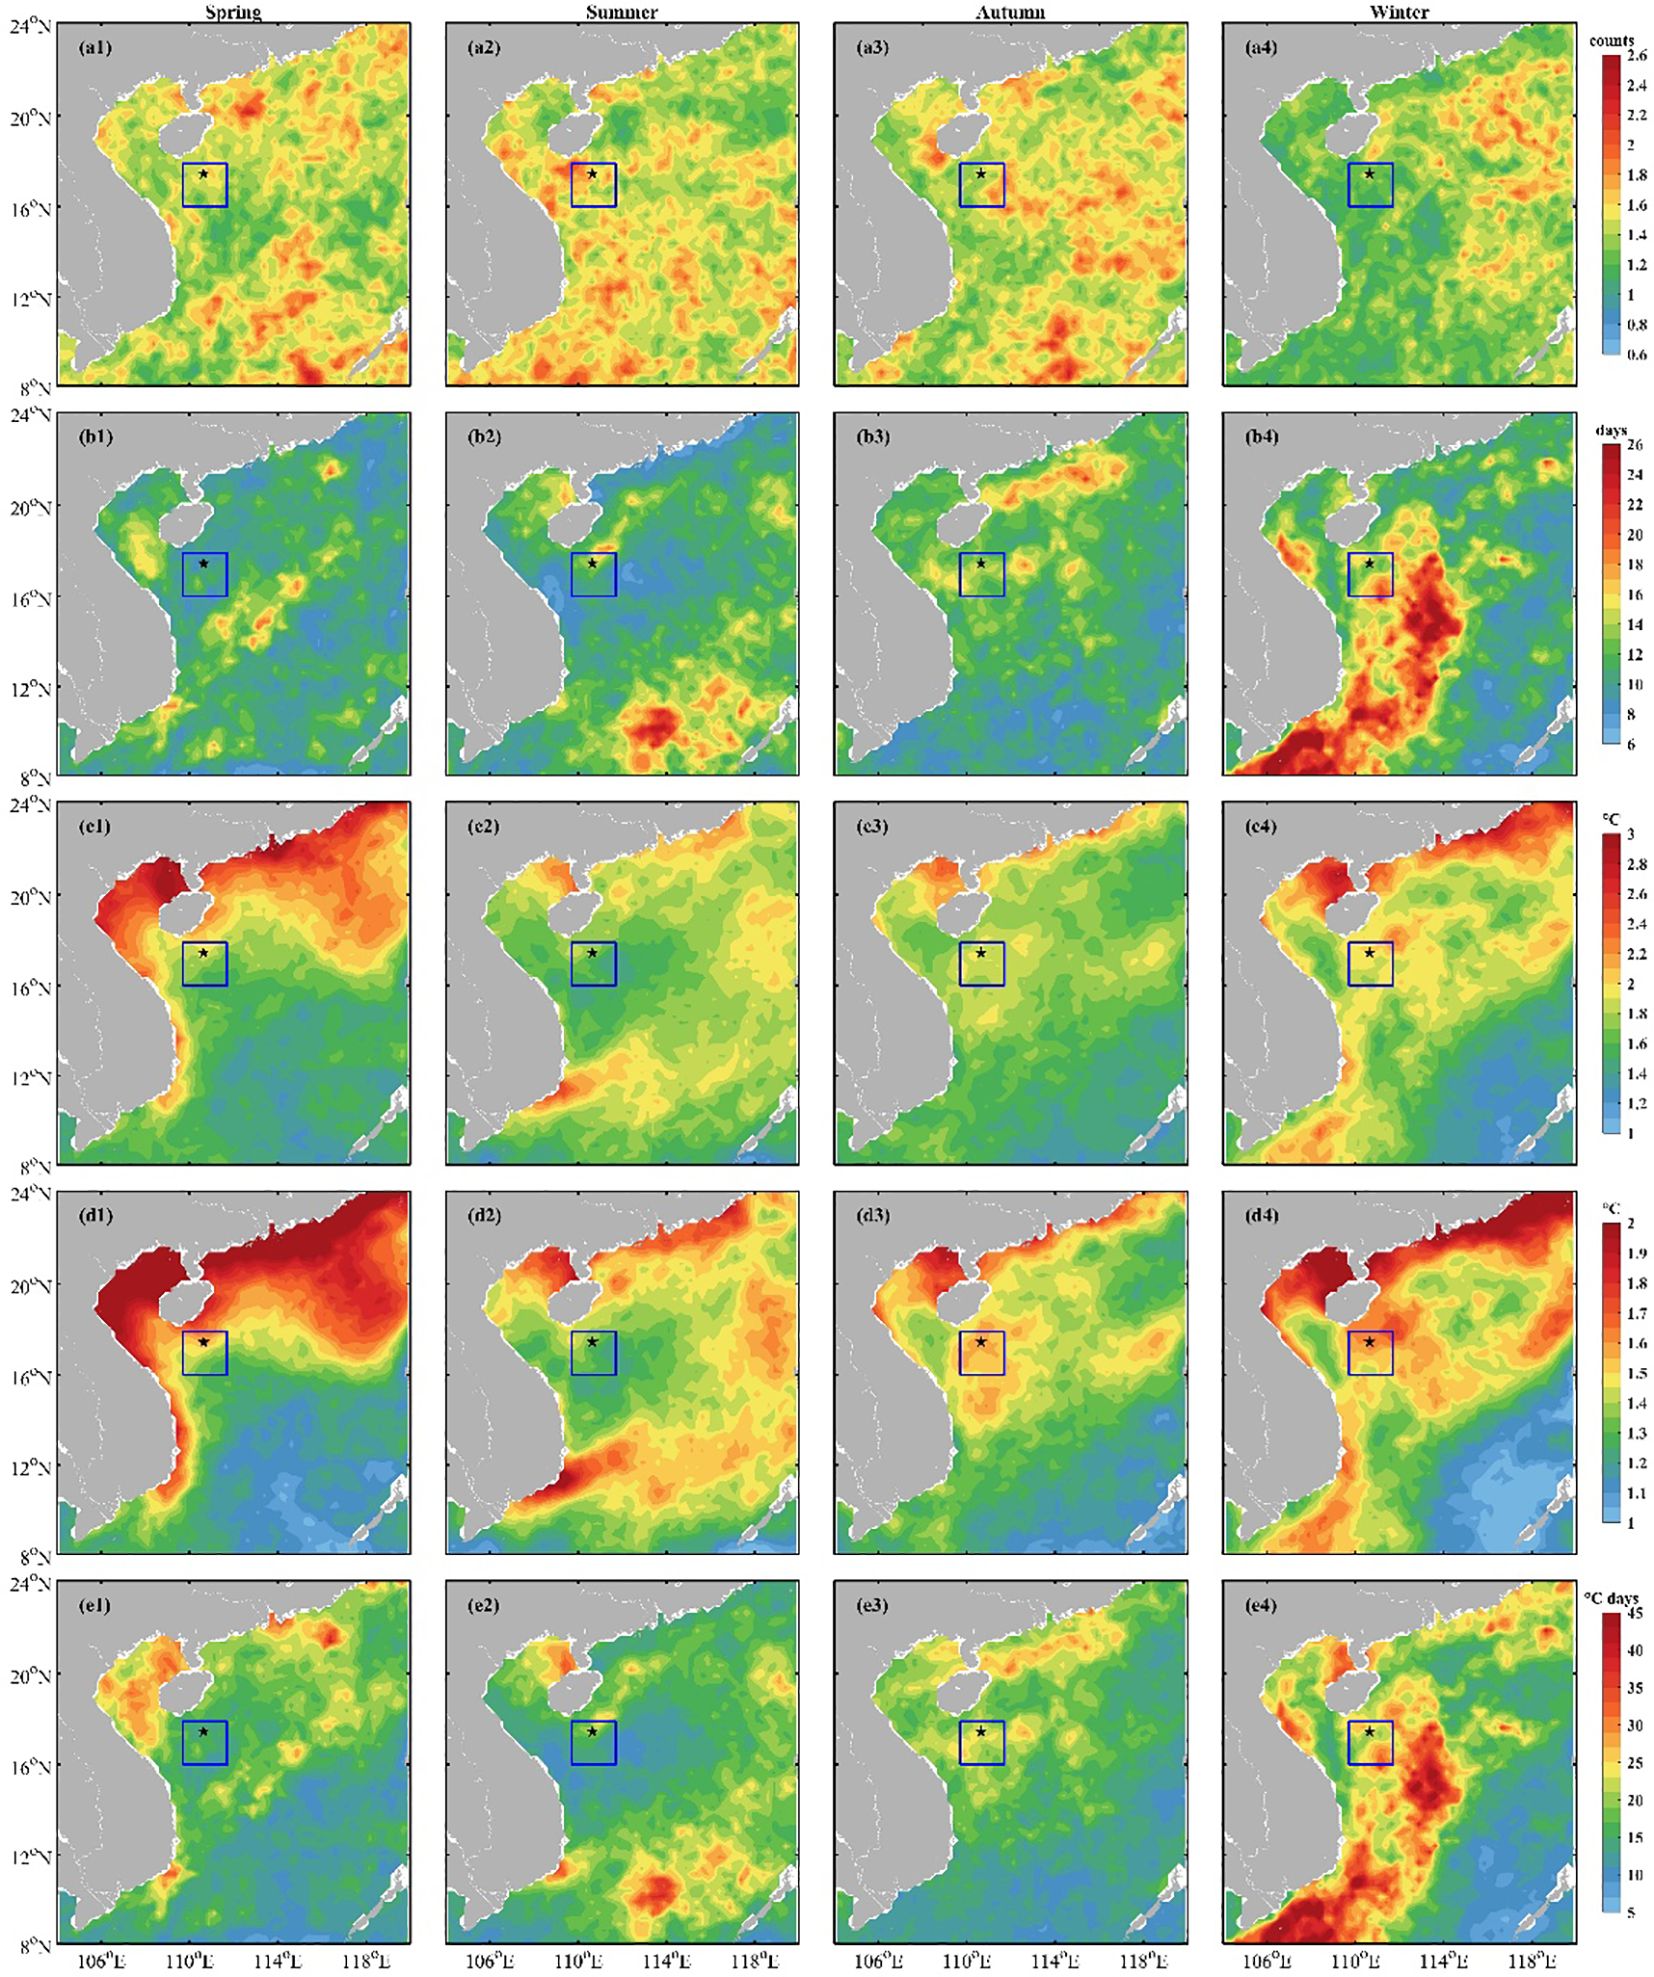
Figure 1. Spatial distribution of the multi-year four seasons of averaged MHW properties in the NSCS from 1982 to 2021. (a1)–(a4) Frequency, (b1)–(b4) duration, (c1)–(c4) maximum intensity, (d1)–(d4) mean intensity, and (e1)–(e4) cumulative intensity. The blue box, e.g., 16.0°N–17.9°N and 109.7°E, 111.7°E, is the region of interest in this paper. The subsurface mooring location (named M) is indicated by the black star in the blue box. MHW, marine heatwave; NSCS, Northern South China Sea.
2.2 Definition of MHWs
MHW events were defined as the daily SST at each grid point exceeding the 90th percentile at least five consecutive days within the climatology period 1982–2021, following Hobday et al. (2016). Two MHW events with an interval of less than 2 days were considered as a single MHW event. The climatological threshold and the mean were calculated from the daily SSTs within an 11-day window centered on each calendar day across all years and then smoothed using a 31-day moving average (Oliver et al., 2018). The 90th percentile is well-suited for studying impacts on marine ecosystems that are sensitive and accurate to identify MHW events (Li et al., 2019; Xiao et al., 2020; Yao and Wang, 2021; Feng et al., 2022; Liu et al., 2022; Mo et al., 2022; Tan et al., 2022; Wang et al., 2022b; Yao et al., 2022; Han et al., 2023; He et al., 2023; Song et al., 2023; Zhao et al., 2023). Once MHWs were identified, a set of metrics, including frequency, duration, total days, mean intensity, maximum intensity, and cumulative intensity, was calculated. Frequency (unit: counts) means the number of MHW events. Duration (unit: days) represents the time between the start and end dates of an MHW event. Total days (unit: days) is the sum of MHW days. Mean intensity (unit: °C), maximum intensity (unit: °C), and cumulative intensity (unit: °C·days) were calculated as the mean temperature anomaly, maximum temperature anomaly, and the sum of the temperature anomalies during an MHW event, respectively. If one MHW event spans multiple months or years, the start date of this event was consistently used as the statistical criterion (Oliver et al., 2018; Lyu et al., 2024).
2.3 Ocean mixed-layer heat budget
The mixed-layer heat budget was constructed to understand the major controlling factors of MHWs and identify underlying physical processes contributing to MHWs (Kataoka et al., 2017; Yuan et al., 2024). Following Moisan and Niiler (1998), the mixed-layer temperature (MLT) tendency is primarily caused by a combination of air–sea heat exchanges, advection by currents and eddies, horizontal and vertical mixing, and entrainment of water into the mixed layer. The specific equation is as follows:
where and t are the temperature averaged in the surface mixed layer and time, respectively. is the net surface heat flux, including the latent heat flux (LHF), sensible heat flux (SHF), shortwave radiation (SWR), and longwave radiation (LWR). In this paper, and its four components are downward positive. is the downward radiative heat flux at the bottom of the mixed layer, is the seawater density (1,025 kg m−3), is the specific heat capacity of seawater (4,000 J kg−1 K−1), and h is the mixed-layer depth (MLD), which is defined as the depth where the ocean temperature does not exceed more than 0.5 °C from that of the surface. is the two-dimensional horizontal velocity vector averaged in the mixed layer, and ∇ is the horizontal gradient operator. is the vertical velocity at the bottom of the mixed layer, and is the temperature just below the mixed layer. In Equation 1, the term on the left side represents the temperature tendency. The first term on the right side of Equation 1, denotes the surface heat flux, the second term represents the horizontal advection, and the third term represents the vertical entrainment. The baseline period was from 1982 to 2021.
3 Results
3.1 Spatiotemporal feature of MHWs
Based on the aforementioned definition of MHW events, the seasonal properties of MHWs in spring (February, March, and April), summer (May, June, and July), autumn (August, September, and October), and winter (November, December, and January) from 1982 to 2021 were analyzed (Figure 1). The results revealed pronounced seasonal variability in MHW activity across the region. The occurrence of MHWs has peaked at approximately three counts annually over the past four decades. The average frequency of MHWs is roughly equal in spring, summer, and autumn (~0.9 counts) and slightly lower in winter (~0.7 counts) (Figures 1a1–a4). The mean duration of an MHW event in the blue box region is 13 days, notably shorter than the SCS-wide average of 18.13 days reported by Liu et al. (2022). The longest events (>26 days) are observed off the western shelf in winter (Figure 1b4), whereas mean event durations in other seasons are generally below 13 days (Figures 1b1–b3). A particularly long event (>26 days) is also detected in the southeastern SCS during summer (Figure 1b2), consistent with the findings of Yao and Wang (2021). The spatial distribution of MHW intensity exhibits belt-like patterns paralleling the coastline, with values decreasing toward the open northwestern SCS (Figures 1c1–c4, d1–d4). In winter and spring, MHWs are characterized by elevated SSTAs in the northwestern SCS, where the maximum intensity reaches 2.8°C, particularly in the Beibu Gulf and the Pearl River estuary around 21°N (Figures 1c1, c4). In these seasons, the mean intensity decreases to 1.5°C along the continental slope (Figures 1d1, d4). Summer MHWs are generally less intense, with maximum and mean intensities around 1.5°C and 1.2°C, respectively. The highest maximum intensity in summer is approximately 2°C near 11°N, while the lowest mean intensity (~1.15 °C) occurs in the western SCS (Figures 1c2, d2). Autumn spatial patterns resemble those in winter and spring but with lower values (Figures 1c3, d3). The cumulative intensity of MHWs, which are affected by mean intensity and event duration, is the highest in winter (15.2 °C·days), and lower in spring, autumn, and summer (∼11 °C·days) (Figures 1e1–e4). These findings agree well with the results of Liu et al. (2022) and Meng et al. (2024). MHWs with strong cumulative intensity could potentially exert severe pressure on the marine ecosystem, leading to a decrease in biodiversity and having significant repercussions on fisheries and the economy (Marin et al., 2021). In winter, the offshore area of northeast Vietnam in the NSCS shows high cumulative intensity exceeding 40°C·days (Figure 1e4), which corresponds to strong mean intensity (>1.5°C) (Figure 1d4). Interestingly, the blue box region containing the subsurface mooring lies at the boundary between areas experiencing the longest durations and strongest cumulative intensities of MHWs (Figures 1b4, e4). Given that winter MHWs of such intensity have not been previously studied, our study aims to fill this research gap in the NSCS.
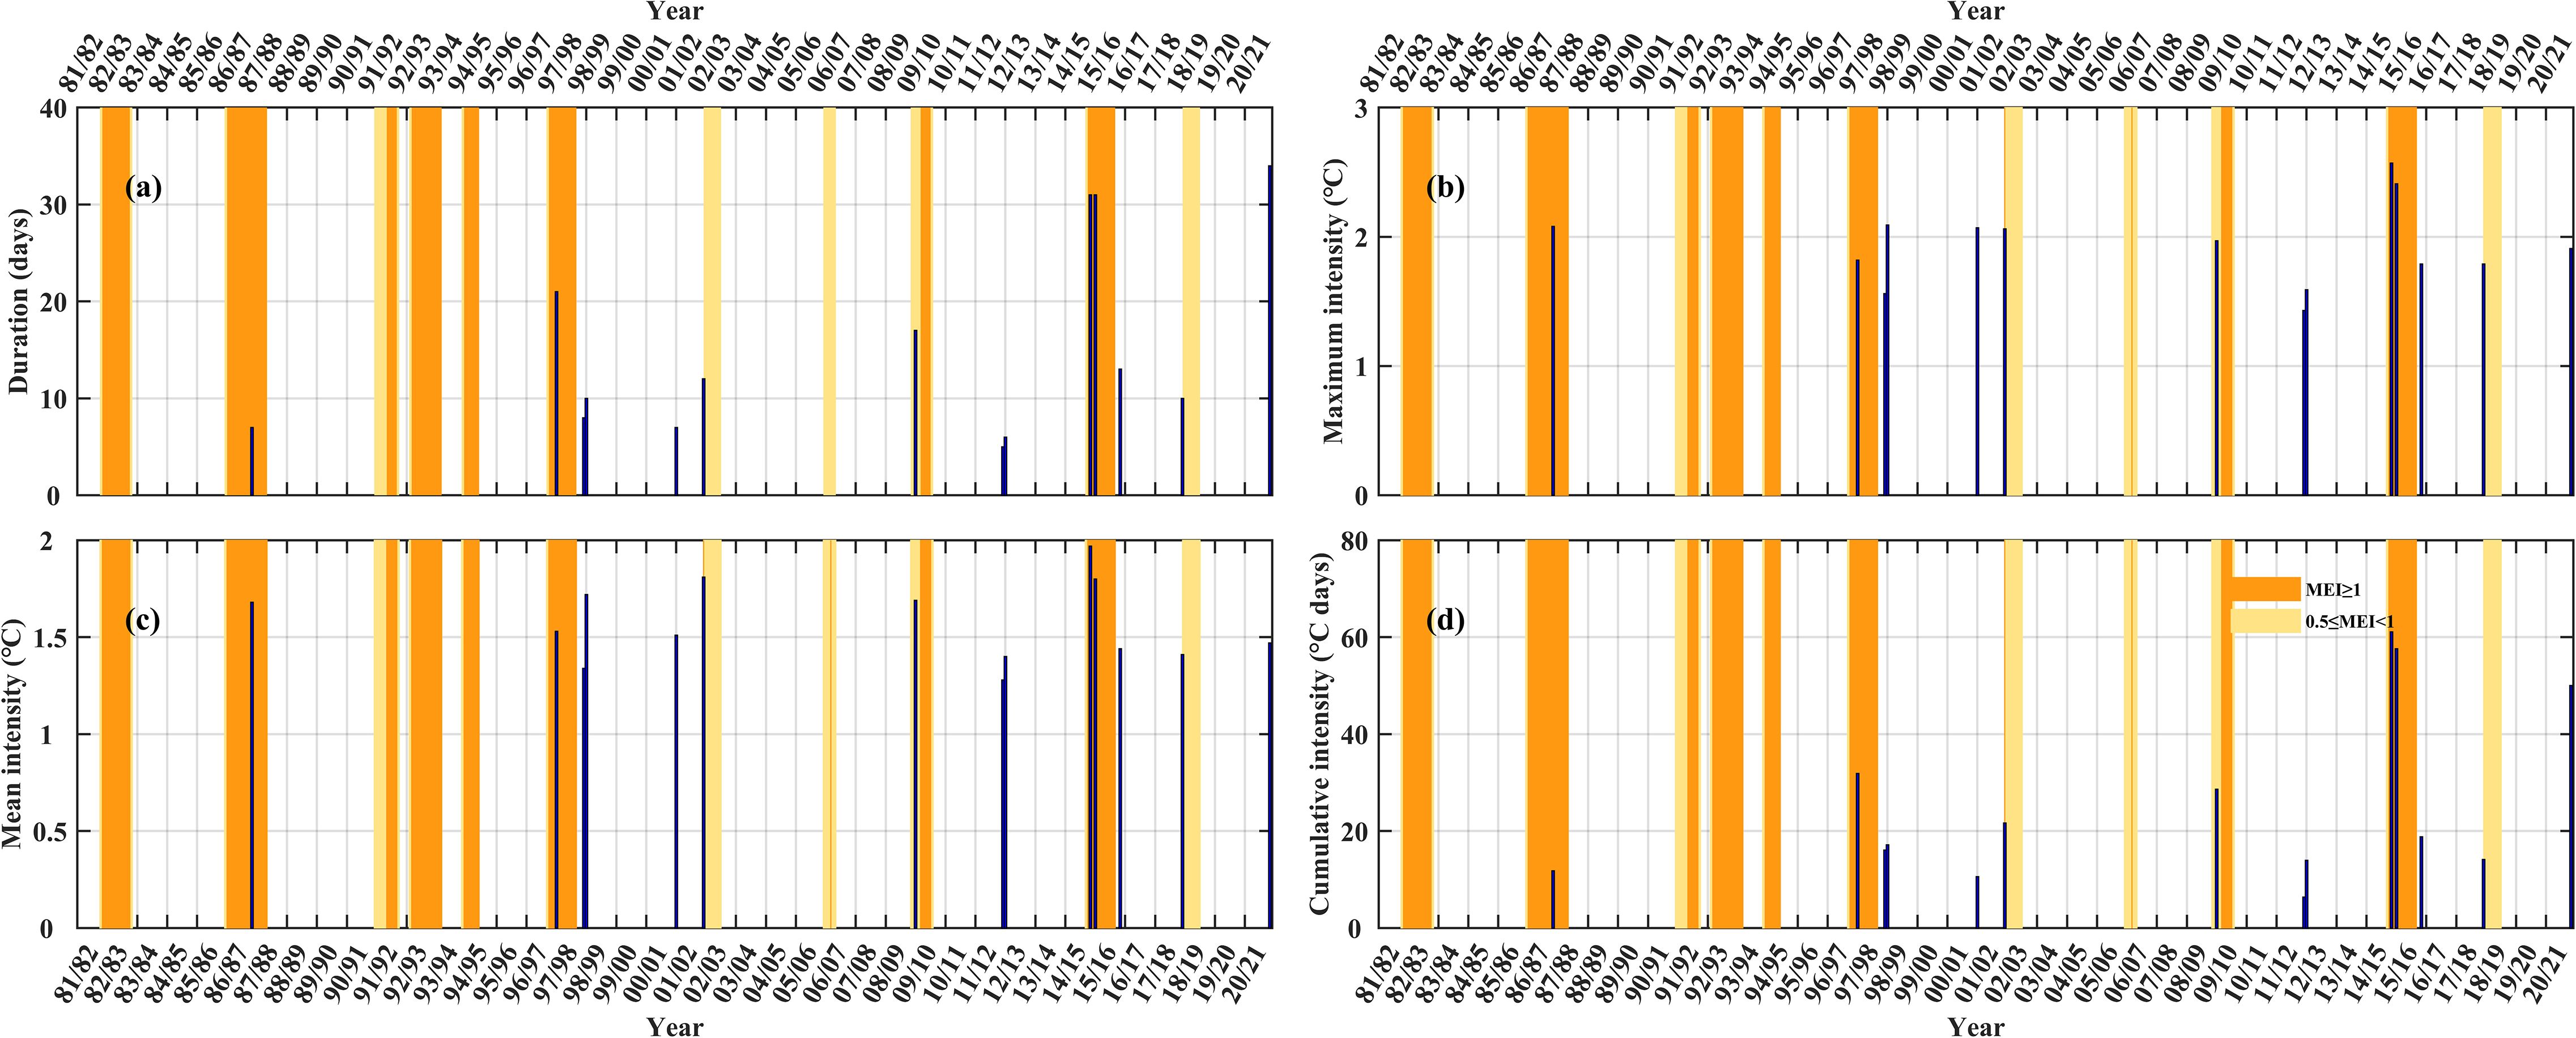
Figure 2. Statistical characteristics of winter MHWs in the blue box region of the NSCS during 1982−2021: (a) duration, (b) maximum intensity, (c) mean intensity, and (d) cumulative intensity. The yellow and orange bins indicate large and extreme positive MEI, respectively. More detailed information on the MHWs in the blue box region of NSCS can be seen in Table 1. MHW, marine heatwave; NSCS, Northern South China Sea; MEI, Multivariate El Niño-Southern Oscillation Index.
A positive SSTA was applied to identify the occurrence and persistence of MHWs (Yao and Wang, 2021; Liu et al., 2022; Han et al., 2023), especially the prominent MHW events where SSTAs exceeded 1.0°C (Figure 1). Overall, a total of 56 MHW events were detected within the blue box region, corresponding to 770 MHW days over the 40-year period (Table 1). There were 18 years without MHW events: 1982, 1984–1986, 1989–1996, 2003–2006, 2013, and 2017. Of the 56 MHW events, 51 occurred after 1996, a period marked by a remarkable warming trend in the SCS (Thompson et al., 2017; Liu et al., 2022). Since June 2014, 473 MHW days were recorded, with the longest duration occurring in 2019 (116 days), followed by 2016 (107 days). The highest frequency of MHW events was observed in 2016, with six events, followed by five events in 2019. We found that the region had an increasing trend of 1.3 MHW events per year between 2014 and 2021. Statistically, approximately 6 MHW events lasting over 30 days occurred in 2015, 2016, 2019, 2020, and 2021. The longest MHW persisted for 55 days from August to October 2020. The seasonal variations and associated physical mechanisms of these winter MHWs were further investigated. MHWs can occur on any day in a year, and 14 MHW events were found in winter, accounting for 25% of the total events (Figure 1; Table 1). In terms of maximum intensity, 76.8% of all MHW events had maximum SSTAs exceeding 1.5°C, especially 21.4% surpassing 2.0 °C (Table 1). Among them, the extreme MHW events with maximum SSTAs above 2.2°C were observed in the spring of 1998, the autumn and winter of 2015/2016, and the spring of 2019. The first extreme event occurred from 26 March to 6 April 1998, with a maximum intensity of 2.55°C and a cumulative intensity of 28.99°C·days. This event was associated with a significant warmer climate shift in early November 1997, characterized by sharply rising SSTAs following the strong 1997/1998 El Niño (Thompson et al., 2017; Li et al., 2019). The second event began with rapid SST warming in August 2015; SST anomalies were 1.15°C and 0.98°C higher than those in the autumns of 1982 and 1997, respectively, influenced by the 2015/2016 El Niño and an unusual IOD (Xiao et al., 2020). In our study, warm anomalies persisted throughout the autumn and winter of 2015/2016, featuring three peaks from 25 September 2015 to 1 February 2016, with cumulative intensities of 38.57°C·days, 61.09°C·days, and 57.60°C·days (Table 1). The third event occurred during the 2018/2019 El Niño, with an average SSTA of 0.77°C across the SCS (100–125°E, 0–25°N; Liu et al., 2022). The domain-averaged SSTA reached 1.27°C in December 2018, facilitating MHW formation. The event exhibited a maximum intensity of 2.32°C and a cumulative intensity of 50.13°C·days. These results indicate that severe MHW events in the NSCS exhibit significant interannual variability, and their frequency and intensity appear to relate to El Niño events.
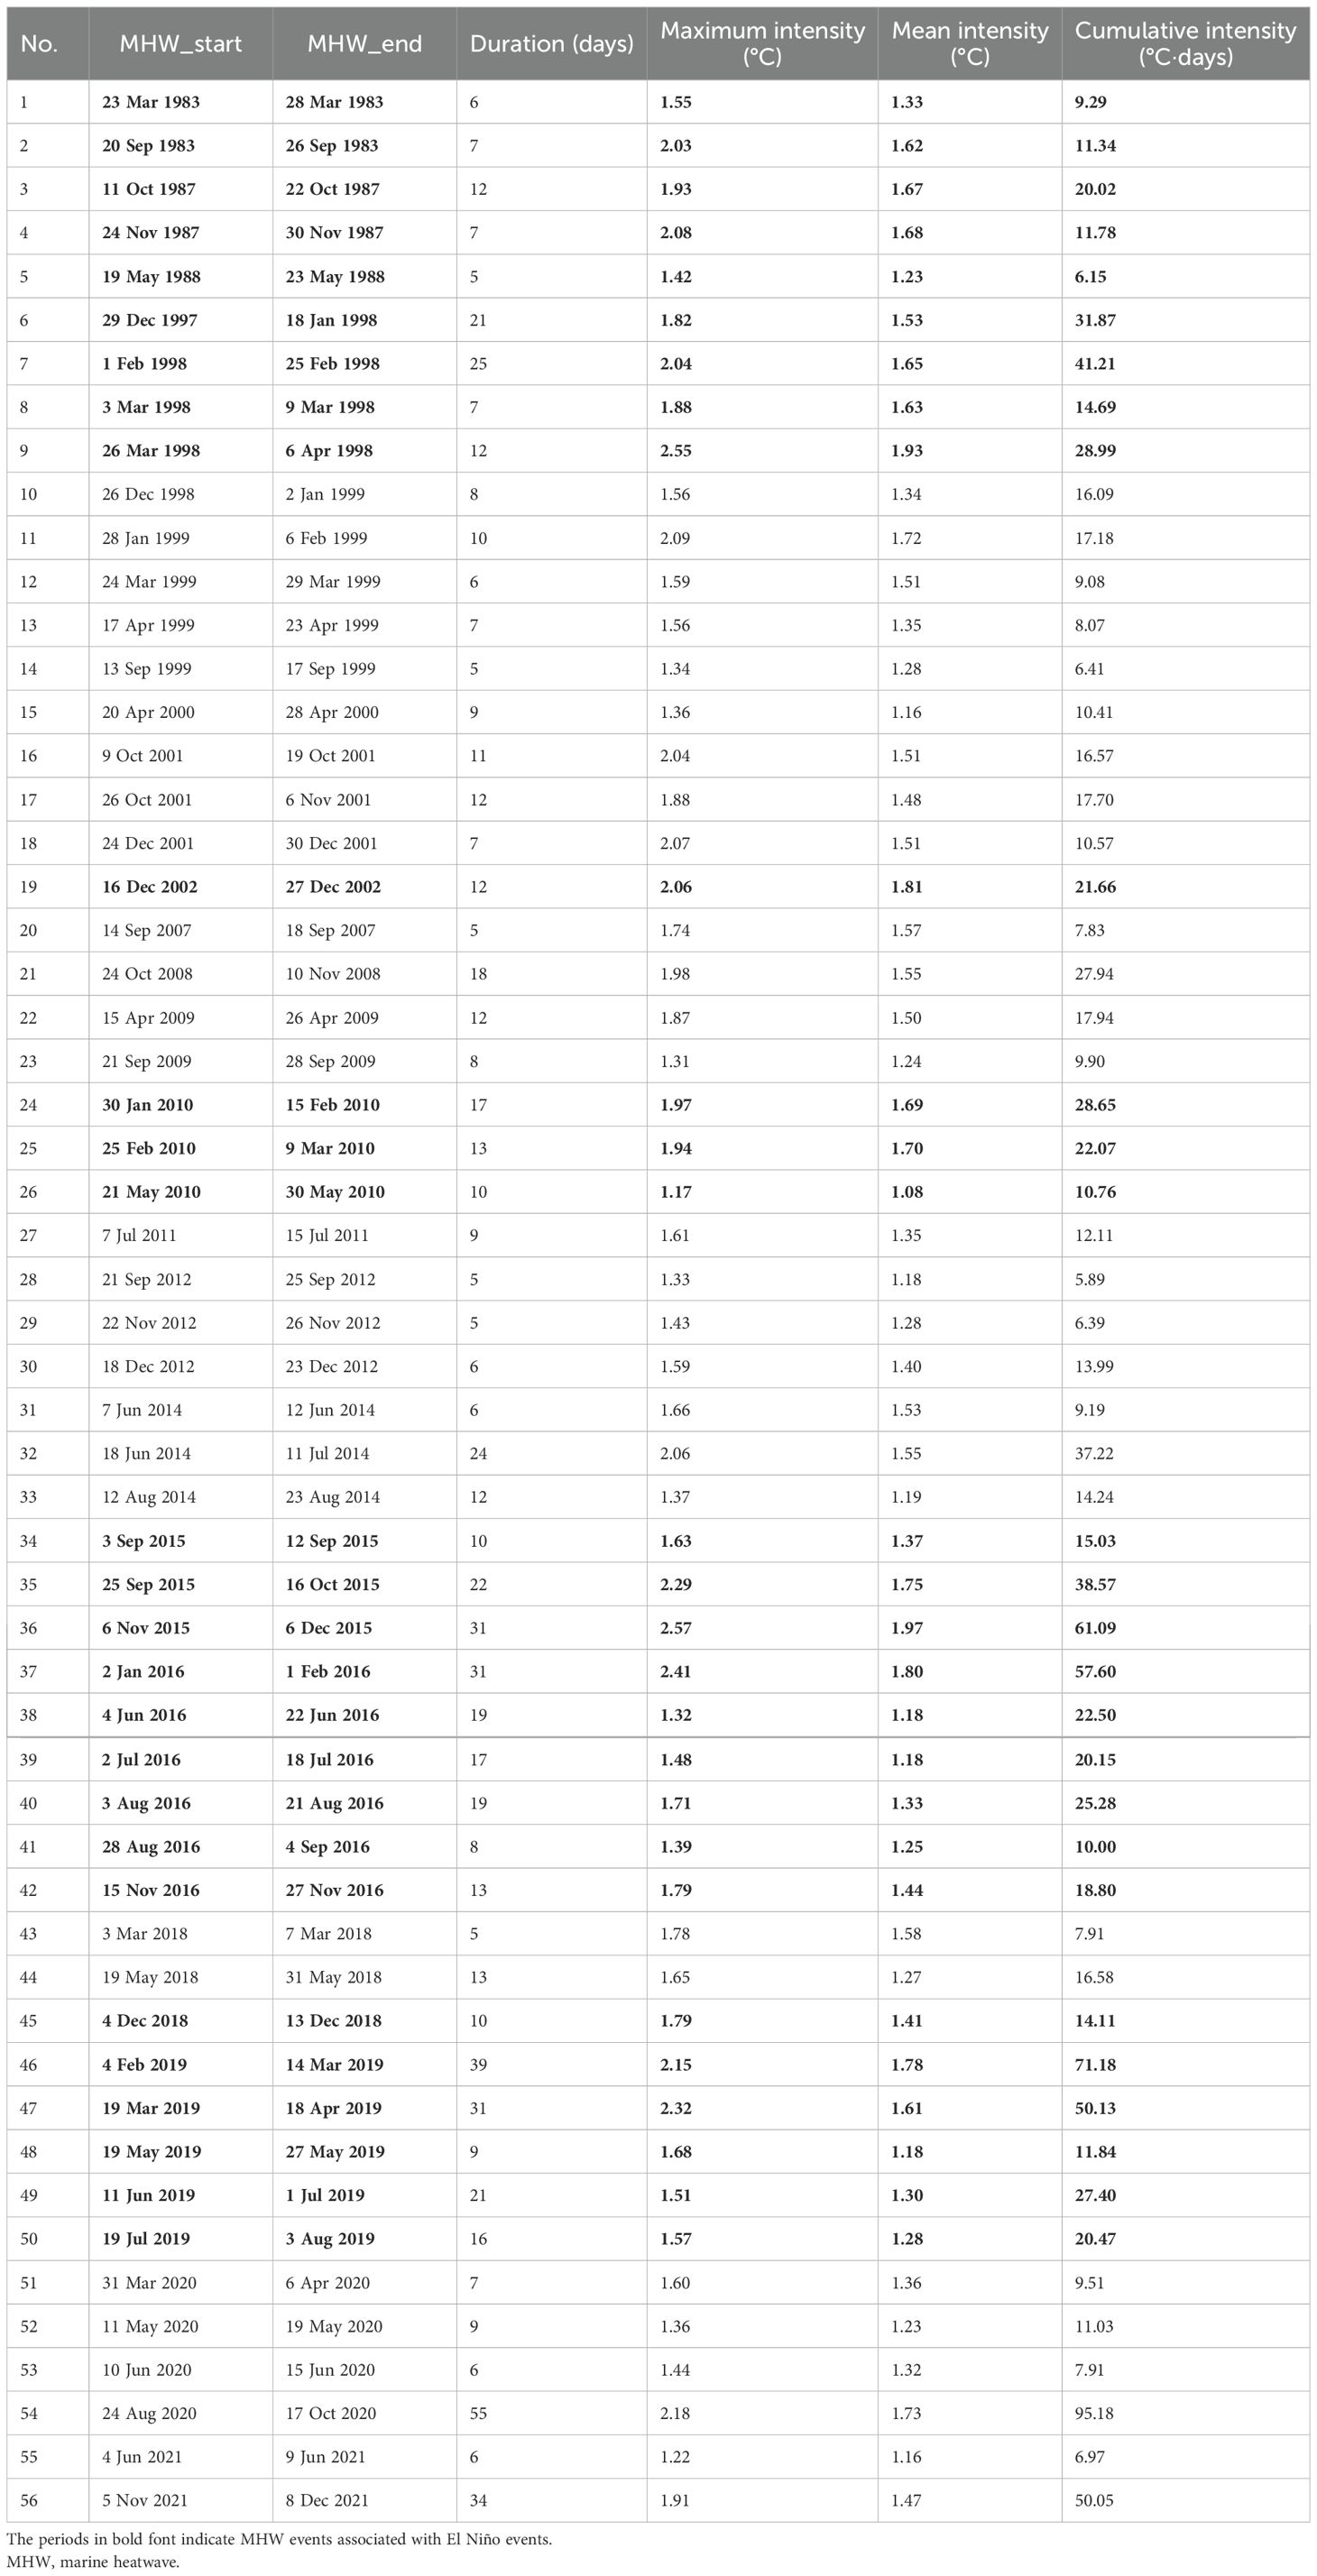
Table 1. Summary of the MHW features during 1982–2021.
From Table 1, we can see that 57.1% of 14 winter MHW events occurred during El Niño events in the blue box region (Nos. 4, 6, 19, 24, 36, 37, 42, and 45). Then, we investigated the characteristics of these MHW events. Figure 2 presents the time series of the duration and the maximum/mean/cumulative intensity for these winter MHW events in relation to the MEI. The mean duration of MHWs averaged in the blue box was 18.4 days, the mean maximum intensity was 2.10°C, the mean intensity was 1.70°C, the mean cumulative intensity was 32.39°C·days, and the number of total days was 129 days during the winter El Niño period. However, the mean duration was 11.90 days, the mean maximum intensity was 1.78°C, the mean intensity was 1.45°C, the mean cumulative intensity was 19.01°C·days, and the number of total days was 83 days during the winter non-El Niño period. Notably, the mean cumulative intensity and the number of total days during the winter El Niño period were nearly two times those of the winter non-El Niño period. No winter MHWs occurred in 1982/1983, 1991/1992, 1992/1993, 1994/1995, 2006/2007, and 2020/2021, despite El Niño occurrences in those years. In addition, we further examined the relationship between the MEI and the maximum intensity of winter MHW events within the blue box region, with a strong relationship (r = 0.59). This suggests that El Niño events may serve as an important large-scale precursor for surface warming associated with MHWs in the SCS, particularly during the winter. While El Niño can create favorable conditions for the occurrence of MHWs, it does not invariably lead to their development. Therefore, winter MHWs in this region are predominantly influenced by El Niño events. Consequently, the interannual variability of winter SST in the blue box area is strongly correlated with El Niño. Given its exceptional intensity and duration, the 2015/2016 winter events were selected for further analysis of their temporal evolution and underlying mechanisms.
Prior to 2015, the total MHW duration lasted for 4 months, covering December 1998–March 1999. A substantial and prominent MHW event was identified in the autumn and winter of 2015/2016 with a total duration of 6 months, spanning from September 2015 to February 2016. Within this period, the most extreme MHW events from the first few days of November 2015 to the first day of February 2016 (Nos. 36 and 37 in Table 1) were observed, with the highest cumulative intensity exceeding 55°C·days. These extreme MHW events have previously been ascribed to be related to the super 1997/1998 and 2015/2016 El Niño events (Xiao et al., 2018; 2020; Yao et al., 2020; Yao and Wang, 2021). Liu et al. (2022) studied 61 MHW events in the SCS during 1982–2018 and reported that the most (secondly most) extreme MHW reached a maximum intensity of +1.58°C (+1.37°C) with a cumulative intensity of 37.07°C·days (66.38°C·days) from 2 January to 2 February in 2016 (25 October to 27 December in 2015). Xiao et al. (2020) observed another extreme occurred in the winter of 1997/1998 with the longest duration of 101 days and the largest cumulative intensity of 101.70°C·days. The discrepancy in the duration is consistent with previous studies (Yao et al., 2020; Yao and Wang, 2021; Liu et al., 2022) due to differences in the selected domains and the climatological reference periods. Therefore, we will focus on analyzing these two winter events in the next section.
3.2 Extreme MHWs in winter of 2015/2016
In this study, we further computed the domain-averaged daily SST evolution over the full 2-year period from January 2015 to December 2016 (Figure 3). The region experienced nine MHW events from early September 2015 to November 2016. Among these, eight MHWs occurred during two distinct periods of persistent MHW conditions: the first included four events during the autumn and winter of 2015/2016 (September–following February), each lasting between 10 and 31 days; the second also consisted of four events in the summer of 2016 (June–August), with durations ranging from 7 to 19 days (red shaded area in Figure 3). In particular, the maximum intensity during the first period (exceeding 1.2°C) was approximately twice that of the second period (~0.67°C). Here, we only focused on the two most intense winter events in 2015/2016, namely, MHW1 and MHW2 (Nos. 36 and 37 in Table 1, respectively). According to standard MHW metrics, both events have the same duration of 31 days, with cumulative intensity of 61.09°C·days during MHW1 and 57.60°C·days during MHW2. Multiple SST datasets suggest that the mean SSTAs in September to November of 2015 broke the previous record set in 1998 by nearly 0.59°C in the SCS (99.5–105.5°E, 10–18°N) (Xiao et al., 2020). As the northwest part of the region above, we also found the MHW events in the 2015/2016 winter were much stronger and longer-lasting than those that occurred in the autumn of 2015. The area-averaged SST reached 28.9°C (2.57°C above normal) on 20 November 2015 during MHW1 and 26.4°C (2.41°C above normal) on 23 January 2016 during MHW2. In summary, MHW1 represents the longest and most intense winter MHW on record in this region since 1982.
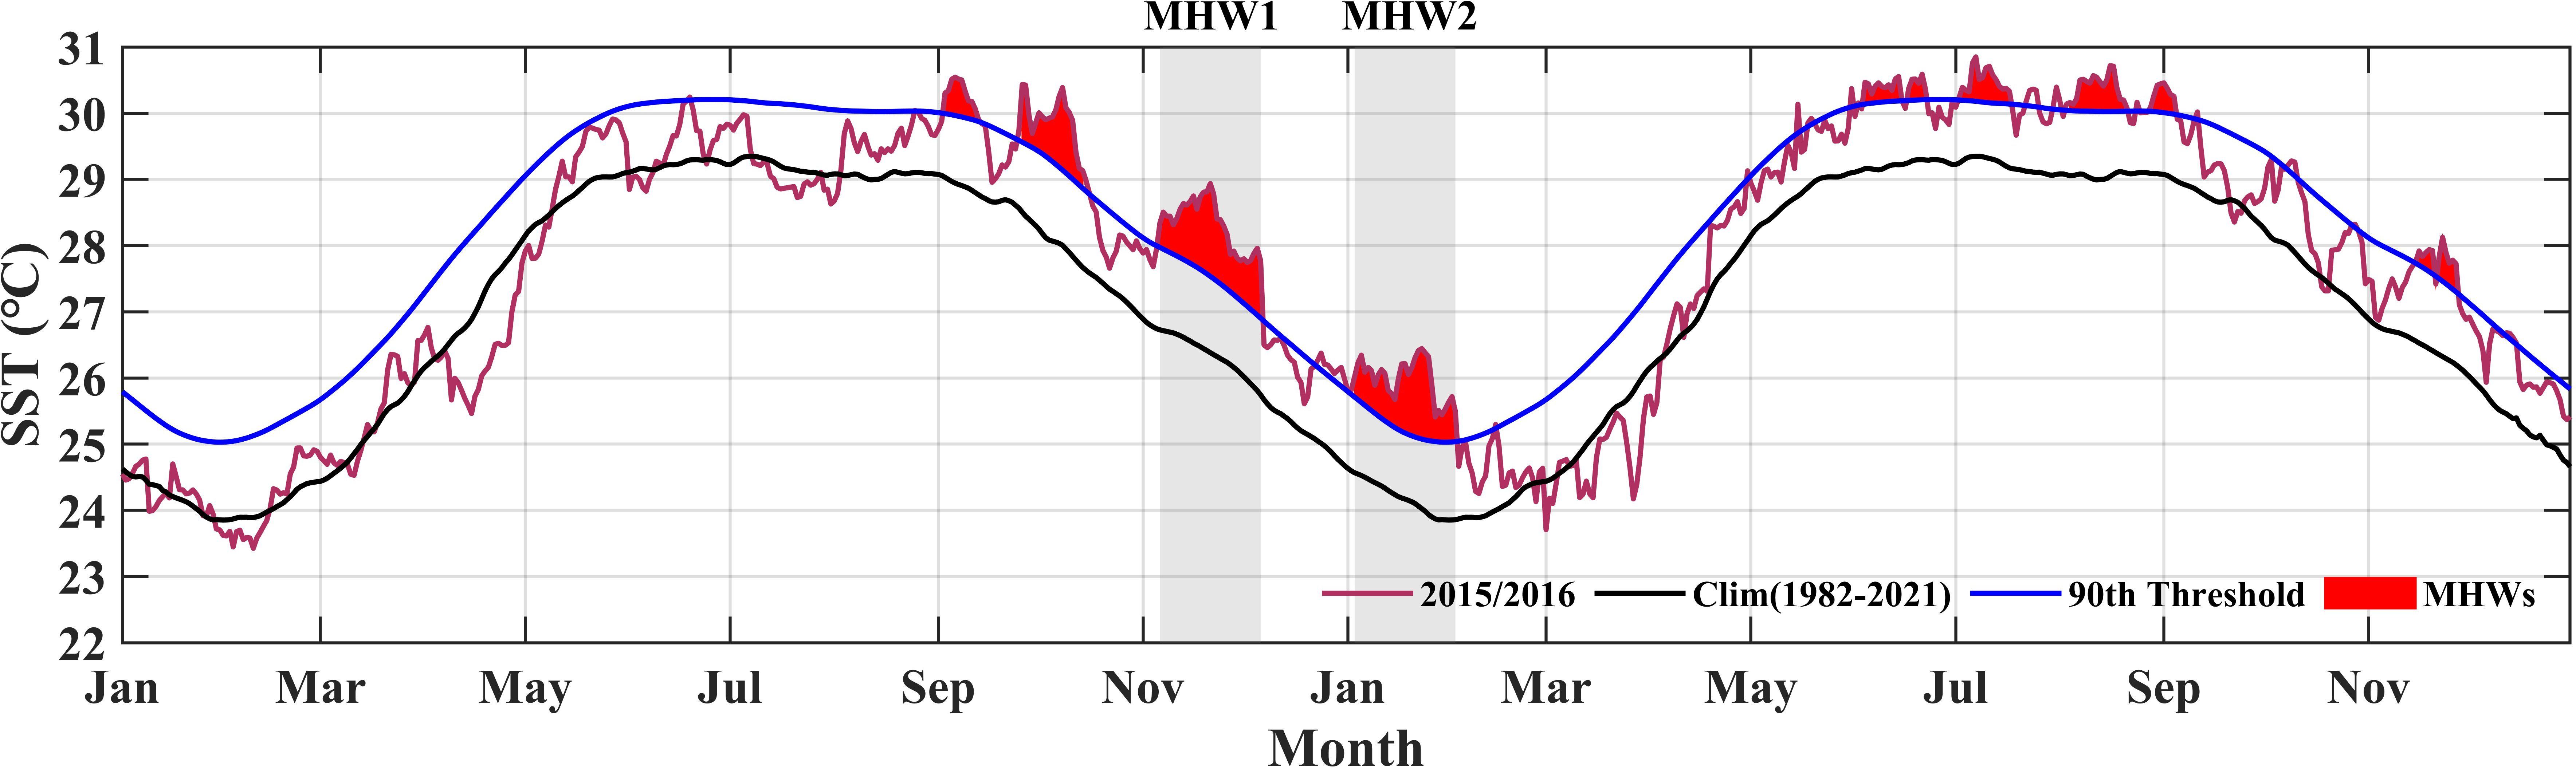
Figure 3. Time series of averaged SST in the blue box region of the NSCS from January 2015 to December 2016. The red, blue, and black lines indicate the SST, the 90th percentile threshold, and the climatological SST, respectively. The red shading indicates the occurrence of MHWs, with the strongest MHW1 and MHW2 being marked in gray bins. SST, sea surface temperature; NSCS, Northern South China Sea; MHWs, marine heatwaves.
4 Driving forces on 2015/2016 winter MHWs
4.1 Direct roles of global warming and El Niño on SSTA
Since 1900, the path of subtropical WBC across all ocean basins has accelerated warming, exceeding the globally averaged rate of surface ocean warming (Wu et al., 2012). Recent studies have indicated that MHWs were expected to occur more frequently in China’s marginal seas and adjacent offshore waters (Yao et al., 2022), particularly in the SCS (Xiao et al., 2019). Our analyses reveal the frequent appearance of MHWs in the SCS accompanying the warming trend. These MHW events were pronounced with no significant changes in duration or maximum intensity even after removing the 40-year long-term warming trend (not shown). For the 2015/2016 events, they were still extreme warming episodes during the study period. Thus, the MHW events were generally independent of and magnified by ocean warming, consistent with the findings of Xiao et al. (2020) on the historical high SST in the autumn of 2015.
In addition to the global SST warming, the dominant climatic modes provide the environmental conditions in favor of the generation of MHW events (Holbrook et al., 2019). For instance, El Niño, as a large-scale ocean mode of climatic variability, has been identified as the most important factor for driving MHWs (Oliver et al., 2018; Holbrook et al., 2019; Liu et al., 2022). Recent studies have highlighted a critical role of ENSO in modulating interannual MHW occurrences in the SCS; 62.3% of the 61 MHWs were associated with El Niño events occurring in 1982/1983, 1987/1988, 1997/1998, 2002/2003, 2006/2007, 2009/2010, 2014/2015, and 2015/2016 and during the period of 1982–2018. Approximately 15 MHW events occurred from August 2014 to November 2016, while two extreme events happened in October 2015–February 2016 (Liu et al., 2022). In our study, the strongest El Niño event of the 21st century was also coincident with the winter MHW event in 2015/2016 (Figures 2, 3). To elucidate the cause of the 2015/2016 winter extreme positive SST, the relationship between SSTAs and El Niño was examined by assessing the impact of the MEI on SST. The analysis reveals that SSTAs across all 56 recorded MHW events in Table 1 had no significant correlation with El Niño, with a low correlation coefficient of 0.21 between the mean intensity and the Niño 3.4 MEI. However, a much stronger relationship (r = 0.59) was observed when focusing specifically on the 14 MHWs that occurred in winter. This suggests that El Niño events may serve as an important large-scale precursor for surface warming associated with MHWs in the SCS. Thus, the MHWs are not fully independent of the MEI, but the MHWs during the winter have a stronger dependence on El Niño events. In contrast, Wang et al. (2022a) did not identify any MHW events during the 2015/2016 winter along the southern boundary of the NSCS continental shelf (111–120°E, 19–23°N). This discrepancy suggests that factors other than El Niño, such as local ocean–atmospheric processes, likely played the dominant role in driving the extreme 2015/2016 winter SSTA.
4.2 Wind anomalies induced SST anomalies
Considering the weak dependence between the presence of winter SCS MHWs and strong El Niño events, the surface wind forcing was further examined for its impact on SST and MHW events in the SCS (Figure 4). The beginning of the winter monsoon is characterized by a sharp increase in wind speed in September, with steady wind direction from the northeast (Liu and Xie, 1999). It can be seen that during a normal winter, an active northeast monsoon wind field develops. It is strongest roughly along the coast from the Luzon Strait to the southwest coast of Vietnam, reaching maximal strength at 8–10 m·s−1 (Figures 4a, b). The winter monsoon was weakened due to the weakened EAM at El Niño events (Chao et al., 1996; Zhao and Zhu, 2016; Zu et al., 2018), as it was observed that negative wind speed anomalies approximately −1 to −2 m·s−1 over the northwest and central SCS were less with respect to the climatological average (Figures 4c, d). The weakened winter northeasterly wind played double roles in warming the seawater: first, the weakened wind speed reduced the advection of cold, dry air into the SCS, thereby limiting sea surface cooling through air–heat exchange; second, the weakened wind speed resulted in a reduction of the southwestward coastal current along the southeastern continental shelf of China, which in turn brings little cold water from the East China Sea and Taiwan Strait into the SCS (Fang et al., 2006; Wang et al., 2006). Similarly, negative wind speed anomalies over the study area contributed to the warming over this region during the 2015/2016 winter (Zhao and Zhu, 2016; Wang et al., 2019). To further elucidate the impact of wind anomalies on the genesis of MHWs, the temporal evolution of wind speed anomalies (Winda) and SSTAs in the 2015/2016 winter within the blue box was analyzed (Figure 5). For the MHW1 period, the wind anomalies were always negative with the averaged value approximately −1.3 m s−1 and the maximum anomaly (−3.2 m s−1) on 15 November 2015. The maximum intensity of MHW1 occurred 5 days after the maximum anomaly of wind speed (20 November 2015), which was 2.57°C (Table 1). However, pronounced large negative anomalies in wind speed below −1 m s−1 were observed in the earlier part of the MHW1 period from 9 November 2015 to 21 November 2015. Thus, we conclude that decreased wind speed significantly contributes to the formation of MHW1. For the MHW2 period, the averaged wind anomalies were essentially close to zero (−0.05 m s−1), with the maximum anomaly (−2.19 m s−1) on 20 January 2016, following the maximum intensity of MHW2 at approximately 2.41°C on 23 January 2016 (Table 1). There were only discontinuous 10 days with wind anomalies below −1 m s−1 (3 January 2016 to 20 January 2016) in the earlier part of the MHW2 period, accompanied by significant positive values during the latter part of the MHW2 period. This indicates that the impact of wind anomalies during MHW2 is minimal.
Figure 4. Distribution of the composite climatological wind vectors (white arrows; m·s−1) and wind speed (shading; m·s−1). At 10 m above the sea surface during the period of MHW1 (a) and MHW2 (b) events. Distribution of the composite wind vectors anomalies (orange arrows; m·s−1) and wind speed anomalies (shading; m·s−1) during MHW1 (c) and MHW2 (d) events. Gray lines and gray dashed lines are respectively the positive and negative contours of the wind stress curl (N·m−3). MHW, marine heatwave.
Figure 5. The time series of wind anomalies (a) and SSTA (b) for 4 November 2015–8 February 2016. The gray bars in (a) and (b) highlight the period for MHW1 and MHW2 events. The blue lines in (a) denote the period affected by wind. The dark circles represent respective maximum wind anomalies (a) and maximum SSTA (b). SSTA, sea surface temperature anomaly; MHW, marine heatwave.
Previous studies (Fang et al., 2006; Liu and Xie, 1999) have reported that the winter wind field yields an anticyclonic wind stress curl over the northwest SCS and a cyclonic wind stress curl over the southeast SCS, with the former weaker than the latter. Climatological wind stress curl was negative wind stress curl prevailing along the Chinese southwest coast and a positive value in the deep regions of the SCS from November to January (Figures 4a, b). In the case of the 2015/2016 El Niño winter, the SCS was influenced by the intermittent positive wind stress curl anomaly, where strong positive wind stress curl occupied most of the region except for the far northern SCS (Figures 4c, d). Considering that the northeasterly winter monsoon of the SCS is weakened, a negative wind stress curl anomaly is imposed to weaken the positive wind stress curl during the El Niño winter. In addition, this strong wind stress curl could inject energy into the complex response of SCS circulation (Zhao and Zhu, 2016). Since this was observed during the MHW1, not the MHW2 period, we conclude that wind stress curl did not amplify or increase the persistence of the positive SSTAs in MHW2. Next, we will consider whether other factors influence the occurrence of MHW2.
4.3 Upper ocean circulation and mesoscale eddies
The EAM and Kuroshio intrusion are important drivers for the formation, maintenance, and seasonal variation of the SCS upper-layer circulation (Chen and Xue, 2014; Gan et al., 2006). The climatological surface geostrophic currents for MHW1 (Figure 6c) and MHW2 (Figure 6d) showed the general evolution of the SCS winter circulation in response to the winter monsoon during 1993−2021. In normal years, a cyclonic gyre occupies the whole basin, or adjoining northern and southern cyclonic gyres (Qu, 2001). The spatial distribution of SSH demonstrated large amplitude oscillations centered at 8°N, 118°E in the eastern SCS during the MHW2 event (Figure 6d). The spatial distribution of SSH during the MHW1 event had the same characteristics as that of MHW2 but a few amplitude oscillations (Figure 6c). On the western shelves, SSH oscillations are out of phase with the deep water variations. SSH gradients southeast of Vietnam indicated the presence of strong WBC, which flowed approximately along the 200-m isobath from southeast Hainan Island to southeast Vietnam in the winter (Figures 6c, d). The cyclonic gyre continued to develop from November to February of next year. In the 2015/2016 winter, the SCS was continuously affected by a strong negative wind stress curl anomaly (Figures 4c, d), which reached its peak on 14 December 2015 (Zhao and Zhu, 2016). A strong negative wind stress curl dominated the SCS, reduced the local wind stress curl in the NSCS, and weakened the SCS cyclonic gyre, thus leading to a weaker SCS WBC in this case (Figures 6a, b). Low SSH (<90 cm) was mainly located in the west of Luzon (not shown) during both the MHW1 and MHW2 events, but on a small scale, with small oscillations for MHW1. The weakening of the wind velocity shear in the meridional direction is associated with a decrease in the negative vorticity input in the northeastern SCS. In addition, a decrease in the wind stress curl would lead to a decrease in meridional velocity transport according to the Sverdrup relation, thus leading to a weakened SCS WBC (Zu et al., 2018). Thus, upper ocean circulation in the blue box has been greatly weakened than during normal years.
Figure 6. Composites of sea surface height (SSH) and surface geostrophic currents (black arrows) during MHW1 (a) and MHW2 (b), the climatological SSH and geostrophic velocities (black arrows) during MHW1 (c) and MHW2 (d), and the sea surface height anomaly (SSHA) and surface absolute geostrophic currents (green arrows) during MHW1 (e) and MHW2 (f) events. MHW, marine heatwave.
In addition to the advection by WBC, eddies could affect the mean circulation in the SCS. Their interactions with the mean flow would either increase or dissipate the mechanical energy of the mean circulation. The Rossby waves can enter the SCS through the Luzon Strait as non-linear Rossby waves or eddies that resonate with the intrinsic oscillation mode of the SCS basin and then propagate westward or southwestward in the SCS (Fang et al., 2006; Zhao and Zhu, 2016; Zu et al., 2018; Wang et al., 2019). Figures 6e, f show the SCS SSHA distribution, superimposed on the satellite-derived surface absolute geostrophic currents during the MHW1 and MHW2 events. The SSHA pattern shows a large low-SSHA region oriented northeast–southwest in the northeastern SCS that forms cyclonic gyres. A decrease in northeasterly wind magnitude with reduced surface absolute geostrophic current would lead to a decrease in energy input into the upper ocean from wind work, thus further weakening the basin-scale cyclonic circulation in the SCS, which is also shown by Zu et al. (2018). During MHW1, a large area of significant SSHA (>25 cm) developed in the western SCS, coinciding with a substantially weakened cyclonic gyre. In contrast, the SSHA during MHW2 was markedly lower (~15 cm) in the same region and was associated with only a small anticyclonic gyre southwest of station M. These patterns indicate that eddy activities in the NSCS WBC region were notably weak throughout the 2015/2016 winter. In addition, the high SSHA tongue extended from the central Vietnam coast toward the northeast, carrying high mean temperature water from the south, which especially leads to the strong positive upper layer temperature anomalies in the blue box during the MHW1 event.
4.4 Ocean mixed-layer heat budget during the 2015/2016 winter
The atmospheric process (represented in the net heat flux term) and oceanic process (represented in the advection and entrainment terms) contributions were further quantified by applying the ocean mixed-layer heat budget analysis. Since September 2015, it has shown a significant rise in SSTAs in the blue box region (Figure 3). To reflect the previous SST rise, the mixed-layer heat budgets from September 2015 to February 2016 were taken relative to daily climatology (Figure 7). Positive anomalies in the temperature tendency term indicate a faster-than-climatology warming/slower-than-climatology cooling.
Figure 7. The evolution of all the terms in the MLT equation in the blue box region of the NSCS during the 2015/2016 winter (4 Nov 2015−8 Feb 2016) relative to the daily climatology calculated from the OFES outputs: the temperature tendency term (red line), the surface heat flux term (purple line), the horizontal advection term (black line), and the vertical entrainment term (blue line). The dashed black line represents the sum of the anomalies of the surface heat flux, horizontal advection, and vertical entrainment terms. MLT, mixed-layer temperature; NSCS, Northern South China Sea; OFES, Ocean General Circulation Model for the Earth Simulator.
In the early stage of the MHW1 period (5–22 November 2015), a pronounced positive anomaly in the temperature tendency term was observed, indicating a significant warming anomaly that contributed energy to the development of MHW1. At the same time, the net surface heat flux increased, leading to a positive anomaly in the surface heat flux term and a corresponding rise in SST. Concurrently, surface wind speeds decreased by approximately 3 m·s−1 (Figures 4c, 5a), and a persistent negative anomaly in wind stress magnitude was observed (Figure 4c), which suppressed oceanic turbulent mixing and resulted in a negative MLD anomaly. Furthermore, a robust weakening of the WBC occurred in the region, influenced by the 2015/2016 El Niño event (Figure 7). Both the horizontal advection term and the vertical entrainment term also increased and remained positive until 23 November 2015. The mixed-layer heat budget analysis indicates that net surface heat flux, horizontal advection, and vertical entrainment all played important roles in driving the record-breaking SSTs during MHW1. Notably, the increased net surface heat flux was the dominant contributor, accounting for approximately 42% of the warming. Overall, the extreme SSTs during MHW1 were primarily attributable to weakened northeasterly winds and enhanced solar radiation at the sea surface. In addition, reduced wind speeds led to a decrease in latent heat release from the ocean to the atmosphere, thereby increasing the net downward heat flux and enhancing ocean stratification. Both the weakened winds and strengthened stratification suppressed turbulent mixing, trapping more heat within a shallower mixed layer and resulting in a pronounced positive SSTA.
The extreme MHW2 event was triggered by multiple intermittent anomalies in the atmospheric and oceanic environment. Three distinct periods of positive temperature tendency term were identified: 4–7 January, 15–22 January, and 27–31 January 2016. The anomalous warming during these phases initiated and sustained the MHW2 event. In contrast, the anomalies in horizontal advection and vertical entrainment were generally negligible throughout most of the event. This indicates that the vertical entrainment term played a role mainly at the beginning of MHW2, while horizontal advection became influential toward its end. Furthermore, no robust anomalies in wind speed or wind stress curl were observed at the onset of the MHW2 event (Figures 4d, 5a). The positive anomaly of the MLT tendency term was mainly induced by the anomalies of the surface heat flux term, meaning that the record‐breaking SST was mainly driven by one‐dimensional vertical processes under the control of atmospheric forcing.
4.5 The in situ horizontal current velocity anomalies
To further study the difference in upper ocean currents between the 2015/2016 El Niño winter and 2016/2017 natural winter, the time series of observed difference in SST (δSST) in blue box and difference in horizontal current velocity profiles (δvelocity) at M station from 4 November 2015 to 8 February 2016 (4 November 2016 to 8 February 2017) are shown in Figure 8. The δ indicates the difference value, which is obtained by subtracting that of the 2015/2016 winter from that of the 2016/2017 winter. Since the domain was largely influenced by the 2015/2016 El Niño, δSST had mostly positive values (Figure 8a). However, domain-averaged δSST during MHW1 (0.96°C) was much stronger than that during MHW2 (0.68°C) with almost the same duration.
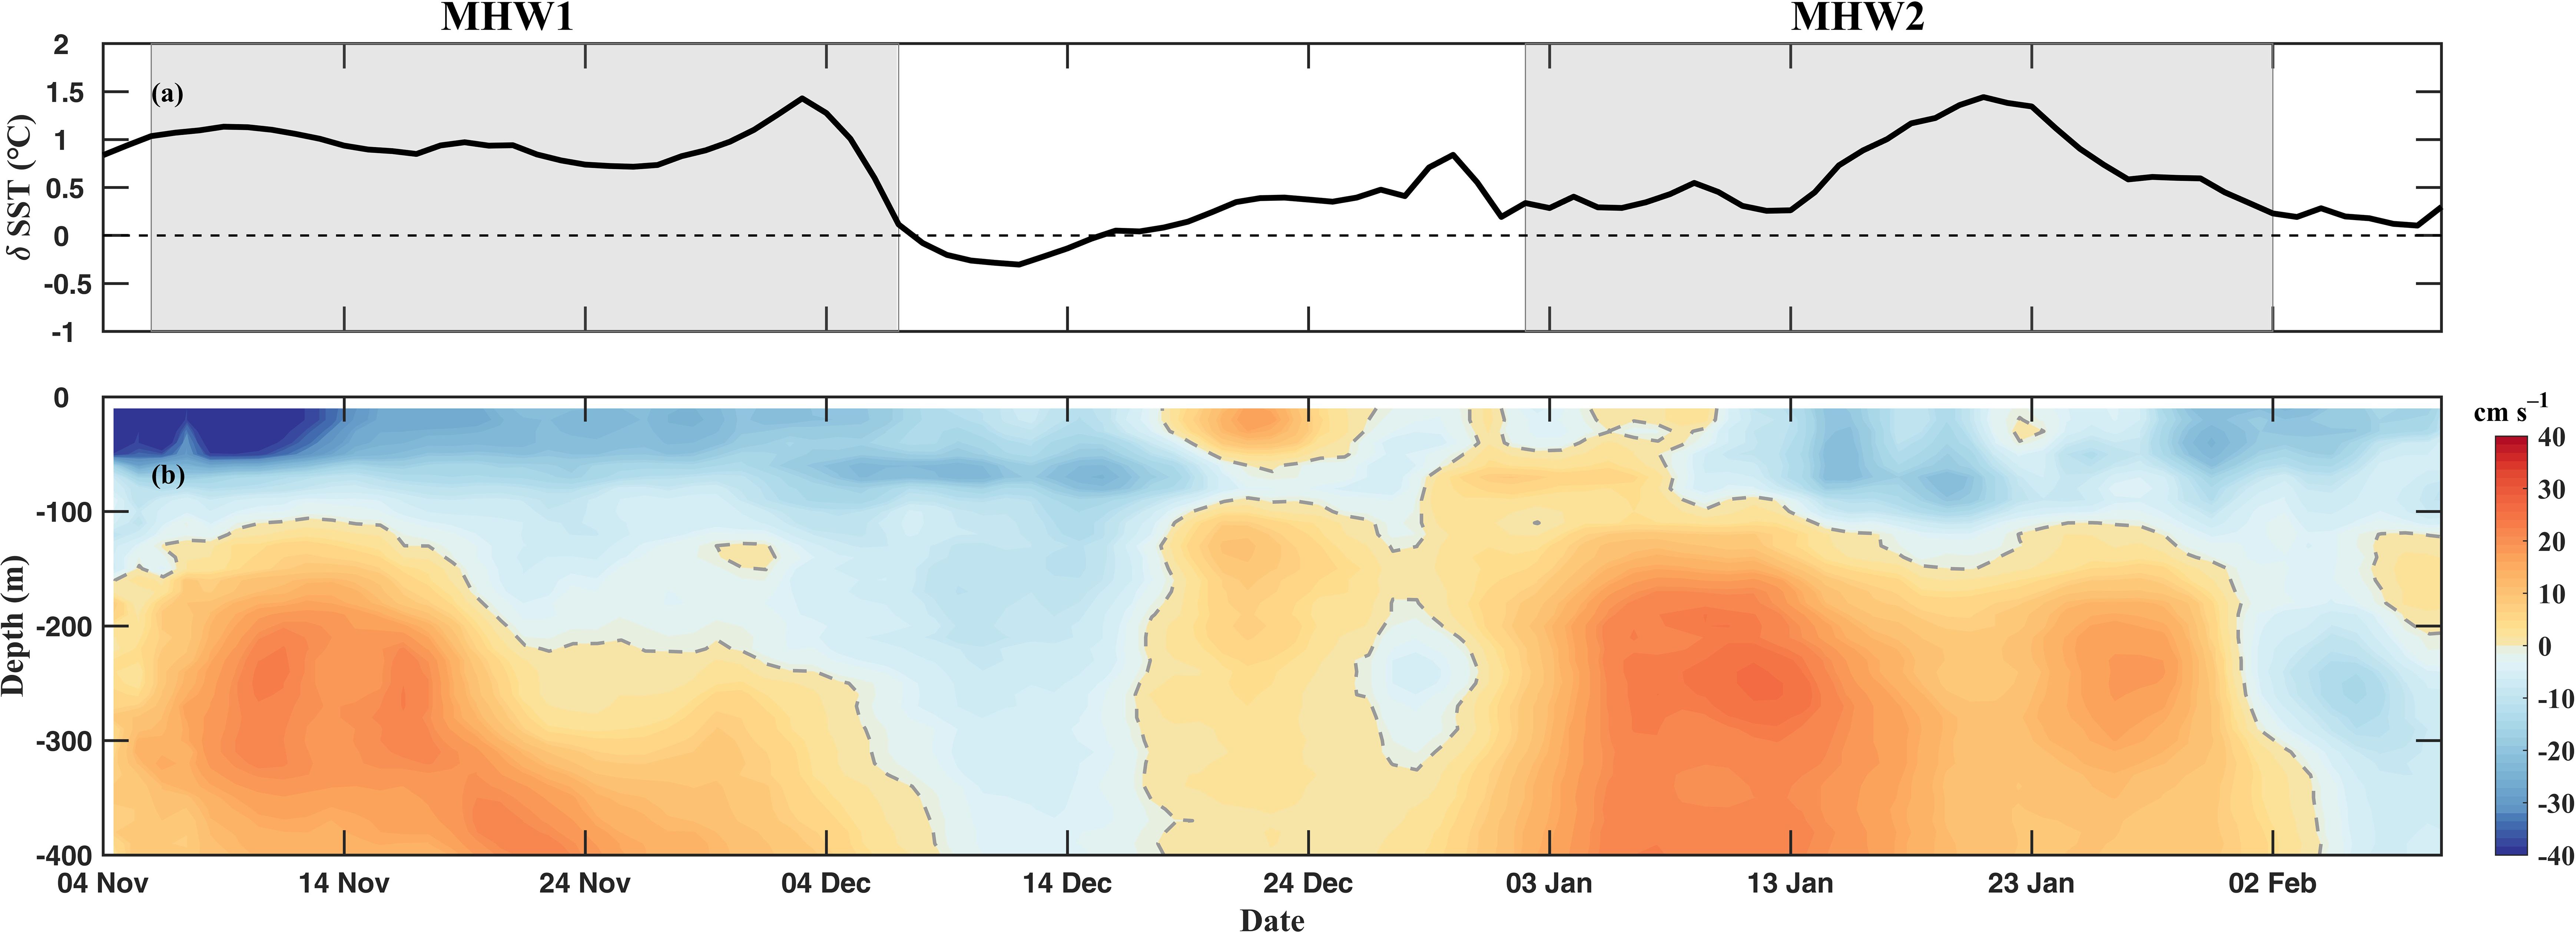
Figure 8. The time series of δSST (a) and δvelocity profiles (b) for 4 November 2015 (2016)–8 February 2016 (2017). The gray bars in (a) highlight the period for MHW1 and MHW2 events. The gray dashed line in (b) represents zero. MHW, marine heatwave.
The current showed obvious seasonal variability. In most years, the current above 450 m around this region flows southwestward from November to April with maximum westward and southward velocities of more than 60 cm·s−1 as seen in in situ mooring data (Shu et al., 2016). The southwestward current in winter was generally larger than the northeastward current in summer, while the direction of the current from May to June and in October was more variable. These features represent the typically seasonal variability of SCS WBC, which is a response to the seasonally reversed wind fields (Wu et al., 1998; Wu and Chang, 2005). Similarly, both the ADCP observed zonal and meridional velocities above 400 m indicated a southwestward direction (not shown) during the winter from October to February in the 2 years (2015–2017). After we computed the δvelocity (Figure 8b), we found that the observed WBC exhibited an obvious year-to-year variability. We observed a maximum velocity of 59.2 cm·s−1 on 1 December 2016, while only 39.7 cm·s−1 on 2 December 2015. In particular, the 2015/2016 winter velocity appeared significantly smaller in comparison with the value of the 2016/2017 winter. A clearly abnormal velocity appeared during MHW1, as δvelocity reached lower than −40 cm·s−1 above 50-m depth from 4 November to 13 November 2015. In the profile, the velocity anomaly can reach a depth of 350 m during MHW1 and MHW2. The observed drastic weakening of winter velocities during 2015/2016 can be primarily attributed to the extreme El Niño event of that year, followed by natural variability in 2016/2017, as documented by Wang et al. (2019) and Zhao and Zhu (2016). Notably, MHW1 exhibited a more substantially reduced current speed and a stronger positive SSTA than MHW2. This suggests that the weakened circulation played a central role in driving the pronounced SSTA during these events.
4.6 The deciding factors for record-breaking 2015/2016 winter MHW
We further investigated several key factors that may regulate winter MHW in the WBC region of the SCS, including wind speed, wind stress curl, currents, and surface geostrophic currents. These dynamical connections are reflected in the spatial distributions of differences in the SST difference (δSST), the wind speed difference (δWind speed), and wind stress curl difference (δWind stress curl) over the blue box region (Figures 9a, b). A close relationship exists between δSST and δWind speed and between δSST and δWind stress curl only during MHW1, with correlation coefficients of 0.52 and 0.45, respectively. It was found that the two kinds of relationship mentioned above during MHW2 were relatively weak (both correlation coefficients of 0.20) in response to an insignificant reduction in wind speed during MHW2, as shown in Figure 5a. These correlations reveal that MHW1, occurring during the peak of the El Niño, was driven largely by persistently weak winds and negative wind stress curl, whereas MHW2, which took place during the decaying phase of the event, exhibited a less clear atmospheric influence. It is worth noting that more close relationships exist between δSST and δcurrent speed during both MHW1 and MHW2 (Figures 9c, d). Correlation coefficients were −0.47 and −0.55 for MHW1 and MHW2, respectively (both at p < 0.01). The correlations of δSST and δgeostrophic velocities were also significant at this level, with correlation coefficients of −0.45 and −0.59 for the two events. These findings illustrate that the MHW1 was closely tied to the entire winter monsoon circulation, upper ocean currents, and surface geostrophic currents. Although MHW2 did not correlate significantly with the winter monsoon circulation, it still exhibited a strong relationship with geostrophic and upper-ocean currents, implying that its development may have been influenced more directly by oceanic processes rather than atmospheric forcing. Thus, SCS WBC and eddies can be considered as independent factors that modulate the SCS SSTA, as it is correlated with the El Niño episode (Zhao and Zhu, 2016; Zu et al., 2018). El Niño events always weaken the SCS WBC through the anticyclonic wind anomaly (Figures 4c, d), especially in the winter of 2015/2016, when there was an extremely anticyclonic wind anomaly and a negative SCS WBC anomaly (Zu et al., 2018).
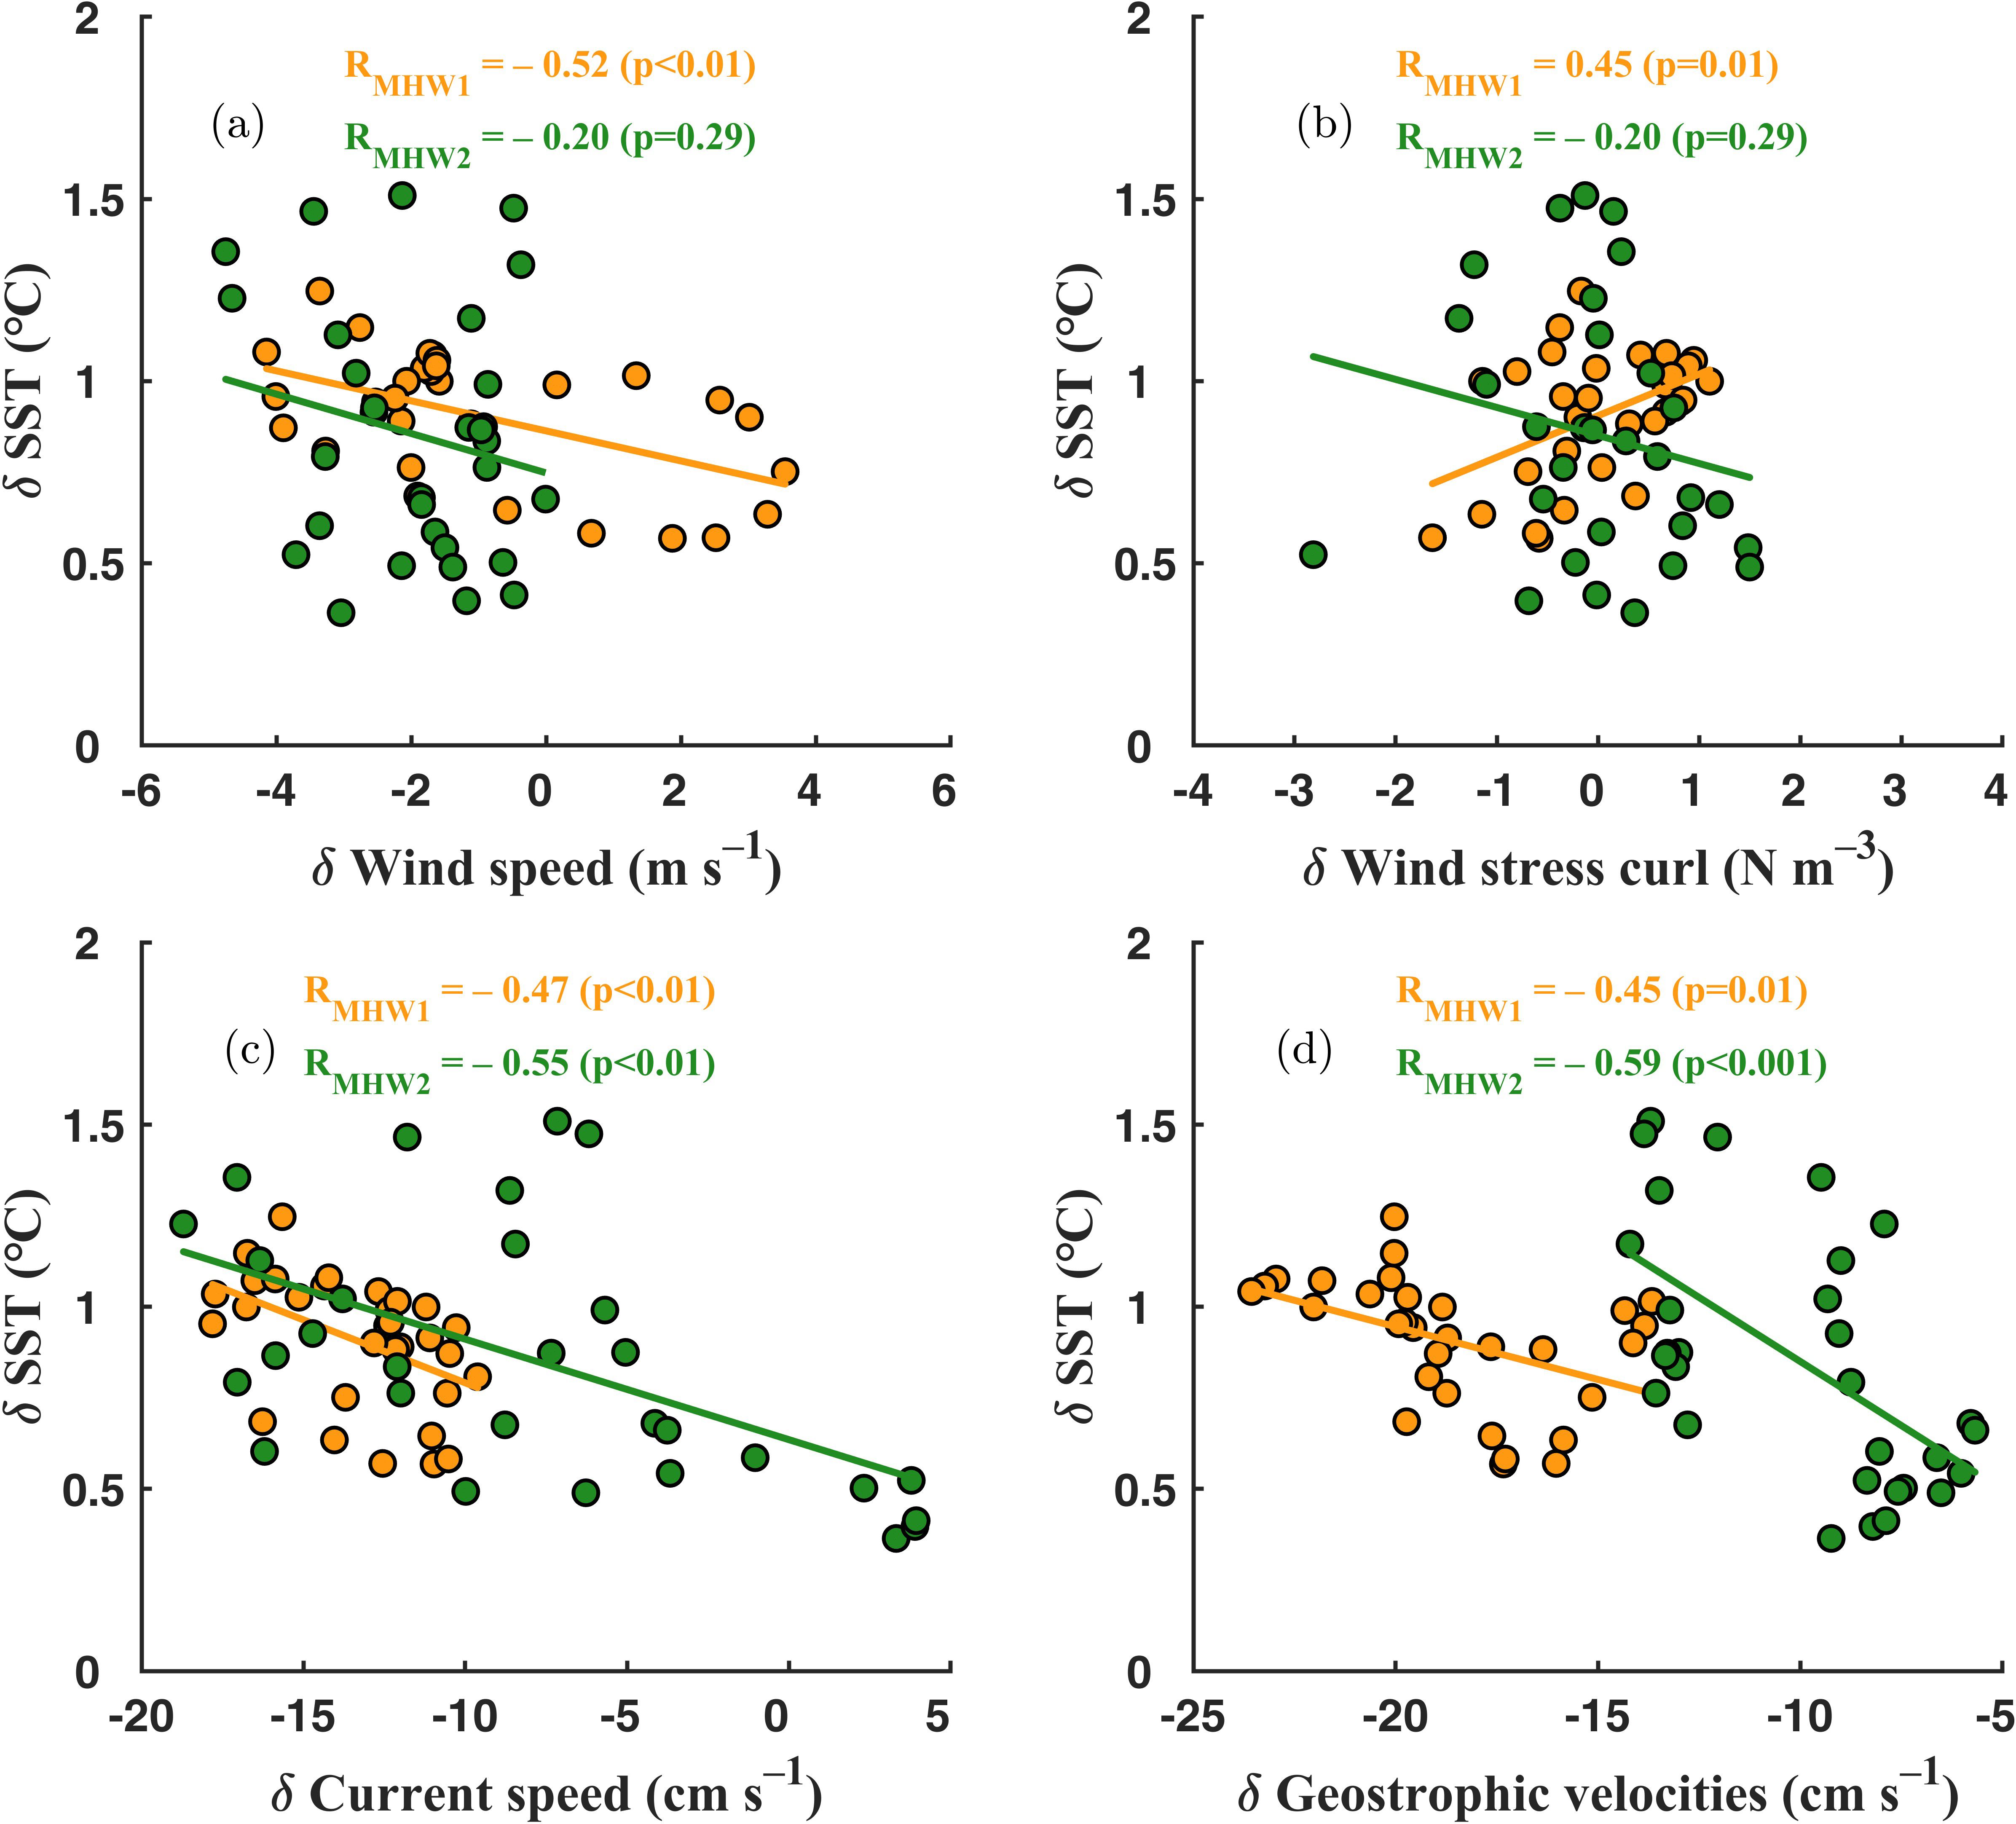
Figure 9. Relationships between δSST and δWind speed (a), between δSST and δWind curl (b), between δSST and δcurrent speed (c), and between δSST and δgeostrophic velocities (d) of the blue box in Figure 1. The orange dots (lines) and green dots (lines) in this figure represent the mean value in the domain during MHW1 and MHW2 periods, respectively. MHW, marine heatwave.
5 Conclusion and discussion
Several sustained MHW events were initially observed in the autumn of 2015 and persisted into the winter of 2015/2016 across a wide area of the SCS WBC region. Among them, two record-breaking winter MHWs occurred: the first winter MHW developed rapidly in early November 2015 and exhibited the strongest intensity. Their characteristics and physical mechanisms were studied using remote sensing products, mooring observations, a mixed-layer heat budget analysis, and a quantitative analysis. Historically, statistical analysis showed that the NSCS experienced a total of 51 MHW events since the end of 1997, and then the MHW frequency, duration, and mean intensity increased starting in 2014 during the 1982–2021 period. MHW characteristics also exhibited pronounced seasonal fluctuations and inter-annual variability. Approximately 38.8% of total events were observed in winter from November to January of the following year, which was higher than that in the other three seasons. There were 4 years (1997/1998 and 2015/2016) during which the MHWs occurred with a large number of winter MHW days, corresponding to El Niño events. Through comparison, the present study discovered that the two extreme 2015/2016 winter MHW events had the longest (~1 month) duration and the most intense cumulative intensity. This unprecedented phenomenon was consistent with the oceanic planetary wave processes associated with El Niño in the tropical Pacific Ocean (Liu et al., 2022). The global ocean temperatures have increased in most regions of the world over the past century, leading to longer and more frequent MHWs (Oliver et al., 2018). In short, the El Niño-induced positive SSTAs provided a favorable background and resulted in the diversity of SCS MHWs. This may be due to other factors driving MHWs than El Niño itself, which also explains the difference between MHWs and El Niño. We further considered other important factors, e.g., teleconnection from strong El Niño and local oceanographic dynamics.
ENSO and its atmospheric or oceanic teleconnections can affect SST, which further modulate the frequency, intensity, and duration of MHWs (Holbrook et al., 2020). When El Niño in the Pacific matures in the boreal winter, the SCS shows anomalous descent motion and weakening of the winter northeast monsoon in response to the anomalous anticyclone in the northwestern Pacific (Wang et al., 2006; Zhao and Zhu, 2016; Zu et al., 2018). These decrease the cloudiness over the SCS that increases the shortwave radiation anomalies and warms the SCS SST (Wang et al., 2006). In the 2015/2016 El Niño events, wind speed decreased in the NSCS but increased in the southeastern SCS, thus leading to an abnormal anticyclonic wind circulation over the SCS (Zu et al., 2018). The anomalous heating occurred east of 160°E, near the equator, although the waters in the Philippine Sea cooled slightly (Zhao and Zhu, 2016). The anomalous low SSTAs induced a large negative wind stress curl anomaly (or anomalous anticyclone) over that region and the SCS in the west. In addition, the basin-wide negative wind stress curl anomaly weakened the SCS cyclonic gyre. The development of the MHW1 could be attributed to the delayed onset of the EAM (Wang et al., 2000) and negative wind stress curl anomalies during November 2015. Indeed, El Niño has also been associated with reduced strength of the northeasterly trade wind field, which, in turn, reduces evaporation, produces a positive SSTA, and triggers positive thermodynamic wind–evaporation–SST feedback. However, the formation of MHW2 cannot be well explained by weakened winter monsoon and negative wind stress curl anomalies.
Meanwhile, the oceanic processes associated with El Niño also contribute to the extreme seawater warming in the NSCS. Positive IOD and El Niño-induced air–sea anomalies contribute to the higher frequency and longer duration of MHWs in the SCS. Furthermore, an early anomalous anticyclone establishment induced by an unusual IOD caused prolonged warming over the SCS in August 2015 (Xiao et al., 2020). The non-linear meridional moisture advection, involving the combined impact of a regional SST gradient over the northwest Pacific and large-scale El Niño-induced moisture anomalies, significantly modulates the El Niño rainfall teleconnection in the boreal cooler months of 2015 (Wang et al., 2018). MHW1 and MHW2 were observed in the first warming peak of El Niño (September to the following February), which exhibited the strongest maximum intensity during the 2015/2016 El Niño peak and decaying phases. The El Niño caused cooler SSTs in the Philippine Sea and induced an anticyclone anomaly, which propagated westward in the form of Rossby waves and eventually affected the NSCS region. At the same time, the El Niño also caused negative wind stress curl anomalies to prevail in the Philippine Sea and the SCS; thus, the wind stress curl over the SCS was reduced, and a large Luzon Strait intrusion occurred in the winter of 2015/2016 through atmosphere-bridged teleconnection, leading to a weaker SCS cyclonic gyre and SCS WBC (Fang et al., 2006; Zhao and Zhu, 2016; Wang et al., 2019). In addition, we found that MHWs in this region could be modulated by other factors, such as upper ocean circulation and mesoscale eddies. Ocean circulation changes can also precondition the ocean for MHW development over longer timescales and at greater depths. The offshore currents in the region could be driven by remote wind forcing across the Chinese coast, which may have a stronger effect during wintertime. As shown in Figure 8c, the maximum correlation between the difference in current speed and the SST was –0.55 for MHW2. Therefore, we consider that the impact of the strong 2015/2016 El Niño event indeed caused the weakest estimated SCS WBC through atmospheric teleconnection for MHW1 and MHW2. Vertically, the difference in vertical current speed was located at a depth of 400 m (Figure 7b). Notably, the difference in current speed during the MHW1 period was much weaker than that during the MHW2 period, which was associated with an extreme warm eddy in the middle of the SCS. Specifically, the eddy activities during the 2015/2016 winter were weaker than the climatology, and the cyclonic eddy activity in the northeast of the SCS during MHW1 was weaker than that during MHW2 (Figure 6). According to previous research, the eddy activities in the SCS correspond to a locally amplified El Niño (Fang et al., 2006). The impact of eddies can be considered as an independent factor (Zhao and Zhu, 2016). Especially for MHW2, this region was affected by eddies from January 2016 and strengthened from February 2016, when a cyclonic eddy propagating from the east started to interact with the SCS WBC. As a result, when the eddy activity was weak, the impact of the strong El Niño event indeed caused the weakest estimated SCS WBC through atmospheric teleconnection. The heat budget analysis agrees well with the observations above. The extreme SSTs during MHW1 were primarily attributable to weakened northeasterly winds and enhanced solar radiation at the sea surface. In addition, reduced wind speeds led to a decrease in latent heat release from the ocean to the atmosphere, thereby increasing the net downward heat flux and enhancing ocean stratification. Both the weakened winds and strengthened stratification suppressed turbulent mixing, trapping more heat within a shallower mixed layer, resulting in a pronounced warming. However, the vertical entrainment term, horizontal advection term, and anomalous wind speed and wind stress curl only play a role at the beginning MHW2 period. The anomalies of the surface heat flux term mainly contributed to the positive anomaly of the MLT tendency term. As a result, the record-breaking SSTA during the MHW2 period was produced by one-dimensional vertical processes under the control of atmospheric forcing.
While El Niño was significant and its development in this condition was not directly related to the 2015/2016 winter MHWs, the relative geographic location in the present study on the path of the strongest SCS WBC was also important for the development of MHWs. Moreover, the MHW frequency, duration, and mean intensity increased with the global average. However, the frequency and mean intensity in the NSCS region were slightly lower than those in the middle of the SCS.
In summary, the regional climate processes, such as El Niño, were likely to be the foundation of surface warming associated with MHWs over the SCS. Even within winter MHWs in the SCS deep basin related to the 2015/2016 El Niño (Liu et al., 2022), there was the first systematic explanation for winter MHWs in the NSCS WBC region. The coeffect of winds, vertical currents through atmospheric and oceanic teleconnection from El Niño, and local oceanographic dynamics, including upper ocean circulation and mesoscale eddies, were the key modulations of the 2015/2016 extreme winter MHW1 during the peak phase and MHW2 during the decaying phase of El Niño. Our research highlights that this linear effect can explain the driving of different MHWs and also provide better insights into the terms contributing to MHW intensity. For future research, the relative contributions of the diverse factors for MHWs in the SCS WBC region require more local observation and further quantitative assessment.
Data availability statement
The SST dataset is available from NOAA (https://www.ncei.noaa.gov/products/optimum-interpolation-sst), the daily sea surface height anomaly (SSHA) and associated surface geostrophic currents anomalies is available from CMEMS (http://marine.copernicus.eu/services-portfolio/access-to-products/), the surface wind is available from CCMP (http://www.remss.com/measurements/ccmp), the MEI is available from NOAA (https://www.psl.noaa.gov/enso/mei/index.html). Four heat flux components (longwave radiation, shortwave radiation, latent heat flux, and sensible heat flux) are provided by ECMWF (https://cds.climate.copernicus.eu), three-dimensional temperature and currents are available from OFES (http://apdrc.soest.hawaii.edu/las_ofes/v6/dataset?catitem=87).
Author contributions
BX: Writing – original draft. HS: Writing – review & editing, Data curation. TL: Writing – review & editing, Data curation. WJ: Writing – original draft, Formal Analysis. FL: Formal Analysis, Investigation, Writing – original draft. LM: Methodology, Visualization, Writing – review & editing. YW: Writing – review & editing.
Funding
The author(s) declare financial support was received for the research and/or publication of this article. This work is financially supported by the National Key Research and Development Program of China (No. 2023YFC2811800). This work is a joint effort from the UN Decade of Ocean Science for Sustainable Development (2021–2030), endorsed programme Mitigation of Natural Incidence Towards an increased Oceanic Resilience (No. MoNITOR). This work is supported by Zhejiang Provincial Natural Science Foundation of China (No. LR25D060001), and also supported by the "14th Five-Year Plan" Major Scientific and Technological Project of CNOOC, Deep Sea Marine Environment Monitoring and Data Platform Research (No. KJGG2022-0202).
Conflict of interest
Authors BX, HS, and TL were employed by the company CNOOC Research Institute Limited Liability Company.
The remaining authors declare that the research was conducted in the absence of any commercial or financial relationships that could be construed as a potential conflict of interest.
Generative AI statement
The author(s) declare that no Generative AI was used in the creation of this manuscript.
Any alternative text (alt text) provided alongside figures in this article has been generated by Frontiers with the support of artificial intelligence and reasonable efforts have been made to ensure accuracy, including review by the authors wherever possible. If you identify any issues, please contact us.
Publisher’s note
All claims expressed in this article are solely those of the authors and do not necessarily represent those of their affiliated organizations, or those of the publisher, the editors and the reviewers. Any product that may be evaluated in this article, or claim that may be made by its manufacturer, is not guaranteed or endorsed by the publisher.
References
Benthuysen J. A., Oliver E. C. J., Feng M., and Marshall A. G. (2018). Extreme marine warming across tropical Australia during austral summer 2015–2016. J. Geophys. Res. Oceans 123, 1301–1326. doi: 10.1002/2017JC013326
Bond N. A., Cronin M. F., Freeland H., and Mantua N. (2015). Causes and impacts of the 2014 warm anomaly in the NE Pacific. Geophys. Res. Lett. 42, 3414–3420. doi: 10.1002/2015GL063306
Cai R., Tan H., and Kontoyiannis H. (2017). Robust surface warming in offshore China Seas and its relationship to the East Asian Monsoon wind field and ocean forcing on interdecadal time scales. J. Clim. 30, 8987–9005. doi: 10.1175/JCLI-D-16-0016.1
Cao D., Xu K., Huang Q. L., Tam C. Y., Chen S., He Z. Q., et al. (2022). Exceptionally prolonged extreme heat waves over South China in early summer 2020: The role of warming in the tropical Indian Ocean. Atmos. Res. 278, 106335. doi: 10.1016/j.atmosres.2022.106335
Chao S. Y., Shaw P. T., and Wu S. Y. (1996). El Niño modulation of the South China Sea circulation. Prog. Oceanogr. 38, 51–93. doi: 10.1016/S0079-6611(96)00010-9
Chen Z., Shi J., and Li C. (2021a). Two types of warm blobs in the Northeast Pacific and their potential effect on the El Niño. Int. J. Climatol. 41, 2810–2827. doi: 10.1002/joc.6991
Chen Z., Shi J., Liu Q., Chen H., and Li C. (2021b). A persistent and intense marine heatwave in the Northeast Pacific during 2019–2020. Geophys. Res. Lett. 48, e2021GL093239. doi: 10.1029/2021GL093239
Chen G. and Xue H. (2014). Westward intensification in marginal seas. Ocean Dyn. 64, 337–345. doi: 10.1007/s10236-014-0691-z
Chen Y., Zhai F., Li P., Gu Y., and Wu K. (2022). Extreme 2020 summer SSTs in the northern South China Sea: Implications for the Beibu Gulf coral bleaching. J. Clim. 35, 4177–4190. doi: 10.1175/JCLI-D-21-0649.1
Di Lorenzo E. and Mantua N. (2016). Multi-year persistence of the 2014/15 North Pacific marine heatwave. Nat. Clim. Change 6, 1042–1048. doi: 10.1038/nclimate3082
Fang G., Chen H., Wei Z., Wang Y., Wang X., and Li C. (2006). Trends and interannual variability of the South China Sea surface winds, surface height, and surface temperature in the recent decade. J. Geophys. Res. Oceans 111, C11S16. doi: 10.1029/2005JC003276
Feng Y., Bethel B. J., Dong C., Zhao H., Yao Y., and Yu Y. (2022). Marine heatwave events near Weizhou Island, Beibu Gulf in 2020 and their possible relations to coral bleaching. Sci. Total Environ. 823, 153414. doi: 10.1016/j.scitotenv.2022.153414
Frölicher T. L., Fischer E. M., and Gruber N. (2018). Marine heatwaves under global warming. Nature 560, 360–364. doi: 10.1038/s41586-018-0383-9
Gan J., Li H., Curchitser E. N., and Haidvogel D. B. (2006). Modeling South China Sea circulation: Response to seasonal forcing regimes. J. Geophys. Res. Oceans 111, C06034. doi: 10.1029/2005JC003298
Gao G., Marin M., Feng M., Yin B., Yang D., Feng X., et al. (2020). Drivers of marine heatwaves in the East China Sea and the South Yellow Sea in three consecutive summers during 2016–2018. J. Geophys. Res. Oceans 125, e2020JC016518. doi: 10.1029/2020JC016518
Han T., Wang L., Xu K., Wang L., Liu B., Tam C.-Y., et al. (2023). Extremely long-lived marine heatwave in South China Sea during summer 2020: Combined effects of the seasonal and intraseasonal variations. Glob. Planet. Change 230, 104261. doi: 10.1016/j.gloplacha.2023.104261
He W., Zeng X., and Deng C. Z. J. (2023). Enhanced impact of prolonged MHWs on satellite-observed chlorophyll in the South China Sea. Prog. Oceanogr. 218, 103123. doi: 10.1016/j.pocean.2023.103123
Hobday A. J., Alexander L. V., Perkins S. E., Smale D. A., Straub S. C., Oliver E. C., et al. (2016). A hierarchical approach to defining marine heatwaves. Prog. Oceanogr. 141, 227–238. doi: 10.1016/j.pocean.2015.12.014
Holbrook N. J., Scannell H. A., Gupta A. S., Benthuysen J. A., Feng M., Oliver E. C. J., et al. (2019). A global assessment of marine heatwaves and their drivers. Nat. Commun. 10, 2624. doi: 10.1038/s41467-019-10206-z
Holbrook N. J., Sen Gupta A., Oliver E. C. J., Hobday A. J., Benthuysen J. A., Scannell H. A., et al. (2020). Keeping pace with marine heatwaves. Nat. Rev. Earth Environ. 1, 482–493. doi: 10.1038/s43017-020-0068-4
Klein S. A., Soden B. J., and Lau N. C. (1999). Remote sea surface temperature variations during ENSO: evidence for a tropical atmospheric bridge. J. Clim. 12, 917–932. doi: 10.1175/1520-0442(1999)012<0917:RSSTVD>2.0.CO;2
Kataoka T., Tozuka T., and Yamagata T. (2017). Generation and decay mechanisms of Ningaloo Niño/Niña. J. Geophys. Res. 122, 8913–8932. doi: 10.1002/2017JC012966
Li Y., Ren G., Wang Q., and You Q. (2019). More extreme marine heatwaves in the China Seas during the global warming hiatus. Environ. Res. Lett. 14, 104010. doi: 10.1088/1748-9326/ab28bc
Li Y., Ren G., You Q., Wang Q., Niu Q., and Mu L. (2022). The 2016 record-breaking marine heatwave in the Yellow Sea and associated atmospheric circulation anomalies. Atmos. Res. 268, 106011. doi: 10.1016/j.atmosres.2021.106011
Liu Q.-Y., Wang D., Wang X., Shu Y., Xie Q., and Chen J. (2014). Thermal variations in the South China Sea associated with eastern and central Pacific El Niño and their mechanisms. J. Geophys. Res. Oceans 119, 8955–8972. doi: 10.1002/2014JC010429
Liu W. T. and Xie X. (1999). Space-based observations of the seasonal changes of South Asian monsoons and oceanic responses. Geophys. Res. Lett. 26, 1473–1476. doi: 10.1029/1999GL900289
Liu K., Xu K., Zhu C., and Liu B. (2022). Diversity of marine heatwaves in the South China Sea regulated by ENSO phase. J. Clim. 35, 877–893. doi: 10.1175/JCLI-D-21-0309.1
Lyu Y., Xiao F., Lu M., Wang D., Wu Q., Wang P., et al. (2024). Increased frequency but decreased intensity of marine heatwaves around coral reef regions in the southern South China Sea. J. Geophys. Res. Oceans 129, e2024JC021235. doi: 10.1029/2024JC021235
Maggiorano A., Feng M., Wang X. H., Ritchie L., Stark C., Colberg F., et al. (2021). Hydrodynamic drivers of the 2013 marine heatwave on the North West Shelf of Australia. J. Geophys. Res. Oceans 126, e2020JC016495. doi: 10.1029/2020JC016495
Marin M., Bindoff N. L., Feng M., and Phillips H. E. (2021). Slower long-term coastal warming drives dampened trends in coastal marine heatwave exposure. J. Geophys. Res. Oceans 126, e2021JC017930. doi: 10.1029/2021JC017930
Meng L., Yan Y., Zhang L., Xing W., Yu Y., and Xing X. (2024). Characteristics and mechanism of winter marine heatwaves in the cold tongue region of the South China Sea. Front. Mar. Sci. 11. doi: 10.3389/fmars.2024.1362805
Mo S., Chen T., Chen Z., Zhang W., and Li S. (2022). Marine heatwaves impair the thermal refugia potential of marginal reefs in the northern South China Sea. Sci. Total Environ. 825, 154100. doi: 10.1016/j.scitotenv.2022.154100
Moisan J. R. and Niiler P. P. (1998). The seasonal heat budget of the North Pacific: net heat flux and heat storage rates, (1950 –1990. J. Phys. Oceanogr. 28, 401–421. doi: 10.1175/1520-0485(1998)028<0401:TSHBOT>2.0.CO;2
Oliver E. C. J., Benthuysen J. A., Bindoff N. L., Hobday A. J., Holbrook N. J., Mundy C. N., et al. (2017). The unprecedented 2015/16 Tasman Sea marine heatwave. Nat. Commun. 8, 16101. doi: 10.1038/ncomms16101
Oliver E. C. J., Donat M. G., Burrows M. T., Moore P. J., Smale D. A., Alexander L. V., et al. (2018). Longer and more frequent marine heatwaves over the past century. Nat. Commun. 9, 1324. doi: 10.1038/s41467-018-03732-9
Qu T. (2001). Role of ocean dynamics in determining the mean seasonal cycle of the South China Sea surface temperature. J. Geophys. Res. 106, 6943–6955. doi: 10.1029/2000JC000479
Santoso A., McPhaden M. J., and Cai W. (2017). The defining characteristics of ENSO extremes and the strong 2015/2016 El Niño. Rev. Geophys. 55, 1079–1129. doi: 10.1002/2017RG000560
Sasaki H., Nonaka M., Masumoto Y., Sasai Y., Uehara H., and Sakuma H. (2008). An eddy-resolving hindcast simulation of the quasi-global ocean from 1950 to 2003 on the Earth Simulator. High Res. Num. Model. Atmos. Ocean. 157–185. doi: 10.1007/978-0-387-49791-4_10
Scannell H. A., Johnson G. C., Thompson L., Lyman J. M., and Riser S. C. (2020). Subsurface evolution and persistence of marine heatwaves in the Northeast Pacific. Geophys. Res. Lett. 47, e2020GL090548. doi: 10.1029/2020GL090548
Schaeffer A. and Roughan M. (2017). Subsurface intensification of marine heatwaves off southeastern Australia: The role of stratification and local winds. Geophys. Res. Lett. 44, 5025–5033. doi: 10.1002/2017GL073714
Shu Y., Xue H., Wang D., Xie Q., Chen J., Li J., et al. (2016). Observed evidence of the anomalous South China Sea western boundary current during the summers of 2010 and 2011. J. Geophys. Res. Oceans 121, 1145–1159. doi: 10.1002/2015JC011434
Smale D. A., Wernberg T., Oliver E. C., Thomsen M., Harvey B. P., Straub S. C., et al. (2019). Marine heatwaves threaten global biodiversity and the provision of ecosystem services. Nat. Clim. Change 9, 306–312. doi: 10.1038/s41558-019-0412-1
Song Q., Yao Y., and Wang C. (2023). Response of future summer marine heatwaves in the South China Sea to enhanced Western Pacific subtropical high. Geophys. Res. Lett. 50, e2023GL103667. doi: 10.1029/2023GL103667
Tan H. J., Cai R. S., and Wu R. G. (2022). Summer marine heatwaves in the South China Sea: Trend, variability and possible causes. Adv. Clim. Change Res. 13, 323–332. doi: 10.1016/j.accre.2022.04.003
Tan W., Wang X., Wang W., Wang C., and Zuo J. (2016). Different responses of sea surface temperature in the South China Sea to various El Niño events during boreal autumn. J. Clim. 29, 1127–1142. doi: 10.1175/JCLI-D-15-0338.1
Thompson B., Tkalich P., and Malanotte-Rizzoli P. (2017). Regime shift of the South China Sea SST in the late 1990s. Clim. Dyn. 48, 1873–1882. doi: 10.1007/s00382-016-3178-4
Tseng Y.-H., Ding R. Q., and Huang X.-M. (2017). The warm Blob in the northeast Pacific–the bridge leading to the 2015/16 El Niño. Environ. Res. Lett. 12, 054019. doi: 10.1088/1748-9326/aa67c3
Wang Q., Cai W., Zeng L., and Wang D. (2018). Nonlinear meridional moisture advection and the ENSO-southern China rainfall teleconnection. Geophys. Res. Lett. 45, 4353–4360. doi: 10.1029/2018GL077446
Wang Q., Li Y., Li Q., Liu Y., and Wang Y. (2019). Changes in means and extreme events of sea surface temperature in the East China Seas based on satellite data from 1982 to 2017. Atmosphere 10, 140. doi: 10.3390/atmos10030140
Wang Q., Wang Y., Sui J., Zhou W., and Li D. (2021). Effects of weak and strong winter currents on the thermal state of the South China Sea. J. Clim. 34, 313–325. doi: 10.1175/JCLI-D-19-0790.1
Wang C., Wang W., Wang D., and Wang Q. (2006). Interannual variability of the South China Sea associated with El Niño. J. Geophys. Res. 111, C03023. doi: 10.1029/2005JC003333
Wang B., Wu R., and Fu X. (2000). Pacific-East Asian teleconnection: How does ENSO affect East Asian climate? J. Clim. 13, 1517–1536. doi: 10.1175/1520-0442(2000)013<1517:PEATHD>2.0.CO;2
Wang Y., Zeng J., Wei Z., Li S., Tian S., Yang F., et al. (2022b). Classifications and characteristics of marine heatwaves in the northern South China Sea. Front. Mar. Sci. 9. doi: 10.3389/fmars.2022.826810
Wang Q., Zhang B., Zeng L., He Y., Wu Z., and Chen J. (2022a). Properties and drivers of marine heat waves in the northern South China Sea. J. Phys. Oceanogr. 52, 917–927. doi: 10.1175/JPO-D-21-0236.1
Wu L. X., Cai W. J., Zhang L. P., Nakamura H., Timmermann A., Joyce T., et al. (2012). Enhanced warming over the global subtropical western boundary currents. Nat. Clim. Change 2, 161–166. doi: 10.1038/NCLIMATE1353
Wu M. C. and Chan J. C. L. (1995). Surface features of winter monsoon surges over South China. Mon. Weather Rev. 123, 662–680. doi: 10.1175/1520-0493(1995)123<0662:SFOWMS>2.0.CO;2
Wu C. R. and Chang C. W. J. (2005). Interannual variability of the South China Sea in a data assimilation model. Geophys. Res. Lett. 32, L17611. doi: 10.1029/2005GL023798
Wu C. R., Shaw P. T., and Chao S. Y. (1998). Seasonal and interannual variations in the velocity field of the South China Sea. J. Oceanogr. 54, 361–372. doi: 10.1007/BF02742620
Xiao F., Wang D., and Leung M. Y. T. (2020). Early and extreme warming in the South China Sea during 2015/2016: Role of an unusual Indian Ocean dipole event. Geophys. Res. Lett. 47, e2020GL089936. doi: 10.1029/2020GL089936
Xiao F., Wang D., Zeng L., Liu Q. Y., and Zhou W. (2019). Contrasting changes in the sea surface temperature and upper ocean heat content in the South China Sea during recent decades. Clim. Dyn. 53, 1597–1612. doi: 10.1007/s00382-019-04697-1
Xiao F., Zeng L., Liu Q. Y., Zhou W., and Wang D. (2018). Extreme subsurface warm events in the South China Sea during 1998/99 and 2006/07: observations and mechanisms. Clim. Dyn. 8, 115–128. doi: 10.1007/s00382-017-3588-y
Yan Y., Chai F., Xue H., and Wang C. (2020). Record-breaking sea surface temperatures in the Yellow and East China Seas. J. Geophys. Res. Oceans 125, e2019JC015883. doi: 10.1029/2019JC015883
Yao Y. and Wang C. (2021). Variations in summer marine heatwaves in the South China Sea. J. Geophys. Res. Oceans 126, e2021JC017792. doi: 10.1029/2021JC017792
Yao Y., Wang C., and Fu Y. (2022). Global marine heatwaves and cold-spells in present climate to future projections. Earth’s Future 10, e2022EF002787. doi: 10.1029/2022EF002787
Yao Y., Wang J., Yin J., and Zou X. (2020). Marine heatwaves in China’s marginal seas and adjacent offshore waters: Past, Present, and Future. J. Geophys. Res. Oceans 125, e2019JC015801. doi: 10.1029/2019JC015801
Yuan T., Zhang J., Yang S., Su Q., Zhao Z., and Ren K. (2024). Vertical structures of marine heatwaves in the South China Sea: Characteristics, drivers and impacts on chlorophyll concentration. J. Geophys. Res. Oceans 129, e2024JC021091. doi: 10.1029/2024JC021091
Zhao Y., Chen M., Chung T. H., Chan L. L., and Qiu J.-W. (2023). The 2022 summer marine heatwaves and coral bleaching in China’s Greater Bay Area. Mar. Environ. Res. 189, 106044. doi: 10.1016/j.marenvres.2023.106044
Zhao R. and Zhu H. X. (2016). Weakest winter South China Sea western boundary current caused by the 2015–2016 El Niño event. J. Geophys. Res. Oceans 121, 1–10. doi: 10.1002/2016JC012252
Keywords: marine heatwave, South China Sea, El Niño, in situ measurement, eddy
Citation: Xie B, Sun H, Liu T, Jin W, Lin F, Meng L and Wang Y (2025) Formation of record-breaking 2015/2016 winter marine heatwave in the northwest South China Sea. Front. Mar. Sci. 12:1671389. doi: 10.3389/fmars.2025.1671389
Received: 23 July 2025; Accepted: 16 October 2025;
Published: 29 October 2025.
Edited by:
Qing Xu, Ocean University of China, ChinaReviewed by:
Yang Ding, Ocean University of China, ChinaJiangbo Jin, Chinese Academy of Sciences (CAS), China
Copyright © 2025 Xie, Sun, Liu, Jin, Lin, Meng and Wang. This is an open-access article distributed under the terms of the Creative Commons Attribution License (CC BY). The use, distribution or reproduction in other forums is permitted, provided the original author(s) and the copyright owner(s) are credited and that the original publication in this journal is cited, in accordance with accepted academic practice. No use, distribution or reproduction is permitted which does not comply with these terms.
*Correspondence: Weifang Jin, amlud2VpZkBzaW8ub3JnLmNu