Abstract
Coastal areas, especially salt marshes, are key regions for ecological stability and coastal protection, but they are increasingly threatened by erosion, sea-level rise, and invasive species. This study focuses on the synergistic effects of engineering measures (soft mattresses) and ecological restoration (native Suaeda salsa) on the coastal geomorphological evolution and ecosystem resilience in the Tiaozini tidal flat of Jiangsu Province, China. Through field measurements (using RTK-GPS, UAV terrain scanning, and vegetation plot sampling) and bio-morphodynamic coupling models, the hydrodynamic processes, sediment transport, vegetation growth, and morphological changes were studied. The results show that soft mattresses altered the flow field, reduced the hydrodynamic force in the sheltered areas, promoted sediment deposition, and transformed the sheltered areas from an erosive environment to a depositional one. The presence of Suaeda salsa enhanced the resilience of the coast by increasing bed roughness, weakening tidal energy, and stabilizing sediments, maintaining a stable sedimentation rate even under strong tidal dynamics. The synergy between soft mattresses and Suaeda salsa significantly improved the restoration efficiency. In the high-tide flat, the cumulative sediment accumulation over four years reached 1.767×10⁴ m3, which is 32.26% higher than the accumulation achieved by relying solely on engineering measures and 82.54% higher than that achieved by relying solely on ecological measures. Additionally, the artificial planting intensity and offshore sediment supply affected the coverage of Suaeda salsa. Moderate planting intensity and adequate sediment supply increased the survival rate and the resilience of the ecosystem. This study clarifies the biophysical feedback between Suaeda salsa and coastal geomorphology, providing a scientific basis for the engineering-ecological integrated strategy for coastal erosion control and ecological restoration.
Introduction
The coastal zone, as a critical area of land-sea interaction, is a core region for population concentration, economic development, and sustainable social progress (Barbier et al., 2011; Costanza et al., 2014). It is also a sensitive area affected by global changes and human activities (He and Silliman, 2019; Kirwan and Megonigal, 2013). Coastal wetlands, particularly salt marshes, hold irreplaceable ecological value in terms of providing primary productivity, maintaining biodiversity, carbon sequestration, and shoreline protection (Gedan et al., 2009; Burden et al., 2013; Duarte et al., 2013; Mudd et al., 2009; Temmerman et al., 2013). Under climate change, the majority of the world’s muddy coasts are eroding at rates exceeding 1 m/yr, and 24% of the world’s sandy beaches are eroding at rates exceeding 0.5 m/yr (Luijendijk et al., 2018; Hulskamp et al., 2023). China’s coastal ecosystems, in particular, are under severe pressure from intense human activities, reduced sediment supply from rivers, and rising sea levels, leading to significant coastal erosion and ecological issues (Li et al., 2022). In the past 50 years, China has lost 53% of its coastal ecosystems, ranking among the eight most severely affected countries globally, posing considerable challenges to its marine environmental security and sustainable development.
Systematic investigations and research on coastal ecological environments and erosion began around the mid-20th century (Masselink et al., 2014; Valiela, 2006). During coastal development, increasing attention has been paid to the health of the coastal ecological environment (Barbier et al., 2011). Coastal erosion prevention measures have shifted from traditional hard-engineering solutions to “Building with Nature” or “Living Shoreline” models that align with environmental and social needs (Pontee, 2013; Gittman et al., 2016). In recent years, advancements in coastal monitoring technologies and the interdisciplinary integration of ecology, environmental science, and morphodynamics have led to significant progress in coastal ecological protection and erosion control (Kirwan et al., 2016; Mudd et al., 2009; Temmerman et al., 2013).
With the increasing global needs for coastal environmental protection and ecosystem restoration, the synergistic development of coastal erosion prevention and ecological restoration has become a frontier and hotspot in the emerging interdisciplinary field of “biogeomorphodynamics” (Fagherazzi et al., 2012). Over the past 30 years, significant efforts have been made to address the scientific question of interactions between coastal morphodynamic processes and biological processes (Bouma et al., 2009; Hu et al., 2014; Van der Wal et al., 2008). Progress has been made in understanding the coupled mechanisms of hydrodynamic-sediment transport-biology in coastal ecosystems and in developing models for qualitative predictions (Fagherazzi et al., 2012; Kirwan et al., 2016; Gu et al., 2025). Furthermore, the protection of degraded coastal ecosystems and the development of living shorelines have become global strategies for sustainable development (Temmerman et al., 2013; McInnes, 2021). Based on this, existing studies have explored the ecological services of various coastal ecosystems, including beaches, salt marshes, and mangroves (Barbier et al., 2011; Ouyang and Guo, 2016). This has led to the proposal of the Nature-based Solutions (NbS) concept, which utilizes the ecological services of coastal ecosystems to provide scientific support for the sustainable use of natural coastlines and the ecological restoration of degraded coastlines (Temmerman et al., 2013; Möller et al., 1999).
Emerging technologies for coastal protection and restoration are increasingly emphasizing the organic integration of soft and hard engineering techniques to achieve both protection and restoration (Gittman et al., 2016; Pontee, 2013). For sandy coasts, the primary hard engineering measures include groins, breakwaters, and seawalls, while soft engineering approaches include beach nourishment, artificial sandbars, sediment bypassing, and the “Sand Engine” concept proposed by Dutch researchers (Luijendijk et al., 2017; Paxton et al., 2020; Van Westen et al., 2024). For muddy coasts with higher vegetation coverage, different protection and restoration theories and techniques have been proposed based on specific vegetation habitats, such as salt marsh vegetation restoration based on the “Window of opportunity” theory, tidal flat hydrological connectivity and microtopography modification, and invasive species control and removal (Balke et al., 2011; Wang et al., 2018; Min et al., 2025). These approaches have preliminarily achieved the protection and restoration of typical muddy coastal eco-geomorphic systems (Turner and McClenachan, 2018).
However, although preliminary research on the integration of coastal geomorphic systems and ecosystems has been conducted, the biophysical feedback mechanisms in the multi-scale coupled evolution of coastal geomorphology and ecosystems remain unclear (Fagherazzi et al., 2012; Williams et al., 2002). It is urgently necessary to establish quantitative relationships among the processes of hydrodynamics, sediment transport, geomorphology, and ecology, as well as to develop more reliable numerical models for the bio-geomorphic evolution of degraded coasts (Kirwan et al., 2016; Geng et al., 2021; Gu et al., 2025). This will help unravel the mechanisms of coastal geomorphic and ecosystem evolution and ecological restoration (Fagherazzi et al., 2012; Hu et al., 2014; Zhou et al., 2022).
Currently, the integration of engineering measures (i.e., for coastal erosion control) with ecological measures (i.e., for ecological protection and restoration) is one of the main challenges for China’s marine ecological civilization strategy (Li et al., 2022). On one hand, the rapid spread of invasive species such as Spartina alterniflora (hereafter S. alterniflora) has caused ecological damage to native ecosystems and significantly altered the ecosystem services of coastal wetlands (Chung, 2006; Liu et al., 2018). On the other hand, with the nationwide implementation of S. alterniflora removal policies, how to restore and rebuild native species communities while meeting the need for sediment retention and shoreline stabilization has become a focus for governments and academia at all levels (Li et al., 2024; Min et al., 2025; Pan et al., 2025).
In 1979, S. alterniflora was introduced to China for shoreline protection (An et al., 2007; Liu et al., 2018). However, S. alterniflora’s strong ecological adaptability and dispersal capability often give it a competitive advantage over native species (Lewis and Weber, 2002; Chen et al., 2004), thereby severely impacting native biodiversity and ecosystem services (Daehler and Strong, 1994; Schwarz et al., 2015; Liu et al., 2020). China’s native coastal salt marsh species include Phragmites australis, Suaeda salsa (hereafter S. salsa), and Scirpus mariqueter (Wang et al., 2022; Xue et al., 2024). Among these, S. salsa, an annual halophyte with high tolerance to salinity, flooding, and drought, serves as a pioneer in salt marsh succession and is widely regarded as an indicator species for ecosystem restoration following S. alterniflora removal (He et al., 2011; Zhang et al., 2023; Shu et al., 2024). Current studies on S. salsa focus on its physiological traits, growth dynamics, spatial distribution, and its influence on hydrodynamics and sediment processes, though its integration into vegetation-morphodynamic coupling models remains limited (Möller et al., 1999; Fagherazzi et al., 2012; Rupprecht et al., 2017).
Against such environmental contexts and policy directives, integrating soft engineering measures and ecological restoration has become imperative for effective coastal erosion control. However, existing research lacks in-depth exploration of their combined effects on muddy coasts, particularly regarding how native species interact with soft structures (Kindeberg et al., 2023; Perricone et al., 2023). This study addresses this gap by focusing on the synergies between soft mattresses and native S. salsa in muddy coastal protection. It examines three key aspects: (1) the extent to which individual measures mitigate erosion; (2) the underlying mechanisms driving the synergy between soft engineering and ecological restoration; and (3) how environmental and artificial factors, such as sediment supply and planting intensity, modulate this collaborative effect.
Method
Study area and indicator species
S. salsa is widely distributed in coastal wetlands such as the northern Jiangsu coast, the Yellow River Estuary, and the Liaohe River Estuary, serving as an indicator species for silty-muddy coasts. Through field surveys of the study area in Jiangsu silty-muddy coasts, the natural S. salsa growth zone in the Tiaozini tidal flat (32°36’N–32°57’N, 120°54’E–120°58’E; Figure 1A) of Jianggang City, Jiangsu Province, was selected as the observational site. The Tiaozini tidal flat is a wide coastal plain formed by continuous acrrection, featuring a flat and broad terrain with an average slope of 0.03% and widely-distributed tidal channels. To prevent the threat of tidal channel migration to coastal stability, some spur dikes made by soft mattresses have been implemented for beach consolidation. In recent years, due to ecological restoration efforts in the Tiaozini reclamation area and effective control of the invasive plant S. alterniflora, S. salsa has become the dominant vegetation community in this region, primarily distributed near the soft mattresses at southeast of the seawall. The density of S. salsa is highest in between the soft mattresses and decreases outward until bare flats appear. This makes the area an ideal site for simulating and validating bio-morphodynamic evolution under the co-influence of S. salsa and soft mattresses.
Figure 1
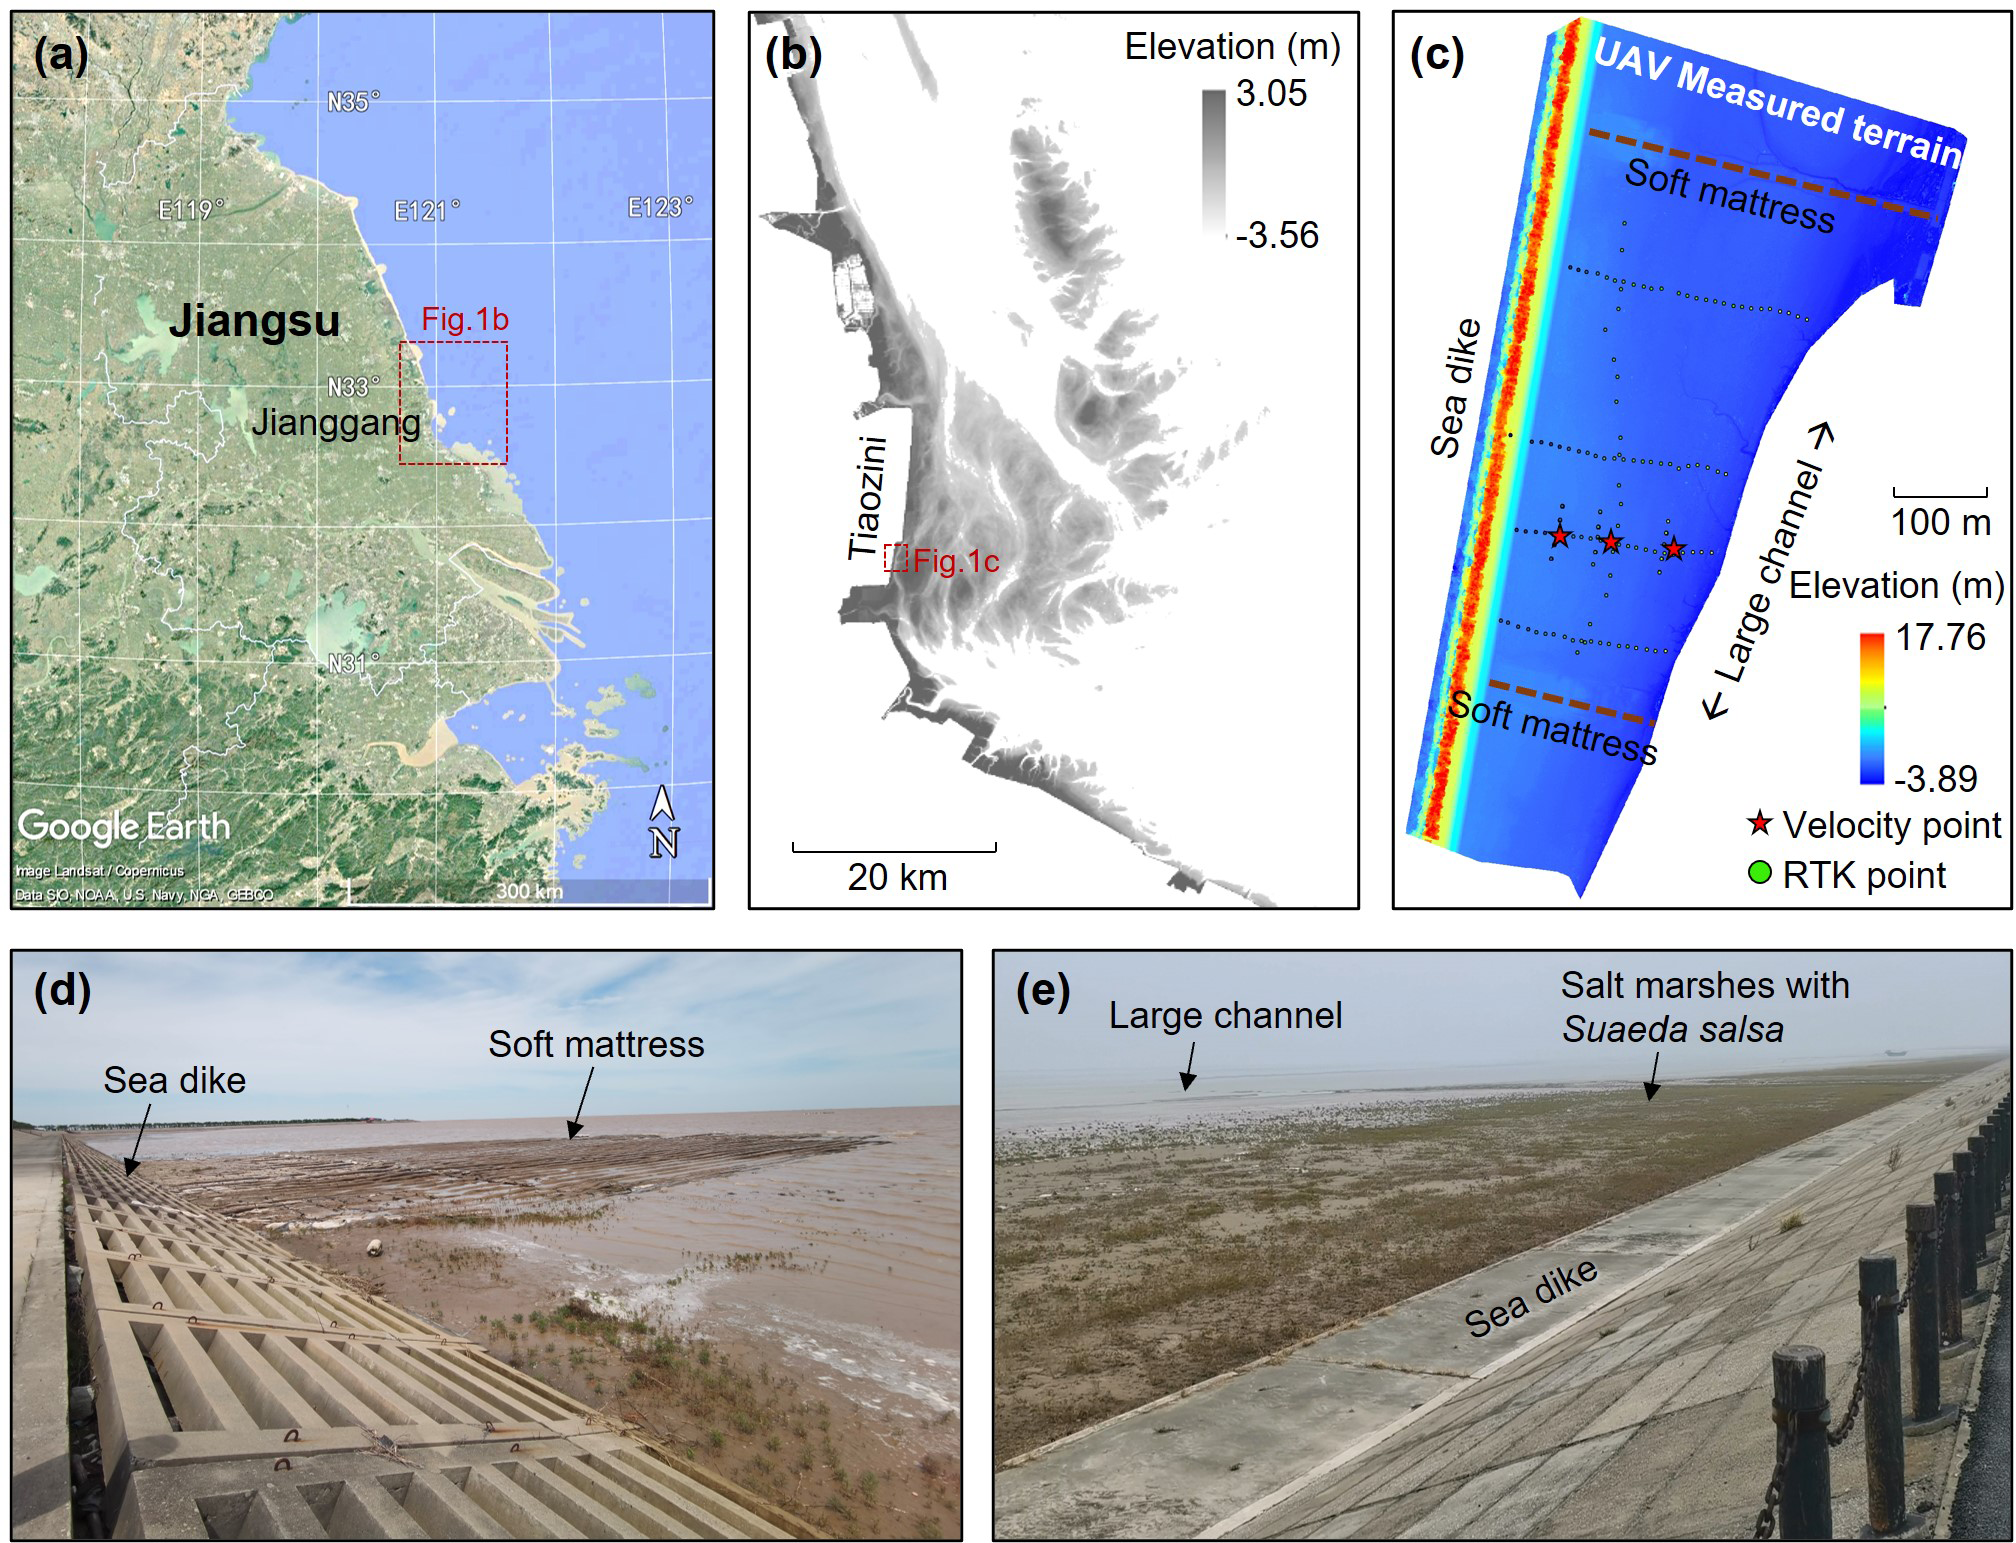
Schematic diagram of the study area: (A) the remote sensing image of Jiangsu coast; (B) the remote sensing elevation data (2021) of the area near Tiaozini; (C) the UAV measured terrain data and the locations of observation points; (D) the photo of the on-site soft mattress; and (E) the photo of the salt marshes.
To characterize the geomorphology of the study area, Real-Time Kinematic Global Positioning System (RTK-GPS) and Unmanned Aerial Vehicle (UAV) laser terrain scanning were employed to conduct full cross-sectional surveys along three transects between soft mattresses in the pre-dike zone (circles in Figure 1C). Elevation measurements were taken at 1 m intervals along each transect, with three replicates per point, and vegetation locations were marked. Local benchmarks for each transect were georeferenced using RTK-GPS. Field data were processed using Trimble R8 GNSS software, with the average of three measurements taken as the elevation for each point. The calibrated elevation data were then visualized in ArcGIS, and the distance between measurement points was calculated using the software’s ruler tool. The projected coordinate system adopted the Gauss-Kruger Projection CGCS2000-120E, and the vertical datum employed the 1985 national height datum of China. The topographic elevation of the study transects was derived from the spacing and elevation of the measurement points.
In-situ observation of hydro-sediment conditions and ecological characteristics
To investigate hydro-sedimentary dynamics and wave attenuation effects, instruments were deployed near the S. salsa vegetation survey quadrats at different elevations. As S. salsa generally germinates in May and matures in September in northern China (He et al., 2015; Zhang et al., 2023), we chose this late growing season period (in early October 2024) to measure waves, currents, and suspended sediment concentration when the biomass of the species is maximum in the field. A wave gauge (RBRsolo3 D|wave 16) was mounted 10 cm above the bed, sampling at 4 Hz in 5 min bursts. An Acoustic Doppler Current Profiler (ADCP) was vertically buried in the soil with the probe height flush with the surface of the tidal flat, used to measure the magnitude and direction of flow velocity within a depth range of 1 meter. An optical backscatter sensor (OBS-3A) was fixed 10 cm above the bed, collecting turbidity and pressure data at 10 min intervals. Water samples were collected for OBS calibration to derive suspended sediment concentrations.
To obtain key ecological parameters such as growth rate, diffusion coefficient, and maximum carrying capacity, fixed observation quadrats (n = 5) were established at high, middle, and low intertidal zones in May 2024 (early growing season). Quadrat surveys (1 × 1 m) were conducted at 50 m intervals, with five replicates per elevation gradient. Plant density () was recorded by carefully counting the number of individuals in each quadrat (He et al., 2015). Given that vegetated marshes and bare flats usually undergo abrupt changes when the extent of seawater inundation exceeds the survival threshold of salt marshes (Wang and Temmerman, 2013; van Belzen et al., 2017), the critical submergence height H (m) of S. salsa under natural conditions was determined as the average elevation of the vegetation edge line based on topographic measurements. In October 2024 (late growing season), the same method was used to measure the final density (d1). The maximum carrying capacity K (individuals/m²) was defined as the final density at each elevation gradient, which was about 200 individuals/m². Mortality rates were calculated by comparing initial and final densities, and the death coefficient (individuals/m²/yr) was derived by scaling to a yearly basis. These data were supplemented with literature values to obtain the ecological parameters of S. salsa in the study area.
Model description
A two-dimensional process-based modeling framework is employed to investigate the morphodynamic change and vegetation growth. This framework integrates morphodynamic model, Delft3D (Lesser et al., 2004), which simulates tidal flow, sediment transport, and bed level changes with a dynamic vegetation model developed in MATLAB (van Maanen et al., 2015; Xie et al., 2022). Specifically, Delft3D computes spatially explicit hydroperiods, which serve as inputs for the vegetation model to simulate marsh establishment, growth and mortality. The vegetation model then updates plant density, which are fed back to Delft3D to modify hydrodynamic resistance and influence sediment dynamics and associated morphological development. This coupled modeling approach has been successfully applied in prior studies of coastal wetland evolution, demonstrating its robustness for exploring biophysical interactions in intertidal landscapes (Wei et al., 2024; Gu et al., 2025).
Delft3D computes tidal flow, sediment transport and associated bed level changes, as detailed in previous studies (Xie et al., 2022; Wei et al., 2024; Gu et al., 2025). Water levels and flow velocities (depth-averaged), computed via the shallow water equations, are used to simulate suspended sediment transport based on the advection-diffusion equation. The resulting bed level changes are computed via the sediment mass balance equation and subsequently fed into the hydrodynamic module for the next time step. To account for the vegetation effects on flow and sediment transport, the Trachytope approach in Delft3D using the Baptist formula was applied (Baptist et al., 2007). The Baptist formulation is based on the concept that vegetation can be modelled as rigid cylinders characterized by vegetation height , density m, stems diameter D and corrected drag coefficient . In this approach, the bed roughness C and flow resistance term M in both x and y directions (i.e., ) are incorporated into the momentum equations to represent the effect of vegetation on tidal currents. Both and are calculated based on vegetation characteristics and water depth by Equation 1 and Equation 2:
where is the unvegetated Chézy coefficient, which can be calculated by ; is the Manning coefficient, and is the Hydraulic Radius; = 9.81 m/s2 is the gravity acceleration; = 0.41 is the Von Kármán constant; (m) is the vegetation height; is the drag coefficient accounting for stems of vegetation. where is the number of saltmarsh stems per square meter and D is the diameter of the saltmarsh stems.
The vegetation model simulates the processes of establishment, growth and mortality based on the methodology of Schwarz et al. (2014). Net vegetation biomass change is described by Equation 3:
where is the derivative with respect to time of the total stem density of the saltmarsh, (stems/m2), with components representing establishment (), growth (), and flow-induced mortality ().
Following previous studies, the establishment, growth, and mortality of vegetation (Marani et al., 2013) are related to local inundation frequency calculated by Equation 4:
where represent relative inundation ratio, a, b and c represents empirical coefficients of the equation, which are determined according to the field surveys in the study area.
Seeding establishment of saltmarsh plants is modelled as a random process by Equation 5:
where is the probability that a bare cell gets colonized. is the initial stem density upon establishment (stems/m2), related to the maximum density K (Schwarz et al., 2014). , where K and are set to 200 and 20 based on the field data in Jiangsu coast, China. is the time step.
Saltmarsh growth is calculated by Equation 6 (Schwarz et al., 2014):
Where r is intrinsic growth of stem density, which is set to 1 (Schwarz et al., 2014).
Flow-induced mortality is described by Equation 7 (Schwarz et al., 2014):
where is the saltmarsh mortality coefficient related to the bed shear stress (; N/m2), set to 3000, (stems m-2/(N/m2)) (Schwarz et al., 2014). is critical bed shear stress for saltmarsh uproot, set to 0.26 N/m2 (Schwarz et al., 2014).
Model construction
Based on the model framework mentioned above, a numerical model (namely Tiaozini Model) has been established to simulate the hydrodynamic processes, sediment erosion/deposition, vegetation development, and morphological evolution in the coastal area between and around two soft mattresses in Tiaozini.
The initial bathymetry of the model was set based on the generalized terrain derived from remote sensing data and the UAV-measured elevation data. Since the Tiaozini coast is adjacent to the Radial Sand Ridges (Figure 1B), which is a huge underwater sand-ridge group presenting a fan-shaped radial offshore morphology (Zhang et al., 1999). Mainly distributed in the inner shelf of the South Yellow Sea and shallow waters with a water depth of 0–25 m, the Radial Sand Ridges extend 200 km from north to south and 140 km from east to west, with the widest intertidal zone reaching 14 km. Therefore, the initial topography of the model was generalized as a rectangular intertidal zone dominated by shoals, with a width of 2600 m in the alongshore direction and 1000 m perpendicular to the shoreline (Figure 2). The model grid size was 5 m, with 520 grids along the coast and 200 grids perpendicular to the coast. The elevation at the offshore boundary was based on the 2021 remote-sensing elevation data. The location, size, and elevation of the soft mattresses in the model were based on the UAV-measured elevation data.
Figure 2
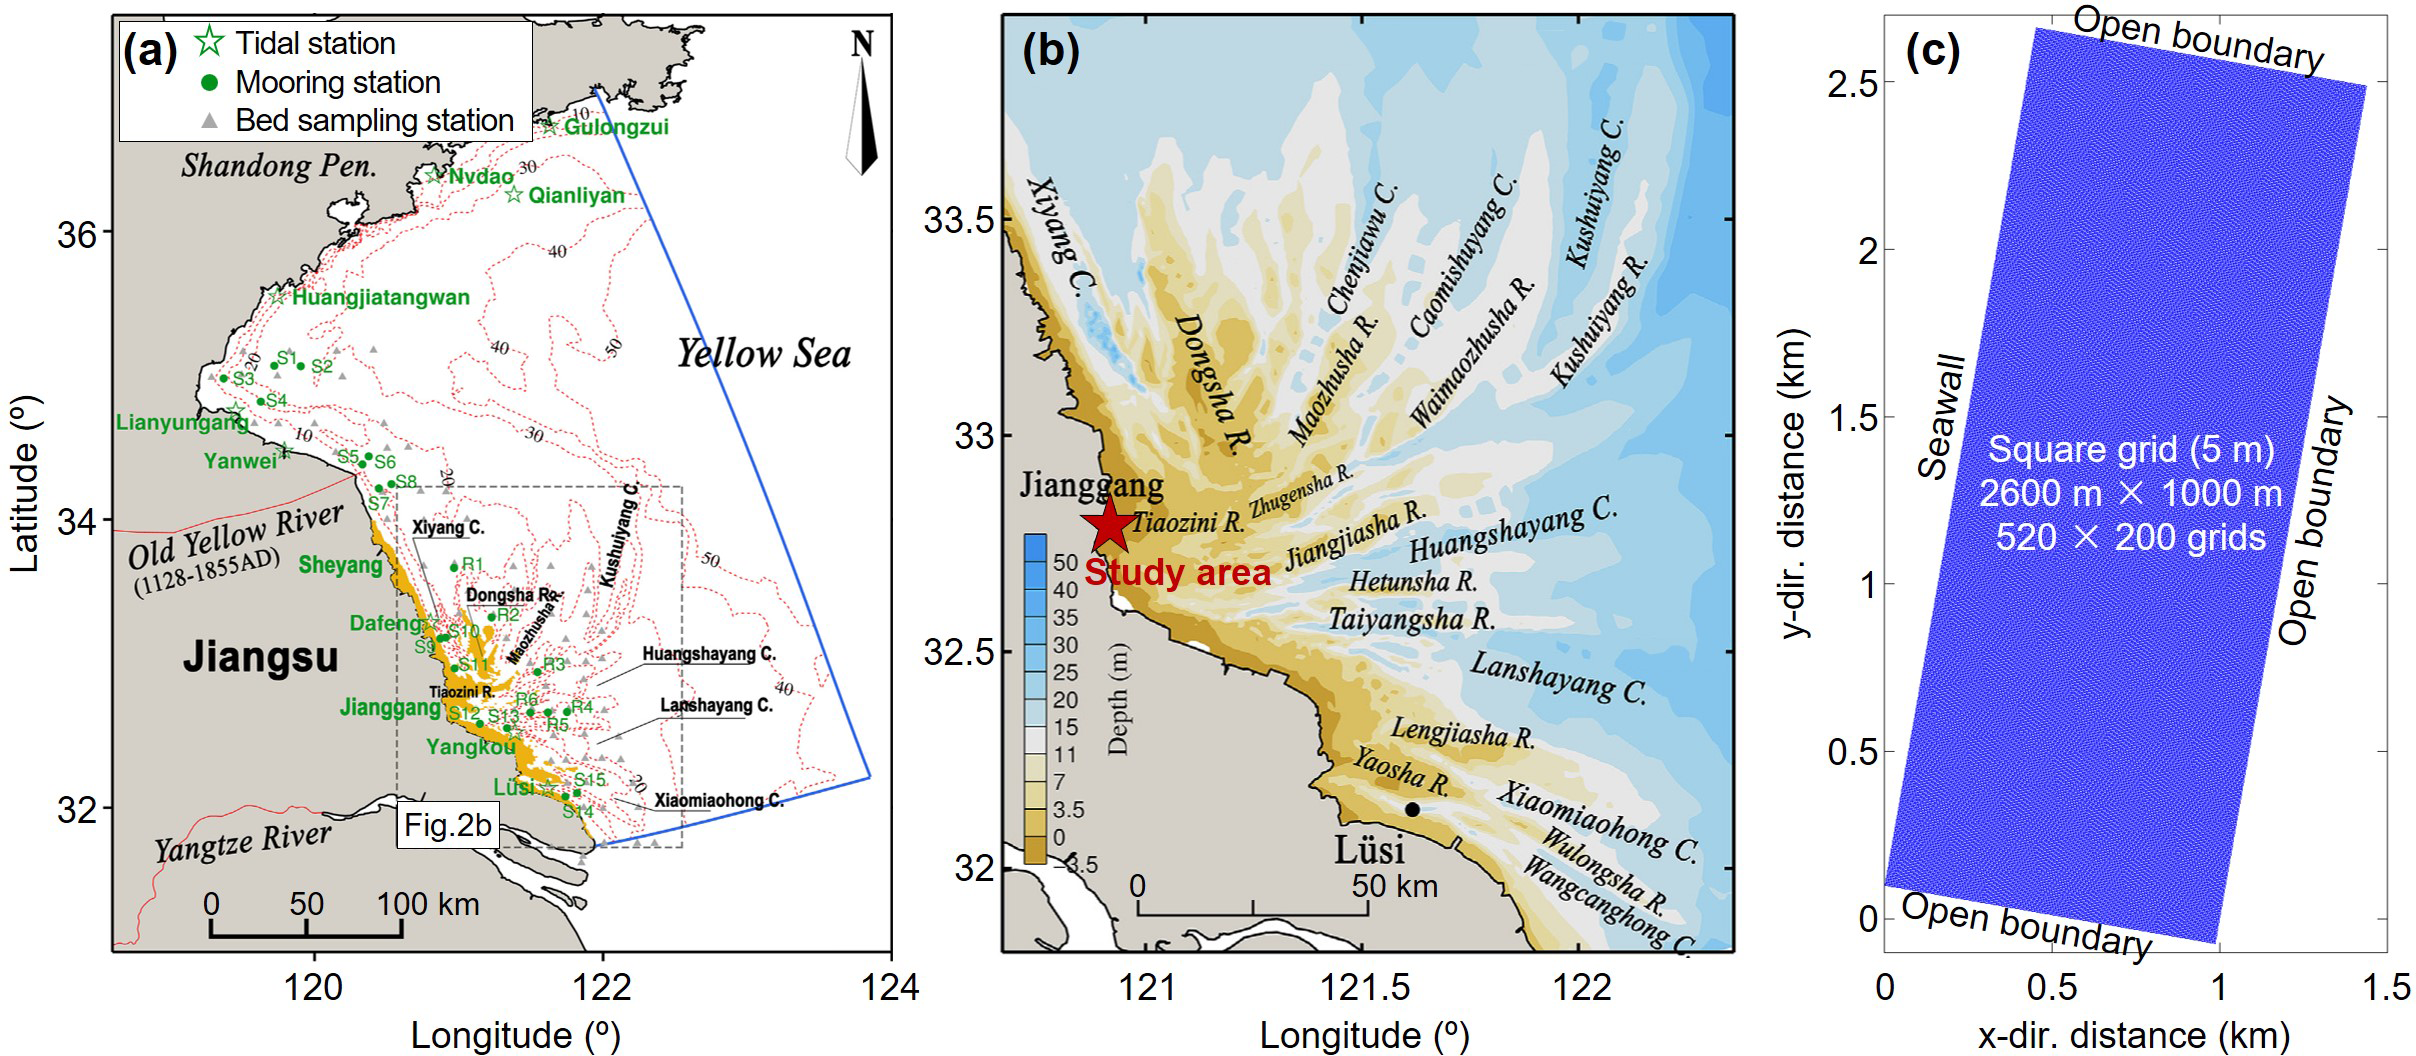
Boundary setup: (A) the JRM used to provide boundary conditions for Tiaozini model (modified from Yao et al., 2018); (B) the study area (Tiaozini) in the JRM (modified from Yao et al., 2018); and (C) the setup of Tiaozini model.
The eastern, southern, and northern boundaries of the model were open boundaries, while the western boundary was a solid-wall boundary simulating a seawall. To ensure that the hydrodynamic processes at the three open boundaries were consistent with reality, the boundary dynamic conditions were provided by the Jiangsu Reginal Model (JRM, Yao et al., 2018). The computational model domain of the JRM almost covers the whole inner shelf along the Jiangsu coast, bounded by the latitudes 32°N and 36.5°N and by the longitudes 119°E and 124°E (i.e., ∼200 km × ∼550 km, see Figure 2A). The simulation accuracy of the JRM was verified by comparing its results with the measured data from observation stations along the Jiangsu Coast (Yao et al., 2018). It indicated that the model could reproduce the tidal current and sediment transport in the Jiangsu coast and meet the requirements for providing boundary conditions for this study. Based on the JRM, the tidal water level variation process near Tiaozini was calculated, providing the water level conditions at the four boundary vertices for the small-scale model in this study.
Through the analysis of field-collected surface sediment samples, the median diameter of sediment was 30 μm, classified as coarse silt, according to the classification standard first demarcated by Friedman and Sanders (1978). Coarse silt is characterized by moderate water permeability, a certain degree of viscosity when moist, and a settlement rate in water that falls between that of sand grains and fine silt. The movement of coarse silt in water is mainly in the form of suspended load and is primarily driven by the shear stress of water flow. Therefore, cohesive sediment module (i.e., Partheniades-Krone formulations, Partheniades, 1965) was used for simulation in the sediment transport model, which determines the movement state of sediment by comparing the relative magnitudes of the critical shear stress of sediment and the shear stress of water flow. More details about the formulations refer to technical manual of Delft3D (Deltares, 2011). According to previous studies of Jiangsu coast (Gong et al., 2012; Geng et al., 2023; Kuai et al., 2023), the settling velocity was set to 0.25 mm/s, and the critical shear stress for deposition and erosion were 0.2 N/m² and 0.4 N/m², respectively, with an erosion rate of 6×10⁻⁴ kg/(m²·s). To ensure topographic stability at the seaward boundary, we increased the critical shear stress for erosion at the seaward boundary to create a non-variation boundary condition.
The growth process of salt marsh vegetation was controlled by hydrodynamic conditions. Therefore, the model used vegetation growth curves to simulate the development of vegetation (Equation 4), which was quantified based on the measured inundation frequency and corresponding plant density at different locations in the field. Although the RBR tide gauges were used in this study to measure water-depth changes at different elevations, the measurement period was selected during a spring tide and encountered stormy weather. As a result, the inundation frequency was higher than normal conditions. Additionally, the water level during neap tides was lower than the elevation of this area, making it impossible to calculate the exposure duration during neap tides. Therefore, this study calculated the annual-average inundation frequency at each elevation based on the in-situ measured elevation at different positions and the one-year water-level process simulated by the JRM. A quadratic-curve fitting was performed between the inundation frequency at different positions and the measured plant-density data to obtain the annual-average vegetation-growth curve.
Results
Model validation
The hydrodynamic and sediment transport processes in the model were first validated using data measured at Tiaozini in October 2024, including the topography around the soft mattresses, water levels and velocities within the salt marsh and at its edge, and near-bed suspended sediment concentration. The measurement positions of various physical parameters are shown in Figure 1C.
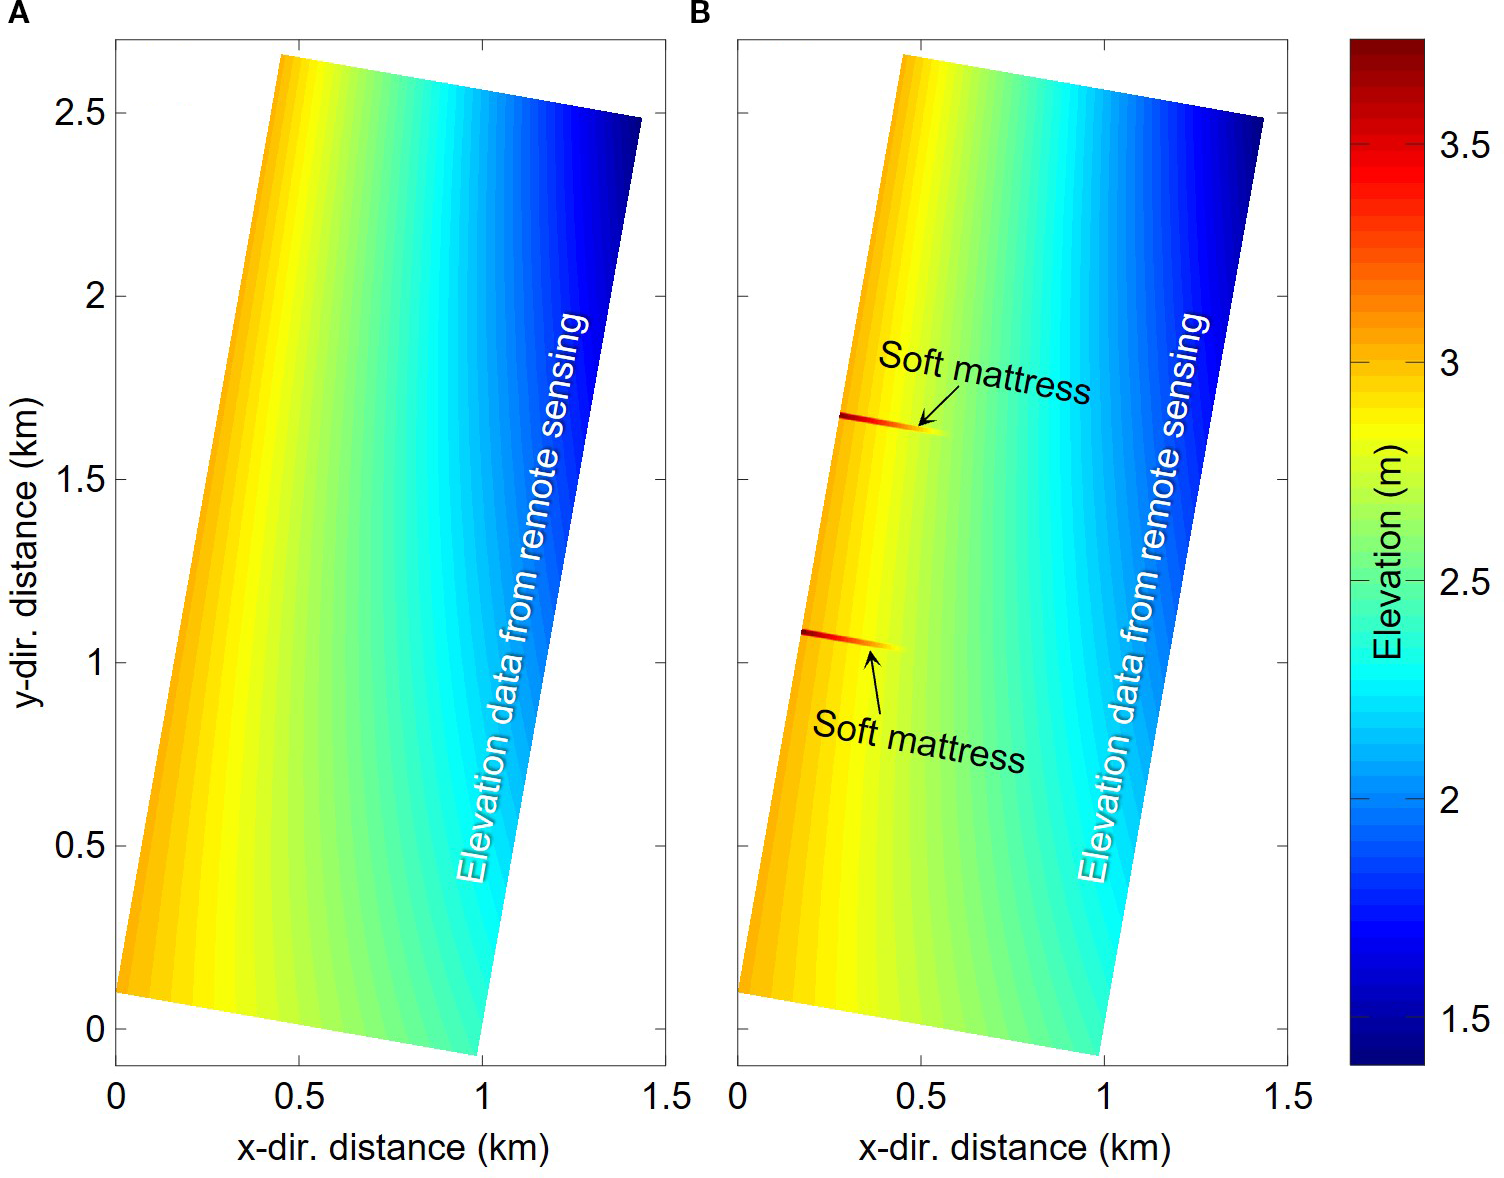
The UAV-measured topography covered the area between and around the two soft mattresses, connected to the seawall on the west side and adjoining a large-scale alongshore tidal channel on the east side. Since the large tidal channel on the east side was always submerged during low tide, making it impossible for the UAV to accurately measure the surface elevation, data from the large tidal-channel area were excluded (Figure 1C). To ensure a smooth hydrodynamic process in the model, the elevation of the east boundary in the model was set based on the remote sensing elevation data of 2021 (Figure 1B), increasing linearly from 1.4 m in the north to 2.4 m in the south, as shown in Figure 3.
Figure 3
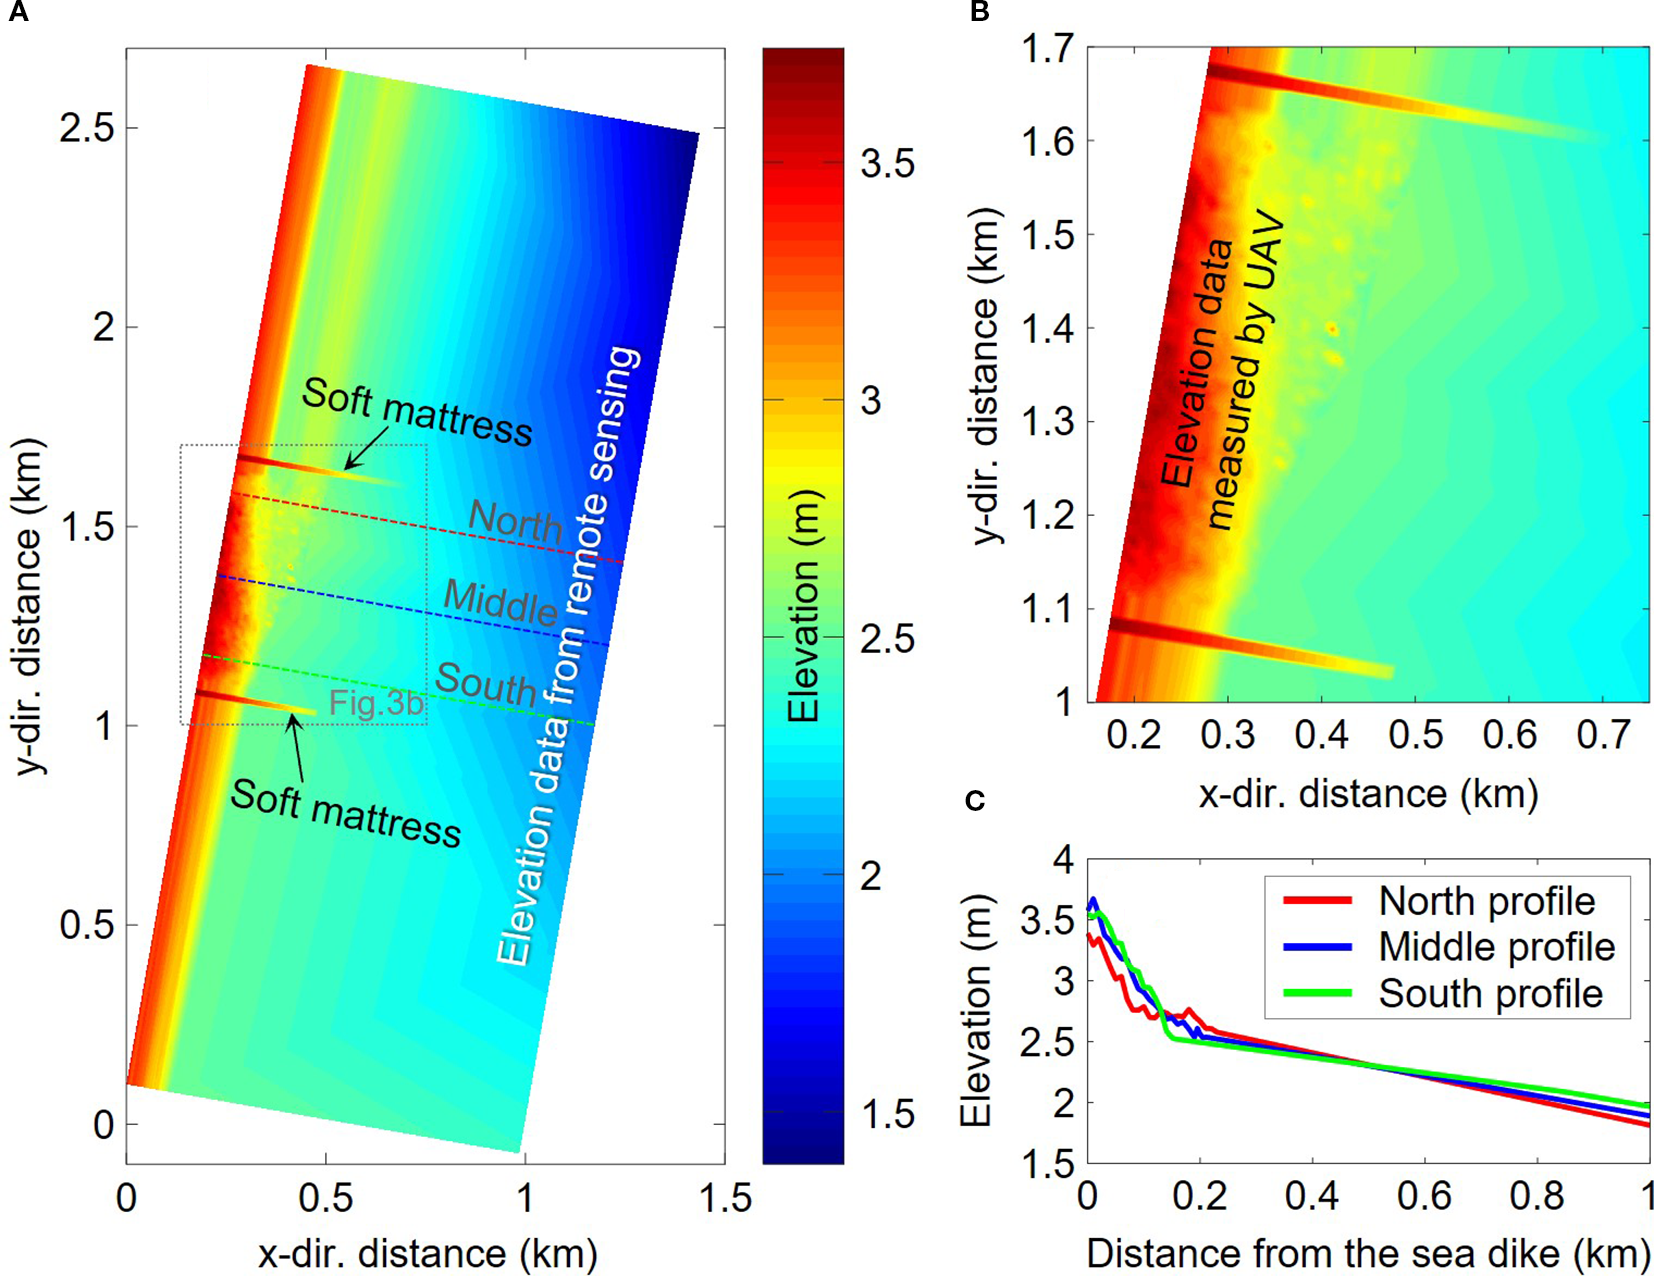
Initial bed elevation in numerical model for model validation: (A) the overall initial bed elevation; (B) the magnified view of the soft mattresses area; and (C) the cross-sectional topography of three sections.
The water-level processes at the four boundaries were provided by the JRM (Figure 2). Due to the shallow elevation of the tidal flat, all four boundary points were exposed during low tide, resulting in a strong shallow water deformation. The rising tide process is rapid, the falling tide process is prolonged, and the landward area is hardly submerged during neap tides. The southeast boundary point was exposed even earlier due to its higher elevation.
The northern soft mattress was longer, approximately 440 m, and the southern one was approximately 300 m. In the model, they were simplified as 10 m-wide submerged dikes, with an elevation about 3.7 m at the landward and 2.7 m at the seaward. To simulate the characteristics that the soft mattresses could be submerged during high water without being eroded, the critical erosion shear stress at the mattress positions in the model was adjusted to 100 N/m2 to avoid erosion.
Field measurements of water depth, velocity, and near-bottom suspended sediment concentration were conducted from October 14 to 22, 2024, covering a complete spring-tide stage when the tide could inundate the tidal flats. During model validation, to match the simulated hydrodynamic processes with the topography, simulations were run from October 1, 2024, and lasted for one month. The simulated changes in water depth, velocity, and near-bed suspended sediment concentration were then compared with the measured data to verify the model’s accuracy (Figure 4).
Figure 4
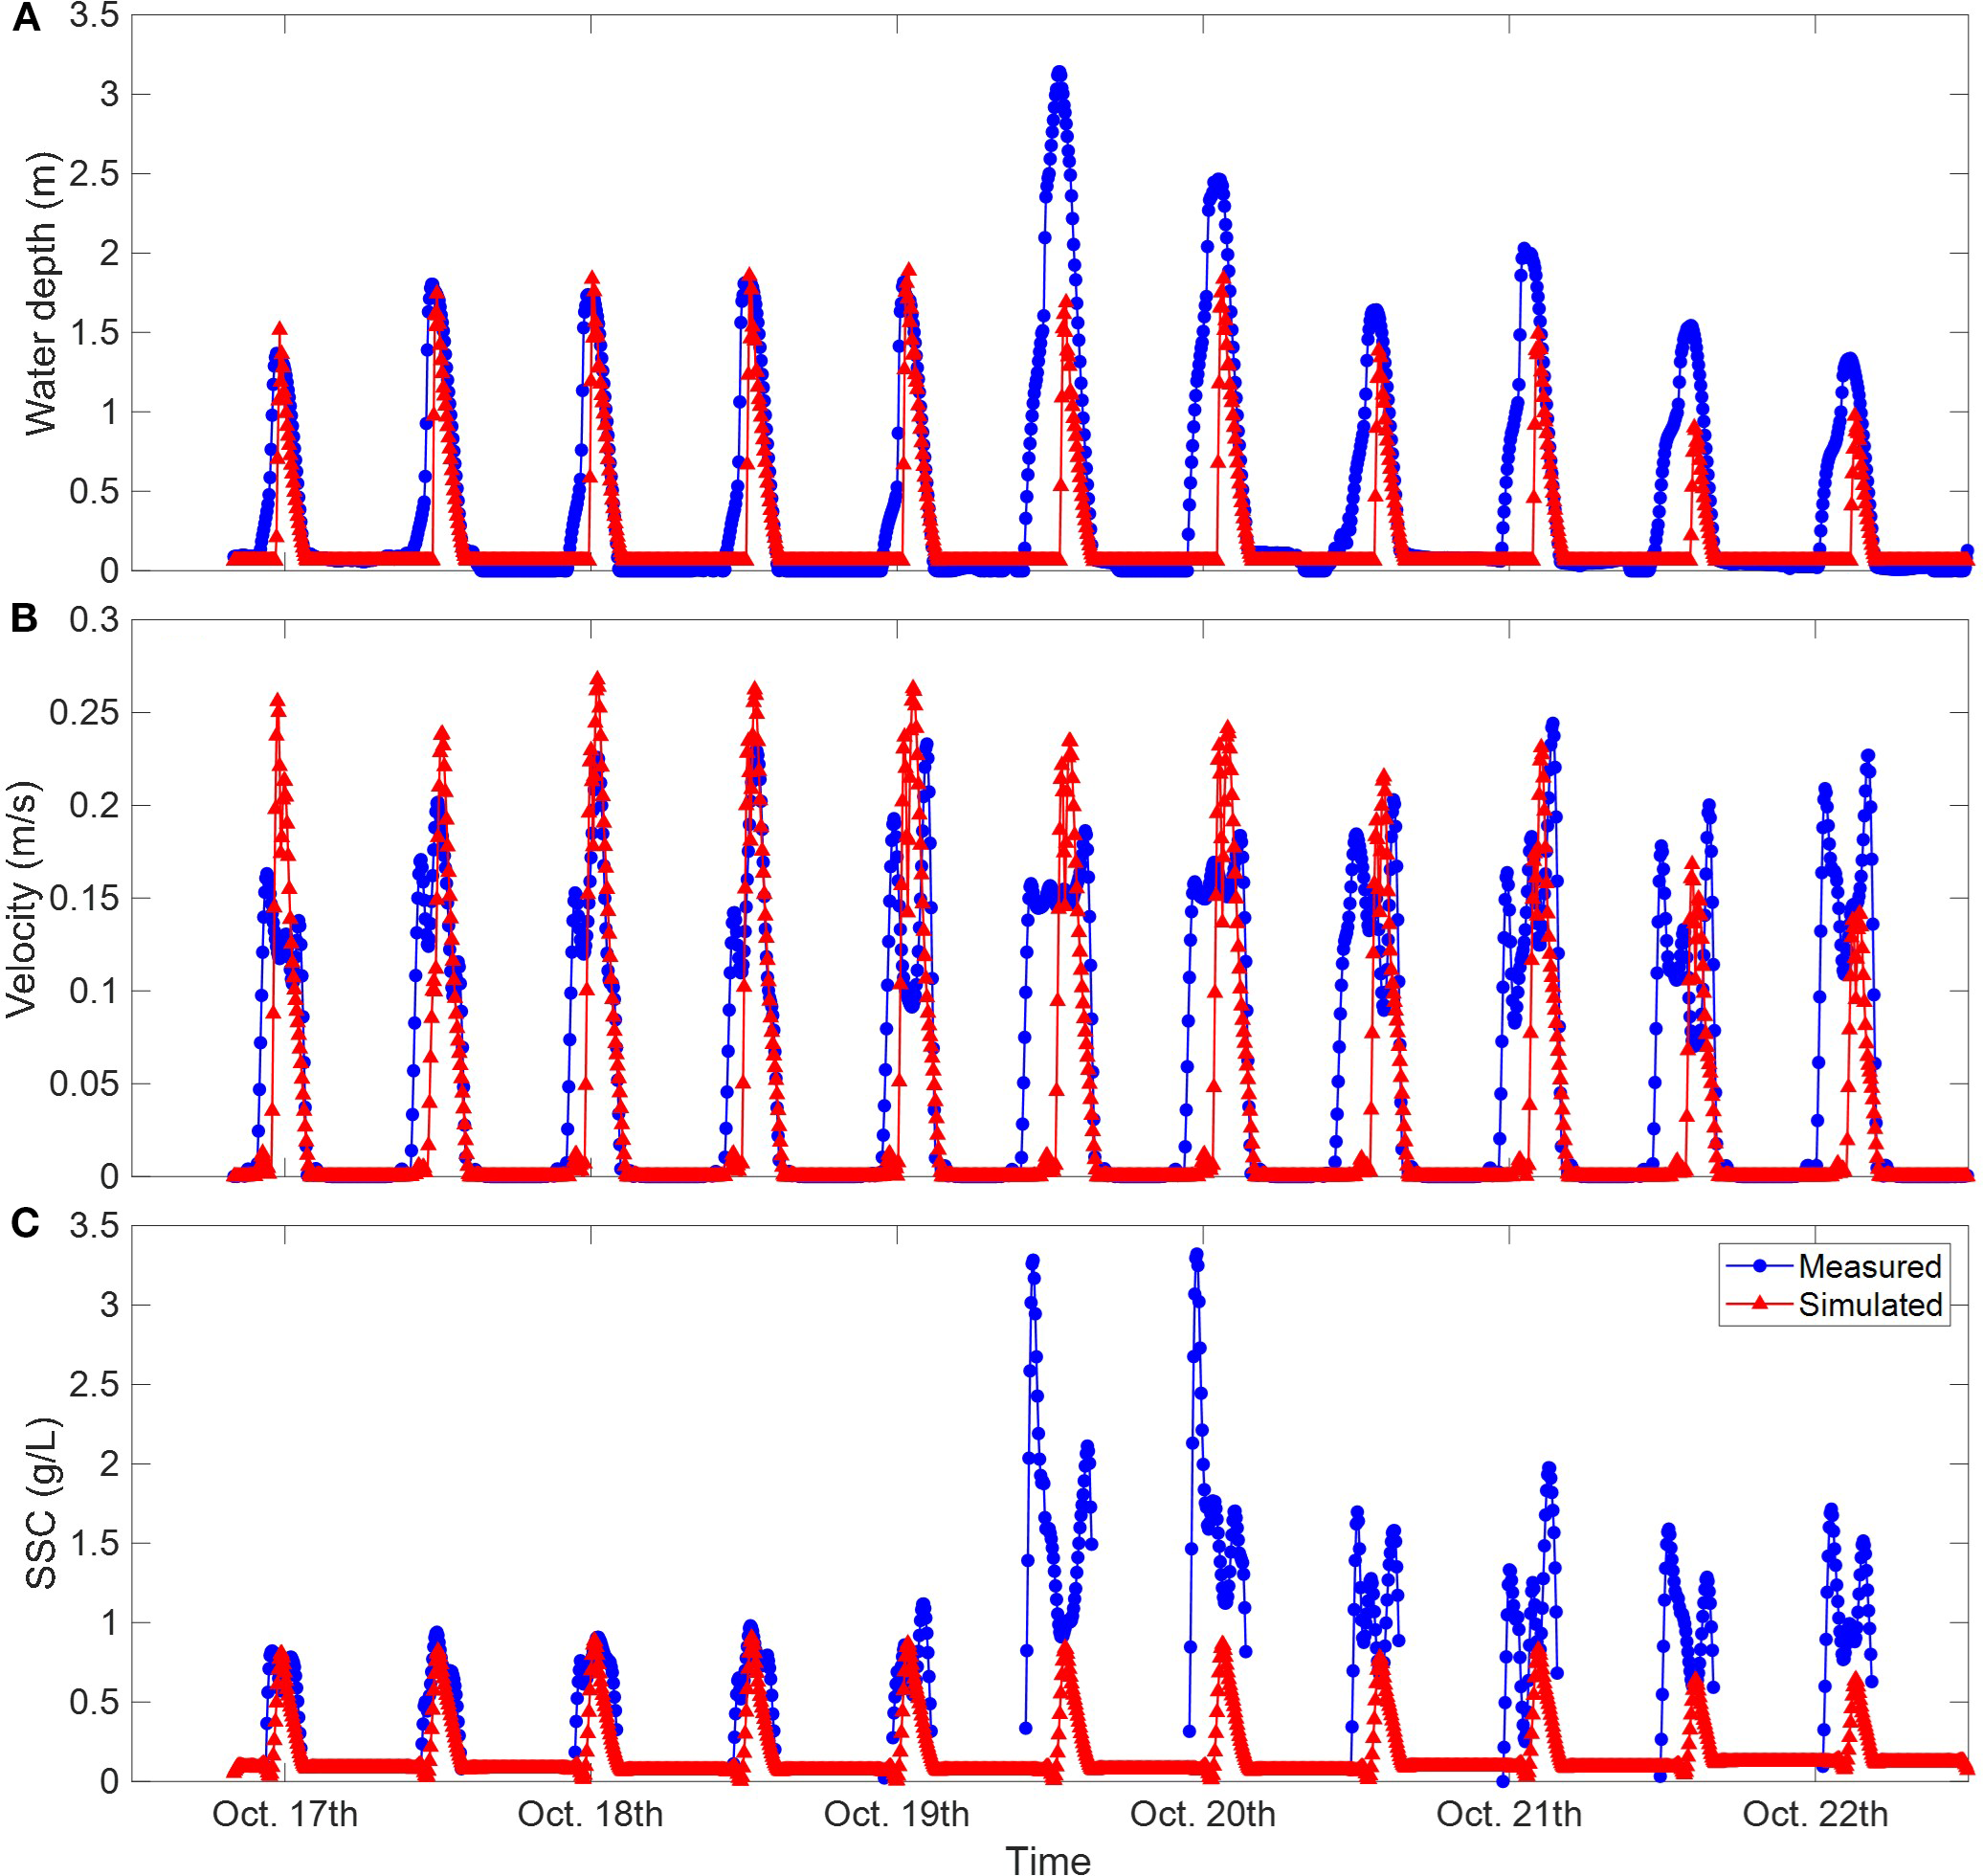
Comparisons between observed data and model results.
Since this study used the 2D horizontal mode (2DH) in Delft3D, the simulated current velocities and suspended sediment concentrations were depth-averaged. Therefore, the measured hydrodynamic and sediment data need to be converted first. Profile velocity data were measured using an Acoustic Doppler Current Profiler (ADCP), from which velocities at different depths could be extracted to calculate the vertically averaged velocity (blue line in Figure 4B). Near-bed suspended sediment concentration was measured using an OBS (Optical Backscatter Sensor) installed about 0.1 m above the bed. Assuming the vertical suspended sediment concentration profile follows the Rouse-profile, the near-bed concentration was used as a reference value. The suspended sediment concentration at different water depths in the profile was calculated based on the water depth and velocity at different times, and then the vertically averaged suspended sediment concentration was converted through the profile distribution (blue line in Figure 4C).
Figure 4 shows the comparison between model simulations and measured data at the seaward measurement point, where red points represent model results. The simulated water depth changes were highly consistent with the measured data (Figure 4A), reproducing the deformation of tidal waves in shallow-water environments, resulting in a very short flood-tide process and a prolonged ebb-tide process after reaching the highest water level. The simulated ebb-tide process matched the measured ebb-tide more closely than the flood-tide. This was because actual hydrodynamic processes were also affected by variable waves and winds, which were difficult to fully account for in the model. Onshore waves and winds could cause tidal surges, advancing the flood-tide and increasing its duration, so the measured water-level process was slightly earlier than the simulation. Especially during the period from 10:00 on the 19th to 06:00 on the 20th, strong winds in the field caused the measured flood-tide to advance significantly and the maximum water level to rise notably. By calculating the relative error of the highest tidal level between the measured and simulated values for the first five tidal cycles with less wind-wave influence, the average relative error was 5.2%.
The change process of vertically averaged velocity was greatly influenced by water depth, especially during the flood-tide stage. The flood-tide front caused by the short flood-tide duration inundate the tidal flats rapidly, leading to a surge in velocity under extremely shallow-water conditions, followed by a rapid decrease in flood-current velocity as the water level rose quickly. During the ebb-tide, the velocity also increased first and then decreased. Similar phenomena occurred in the numerical model, and the velocity-change process was consistent with the trend of the measured velocity. However, there was a large deviation between the simulated flood-current velocity peak and the measured data (Figure 4B). One reason might be that the ADCP used for in-situ velocity measurement had a blind zone within about 10 cm near the bed, making it difficult to capture the velocity surge under extremely shallow-water conditions. On the other hand, the model ignored the influence of wind and waves on the flood-tide process, resulting in the short and intense flood-tide dominated by tides, which also led to a larger relative error in the peak velocity between simulation and measurement, averaging about 24.2%.
The simulated suspended sediment concentration showed a similar overall trend to the converted measured values, with concentration peaks appearing at specific times, indicating that the numerical model could reflect the periodic-variation characteristics of suspended sediment concentration on coastal tidal flats to a certain extent and simulate the fluctuation behaviors of suspended sediment concentration over time (Figure 4C). The average relative error of the first five concentration peaks was 9.4%. Due to the complexity of the on-site environmental conditions, many studies on tidal flat models based on on-site measured data have significant deviations in their simulation results, especially in the simulation of suspended sediment concentration (Guo et al., 2012; Rahbani, 2015). For instance, in the study by Guo et al. (2012) on the hydrodynamic and sediment transport conditions of the Qiantang Estuary, although the simulated suspended sediment concentration differed significantly from the measured results, the trend and magnitude of the tidal flat evolution were overall consistent with the reality. Therefore, given that this study focuses on the evolution mechanism of tidal flats over annual scale, the model results can meet the precision requirements of theoretical discussions.
Sedimentation-promoting effect of soft mattress engineering
In the previous section, using the UAV-measured topography as the initial terrain, the simulated hydrodynamic processes were verified by comparing with field measurements, confirming the model ability in simulating the reality. Then, the validated model was applied to simulate a four-year evolution of coastal morphology under the influence of engineering and ecological measures. The selected initial terrain was generalized based on the 2021 remote-sensing elevation data around Tiaozini (Figure 1B). The western boundary connected to the seawall, with a basically uniform elevation along the coast of about 3 m. The elevation of the eastern boundary changed from 1.4 m to 2.4 m (Figure 5). The offshore boundary conditions were provided by the JRM, which used larger grid sizes that could not reflect the geomorphology of the tidal-channel system in the Radial Sand Ridges. Therefore, small scale topographic undulations within the study area were ignored during initial-terrain construction, and the elevation at each point was interpolated based on the boundary-point elevations (Figure 5). The JRM provided a one-year water-level process for the three open boundaries. Based on preliminary sensitivity analysis, the morphological acceleration factor was set to 4, which effectively accelerated the morphological evolution process while maintaining simulation accuracy. The simulation started on January 1, 2021, and after conversion using the morphological acceleration factor, ended at the end of 2024, allowing comparison with the 2024 measured topographic data. In order to separately discuss the effects of engineering measures and ecological measures on landform evolution and the ecosystem, we set up 4 groups of control experiments. The conditions of the soft mattresses and vegetation planting in each group were shown in Table 1.
Figure 5
Initial bed elevation for morphologic evolution: (A) the situation without soft mattresses and (B) the situation with soft mattresses.
Table 1
| Cases | Engineering measure | ||
|---|---|---|---|
| Without soft mattresses | With soft mattresses | ||
| Ecological measure | Without salt marsh | #1 | #2 |
| With salt marsh | #3 | #4 | |
Conditions of the soft mattresses and vegetation planting in each case.
First, in the absence of vegetation, the evolution processes of tidal flats with and without soft mattresses were simulated to analyze the contribution of the mattress engineering to coastal protection. In the early stage of evolution, topographic changes had not yet appeared, and its impact on the flow field was small. As a result, the impact trend of the flow field’s distribution and characteristics on the subsequent morphological evolution can be summarized from this stage (see Figure 6).
Figure 6
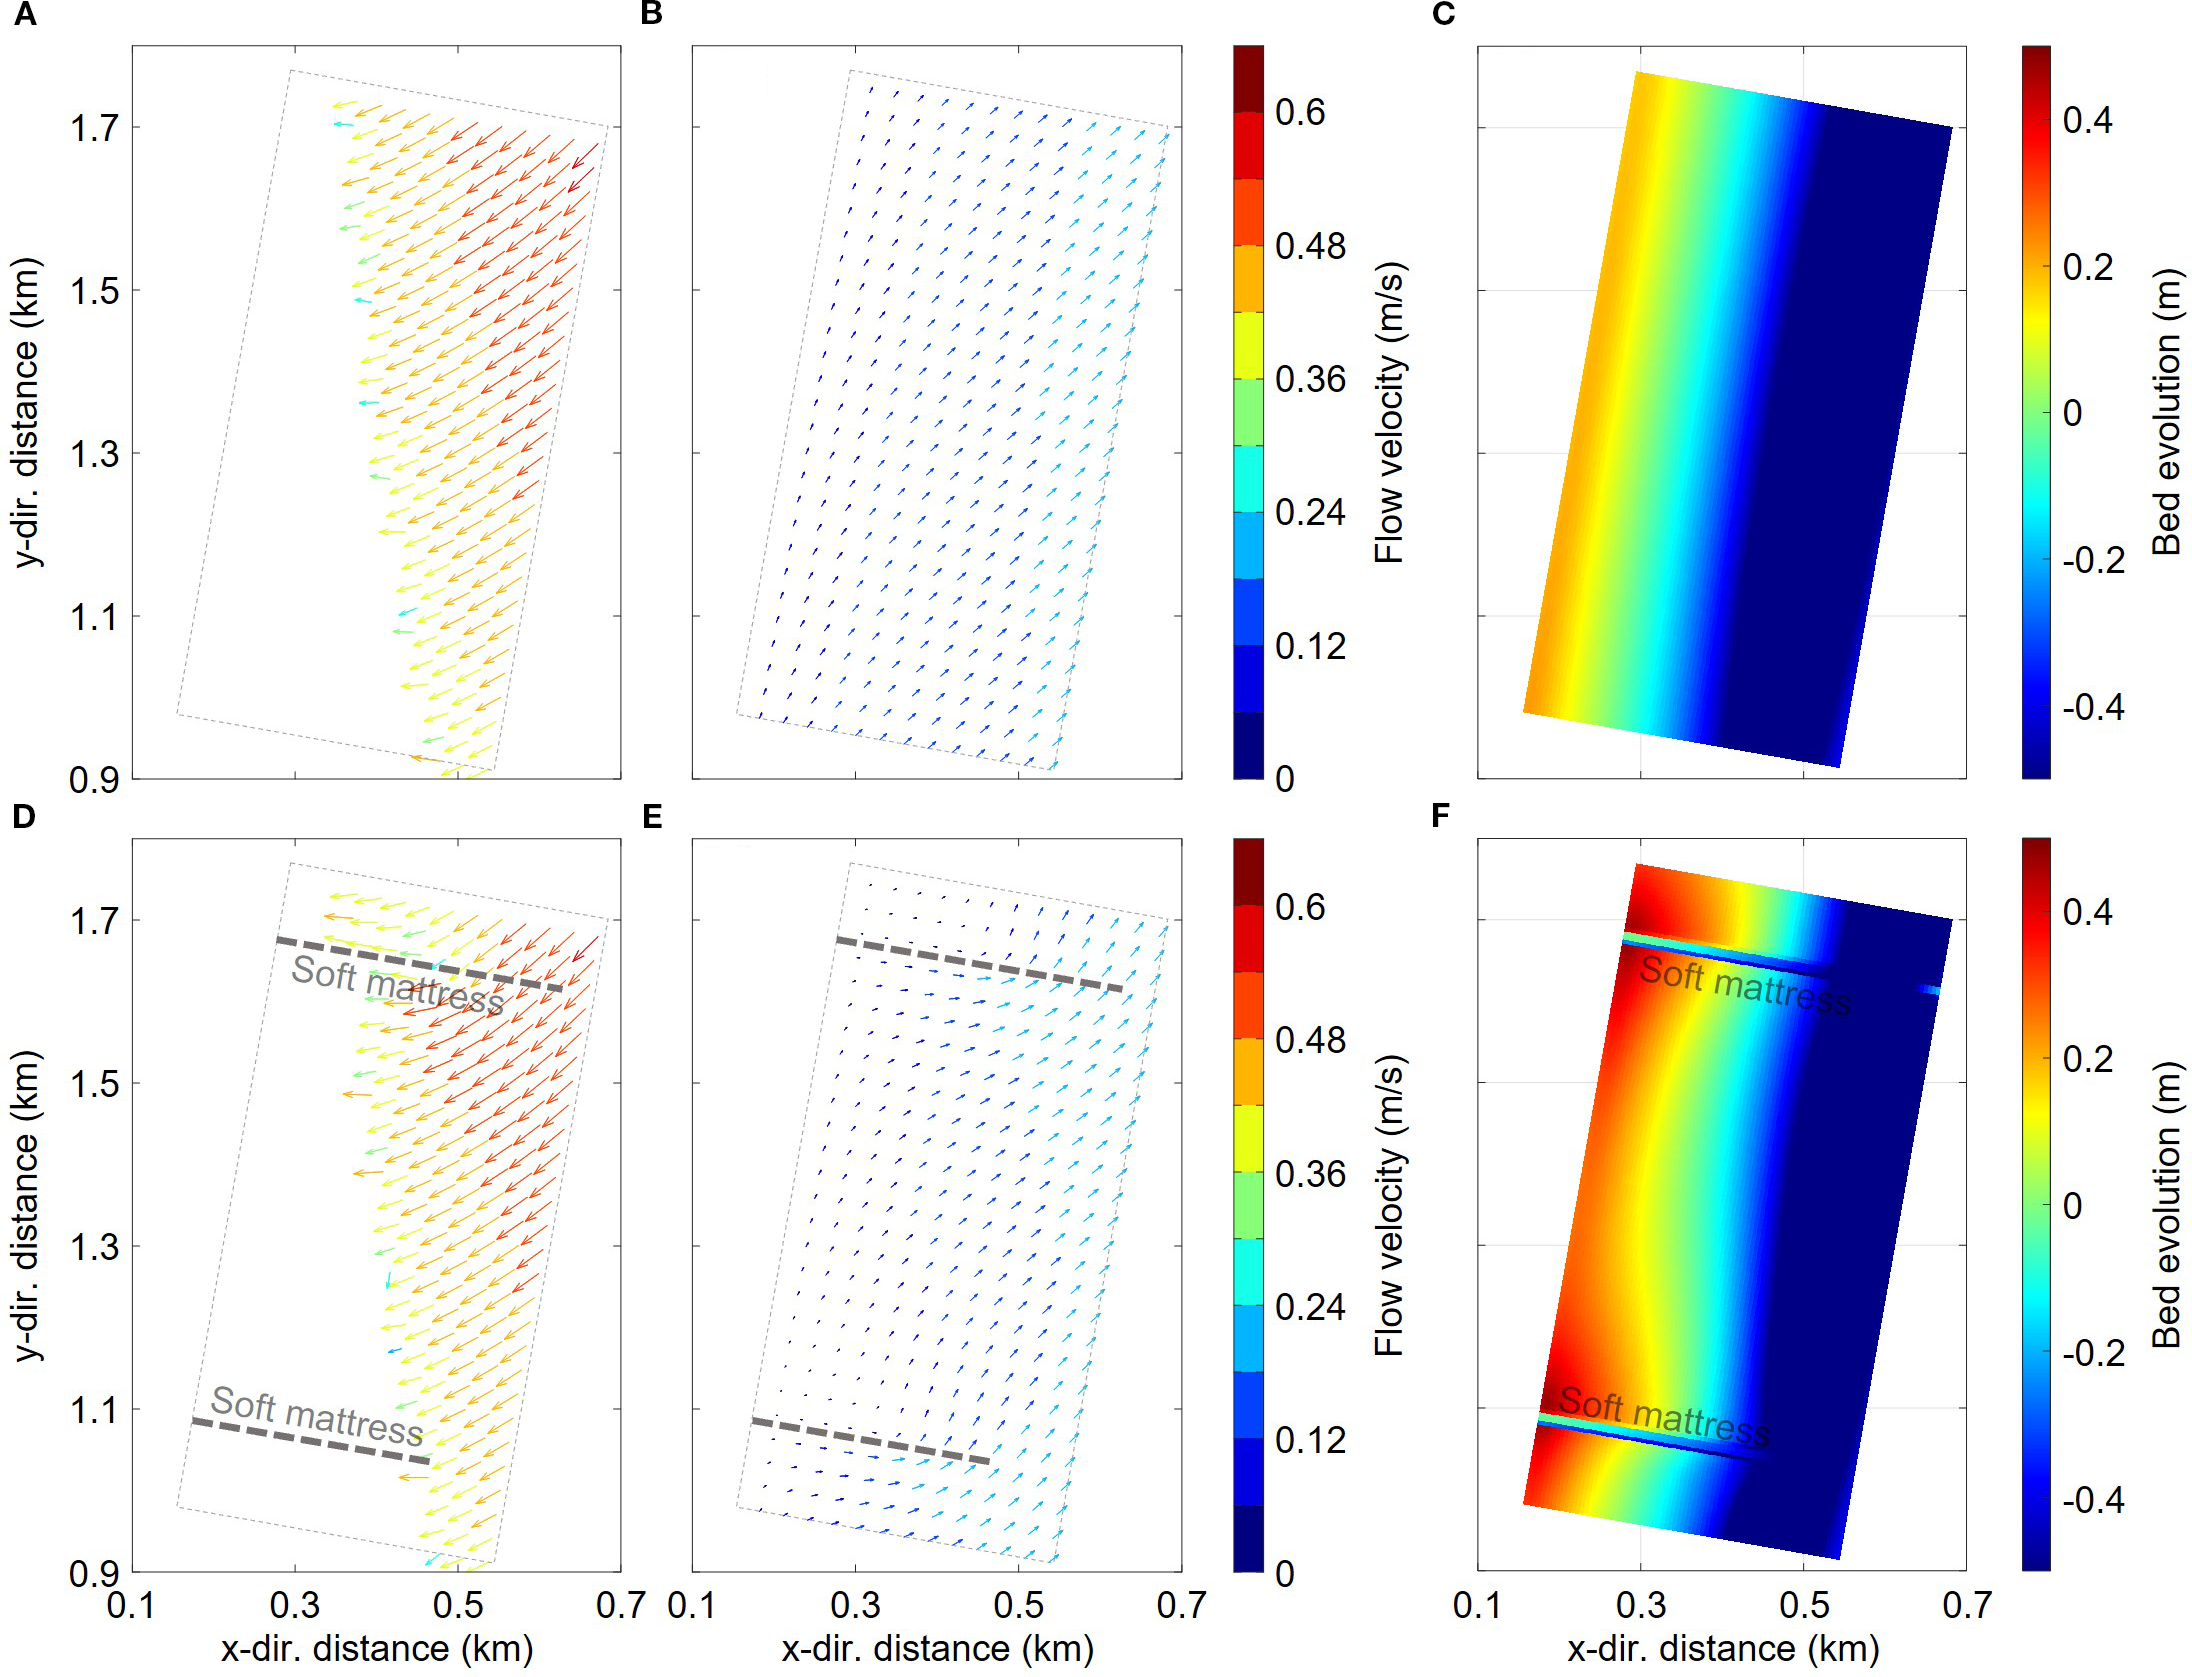
The maximum flow field during flood and ebb as well as the final bed topography changes in cases without and with soft mattresses.
In general, the flow direction in the study area showed along-shore-current characteristics. Without soft mattresses, the flood-tide proceeded from north to south, and under the influence of shallow-water deformation of tidal waves, the flood-tide process was very rapid. During the rapid water-level rise, the flow direction gradually changed from along-shore to perpendicular to the shoreline (Figure 6A). During the ebb-tide, the flow direction first deflected to the northeast, then gradually changed to along-shore northward as the water level dropped (Figure 6B). The evenly-distributed flow-field ultimately resulted in uniform geomorphological changes, with little variation in sediment erosion-deposition along the coast (Figure 6C). Sediment deposition mainly occurred in the higher tidal flat areas, which had a low inundation frequency and weak hydrodynamic forces, making it easier for sediment to settle. The farther from the shore, the lower the tidal flats elevation, with increasing hydrodynamic forces and inundation frequency, causing the bed evolution trend to gradually change from deposition to erosion, forming a deeper erosion area about 500 meters offshore. The simulated geomorphology was similar to the location of the large tidal channel in reality (e.g., Figures 1B, C), indicating that the model could well reproduce the geomorphological evolution trend near the study area.
In the presence of soft mattresses, hydrodynamic processes were affected to a certain extent. Especially when the water level was between the mattress and tidal flats elevations, the flow was deflected by the mattresses, and the flow direction within the sheltered area of the two mattresses tended to be more perpendicular to the shoreline (Figure 6D). During the ebb-tide, the flow was also deflected offshore due to the obstruction of the mattresses (Figure 6E). However, when the water level exceeded the mattress elevation, the influence of the mattresses on the flow direction weakened, and the flow directly over-flowed the mattresses, with increased velocity. Due to the sheltering effect of the mattresses, the hydrodynamic forces near them were weaker, making it easier for sediment to deposit, thus forming sediment-accumulation areas where the two mattresses were connected to the seawall toe. Compared with the case without mattresses, the average elevation in the sheltered area (200 m wide area from the seawall) was raised by 0.13 m, and the sediment-deposition volume increased from -3681 m3 to 9852 m3, demonstrating the important role of soft mattresses in coastal protection and beach preservation.
Ecological effect of soft mattress engineering
Next, vegetation growth and vegetation effects were considered in the model. The study area had naturally growing S. salsa. To generalize the growth state of S. salsa communities and their annual-average vegetation effects, and simplify the calculation process, we ignored the differences in the growth stages of S. salsa throughout the year. Based on the measured elevation and biomass-density data, a quadratic growth curve describing the relationship of S. salsa vegetation density and inundation frequency was established. Vegetation-observation quadrats were set at different positions on the tidal flat in May and October 2024, measuring the density of S. salsa and the corresponding surface elevation in the quadrats. Since the measured water-level process in the field was short and significantly affected by storms, making it difficult to calculate the annual inundation frequency, the annual-average inundation frequency was calculated by referring to the water-level process simulated by the JRM and combining the measured surface elevation of each quadrat. Additionally, the elevation at the position with the highest observed S. salsa density was taken as the most suitable elevation for the species’ growth to determine the position of the highest point in the S. salsa growth curve.
In the numerical model, the vegetation-growth process was simulated through the vegetation-growth curve (Equations 3, 4), and the seed-propagation process of S. salsa was simulated by random assignment (Equation 5), with the probability of vegetation-seed colonization selected based on previous experience (Wang et al., 2025). The vegetation effect in the model was reflected by increasing the bed roughness and adding flow resistance term in momentum equations in the vegetated area (Equations 1, 2). The increase in roughness weakened the current, enhanced sediment deposition, thereby changing the geomorphological erosion-deposition pattern and influencing vegetation growth, forming a bio-morphodynamic cycle.
The initial terrain in the model was the same as the unvegetated cases in the previous section. The simulation started on January 1, 2021 and stopped at the end of 2024. Controlled by the survival habits of S. salsa, the plant appeared on the higher tidal flats near the seawall. Due to the random distribution of S. salsa seeds in the model, the final distribution of the plant showed a patchy pattern. Without soft mattresses, the distribution range and density of S. salsa were basically uniform along the shoreline, while with mattresses, both the distribution range and density increased significantly. The sediment-promotion effect of the mattresses raised the tidal-flat elevation, making it more suitable for S. salsa to survive. At the same time, the uneven deposition intensity in the sheltered area due to the mattresses led to uneven vegetation distribution, with more vigorous S. salsa near the mattresses. Since the flood-tide direction was southward, more sediment was deposited on the south side of the sheltered area, resulting in a wider distribution of S. salsa communities on the south side. The simulated S. salsa distribution in the model was highly consistent with the real distribution in the field. We further compared the area of S. salsa coverage in the model with that in reality. Since the distribution of S. salsa at the edge of the salt marsh is very sparse, we took the grid points with 20% of the maximum biomass in the biomass distribution map as the salt marsh edge to count the distribution range of S. salsa in the model. The statistical results show that the relative error of the S. salsa distribution area in the model was 12.1%.
To verify the simulation accuracy of the numerical model in terms of geomorphology, three sections were selected within the sheltered area of the soft mattresses (as marked by dashed lines in Figures 7A, C, E). The bed elevation of the measured sections were compared with the simulation results in the cases with soft mattresses, which were shown in Figure 7F. It can be seen that after a certain period of geomorphological evolution, the model results generally reproduced the real coastal section morphology. The tidal flats on the landward side continued to accumulate sediment, and their elevation gradually increased. It led to a steeper cross-sectional slope compared to the initial bed surface. Ultimately, the simulated section morphology was highly similar to the measured section, especially on the north side, where the north soft mattress provided a stronger sediment deposition. However, for the middle and south sections, due to the large tidal channel swinging westward and invading the south soft mattress in the reality, there was a large deviation between the simulated elevation and the measured values at the seaward end of the sections.
Figure 7
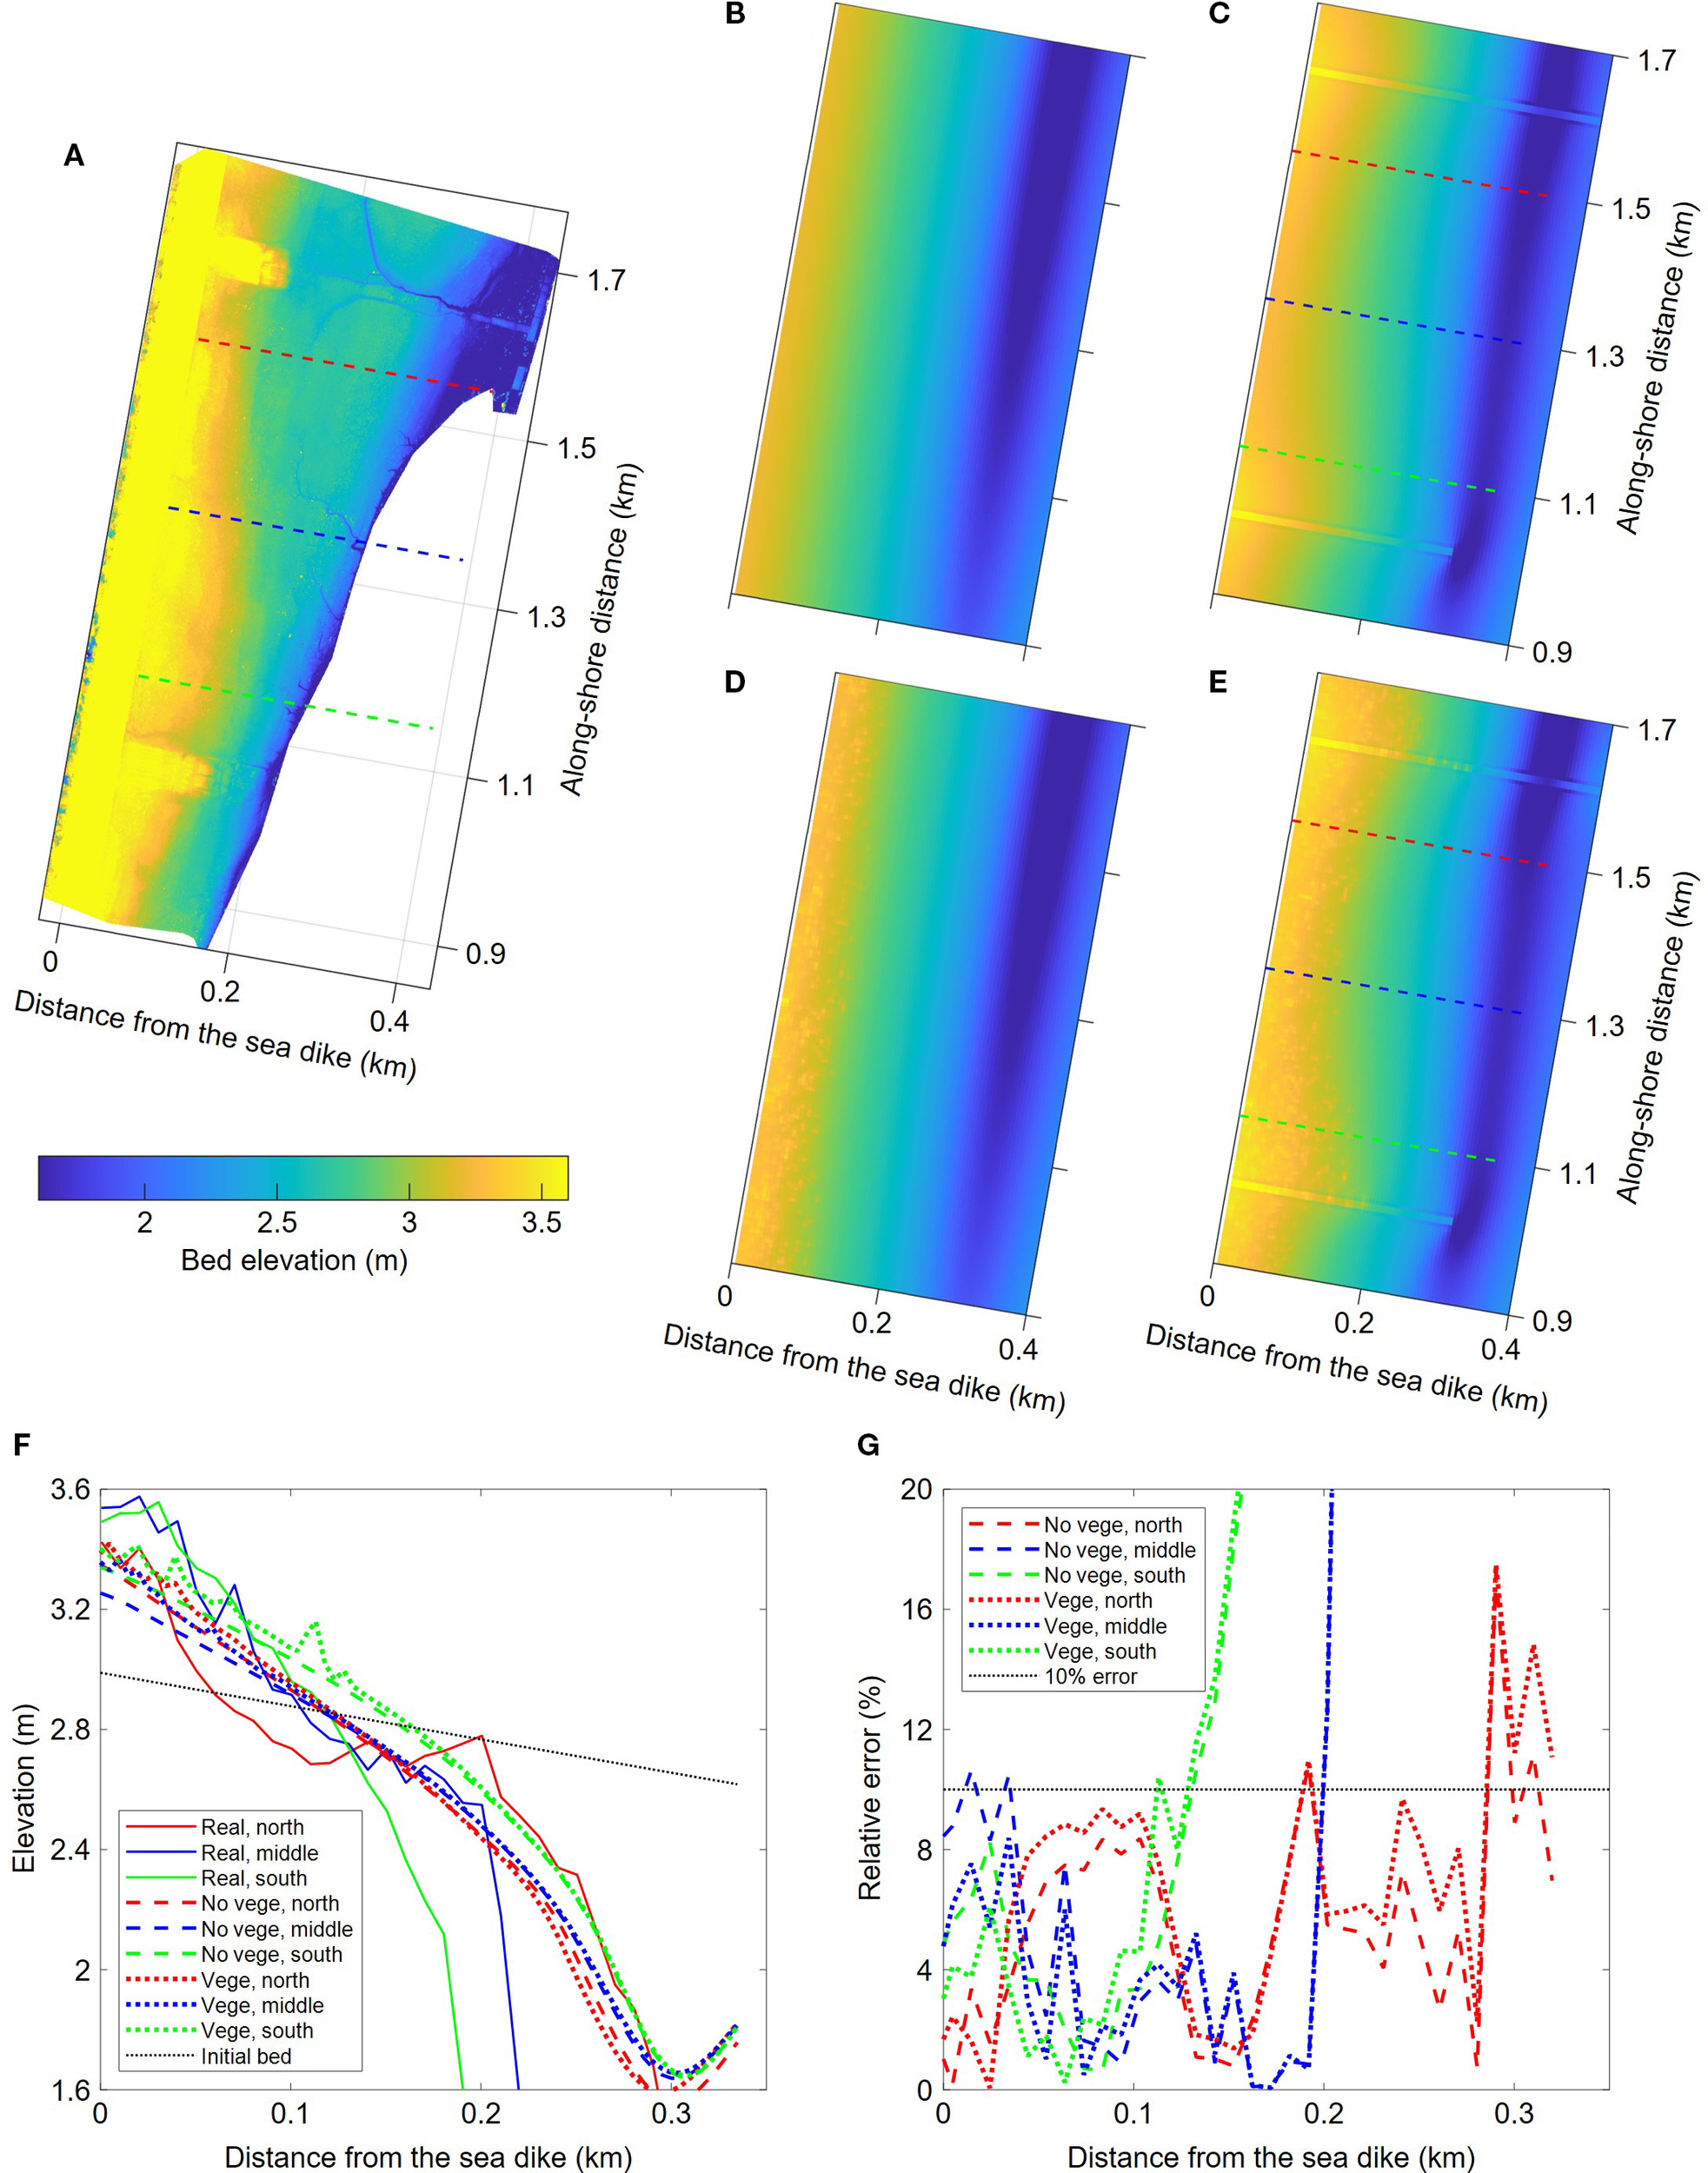
Comparisons between real topography and the model results: (A) UAV measured bed topography; (B–E) simulated bed topographies in the cases without soft mattress or vegetation, with soft mattress but no vegetation, without soft mattress but with vegetation, and with soft mattress and vegetation, respectively; (F) bed profiles in real and simulated tidal flats; and (G) the relative error of simulated bed elevation.
Compared with the case without vegetation, the presence of S. salsa further raised the elevation of the landward tidal flats, making the simulation results closer to the measured results (dotted lines in Figure 7F). By calculating the relative errors between the simulation results and the measured elevations in the two cases, it can be observed that the relative errors are generally less than 10% within the higher tidal flats range. Moreover, the elevation simulation results with vegetation are superior to those without vegetation.
Furthermore, we calculated the cumulative sedimentation volume in the high-tide flat area of the sheltered zone (Table 2). The actual sedimentation volume calculated based on the 2021 remote sensing images and 2024 measured topographic data was 1.59×10⁴ m3. The model calculation results show that the cumulative sedimentation volumes with and without vegetation in the cases with soft mattress condition were 1.767×10⁴ m³ and 1.336×10⁴ m³, respectively. The presence of S. salsa reduced the relative calculation error of the cumulative sedimentation volume from 16.12% to 10.98%.
Table 2
| Total deposition in model (×103 m3) | Total deposition in reality (×103 m3) | ||
|---|---|---|---|
| Engineering condition Ecological condition |
Without soft mattresses | With soft mattresses | With soft mattresses |
| With S. salsa | 9.68 | 17.67 | 15.93 |
| Without S. salsa | 5.51 | 13.36 | / |
Comparisons of total deposition in model and in reality.
The impact of salt marsh vegetation on coastal resilience
The change process of the average elevation within the sheltered area between the two soft mattresses under various conditions was shown in Figure 8. By comparing it with the offshore water level process, it can be seen that in the case without vegetation, there is an obvious corresponding relationship between the change trend of the average elevation and the strength of tidal dynamics. During the strong tide stage, when the tidal dynamics were strong and the maximum water level generally exceeded 4 m, the tidal flats without the protection of soft mattresses were severely eroded, and the elevation continued to decrease (red solid line in Figure 8B). It is consistent with the coastal erosion trend before the construction of soft mattresses in actual situations, which is induced by the migration of tidal channels. In the case with soft mattresses, due to the sediment-promoting effect of the soft mattresses, the average elevation of the sheltered area showed a slowly-increasing trend (blue solid line in Figure 8B). In the subsequent relatively weak tide stage, the tidal dynamics slightly weakened, and sediment was more likely to deposit. As a result, the tidal flats without soft mattresses showed a deposition trend (red solid line in Figure 8B), and the deposition rate became faster in the case with soft mattresses (blue solid line in Figure 8B). As the simulation progressed, the tidal dynamics at the offshore boundary went through another round of changes in strength, causing fluctuations in the change trend and rate of the elevation in the case without vegetation.
Figure 8
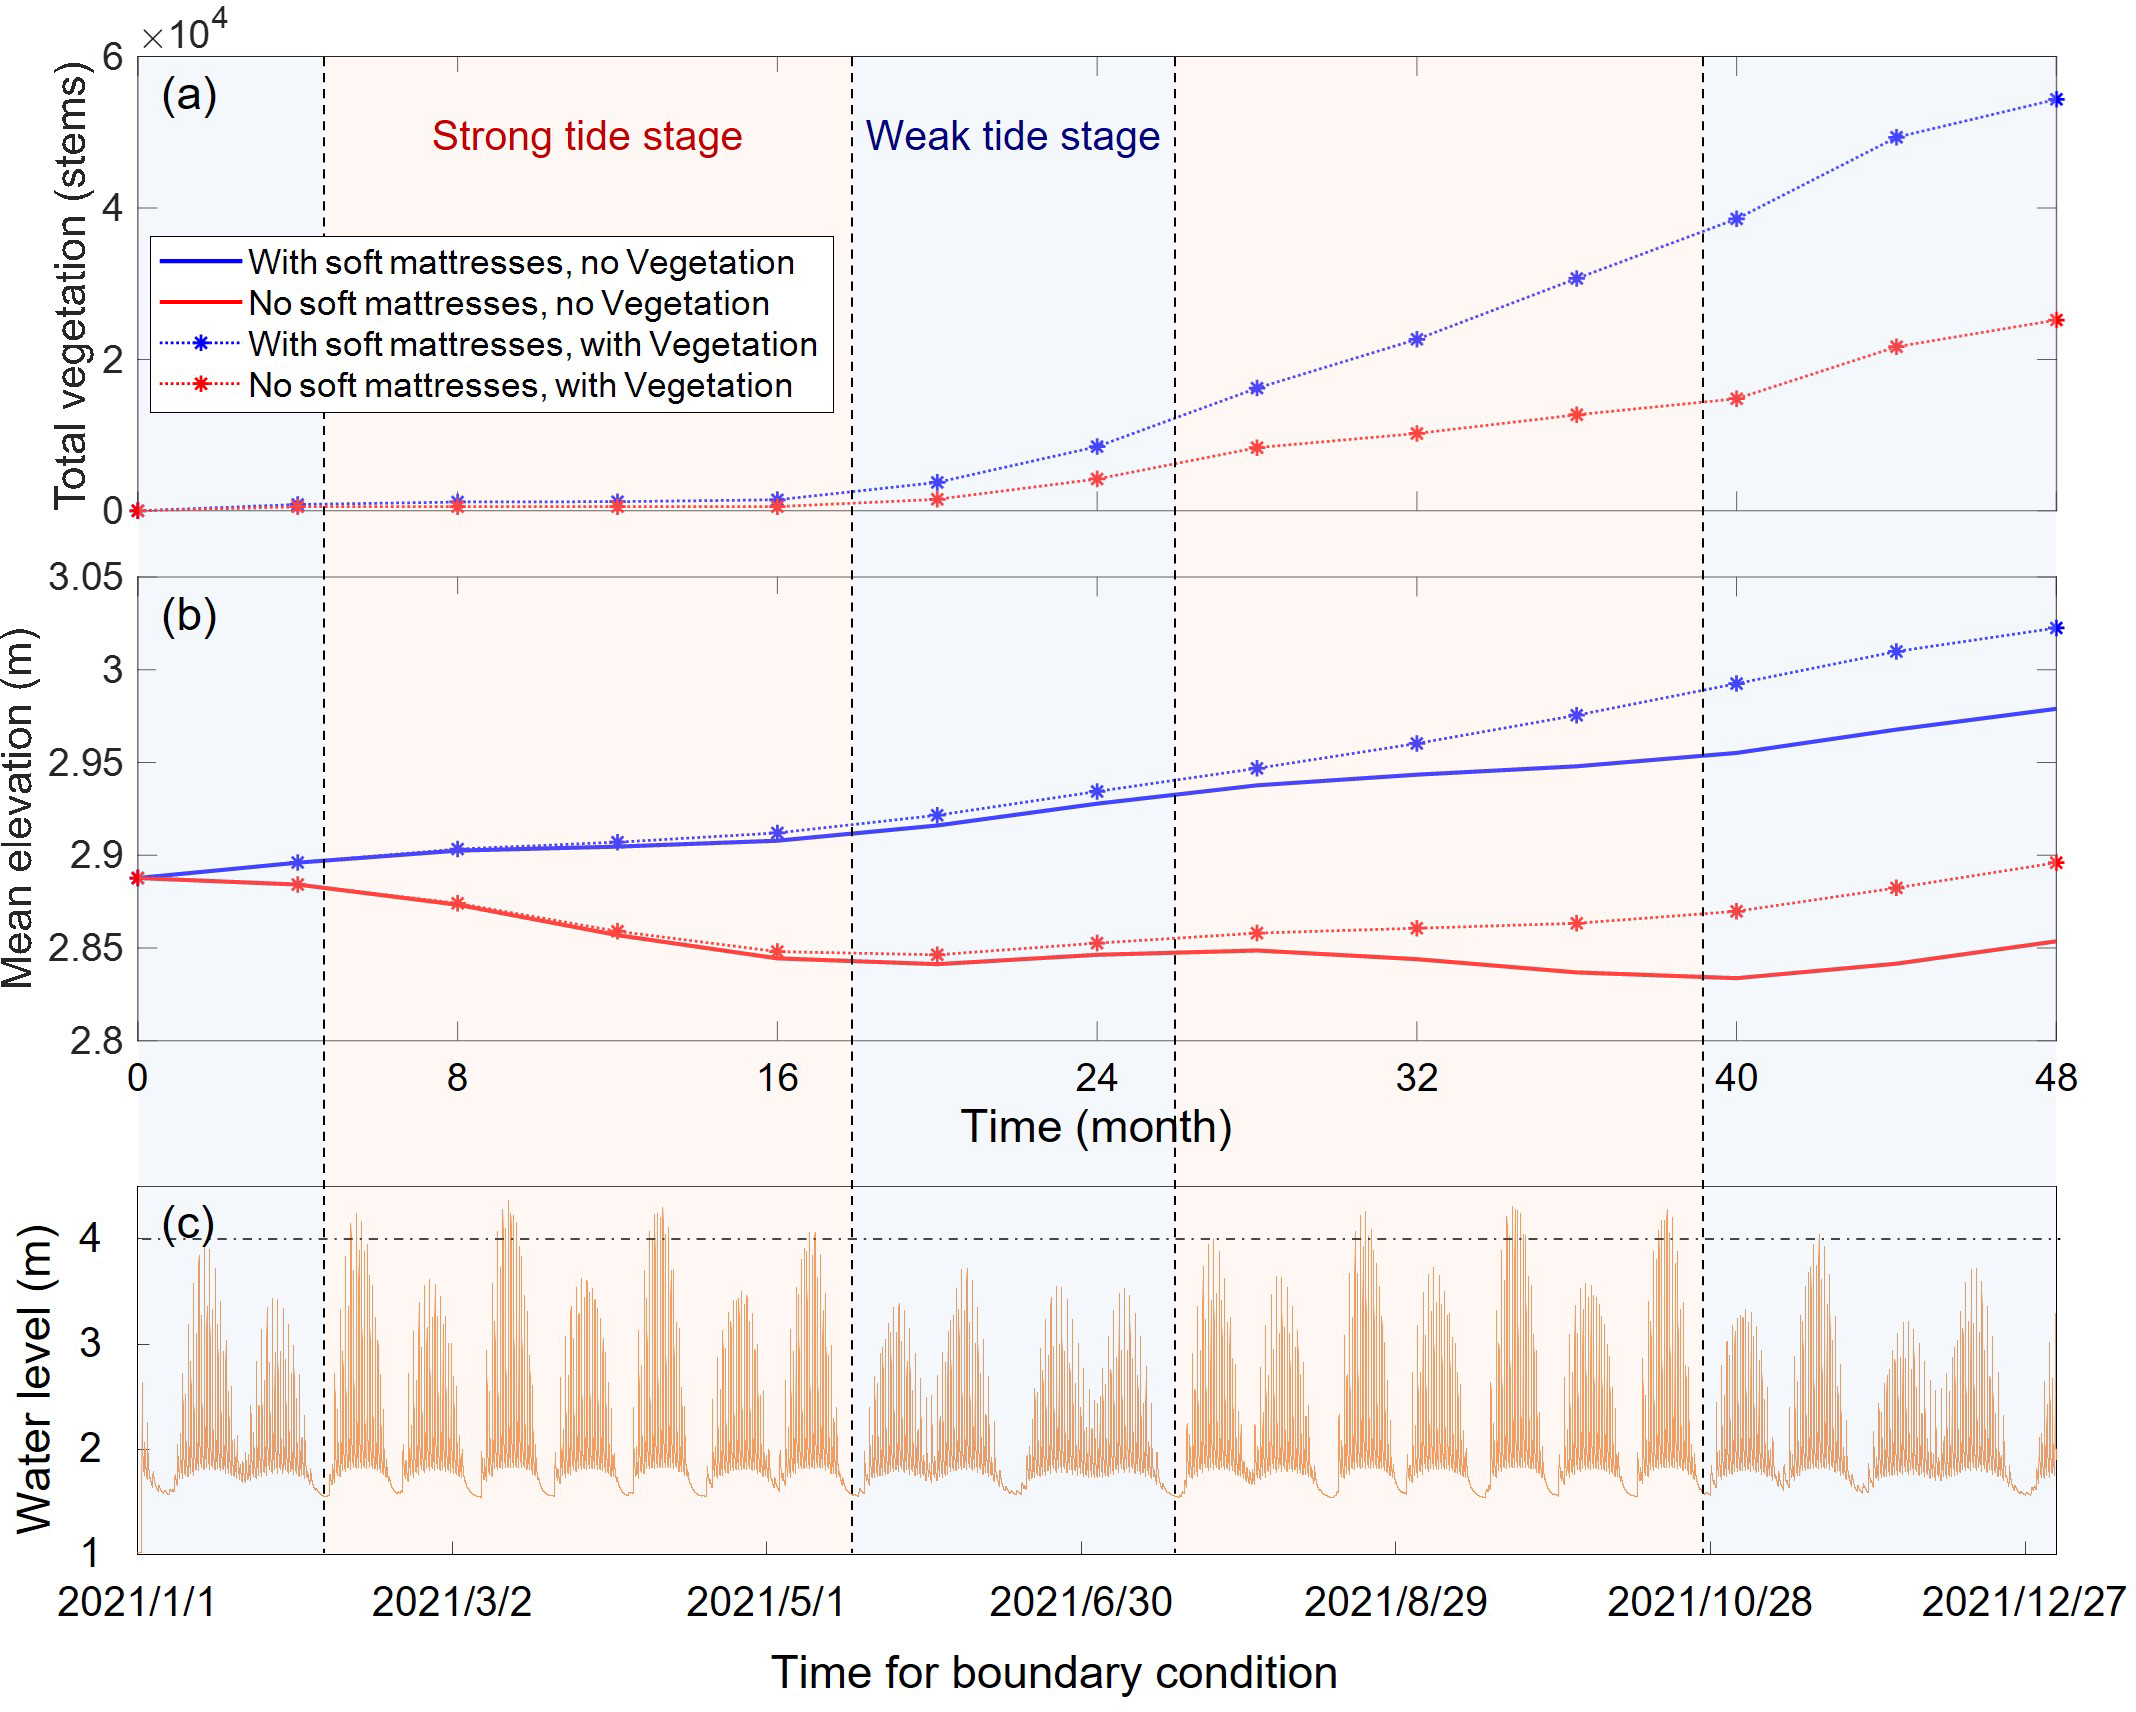
Temporal variations of (A) total vegetation volume and (B) mean bed elevation, compared with (C) the variation of water level provided at the seaward boundary.
In the case with S. salsa growth, the elevations with and without soft mattresses both increased significantly. In the case without soft mattresses, the final average elevation of the tidal flats even slightly exceeded the initial elevation, and the system changed to a deposition environment (red dotted line in Figure 8B). This indicated that S. salsa played a significant role in beach protection and sediment promotion. In addition, by comparing the change trends of elevation over time with and without vegetation, it can be found that the fluctuations in the elevation change process were significantly fewer in the cases with vegetation.
Specifically, in the case without soft mattresses, the presence of S. salsa eliminated the process of repeated rise and fall of the tidal flat elevation. In the first 16 months of the simulation, S. salsa was still in the stage of seed expansion and colonization, and had little impact on the surface elevation. Subsequently, as the elevation of the tidal flats slightly increased, the established S. salsa grew rapidly. During this period, the influence of S. salsa on the geomorphology also began to increase, which kept the elevation in a state of continuous accretion. Even under the condition of strong tidal dynamics from July to October, the vegetated tidal flats were still depositing (red dotted line in Figure 8B), while the non-vegetated tidal flats were in an erosive state (red solid line in Figure 8B). In the cases with soft mattresses, different from the fluctuating increase process of the bed elevation in the absence of vegetation, the presence of vegetation further increased the deposition between the soft mattresses and made the elevation increase at a constant rate (blue dotted line in Figure 8B).
The above-mentioned differences indicate that the presence of S. salsa improves the resilience of the coastal system, enabling it to maintain a stable change trend when the environmental dynamic conditions change. The reason is that when the tidal dynamics increase, the fully developed S. salsa can weaken the tidal energy by increasing the roughness, inhibit the erosion process, and keep the erosion-deposition trend stable during dynamic changes.
Discussion
The Relationship between S. salsa survival rate and artificial planting intensity
Reconstructing coastal vegetation populations through artificial planting is one of the main approaches for coastal ecological restoration. Different planting rates may affect the final outcomes of coastal ecological restoration, thereby influencing the coastal erosion-accretion pattern and the effect of coastal erosion protection. Based on the vegetation-dynamic geomorphology model established in the previous section, this section characterizes the intensity of artificial S. salsa planting by imposing different initial densities of vegetation seedlings, explores the relationship between the initial density of S. salsa and its final survival rate, and provides guidance for S. salsa ecological restoration projects.
In the actual implementation of S. salsa ecological restoration projects, seeds were often sown by UAV or other artificial means. In this model, the intensity of S. salsa seed establishment was determined by the seed establishment probability parameter (Equation 5), which represented the proportion of grid points in the entire calculation area that would be colonized by S. salsa seeds. After seed establishment, the growth process of S. salsa was governed by Equation 3 and Equation 4. Therefore, the process of artificial intervention in S. salsa seed establishment (i.e., the intensity of artificial S. salsa planting) could be characterized by changing the seed establishment probability in the model. During the actual process of sowing seeds, the intensity or density could be fully controlled. For instance, a highly intensive manual seeding method could be used to create a very dense distribution of seeds. Accordingly, in our model, we set up 5 groups of seed establishment probabilities with a wide range of variation (e.g., 5%, 10%, 20%, 40%, and 80%) for sensitivity analysis. The generalized tidal flat topography under the condition with soft mattress shown in Figure 5B was used as the initial topography for simulation. The topographic evolution and vegetation distribution results after four years of simulation were shown in Figure 9.
Figure 9
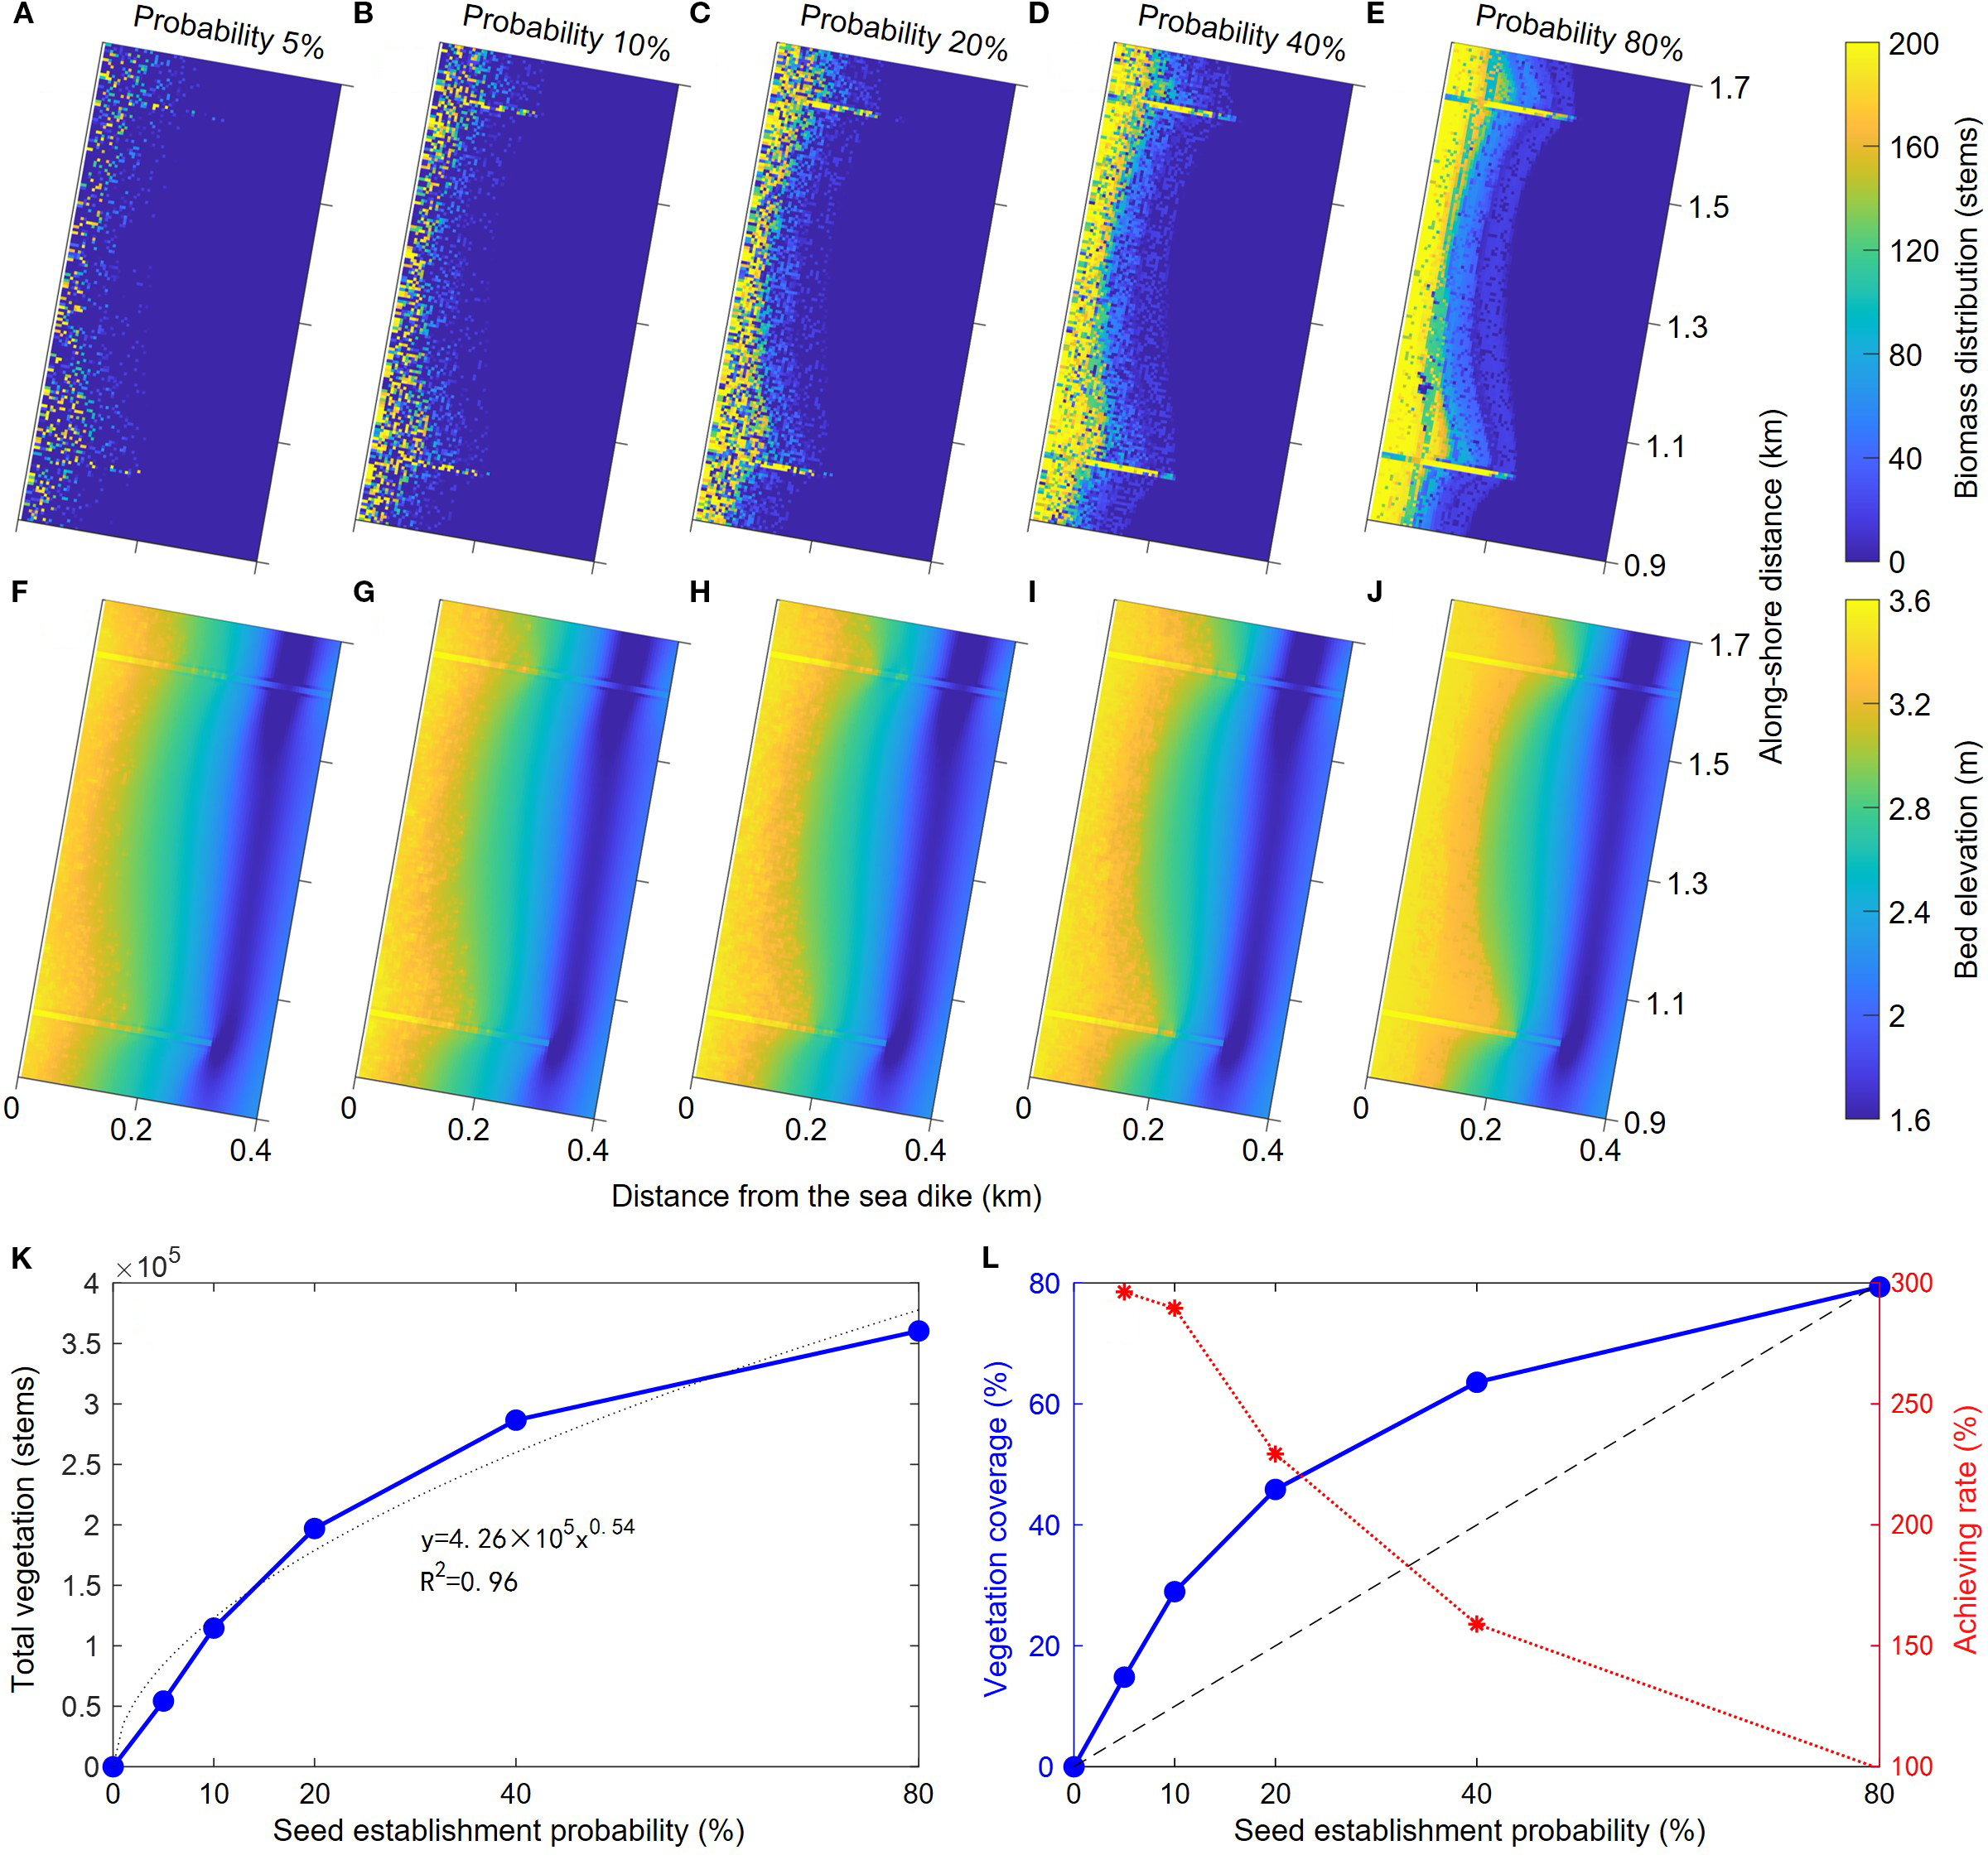
Comparisons of bed topography and vegetation distribution in cases with different seed establishment chance: (A–E) the biomass distribution of different cases, (F–J) the bed topography of different cases, (K) the variation of total vegetation as a function of seed establishment probability, and (L) the variations of vegetation coverage and final achieving rate as a function of seed establishment probability.
As the seed establishment probability improved, the intensity of artificial S. salsa planting increased, and the final distribution density and range of S. salsa populations both expanded (Figures 9A–E). For areas already colonized by S. salsa seeds, the final growth degree of S. salsa plants was determined by the local bed elevation and corresponding inundation frequency. Thus, in the high beach, S. salsa often reached its maximum biomass. As the bed elevation decreases seaward, the density of S. salsa vegetation per unit area also decreased. Additionally, due to the current-weakening effects of S. salsa, the degree of sediment deposition on the tidal flats increased with the higher seed establishment probability (Figures 9F–J). In the case of an 80% establishment probability, a distinct elevation change formed at the edge of the S. salsa growth area, creating a landform similar to a steep bank (Figure 9J). For cases with relatively low establishment probabilities, uneven S. salsa population distribution and topographic undulations formed at the edge of the salt marsh.
Further, we calculated the total vegetation biomass and corresponding vegetation coverage ratio within the sheltered area of soft mattresses under different S. salsa seed establishment probabilities (Figures 9K, L). For low establishment probabilities, the total S. salsa biomass increased approximately linearly with the rising probability, but as the probability further increased, the growth trend of total biomass gradually diminished. Overall, the plant biomass in the sheltered area exhibited a power function growth trend with the S. salsa seed establishment probability, and the vegetation coverage showed the same trend (Figures 9K, L). On the other hand, vegetation coverage could also be regarded as the final S. salsa coverage range achieved after seed establishment. Thus, we calculated the achievement rate of S. salsa coverage, defined as the ratio of the final vegetation coverage to the initial seed establishment probability. The dashed line in Figure 9L represented the case where the seed establishment probability equaled the final vegetation coverage (i.e., all sown seeds were established without outward expansion). It can be seen that the final vegetation coverage area exceeded the initial establishment probability, so the achievement rate of coverage was generally above 100%. When the establishment probability was low, the achievement rate was as high as ~300%, while, it decreased as the seed establishment probability increased. Therefore, relevant studies indicated that during coastal salt marsh ecological restoration, a higher degree of artificial intervention in vegetation expansion is not necessarily better. This view is also evident in other coastal ecosystems (Silliman et al., 2015). Although greater intervention is widely designed to achieve higher vegetation coverage, it can also restrict the natural expansion process of vegetation to some extent, reducing the efficiency of ecological restoration. In the present study, the negative correlation between the colonization probability of S. salsa and its ultimate achievement rate reflects a trade-off between vegetation expansion and environmental carrying capacity. Indeed, intraspecific competition for nutrients could sufficiently strong to cancel off further expansion when a certain biomass threshold is surpassed (Huang et al., 2022). This could especially the case for S. salsa, which is an annual species with a relatively low colonization ability with shallow and sparse roots (Zhang et al., 2023).
Influence of offshore sediment supply on coastal ecological restoration and erosion protection
Under the influence of global climate change and human activities, most coastal areas worldwide faced sea-level rise and reduced offshore sediment supply. Offshore sediment supply was a prerequisite for coastal erosion protection and ecological environment conservation. When offshore sediment supply was insufficient, the coast tended to be in a state of erosion, prone to shoreline retreat, and unconducive to the stability and restoration of coastal ecosystems. To compare the coastal erosion-accretion evolution and salt marsh vegetation succession processes under different sediment supply conditions, we set different offshore suspended sediment concentrations (SSC: 0, 0.2, 0.4, 0.8 g/L) and conducted a comparative analysis of the geomorphological and vegetation evolution processes within the sheltered area under the soft mattress condition (Figure 10).
Figure 10
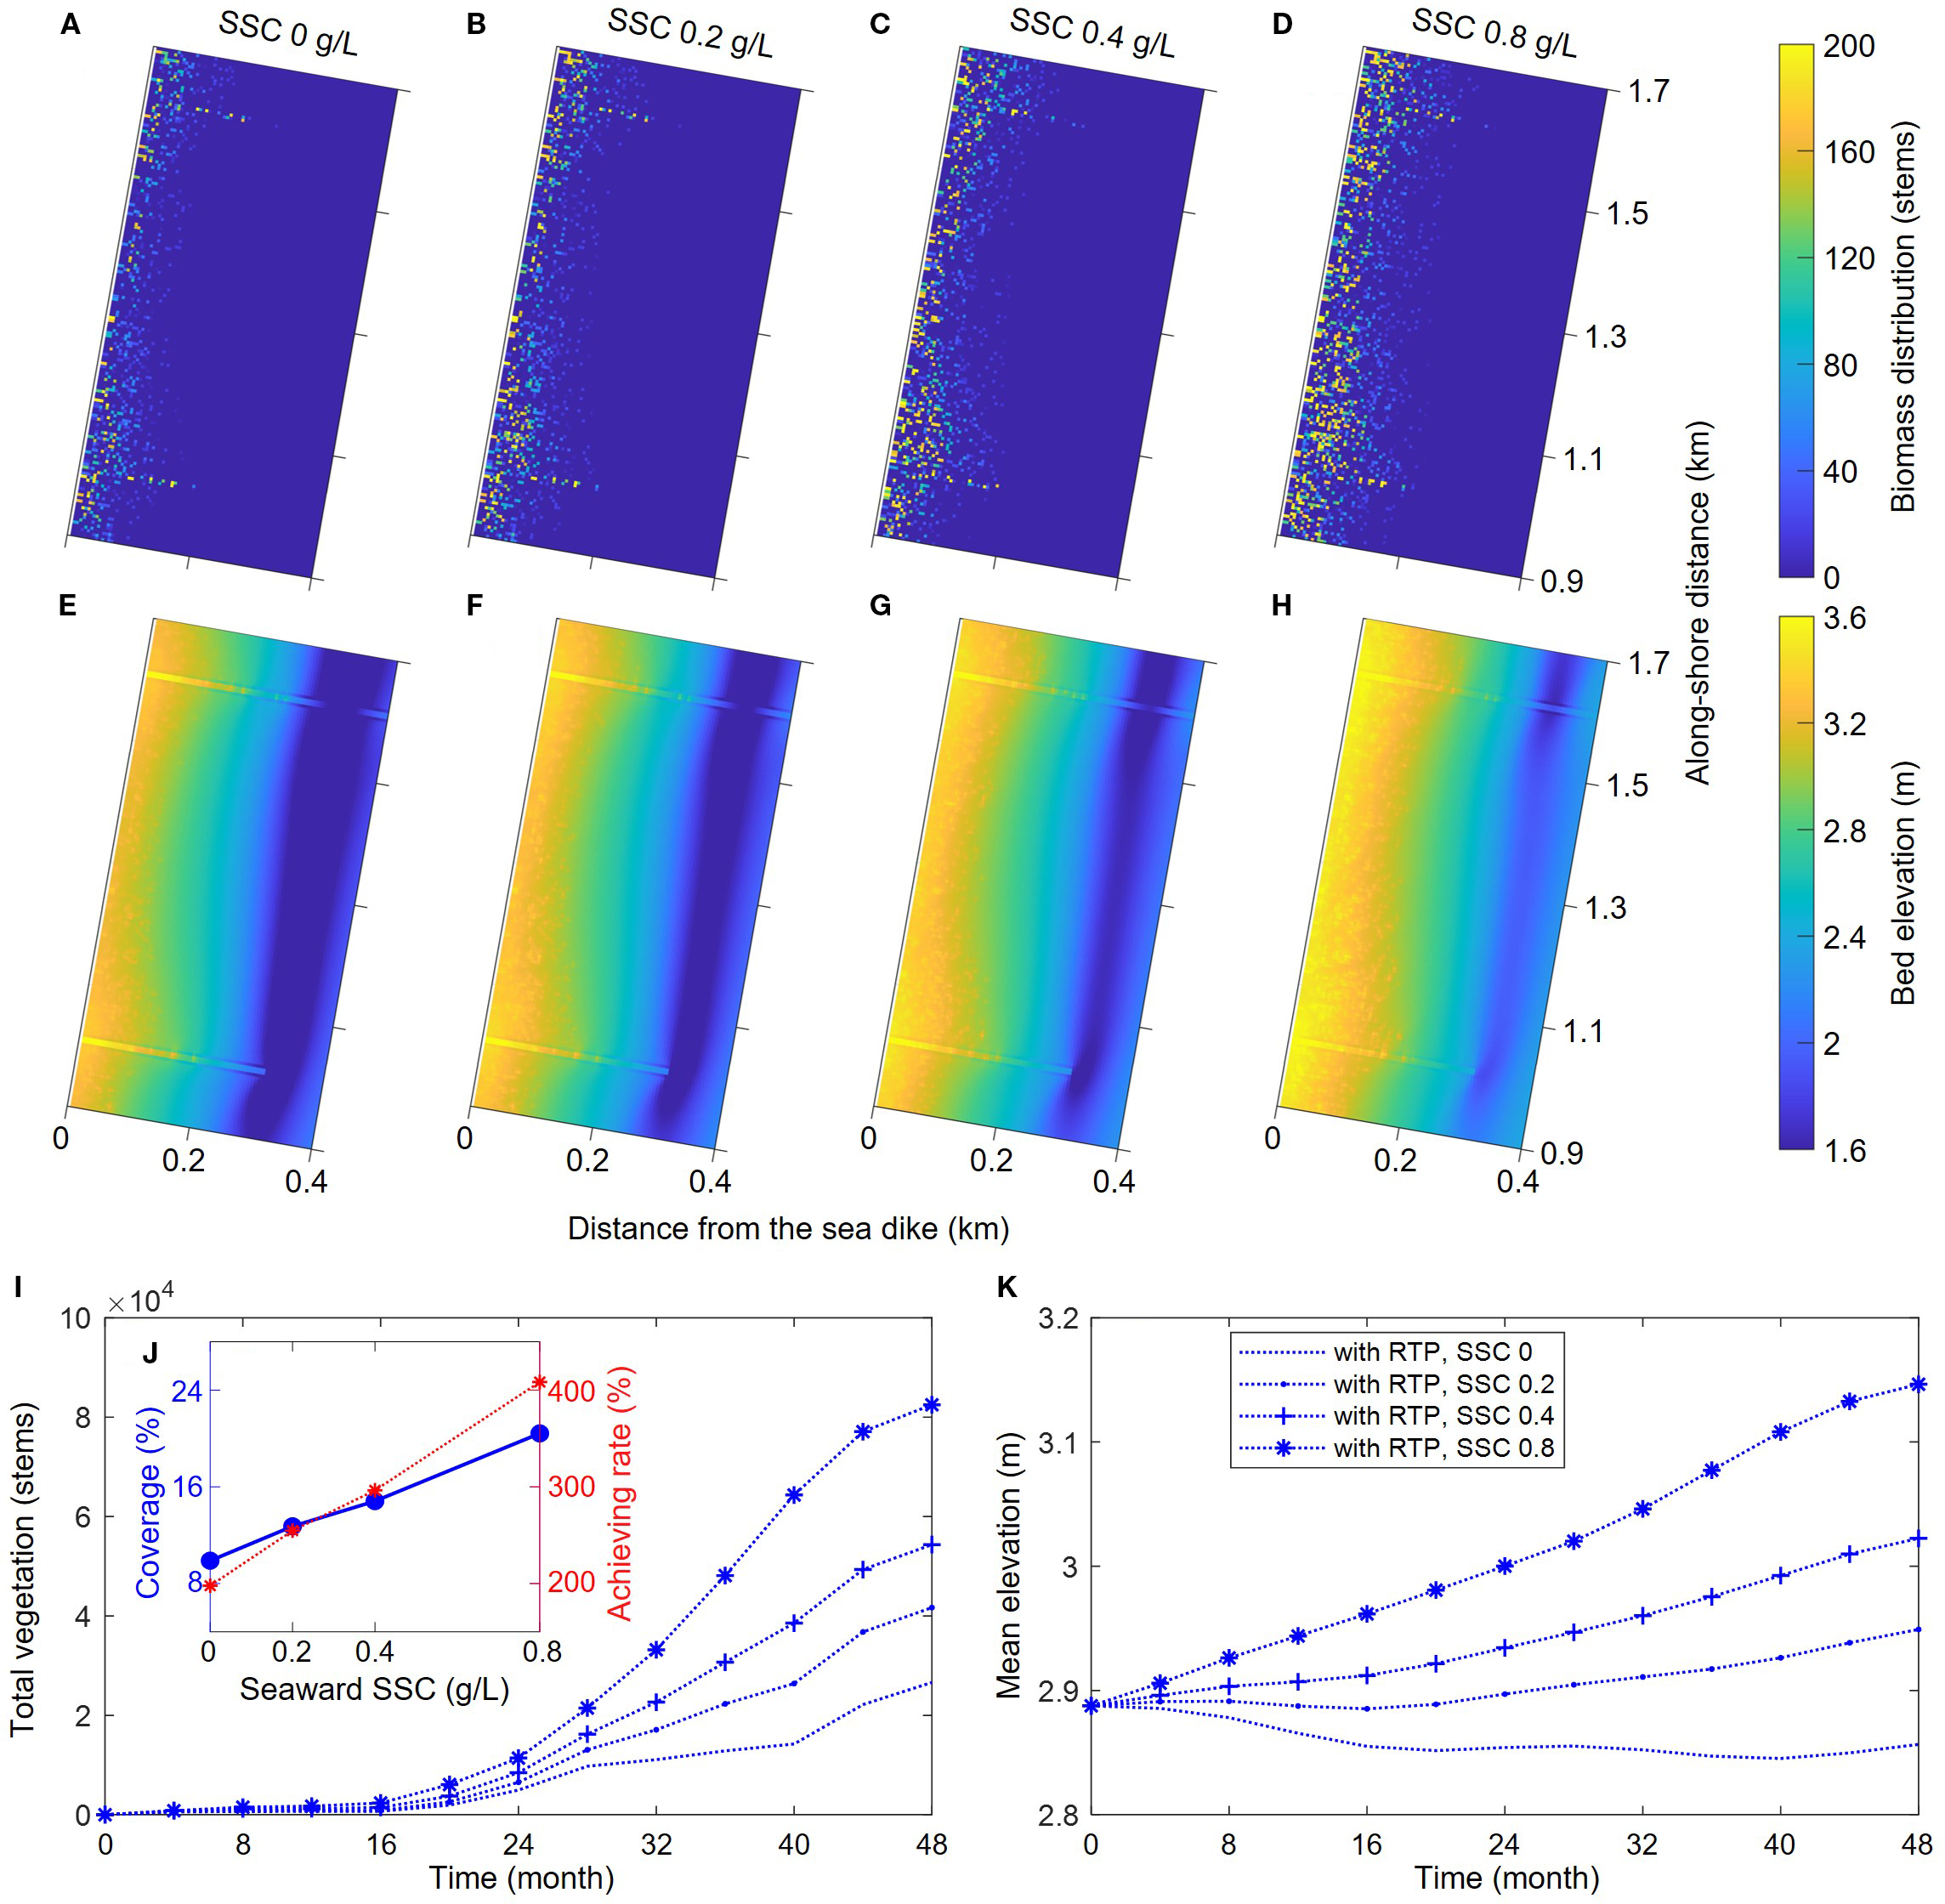
Comparisons of bed topography and vegetation distribution in cases with different seaward SSC: (A–D) the biomass distribution of different cases, (E–H) the bed topography of different cases, (I) the variation of total vegetation as a function of time, (J) the variations of vegetation coverage and final achieving rate as a function of seaward SSC, and (K) the variation of mean bed elevation as a function of time.
This group of models all considered the S. salsa model with a seed establishment probability of 0.05 for simulation. Although the seed establishment probability was the same across groups, different offshore SSC values ultimately led to different S. salsa distribution ranges (Figures 10A–D). The reason was that as the offshore SSC increased, the overall deposition degree of the tidal flat also increased, and the rise in bed elevation was more suitable for S. salsa growth, resulting in higher biomass and density in the initially colonized areas. For areas with originally lower elevations, the beach elevation increase caused by high sediment concentration also made a larger area suitable for S. salsa seed establishment, so the final distribution range of S. salsa increased with the rising offshore SSC (Figures 10I, J).
By calculating the total S. salsa biomass within the sheltered area of soft mattresses, we found that both the total biomass and the final coverage of S. salsa populations increased linearly with the offshore SSC. Similarly, we calculated the achievement rate of S. salsa coverage (all groups were calculated based on an initial seed establishment probability of 5%). The results showed that the achievement rate of coverage also increased linearly with the offshore SSC (Figure 10J). When the offshore SSC was 0.8 g/L, a 5% seed establishment probability finally achieved a 20% coverage, with an achievement rate exceeding 400%, indicating that sufficient sediment supply could significantly improve the efficiency and survival rate of artificially planted S. salsa, contributing to enhancing the resilience of ecosystem restoration.
The increase in offshore SSC also significantly improved the coastal erosion-accretion pattern (Figures 10E–H). When the offshore SSC was zero, the tidal flat within the sheltered area was generally in an erosive state, with the average elevation continuously decreasing (Figure 10K). Due to the smaller density, and distribution range of S. salsa in this case, the rate of bed elevation decreases varied with the intensity of tidal dynamics. As the offshore SSC increased, the sheltered area gradually transitioned from erosion to deposition, and the growth and expansion of S. salsa populations were faster, making the rate of bed elevation change no longer dependent on tidal dynamics, which highlighted the important role of salt marsh vegetation in enhancing coastal resilience. The simulation results are consistent with the actual observation results, from which it is evident that sediment supply plays a crucial role in coastal saltmarsh restoration globally (Liu et al., 2021). Adequate sediment supply enables marsh surfaces to accrete vertically, allowing them to keep pace with sea-level rise, while also promoting the seaward expansion of salt marshes (Ladd et al., 2019; Mei et al., 2023; Liu et al., 2025). For example, in Great Britain the northern saltmarsh under sediment-rich condition exhibits expansion while southern saltmarsh under sediment-starved condition suffers from erosion, which suggests the importance of sediment supply (Ladd et al., 2019).
Synergistic effect of engineering and ecological measures
Through the simulation of the vegetation-dynamic geomorphology model in this study, we found that the simultaneous implementation of engineering measures (e.g., construction of soft mattresses) and ecological measures (e.g., reconstruction of S. salsa populations) in coastal erosion protection can better enhance the effect of coastal erosion protection and facilitate coastal ecosystem restoration. On the one hand, as a flexible engineering structure, the soft mattress can change the flow direction and velocity, forming a weak current zone within its sheltered area, which significantly reduces the erosive force of tidal currents and waves, increases beach elevation, and reduces the flooding frequency in the sheltered area, better meeting the growth needs of S. salsa. On the other hand, S. salsa plants further weaken flow energy by increasing bed roughness, stabilize sediments, reduce erosion, and enhance the ability of coastal landforms to maintain stability under changing environmental dynamic conditions, significantly improving coastal system resilience. The model results show that when the soft mattress and S. salsa act together, the cumulative deposition volume in the high-tide flat area of the sheltered area is 1.767×10⁴ m³, which is 32.26% higher than that of single engineering measures and 82.54% higher than that of single ecological measures (Table 1), demonstrating the synergistic effect between engineering and ecological measures. Additionally, artificial intervention in S. salsa seed establishment and increasing offshore sediment supply can significantly enhance S. salsa population coverage and assist in the recovery of S. salsa ecosystems.
The effects of coastal erosion protection and ecological restoration will also be influenced by environmental dynamic conditions and the types of salt marsh vegetation, thereby causing differences in the response mechanisms of eco-morphodynamic changes to environmental changes in different regions. For example, previous study finds that increased tidal range can enhance the stability of wetlands, which is attributable to vegetation growth range that expands with tidal range in USA (Kirwan and Guntenspergen, 2010). However, the survival range of saltmarsh may decrease in China due to large-scale reclamation (Tian et al., 2016). Vegetation species also exert a strong influence on tidal flat and saltmarsh morphodynamic evolution. Dense vegetation (e.g., S. alterniflora) tends to cause stronger flow deviation while sparse vegetation (e.g., Salicornia or S. salsa) induces weaker flow deviation (Bouma et al., 2013). Consequently, due to this flow deviation difference, denser vegetation hinders sediment transport towards saltmarsh interiors (Gourgue et al., 2024; Wang et al., 2025).
The Tiaozini tidal flat demonstrated in this study is merely one practical application among numerous environment - friendly coastal protection schemes. In Table 3, we summarize 4 typical “Nature - based coastal erosion protection” measures and compare their scheme design, coastal erosion protection effect, and ecosystem protection effect. It can be seen that various schemes adapt to local environmental and ecological conditions and artificially shape and intervene in coastal areas through a combination of ecological and engineering methods. All kinds of schemes can not only improve the coastal erosion resistance but also help restore or enhance the adaptability of the local ecosystem. For example, artificial tidal pools in Singapore promote algae colonization and increase animal diversity. Future protection measures will pay more attention to exploring the multiple benefits of ecosystems. Not only will we focus on improving biodiversity, but we will also further consider strengthening ecosystem service functions, such as improving water quality and increasing carbon sequestration, to achieve deep integration of coastal protection and ecosystem health.
Table 3
| Project cases | Location | Scheme design | The effect of coastal erosion protection | The effect of ecosystem protection |
|---|---|---|---|---|
| This study | Tiaozini tidal flat of Jiangsu Province, China | Construction of soft mattresses and reconstruction of S. salsa populations. | The cumulative deposition volume in the sheltered area is 32.26% higher than that of single engineering measures and 82.54% higher than that of single ecological measures (Table 1). | The protective effect of the soft mattresses resulted in a doubling of the vegetation biomass (Figure 8A). |
| “Coastbusters” projects (Boulenger et al., 2024) | The Belgian Part of the North Sea | Develop nature-based coastal protection by favoring subtidal mussel bed establishment on the seafloor through typical longline aquaculture techniques. | The area sheltered by coastal sandbanks was dominated by fine-muddy sand, the area more exposed to the open sea was dominated by more sandy sediments. | The biological abundance and species richness of the sheltered area are 2.57 times and 1.57 times those of the exposed area, respectively. |
| Artificial Tidal Pools (Moosavi, 2017) | Singapore | Different types of tidal pool units were designed consisting of fabricated concrete modules, and were positioned in a randomized layout along a linear stretch of a seawall. | The protective effect is more evident in the ecological enhancement of existing hard infrastructure, thereby assisting in alleviating coastal erosion. | Turf algae colonized within the first week, followed by diverse algae assemblages. Faunal diversity/abundance increased over time, with species including periwinkle/nerite snails, crabs, tube/fire worms, feather stars, and bead anemones detected. |
| Living Breakwater (Moosavi, 2017) | Staten Island, New York, U.S. | A combination of stepped shorelines and dunes, tidal flats, intertidal and subtidal breakwaters, living shorelines and home elevation in order to create multiple lines of defense mechanisms that are less likely to fail singularly. | Reduce the risk of coastal flooding and erosion. Moreover, in areas with severe land loss, it can also assist in the restoration of beaches by leveraging sediment dynamics. | Breakwaters’ lee sedimentation zones supported muddy bottom-loving species (e.g., eelgrass, hard clams). EConcrete units catalyzed oyster reef development-oysters’ biogenic calcium carbonate deposits enhanced infrastructure lifespan while providing reef habitat for juvenile fish and shellfish. |
Comparisons of total deposition in model and in reality.
Limitations and future work
Although this study simulates coastal geomorphological evolution and S. salsa population succession under the synergistic effect of engineering and ecological measures through a generalized model, many physical processes are greatly simplified or ignored due to model limitations. For example, the model mainly considers tidal dynamics, excluding the influence of strong winds or storm surges, and does not account for the effects of flocculation and salinity on sediment transport processes, leading to significant deviations between simulated flow velocity, water level, and SSC and field measurement data. This is particularly important for open-coast areas like Tiaozini, as extreme weather often has a strong impact on geomorphic features and the ecological health of salt marshes in a short period of time (Arkema et al., 2013; Wei et al., 2022; Wang et al., 2024). On the other hand, the model only considers the growth and establishment process of the single species S. salsa, ignoring the influence of environmental stresses such as salinity and temperature, and does not simulate its competition with invasive species like S. alterniflora. The processes such as growth, death, competition and succession among different species will affect the water flow dynamics conditions and the critical erosion shear stress of the tidal flat soil, thereby altering the long-term erosion and deposition evolution pattern of the tidal flat landscape (Geng et al., 2023; Xie et al., 2023). In fact, after the comprehensive removal of S. alterniflora, recurrence trends of S. alterniflora have been observed in many coastal areas of China. In this context, exploring the recurrence rate of S. alterniflora and determining whether it will harm local species will be one of the key focuses of future research.
Therefore, based on the current vegetation-dynamic geomorphology model, future research can be deepened and expanded in multiple dimensions. In terms of physical process simulation, storm surge models can be integrated to improve the wind wave-tide coupling mechanism, analyze bed topography evolution and ecosystem succession under extreme conditions such as typhoon, and optimize the dynamic parameterization scheme of sediment transport to enhance the accuracy of deposition simulation in high-turbidity environments. Ecological process research can focus on constructing multi-species competition modules, quantifying the interspecific competition effects between S. salsa and S. alterniflora, and simultaneously coupling vegetation physiological response models to dynamically characterize the impact of environmental factors on S. salsa growth. At the multi-scale coupling level, variable grid technology can be used to optimize regional-local nested models, analyze the influence of tidal channel systems on water-sediment transport, and simulate the long-term evolution of coastal systems in combination with climate change scenarios (e.g., sea-level rise, increased extreme weather). In engineering applications, synergistic optimization of soft mattress configurations and vegetation arrangements can be explored, the process of S. alterniflora control and ecological restoration can be simulated, and interdisciplinary directions such as carbon sink function quantification and integration of artificial intelligence and models can be expanded to provide more precise scientific support for coastal protection and ecological restoration.
Conclusions
Coastal erosion and ecosystem degradation are the two major threats facing the development of coastal areas, especially in regions that suffer from invasive species and insufficient sediment supply. This study focuses on the Tiaozini tidal flat in Jiangsu Province, China, and conducted on-site measurements and bio-morphodynamic coupling simulations. Its aim is to investigate how engineering measures (soft mattresses) and ecological engineering (native S. salsa) mutually influence coastal landform evolution and the capacity of ecosystem recovery. The main research results are as follows:
The soft mattresses can effectively promote coastal sedimentation and stabilize the tidal flat by deflecting water flow, reducing flow velocity, and weakening erosion force in the sheltered area, converting the local environment from an erosion zone to a deposition zone. Compared with the area without soft mattresses, the sediment deposition volume changed from -3681 m3 (erosion) to 9852 m3 (deposition). This confirms the crucial role of the soft mattress in coastal protection and beach conservation.
The presence of S. salsa can significantly enhance the resilience of the coast by increasing bed roughness, stabilizing sediments, and creating a more conducive environment for sediment deposition. Model simulations show that the high tidal flat covered by S. salsa can maintain continuous deposition even under strong tidal dynamic conditions. Compared with on-site measurements, the simulation error of the high tidal flat elevation was reduced. The relative error between the observed vegetation coverage area and the model simulation result is only 12.1%, confirming the rationality of the model for simulating vegetation ecological processes.
The combined application of soft mattress and S. salsa produces a significant synergistic effect, making the coastal restoration process more efficient. After four years of evolution in the model, the cumulative sediment volume in the high beach area reached 1.767×10⁴ m³, which was 32.26% higher than the situation using only the soft mattress and 82.54% higher than the situation using only S. salsa. In addition, moderate artificial planting intensity and sufficient offshore sediment supply significantly would increase the survival rate and coverage of S. salsa, highlighting the importance of matching coastal restoration engineering with natural processes.
This study clarifies the biophysical feedback mechanism between S. salsa and coastal landforms, proving the effectiveness of comprehensive engineering measures and ecological strategies for coastal erosion control and ecosystem restoration. These research results provide scientific basis for managing invasive species (such as S. alterniflora), optimizing artificial vegetation planting, and enhancing coastal restoration capabilities in the context of global change. Future research should refine the model by incorporating factors such as the impact of storms, competition among various species, and long-term climate scenarios, in order to further enhance the accuracy of the restoration strategies.
Statements
Data availability statement
The raw data supporting the conclusions of this article will be made available by the authors, without undue reservation.
Author contributions
LG: Conceptualization, Investigation, Writing – review & editing, Writing – original draft, Funding acquisition. ZD: Software, Data curation, Writing – original draft. YG: Writing – original draft, Methodology, Data curation. HC: Data curation, Writing – original draft, Methodology. PY: Supervision, Software, Writing – review & editing, Conceptualization, Methodology. ZZ: Funding acquisition, Project administration, Conceptualization, Writing – review & editing, Validation. JS: Methodology, Writing – review & editing, Funding acquisition.
Funding
The author(s) declare financial support was received for the research and/or publication of this article. This work was funded by the National Key R&D Program of China (2022YFC3106201), the National Natural Science Foundation of China (Grants 42206162, 42206164, 42361144873), and the Joint Funds of Natural Science Foundation of Zhejiang Province and Water Resources Department (Grant No. LZJWZ23E090005).
Conflict of interest
The authors declare that the research was conducted in the absence of any commercial or financial relationships that could be construed as a potential conflict of interest.
The author(s) declared that they were an editorial board member of Frontiers, at the time of submission. This had no impact on the peer review process and the final decision.
Generative AI statement
The author(s) declare that no Generative AI was used in the creation of this manuscript.
Any alternative text (alt text) provided alongside figures in this article has been generated by Frontiers with the support of artificial intelligence and reasonable efforts have been made to ensure accuracy, including review by the authors wherever possible. If you identify any issues, please contact us.
Publisher’s note
All claims expressed in this article are solely those of the authors and do not necessarily represent those of their affiliated organizations, or those of the publisher, the editors and the reviewers. Any product that may be evaluated in this article, or claim that may be made by its manufacturer, is not guaranteed or endorsed by the publisher.
References
1
An S. Q. Gu B. H. Zhou C. F. Wang Z. S. Deng Z. F. Zhi Y. B. et al . (2007). Spartina invasion in China: implications for invasive species management and future research. Weed Res.47(3), 183–191. doi: 10.1111/j.1365-3180.2007.00559.x
2
Arkema K. K. Guannel G. Verutes G. Wood S. A. Guerry A. Ruckelshaus M. et al . (2013). Coastal habitats shield people and property from sea-level rise and storms. Nat. Climate Change3, 913–918. doi: 10.1038/nclimate1944
3
Balke T. Bouma T. Horstman E. Webb E. Erftemeijer P. Herman P. (2011). Windows of opportunity: thresholds to mangrove seedling establishment on tidal flats. Mar. Ecol. Prog. Ser.440, 1–9. doi: 10.3354/meps09364
4
Baptist M. J. Babovic V. Rodríguez Uthurburu J. Keijzer M. Uittenbogaard R. E. Mynett A. et al . (2007). On inducing equations for vegetation resistance. J. Hydraulic Res.45, 435–450. doi: 10.1080/00221686.2007.9521778
5
Barbier E. B. Hacker S. D. Kennedy C. Koch E. W. Stier A. C. Silliman B. R. (2011). The value of estuarine and coastal ecosystem services. Ecol. Monogr.81, 169–193. doi: 10.1890/10-1510.1
6
Boulenger A. Lanza-Arroyo P. Langedock K. Semeraro A. Van Hoey G. (2024). Nature-based solutions for coastal protection in sheltered and exposed coastal waters: integrated monitoring program for baseline ecological structure and functioning assessment. Environ. Monit. Assess.196, 316. doi: 10.1007/s10661-024-12480-x
7
Bouma T. J. Friedrichs M. Klaassen P. van Wesenbeeck B. K. Brun F. G. Temmerman S. et al . (2009). Effects of shoot stiffness, shoot size, and current velocity on scouring sediment from around seedlings and propagules. Mar. Ecol. Prog. Ser.388, 293–297. doi: 10.3354/meps08130
8
Bouma T. J. Temmerman S. Van Duren L. A. Martini E. Vandenbruwaene W. Callaghan D. P. et al . (2013). Organism traits determine the strength of scale-dependent bio-geomorphic feedbacks: A flume study on three intertidal plant species. Geomorphology180, 57–65. doi: 10.1016/j.geomorph.2012.09.005
9
Burden A. Garbitt R. A. Evans C. D. Jones D. L. Cooper D. M. (2013). Carbon sequestration and biogeochemical cycling in a saltmarsh subject to coastal managed realignment. Estuarine Coast. Shelf Sci.120, 12–20. doi: 10.1016/j.ecss.2013.01.014
10
Chen Z. Y. Li B. Zhong Y. Chen J. K. (2004). Local competitive effects of introduced Spartina alterniflora on Scirpus mariqueter at Dongtan of Chongming Island, the Yangtze River estuary and their potential ecological consequences. Hydrobiologia528, 99–106. doi: 10.1007/s10750-004-1888-9
11
Chung C.-H. (2006). Forty years of ecological engineering with Spartina plantations in China. Ecol. Eng.27, 49–57. doi: 10.1016/j.ecoleng.2005.09.012
12
Costanza R. de Groot R. Sutton P. van der Ploeg S. Anderson S. J. Kubiszewski I. et al . (2014). Changes in the global value of ecosystem services. Global Environ. Change26, 152–158. doi: 10.1016/j.gloenvcha.2014.04.002
13
Daehler C. C. Strong D. R. (1994). Variable reproductive output among clones of Spartina alterniflora (Poaceae) invading San Francisco Bay, California: The influence of herbivory, pollination, and establishment site. Am. J. Bot.81, 307–313. doi: 10.1002/j.1537-2197.1994.tb15448.x
14
Deltares (2011). Delft3D-FLOW User Manual. 3.15 ed (Delft, The Netherlands: Deltares (WL).
15
Duarte C. M. Losada I. J. Hendriks I. E. Mazarrasa I. Marbà N. (2013). The role of coastal plant communities for climate change mitigation and adaptation. Nat. Climate Change3, 961–968. doi: 10.1038/nclimate1970
16
Fagherazzi S. Kirwan M. L. Mudd S. M. Guntenspergen G. R. Temmerman S. D’Alpaos A. et al . (2012). Numerical models of salt marsh evolution: Ecological, geomorphic, and climatic factors. Rev. Geophysics50, RG1002. doi: 10.1029/2011RG000359
17
Friedman G. M. Sanders J. E. (1978). Principles of Sedimentology (New York: Wiley), 378.
18
Gedan K. B. Silliman B. R. Bertness M. D. (2009). Centuries of human-driven change in salt marsh ecosystems. Annu. Rev. Mar. Sci.1, 117–141. doi: 10.1146/annurev.marine.010908.163930
19
Geng L. D’Alpaos A. Sgarabotto A. Gong Z. Lanzoni S. (2021). Intertwined eco-morphodynamic evolution of salt marshes and emerging tidal channel networks. Water Resour. Res.57, e2021WR030840. doi: 10.1029/2021WR030840
20
Geng L. Lanzoni S. D’alpaos A. Sgarabotto A. Gong Z. (2023). The sensitivity of tidal channel systems to initial bed conditions, vegetation, and tidal asymmetry. J. Geophysical Research: Earth Surface128, e2022JF006929. doi: 10.1029/2022JF006929
21
Gittman R. K. Scyphers S. B. Smith C. S. Neylan I. P. Grabowski J. H. (2016). Ecological consequences of shoreline hardening: A meta-analysis. BioScience66, 763–773. doi: 10.1093/biosci/biw091
22
Gong Z. Wang Z. Stive M. J. F. Zhang C. Chu A. (2012). Process-based morphodynamic modeling of a schematized mudflat dominated by a long-shore tidal current at the central Jiangsu coast, China. J. Coast. Res.28, 1381–1392. doi: 10.2112/JCOASTRES-D-12-00001.1
23
Gourgue O. Belliard J. P. Xu Y. Kleinhans M. G. Fagherazzi S. Temmerman S. (2024). Dense vegetation hinders sediment transport toward saltmarsh interiors. Limnology Oceanography Lett.9, 764–775. doi: 10.1002/lol2.10436
24
Gu Y. Han G. Geng L. Xie B. Zhang Y. Xie D. et al . (2025). Trade-offs between vegetation and sediment availability in shaping long-term tidal network morphodynamics. Front. Mar. Sci.12. doi: 10.3389/fmars.2025.1574276
25
Guo Y. Wu X. Pan C. Zhang J. (2012). Numerical simulation of the tidal flow and suspended sediment transport in the Qiantang Estuary. J. waterway port coastal ocean Eng.138, 192–202. doi: 10.1061/(ASCE)WW.1943-5460.0000118
26
He Q. Altieri A. H. Cui B. (2015). Herbivory drives zonation of stress-tolerant marsh plants. Ecology96, 1318–1328. doi: 10.1890/14-0937.1
27
He Q. Cui B. An Y. (2011). The importance of facilitation in the zonation of shrubs along a coastal salinity gradient: Zonation and facilitation along salinity gradients. J. Vegetation Sci.22, 828–836. doi: 10.1111/j.1654-1103.2011.01300.x
28
He Q. Silliman B. R. (2019). Climate change, human impacts, and coastal ecosystems in the Anthropocene. Curr. Biol.26, R1021–R1035. doi: 10.1016/j.cub.2016.06.018
29
Hu Z. Suzuki T. Zitman T. Uittewaal W. Stive M. (2014). Laboratory study on wave dissipation by vegetation in combined current-wave flow. Coast. Eng.88, 131–142. doi: 10.1016/j.coastaleng.2013.12.004
30
Huang H. Xu C. Liu Q. X. (2022). Social distancing” between plants may amplify coastal restoration at early stage. J. Appl. Ecol.59, 188–198. doi: 10.1111/1365-2664.14044
31
Hulskamp R. Luijendijk A. van Maren B. Moreno-Rodenas A. Calkoen F. Kras E. et al . (2023). Global distribution and dynamics of muddy coasts. Nat. Commun.14, 8259. doi: 10.1038/s41467-023-43819-6
32
Kindeberg T. Almström B. Skoog M. Olsson P. A. Hollander J. (2023). Toward a multifunctional nature-based coastal defense: a review of the interaction between beach nourishment and ecological restoration. Nordic J. Bot.2023, e03751. doi: 10.1111/njb.03751
33
Kirwan M. L. Guntenspergen G. R. (2010). Influence of tidal range on the stability of coastal marshland. J. Geophysical Research: Earth Surface115, F02009. doi: 10.1029/2009JF001400
34
Kirwan M. L. Megonigal J. P. (2013). Tidal wetland stability in the face of human impacts and sea-level rise. Nature504, 53–60. doi: 10.1038/nature12856
35
Kirwan M. L. Temmerman S. Skeehan E. E. Guntenspergen G. R. Fagherazzi S. (2016). Overestimation of marsh vulnerability to sea level rise. Nat. Climate Change6, 253–260. doi: 10.1038/nclimate2909
36
Kuai Y. Aarninkhof S. Wang Z. B. (2023). Diagnostic modeling of the shoreline variation along the Jiangsu Coast, China. Geomorphology425, 108581. doi: 10.1016/j.geomorph.2023.108581
37
Ladd C. J. Duggan-Edwards M. F. Bouma T. J. Pagès J. F. Skov M. W. (2019). Sediment supply explains long-term and large-scale patterns in salt marsh lateral expansion and erosion. Geophysical Res. Lett.46, 11178–11187. doi: 10.1029/2019GL083315
38
Lesser G. R. Roelvink J. A. Van Kester J. A. T. M. Stelling G. S. (2004). Development and validation of a three-dimensional morphological model. Coast. Eng.51, 883–915. doi: 10.1016/j.coastaleng.2004.07.014
39
Lewis M. A. Weber D. E. (2002). Effects of substrate salinity on early seedling survival and growth of Scirpus robustus Pursh and Spartina alterniflora Loisel. Ecotoxicology11, 19–26. doi: 10.1023/A:1013788928922
40
Li S. Xie T. Bai J. Cui B. (2022). Degradation and ecological restoration of estuarine wetlands in China. Wetlands42, 90. doi: 10.1007/s13157-022-01589-9
41
Li T. Xue L. Zhang X. Ma Y. Gong L. Shi B. et al . (2024). Harvested Spartina area performs better than native Scirpus in sedimentation and carbon preservation under storm surge. Ocean Coast. Manage.249, 107002. doi: 10.1016/j.ocecoaman.2023.107002
42
Liu W. W. Chen X. C. Strong D. R. Pennings S. C. Kirwan M. L. Chen X. et al . (2020). Climate and geographic adaptation drive latitudinal clines in biomass of a widespread saltmarsh plant in its native and introduced ranges. Limnology Oceanography65(6), 1399–1409. doi: 10.1002/lno.11395
43
Liu Z. Fagherazzi S. Cui B. (2021). Success of coastal wetlands restoration is driven by sediment availability. Commun. Earth Environ.2, 44. doi: 10.1038/s43247-021-00117-7
44
Liu S. Hu Z. Grandjean T. J. Wang Z. B. van Zelst V. T. Qi L. et al . (2025). Dynamics and drivers of tidal flat morphology in China. Nat. Commun.16, 2153. doi: 10.1038/s41467-025-57525-y
45
Liu M. Mao D. Wang Z. Li L. Man W. Jia M. et al . (2018). Rapid invasion of Spartina alterniflora in the coastal zone of mainland China: New observations from Landsat OLI images. Remote Sens.10, 1933. doi: 10.3390/rs10121933
46
Luijendijk A. Hagenaars G. Ranasinghe R. Baart F. Donchyts G. Aarninkhof S. (2018). The state of the world’s beaches. Sci. Rep.8, 6641. doi: 10.1038/s41598-018-24630-6
47
Luijendijk A. P. Ranasinghe R. De Schipper M. A. Huisman B. A. Swinkels C. M. Walstra D. J. R. et al . (2017). The initial morphological response of the Sand Engine: A process-based modelling study. Coast. Eng.119, 1–14. doi: 10.1016/j.coastaleng.2016.09.005
48
Marani M. Da Lio C. D’Alpaos A. (2013). Vegetation engineers marsh morphology through multiple competing stable states. Proc. Natl. Acad. Sci. United States America110, 3259–3263. doi: 10.1073/pnas.1218327110
49
Masselink G. Hughes M. Knight J. (2014). Introduction to coastal processes and geomorphology ( Routledge, London).
50
McInnes R. J. (2021). “ Coastal wetland restoration in the world: Needs, challenges and benefits,” in Coastal Wetlands Restoration: Public Perception and Community Development. Routledge, Oxfordshire, UK.
51
Mei X. Leonardi N. Dai J. Wang J. (2023). Cellular automata to understand the prograding limit of deltaic tidal flat. Eng. Appl. Comput. Fluid Mechanics17, 2234038. doi: 10.1080/19942060.2023.2234038
52
Min Y. Ke Y. Zhuo Z. Qi W. Li J. Li P. et al . (2025). Monitoring Spartina alterniflora removal dynamics across coastal China using time series Sentinel-1 imagery. Remote Sens. Environ.326, 114813. doi: 10.1016/j.rse.2025.114813
53
Moosavi S. (2017). Ecological coastal protection: pathways to living shorelines. Procedia Engineerin. 196, 930–938. doi: 10.1016/j.proeng.2017.08.027
54
Möller I. Spencer T. French J. R. Leggett D. J. Dixon M. (1999). Wave transformation over salt marshes: A field and numerical modelling study. Estuarine Coast. Shelf Sci.49, 411–426. doi: 10.1006/ecss.1999.0509
55
Mudd S. M. Howell S. M. Morris J. T. (2009). Impact of dynamic feedbacks between sedimentation, sea-level rise, and biomass production on near-surface marsh stratigraphy and carbon accumulation. Estuarine Coast. Shelf Sci.82, 377–389. doi: 10.1016/j.ecss.2009.01.028
56
Ouyang X. Guo F. (2016). Paradigms of mangroves in treatment of anthropogenic wastewater pollution. Sci. Total Environ.544, 971–979. doi: 10.1016/j.scitotenv.2015.11.060
57
Pan S. Gong Z. Geng L. Han G. (2025). How erosion of salt marsh edges leads to the loss of organic carbon: Insights from Jiangsu coast, China. Ocean Coast. Manage.264, 107642. doi: 10.1016/j.ocecoaman.2025.107642
58
Partheniades E. (1965). Erosion and deposition of cohesive soils. J. Hydraulics Division91, 105–139. doi: 10.1061/JYCEAJ.0001165
59
Paxton A. B. Shertzer K. W. Bacheler N. M. Kellison G. T. Riley K. L. Taylor J. C. (2020). Meta-analysis reveals artificial reefs can be effective tools for fish community enhancement but are not one-size-fits-all. Front. Mar. Sci.7. doi: 10.3389/fmars.2020.00282
60
Perricone V. Mutalipassi M. Mele A. Buono M. Vicinanza D. Contestabile P. (2023). Nature-based and bioinspired solutions for coastal protection: an overview among key ecosystems and a promising pathway for new functional and sustainable designs. ICES J. Mar. Sci.80, 1218–1239. doi: 10.1093/icesjms/fsad080
61
Pontee N. (2013). Defining coastal squeeze: A discussion. Ocean Coast. Manage.84, 204–207. doi: 10.1016/j.ocecoaman.2013.07.010
62
Rahbani M. (2015). A comparison between the suspended sediment concentrations derived from DELFT3D model and collected using transmissometer–a case study in tidally dominated area of Dithmarschen Bight. Oceanologia57, 44–49. doi: 10.1016/j.oceano.2014.06.002
63
Rupprecht F. Möller I. Evans B. Spencer T. Jensen K. (2017). Biophysical properties of salt marsh canopies: Quantifying plant stem flexibility and above ground biomass. Coast. Eng.120, 74–84. doi: 10.1016/j.coastaleng.2016.05.004
64
Schwarz C. Bouma T. J. Zhang L. Temmerman S. Ysebaert T. Herman P. M. J. (2015). Interactions between plant traits and sediment characteristics influencing species establishment and scale-dependent feedbacks in salt marsh ecosystems. Geomorphology250, 298–307. doi: 10.1016/j.geomorph.2015.09.013
65
Schwarz C. Ye Q. H. van der Wal D. Zhang L. Q. Bouma T. Ysebaert T. et al . (2014). Impacts of salt marsh plants on tidal channel initiation and inheritance. J. Geophysical Research: Earth Surface119, 385–400. doi: 10.1002/2013JF002900
66
Shu Y. Zhang Z. Wang Y. Chen J. Liu J. (2024). Coping with wave effects: Plasticity in physiology and biomechanics of Suaeda salsa colonization in the Yellow River Delta. Ecol. Eng.208, 107388. doi: 10.1016/j.ecoleng.2024.107388
67
Silliman B. R. Schrack E. He Q. Cope R. Santoni A. van der Heide T. et al . (2015). Facilitation shifts paradigms and can amplify coastal restoration efforts. Proc. Natl. Acad. Sci.112, 14295–14300. doi: 10.1073/pnas.1515297112
68
Temmerman S. Meire P. Bouma T. J. Herman P. M. Ysebaert T. De Vriend H. J. (2013). Ecosystem-based coastal defense in the face of global change. Nature504, 79–83. doi: 10.1038/nature12859
69
Tian B. Wu W. Yang Z. Zhou Y. (2016). Drivers, trends, and potential impacts of long-term coastal reclamation in China from 1985 to 2010. Estuarine Coast. Shelf Sci.170, 83–90. doi: 10.1016/j.ecss.2016.01.006
70
Turner R. E. McClenachan G. (2018). Reversing wetland death from 35,000 cuts: Opportunities to restore Louisiana’s dredged canals. PloS One13, e0193936. doi: 10.1371/journal.pone.0193936
71
Valiela I. (2009). Global coastal change. Blackwell Publishing, Malden, MA.
72
van Belzen J. Van De Koppel J. Kirwan M. L. van der Wal D. Herman P. M. Dakos V. et al . (2017). Vegetation recovery in tidal marshes reveals critical slowing down under increased inundation. Nat. Commun.8, 15811. doi: 10.1038/ncomms15811
73
Van der Wal D. Wielemaker-Van den Dool A. Herman P. M. (2008). Spatial patterns, rates and mechanisms of saltmarsh cycles (Westerschelde, The Netherlands). Estuarine Coast. Shelf Sci.76, 357–368. doi: 10.1016/j.ecss.2007.07.017
74
van Maanen B. Coco G. Bryan K. R. (2015). On the ecogeomorphological feedbacks that control tidal channel network evolution in a sandy mangrove setting. Proc. R. Soc. A: Mathematical Phys. Eng. Sci.471, 20150115. doi: 10.1098/rspa.2015.0115
75
Van Westen B. Luijendijk A. P. De Vries S. Cohn N. Leijnse T. W. B. De Schipper M. A. (2024). Predicting marine and aeolian contributions to the Sand Engine’s evolution using coupled modelling. Coast. Eng.188, 104444. doi: 10.1016/j.coastaleng.2023.104444
76
Wang Q. Cui B. Luo M. (2018). Effectiveness of microtopographic structure in species recovery in degraded salt marshes. Mar. pollut. Bull.133, 173–181. doi: 10.1016/j.marpolbul.2018.05.037
77
Wang J. Dai Z. Fagherazzi S. Lou Y. Mei X. Ma B. (2024). Large-scale sedimentary shift induced by a mega-dam in deltaic flats. Sedimentology71, 1084–1112. doi: 10.1111/sed.13168
78
Wang D. Gu C. Temmerman S. Belliard J.-P. Gourgue O. Xue L. et al . (2025). Coastal marsh vulnerability to sea-level rise is exacerbated by plant species invasion. Global Change Biol.31, e70058. doi: 10.1111/gcb.70058
79
Wang C. Temmerman S. (2013). Does biogeomorphic feedback lead to abrupt shifts between alternative landscape states?: An empirical study on intertidal flats and marshes. J. Geophysical Research: Earth Surface118, 229–240. doi: 10.1029/2012JF002474
80
Wang B. Zhang K. Liu Q.-X. He Q. Van De Koppel J. Teng S. N. et al . (2022). Long-distance facilitation of coastal ecosystem structure and resilience. Proc. Natl. Acad. Sci. United States America119, e2123274119. doi: 10.1073/pnas.2123274119
81
Wei W. Dai Z. Pang W. Wang J. Chen Y. Gao S. (2022). Frequency-dependent wave damping by tidal wetlands under storm conditions. J. Hydrology613, 128415. doi: 10.1016/j.jhydrol.2022.128415
82
Wei Y. Van Maanen B. Xie D. Jiang Q. Zhou Z. Schwarz C. (2024). Mangrove-saltmarsh ecotones: Are species shifts determining eco-morphodynamic landform configurations? Earth’s Future12, e2024EF004990. doi: 10.1029/2024EF004990
83
Williams P. B. Orr M. K. Garrity N. J. (2002). Hydraulic geometry: A geomorphic design tool for tidal marsh channel evolution in wetland restoration projects. Restor. Ecol.10, 577–590. doi: 10.1046/j.1526-100X.2002.01041.x
84
Xie D. Schwarz C. Kleinhans M. G. Bryan K. R. Coco G. Hunt S. et al . (2023). Mangrove removal exacerbates estuarine infilling through landscape-scale bio-morphodynamic feedbacks. Nat. Commun.14, 7310. doi: 10.1038/s41467-023-42733-1
85
Xie D. Schwarz C. Kleinhans M. G. Zhou Z. van Maanen B. (2022). Implications of coastal conditions and sea-level rise on mangrove vulnerability: A bio-morphodynamic modeling study. J. Geophysical Research: Earth Surface127, e2021JF006301. doi: 10.1029/2021JF006301
86
Xue L. Shi B. Schoutens K. Li T. Sun J. Ma Y. et al . (2024). Response of a patchy intertidal mudflat-marsh transition zone to a typhoon. Limnology Oceanography. 69(11), 2716–2731. doi: 10.1002/lno.12707
87
Yao P. Su M. Wang Z. van Rijn L. C. Zhang C. Stive M. J. (2018). Modeling tidal-induced sediment transport in a sand-silt mixed environment from days to years: Application to the Jiangsu coastal water, China. Coast. Eng.141, 86–106. doi: 10.1016/j.coastaleng.2018.09.002
88
Zhang K. Yan J. He Q. Xu C. Van De Koppel J. Wang B. et al . (2023). Self-organized mud cracking amplifies the resilience of an iconic “Red Beach” salt marsh. Sci. Adv.9, eabq3520. doi: 10.1126/sciadv.abq3520
89
Zhang C. Zhang D. Zhang J. Wang Z. (1999). Tidal current-induced formation—storm-induced change—tidal current-induced recovery: Interpretation of depositional dynamics of formation and evolution of radial sand ridges on the Yellow Sea seafloor. Sci. China Ser. D: Earth Sci.42, 1–12. doi: 10.1007/BF02878492
90
Zhou Z. Liang M. Chen L. Xu M. Chen X. Geng L. et al . (2022). Processes, feedbacks, and morphodynamic evolution of tidal flat–marsh systems: Progress and challenges. Water Sci. Eng.15, 89–102. doi: 10.1016/j.wse.2021.07.002
Summary
Keywords
coastal erosion prevention, engineering measures, ecological restoration, synergistic effect, bio-morphodynamic modeling
Citation
Geng L, Dou Z, Gu Y, Cao H, Yao P, Zhou Z and Shao J (2025) The synergistic effect between engineering measures and ecological measures in coastal erosion prevention. Front. Mar. Sci. 12:1671752. doi: 10.3389/fmars.2025.1671752
Received
23 July 2025
Accepted
24 September 2025
Published
09 October 2025
Volume
12 - 2025
Edited by
Giandomenico Foti, Mediterranea University of Reggio Calabria, Italy
Reviewed by
Jie Wang, Utrecht University, Netherlands; Mardiha Mokhtar, Universiti Tun Hussein Onn Malaysia (UTHM), Malaysia
Updates
Copyright
© 2025 Geng, Dou, Gu, Cao, Yao, Zhou and Shao.
This is an open-access article distributed under the terms of the Creative Commons Attribution License (CC BY). The use, distribution or reproduction in other forums is permitted, provided the original author(s) and the copyright owner(s) are credited and that the original publication in this journal is cited, in accordance with accepted academic practice. No use, distribution or reproduction is permitted which does not comply with these terms.
*Correspondence: Peng Yao, p.yao@hhu.edu.cn
Disclaimer
All claims expressed in this article are solely those of the authors and do not necessarily represent those of their affiliated organizations, or those of the publisher, the editors and the reviewers. Any product that may be evaluated in this article or claim that may be made by its manufacturer is not guaranteed or endorsed by the publisher.