 Weifu Qin
 Ruibin Ding
 Jiliang Xuan
 Feng Zhou
- 1School of Oceanography, Shanghai Jiao Tong University, Shanghai, China
- 2State Key Laboratory of Satellite Ocean Environment Dynamics, Second Institute of Oceanography, Ministry of Natural Resources, Hangzhou, China
- 3Institute of Polar and Ocean Technology, Second Institute of Oceanography, Ministry of Natural Resources, Hangzhou, China
- 4Observation and Research Station of Yangtze River Delta Marine Ecosystems, Ministry of Natural Resources, Zhoushan, China
Cross-shelf heat transport (CSHT) is a key component of the heat budget in the East China Sea. However, long-term observational evidence and a dynamic understanding of its complex spatiotemporal variations remain unclear. This study quantifies CSHT along the 200 m isobath using long-term data derived from satellite and in situ observations, and systematically analyzes its spatiotemporal variations and dynamic mechanisms. During 1993-2022, the net CSHT was 0.10 ± 0.08 PW, with on-shelf and off-shelf components of 0.70 ± 0.12 PW and -0.59 ± 0.08 PW, respectively. CSHT exhibits a dominant seasonal variation, with distinct phase differences between the net value and bidirectional components: the net value peaks in autumn and reaches its minimum in spring, whereas the bidirectional components are strongest in summer and weakest in winter. Depth-integrated results reveal unidirectional dominance in most shelf regions (on-shelf/off-shelf channels contain minimal reverse components). Among them, the northeastern Taiwan shelf, as the strongest on-shelf/off-shelf channel for CSHT, dominates the bidirectional components’ summer-strong/winter-weak pattern, whereas the southwestern Kyushu shelf primarily contributes to the net value’s autumn-strong/spring-weak characteristic. Along-isobath integration shows balanced bidirectional components above 150 m, whereas on-shelf transport dominates below. Dynamical mechanisms indicate that geostrophic transport dominates CSHT, except for bottom Ekman transport in the central shelf. In terms of temporal variations, northeastern Taiwan is mostly active due to geostrophic currents’ variability. Empirical Orthogonal Function analysis further confirms that variations off northeastern Taiwan manifest as an on-shelf/off-shelf dipole structure throughout the entire water column. These results provide new physical insights into heat regulation in the East China Sea.
1 Introduction
As a major western boundary current in the Northwest Pacific, the Kuroshio transports substantial heat poleward and significantly influences the East China Sea (ECS) through cross-shelf heat transport (CSHT). Early observational studies estimated a net CSHT of approximately 0.30 PW entering the ECS based on ADCP data during October-December in 1999, which was markedly greater than the heat input from the Taiwan Strait (0.01 PW), with most of the imported heat exiting the ECS through the Korea/Tsushima Strait (and a smaller portion through the air-sea interface), confirming that CSHT is a key component of the ECS’s heat budget (Teague et al., 2003).
To investigate long-term changes and the complete spatial structure of CSHT, researchers have successively carried out relevant numerical modeling studies. Given the pronounced seasonal variation in the Kuroshio’s heat transport (Zhang et al., 2002), a strong seasonal cycle in CSHT is expected. Fang et al. (2003) used MOM2.0 to estimate a climatological mean CSHT of 0.21 PW, with the highest value in October (0.41 PW) and the lowest in July (0.03 PW). Their results also identified the northeastern Taiwan shelf as the primary channel for heat input into the ECS. Subsequent studies (Liu et al., 2010; Yang et al., 2022) further revealed that the southwestern Kyushu shelf serves as a secondary heat input channel, whereas the central shelf is predominantly characterized by heat output.
However, considerable discrepancies persist among modeling results due to differences in configurations (e.g., topography, boundary conditions, and parameterization schemes). For instance, Liu et al. (2010), using MOM4p0d, reported CSHT during 1995–1999 was input in autumn/winter (0.17/0.10 PW) but output in spring/summer (-0.02/-0.05 PW), differing significantly from the year-round input (0.05-0.35 PW) proposed by Fang et al. (2003). Zhou et al. (2015) and Yang et al. (2022) reported nearly twofold differences in simulated CSHT in 2006 using ROMS and JCOPE2M, respectively (~0.2 PW vs.< 0.1 PW).
In addition, most existing studies have focused on the net value analysis of CSHT, whereas studies on cross-shelf water transport carrying heat have shown that the magnitudes of on-shelf and off-shelf transport exceed the net value (Ding et al., 2016; Guo et al., 2006; Liu and Gan, 2012). The strong on-shelf and off-shelf CSHT regulate the heat balance of the ECS shelf and the Kuroshio mainstream, respectively (Yang et al., 2022), potentially influencing local or even larger-scale climate anomalies through air-sea interactions. However, current understanding of CSHT’s bidirectional components has largely been restricted to their multi-year averaged spatial distribution.
Horizontally, the northeastern Taiwan shelf exhibits the strongest bidirectional CSHT (Liu et al., 2010), where the Kuroshio loses the support of the Taiwan coast and meanders significantly (Isobe, 2008; Su, 2001; Su and Pan, 1987), generating substantial upstream on-shelf and downstream off-shelf transport (Cui et al., 2021; Liu et al., 2015; Yang et al., 2018b). CSHT in the central and southwestern Kyushu shelf is weaker compared to northeastern Taiwan, but their bidirectional components still surpass the overall net value (Liu et al., 2010; Yang et al., 2022). Although the mainstream of the Kuroshio in the central shelf is basically along the 200 m isobath, the analyses of sediment composition have provided evidence for the cross-shelf transport phenomenon here (Bian et al., 2013; Li et al., 2016; Yuan et al., 2008). The Kuroshio current in the southwestern Kyushu shelf forms a shoreward branch, which is the main cause of cross-shelf transport here (Hsueh, 2000; Hsueh et al., 1996).
Compared with the horizontal direction, studies on vertical structure of CSHT remain unclear. Tian et al. (2019) suggested on-shelf CSHT in 20 m above and 150 m below, with off-shelf CSHT in between, and the contribution of CSHT decreases with depth. In contrast, Yang (2019) found on-shelf CSHT in surface (0–60 m) and bottom (140–200 m) layers, with unstable patterns in between, and the bottom layer is the dominant contributor to CSHT.
Overall, while previous in situ and modeling studies have provided valuable insights into CSHT, significant challenges remain. These include large discrepancies among model results, an insufficient consideration of bidirectional transport, and uncertainties in the vertical structure, collectively highlighting the lack of long-term observational evidence and a dynamically consistent understanding. Therefore, this study aims to systematically analyze the net and bidirectional CSHT over time and space based on a long-term dataset derived from satellite remote sensing and in situ observations (ARMOR3D), and further investigates the dynamic mechanisms underlying the observed variations.
2 Data and methods
2.1 Data
ARMOR3D was used to calculate cross-shelf geostrophic currents. Provided by the Copernicus Marine Environment Monitoring Service (CMEMS), ARMOR3D spans the period 1993–2022 with a monthly temporal resolution, a horizontal resolution of 0.25°, and variable vertical resolution: 5 m in 0–70 m, 10 m in 70–100 m, and 25 m in 100–200 m. ARMOR3D has been widely utilized in studies of western boundary currents and ECS regional dynamics recently (Aroucha et al., 2020; Wang et al., 2022; Yu et al., 2022). The dataset was primarily generated through the following two steps:
1. Reconstruction of the 3D Temperature-Salinity Field (Guinehut et al., 2012).
This process integrated satellite and in situ data in two substeps:
i. Generation of Synthetic Profiles: synthetic temperature and salinity profiles were derived from satellite remote sensing data through a multiple linear regression method and covariances calculated from historical data.
ii. Optimal Interpolation: the synthetic profiles were then combined with in situ temperature and salinity profiles (Argo profiling floats, XBT, CTD and moorings measurements) using an optimal interpolation method.
2. Calculation of 3D Geostrophic Currents (Mulet et al., 2012).
Based on satellite altimeter and the three-dimensional temperature-salinity field, and combined with the hydrostatic, Boussinesq, and geostrophic approximations, the thermal wind equation was applied to calculate the three-dimensional geostrophic currents.
In the ECS Kuroshio region, satellite altimetry has been widely employed to estimate geostrophic currents (Ding et al., 2016; Liu et al., 2014b; Wu et al., 2014). The volume and reliability of temperature data have been validated by Wei et al. (2023), with the monthly in situ data volume exceeding 3.0 at each vertical layer across eight subregions near the 200 m isobath, and the surface layer exhibiting correlation coefficients above 0.65 with Optimum Interpolation Sea Surface Temperature (OISST) in each subregion. In contrast, the impact of salinity variability on geostrophic currents is relatively small (Zhang et al., 2017).
Other auxiliary materials used in this study include: sea surface wind data from Cross-Calibration Multi-Platform (CCMP) were used to calculate the cross-shelf surface Ekman current. CCMP is a reconstruction product of satellite, mooring and model data, which has been widely applied in the study of the ECS Kuroshio region (Hsin et al., 2013; Kang and Na, 2022; Wang and Oey, 2014). The cross-shelf bottom Ekman current was derived from geostrophic currents using empirical formula (Ding et al., 2019; Kundu et al., 2015). The fifth-generation global climate and weather reanalysis data (ERA5), provided by the European Center for Medium-Range Weather Forecasts (ECMWF), were used to calculate the air-sea heat transport. Historical field observations of PN section from the Japan Meteorological Agency (JMA) were used to assess the applicability of ARMOR3D in cross-shelf studies.
2.2 Methods
We calculated CSHT along the 200 m isobath (denoted as Q for simplicity) using the following equation:
In the Equation 1, is the seawater density, is the specific heat of seawater at constant pressure, and their product is approximated as a constant, i.e., (Hall and Bryden, 1982). is the seawater potential temperature. is the cross-shelf current velocity, including geostrophic (), surface Ekman () and bottom Ekman () current velocity. was obtained from ARMOR3D as described in the last subsection, whereas and were calculated from the frictional stresses. Specially, since previous studies have demonstrated the influence of surface and bottom frictional stresses on cross-shelf exchange (Guo et al., 2006; Zhang et al., 2017), the along-shelf components of these stresses were retained, whereas the minor cross-shelf frictional stresses were neglected. Thus, and were calculated from the along-shelf surface wind stress and bottom frictional stress, respectively, with the formulas described in Ding et al. (2016) and Ding et al. (2019). Since the seasonal and interannual variations of cross-shelf transport are most significant (Liu et al., 2021), a low-pass filter was first applied in the subsequent analysis to remove intra-seasonal signals.
We investigated the spatiotemporal variations of CSHT from the perspectives of kinematic and dynamic decomposition. The kinematic approach analyzes the contributions of cross-shelf current velocity () and shelf temperature (), whereas the dynamic approach considers the surface Ekman (), geostrophic (), and bottom Ekman () components. The decomposition of the kinematic components of the multi-year averaged CSHT is performed as the Equation 2:
regarding the decomposition of the kinematic components of the CSHT’s variance:
In the Equation 3, denotes the index of the monthly temporal samples used in the summation, with representing the total number of samples (for the monthly series spanning 1993-2022, ; the same applies hereafter). For brevity, the factor is omitted, and is defined as . Among the six components obtained by kinematic decomposition, the first three represent the variance terms of cross-shelf current velocity, shelf temperature, and cross-shelf heat transport disturbance, respectively, and the last three represent their covariance terms. Further dynamic decomposition of is performed:
In the Equation 4, the first three terms represent the variance terms of the geostrophic, surface Ekman, and bottom Ekman components, respectively, and the last three terms represent their covariance contributions.
2.3 Validation of East China Sea’s budgets and PN’s temperature
To ensure the reliability of the analysis, the budgets of water and heat transport in the ECS (Figure 1A) were first validated based on the aforementioned data (ARMOR3D, CCMP and ERA5). For the budget of water transport, the net input through the Taiwan Strait and the 200 m isobath are 1.00 ± 0.92 Sv and 1.40 ± 1.00 Sv, respectively, while the net output through the Korea/Tsushima Strait is 2.65 ± 0.74 Sv. The average residual of the water transport budget is -0.25 Sv, which falls within the margin of error. For the budget of heat transport, the net input through the Taiwan Strait and the 200 m isobath are 0.10 ± 0.09 PW and 0.10 ± 0.08 PW, respectively, while the net output through the Korea/Tsushima Strait and the air-sea interface are 0.18 ± 0.07 PW and 0.02 ± 0.10 PW, respectively. The average residual of the heat transport budget is effectively zero. These validation results suggest that the ECS’s budgets are well balanced.
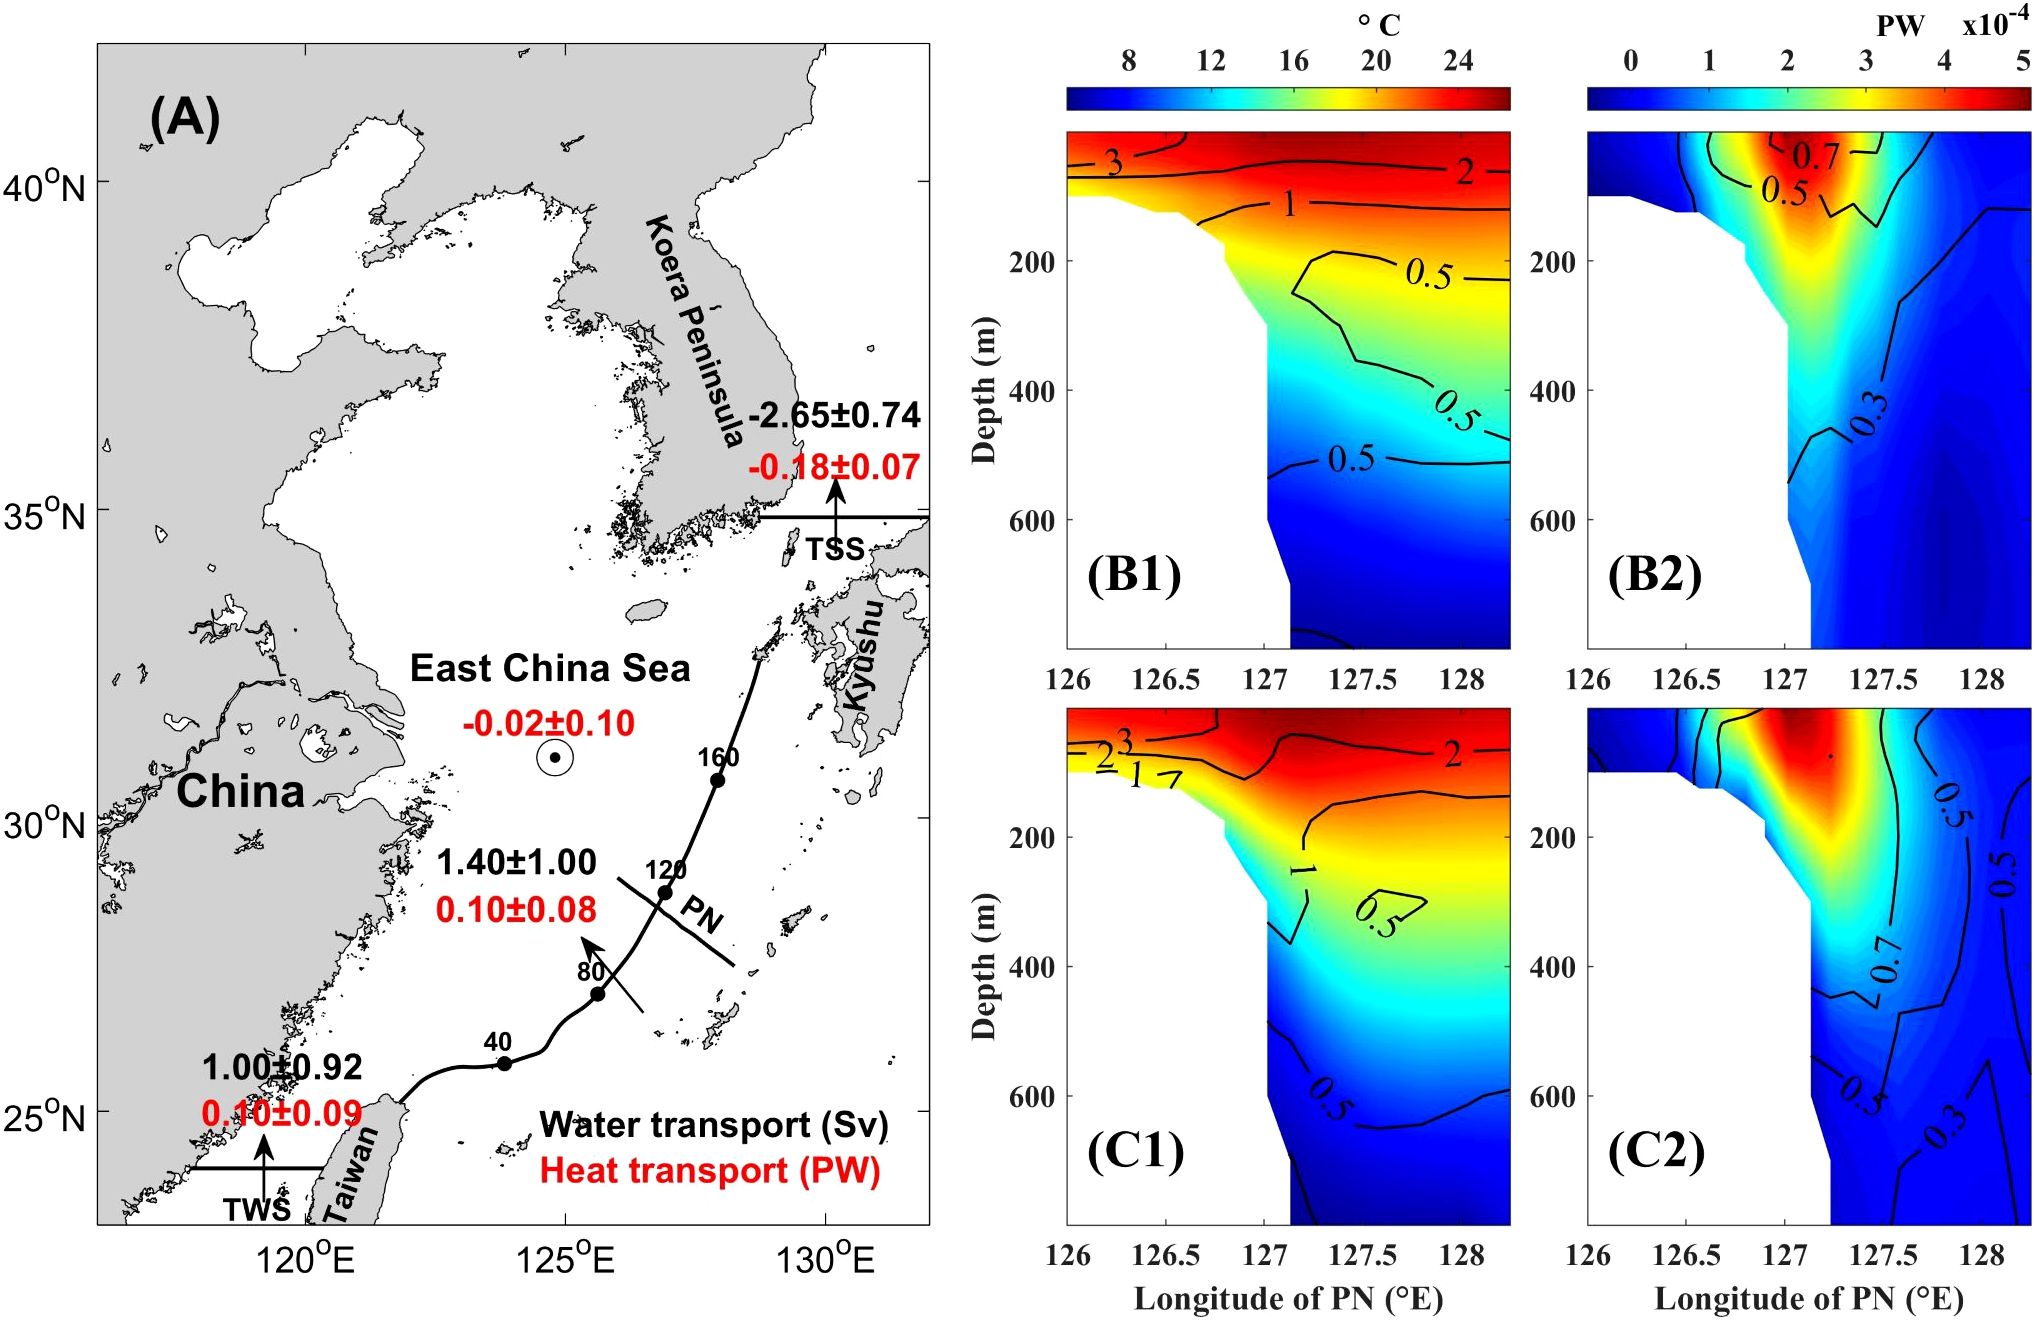
Figure 1. (A) Budgets of water and heat transports in the ECS (negative values represent output), TWS and KTS denote the Taiwan Strait and the Korea/Tsushima Strait, respectively. Shelf points are evenly spaced along the 200 m isobath from northeastern Taiwan to southwestern Kyushu. (B1, C1) Temperature distribution along the PN section. (B2, C2) Heat transport distribution along the PN section. (B1, B2) is based on ARMOR3D; (C1, C2) is based on JMA observations. Background colors represent multi-year averages; contour lines indicate standard deviations.
Next, the temperature of the PN section was validated to assess the applicability of ARMOR3D in the cross-shelf direction of the ECS (Figures 1B1, C1). A systematic comparison of ARMOR3D and JMA observations shows generally consistent spatial structures. Specifically, the distribution of surface warm water and bottom cold water is well captured, and the vertical gradient characteristics of the thermocline are clearly reproduced. The main differences between the two are that ARMOR3D’s temperature extremes and standard deviations are slightly lower, and it does not capture the temperature variations near the continental slope’s bottom topography as well. This may be due to the smoothing effect caused by ARMOR3D’s spatial interpolation and resolution limitations. However, the overall error is within an acceptable range and can support the cross-shelf heat transport study presented in this paper.
Furthermore, to directly validate the heat transport diagnostics, we compared heat transport along the PN section based on ARMOR3D with JMA observations (Figures 1B2, C2). The spatial patterns and magnitudes also show generally good agreement, confirming that ARMOR3D can reasonably reproduce both the temperature structure and associated heat transport along the PN section. If the component of heat transport across the 200 m isobath was calculated at the point where the PN section intersects it, the result based on the ARMOR3D is -6.46 ± 1.10 × 10⁻³ PW, whereas that from JMA observations is -6.51 ± 1.61 × 10⁻³ PW. The correlation between them is as high as 0.82 (p< 0.01), and the relative error between the mean values is less than 1%. This further supports the reliability of ARMOR3D for applications in CSHT studies in the ECS.
3 Results
To systematically analyze the spatiotemporal variation characteristics of CSHT’s net value and bidirectional components, this section explores CSHT from an overall to a localized perspective. First, in subsection 3.1, a complete sectional integration of CSHT is performed to analyze the net value and bidirectional components of CSHT from an overall perspective. Then, in subsection 3.2, CSHT is integrated along the depth direction and along the isobath direction to study its horizontal and vertical structure, respectively. Finally, in subsection 3.3, a sectional distribution analysis of CSHT is performed to explore its three-dimensional structure and primary controlling mechanisms from the perspective of kinematics and dynamics.
3.1 Total cross-shelf heat transport
The results of the complete sectional integration (Figure 2A) show that from 1993 to 2022, the total net CSHT was 0.10 ± 0.08 PW, significantly lower in magnitude than its on-shelf and off-shelf components (0.70 ± 0.12 PW and -0.59 ± 0.08 PW). Notably, there is a significant negative correlation between the bidirectional components of CSHT (r = -0.71, p< 0.01), indicating that they tend to strengthen or weaken synchronously. For example, the bidirectional components reached a peak in the summer of 2001 (> 0.1 PW and < -0.8 PW), while dropped to a trough in the winter of 1996 (~0.4 PW and -0.45 PW).
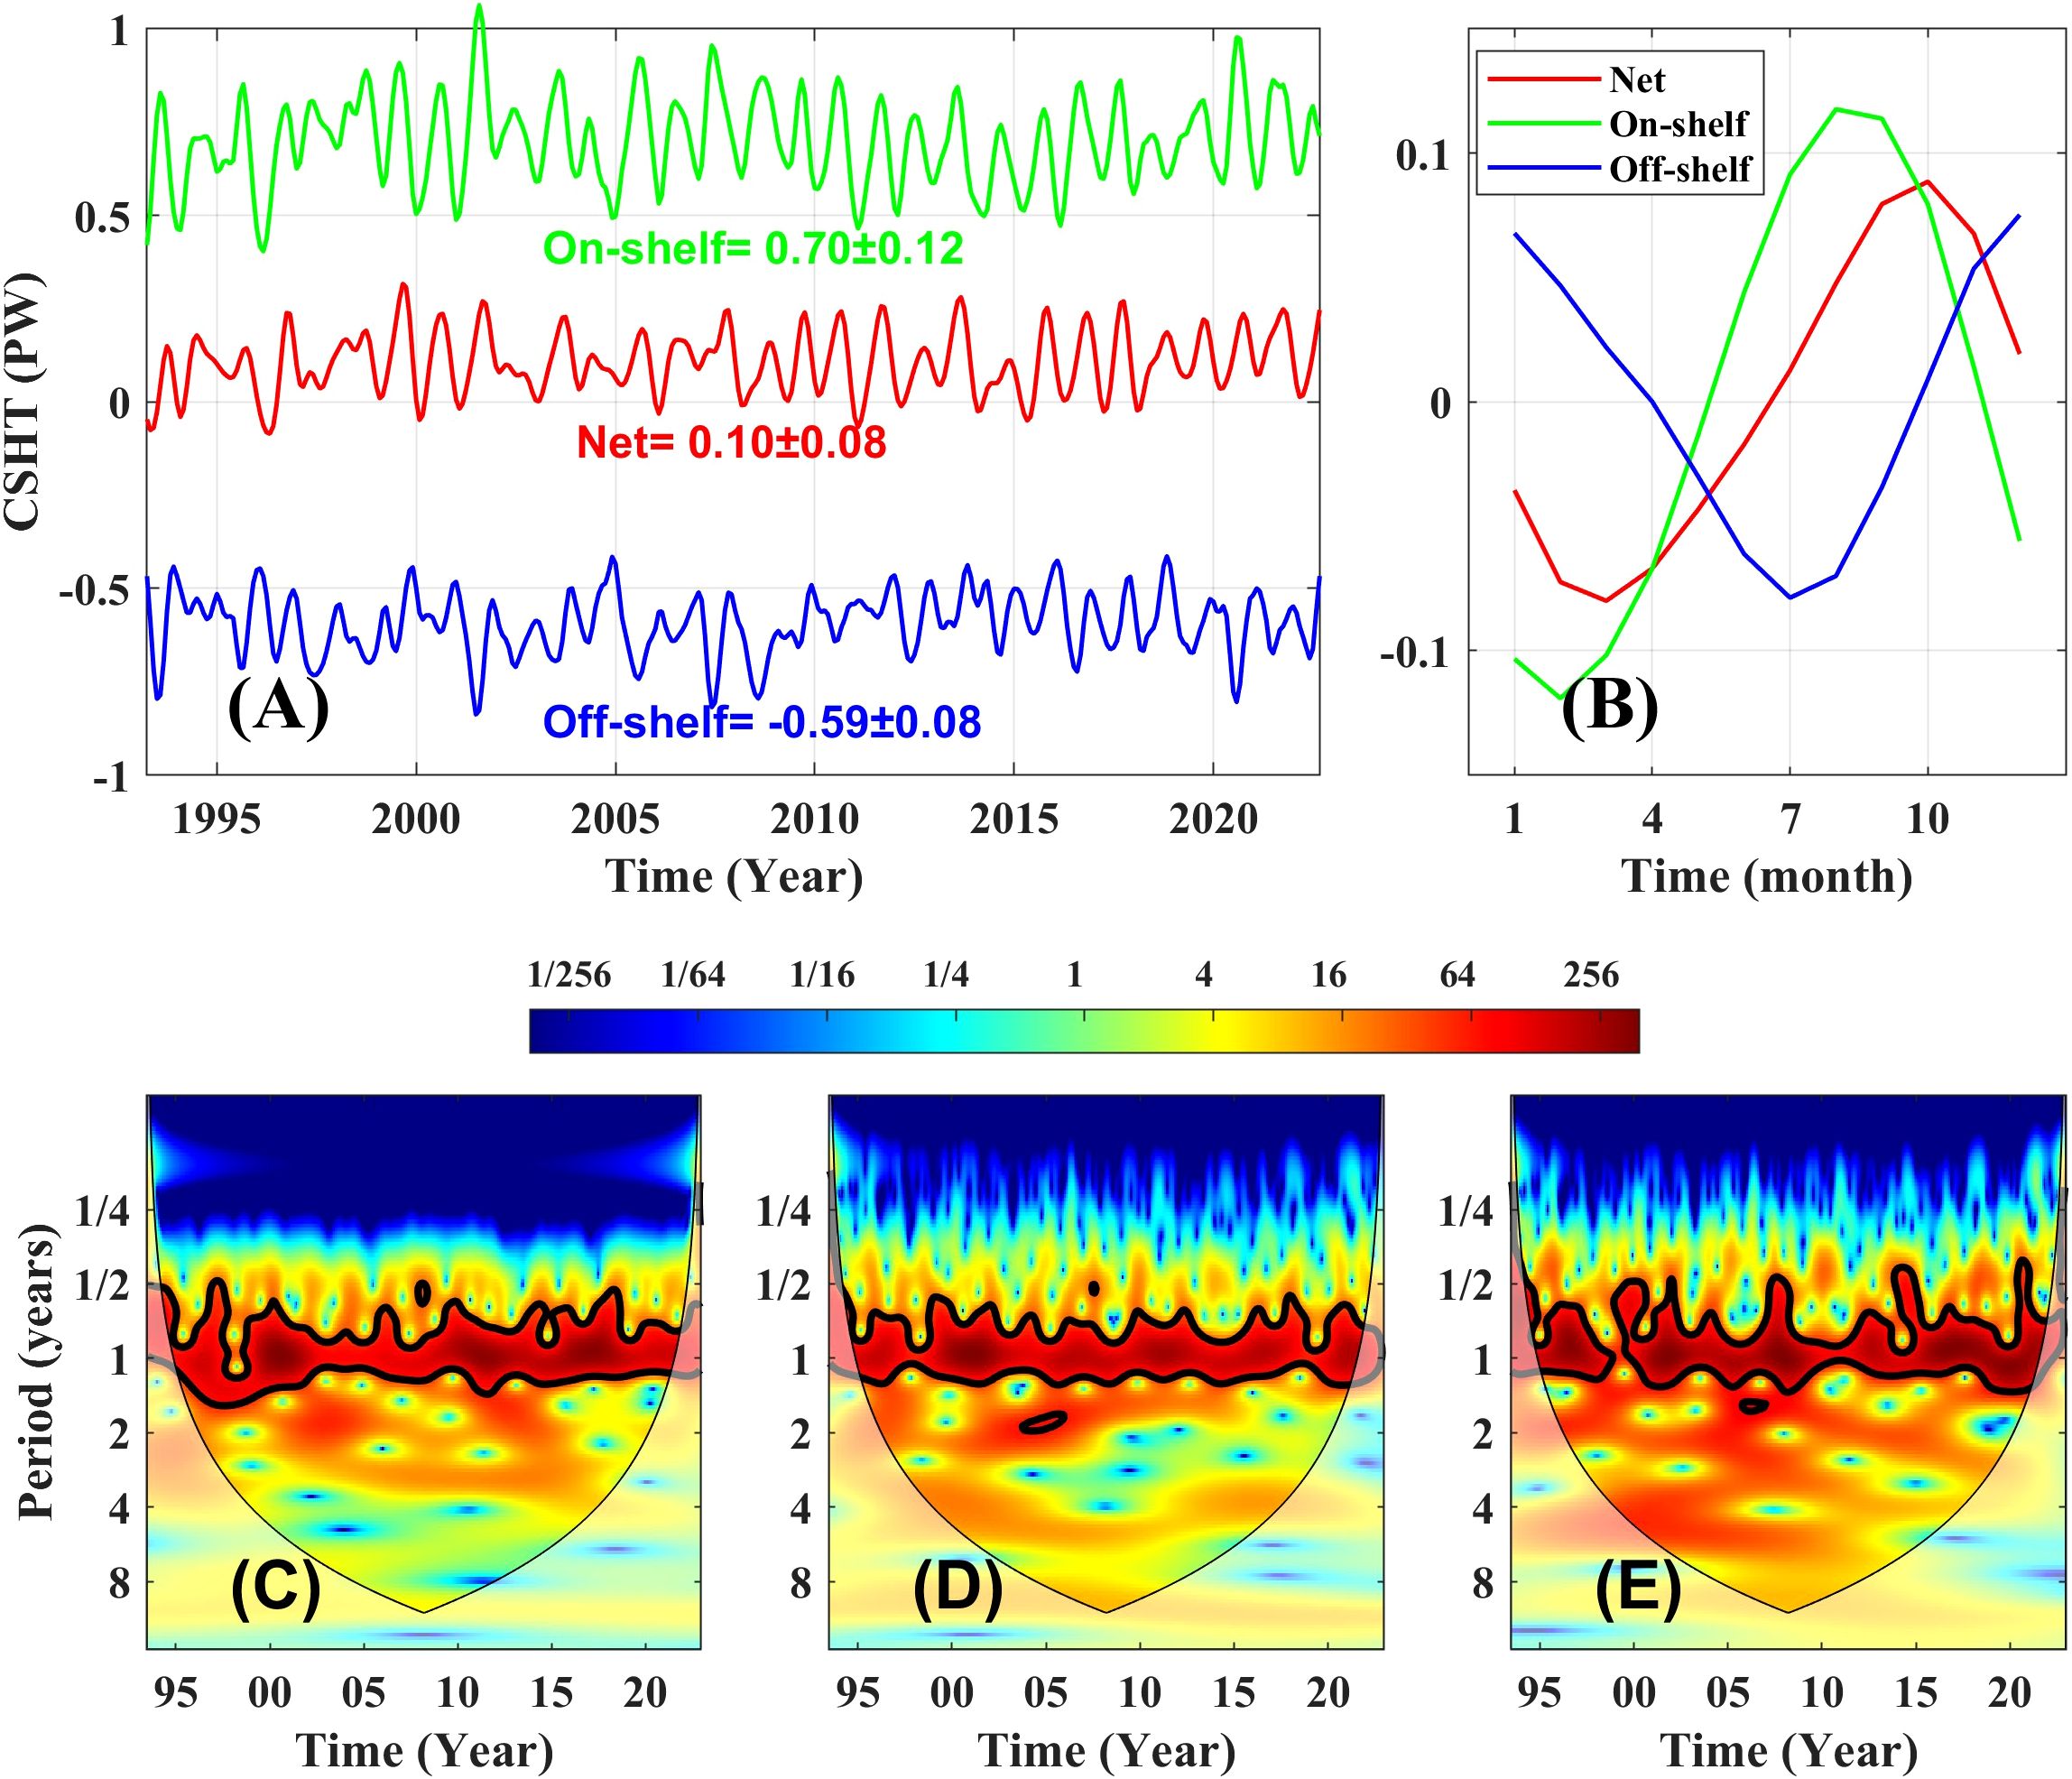
Figure 2. (A) Time series of CSHT. Red, green, and blue lines represent the net, on-shelf, and off-shelf components, respectively. (B) Monthly climatological anomalies of CSHT. (C–E) Wavelet power spectra of the net, on-shelf, and off-shelf components of CSHT. Black contours mark regions exceeding the 5% significance level.
By using the wavelet analysis, we conducted an in-depth study on the temporal variability of CSHT (Figures 2C–E). The results reveal statistically significant seasonal-cycle signals for both the net and bidirectional components (exceeding the 5% significance level), whereas interannual signals generally fail to pass the significance test. To highlight the seasonal variation patterns, monthly climatological anomalies of CSHT are shown in Figure 2B. The results indicate that there are significant phase differences in the seasonal variations of CSHT’s net value and bidirectional components. The net value is strongest in autumn and weakest in spring, whereas the bidirectional components are strongest in summer and weakest in winter (note that Figure 2B shows the anomaly values, where a negative anomaly for off-shelf heat transport, which is inherently negative, indicates an increase in transport).
3.2 Horizontal and vertical structure of cross-shelf heat transport
The integration along the depth (Figure 3) indicates pronounced horizontal heterogeneity in CSHT: transport intensity in the northeastern Taiwan shelf is significantly stronger than that in the central and southwestern Kyushu shelf, with peak values reaching 2×10⁻² PW in the former region, compared to values generally below 1×10⁻² PW in the latter two regions. Further analysis reveals that there are relatively fixed strong heat transport channels in the upstream and downstream regions off northeastern Taiwan: on-shelf heat transport persists near the 30th shelf point, and off-shelf heat transport persists near the 55th shelf point. In both regions, the time averaged intensities of CSHT are significantly higher than the standard deviation. It is noted that for most of the shelf regions, CSHT exhibits a clear unidirectional dominance, with the on-shelf (off-shelf) transport channel containing negligible off-shelf (on-shelf) components.
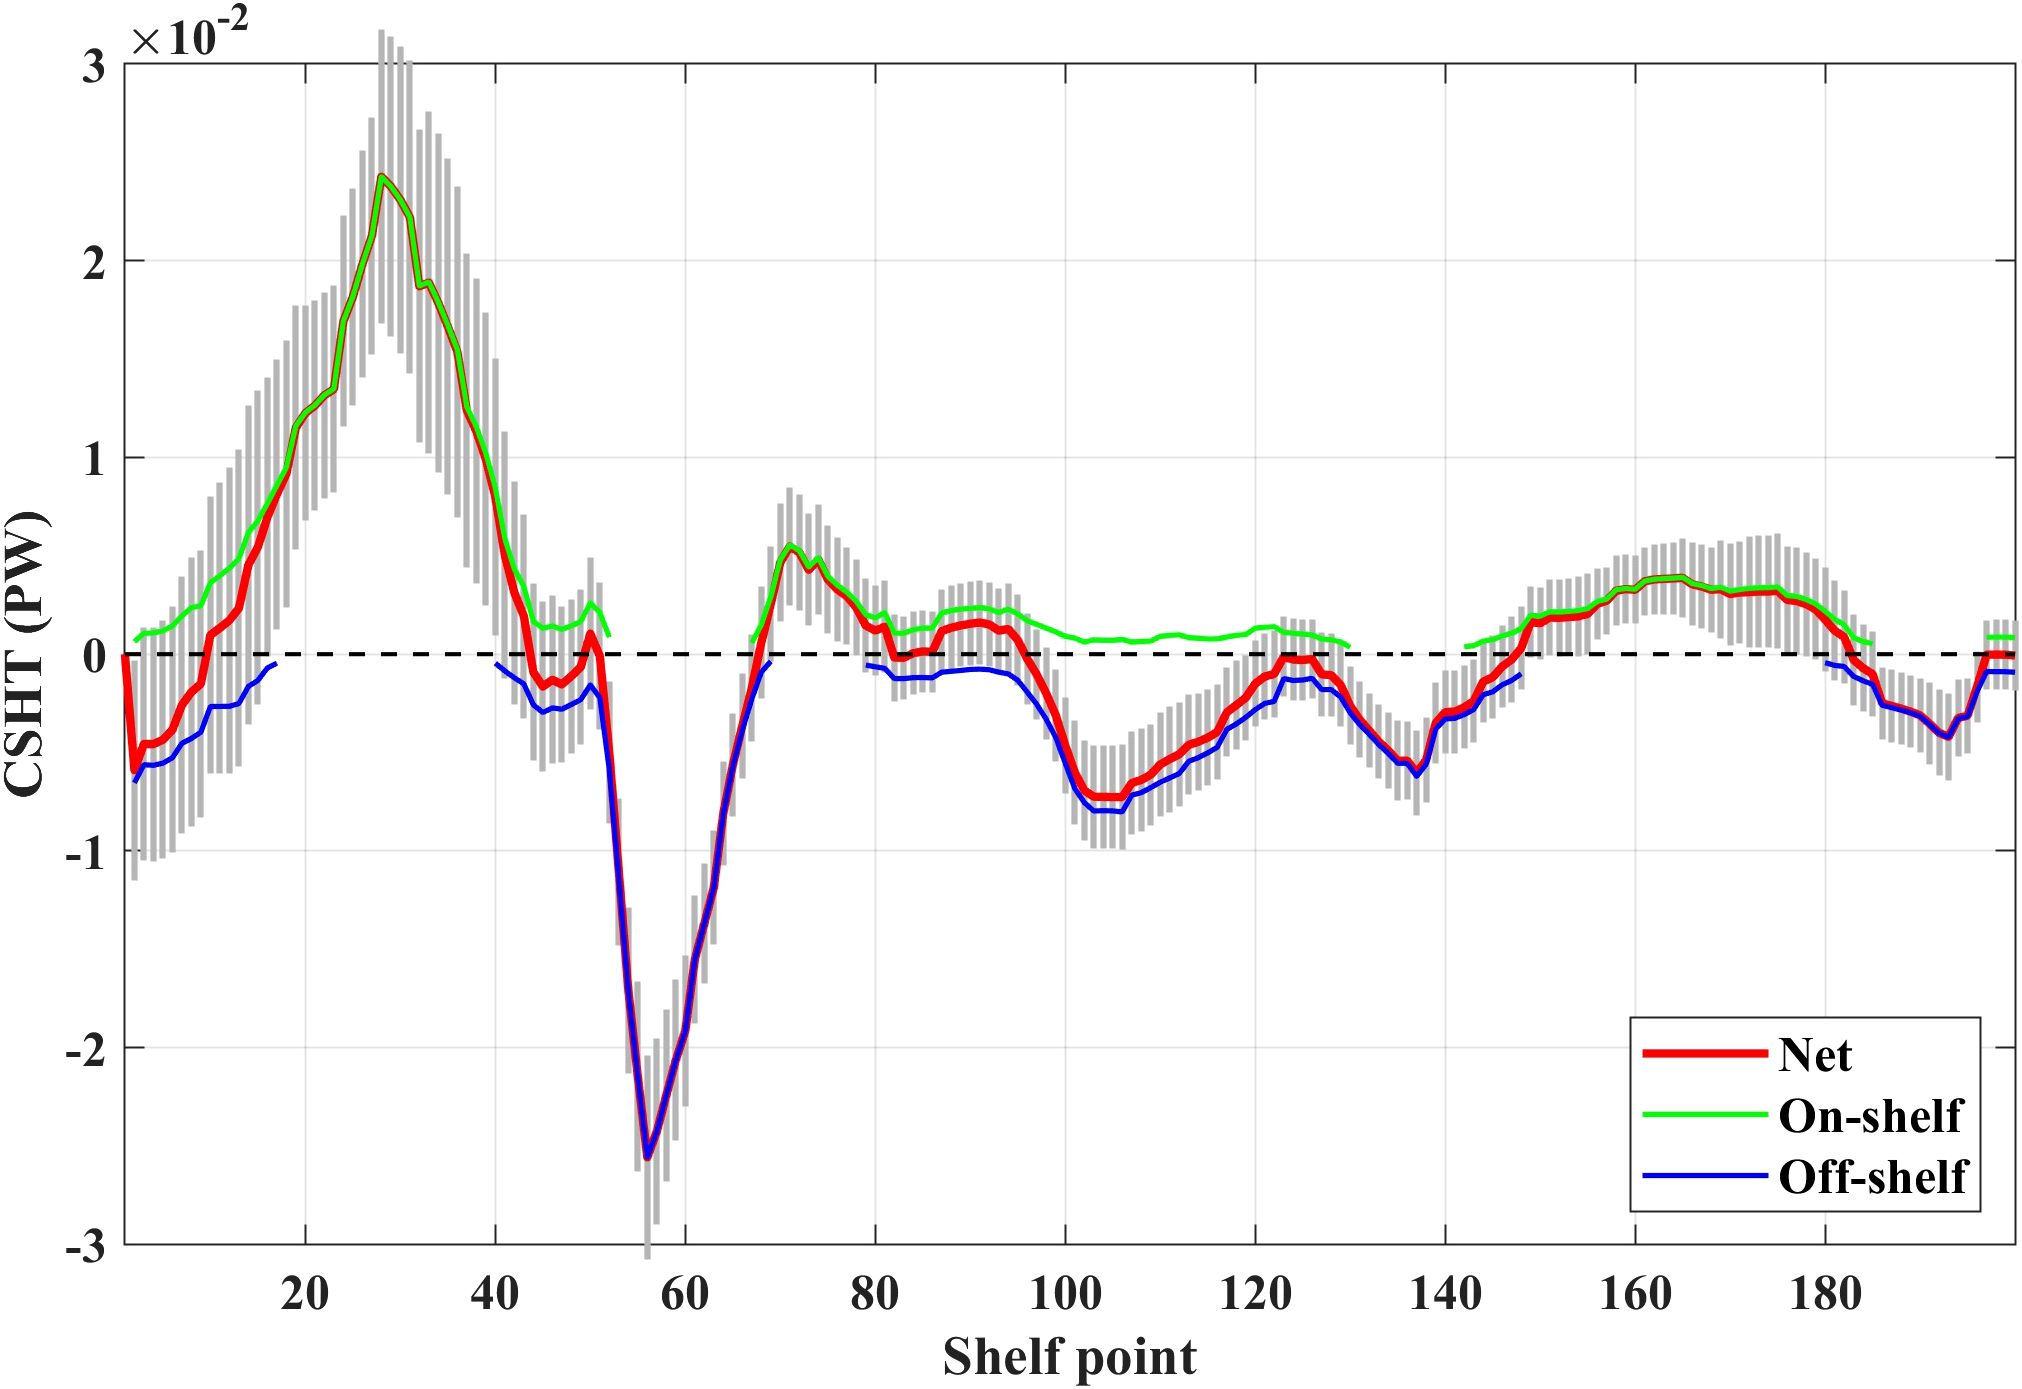
Figure 3. Horizontal structure of CSHT based on integration along the depth. Solid lines indicate multi-year averages; error bars denote standard deviations. Note that only the light gray error bars for the net transport are displayed, as substantial overlap exists between the bidirectional and net components.
The integration along the isobath (Figure 4) reveals CSHT’s significant vertical stratification characteristics: the net value of CSHT in the shallow layer above 150 m is small, and the strong bidirectional components in this depth range are essentially balanced; whereas the deep layer below 150 m shows a clear dominance of on-shelf transport, with its intensity significantly exceeding that of the off-shelf component. Consequently, the deep layer is the primary contributor to net heat transport. If the CSHT for depths both shallower and deeper than 150 m was calculated, the net value of the former is -0.02 ± 0.06 PW (with on-shelf and off-shelf components of 0.60 ± 0.08 PW and -0.63 ± 0.08 PW, respectively), whereas the net value of the latter is 0.11 ± 0.03 PW (with on-shelf and off-shelf components of 0.17 ± 0.03 PW and -0.06 ± 0.01 PW, respectively). Notably, the upper water column above 150 m exhibits greater variability, indicating more active seasonal and interannual fluctuations.
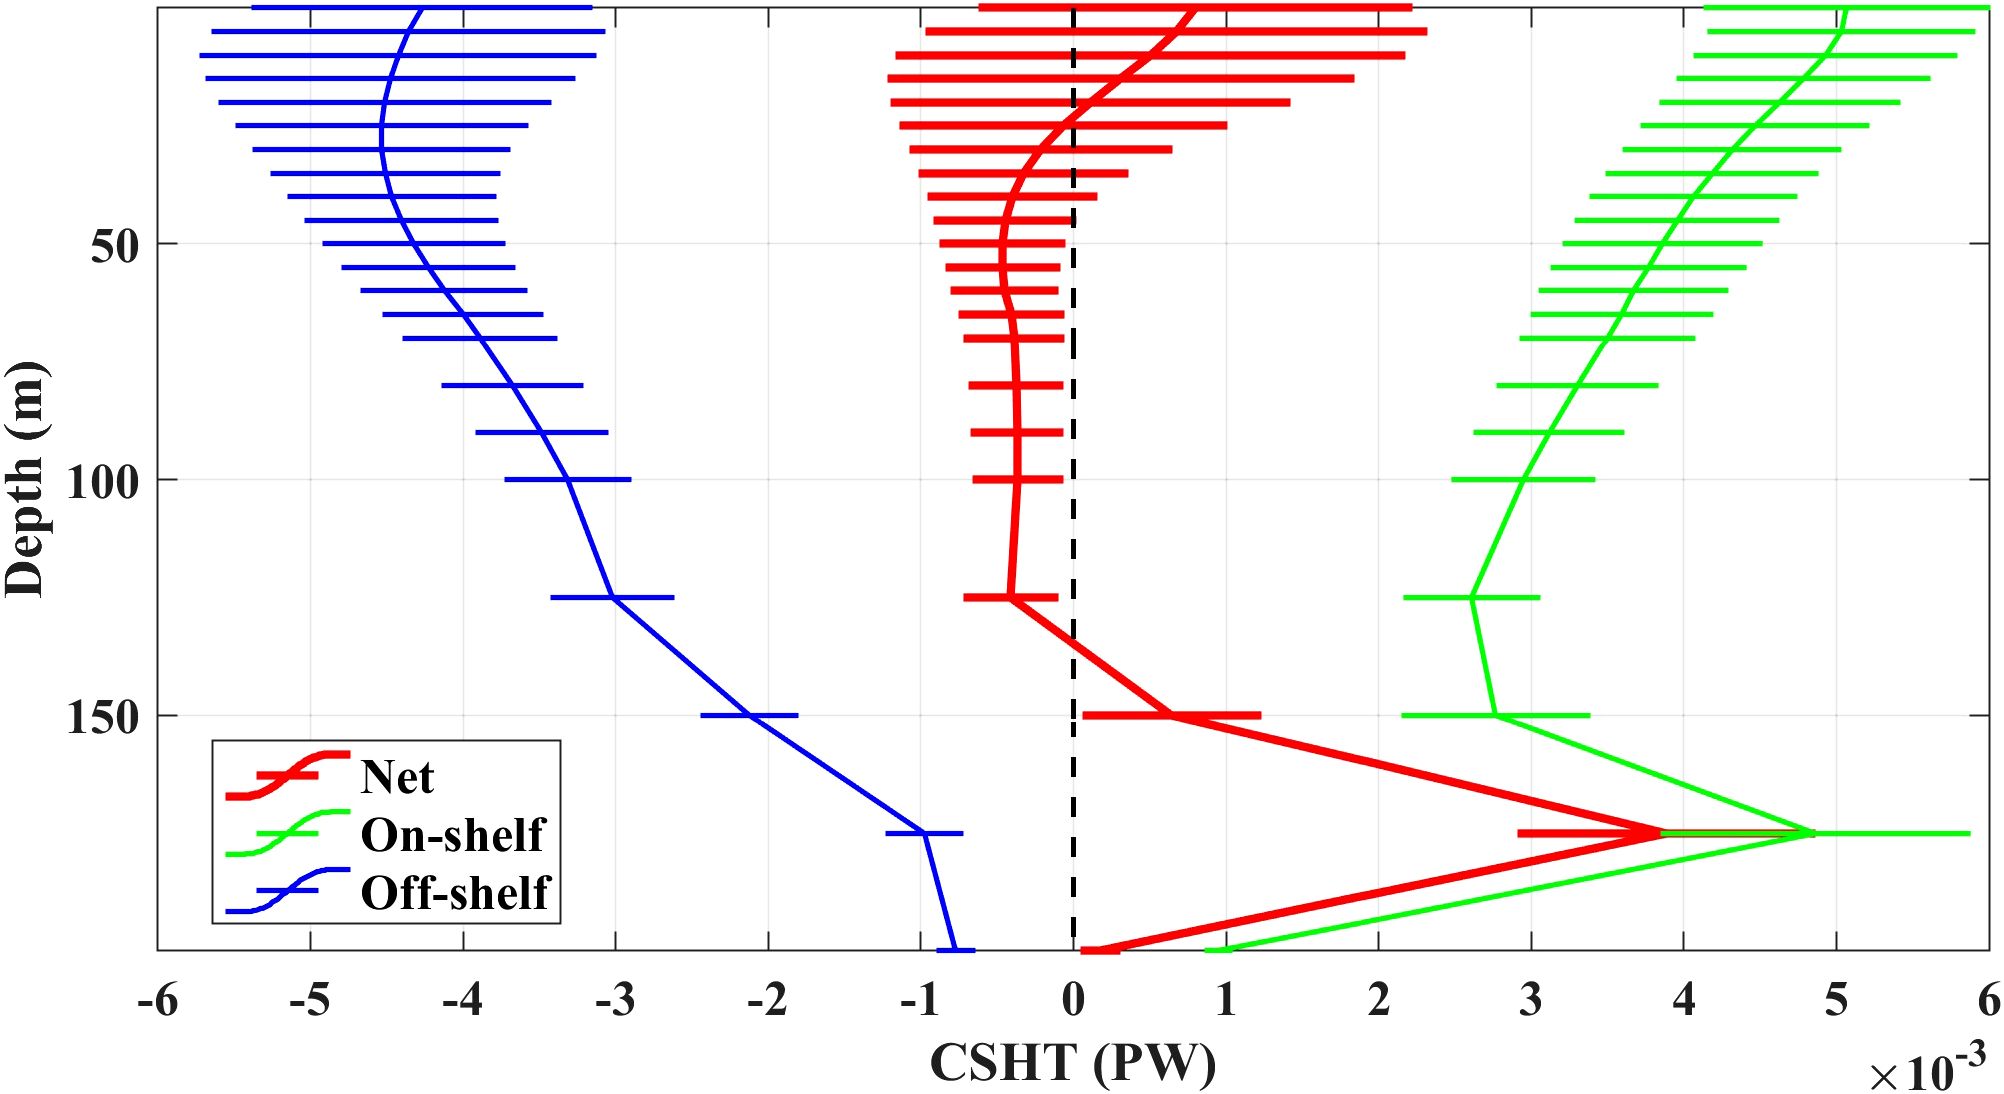
Figure 4. Vertical structure of CSHT based on integration along the 200 m isobath. Solid lines indicate multi-year averages; error bars denote standard deviations.
3.3 Sectional distribution patterns of cross-shelf heat transport
To further investigate the three-dimensional structure and dominant controlling mechanisms of CSHT, this subsection analyzes the sectional distribution of CSHT from two aspects: kinematics (cross-shelf current velocity and shelf temperature) and dynamics (surface Ekman component, inner geostrophic component, and bottom Ekman component).
The multi-year averaged distribution of CSHT (Figure 5A) shows that the northeastern Taiwan shelf exhibits a significant upstream on-shelf/downstream off-shelf dipole structure, extending from the surface to the bottom; the central shelf presents a typical double-layer structure, shallow layer above 150 m mainly shows off-shelf heat transport, whereas deep layer below 150 m turns to on-shelf heat transport, but the overall intensity is significantly weaker than that in the northeastern Taiwan shelf; the structure in the southwestern Kyushu shelf is similar to that in the northeastern Taiwan shelf, but with much weaker heat transport. Spatially, the distribution of CSHT closely aligns with the cross-shelf current velocity (Figure 5D), which is mainly because the direction of CSHT is controlled by the current velocity, whereas temperature only affects its amplitude.
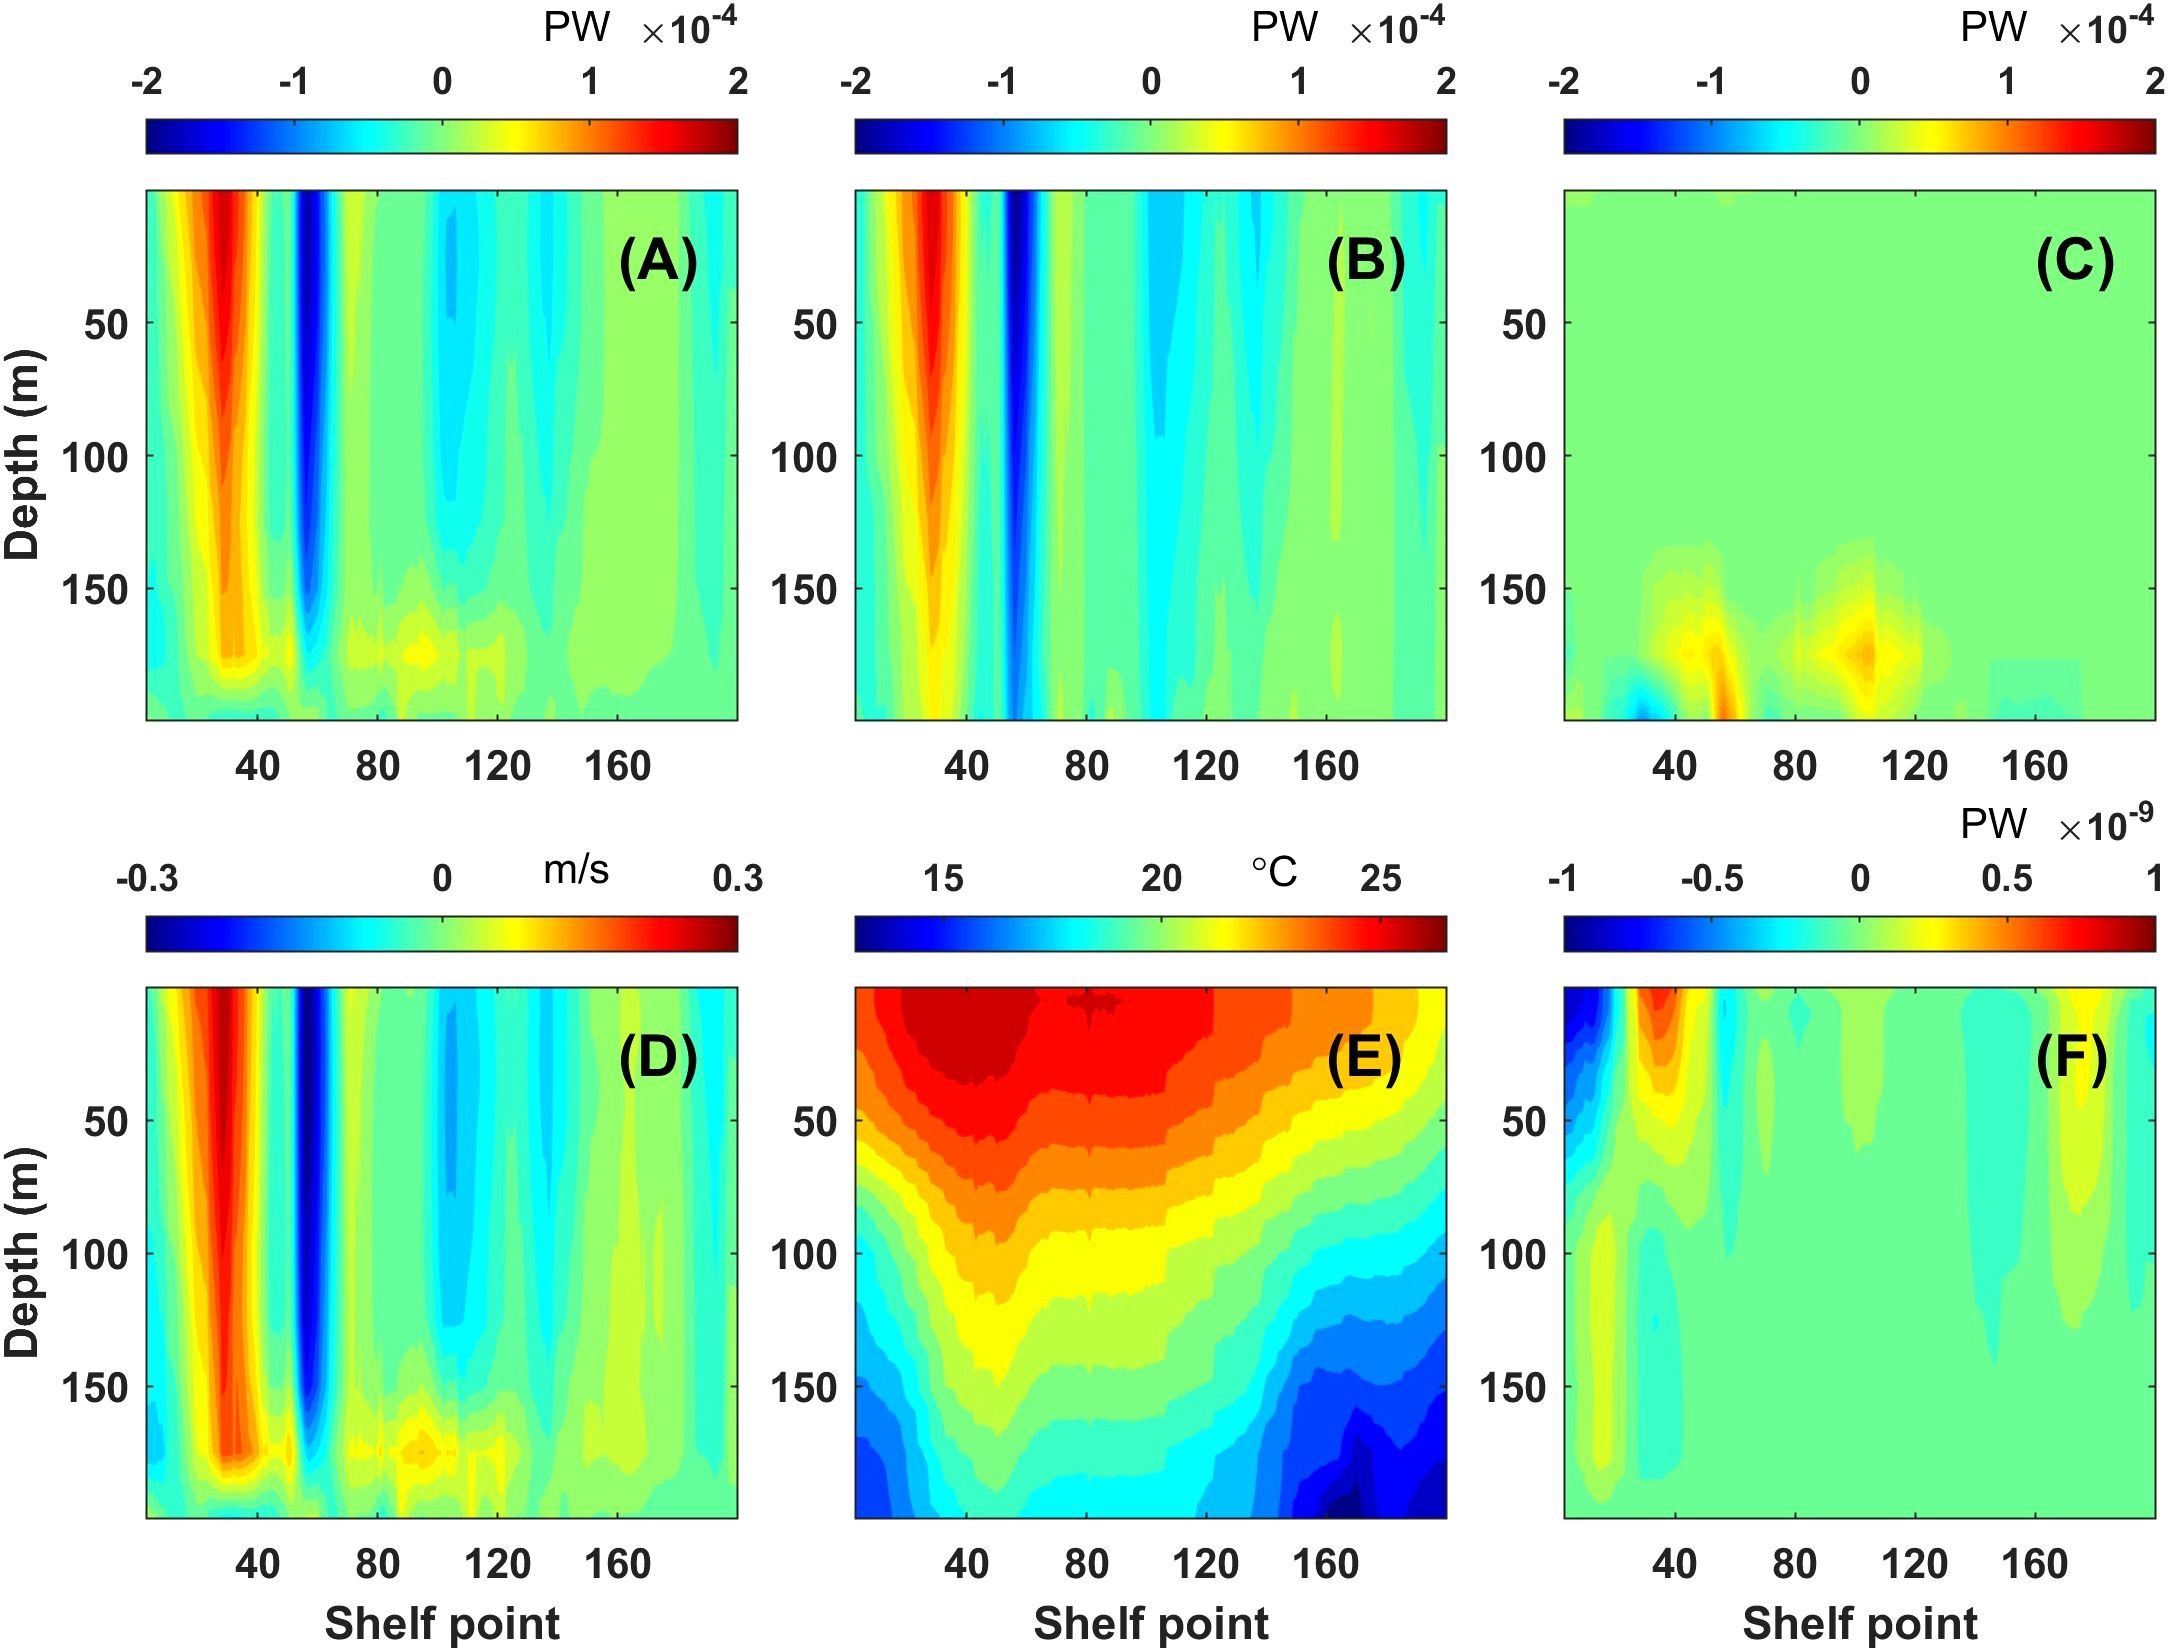
Figure 5. Multi-year averaged sectional distributions of CSHT (A) and its driving factors. (B) Geostrophic component. (C) Ekman component. (D) Cross-shelf velocity. (E) Shelf temperature. (F) Temperature and current fluctuations, its magnitude is much smaller than , indicating that ≈ (Formula 2), so cross-shelf velocity and shelf temperature are shown separately here.
Dynamic decomposition results demonstrate that geostrophic heat transport (Figure 5B) dominates in most regions, with a spatial pattern that mirrors the CSHT. It is particularly worth noting that within a range of bottom 50 m in the central shelf, the bottom Ekman heat transport shows a relatively enhanced characteristic (Figure 5C). This is because the Kuroshio mainstream is more closely aligned with the 200 m isobath in the central shelf than in other regions, resulting in the strongest bottom Ekman transport, a configuration associated with the bottom friction effects generated as the current flows along the shelf. In contrast, the contribution of the surface Ekman component is generally small, being 1–2 orders of magnitude lower than the geostrophic and bottom Ekman components.
In order to study the characteristics of multi-year variation, variance decomposition analysis is performed on CSHT (Figure 6). The results reveal that the variation signal of CSHT is significantly stronger in the northeastern Taiwan shelf than in other regions. Kinematic decomposition indicates that CSHT variation mainly stems from changes in cross-shelf current velocity (Figure 6B1 is basically consistent with Figure 6A), whereas the contributions of temperature fluctuations and covariances are relatively minor. Dynamic decomposition further confirms that this velocity variation is mainly driven by geostrophic currents’ variability (Figure 6C1), and the variance contributions of the surface and bottom Ekman terms are relatively low. It is worth noting that while the direct influence of temperature variations on CSHT is relatively minor, it can indirectly impact the transport process by modifying the density structure and geostrophic flow field (Chuang and Liang, 1994; Oey et al., 2010).
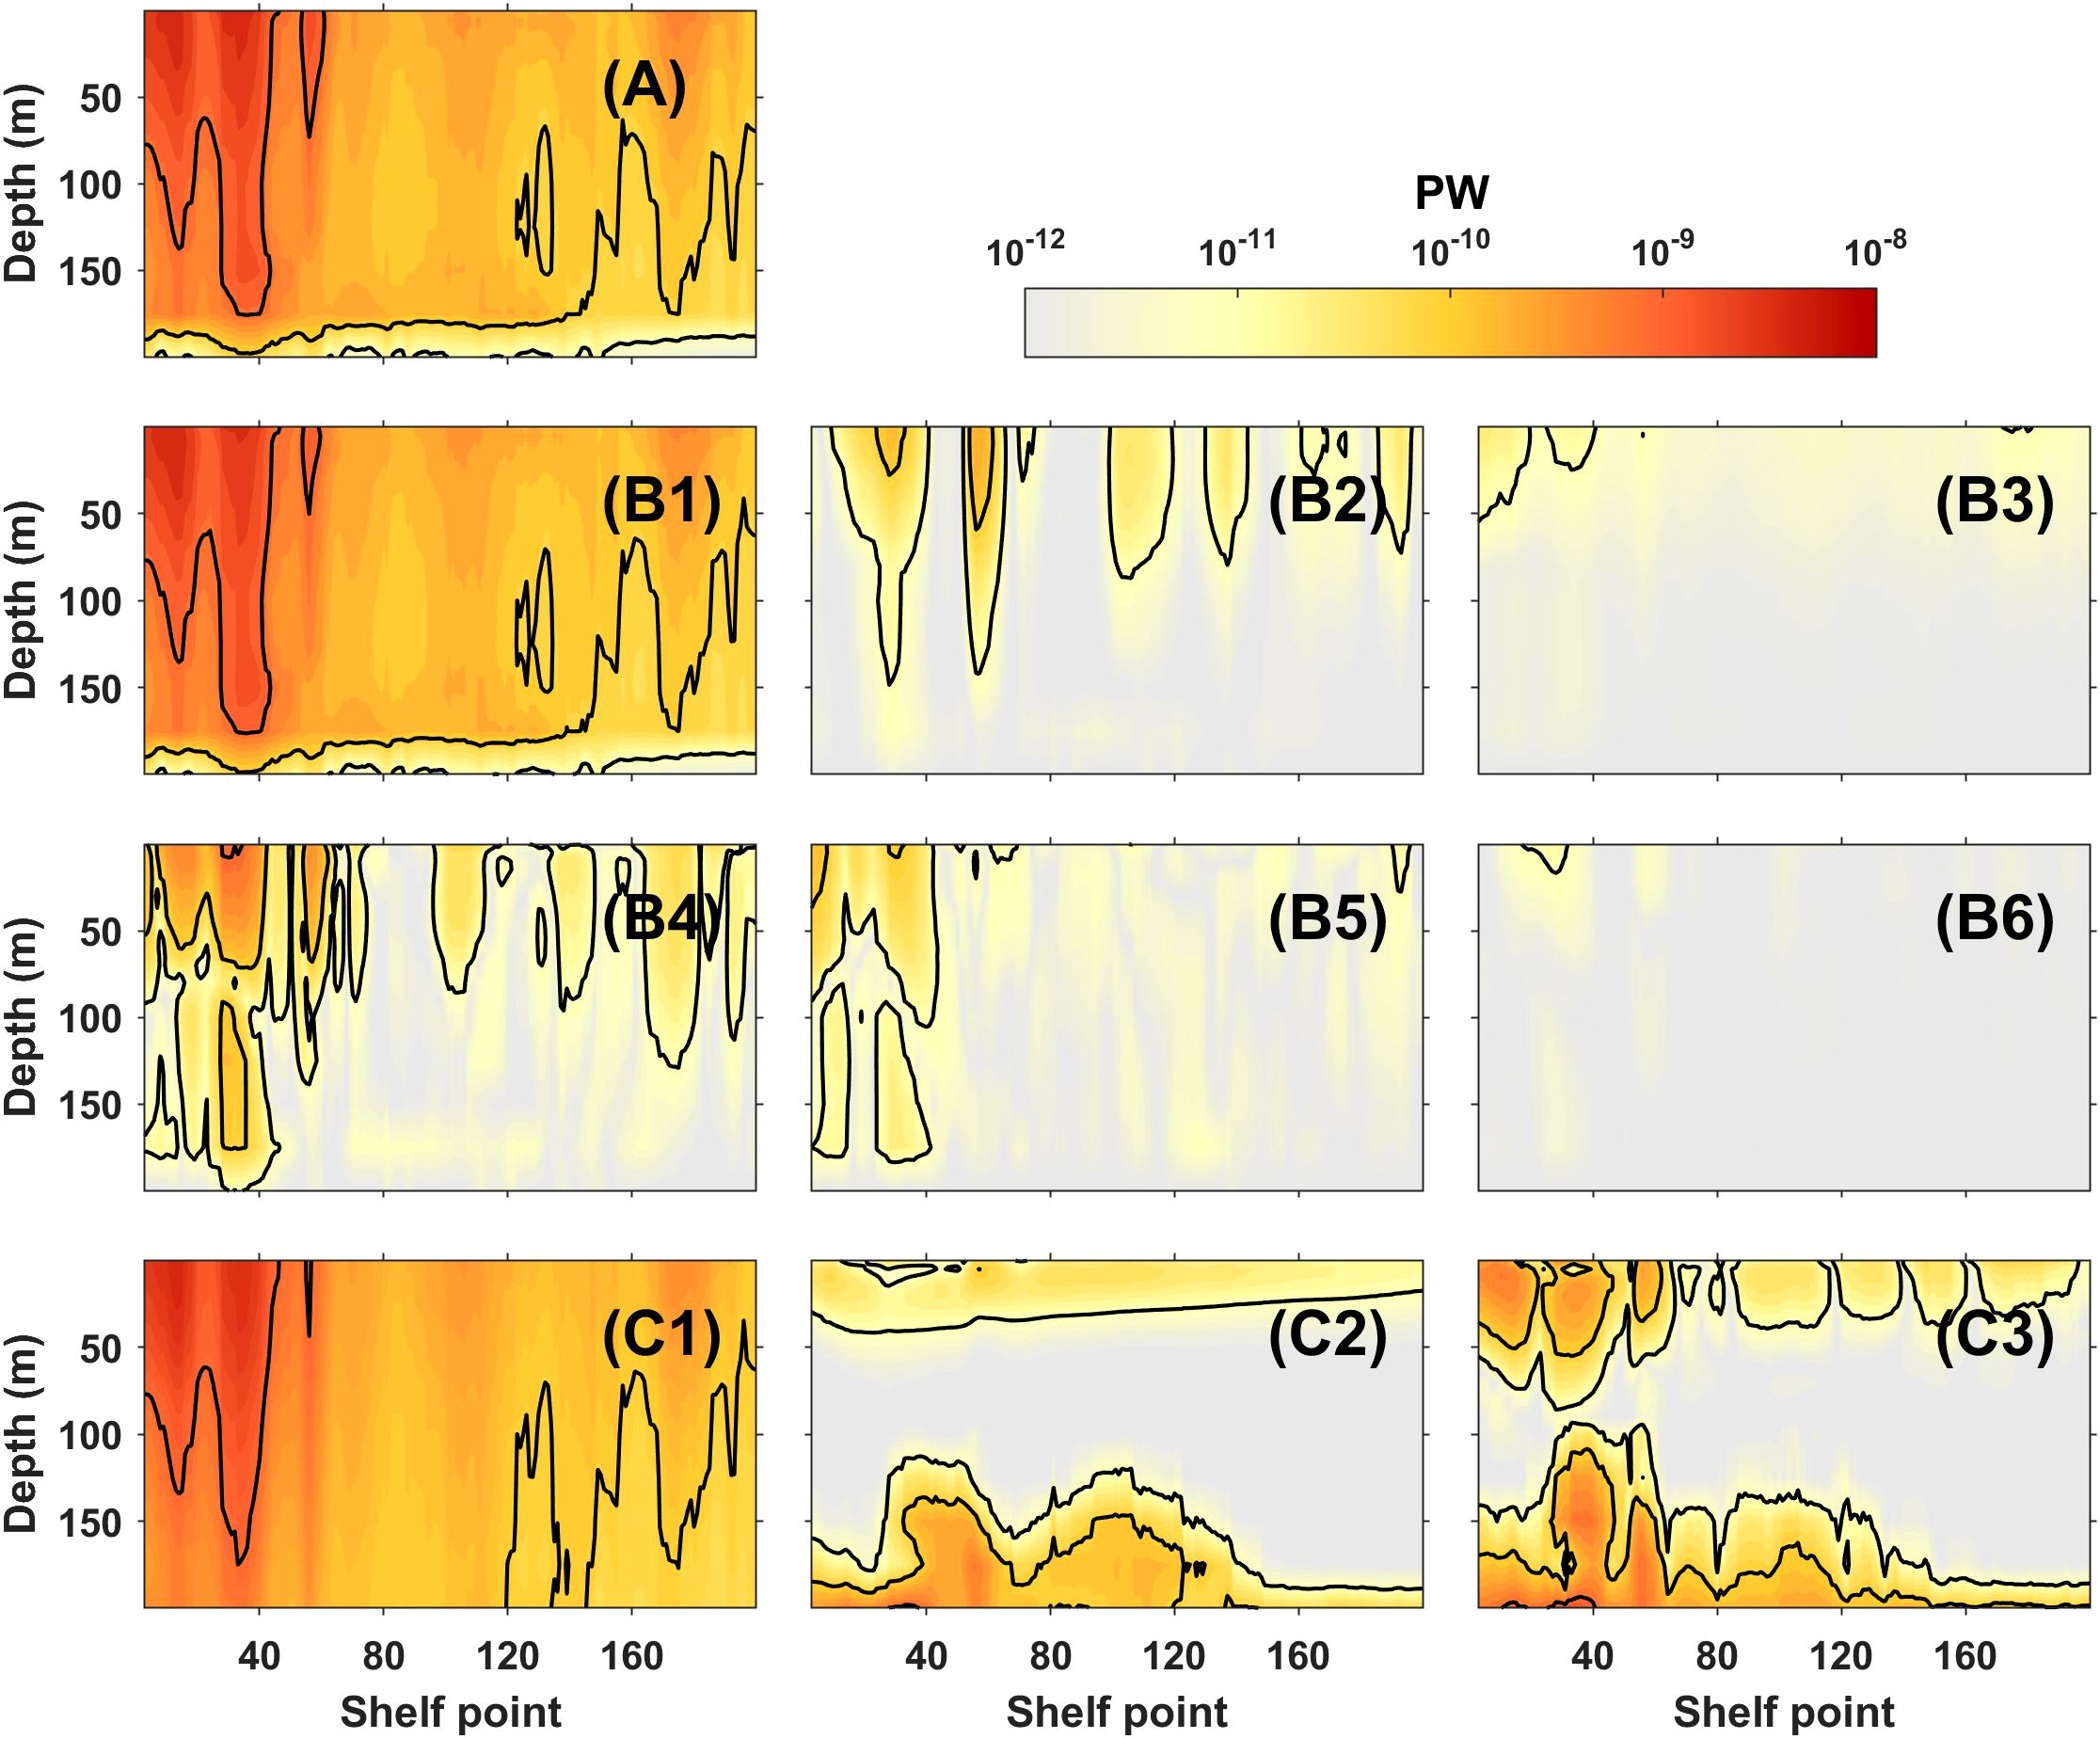
Figure 6. (A) CSHT’s variance. (B1-B6) Components of kinematic variance decomposition, i.e., , , , , , , is all omitted for the convenience of writing, latter the same. (C1-C3) Components of dynamic variance decomposition, i.e., , , . is omitted as a result of the spatial separation between the surface and bottom Ekman components.
To capture the dominant spatiotemporal modes of CSHT’s variability, Empirical Orthogonal Function (EOF) analysis is conducted (Figure 7). The results show that the first two modes of EOF explain 76% of the total variance, while the remaining modes each contribute less than half the variance of the second mode. Thus, only the first two modes are analyzed. For comparison with the mean field, time coefficients are normalized by their standard deviations, and the corresponding spatial modes are rescaled accordingly.
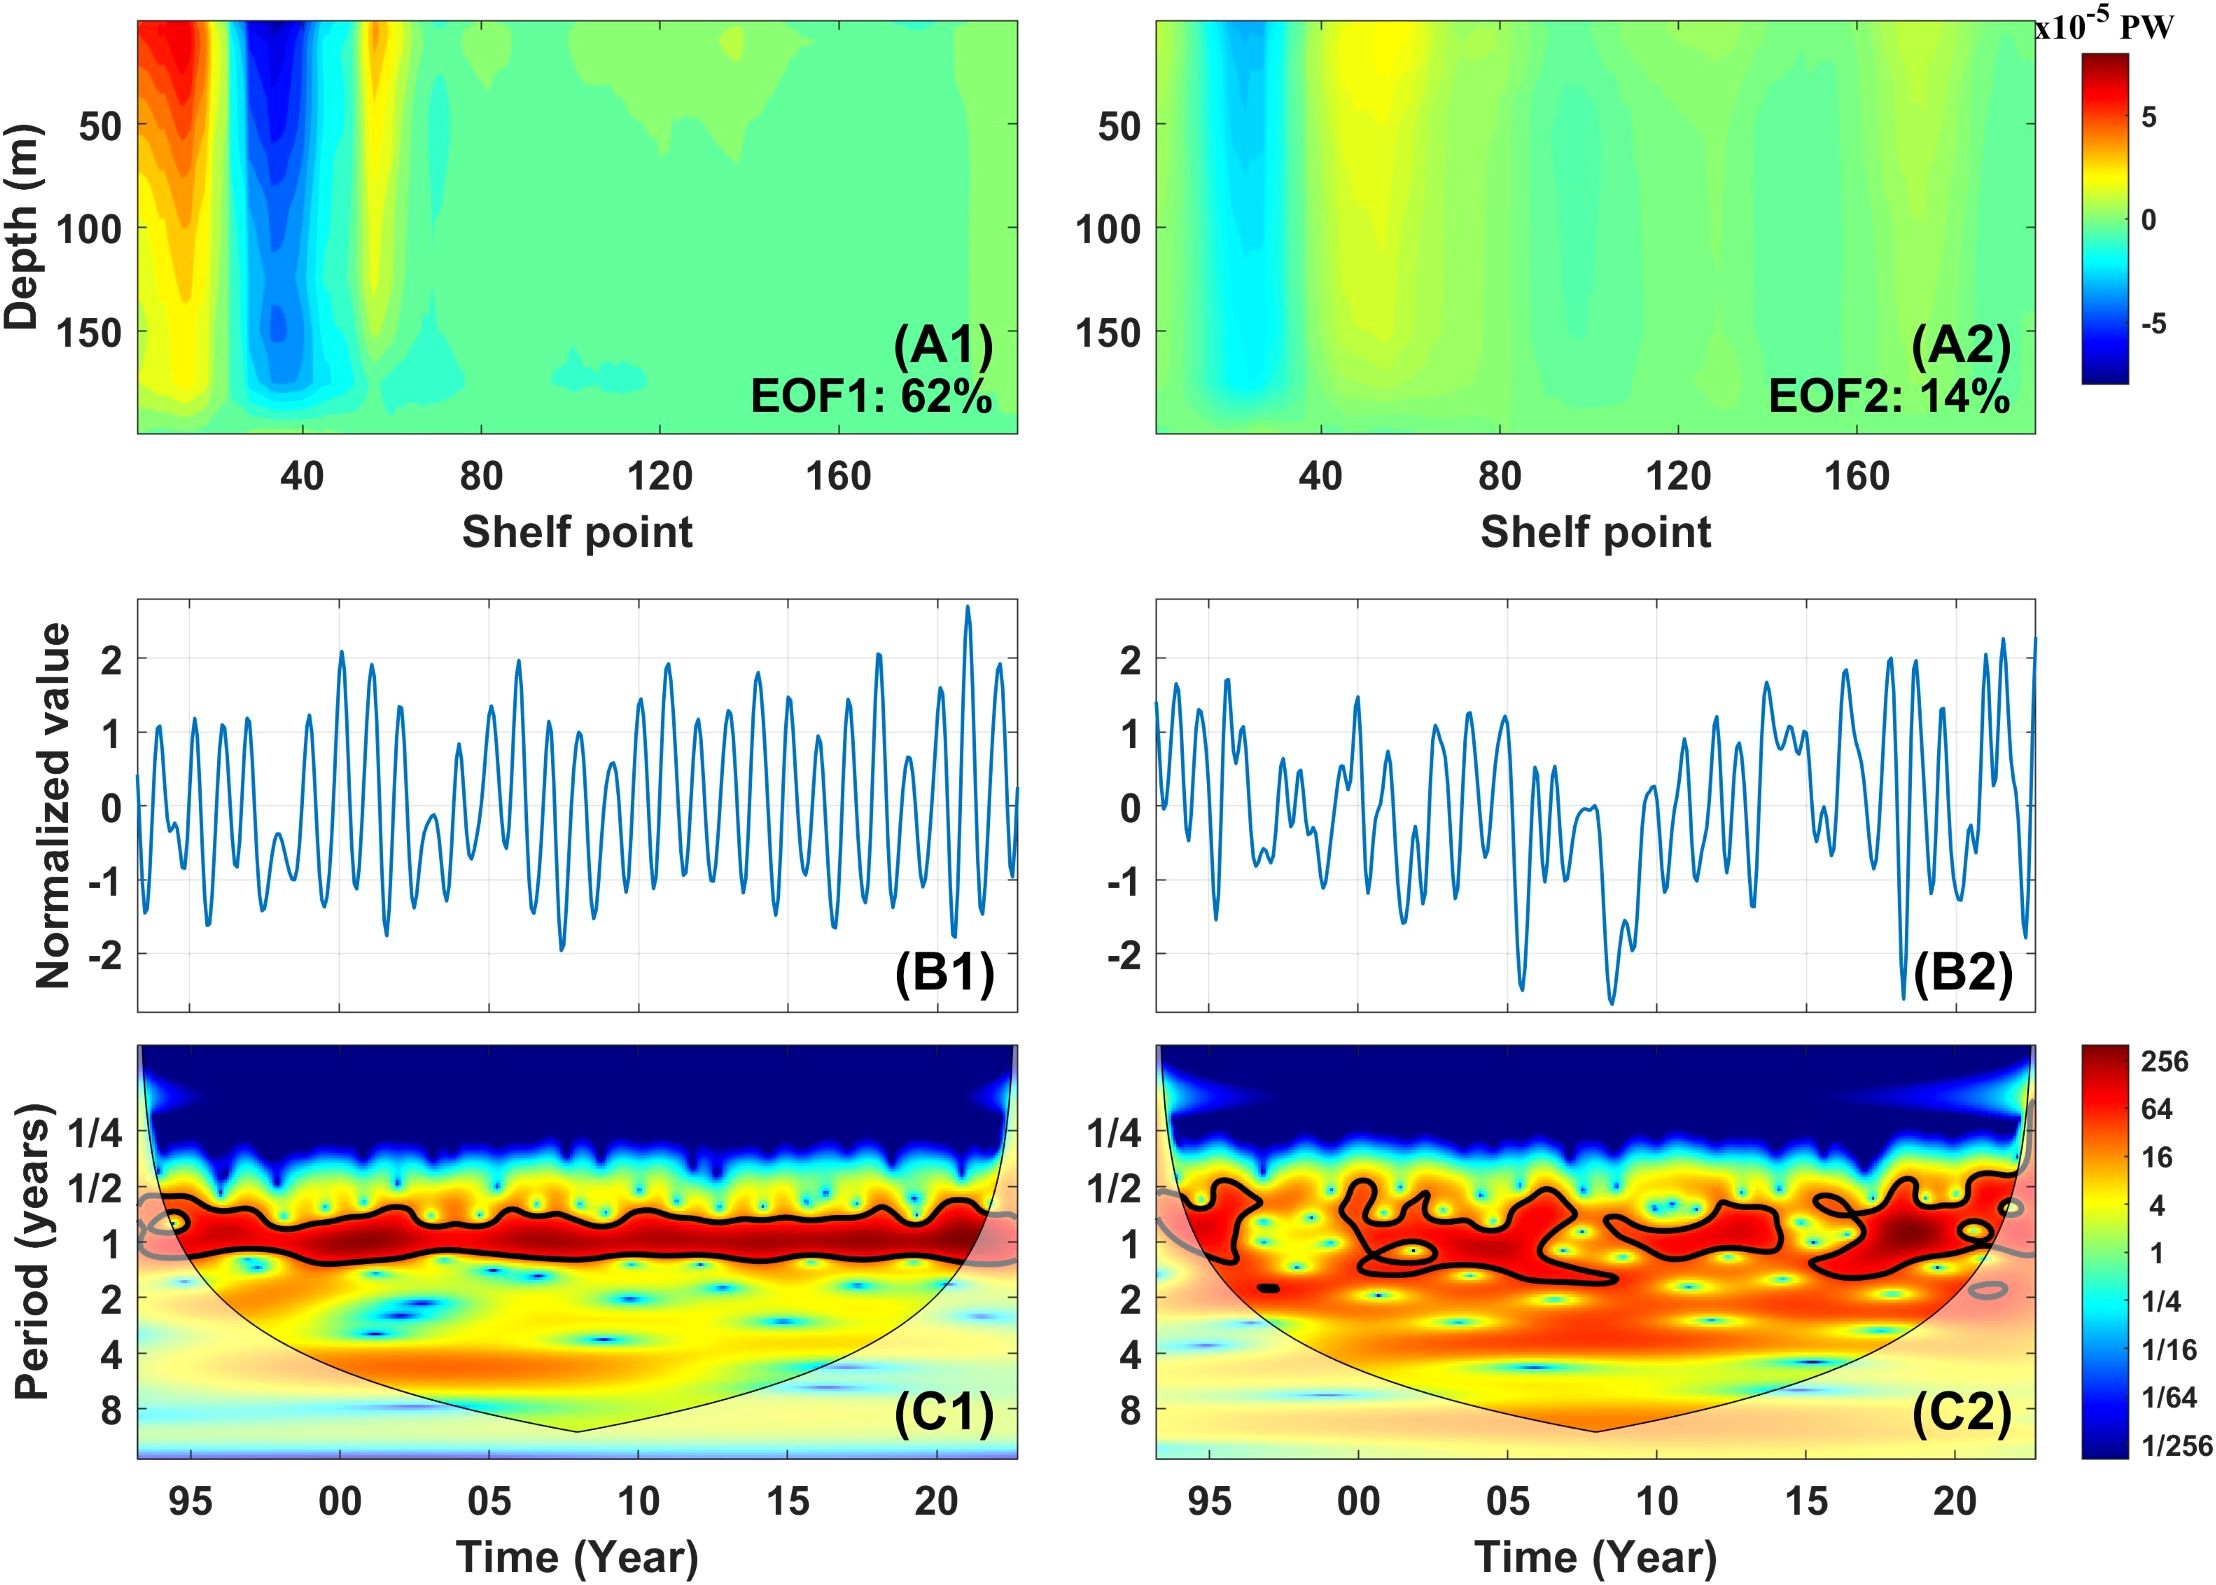
Figure 7. (A1, A2) Spatial patterns of the first and second EOF modes. (B1, B2) Standardized principal components (PC1 and PC2). (C1, C2) Wavelet power spectra of PC1 and PC2. Black contours mark regions exceeding the 5% significance level.
The first mode of EOF explains 62% of the total variance, and is characterized by a prominent upstream on-shelf/downstream off-shelf dipole structure centered in northeastern Taiwan shelf, extending throughout the water column. The associated time coefficient (PC1) exhibits a clear annual cycle, with higher values in winter and lower values in summer. The second mode of EOF explains 14% of the total variance, and the most significant feature is also located in the northeastern Taiwan shelf, although with broader spatial extent. The variation pattern of the corresponding time coefficient PC2 is not as obvious as that of PC1, but there are significant annual cycle signals in 2000-2006, 2008-2014, and 2016-2000.
Due to the pronounced seasonal characteristics of the first two EOF modes, seasonal reconstructed anomalies were performed (Figure 8). The results reveal a distinct seasonal dipole pattern off northeastern Taiwan. In winter and spring, the upstream region exhibits on-shelf anomalies, while the downstream region shows off-shelf anomalies. Conversely, this pattern reverses in summer and autumn. This dipole pattern indicates that the Kuroshio path off northeastern Taiwan shifts on-shelf during winter and spring, and off-shelf during summer and autumn, with the signal being most pronounced in winter and summer, while spring and autumn represent transitional periods.
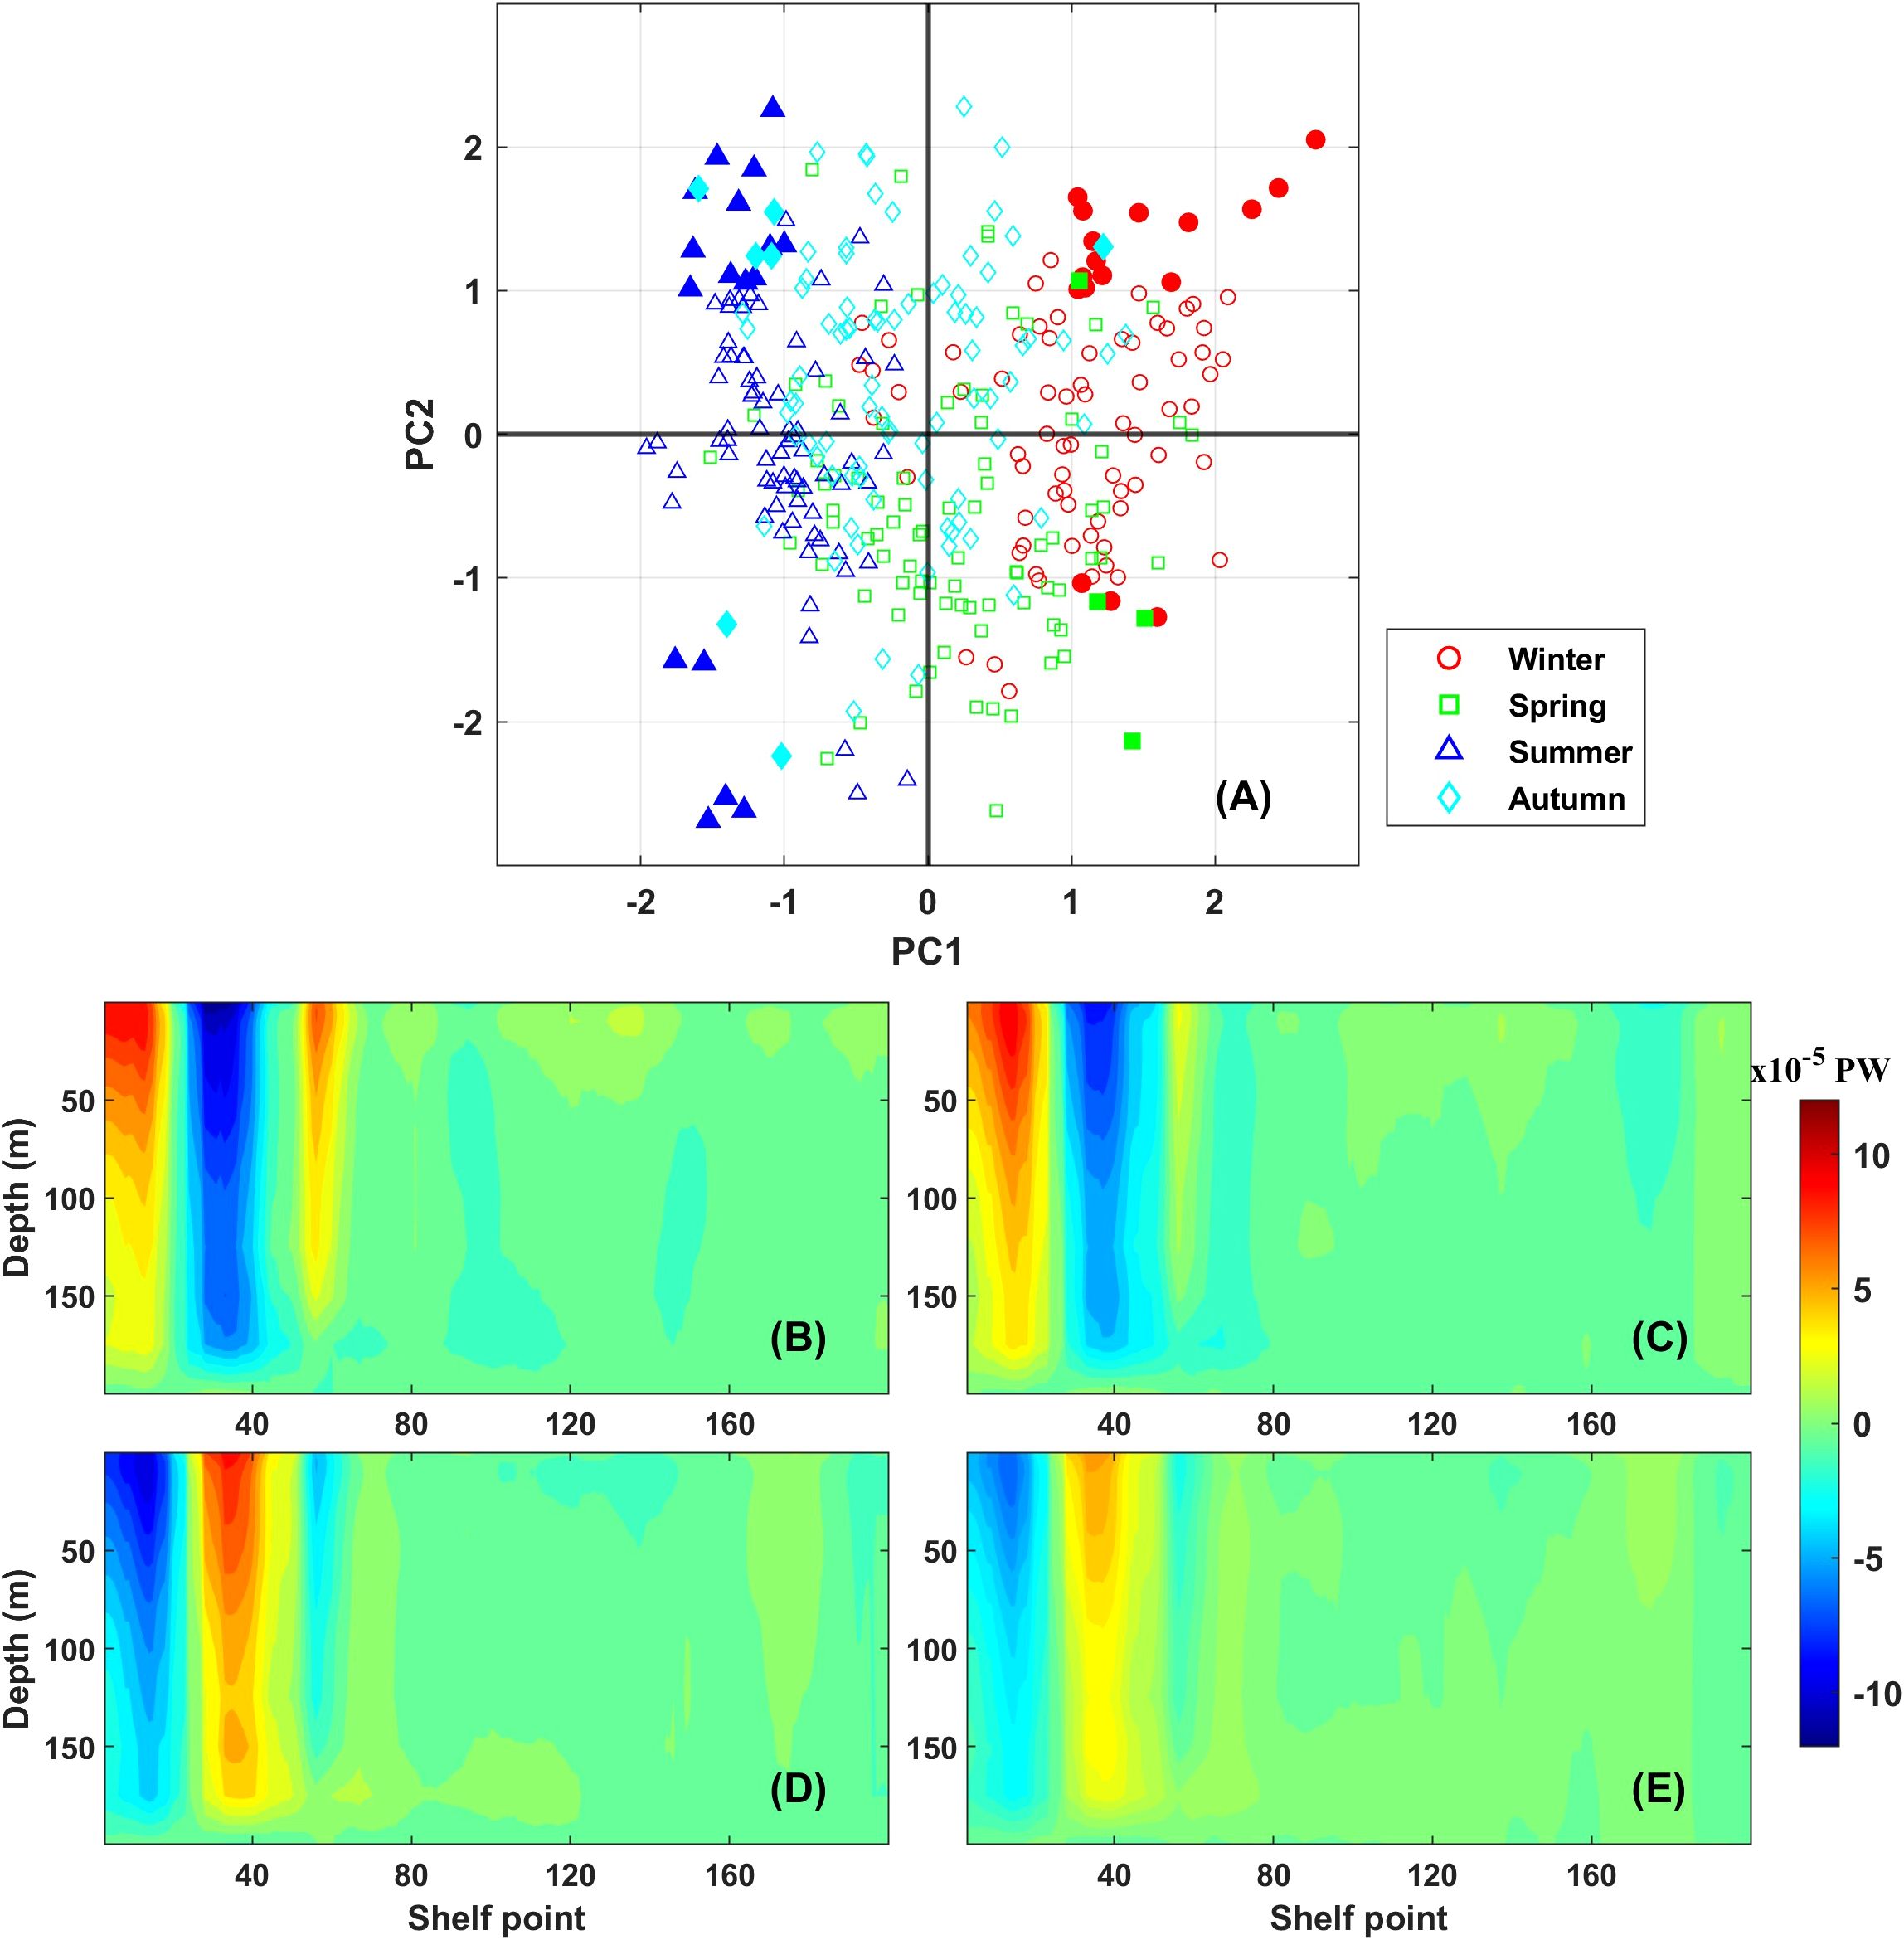
Figure 8. Seasonal reconstructed anomalies based on PC1 and PC2. (A) Scatter plot of PC1 versus PC2. The solid dots represent data points where the absolute values of both PCs exceed one standard deviation. (B–E) The spatial patterns of the EOF reconstructed for (B) winter, (C) spring, (D) summer, and (E) autumn, based on the data points marked as solid dots in (A).
4 Discussion
4.1 Comparison of net cross-shelf heat transport with previous studies
The CSHT estimated in this study, derived from integrated satellite remote sensing and in situ observations, provides a more comprehensive view compared with previous studies (Table 1). However, some uncertainties remain, primarily attributable to differences in data sources and calculation methods.
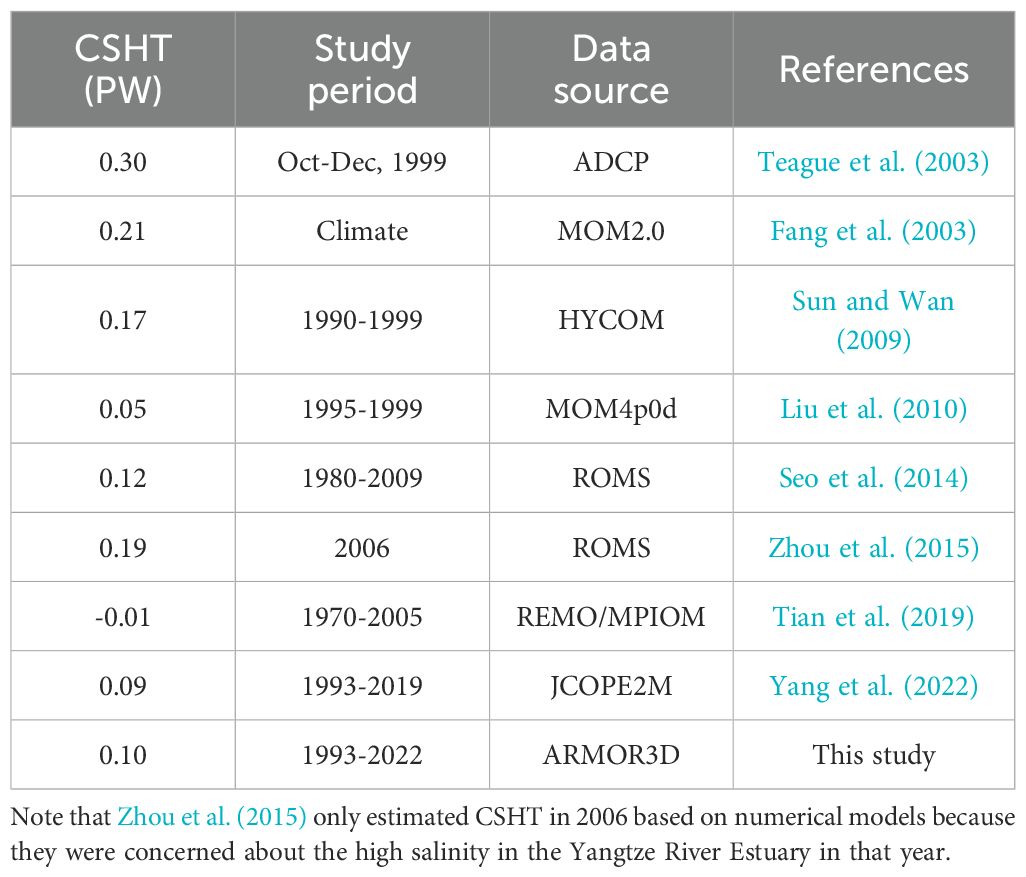
Table 1. A compilation of CSHT estimates (negative value represents output), including the respective study periods, data sources and references.
Regarding data sources, most existing studies have relied on numerical models, except for Teague et al. (2003) using in situ observations. While in situ observations offer high reliability, they are limited in temporal and spatial coverage. In contrast, model-based estimates are subject to considerable uncertainties due to differences in model configurations. With the growing availability of satellite remote sensing and advancements in its integration with in situ data, this study provides a more reliable observational foundation for assessing CSHT.
For calculation methods, early studies primarily adopted indirect approaches, such as Teague et al. (2003) inferred CSHT from measurements in the Taiwan and Korea/Tsushima Straits; Fang et al. (2003) calculated heat through a series of sections (Taiwan-Iriomote Island, Iriomote Island-Okinawa Prefecture, Okinawa Prefecture-Amami City, and Tokara Strait) and combined them to obtain CSHT; Sun and Wan (2009) derived CSHT by comparing the heat transport difference between the section east of Taiwan and Tokara Strait. Since 2010, most studies have used direct calculations along the 200 m isobath (Liu et al., 2010; Tian et al., 2019; Yang et al., 2022; Zhou et al., 2015), with the exception of Seo et al. (2014), in which heat transport across the Taiwan-Kyushu section was examined. In this study, we adopted a method analogous to that proposed by Ding et al. (2019) for diagnosing nutrient transport, allowing us to separate and analyze the contributions of distinct dynamical components to CSHT along the 200 m isobath. They have analyzed the uncertainty in the dynamic diagnostics, which primarily originates from satellite altimetry data and is approximately 20% in the ECS Kuroshio region. Although the empirical formula for the bottom Ekman current introduces uncertainty primarily in the bottom Ekman depth (via the bottom friction coefficient), its uncertainty is much smaller than the 25 m vertical resolution of ARMOR3D in 100–200 m layer, and the bottom Ekman transport itself is subordinate to the dominant geostrophic transport in the CSHT’s spatiotemporal variations.
It is worth noting that the results of this study and Tian et al. (2019) differ in the direction of CSHT, primarily due to differences in the treatment of temperature parameters. Tian et al. (2019) derived CSHT using cross-shelf velocity multiplied by temperature anomalies, which were defined relative to the mean temperature at each depth level, in contrast to our use of the full temperature field. The results obtained by this method are shown in Figure 9. Although this approach emphasizes the effect of regional temperature differences in different water layers, it may fail to capture the actual intensity and direction of CSHT.
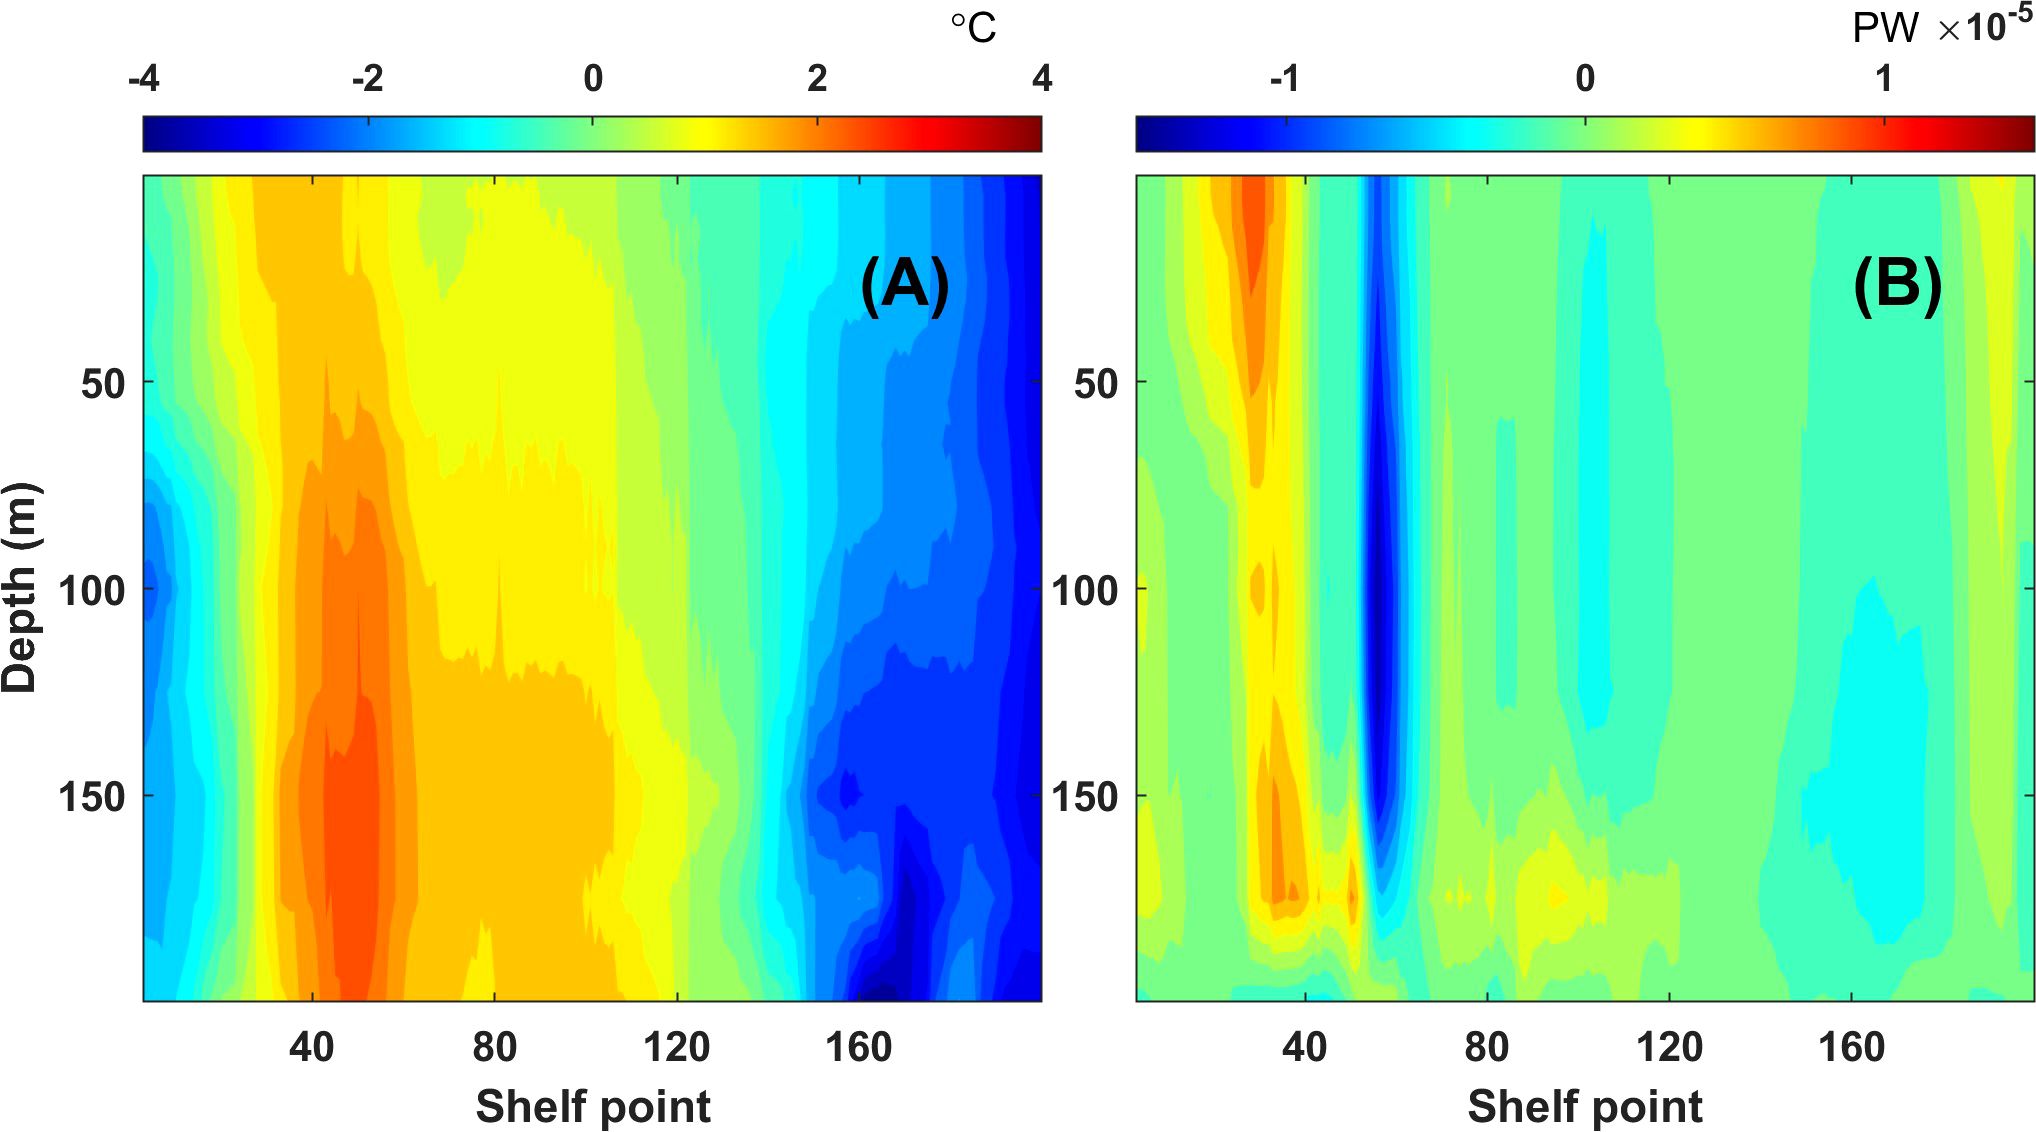
Figure 9. (A) Multi-year averaged temperature anomaly field based on layer-mean reference. (B) Corresponding CSHT field derived from (A).
4.2 Enhancement of the understanding of cross-shelf heat transport: a bidirectional perspective
The net value of CSHT is strongest in autumn and weakest in spring, while the bidirectional components exhibit the strongest values in summer and the weakest in winter, reflecting a significant seasonal phase difference. Previous studies have mainly focused on the seasonal variation of CSHT’s net value, potentially overlooking the critical regulatory role of bidirectional components in certain areas. Given the prominent unidirectional dominance of CSHT at most shelf points, this subsection further explores the seasonal distribution of CSHT at different shelf locations.
As shown in Figure 10A, the seasonal variations of CSHT exhibit significant spatial heterogeneity. The winter-summer difference is most pronounced in the northeastern Taiwan shelf: during summer (winter), the strong transport channels near the 30th and 55th shelf points are significantly enhanced (weakened), but the upstream on-shelf transport range shrinks (expands); the seasonal curves in the central shelf region largely overlap, indicating that the seasonal differences are relatively minor; the southwestern Kyushu shelf mainly show spring-autumn differences, where on-shelf transport is strengthened in autumn and significantly weakened in spring in the region around the 160th to 185th shelf points. This indicates that the northeastern Taiwan shelf is the primary contributor to the bidirectional components’ summer-strong/winter-weak characteristic, whereas the southwestern Kyushu shelf mainly contributes to the net value’s autumn-strong/spring-weak feature.
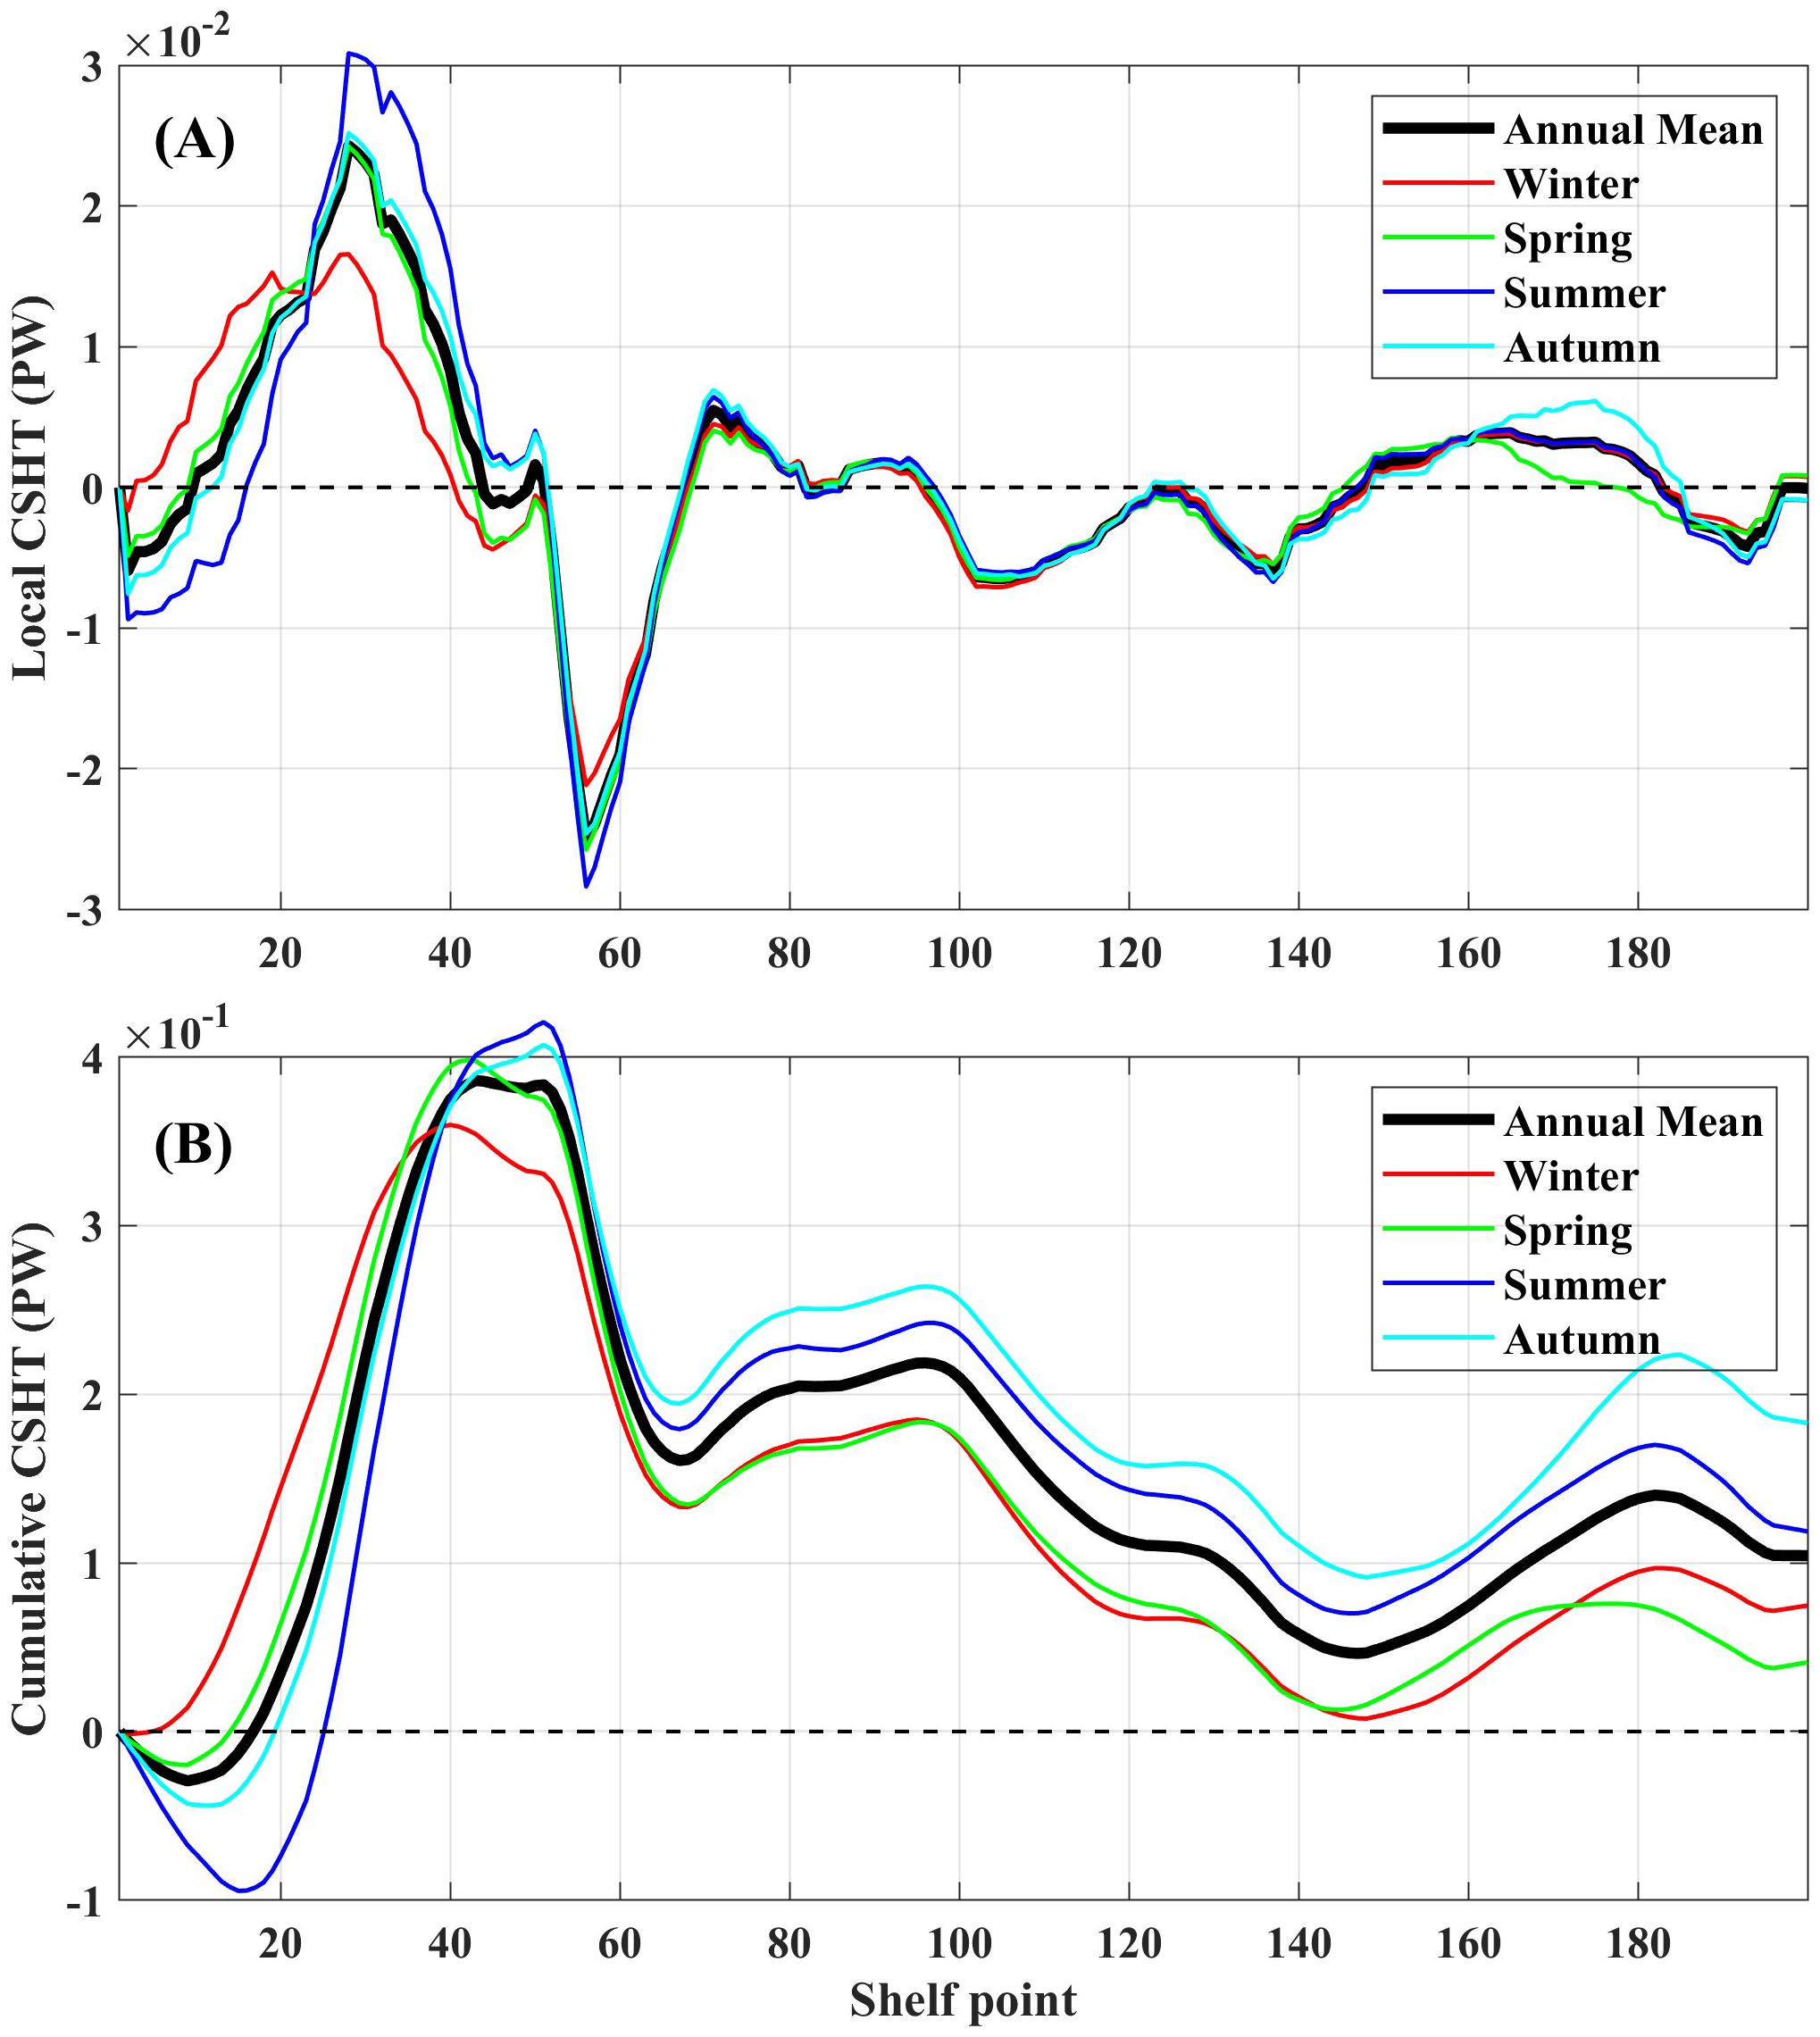
Figure 10. The annual and seasonal averaged CSHT horizontal structure (integrated along the depth). (A) shows the local CSHT at each shelf point; (B) shows the cumulative CSHT along the shelf direction starting from the first shelf point.
To further verify the above understanding, Figure 10B presents the cumulative results of CSHT along the shelf direction. It can be seen that in the northeastern Taiwan shelf, the variation in cumulative CSHT is greatest in summer and smallest in winter, highlighting this region as the primary control area for the bidirectional component’s variation. The seasonal differences in CSHT remain relatively consistent in the central shelf region. While in the southwestern Kyushu shelf, the difference between autumn and spring clearly increases (from 0.05 PW to 0.15 PW), further confirming this region’s key role in regulating the seasonal variation of the net value.
Given that CSHT exhibits dominate seasonal-cycle signals but negligible interannual periodicity, its interannual variability is manifested in specific anomalous years. For instance, the bidirectional components of the CSHT peaked simultaneously in 2001 and weakened concurrently in 1996. The former (latter) is the year when the Kuroshio is strengthened (weakened), resulting in more (less) cross-shelf bidirectional transports (Liu et al., 2014a). The weak lead-lag correlations (|r|< 0.35) between the bidirectional transport and major climate signals (ENSO, IOD, PDO, etc.) suggest no direct control. Instead, climate signals likely influence bidirectional transport indirectly by first modulating Kuroshio transport (Jo et al., 2022; Shen et al., 2014; Soeyanto et al., 2014), which subsequently drives its variability, thereby diluting the direct correlation.
Furthermore, the bidirectional perspective reveals a distinct vertical structure in CSHT: the strong bidirectional components above 150 m are essentially balanced, whereas the layer below 150 m exhibits a clear dominance of on-shelf transport. This structure is explained by differential dynamical origins. The upper-layer balance is primarily driven by geostrophic transport in the northeastern Taiwan shelf, where the Kuroshio meanders significantly and induces substantial upstream on-shelf and downstream off-shelf flows, respectively. Conversely, the deep-layer on-shelf dominance mainly stems from bottom Ekman processes in the central shelf, where the Kuroshio mainstream flows almost parallel to the shelf, resulting in a consistent on-shelf flow due to bottom friction.
Finally, CSHT not only regulates the upper ocean heat content and air-sea heat flux in the ECS (Liu et al., 2014a; Tan et al., 2020), but also influences the regional circulation structure (Brink, 2016; Su, 2001) and contributes to large-scale heat redistribution in the climate system (Hsiung, 1985). Moreover, changes in the surface thermal environment induced by CSHT may have ecological implications, potentially affecting the occurrence of algal blooms and the distribution of fish populations in the ECS (Cai et al., 2016; Yang et al., 2018a). The insights provided in this study, particularly from the perspective of CSHT’s bidirectional components, offer a new physical framework and research perspective for understanding how CSHT regulates the regional ocean-atmosphere system and marine ecological environment.
4.3 Heat transport through the Taiwan and Korea/Tsushima Straits
To gain a more comprehensive understanding of heat variability in the ECS, it is essential to consider the heat exchanges through its key lateral boundaries, namely the Taiwan Strait and the Korea/Tsushima Strait. As described in subsection 2.3, the net heat input through the Taiwan Strait (0.10 ± 0.09 PW) is comparable in magnitude to the net CSHT (0.10 ± 0.08 PW), while the Korea/Tsushima Strait serves as the primary heat outflow pathway for the ECS (-0.18 ± 0.07 PW). The air-sea heat flux, in contrast, has a relatively small net magnitude on the annual mean and follows a well-understood seasonal pattern (with heat entering the ocean in summer and being released to the atmosphere in winter). Thus, we focus on the seasonal variability and spatial structure of heat transport through the Taiwan and Korea/Tsushima Straits here.
The time series (Figures 11A–D) shows that heat transport through the Taiwan Strait consists of an on-shelf component of 0.13 ± 0.08 PW and a minor off-shelf component of -0.02 ± 0.02 PW. A significant positive correlation (r = 0.69, p< 0.01) between the bidirectional transports indicates that their intensities generally vary in opposition, with a stronger on-shelf transport corresponding to a weaker off-shelf transport, and vice versa. The structure of this seasonal cycle is illustrated by the monthly climatological anomalies, which reveal that the net and on-shelf transports are stronger in summer and weaker in winter, whereas the off-shelf component shows the opposite phase (note that for inherently negative transport values, a negative anomaly indicates a greater transport magnitude; the same applies below). In contrast, the Korea/Tsushima Strait has negligible on-shelf transport. Its net and off-shelf components are also predominantly seasonal, being weaker in winter/spring and stronger in summer/autumn.
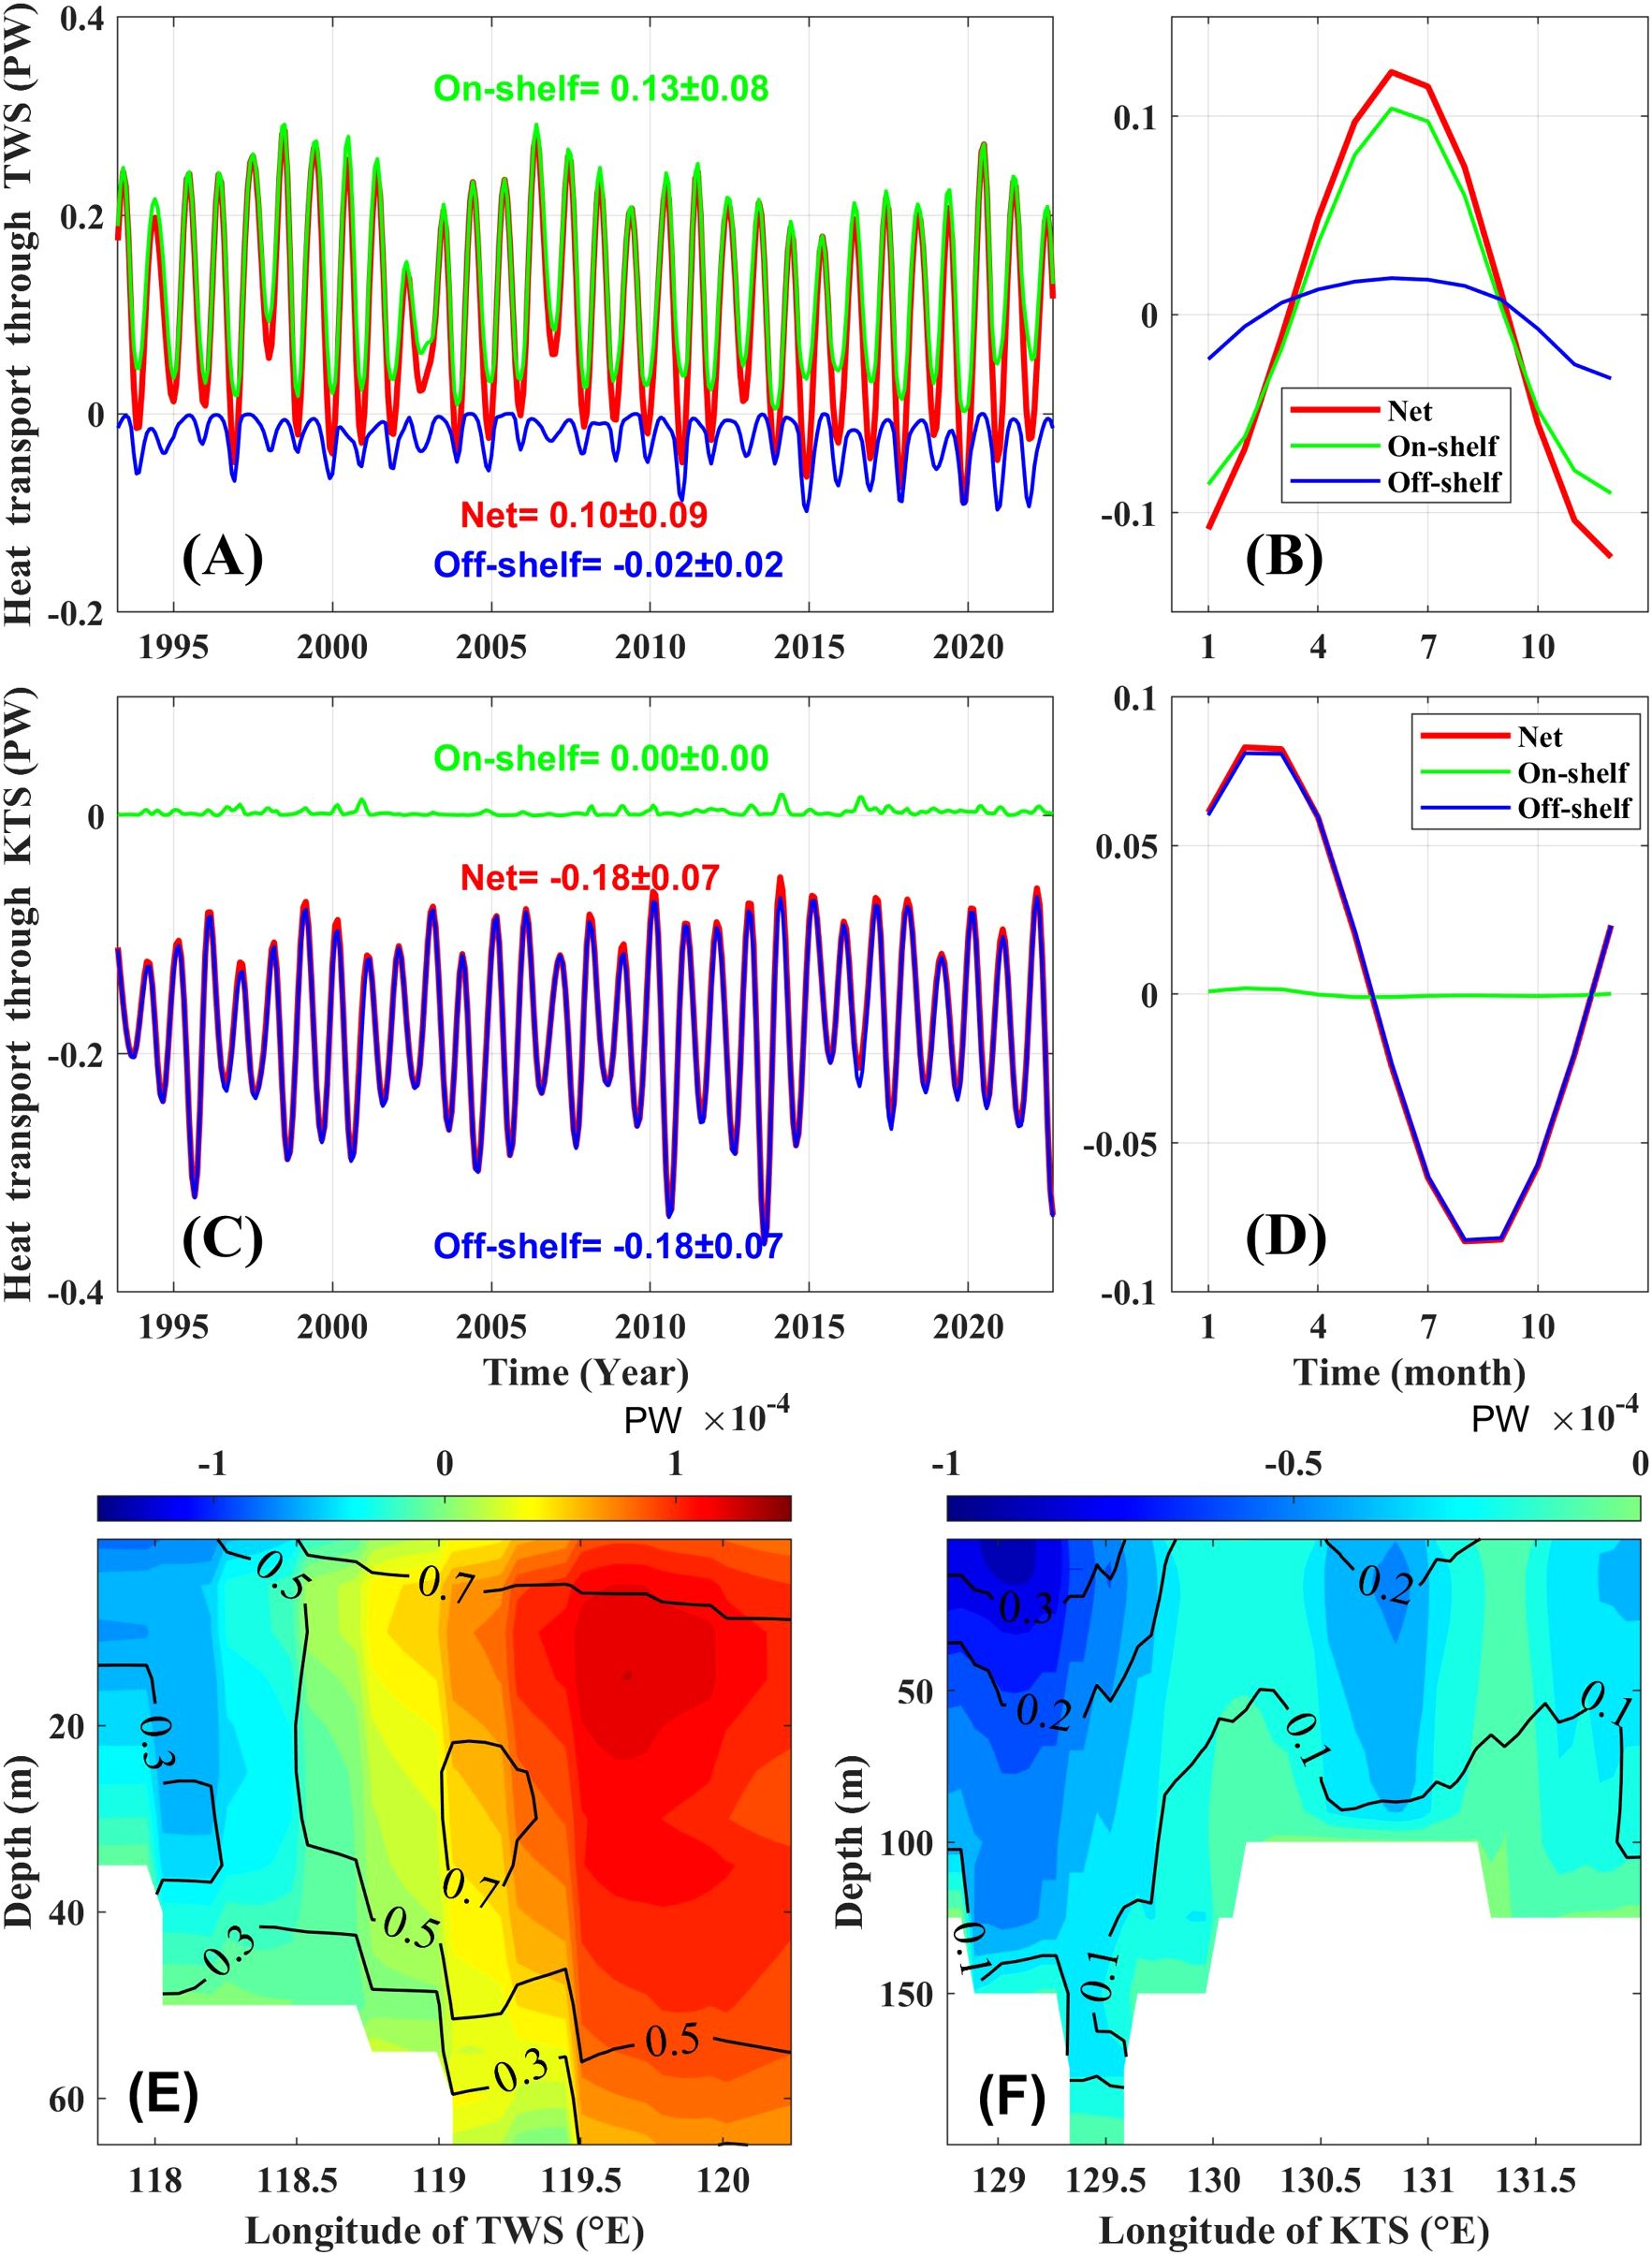
Figure 11. Heat transport through the Taiwan Strait (A, B) and the Korea/Tsushima Strait (C, D). Red, green, and blue lines represent the net, on-shelf, and off-shelf components, respectively. Heat transport distribution along the Taiwan Strait (E) and the Korea/Tsushima Strait (F). Background colors represent multi-year averages; contour lines indicate standard deviations.
The spatial structure of heat transport reveals distinct patterns through the straits (Figures 11E, F). In the Taiwan Strait, on-shelf transport dominates east of 118.5°E with greater intensity and variability, while weaker off-shelf transport is confined to the west; in contrast, the Korea/Tsushima Strait, though slightly less intense overall, is characterized by predominately off-shelf transport, which is strongest and most variable west of 129.5°E, followed by the region between 130.5°E and 131°E. Unlike the typical on-shelf/off-shelf dipole variability of CSHT, heat transport variations in both the Taiwan Strait and the Korea/Tsushima Strait generally exhibit in-phase behavior (not shown). This is consistent with the fact that the bidirectional components of the CSHT generally strengthen or weaken simultaneously, in contrast to the see-saw pattern through the Taiwan Strait, where the intensity of on-shelf and off-shelf transports varies inversely.
5 Conclusion
As a critical process governing heat exchange between the ECS shelf and the Kuroshio mainstream, CSHT plays a vital role in modulating both physical and ecological processes in the regional ocean. However, previous studies based primarily on in situ observations or numerical models have struggled to achieve a balance between observational authenticity and spatiotemporal coverage. Furthermore, the dynamic characteristics of the bidirectional components of CSHT have remained poorly understood. In response, this study utilizes a combination of satellite remote sensing and in situ observations to systematically examine the spatiotemporal variations of both net and bidirectional CSHT components over the period 1993-2022. The main findings are as follows:
1. CSHT exhibits pronounced seasonal variations, with notable phase differences between the net value and bidirectional components. During the study period, the CSHT net value was 0.10 ± 0.08 PW, with the maximum values in autumn and the minimum in spring. The bidirectional components were 0.70 ± 0.12 PW and -0.59 ± 0.08 PW, both showing the strongest values in summer and the weakest in winter.
2. CSHT generally exhibits a unidirectional dominance in the horizontal direction, with almost no reverse components in the on-shelf/off-shelf channels. Among them, the northeastern Taiwan shelf, as the strongest on-shelf and off-shelf channels for CSHT, dominates the bidirectional components’ summer-strong/winter-weak seasonal pattern. Meanwhile, the southwestern Kyushu shelf primarily contributes to the net value’s autumn-strong/spring-weak variation. Vertically, except for the bottom layer within 50 meters, where on-shelf transport predominates, the bidirectional components in other water layers tend to be balanced.
3. Dynamic mechanism analysis confirms the dominant role of geostrophic transport on CSHT. In terms of spatial distribution, the significant moderating effect of other processes (bottom Ekman transport, cf. subsection 3.3) on CSHT is observed only in the bottom 50 m of the central shelf. In terms of temporal variability, CSHT’s variability is most intense off northeastern Taiwan modulated by geostrophic currents, and its dominant EOF mode is manifested as a vertically coherent on-shelf/off-shelf dipole pattern. This discovery is the first to interpret the spatiotemporal variation characteristics of CSHT from a dynamic perspective.
In summary, this study systematically analyzes the spatiotemporal variations and dynamic causes of CSHT’s net and bidirectional components through three-dimensional diagnostic analysis of multi-source observational data, providing new physical insights into the regulation of heat in the ECS. Future research may benefit from integrating high-resolution field measurements with coupled ocean-atmosphere models to further elucidate the driving mechanisms and feedback processes of CSHT, ultimately improving predictive capacity for regional air-sea interactions and ecosystem responses.
Data availability statement
The original contributions presented in the study are included in the article/supplementary material. Further inquiries can be directed to the corresponding author.
Author contributions
WQ: Writing – review & editing, Software, Formal Analysis, Writing – original draft, Visualization, Data curation, Validation, Investigation, Methodology. RD: Software, Supervision, Methodology, Funding acquisition, Conceptualization, Formal Analysis, Writing – review & editing, Resources, Validation. JX: Software, Funding acquisition, Resources, Writing – review & editing, Project administration, Conceptualization. FZ: Project administration, Funding acquisition, Writing – review & editing, Resources.
Funding
The author(s) declare that financial support was received for the research and/or publication of this article. This research was funded by the Scientific Research Fund of the Second Institute of Oceanography, Ministry of Natural Resources, grant number JG2509; the National Science Foundation of China, grant number U23A2033; the Key R&D Program of Zhejiang Province, grant number 2024C03034; the General Program of the National Natural Science Foundation of China, grant number 22662.
Acknowledgments
We are grateful for the academic support from the School of Oceanography and the facility support from the State Key Laboratory of Satellite Ocean Environment Dynamics.
Conflict of interest
The authors declare that the research was conducted in the absence of any commercial or financial relationships that could be construed as a potential conflict of interest.
Generative AI statement
The author(s) declare that no Generative AI was used in the creation of this manuscript.
Any alternative text (alt text) provided alongside figures in this article has been generated by Frontiers with the support of artificial intelligence and reasonable efforts have been made to ensure accuracy, including review by the authors wherever possible. If you identify any issues, please contact us.
Publisher’s note
All claims expressed in this article are solely those of the authors and do not necessarily represent those of their affiliated organizations, or those of the publisher, the editors and the reviewers. Any product that may be evaluated in this article, or claim that may be made by its manufacturer, is not guaranteed or endorsed by the publisher.
References
Aroucha L. C., Veleda D., Lopes F. S., Tyaquiçã P., Lefèvre N., and Araujo M. (2020). Intra- and inter-annual variability of north Brazil current rings using angular momentum eddy detection and tracking algorithm: observations from 1993 to 2016. J. Geophys. Res.: Oceans 125, e2019JC015921. doi: 10.1029/2019jc015921
Bian C., Jiang W., and Greatbatch R. J. (2013). An exploratory model study of sediment transport sources and deposits in the Bohai Sea, Yellow Sea, and East China Sea. J. Geophys. Res.: Oceans 118, 5908–5923. doi: 10.1002/2013jc009116
Brink K. H. (2016). Cross-shelf exchange. Ann. Rev. Mar. Sci. 8, 59–78. doi: 10.1146/annurev-marine-010814-015717
Cai R., Tan H., and Qi Q. (2016). Impacts of and adaptation to inter-decadal marine climate change in coastal China seas. Int. J. Climatol. 36, 3770–3780. doi: 10.1002/joc.4591
Chuang W.-S. and Liang W.-D. (1994). Seasonal variability of intrusion of the Kuroshio water across the continental shelf northeast of Taiwan. J. Oceanog. 50, 531–542. doi: 10.1007/bf02235422
Cui X., Yang D., Sun C., Feng X., Gao G., Xu L., et al. (2021). New insight into the onshore intrusion of the kuroshio into the east China sea. J. Geophys. Res.: Oceans 126, e2020JC016248. doi: 10.1029/2020jc016248
Ding R., Huang D., Xuan J., Mayer B., Zhou F., and Pohlmann T. (2016). Cross-shelf water exchange in the East China Sea as estimated by satellite altimetry and in situ hydrographic measurement. J. Geophys. Res.: Oceans 121, 7192–7211. doi: 10.1002/2016jc011972
Ding R., Huang D., Xuan J., Zhou F., and Pohlmann T. (2019). Temporal and spatial variations of cross-shelf nutrient exchange in the east China sea, as estimated by satellite altimetry and in situ measurements. J. Geophys. Res.: Oceans 124, 1331–1356. doi: 10.1029/2018jc014496
Fang G., Wei Z., Choi B.-H., Wang K., Fang Y., and Li W. (2003). Interbasin freshwater, heat and salt transport through the boundaries of the East and South China Seas from a variable-grid global ocean circulation model. Sci. China Ser. D: Earth Sci. 46, 149–161. doi: 10.1360/03yd9014
Guinehut S., Dhomps A. L., Larnicol G., and Le Traon P. Y. (2012). High resolution 3-D temperature and salinity fields derived from in situ and satellite observations. Ocean Sci. 8, 845–857. doi: 10.5194/os-8-845-2012
Guo X., Miyazawa Y., and Yamagata T. (2006). The kuroshio onshore intrusion along the shelf break of the east China sea: the origin of the tsushima warm current. J. Phys. Oceanog. 36, 2205–2231. doi: 10.1175/jpo2976.1
Hall M. M. and Bryden H. L. (1982). Direct estimates and mechanisms of ocean heat transport. Deep. Sea Res. Part A. Oceanographic Res. Papers 29, 339–359. doi: 10.1016/0198-0149(82)90099-1
Hsin Y.-C., Qiu B., Chiang T.-L., and Wu C.-R. (2013). Seasonal to interannual variations in the intensity and central position of the surface Kuroshio east of Taiwan. J. Geophys. Res.: Oceans 118, 4305–4316. doi: 10.1002/jgrc.20323
Hsiung J. (1985). Estimates of global oceanic meridional heat transport. J. Phys. Oceanog. 15, 1405–1413. doi: 10.1175/1520-0485(1985)015<1405:Eogomh>2.0.Co;2
Hsueh Y. (2000). The kuroshio in the east China sea. J. Mar. Syst. 24, 131–139. doi: 10.1016/s0924-7963(99)00083-4
Hsueh Y., Lie H.-J., and Ichikawa H. (1996). On the branching of the Kuroshio west of Kyushu. J. Geophys. Res.: Oceans 101, 3851–3857. doi: 10.1029/95jc03754
Isobe A. (2008). Recent advances in ocean-circulation research on the Yellow Sea and East China Sea shelves. J. Oceanog. 64, 569–584. doi: 10.1007/s10872-008-0048-7
Jo S., Moon J.-H., Kim T., Song Y. T., and Cha H. (2022). Interannual modulation of kuroshio in the east China sea over the past three decades. Front. Mar. Sci. 9. doi: 10.3389/fmars.2022.909349
Kang J. and Na H. (2022). Long-term variability of the kuroshio shelf intrusion and its relationship to upper-ocean current and temperature variability in the East China sea. Front. Mar. Sci. 9. doi: 10.3389/fmars.2022.812911
Kundu P. K., Cohen I. M., and Dowling D. R. (2015). Fluid mechanics (Burlington, Massachusetts, USA: Academic press).
Li G., Qiao L., Dong P., Ma Y., Xu J., Liu S., et al. (2016). Hydrodynamic condition and suspended sediment diffusion in the Yellow Sea and East China Sea. J. Geophys. Res.: Oceans 121, 6204–6222. doi: 10.1002/2015jc011442
Liu X., Chen D., Dong C., and He H. (2015). Variation of the Kuroshio intrusion pathways northeast of Taiwan using the Lagrangian method. Sci. China Earth Sci. 59, 268–280. doi: 10.1007/s11430-015-5176-5
Liu X., Dong C., Chen D., and Su J. (2014b). The pattern and variability of winter Kuroshio intrusion northeast of Taiwan. J. Geophys. Res.: Oceans 119, 5380–5394. doi: 10.1002/2014jc009879
Liu N., Eden C., Dietze H., Wu D., and Lin X. (2010). Model-based estimate of the heat budget in the East China Sea. J. Geophys. Res. 115, C08026. doi: 10.1029/2009jc005869
Liu Z. and Gan J. (2012). Variability of the Kuroshio in the East China Sea derived from satellite altimetry data. Deep. Sea Res. Part I: Oceanographic Res. Papers 59, 25–36. doi: 10.1016/j.dsr.2011.10.008
Liu Z., Gan J., Hu J., Wu H., Cai Z., and Deng Y. (2021). Progress of studies on circulation dynamics in the East China sea: the kuroshio exchanges with the shelf currents. Front. Mar. Sci. 8. doi: 10.3389/fmars.2021.620910
Liu C., Wang F., Chen X., and von Storch J.-S. (2014a). Interannual variability of the Kuroshio onshore intrusion along the East China Sea shelf break: Effect of the Kuroshio volume transport. J. Geophys. Res.: Oceans 119, 6190–6209. doi: 10.1002/2013jc009653
Mulet S., Rio M. H., Mignot A., Guinehut S., and Morrow R. (2012). A new estimate of the global 3D geostrophic ocean circulation based on satellite data and in-situ measurements. Deep. Sea Res. Part II: Topical Stud. Oceanog. 77-80, 70–81. doi: 10.1016/j.dsr2.2012.04.012
Oey L.-Y., Hsin Y.-C., and Wu C.-R. (2010). Why does the Kuroshio northeast of Taiwan shift shelfward in winter? Ocean Dynamics 60, 413–426. doi: 10.1007/s10236-009-0259-5
Seo G.-H., Cho Y.-K., and Choi B.-J. (2014). Variations of heat transport in the northwestern Pacific marginal seas inferred from high-resolution reanalysis. Prog. Oceanog. 121, 98–108. doi: 10.1016/j.pocean.2013.10.005
Shen M.-L., Tseng Y.-H., Jan S., Young C.-C., and Chiou M.-D. (2014). Long-term variability of the Kuroshio transport east of Taiwan and the climate it conveys. Prog. Oceanog. 121, 60–73. doi: 10.1016/j.pocean.2013.10.009
Soeyanto E., Guo X., Ono J., and Miyazawa Y. (2014). Interannual variations of Kuroshio transport in the East China Sea and its relation to the Pacific Decadal Oscillation and mesoscale eddies. J. Geophys. Res.: Oceans 119, 3595–3616. doi: 10.1002/2013jc009529
Su J. (2001). A review of circulation dynamics of the coastal oceans near China. Acta Oceanol. Sin. 23, 1–16.
Sun S. and Wan B. (2009). Seasonal and interannual variations of the heat and salt transports between Kuroshio and the costal oceans near China. J. East China Normal. Univ. (Natural Science) 2009, 98–107.
Tan H., Cai R., Yan X., and Li C. (2020). Amplification of Winter Sea surface temperature response over East China Seas to global warming acceleration and slowdown. Int. J. Climatol. 41, 2082–2099. doi: 10.1002/joc.6948
Teague W. J., Jacobs G. A., Ko D. S., Tang T. Y., Chang K. I., and Suk M. S. (2003). Connectivity of the Taiwan, cheju, and korea straits. Continental. Shelf Res. 23, 63–77. doi: 10.1016/s0278-4343(02)00150-4
Tian D., Su J., Zhou F., Mayer B., Sein D., Zhang H., et al. (2019). Heat budget responses of the eastern China seas to global warming in a coupled atmosphere-ocean model. Climate Res. 79, 109–126. doi: 10.3354/cr01579
Wang P., Mao K., Chen X., and Liu K. (2022). The three-dimensional structure of the mesoscale eddy in the kuroshio extension region obtained from three datasets. J. Mar. Sci. Eng. 10, 1754. doi: 10.3390/jmse10111754
Wang J. and Oey L. Y. (2014). Inter-annual and decadal fluctuations of the Kuroshio in East China Sea and connection with surface fluxes of momentum and heat. Geophys. Res. Lett. 41, 8538–8546. doi: 10.1002/2014gl062118
Wei Y., Ding R., Huang D., Xuan J., Li H., Zhang J., et al. (2023). The weakened upwelling at the upstream kuroshio in the East China sea induced extensive sea surface warming. Geophys. Res. Lett. 50, e2022GL101835. doi: 10.1029/2022gl101835
Wu C.-R., Hsin Y.-C., Chiang T.-L., Lin Y.-F., and Tsui I. F. (2014). Seasonal and interannual changes of the Kuroshio intrusion onto the East China Sea Shelf. J. Geophys. Res.: Oceans 119, 5039–5051. doi: 10.1002/2013jc009748
Yang M. (2019). Temporal and Spatial Variability of Heat Transport of the Kuroshio in the East China sea (Tianjin, China: Tianjin University of Science & Technology).
Yang M., Guo X., Zheng J., and Sun Q. (2022). Long-term trend and inter-annual variation of ocean heat content in the bohai, yellow, and East China seas. Water 14, 2763. doi: 10.3390/w14172763
Yang D. Z., Huang R. X., Yin B. S., Feng X. R., Chen H. Y., Qi J. F., et al. (2018b). Topographic beta spiral and onshore intrusion of the kuroshio current. Geophys. Res. Lett. 45, 287–296. doi: 10.1002/2017gl076614
Yang D., Yin B., Chai F., Feng X., Xue H., Gao G., et al. (2018a). The onshore intrusion of Kuroshio subsurface water from February to July and a mechanism for the intrusion variation. Prog. Oceanog. 167, 97–115. doi: 10.1016/j.pocean.2018.08.004
Yu F., Sun F., Li J., and Chen G. (2022). An offshore subsurface thermal structure inversion method by coupling ensemble learning and tide model for the South Yellow Sea. Front. Mar. Sci. 9. doi: 10.3389/fmars.2022.1075938
Yuan D., Zhu J., Li C., and Hu D. (2008). Cross-shelf circulation in the Yellow and East China Seas indicated by MODIS satellite observations. J. Mar. Syst. 70, 134–149. doi: 10.1016/j.jmarsys.2007.04.002
Zhang J., Guo X., Zhao L., Miyazawa Y., and Sun Q. (2017). Water Exchange across Isobaths over the Continental Shelf of the East China Sea. J. Phys. Oceanog. 47, 1043–1060. doi: 10.1175/jpo-d-16-0231.1
Zhang D., Johns W. E., and Lee T. N. (2002). The seasonal cycle of meridional heat transport at 24°N in the North Pacific and in the global ocean. J. Geophys. Res. 107, 20–1–20–24. doi: 10.1029/2001jc001011
Keywords: East China Sea, cross-shelf, heat transport, geostrophic, Ekman
Citation: Qin W, Ding R, Xuan J and Zhou F (2025) Spatiotemporal variations and dynamic mechanisms of cross-shelf heat transport in the East China Sea. Front. Mar. Sci. 12:1673613. doi: 10.3389/fmars.2025.1673613
Received: 26 July 2025; Accepted: 17 November 2025; Revised: 22 October 2025;
Published: 03 December 2025.
Edited by:
Kyung-Ae Park, Seoul National University, Republic of KoreaReviewed by:
YoungHo Kim, Pukyong National University, Republic of KoreaKyungJae Lee, Incheon National University, Republic of Korea
Ergang Lian, Tongji University, China
Copyright © 2025 Qin, Ding, Xuan and Zhou. This is an open-access article distributed under the terms of the Creative Commons Attribution License (CC BY). The use, distribution or reproduction in other forums is permitted, provided the original author(s) and the copyright owner(s) are credited and that the original publication in this journal is cited, in accordance with accepted academic practice. No use, distribution or reproduction is permitted which does not comply with these terms.
*Correspondence: Ruibin Ding, ZGluZ3J1aWJpbkBzaW8ub3JnLmNu