Abstract
Marine macroalgae play an important yet underrecognized role in coastal and benthic carbon cycling, with recent attention focusing on their contribution to blue carbon storage via detrital pathways. However, their ecological significance remains underrepresented in molecular monitoring studies, partly due to the absence of dedicated genetic markers for sedimentary detection. Here, we developed and validated a novel environmental DNA (eDNA) primer set, DSea-9, targeting a hypervariable region of the nuclear 18S rRNA gene optimized for macroalgal detection in marine sediments. The primer was designed by aligning over 7,000 macroalgal sequences and was evaluated through in silico PCR and in vitro amplification of 30 macroalgal species from Phaeophyceae, Rhodophyta, and Ulvophyceae. Field validation was performed on coastal and offshore sediment eDNA, with taxonomic assignments via PR2, SILVA, and NCBI databases. DSea-9 demonstrated high in silico coverage (>85–90%) and significantly improved the detection of macroalgal taxa such as Alaria and Palmaria, compared to conventional universal primers. Notably, DSea-9 enabled consistent detection of macroalgal DNA across a wide depth range, including the deepest sampled station (933 m), demonstrating its sensitivity to low-abundance DNA templates in offshore sediments. Overall, DSea-9 provides a sensitive and scalable tool for sedimentary eDNA monitoring of macroalgal biodiversity. Its application can contribute to refining biodiversity baselines, tracking macroalgal detritus dispersal, and strengthening the ecological representation of macroalgae in blue carbon assessments and sustainable marine management frameworks.
1 Introduction
The acceleration of global climate change has brought renewed urgency to our understanding and management of natural carbon sinks. As atmospheric CO2 levels continue to rise due to anthropogenic greenhouse gas emissions, identifying and safeguarding ecosystems with high carbon sequestration potential has become a core strategy in climate mitigation frameworks (Friedlingstein et al., 2022; Hu et al., 2022; Nayak et al., 2022). Among these, coastal and marine ecosystems are increasingly recognized for their capacity to act as significant carbon sinks, a function collectively referred to as “blue carbon” (Brink et al., 2007; McLeod et al., 2011). Traditionally, blue carbon studies have focused on vegetated coastal habitats such as mangroves, seagrasses, and salt marshes, where organic carbon is both fixed via photosynthesis and stored long-term in sediments. However, recent scientific discourse has drawn attention to the overlooked role of marine macroalgae as emerging blue carbon contributors (Krause-Jensen and Duarte, 2016; Raven, 2018; Pessarrodona et al., 2023).
Compared to seagrass and mangroves, macroalgae have been underrepresented in blue carbon studies, not only due to their allochthonous nature but also due to the lack of effective molecular detection tools. Despite their ecological importance, few studies have developed dedicated molecular markers for macroalgal detritus detection in sediments, representing a critical methodological gap. Macroalgae form a diverse and globally distributed group of primary producers in marine systems. While most macroalgae are not rooted in sediment like seagrasses or marsh plants, a significant proportion of the carbon they fix is exported as detritus into deeper waters and sediments, where it may be buried and stored for long periods (Krause-Jensen and Duarte, 2016; Ortega et al., 2019; Ager et al., 2023). This process—termed “detached blue carbon sequestration”—is increasingly considered a vital, albeit underappreciated, pathway in the oceanic carbon cycle. Unlike other coastal blue carbon ecosystems, however, the contribution of macroalgae to carbon storage remains difficult to quantify, owing in part to their allochthonous nature and the limited availability of monitoring tools suited to track their fate in sedimentary environments (Pessarrodona et al., 2023; Ross et al., 2023; Yamuza-Magdaleno et al., 2024).
Recent advances in environmental DNA (eDNA) technologies have revolutionized biodiversity monitoring and ecological assessments in aquatic ecosystems. By capturing traces of genetic material shed by organisms into the environment, eDNA enables non-invasive, highly sensitive detection of taxa across diverse habitats. DNA metabarcoding, which combines eDNA with high-throughput sequencing and taxon-specific molecular markers, has been successfully applied to fish, invertebrates, and microbial communities in both water and sediment samples (Yang et al., 2018; Zhang et al., 2018, 2023; Díaz et al., 2020). However, despite the growing utility of this method, the development of genetic markers specifically targeting macroalgae remains in its infancy. Most eDNA studies either lack the taxonomic resolution to identify macroalgal sequences or use universal primers biased toward other eukaryotic lineages. This methodological gap hampers our ability to detect and attribute macroalgae-derived organic matter in benthic environments, limiting our understanding of their spatial distribution, persistence, and long-term ecological functions, including carbon sequestration.
Early advances in eukaryotic eDNA metabarcoding were pioneered through the development of short 18S rRNA gene markers targeting hypervariable regions such as V4 and V9. Amaral-Zettler et al. (2009) first demonstrated the use of the V9 region for protistan diversity profiling in marine environments, followed by Stoeck et al. (2010) who refined this approach to reveal highly complex eukaryotic assemblages from anoxic waters (Amaral-Zettler et al., 2009; Stoeck et al., 2010). Subsequent studies, including Guardiola et al. (2015), extended the application of these primers to deep-sea sediments, showing that short 18S fragments can recover ecologically informative eukaryotic signals even from degraded DNA (Guardiola et al., 2015). In addition to the V4 and V9 regions, the V7 hypervariable domain of the 18S rRNA gene has also been widely employed in marine benthic eDNA studies. For instance, previous research first demonstrated that V7-based amplicons can recover diverse eukaryotic signatures from deep-sea sediments, showing its robustness for degraded DNA templates (Guardiola et al., 2015). More recent research has further confirmed the utility of the V7 region for profiling benthic eukaryotic communities in sediment environments (Ørberg et al., 2025). These V7-targeting approaches, together with the V4 and V9 frameworks, have collectively advanced our understanding of eukaryotic diversity and provided reference points for developing group-specific primers such as DSea-9. These pioneering efforts established the foundation of modern eukaryotic metabarcoding and demonstrated the practicality of short amplicons for environmental sequencing. However, despite continuous improvements in database curation and taxonomic resolution (Hadziavdic et al., 2014; Choi and Park, 2020; Egge et al., 2021), universal 18S primers remain biased toward protists and metazoans, providing limited coverage of macroalgal lineages. This gap underscores the need for a marker system specifically optimized for macroalgae detection in sedimentary eDNA.
Universal primers widely used for eukaryotic metabarcoding, such as those targeting the V4 or V9 regions, often show limited affinity for macroalgal templates due to mismatches at conserved flanking sites and insufficient reference representation of algal lineages in public databases. Consequently, macroalgal sequences are typically under-detected or misclassified in sediment eDNA datasets, despite their ecological importance.
Given this context, there is a pressing need for dedicated molecular tools that can enhance the detectability of macroalgae in sedimentary eDNA studies. The development of such markers would not only improve biodiversity assessments in macroalgal-dominated ecosystems, but also enable more accurate quantification of macroalgae-derived carbon burial in marine sediments. These insights are crucial for assessing the true magnitude of macroalgae contributions to blue carbon dynamics and integrating them into climate policies and carbon accounting frameworks.
In this study, we present a newly designed eDNA primer set, DSea-9, targeting the V9 region of the nuclear-encoded 18S rRNA gene, optimized for the detection of macroalgal DNA in marine sediments. Our marker was developed through an in silico and experimental pipeline informed by full-length rRNA sequences from a broad taxonomic range of red, green, and brown algae, as well as representative non-target marine taxa. The targeted region was selected to maximize taxonomic resolution while minimizing amplification bias from non-algal groups. We validated the marker’s performance through both in vitro PCR on extracted macroalgae genomic DNA and in situ sediment eDNA samples collected from macroalgal-dominated coastal habitats. Amplicon libraries were sequenced using high-throughput Illumina platforms, and the resulting data were processed using state-of-the-art bioinformatic pipelines to assess marker specificity, sensitivity, and ecological informativeness.
Similar marker-development strategies have proven effective in other taxonomic groups. For instance, the MiFish primers revolutionized fish community monitoring by enabling high-resolution detection of hundreds of species through a short mitochondrial 12S rRNA fragment (Miya et al., 2015). Likewise, protistan studies using the 18S V4 and V9 regions (Amaral-Zettler et al., 2009; Stoeck et al., 2010; Egge et al., 2021) demonstrated how region-specific primer optimization can greatly improve ecological resolution. These precedents inspired the rationale behind DSea-9, which adopts the same design philosophy—a short, taxon-focused amplicon optimized for degraded environmental templates—but applies it specifically to macroalgal eDNA in marine sediments.
Our work builds upon and complements previous pioneering efforts in eDNA marker development. In addition to its ecological significance, the ability to trace macroalgal detritus in sediments via eDNA can contribute to emerging sustainable seaweed industries by providing biodiversity baselines to support environmentally responsible aquaculture practices (Ørberg et al., 2023; Jueterbock et al., 2025). Furthermore, sedimentary eDNA monitoring offers a complementary tool for marine spatial planning, aiding the designation of suitable cultivation areas, tracking ecosystem services, and minimizing potential ecological conflicts within the rapidly growing blue economy framework. For example, the MiFish primers revolutionized fish community monitoring by enabling the high-resolution detection of hundreds of fish species through a short mitochondrial 12S rRNA fragment (Miya et al., 2015). Similarly, studies targeting protistan diversity have leveraged hypervariable regions of the 18S rRNA gene to unlock microbial eukaryotic richness in environmental samples (Amaral-Zettler et al., 2009; Stoeck et al., 2010; Choi and Park, 2020; Egge et al., 2021). Inspired by these efforts, our study addresses a previously unmet need for macroalgae-specific eDNA primers suited to sedimentary environments, where much of the exported algal detritus is likely to accumulate and persist.
Beyond its methodological novelty, the implications of this study are broad and interdisciplinary. By facilitating the reliable detection of macroalgae-derived DNA in marine sediments, the newly developed marker can be applied to identify macroalgal hotspots, map detritus dispersal, and characterize long-term depositional patterns. This approach not only advances biodiversity monitoring in benthic ecosystems but also contributes to an improved understanding of the role of macroalgae in ecosystem services, thereby supporting sustainable marine resource management and emerging blue economy initiatives. In particular, these molecular tools can complement spatial planning efforts and promote responsible macroalgae aquaculture by providing baseline data on natural detritus accumulation and distribution patterns.
In an era where the blue economy is rapidly expanding—with macroalgae aquaculture positioned as a key sector—robust tools for monitoring macroalgae presence and ecological contributions are increasingly needed. The marker system developed in this study addresses a critical gap in detecting and quantifying macroalgae contributions to sedimentary biodiversity and carbon storage, offering a complementary tool for ecosystem-based management strategies that balance ecological conservation with sustainable industry growth. The following sections describe the primer design rationale, its validation through both in silico and in vitro analyses, and its comparative performance against established universal primers (V7 and V9) using coastal and deep-sea sediment eDNA. Also, the primer design process, experimental validation, and application to natural sediment samples are described. Subsequently, the ecological relevance of macroalgae-derived eDNA detection in marine sediments is discussed, with particular emphasis on its potential application as a molecular proxy for biodiversity monitoring, habitat connectivity, and assessments of macroalgal detritus deposition relevant to blue carbon research and sustainable marine management.
2 Materials and methods
2.1 Primer development
2.1.1 Primer design
To identify a suitable region within the 18S rRNA gene for species-level discrimination based on environmental DNA (eDNA), a total of 7,462 18S rRNA gene sequences were batch-downloaded from the NCBI nucleotide database in FASTA format as of July 2023 (search terms: “Phaeophyceae 18S”, “Rhodophyta 18S”, and “Ulvophyceae 18S”). After initial download, sequences shorter than 1,000 bp or containing >1% ambiguous bases (N) were excluded to retain only high-quality, near-full-length sequences suitable for primer design. Incomplete or partial sequences lacking the targeted V9 region were also removed following manual inspection. After removing problematic or incomplete sequences, 7,114 high-quality NCBI reference sequences were retained for further analysis. Sequence filtering was performed using Geneious Prime (v.2023.2.2, Biomatters Ltd.), and the remaining sequences were aligned with MAFFT v7.490 using the automatic alignment mode with multi-threading. The alignments were visually inspected in Geneious to locate conserved and hypervariable regions. Particular attention was given to identifying a short hypervariable segment (<200 bp) flanked by highly conserved sites, suitable for paired-end sequencing with the Illumina MiSeq platform. During method development, several candidate regions of the 18S rRNA gene (V2, V4, V7, and V9) were preliminarily evaluated for macroalgal eDNA applications. Among these, the V9 domain was selected because it provided the most consistent primer-binding conservation across Phaeophyceae, Rhodophyta, and Ulvophyceae while maintaining sufficient internal variability for taxonomic discrimination. Its short amplicon length (~130 bp) further ensured compatibility with degraded sedimentary DNA and full overlap in Illumina paired-end sequencing. Degenerate base positions were incorporated during primer design to accommodate intra-group nucleotide variation, and the final primer pair was selected based on its target coverage within the alignment. In addition, the primer set was evaluated in silico for the presence of potential secondary structures, including hairpin loops and self-dimerization, using OligoAnalyzer version 3.19 (Integrated DNA Technologies). Primer specificity was subsequently evaluated by both in silico simulation (Section 2.1.2) and wet-lab amplification (Section 2.1.3).
2.1.2 In silico evaluation of interspecific variation
To assess the taxonomic coverage and specificity of the newly designed degenerate primer set, an in silico PCR simulation was conducted using the NCBI Primer-BLAST tool. A total of 32 possible primer pairs were generated by expanding all combinations of five degenerate positions (four in the forward and one in the reverse primer: W, R, and Y) within the forward and reverse primer sequences. Each unique primer pair was individually tested against the NCBI nucleotide collection (nr/nt) database, with the search restricted to target taxa (Phaeophyceae, Rhodophyta, and Ulvophyceae) to evaluate taxonomic coverage. In addition, a complementary search without taxonomic restriction was conducted to evaluate off-target amplification potential across the full nucleotide database. For each primer combination, the predicted amplicon sequences and taxonomic assignments were reviewed. The combined results confirmed that the degenerate primer set consistently amplified the intended macroalgal groups while maintaining high taxonomic resolution, with no significant amplification of non-target taxa. Detailed PCR conditions are described in Section 2.1.3.
2.1.3 Primer testing with extracted DNA from macroalgae
To evaluate the universality of the newly developed DSea-9-F/R primer set (excluding adapter sequences), genomic DNA was extracted from 30 macroalgal species representing the three major lineages—Phaeophyceae, Rhodophyta, and Chlorophyta—using the AccuPrep Plant Genomic DNA Extraction Kit (Bioneer, Daejeon, Republic of Korea). These species encompassed 10 orders and 20 families (Table 1). Double-stranded genomic DNA concentrations were measured using a UV-VIS spectrophotometer (Shimadzu UV-1900i, Shimadzu, Japan), and each sample was diluted to 10 ng μL-1 with sterile distilled water.
Table 1
| Taxon (Phylum/Class) | Family | Species name | Identification level | Collection site | Collection date | accession no. | Length (bp) |
|---|---|---|---|---|---|---|---|
| Ochrophyta/Phaeophyceae | Dictyotaceae | Dictyota sp. | Genus | Pohang-si, South Korea | Aug/2021 | PQ662671 | 137 |
| Ochrophyta/Phaeophyceae | Scytosiphonaceae | Colpomenia sp. | Genus | Pohang-si, South Korea | Mar/2024 | PQ656365 | 137 |
| Ochrophyta/Phaeophyceae | Scytosiphonaceae | Scytosiphon lomentaria | Species | Pohang-si, South Korea | Mar/2024 | PQ662697 | 137 |
| Ochrophyta/Phaeophyceae | Scytosiphonaceae | Scytosiphon sp. | Genus | Pohang-si, South Korea | Mar/2023 | PQ662675 | 137 |
| Ochrophyta/Phaeophyceae | Sargassaceae | Sargassum confusum | Species | Jeju-do, South Korea | Aug/2022 | PQ656372 | 139 |
| Ochrophyta/Phaeophyceae | Sargassaceae | Sargassum fulvellum | Species | Pohang-si, South Korea | Mar/2024 | PQ656366 | 139 |
| Ochrophyta/Phaeophyceae | Sargassaceae | Sargassum sp. | Genus | Dokdo, South Korea | Jun/2024 | PQ656301 | 139 |
| Ochrophyta/Phaeophyceae | Sargassaceae | Sargassum thunbergii | Species | Jeju-do, South Korea | Aug/2022 | PQ656374 | 139 |
| Ochrophyta/Phaeophyceae | Alariaceae | Undaria peterseniana | Species | Ulleungdo, South Korea | Jun/2024 | PV405783 | 137 |
| Ochrophyta/Phaeophyceae | Alariaceae | Undaria pinnatifida | Species | Jindo-gun, South Korea | Apr/2023 | PQ662733 | 137 |
| Ochrophyta/Phaeophyceae | Laminariaceae | Saccharina japonica | Species | Jindo-gun, South Korea | Apr/2023 | PQ662730 | 137 |
| Ochrophyta/Phaeophyceae | Lessoniaceae | Ecklonia cava | Species | Dokdo, South Korea | Jun/2024 | PV404781 | 137 |
| Ochrophyta/Phaeophyceae | Lessoniaceae | Ecklonia sp. | Genus | Jeju-do, South Korea | Aug/2022 | PQ656373 | 137 |
| Ochrophyta/Phaeophyceae | Lessoniaceae | Eisenia bicyclis | Species | Ulleungdo, South Korea | Sep/2023 | PQ662747 | 137 |
| Ochrophyta/Phaeophyceae | Lessoniaceae | Eisenia sp. | Genus | Ulleungdo, South Korea | May/2024 | PV405782 | 137 |
| Ochrophyta/Phaeophyceae | Sporochnaceae | Carpomitra costata | Species | Ulleungdo, South Korea | Sep/2023 | PV440944 | 137 |
| Rhodophyta/Florideophyceae | Corallinaceae | Bossiella orbigniana | Species | Jeju-do, South Korea | Aug/2022 | PQ656370 | 138 |
| Rhodophyta/Florideophyceae | Corallinaceae | Corallina declinata | Species | Pohang-si, South Korea | Mar/2023 | PQ662686 | 138 |
| Rhodophyta/Florideophyceae | Corallinaceae | Corallinoideae sp. | Subfamily | Tongyeong-si, South Korea | Oct/2022 | PQ656309 | 138 |
| Rhodophyta/Florideophyceae | Lithophyllaceae | Amphiroa dilatata | Species | Jeju-do, South Korea | Oct/2022 | PQ656377 | 138 |
| Rhodophyta/Florideophyceae | Gigartinaceae | Chondrus crispus | Species | Pohang-si, South Korea | Mar/2023 | PQ662673 | 138 |
| Rhodophyta/Florideophyceae | Phyllophoraceae | Prionitis sternbergii | Species | Pohang-si, South Korea | Aug/2021 | PV405786 | 140 |
| Rhodophyta/Florideophyceae | Gracilariaceae | Gracilaria mammillari. | Species | Pohang-si, South Korea | Sep/2023 | PQ662694 | 137 |
| Rhodophyta/Florideophyceae | Halymeniaceae | Pachymeniopsis lanceolata | Species | Pohang-si, South Korea | Mar/2023 | PQ662687 | 140 |
| Rhodophyta/Florideophyceae | Halymeniaceae | Prionitis sp. | Genus | Pohang-si, South Korea | Mar/2023 | PQ662676 | 140 |
| Rhodophyta/Florideophyceae | Schizymeniaceae | Schizymenia sp. | Genus | Jindo-gun, South Korea | Apr/2023 | PQ662732 | 139 |
| Rhodophyta/Florideophyceae | Plocamiaceae | Plocamium maggsiae | Species | Dokdo, South Korea | Sep/2023 | PQ656302 | 138 |
| Rhodophyta/Florideophyceae | Plocamiaceae | Plocamium sp. | Genus | Jeju-do, South Korea | Aug/2024 | PQ656166 | 138 |
| Rhodophyta/Florideophyceae | Rhodymeniaceae | Rhodymenia intricata | Species | Dokdo, South Korea | Sep/2023 | PQ662669 | 139 |
| Chlorophyta/Ulvophyceae | Cladophoraceae | Cladophora pellucidoidea | Species | Jindo-gun, South Korea | Apr/2023 | PQ662731 | 132 |
| Chlorophyta/Ulvophyceae | Cladophoraceae | Cladophora prolifera | Species | Jeju-do, South Korea | Aug/2022 | PQ656369 | 132 |
| Chlorophyta/Ulvophyceae | Kornmanniaceae | Blidingia sp. | Genus | Jindo-gun, South Korea | Apr/2023 | PQ662735 | 138 |
| Chlorophyta/Ulvophyceae | Ulvaceae | Ulva arasakii | Species | Pohang-si, South Korea | Aug/2023 | PQ662689 | 138 |
| Chlorophyta/Ulvophyceae | Ulvaceae | Ulva australis | Species | Pohang-si, South Korea | Aug/2021 | PQ662670 | 138 |
| Chlorophyta/Ulvophyceae | Ulvaceae | Ulva compressa | Species | Jindo-gun, South Korea | Apr/2023 | PQ662737 | 138 |
| Chlorophyta/Ulvophyceae | Ulvaceae | Ulva flexuosa | Species | Pohang-si, South Korea | Mar/2023 | PQ662688 | 139 |
| Chlorophyta/Ulvophyceae | Ulvaceae | Ulva linza | Species | Jindo-gun, South Korea | Apr/2023 | PQ662742 | 139 |
A list of macroalgae species for testing DSea-9 primers (without adapter sequences) using extracted DNA diluted to 5 ng μL-1 subsequently sequenced with a Sanger method. Identification level indicates the lowest taxonomic rank uniquely distinguishable by the obtained 18S sequence, based on sequence similarity and alignment results.
PCR was performed in a 20 μL total reaction volume using a commercial premix (Bioneer, Daejeon, Republic of Korea). Each reaction mixture consisted of 17 μL of triple-distilled water, 1 μL of each primer (10 pmol), and 1 μL of DNA template (10 ng μL-1). A negative control, in which no template DNA was added, was included in each experimental set.
The thermal cycling profile included an initial denaturation at 95°C for 5 minutes, followed by 30 cycles of denaturation at 95°C for 30 seconds, annealing at 53°C for 30 seconds, and extension at 72°C for 30 seconds. The annealing temperature (53°C) and the number of cycles (30) were selected based on preliminary gradient PCR tests conducted between 50°C and 56°C using representative red, brown, and green algal DNA templates. The chosen conditions produced consistent amplification across lineages without non-specific bands, and representative gel electrophoresis images are provided in Supplementary Figure S1. A final extension step was carried out at 72°C for 5 minutes. PCR products were visualized through agarose gel electrophoresis to verify the expected amplicon size and subsequently purified using the ELPIS PCR Clean-Up Kit (ELPIS, Daejeon, Republic of Korea). Purified PCR products were ligated into the pGEM-T Easy vector (Promega, WI, USA) and transformed into Escherichia coli DH5α competent cells. Plasmid DNA was extracted using the Dokdo Mini-Prep Kit (ELPIS, Daejeon, Republic of Korea). Sequencing reactions were performed via Sanger sequencing, and resulting sequences were edited and assembled using Geneious Prime (v.2023.2.2, Biomatters Ltd.). Final sequences were deposited in the NCBI GenBank database.
2.2 Primer testing with eDNA
2.2.1 Sample collection
Coastal sediment: To evaluate the versatility of the newly developed primers for eDNA-based metabarcoding, coastal sediment was collected from Yangpo Port (35.880735° N, 129.519754° E), located in Pohang, Republic of Korea (Figure 1). Sampling was conducted via SCUBA diving, and approximately half the volume of a 50 mL tube was filled with sediment. DNA Shield (Zymo Research, Irvine, CA, USA) was immediately added, and samples were transported and stored at 4°C until laboratory processing. Upon arrival at the laboratory, a portion of each sample was aliquoted and stored at –80°C until further analysis.
Figure 1
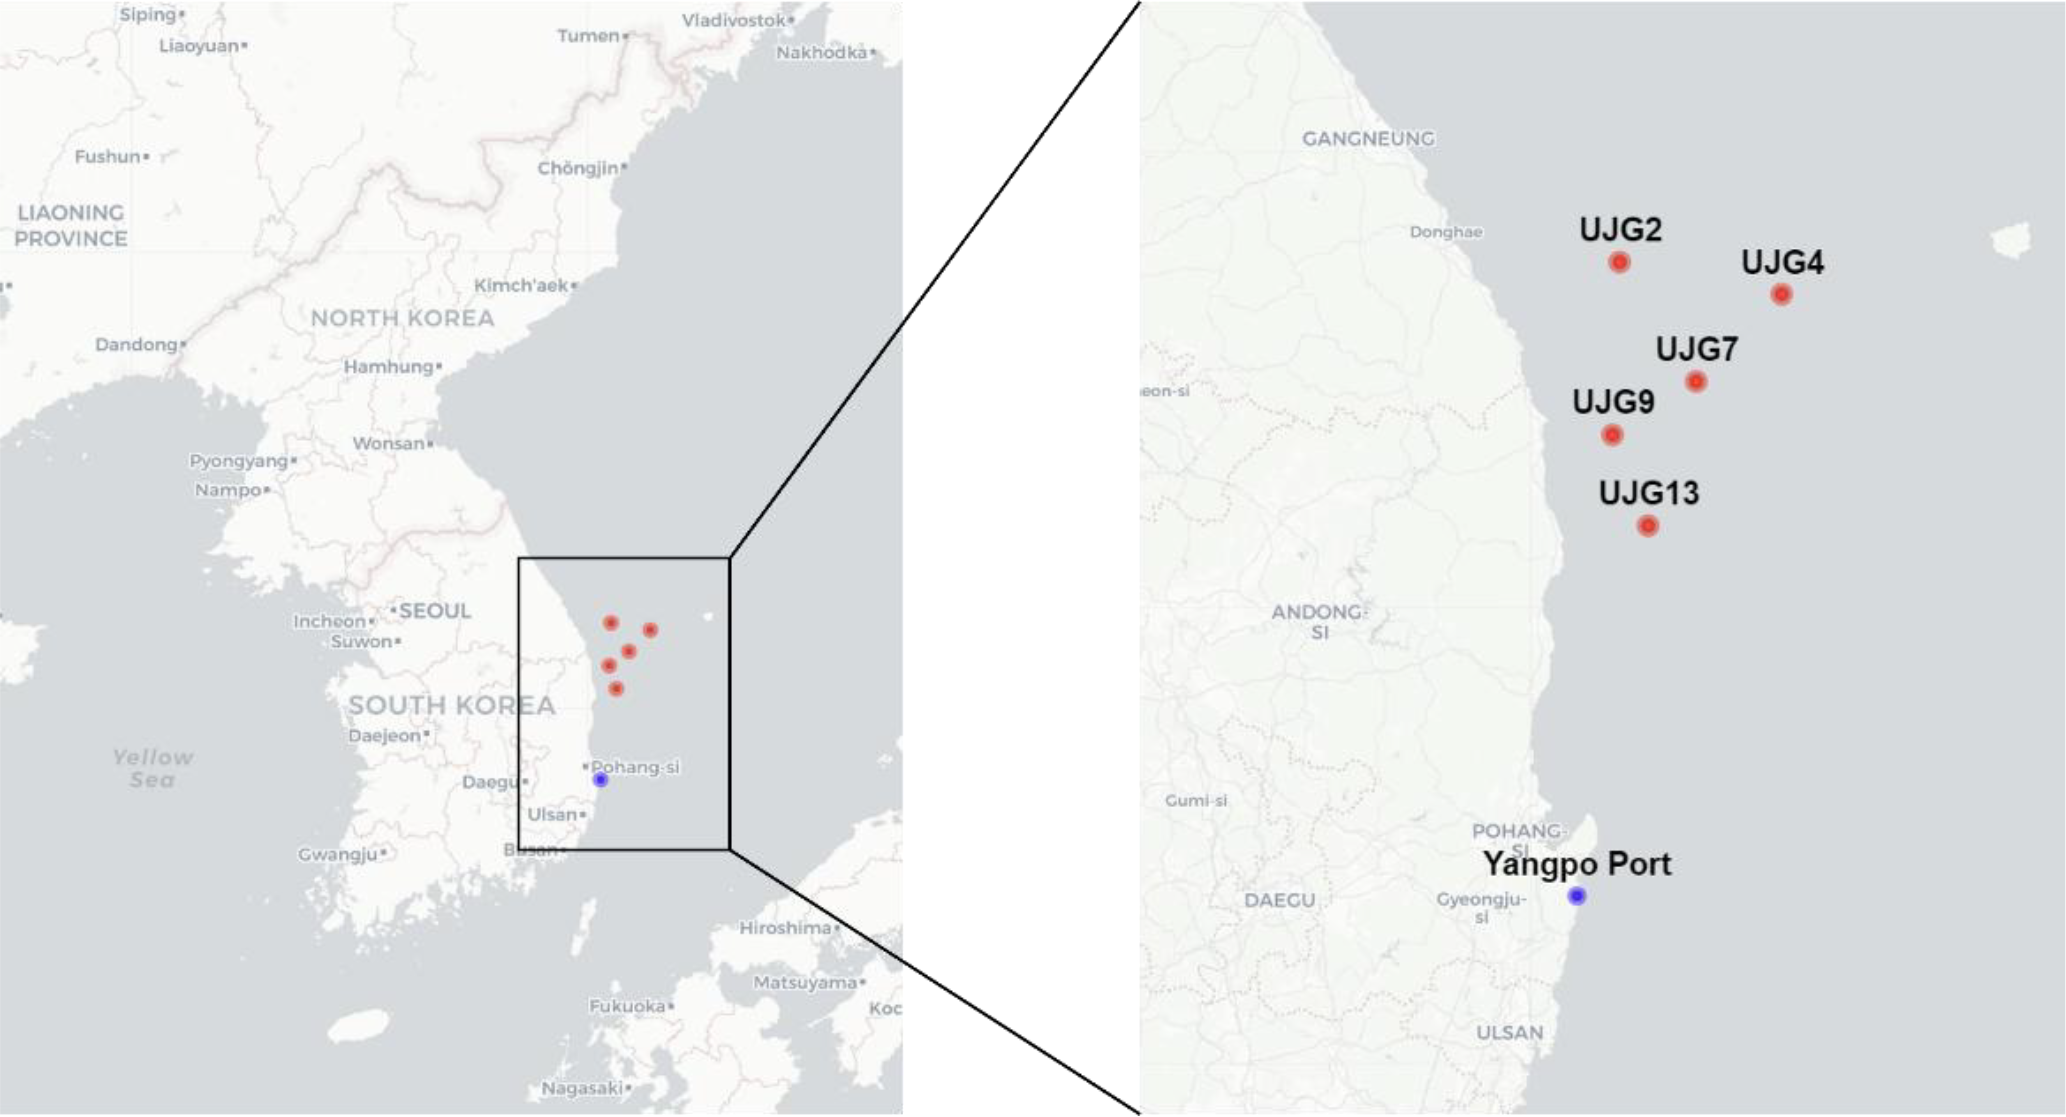
Locations of sediment sampling sites in the East Sea (Sea of Japan) of Republic of Korea. Coastal sediment was collected at Yangpo Port (blue dot), and offshore sediments were obtained from five stations (UJG2–UJG13; red dots) along a depth gradient (128–933 m) off the coast of Uljin, Republic of Korea. Offshore samples were retrieved during a 2021 research cruise using a free-fall grab sampler and are archived in the KIOST Marine Sample Library.
Outer shelf to upper slope sediment: Sediment samples across a depth gradient were obtained from the Korea Institute of Ocean Science and Technology (KIOST) Marine Sample Library (LIMS). These samples were originally collected using a free-fall grab sampler during an offshore expedition conducted in June 2021 off the eastern coast of Uljin, Republic of Korea. The offshore sampling stations and their coordinates were as follows: UJG-13 (36.7994° N, 129.7373° E; 128 m), UJG-9 (37.0239° N, 129.6301° E; 141 m), UJG-2 (37.1580° N, 129.8839° E; 538 m), UJG-7 (37.3684° N, 130.1499° E; 688 m), and UJG-5 (37.4479° N, 129.6506° E; 933 m). The surface sediment samples represented a transect from the outer continental shelf to the upper slope and were used to evaluate the detection efficiency of the DSea-9 primer in deep-sea environments.
2.2.2 DNA extraction, amplification, and next generation sequencing
DNA extraction was performed using the DNeasy PowerSoil Pro Kit (Qiagen, Hilden, Germany). For cell lysis, buffer was added to the sediment sample along with 6 μL of proteinase K (Thermo Fisher Scientific, Waltham, MA, USA) and 2 μL of lysozyme (Thermo Fisher Scientific, Waltham, MA, USA), followed by incubation at 65°C for 10 minutes. Subsequent steps were conducted according to the manufacturer’s protocol.
Distinct protocols were applied for coastal and outer shelf to upper slope sediment samples for amplification, sequencing, and downstream data analysis. Also, to evaluate the detection efficiency and specificity of the newly designed DSea-9 primers for macroalgae eDNA, two widely used markers targeting the 18S rRNA gene V7 and V9 regions were also included in the analysis as comparative benchmarks (Amaral-Zettler et al., 2009; Stoeck et al., 2010; Guardiola et al., 2015).
Because this study aimed to evaluate primer specificity and taxonomic coverage rather than DNA quantification, all amplifications were performed using conventional PCR rather than quantitative PCR (qPCR). To verify that potential PCR inhibitors present in the sediment did not interfere with amplification, each eDNA extract was analyzed both undiluted and after a 1:10 dilution. Comparable band intensity and amplicon profiles were obtained under both conditions, indicating no substantial inhibition. All DNA extraction and PCR setup steps were conducted in physically separated laboratory rooms with dedicated pipettes, filtered aerosol-resistant tips, and negative controls (no-template and extraction blanks) included in every run; no amplification was detected in any blank sample (see Supplementary Figure S1 for representative gel electrophoresis results).
To ensure the reliability of the eDNA workflow, negative controls were incorporated at every step, including field blanks, extraction blanks, and no-template PCR controls. Field blanks consisted of sterile water handled alongside sediment samples during field collection to monitor possible environmental contamination, while extraction blanks were processed in parallel with sediment samples but contained no material to detect potential cross-contamination during DNA extraction. No-template controls (Mastermix negatives) contained all PCR reagents except DNA template and were used to verify the absence of contamination during amplification For all negative controls, no amplification of target-sized products (~130 bp) was detected, which was considered a successful negative result, and non-specific bands referred to any secondary bands or smears distinct from the target size. None of the controls showed any amplification or non-specific products, confirming that contamination did not occur during sampling, extraction, or amplification.
For coastal sediment samples, the concentration of PCR amplicons was measured using a UV-VIS spectrophotometer (Shimadzu UV-1900i, Shimadzu, Japan), and product quality was assessed via agarose gel electrophoresis. Sequencing library preparation was performed following the Illumina 16S Metagenomic Sequencing Library Preparation Guide. Library quantification was conducted using qPCR (KAPA Library Quantification Kit, Roche, Basel, Switzerland), and quality control of the library was performed using a Bioanalyzer DNA 1000 chip (Agilent Technologies, Santa Clara, CA, USA). Sequencing was carried out on the Illumina MiSeq platform (Illumina, San Diego, CA, USA) with 2×300 bp paired-end reads. The universal primer pair with Illumina adapter overhang sequences used for the first-round PCR targeting the DSea-9 region was as follows:
-
DSea-9_F (Forward primer):
-
5′-TCGTCGGCAGCGTCAGATGTGTATAAGAGACAGTCGCWCCTACCGATTGRRY-3′
-
DSea-9_R (Reverse primer):
-
5′-GTCTCGTGGGCTCGGAGATGTGTATAAGAGACAGTCACCTACGGARACCTTGTTAC-3′
For outer shelf to upper slope sediment samples, DNA extraction and first-round PCR amplification were performed using the DSea-9_F/DSea-9_R primer set with Illumina adapter overhang sequences. PCR amplification was conducted in a 20μL reaction volume consisting of 1μL of each primer (10 pmol), 1μL of DNA template (10ng μL1), and 17μL of triple-distilled water using a commercial PCR premix (Bioneer, Daejeon, Republic of Korea). PCR cycling conditions were as follows: initial denaturation at 95°C for 5 minutes, followed by 30 cycles of 95°C for 30 seconds, 53°C for 30 seconds, and 72°C for 30 seconds, with a final extension at 72°C for 5 minutes.
The first-round PCR products were purified using the Dokdo-Prep PCR Purification Kit (ELPIS, Daejeon, Korea). Following purification, indexing PCR was performed using Nextera XT indexed primers (Illumina, San Diego, CA) according to the manufacturer’s protocol, with the same cycling conditions except for 10 cycles. Final libraries were purified using AMPure XP beads (Beckman Coulter, Brea, CA, USA), quantified via qPCR (KAPA Library Quantification Kit, Wilmington, MA, USA), and fragment size was validated using a TapeStation D1000 system (Agilent Technologies, Waldbronn, Germany). Sequencing was performed on the Illumina MiSeq platform (2×300bp paired-end reads).
Reference genomic DNA produced an amplicon of approximately 130 bp, whereas eDNA samples yielded a longer product (~200 bp) due to the Illumina adapter overhangs used in the first-round PCR. In addition, a faint band below 100 bp was occasionally observed in both eDNA samples and negative controls, which we interpret as primer-dimer formation. Representative gel images are provided in Supplementary Figure S1.
2.2.3 Quality filtering
For coastal sediment, raw paired-end sequencing reads obtained from the Illumina MiSeq platform were subjected to a rigorous quality control process. Adapter and primer sequences were removed using Cutadapt (v3.2). Quality filtering, dereplication, error modeling, and chimera removal were conducted using the DADA2 pipeline (v1.20). This process also involved the removal of PhiX control sequences and the merging of paired-end reads based on sequence overlap. Only high-quality reads were retained for downstream analysis, and unique Amplicon Sequence Variants (ASVs) were generated without clustering. To assess sequencing depth and ensure sufficient coverage for ecological analyses, rarefaction analysis was performed. Rarefaction curves were plotted for each sample to visualize the sequencing effort and saturation level, ensuring that the read depth was adequate for robust diversity interpretation.
For outer shelf to upper slope sediment, raw sequence data obtained from the Illumina MiSeq platform were subjected to adapter and primer removal using Cutadapt (v3.2). Subsequently, both forward and reverse reads were trimmed to 200 bp to remove low-quality bases at the 3’ ends. Following trimming, error correction and ASV inference were conducted using the DADA2 pipeline (v1.18) in R, which includes quality filtering, denoising, merging of paired-end reads, and chimera removal. Reads with more than two expected errors (maxEE = 2) were discarded, and remaining sequences were denoised based on an inferred error model. Merged reads were retained only if a minimum overlap of 12 bp was achieved between forward and reverse reads, and sequences with mismatches in the overlap region were discarded. Putative chimeric sequences were removed using the consensus method implemented in the removeBimeraDenovo() function of DADA2. To enable comparison across samples with varying sequencing depths, rarefaction was performed using QIIME (v1.9), rarefying each sample to the minimum sequencing depth observed across all samples. The final ASV table was used for all downstream ecological and statistical analyses.
2.2.4 Taxonomic assignment
For coastal sediment, taxonomic classification of ASVs was conducted using the assignTaxonomy() function implemented in DADA2, referencing the Protist Ribosomal Reference (PR2) Database (v5.0.0). Taxonomic assignments followed a hierarchical structure, spanning from Domain to Genus level: Domain – Supergroup – Division – Subdivision – Class – Order – Family – Genus. Following rarefaction, the normalized ASV table was used to calculate the relative abundance of each taxonomic rank across all samples. The resulting taxonomic profiles were visualized using KronaTools (v2.8), allowing interactive exploration of eukaryotic community composition and relative proportions within the coastal sediment samples. This integrative and reproducible workflow enabled detailed characterization of the taxonomic diversity present in eukaryotic communities from coastal sediments, as revealed by 18S rRNA gene amplicon sequencing.
For outer shelf to upper slope sediment, taxonomic assignment of each Amplicon Sequence Variant (ASV) was performed by aligning representative sequences to the NCBI nucleotide collection (nt) database. Sequence alignment was conducted using the BLAST+ algorithm (v2.9.0) with stringent filtering criteria: only hits with query coverage >85% and sequence identity >85% were considered valid for downstream analyses. For each ASV, the top-scoring hit was used to assign taxonomy at the most specific level supported by the alignment quality. When multiple top hits with equal scores were returned, the Lowest Common Ancestor (LCA) approach was applied, whereby the ASV was assigned to the lowest shared taxonomic level among the top hits to prevent overclassification and ensure consistency. To maintain assignment accuracy, low-confidence matches (e.g., hits with identity below threshold, short alignment length, or ambiguous taxonomic information) were excluded from further interpretation.
3 Results
3.1 Primer development
3.1.1 DSea-9
The DSea-9 primer pair, targeting the hypervariable V9 region of the 18S rRNA gene, was developed and optimized as described in Section 2.1.1. Using the DSea-9 primers (excluding adapter sequences), successful amplification was obtained from genomic DNA extracted from 30 representative macroalgal taxa (80 isolates in total), encompassing 10 orders and 30 families across the three major algal lineages (Phaeophyceae, Rhodophyta, and Ulvophyceae). Duplicate isolates yielding identical sequences were collapsed into single representative entries in Table 1. Representative amplification results are shown in Supplementary Figure S1. Although most species produced clear ~130 bp bands, a few taxa such as Ecklonia cava and Undaria pinnatifida displayed faint or barely visible bands under the initial PCR conditions; these were successfully re-amplified under optimized conditions and verified by Sanger sequencing. In contrast, Sargassum horneri and Plocamium cartilagineum showed no visible amplification and are considered potential false-negative results. All Sanger-verified sequences generated in this study have been deposited in the NCBI GenBank database (Table 1).
3.1.2 In vitro validation using extracted macroalgal DNA
The DSea-9 primer set was tested in vitro using genomic DNA extracted from 30 macroalgal species, representing 10 orders and 20 families across Phaeophyceae and Florideophyceae lineages. PCR amplification was successful for most of the tested species (>90%), yielding clear amplicon bands of the expected ~130 bp size, while a few taxa produced faint or no visible bands under the initial PCR conditions (see Supplementary Figure S1). Specifically: Within Phaeophyceae, 21 species from six orders (Dictyotales, Sphorochonales, Ectocarpales, Fucales, Laminariales, and Lessoniaceae) were successfully amplified. Within Florideophyceae (Rhodophyta), 9 species from six orders (Nemastomatales, Rhodymeniales, Halymeniales, Corallinales, Gigartinales, and Plocamiales) showed robust amplification. Within Ulvophyceae, 5 species from three orders (Cladophoraceae, Kornmanniaceae, and Ulvaceae) successfully amplified.
No substantial non-specific amplification was observed in the negative controls, although a faint primer-dimer band (<100 bp) was occasionally visible. All PCR products were successfully sequenced using the Sanger method, and the resulting high-quality sequences were deposited in GenBank.
3.1.3 In silico evaluation of interspecific variations
In silico PCR simulations were performed using Primer-BLAST against a curated NCBI nt database containing annotated 18S rRNA sequences of macroalgal taxa, including Phaeophyceae, Rhodophyta, and Ulvophyceae. The DSea-9-F/R primer set successfully amplified a broad range of target sequences, yielding amplicons between 120–150 bp. This length range is compatible with Illumina MiSeq 2×300 bp sequencing.
DSea-9 primers achieved high in silico detection rates, consistently amplifying the majority of Phaeophyceae, Rhodophyta, and Ulvophyceae sequences (>80–85%), while off-target amplification remained negligible (<2%) and restricted to low-confidence hits. Compared with established universal eukaryotic primers (e.g., 1380F/1510R), DSea-9 primers demonstrated enhanced resolution within macroalgal lineages, particularly in Rhodophyta, where conventional markers often failed to distinguish among closely related genera. These results confirm the high specificity and broad taxonomic coverage of DSea-9 primers in silico, supporting their application in targeted macroalgal eDNA metabarcoding.
3.2 Primer testing with eDNA from coastal sediment
The performance of the DSea-9 primer set was further evaluated using environmental DNA (eDNA) extracted from coastal sediment samples collected at Yangpo Port. Taxonomic assignment of sequencing reads was conducted via two independent pipelines: (1) commercial sequencing service with taxonomic assignment using the PR2 database, and (2) in-house QIIME2-based pipeline using the SILVA database after quality filtering and trimming. Based on the PR2 database (Table 2), the V7 primer yielded the highest proportion of macroalgal reads (0.727%), followed by DSea-9 (0.421%) and V9 (0.135%). The V7 dataset included substantial Phaeophyceae representation (102 + 1089 + 180 + 20 + 34 = 1425 reads) across multiple orders, whereas DSea-9 primarily detected Phaeophyceae (0.355%), particularly within Fucales, and Corallinales (0.066%), while Ulvales remained undetected (0%).
Table 2
| Order | V7 | V9 | DSea-9 |
|---|---|---|---|
| Phaeophyceae | 0.727% | 0.135% | 0.355% |
| Corallinales | 0.002% | 0% | 0.066% |
| Ulvales | 0.004% | 0% | 0% |
| Total | 0.733% | 0.135% | 0.421% |
Relative abundance (%) of macroalgal sequences detected from coastal sediment samples using three primer sets (V7, V9, and DSea-9), assigned against the Protist Ribosomal Reference Database (PR2). Sequencing reads were taxonomically classified to the order level. Percentages represent the proportion of total reads assigned to each macroalgal order.
Consistently, the QIIME2-SILVA pipeline (Table 3) supported these findings, with V7 recovering the largest number of Phaeophyceae reads (1433 total), while DSea-9 yielded 351 macroalgal reads dominated by Fucales (85 + 266). Importantly, the genus Cystoseira was detected only by V7, not by DSea-9, as indicated in Table 3.
Table 3
| Phylum | Class | Order | Family | Genus | V7 | V9 | DSea-9 |
|---|---|---|---|---|---|---|---|
| Ochrophyta | Phaeophyceae | 102 | 0 | 85 | |||
| Ochrophyta | Phaeophyceae | Fucales | Fucales | 1089 | 154 | 266 | |
| Ochrophyta | Phaeophyceae | Fucales | Fucales | Cystoseira | 180 | 0 | 0 |
| Ochrophyta | Phaeophyceae | Ectocarpales | Ectocarpales | 20 | 0 | 0 | |
| Ochrophyta | Phaeophyceae | Dictyotales | Dictyotales | 34 | 0 | 0 | |
| Florideophycidae | Corallinophycidae | Corallinophycidae | Corallinophycidae | 0 | 9 | 0 | |
| Chlorophyta | Ulvophyceae | Ulvales | Ulvales | 8 | 0 | 0 | |
| Total | 1433 (0.746%) |
163 (0.142%) |
351 (0.359%) |
||||
Taxonomic composition of macroalgal sequences detected from coastal sediment samples using three primer sets (V7, V9, and DSea-9), analyzed with the QIIME2 pipeline and classified against the SILVA database. Read counts and corresponding relative abundances (%) were summarized at the genus level.
Taken together, these results show that V7 retrieved the highest proportion of brown-algal sequences in coastal sediments, whereas DSea-9 provided broader lineage coverage across Phaeophyceae, Florideophyceae, and Ulvophyceae and exhibited consistent performance across both PR2 and SILVA workflows. Rather than outperforming universal primers in read abundance, DSea-9 functions as a complementary marker that enhances detection of macroalgal groups under-represented by V4/V9-based universal primers.
3.3 Primer testing with eDNA from outer shelf to upper slope sediment
To evaluate the performance of the DSea-9 primer in deeper benthic environments, sediment eDNA samples collected from five stations along a depth gradient (128–933 m) were analyzed. Amplicon libraries generated using three different primer sets (V7, V9, and DSea-9) were sequenced, and representative ASVs were taxonomically classified using BLAST+ against the NCBI nucleotide (nt) database (Table 4).
Table 4
| Primer | Class | Family | Species | UJG13 (128 m) | UJG9 (141 m) | UJG2 (538 m) | UJG7 (688 m) | UJG5 (933 m) |
|---|---|---|---|---|---|---|---|---|
| V7 | Phaeophyceae | Sargassaceae | Sargassum ilicifolium | 60 | 0 | 0 | 0 | 9 |
| Phaeophyceae | Sargassaceae | Sargassum sp. | 0 | 274 | 0 | 0 | 0 | |
| Phaeophyceae | Agaraceae | uncultured Agarum | 0 | 19 | 0 | 11 | 0 | |
| Florideophyceae | Rhodomelaceae | Herposiphonia parca | 40 | 0 | 0 | 0 | 0 | |
| Florideophyceae | Corallinaceae | Corallinaceae sp. | 0 | 0 | 0 | 0 | 2 | |
| Florideophyceae | Corallinaceae | Pneophyllum conicum | 0 | 5 | 0 | 0 | 0 | |
| Florideophyceae | Plocamiaceae | Plocamium sp. | 0 | 9 | 0 | 0 | 0 | |
| Ulvophyceae | Dasycladaceae | Batophora occidentalis | 0 | 2 | 0 | 0 | 0 | |
| Total | 100 (0.095%) |
309 (0.295%) |
0 (0%) |
11 (0.010%) |
11 (0.010%) |
|||
| Class | Family | Species | ||||||
| V9 | Phaeophyceae | Sargassaceae | Sargassum ilicifolium | 4 | 206 | 14 | 18 | 10 |
| Phaeophyceae | Phyllariaceae | Saccorhiza dermatodea | 0 | 6 | 0 | 0 | 0 | |
| Florideophyceae | Rhodomelaceae | Melanothamnus harveyi | 0 | 2 | 0 | 0 | 0 | |
| Total | 4 (0.004%) |
214 (0.212%) |
14 (0.014%) |
18 (0.018%) |
10 (0.010%) |
|||
| Class | Family | Species | ||||||
| DSea-9 | Phaeophyceae | Scytosiphonaceae | Colpomenia sp. | 0 | 10 | 0 | 0 | 0 |
| Phaeophyceae | Sargassaceae | Sargassum dazhouense | 9 | 204 | 6 | 8 | 0 | |
| Phaeophyceae | Alariaceae | Alaria esculenta | 14 | 123 | 41 | 21 | 164 | |
| Florideophyceae | Corallinaceae | Corallina declinata | 0 | 9 | 0 | 0 | 6 | |
| Florideophyceae | Pterocladiaceae | Pterocladiella capillacea | 8 | 0 | 0 | 0 | 0 | |
| Florideophyceae | Palmariaceae | Palmaria palmata | 0 | 0 | 0 | 0 | 3 | |
| Ulvophyceae | Cladophoraceae | Cladophora opaca | 0 | 5 | 34 | 9 | 24 | |
| Ulvophyceae | Cladophoraceae | Cladophora sp. | 0 | 0 | 0 | 0 | 8 | |
| Ulvophyceae | Ulvaceae | Ulva arasakii | 16 | 12 | 0 | 0 | 45 | |
| Ulvophyceae | Ulvaceae | Ulva flexuosa | 0 | 136 | 0 | 36 | 0 | |
| Ulvophyceae | Ulvaceae | Ulva sp. | 0 | 0 | 22 | 0 | 0 | |
| Total | 47 (0.050%) |
499 (0.535%) |
103 (0.110%) |
74 (0.079%) |
250 (0.268%) |
|||
Detection of macroalgal taxa from outer shelf to upper slope sediment samples using three different primer sets (V7, V9, and DSea-9).
The V7 primer set yielded a limited number of macroalgal ASVs, primarily detecting Phaeophyceae (e.g., Sargassum ilicifolium, Sargassum sp.), along with low-abundance sequences assigned to Florideophyceae (e.g., Herposiphonia parca, Corallina sp., Pneophyllum conicum) and Ulvophyceae (e.g., Batophora occidentalis). However, detection was largely confined to the shallower stations (UJG13–UJG9), with minimal macroalgal representation beyond 538 m depth. Notably, V7 yielded the highest relative proportion of Phaeophyceae reads overall, including the genus Cystoseira, consistent with its strong performance reported in previous studies.
The V9 universal primer exhibited narrower taxonomic breadth, detecting mainly Phaeophyceae, including Sargassum ilicifolium and Saccorhiza dermatodea, and one red algal species (Melanothamnus harveyi). Most detections occurred in mid-depth stations (141–688 m), but overall macroalgal read counts remained low (<0.22%).
The DSea-9 primer showed comparable recovery of brown-algal sequences to V7 but captured a broader diversity of macroalgal lineages overall. Detected taxa spanned: Phaeophyceae (e.g., Colpomenia sp., Sargassum dzhaponicum, Alaria esculenta), Florideophyceae (e.g., Corallina declinata, Palmaria palmata), Ulvophyceae, including Cladophora spp. and multiple Ulva species. Unlike the universal primers, DSea-9 also detected macroalgal DNA at the deepest station (UJG4, 933 m), where Ulva sp., Cladophora opaca, and Palmaria palmata were detected, which may reflect primer-specificity differences rather than sensitivity alone, as these taxa were not detected by V7 or V9.Although V7 retrieved the highest proportion of Phaeophyceae, DSea-9 provided the widest lineage coverage and the most consistent detection across the depth gradient.
Overall, these results indicate that the three primer sets yielded complementary information: V7 performed best for brown-algal groups such as Cystoseira, whereas DSea-9 achieved broader macroalgal detection and deeper sediment coverage than either V7 or V9.
4 Discussion
This study demonstrates the successful development and application of the DSea-9 primer set, specifically designed to overcome taxonomic biases associated with universal eDNA primers in sedimentary environments. By targeting a hypervariable region within the 18S rRNA gene, DSea-9 achieved a balance between taxonomic resolution and amplicon length, aligning with current best practices in eDNA metabarcoding where primer customization for ecological targets is increasingly emphasized (Hadziavdic et al., 2014; Piredda et al., 2017; Gaonkar and Campbell, 2024).
In silico analyses confirmed the broad amplification capacity of DSea-9, with high predicted detection rates in macroalgae while minimizing off-target amplification. This performance substantially exceeds that of commonly used universal primers, particularly for red and green algal lineages, which are often underrepresented in existing eDNA studies. Moreover, consistent performance across PR2 and SILVA reference databases highlights the marker’s robustness against reference-dependent biases, which remain a persistent challenge in eDNA-based biodiversity assessments (van der Loos and Nijland, 2021; Tedersoo et al., 2024; Varrella et al., 2025).
Field validation further demonstrated the practical efficacy of DSea-9. In coastal sediment samples, the universal V7 primer yielded the highest relative proportion of Phaeophyceae reads, including the genus Cystoseira, which is consistent with previous reports of its strong affinity for brown-algal lineages (Hadziavdic et al., 2014; Piredda et al., 2017). Nevertheless, DSea-9 achieved comparable recovery of Phaeophyceae while detecting a wider range of macroalgal groups—including red and green algae—that were under-detected by both V7 and V9.This improvement was also evident in offshore samples, where DSea-9 maintained detection capacity down to 933 m depth, in contrast to conventional primers whose performance declined markedly with increasing depth. Hence, the three primer sets can be considered complementary: V7 performs best for certain brown-algal groups, whereas DSea-9 extends detection to a broader taxonomic spectrum and greater depth coverage.
These habitat-linked differences suggest that underlying preservation, matrix, and community factors likely shape primer performance. Habitat‐linked differences in DSea-9 performance are consistent with known controls on eDNA preservation and amplification. In sediments, the balance between DNA production, degradation, and sorption creates large extracellular DNA pools whose size and turnover vary with redox regime, mineralogy, and bioturbation; such matrix effects can differentially favor short, taxon-focused markers over universal loci in some contexts. These processes are particularly pronounced in marine sediments—where extracellular DNA constitutes a major reservoir—helping to explain stronger signals in colder, less oxygenated offshore and deep-sea settings (Torti et al., 2015). Temperature further modulates persistence: controlled experiments show markedly longer detectability at ≤10°C relative to ≥20°C, aligning with the enhanced recovery we observed in deep-sea sediments (McCartin et al., 2022).
Co-extracted inhibitors provide an additional, habitat-specific mechanism. Humic substances and related organics—often elevated in nearshore, terrestrially influenced sediments—can suppress polymerase activity and template accessibility, reducing effective amplification and potentially diminishing the relative benefits of taxon-specific primers in coastal matrices unless mitigated by extraction/cleanup strategies (Schrader et al., 2012; Sidstedt et al., 2020). Primer–template interactions also matter: even with degenerate positions, amplification biases arise from mismatches at binding sites, GC content, and amplicon length, which can shift observed read shares among primer sets across communities with different macroalgal composition (Krehenwinkel et al., 2017; Braukmann et al., 2019; Liu et al., 2023).
Finally, sample type and informatics can shape apparent performance. Multiple coastal surveys report higher OTU richness and distinct assemblages in sediments relative to paired water samples, emphasizing that primer behavior is filtered by substrate-specific DNA sources and retention (Holman et al., 2019; Tagliabue et al., 2023). Reference databases and pipelines introduce additional observation biases that affect relative read proportions independent of true abundance; nonetheless, the consistent macroalgal recovery we obtained across independent workflows supports the robustness of DSea-9 despite such analysis-level variability (Shaffer et al., 2025).
A significant advance of DSea-9 is its ability to resolve taxonomic identities beyond the dominant brown-algal lineages. Our results showed successful detection of key foundation and canopy-forming species, including Cystoseira, Colpomenia, Alaria, Palmaria, and Ulva, many of which were poorly resolved or undetected with V9 and only partially captured by V7. This higher taxonomic resolution is particularly valuable for habitat-scale biodiversity monitoring, enabling refined assessments of macroalgal assemblage structure and spatial distribution.
In terms of technical performance, DSea-9 exhibits practical advantages for environmental monitoring. Its short amplicon length (~130 bp) supports amplification from degraded sedimentary DNA, and its compatibility with the Illumina MiSeq platform facilitates integration into existing eDNA workflows. Moreover, the marker produced reproducible results across multiple bioinformatics pipelines, underscoring its adaptability for operational monitoring programs.
Collectively, these results position DSea-9 as a versatile molecular tool not only for biodiversity research but also for broader ecological monitoring initiatives relevant to sustainable marine resource management. Given the growing emphasis on ecosystem-based management within the blue economy, reliable molecular tools are increasingly needed to track biodiversity baselines, monitor habitat connectivity, and assess ecological change, especially in sediment-dominated benthic systems (Jeffery et al., 2022; Preston et al., 2024).
Although this study did not quantify carbon sequestration directly, the improved detectability of macroalgal detritus in sediments offers complementary molecular evidence relevant to blue carbon research. In particular, the ability to track species-specific macroalgal signatures in sediment cores can provide indirect indicators of long-term detrital deposition, informing assessments of macroalgal contributions to sedimentary organic matter pools and potential carbon storage. This aligns with recent arguments advocating for more comprehensive inclusion of macroalgae in marine carbon cycling discussions, while maintaining a cautious interpretation to avoid overestimation of sequestration capacities (Krause-Jensen et al., 2018; Wu et al., 2023; Kim, 2024).
Beyond blue carbon contexts, the DSea-9 primer may have practical utility in applied management settings, such as evaluating the ecological footprint of macroalgae aquaculture, monitoring the effectiveness of coastal habitat restoration, and supporting spatial planning decisions aimed at balancing conservation with economic activities. By enhancing detection of key functional and foundation species, this marker can provide baseline data to inform sustainable harvesting practices and ecosystem service valuation within the expanding blue economy framework.
Some limitations of this study should be acknowledged. The primer was designed primarily using reference sequences from Korean coastal taxa, potentially limiting coverage of certain underrepresented macroalgal lineages globally. Validation was restricted to sedimentary samples, with the applicability to water-column or dissolved eDNA yet to be tested. Moreover, the reliance on adult tissue-derived genomic DNA during validation may not fully capture the degradation profiles of detritus-derived DNA in natural environments (Barnes et al., 2014; Strickler et al., 2015; Joseph et al., 2022).
Future work should therefore expand the geographic and ecological validation of DSea-9, including testing in diverse biogeographic regions and across multiple substrate types. Application in long-term time series and sediment core studies could further elucidate macroalgal deposition dynamics, while experimental assessments of DNA degradation rates would refine interpretations of macroalgal DNA persistence in sediments (Dell’Anno and Corinaldesi, 2004; Wasmund, 2023). Additionally, integrating DSea-9 into multidisciplinary monitoring frameworks, alongside physical and biogeochemical data, would enhance its utility in supporting marine spatial planning, ecosystem-based management, and sustainability policies.
In conclusion, DSea-9 represents a methodological advance in macroalgal eDNA detection from sediments, offering improved sensitivity, specificity, and taxonomic resolution compared to general primers. While it is not a direct quantitative tool for carbon stock estimation, its capacity to enhance biodiversity assessments and trace macroalgal detritus dynamics contributes valuable molecular evidence to marine monitoring efforts. In an era of expanding blue economy activities, tools like DSea-9 can support more informed and sustainable management of marine resources, bridging the gap between molecular ecology, ecosystem service evaluations, and practical conservation applications.
5 Conclusion
In this study, a novel environmental DNA (eDNA) primer set, DSea-9, was developed and validated to enhance the detection of macroalgal taxa in marine sediments. By targeting a hypervariable region within the nuclear 18S rRNA gene, DSea-9 was shown to achieve high specificity and broad taxonomic coverage, effectively amplifying Phaeophyceae, Rhodophyta, and Ulvophyceae lineages. Validation was conducted through in vitro and in silico analyses, followed by application to natural sediment samples collected from both coastal and offshore environments. Superior detection sensitivity and species-level resolution were consistently observed compared to conventional universal eukaryotic primers. The detectable range of macroalgal taxa, including ecologically important species, was broadened using DSea-9, overcoming previous limitations in sedimentary eDNA surveys. Compatibility with high-throughput sequencing platforms and standard bioinformatic workflows ensures practical scalability for environmental monitoring applications. Although the primer was not designed for quantitative assessments, it provides molecular evidence supporting the ecological relevance of macroalgal detritus in marine carbon dynamics. Overall, DSea-9 serves as a robust molecular tool to address a methodological gap in eDNA-based blue carbon monitoring, offering improved detection of macroalgal contributions to marine biodiversity and blue carbon processes across a variety of sedimentary habitats.
Statements
Data availability statement
The original contributions presented in the study are included in the article/Supplementary Material. Further inquiries can be directed to the corresponding authors.
Author contributions
J-MD: Data curation, Writing – original draft, Funding acquisition. Y-HS: Data curation, Validation, Writing – review & editing. H-SN: Writing – review & editing, Data curation, Investigation. YS: Writing – review & editing, Visualization, Data curation. J-WL: Data curation, Writing – review & editing, Investigation. BK: Writing – review & editing, Methodology, Data curation. JK: Writing – review & editing, Methodology. S-YS: Data curation, Investigation, Writing – review & editing. H-SY: Supervision, Conceptualization, Writing – review & editing, Funding acquisition.
Funding
The author(s) declared that financial support was received for this work and/or its publication. This research was supported by the Global -Learning & Academic research institution for Master’s•PhD students, and Postdocs (LAMP) Program of the National Research Foundation of Korea (NRF), funded by the Ministry of Education (Grant No. RS-2023-00301914); the Basic Science Research Program through the NRF, funded by the Ministry of Education (Grant No. RS-2021-NR065829; Grant No. RS-2024-000450642; RS-2025-25414481); the NRF grant funded by the Korean government (MSIT) (Grant No. RS-2024-00406555).
Acknowledgments
The authors would like to thank the Library of Marine Samples and the Korea Hydrographic and Oceanographic Agency for providing access to marine sediment samples used in this study.
Conflict of interest
The authors declared that this work was conducted in the absence of any commercial or financial relationships that could be construed as a potential conflict of interest.
Generative AI statement
The author(s) declared that generative AI was not used in the creation of this manuscript.
Any alternative text (alt text) provided alongside figures in this article has been generated by Frontiers with the support of artificial intelligence and reasonable efforts have been made to ensure accuracy, including review by the authors wherever possible. If you identify any issues, please contact us.
Publisher’s note
All claims expressed in this article are solely those of the authors and do not necessarily represent those of their affiliated organizations, or those of the publisher, the editors and the reviewers. Any product that may be evaluated in this article, or claim that may be made by its manufacturer, is not guaranteed or endorsed by the publisher.
Supplementary material
The Supplementary Material for this article can be found online at: https://www.frontiersin.org/articles/10.3389/fmars.2025.1673977/full#supplementary-material
Supplementary Figure 1Representative agarose gel electrophoresis results for DSea-9 primer validation. (A) Amplification of genomic DNAfrom representative macroalgal species (Phaeophyceae, Rhodophyta, and Chlorophyta) showing the expected product size of approximately 130 bp without substantial non-specific bands. The DNA ladder ranged from 100 bp to 500 bp. Some samples (e.g., Sargassum horneri, Ecklonia cava, and Undaria pinnatifida) showed faint or no visible bands under the initial PCR conditions; subsequent optimization confirmed successful amplification, and the corresponding sequences were deposited in GenBank (see Table 1). (B) Amplification of environmental DNA (eDNA) extracted from coastal (Yangpo Port) and offshore sediment samples. The major eDNA amplicon was approximately 200 bp due to lllumina adapter overhangs added during the first-round PCR. A faint band below 100 bp, occasionally visible in eDNA and negative controls, was interpreted as primer-dimer formation. Field blanks, extraction blanks, and no-template PCR controls were loaded intermittently between eDNA samples to monitor contamination; all negative controls showed no amplification of target-sized products.
References
1
Ager T. G. Krause-Jensen D. Olesen B. Carlson D. F. Winding M. H. S. Sejr M. K. (2023). Macroalgal habitats support a sustained flux of floating biomass but limited carbon export beyond a Greenland fjord. Sci. Total Environ.872, 162224. doi: 10.1016/j.scitotenv.2023.162224
2
Amaral-Zettler L. A. McCliment E. A. Ducklow H. W. Huse S. M. (2009). A method for studying protistan diversity using massively parallel sequencing of V9 hypervariable regions of small-subunit ribosomal RNA Genes. PLoS One4, e6372. doi: 10.1371/journal.pone.0006372
3
Barnes M. A. Turner C. R. Jerde C. L. Renshaw M. A. Chadderton W. L. Lodge D. M. (2014). Environmental conditions influence eDNA persistence in aquatic systems. Environ. Sci. Technol.48, 1819–1827. doi: 10.1021/es404734p
4
Braukmann T. W. A. Ivanova N. V. Prosser S. W. J. Elbrecht V. Steinke D. Ratnasingham S. et al . (2019). Metabarcoding a diverse arthropod mock community. Mol. Ecol. Resour19, 711–727. doi: 10.1111/1755-0998.13008
5
Brink B.t. Alkemade R. Bakkenes M. Clement J. Eickhout B. Fish L. et al . (2007). Cross-roads of life on Earth: exploring means to meet the 2010 Biodiversity Target: solution-oriented scenarios for Global biodiversity outlook 2 ( Secretariat of the Convention on Biological Diversity; Netherlands Environmental Assessment Agency).
6
Choi J. Park J. S. (2020). Comparative analyses of the V4 and V9 regions of 18S rDNA for the extant eukaryotic community using the Illumina platform. Sci. Rep.10, 6519. doi: 10.1038/s41598-020-63561-z
7
Dell’Anno A. Corinaldesi C. (2004). Degradation and turnover of extracellular DNA in marine sediments: Ecological and methodological considerations. Appl. Environ. Microbiol.70, 4384–4386. doi: 10.1128/AEM.70.7.4384-4386.2004
8
Díaz C. Wege F. F. Tang C. Q. Crampton-Platt A. Rüdel H. Eilebrecht E. et al . (2020). Aquatic suspended particulate matter as source of eDNA for fish metabarcoding. Sci. Rep.10, 14352. doi: 10.1038/s41598-020-71238-w
9
Egge E. Elferink S. Vaulot D. John U. Bratbak G. Larsen A. et al . (2021). An 18S V4 rRNA metabarcoding dataset of protist diversity in the Atlantic inflow to the Arctic Ocean, through the year and down to 1000m depth. Earth Syst. Sci. Data13, 4913–4928. doi: 10.5194/essd-13-4913-2021
10
Friedlingstein P. O’sullivan M. Jones M. W. Andrew R. M. Gregor L. Hauck J. et al . (2022). Global carbon budget 2022. Earth Syst. Sci. Data14, 4811–4900. doi: 10.5194/essd-14-4811-2022
11
Gaonkar C. C. Campbell L. (2024). A full-length 18S ribosomal DNA metabarcoding approach for determining protist community diversity using Nanopore sequencing. Ecol. Evol.14, e11232. doi: 10.1002/ece3.11232
12
Guardiola M. Uriz M. J. Taberlet P. Coissac E. Wangensteen O. S. Turon X. (2015). Deep-sea, deep-sequencing: Metabarcoding extracellular DNA from sediments of marine canyons. PLoS One10, e0139633. doi: 10.1371/journal.pone.0139633
13
Hadziavdic K. Lekang K. Lanzen A. Jonassen I. Thompson E. M. Troedsson C. (2014). Characterization of the 18s rRNA gene for designing universal eukaryote specific primers. PLoS One9, e87624. doi: 10.1371/journal.pone.0087624
14
Holman L. E. de Bruyn M. Creer S. Carvalho G. Robidart J. Rius M. (2019). Detection of introduced and resident marine species using environmental DNA metabarcoding of sediment and water. Sci. Rep.9, 11559. doi: 10.1038/s41598-019-47899-7
15
Hu Y. Zhang Q. Hu S. Xiao G. Chen X. Wang J. et al . (2022). Research progress and prospects of ecosystem carbon sequestration under climate change (1992–2022). Ecol. Indic145, 109656. doi: 10.1016/j.ecolind.2022.109656
16
Jeffery N. W. Lehnert S. J. Kess T. Layton K. K. S. Wringe B. F. Stanley R. R. E. (2022). Application of omics tools in designing and monitoring marine protected areas for a sustainable blue economy. Front. Genet.13. doi: 10.3389/fgene.2022.886494
17
Joseph C. Faiq M. E. Li Z. Chen G. (2022). Persistence and degradation dynamics of eDNA affected by environmental factors in aquatic ecosystems. Hydrobiologia849, 4119–4133. doi: 10.1007/s10750-022-04959-w
18
Jueterbock A. Hoarau-Heemstra H. Wigger K. Duarte B. Bruckner C. Chapman A. et al . (2025). Roadmap to sustainably develop the European seaweed industry. NPJ Ocean Sustain4, 22. doi: 10.1038/s44183-025-00122-9
19
Kim K. Y. (2024). Harnessing seaweed farming for climate mitigation in South Korea: evaluating carbon dioxide removal potential and future research directions. Algae39, 329–347. doi: 10.4490/algae.2024.39.10.28
20
Krause-Jensen D. Duarte C. M. (2016). Substantial role of macroalgae in marine carbon sequestration. Nat. Geosci9, 737–742. doi: 10.1038/ngeo2790
21
Krause-Jensen D. Lavery P. Serrano O. Marba N. Masque P. Duarte C. M. (2018). Sequestration of macroalgal carbon: The elephant in the Blue Carbon room. Biol. Lett.14, 20180236. doi: 10.1098/rsbl.2018.0236
22
Krehenwinkel H. Wolf M. Lim J. Y. Rominger A. J. Simison W. B. Gillespie R. G. (2017). Estimating and mitigating amplification bias in qualitative and quantitative arthropod metabarcoding. Sci. Rep.7, 17668. doi: 10.1038/s41598-017-17333-x
23
Liu M. Burridge C. P. Clarke L. J. Baker S. C. Jordan G. J. (2023). Does phylogeny explain bias in quantitative DNA metabarcoding? Metabarcoding Metagenom7, 73–88. doi: 10.3897/mbmg.7.101266
24
McCartin L. J. Vohsen S. A. Ambrose S. W. Layden M. McFadden C. S. Cordes E. E. et al . (2022). Temperature Controls eDNA Persistence across Physicochemical Conditions in Seawater. Environ. Sci. Technol.56, 8629–8639. doi: 10.1021/acs.est.2c01672
25
McLeod E. Chmura G. L. Bouillon S. Salm R. Björk M. Duarte C. M. et al . (2011). A blueprint for blue carbon: Toward an improved understanding of the role of vegetated coastal habitats in sequestering CO2. Front. Ecol. Environ.9, 552–560. doi: 10.1890/110004
26
Miya M. Sato Y. Fukunaga T. Sado T. Poulsen J. Y. Sato K. et al . (2015). MiFish, a set of universal PCR primers for metabarcoding environmental DNA from fishes: Detection of more than 230 subtropical marine species. R Soc. Open Sci.2, 150088. doi: 10.1098/rsos.150088
27
Nayak N. Mehrotra R. Mehrotra S. (2022). Carbon biosequestration strategies: a review. Carbon Capture Sci. Technol.4, 100065. doi: 10.1016/j.ccst.2022.100065
28
Ørberg S. B. Duarte C. M. Geraldi N. R. Sejr M. K. Wegeberg S. Hansen J. L. S. et al . (2023). Prevalent fingerprint of marine macroalgae in arctic surface sediments. Sci. Total Environ.898, 165507. doi: 10.1016/j.scitotenv.2023.165507
29
Ørberg S. B. Seidenkrantz M. S. Geraldi N. R. Andresen C. S. Kjeldsen K. U. Duarte C. M. et al . (2025). Millennial-scale fingerprint of macroalgae in Arctic marine sediments. Sci. Total Environ.998, 180191. doi: 10.1016/j.scitotenv.2025.180191
30
Ortega A. Geraldi N. R. Alam I. Kamau A. A. Acinas S. G. Logares R. et al . (2019). Important contribution of macroalgae to oceanic carbon sequestration. Nat. Geosci12, 748–754. doi: 10.1038/s41561-019-0421-8
31
Pessarrodona A. Franco-Santos R. M. Wright L. S. Vanderklift M. A. Howard J. Pidgeon E. et al . (2023). Carbon sequestration and climate change mitigation using macroalgae: a state of knowledge review. Biol. Rev.98, 1945–1971. doi: 10.1111/brv.12990
32
Piredda R. Tomasino M. P. D’Erchia A. M. Manzari C. Pesole G. Montresor M. et al . (2017). Diversity and temporal patterns of planktonic protist assemblages at a Mediterranean Long Term Ecological Research site. FEMS Microbiol. Ecol.93, fiw200. doi: 10.1093/femsec/fiw200
33
Preston R. Majaneva M. Halonen V. Rodil I. F. (2024). Different approaches to estimate benthic metazoan diversity associated with free-living macroalgae (Fucus vesiculosus) on shallow soft sediments. Estuar. Coast. Shelf Sci.301, 108731. doi: 10.1016/j.ecss.2024.108731
34
Raven J. (2018). Blue carbon: Past, present and future, with emphasis on macroalgae. Biol. Lett.14, 20180336. doi: 10.1098/rsbl.2018.0336
35
Ross F. W. R. Boyd P. W. Filbee-Dexter K. Watanabe K. Ortega A. Krause-Jensen D. et al . (2023). Potential role of seaweeds in climate change mitigation. Sci. Total Environ.885, 163699. doi: 10.1016/j.scitotenv.2023.163699
36
Schrader C. Schielke A. Ellerbroek L. Johne R. (2012). PCR inhibitors - occurrence, properties and removal. J. Appl. Microbiol.113, 1014–1026. doi: 10.1111/j.1365-2672.2012.05384.x
37
Shaffer M. R. Andruszkiewicz Allan E. Van Cise A. M. Parsons K. M. Shelton A. O. Kelly R. P. (2025). Observation bias in metabarcoding. Mol. Ecol. Resour. e14119. doi: 10.1111/1755-0998.14119
38
Sidstedt M. Rådström P. Hedman J. (2020). PCR inhibition in qPCR, dPCR and MPS—mechanisms and solutions. Anal. Bioanal Chem.412, 2009–2023. doi: 10.1007/s00216-020-02490-2
39
Stoeck T. Bass D. Nebel M. Christen R. Jones M. D. M. Breiner H. W. et al . (2010). Multiple marker parallel tag environmental DNA sequencing reveals a highly complex eukaryotic community in marine anoxic water. Mol. Ecol.19, 21–31. doi: 10.1111/j.1365-294X.2009.04480.x
40
Strickler K. M. Fremier A. K. Goldberg C. S. (2015). Quantifying effects of UV-B, temperature, and pH on eDNA degradation in aquatic microcosms. Biol. Conserv.183, 85–92. doi: 10.1016/j.biocon.2014.11.038
41
Tagliabue A. Matterson K. O. Ponti M. Turicchia E. Abbiati M. Costantini F. (2023). Sediment and bottom water eDNA metabarcoding to support coastal management. Ocean Coast. Manag244, 106785. doi: 10.1016/j.ocecoaman.2023.106785
42
Tedersoo L. Hosseyni Moghaddam M. S. Mikryukov V. Hakimzadeh A. Bahram M. Nilsson R. H. et al . (2024). EUKARYOME: the rRNA gene reference database for identification of all eukaryotes. Database2024. doi: 10.1093/database/baae043
43
Torti A. Lever M. A. Jørgensen B. B. (2015). Origin, dynamics, and implications of extracellular DNA pools in marine sediments. Mar. Genomics24, 185–196. doi: 10.1016/j.margen.2015.08.007
44
van der Loos L. M. Nijland R. (2021). “ Biases in bulk: DNA metabarcoding of marine communities and the methodology involved,” in Molecular ecology ( John Wiley and Sons Inc) 30, 3270–3288. doi: 10.1111/mec.15592
45
Varrella S. Livi S. Corinaldesi C. Castriota L. Maggio T. Vivona P. et al . (2025). A comprehensive assessment of non-indigenous species requires the combination of multi-marker eDNA metabarcoding with classical taxonomic identification. Environ. Int.199. doi: 10.1016/j.envint.2025.109489
46
Wasmund K. (2023). Deciphering community interactions of sulfate-reducing microorganisms in complex microbial communities of marine sediments. mBio14, e00513–23. doi: 10.1128/mbio.00513-23
47
Wu J. Keller D. P. Oschlies A. (2023). Carbon dioxide removal via macroalgae open-ocean mariculture and sinking: an Earth system modeling study. Earth System Dynamics14, 185–221. doi: 10.5194/esd-14-185-2023
48
Yamuza-Magdaleno A. Jiménez-Ramos R. Casal-Porras I. Brun F. G. Egea L. G. (2024). Long-term sediment organic carbon remineralization in different seagrass and macroalgae habitats: implication for blue carbon storage. Front. Mar. Sci.11. doi: 10.3389/fmars.2024.1370768
49
Yang J. Jeppe K. Pettigrove V. Zhang X. (2018). Environmental DNA metabarcoding supporting community assessment of environmental stressors in a field-based sediment microcosm study. Environ. Sci. Technol.52, 14469–14479. doi: 10.1021/acs.est.8b04903
50
Zhang G. K. Chain F. J. J. Abbott C. L. Cristescu M. E. (2018). Metabarcoding using multiplexed markers increases species detection in complex zooplankton communities. Evol. Appl.11, 1901–1914. doi: 10.1111/eva.12694
51
Zhang M. Zou Y. Xiao S. Hou J. (2023). Environmental DNA metabarcoding serves as a promising method for aquatic species monitoring and management: A review focused on its workflow, applications, challenges and prospects. Mar. Pollut. Bull.194, 115430. doi: 10.1016/j.marpolbul.2023.115430
Summary
Keywords
eDNA, macroalgae, blue carbon, sedimentary DNA, molecular marker, 18S rRNA gene, benthic ecosystem, carbon sequestration
Citation
Do J-M, Seo Y-H, Noh H-S, Shin Y, Lee J-W, Kim B, Kim J, Shin S-Y and Yoon H-S (2025) A blue carbon eDNA marker reveals macroalgal signals from coastal to deep-sea sediments. Front. Mar. Sci. 12:1673977. doi: 10.3389/fmars.2025.1673977
Received
27 July 2025
Revised
24 November 2025
Accepted
26 November 2025
Published
12 December 2025
Volume
12 - 2025
Edited by
Teresa Margarida Mouga, Polytechnic Institute of Leiria, Portugal
Reviewed by
Marc B. Anglès d’Auriac, Norwegian Institute for Water Research (NIVA), Norway
Qikun Xing, Ocean University of China, China
Updates
Copyright
© 2025 Do, Seo, Noh, Shin, Lee, Kim, Kim, Shin and Yoon.
This is an open-access article distributed under the terms of the Creative Commons Attribution License (CC BY). The use, distribution or reproduction in other forums is permitted, provided the original author(s) and the copyright owner(s) are credited and that the original publication in this journal is cited, in accordance with accepted academic practice. No use, distribution or reproduction is permitted which does not comply with these terms.
*Correspondence: Sun-Young Shin, syshin@knu.ac.kr; Ho-Sung Yoon, hsy@knu.ac.kr
Disclaimer
All claims expressed in this article are solely those of the authors and do not necessarily represent those of their affiliated organizations, or those of the publisher, the editors and the reviewers. Any product that may be evaluated in this article or claim that may be made by its manufacturer is not guaranteed or endorsed by the publisher.