Abstract
Introduction:
The "blue economy" is an invaluable part in the pursuit of Sustainable Development Goal 14 (SDG14), with China's active engagement holding significant implications for global marine governance. However, a quantitative, regionally scaled “bottom-up” assessment framework for blue economy growth and actionable implementation strategies remain underexplored.
Methods:
This study addresses this gap by first utilizing a Strengths, Weaknesses, Opportunities, and Threats (SWOT) analysis to identify the marine development direction of Wuyuan Bay. Subsequently, a novel Seashore Vitality Assessment (SVA) framework, integrated with the Gray Relation Analysis (GRA) method, is constructed to inform Marine Spatial Planning (MSP) for sustainable development. Applied to the typical case of Wuyuan Bay, this framework effectively measures the blue economy growth level of coastal zones.
Results:
The SVA results unveil that economic vitality, particularly in sea areas, is the primary factor limiting blue economy growth, highlighting MSP as the most effective pathway for enhancement, tailored by distinct seashore types. The derived marine development direction for Wuyuan Bay is “ecology + tourism + sports”, leading to four comprehensive MSP strategies.
Discussion:
This study contributes by filling a critical research gap in urban vitality assessment within marine and coastal zones, emphasizing the integrated land-sea interface and the spillover effects of marine influences. The framework's simplicity and effectiveness offer a valuable reference for other regions in formulating blue economy growth plans and fostering multi-stakeholder benefits. Future research should deepen data analysis through longitudinal datasets and advanced statistical modeling, systematically incorporate cultural vitality metrics using diverse data sources including statistical yearbooks and web search indices, and consider the effectiveness evaluation and adaptive regulatory schemes for MSP.
1 Introduction
The increasing global recognition of the ocean’s paramount importance for human well-being and economic prosperity has spurred intensive efforts towards “integrated marine and coastal management” and sustainable development of coastal cities, with concepts like the blue economy, Marine Spatial Planning (MSP), and city vitality at the forefront of these endeavors (Noonan-Birch et al., 2024; Reusch et al., 2018; Stephenson et al., 2023; Yin et al., 2022; Zhao et al., 2025). Since the concept of the “blue economy” was proposed at the United Nations Conference on Sustainable Development in Rio de Janeiro in 2012 (UN, 2012), almost all coastal countries and cities actively participating and joining in developing the blue economy because of its clear benefits, especially among managers (Bennett et al., 2019; Narwal et al., 2024). As a country with vast marine territories, a large population and a significant marine economy, China’s participation in the construction of the blue economy has an important impact on global ocean governance and sustainable development (Crona et al., 2020). The blue economy serves as a pivotal instrument in China’s strategy to foster the sustainable development of oceanic resources (Fabinyi et al., 2021). Initially introduced in China’s 13th Five-Year Plan in 2016, this concept marks a significant shift from the prioritization of the growth of the “marine economy” at the expense of marine environmental conservation (Ding et al., 2014). Following its introduction, the term “blue economy” has gained increasing prominence and has been operationalized through various policies, such as “Blue Bay” (Sui et al., 2020), “Harmony Island”, and island restoration programs (Zhang et al., 2023). Particularly after 2018, China adopted one of the strictest management approaches to ocean development and utilization in its history, characterized by measures such as limiting land reclamation and enclosures (Lin et al., 2022). Building on this trajectory of intensified environmental governance, the subsequent 14th Five-Year Plan (2021-2025) further solidified the blue economy as a core strategy, emphasizing integrated land-sea planning to achieve high-quality marine development and foster marine ecological civilization (Wei et al., 2020). Nevertheless, the scarcity of robust blue economy growth assessment frameworks and actionable implementation methodologies currently impedes the effective realization of these ambitious objectives. While macro-level policy frameworks and governance structures have been progressively established to guide blue economy development, sophisticated bottom-up regional blue economy performance assessment and practical implementation pathways remain largely in an exploratory phase. In this context, the role of MSP in facilitating blue economy growth is undeniable (Surís-Regueiro et al., 2021; Yang et al., 2025), manifesting particularly in its capacity for integrated environmental protection, fostering the integration of local community knowledge, reconciling diverse stakeholder interests, and establishing sustainable economic objectives (Hoareau, 2025; Knol-Kauffman et al., 2023; Yang et al., 2025). Specifically, the strategic formulation of regional MSP initiatives, informed by robust scientific blue economy growth assessment results, represents a particularly potent and viable pathway to address these challenges.
Recognized for its clear benefits in areas such as marine pollution reduction and the preservation of marine life, the blue economy represents a crucial pathway for the successful achievement of Sustainable Development Goal 14 (SDG 14), “Life Below Water”, and has accordingly received considerable attention recently (Duan et al., 2024; Liang et al., 2022). A broadly agreed-upon understanding of the definition of the blue economy has not yet been developed, and the main divergences have concerned the scope and prioritization of the internal objectives (Voyer et al., 2022). The term encompasses a broader range of activities than the “marine economy”, which traditionally focuses on economic exploitation. Furthermore, the blue economy emphasizes social well-being and environmental stewardship, aligning with the United Nations Sustainable Development Goals (SDGs) (Cisneros-Montemayor et al., 2019). The World Bank describes the blue economy as supporting “the sustainable use of ocean resources for economic growth and improved livelihoods and jobs while preserving the health of the ocean” (Bank, 2017). This approach has resonated with international and regional ocean governance bodies and led to a proliferation of studies and practices, particularly in Small Island Developing States (SIDSs) (Noonan-Birch et al., 2024; Phang et al., 2023; Pournara et al., 2023; Voyer et al., 2020). These efforts often converge on three pillars of sustainable development: environmental protection, social equity, and economic growth (Wuwung et al., 2022). Complementing this global understanding, China has articulated its unique “Five-sphere Integrated Overall Plan”, which extends beyond these three pillars to encompass a more holistic approach to national development. This overarching strategy systematically integrates economic prosperity, political stability, cultural advancement, social harmony, and ecological civilization (Wang et al., 2023). Particularly, the emphasis on ecological civilization highlights China’s commitment to prioritizing harmonious coexistence between humanity and nature, aligning closely with environmental protection. Meanwhile, political stability and cultural advancement provide the institutional and ideological foundations for fostering social equity and sustainable economic growth, ultimately aiming for comprehensive and balanced national progress. Assessing the performance of the blue economy presents unique challenges because of its multifaceted nature. Scholars employ various metrics to evaluate specific aspects of the blue economy, including policy coherence, socioeconomic indicators (Voyer et al., 2022), ecosystem service values (Maskaeva et al., 2024), aggregate risk (Hodgson et al., 2019), and social justice (Germond-Duret et al., 2023). However, despite their individual insights, these varied metrics often exhibit a lack of spatial resolution and integrated frameworks, consequently hindering their direct translation into holistic, actionable strategies for regional blue economy growth and spatial planning. Crucially, the ultimate success of blue economy initiatives and MSP at the regional level hinges upon the sustained vitality and sustainable development of coastal cities, yet conventional vitality assessment approaches frequently overlook the critical land-sea interface.
City vitality, as defined by Maas in 1984, is “derived from a variety of unique business and recreational opportunities and a dense social heterogeneous pedestrian population” (Maas, 1984). This concept encapsulates a city’s allure and competitive edge across the environmental, societal, economic, and cultural domains and serves as a catalytic force for its enduring growth in a manner similar to the “blue economy”. In the realm of urban planning, the exploration of land space vitality has been multifaceted, encompassing studies at various scales, e.g., cities (Wang et al., 2022), districts (Gómez-Varo et al., 2022), regions (Meng and Xing, 2019), and streets (Xia et al., 2020). Typically, assessment frameworks are constructed based on evaluations of indicators that represent the economic, social, and environmental systems. The dynamism of coastal areas, particularly those adjacent to the shoreline, is pivotal to broader city vitality, given that nearly half of the world’s cities with populations exceeding one million are located at or near estuaries, tidal river mouths, and approximately two-thirds of the global populace resides within 60 kilometers of the coastline (UNAO, 2016). Seascapes have long been prized, with seaside properties fetching premium prices worldwide (Latinopoulos, 2018). Most previous research has concentrated on riverine or lakeside environments (Fan et al., 2023, 2021; Wu et al., 2019), often treating them as an extension of terrestrial urban areas with limited consideration of the marine dimension. Notably, one study that explored coastal frontages focused solely on terrestrial areas, completely neglecting the intricate interplay with the marine expanse (Huang et al., 2022). This oversight is particularly glaring for coastal cities whose economic, environmental, and social fabric is intrinsically linked to the sea. To address this critical research gap and to provide a more tailored assessment for coastal environments, this study proposes a Seashore Vitality Assessment (SVA) framework. The SVA framework is thus conceptualized as a specialized application and extension of the broader city vitality concept, specifically adapted to capture the unique features and dynamics of coastal zones, encompassing both land-sea interactions and their integrated valuation. This spatially-explicit framework is designed to overcome the limitations of existing blue economy assessment methodologies, particularly by providing a robust, bottom-up approach for evaluating regional blue economy growth. Moreover, its comprehensive perspective offers critical insights that are essential for informing the strategic formulation of MSP initiatives and enhancing the practical implementation pathways for sustainable blue economic development.
The objectives of this study were threefold: (1) To develop a robust SVA framework, building upon current urban land spatial vitality assessment studies, specifically by identifying and defining appropriate indicators that effectively capture the unique features and integrated land-sea interactions of coastal zones for assessing blue economy growth. (2) To demonstrate how the SVA framework and its assessment results can inform and contribute to the strategic formulation of regional MSP, thereby providing a spatially-explicit, bottom-up approach to enhance blue economic governance and facilitate sustainable development. (3) To validate the feasibility, effectiveness, and practical utility of the proposed SVA framework and its application in MSP through a comprehensive case study.
2 Materials and methods
2.1 Study area
Wuyuan Bay is situated in the northeastern corner of Xiamen Island, within the city of Xiamen, Fujian Province, China. A prominent coastal city in Southeast China, Xiamen is aptly known as the “Island of Egrets” for its long history as a haven for these graceful birds, reflecting its significant natural heritage. This ecological identity complements its rich maritime past as a hub of the Maritime Silk Road and one of China’s first open trading ports, with its later designation as a Special Economic Zone further driving its port-centric economic development. Indeed, leveraging its well-preserved ecology and abundant coastal charm, Xiamen has also fostered a vibrant tourism industry, contributing significantly to its overall economic and social vitality. It is a compact urban bay that forms part of the larger Xiamen Bay. The bay is uniquely divided into inner and outer sections by a sluice gate at the foot of Tianyuan Bridge. The outer bay opens directly into the sea, whereas the water level of the inner bay is regulated by the sluice gate to facilitate daily exchanges with the outer bay (Figure 1). It has a subtropical marine monsoon climate, which is mild and rainy, warm, hot and humid, with an average annual temperature of 20.9 °C. Precipitation is distributed mainly between April and August each year, accounting for 67% of the total annual precipitation, with an average annual precipitation of 1183.4 mm. The region lies within the subtropical monsoon zone, where there are distinct seasonal shifts in wind direction and velocity. Throughout the year, the predominant wind direction is from the east, with the average annual wind speed reaching 3.4 m/s. Surrounding Wuyuan Bay is an artificial coastline that serves as a form of hard shore protection. Owing to its limited fetch, the winds that reach the bay generate minimal waves, resulting in a generally tranquil water surface.
Figure 1
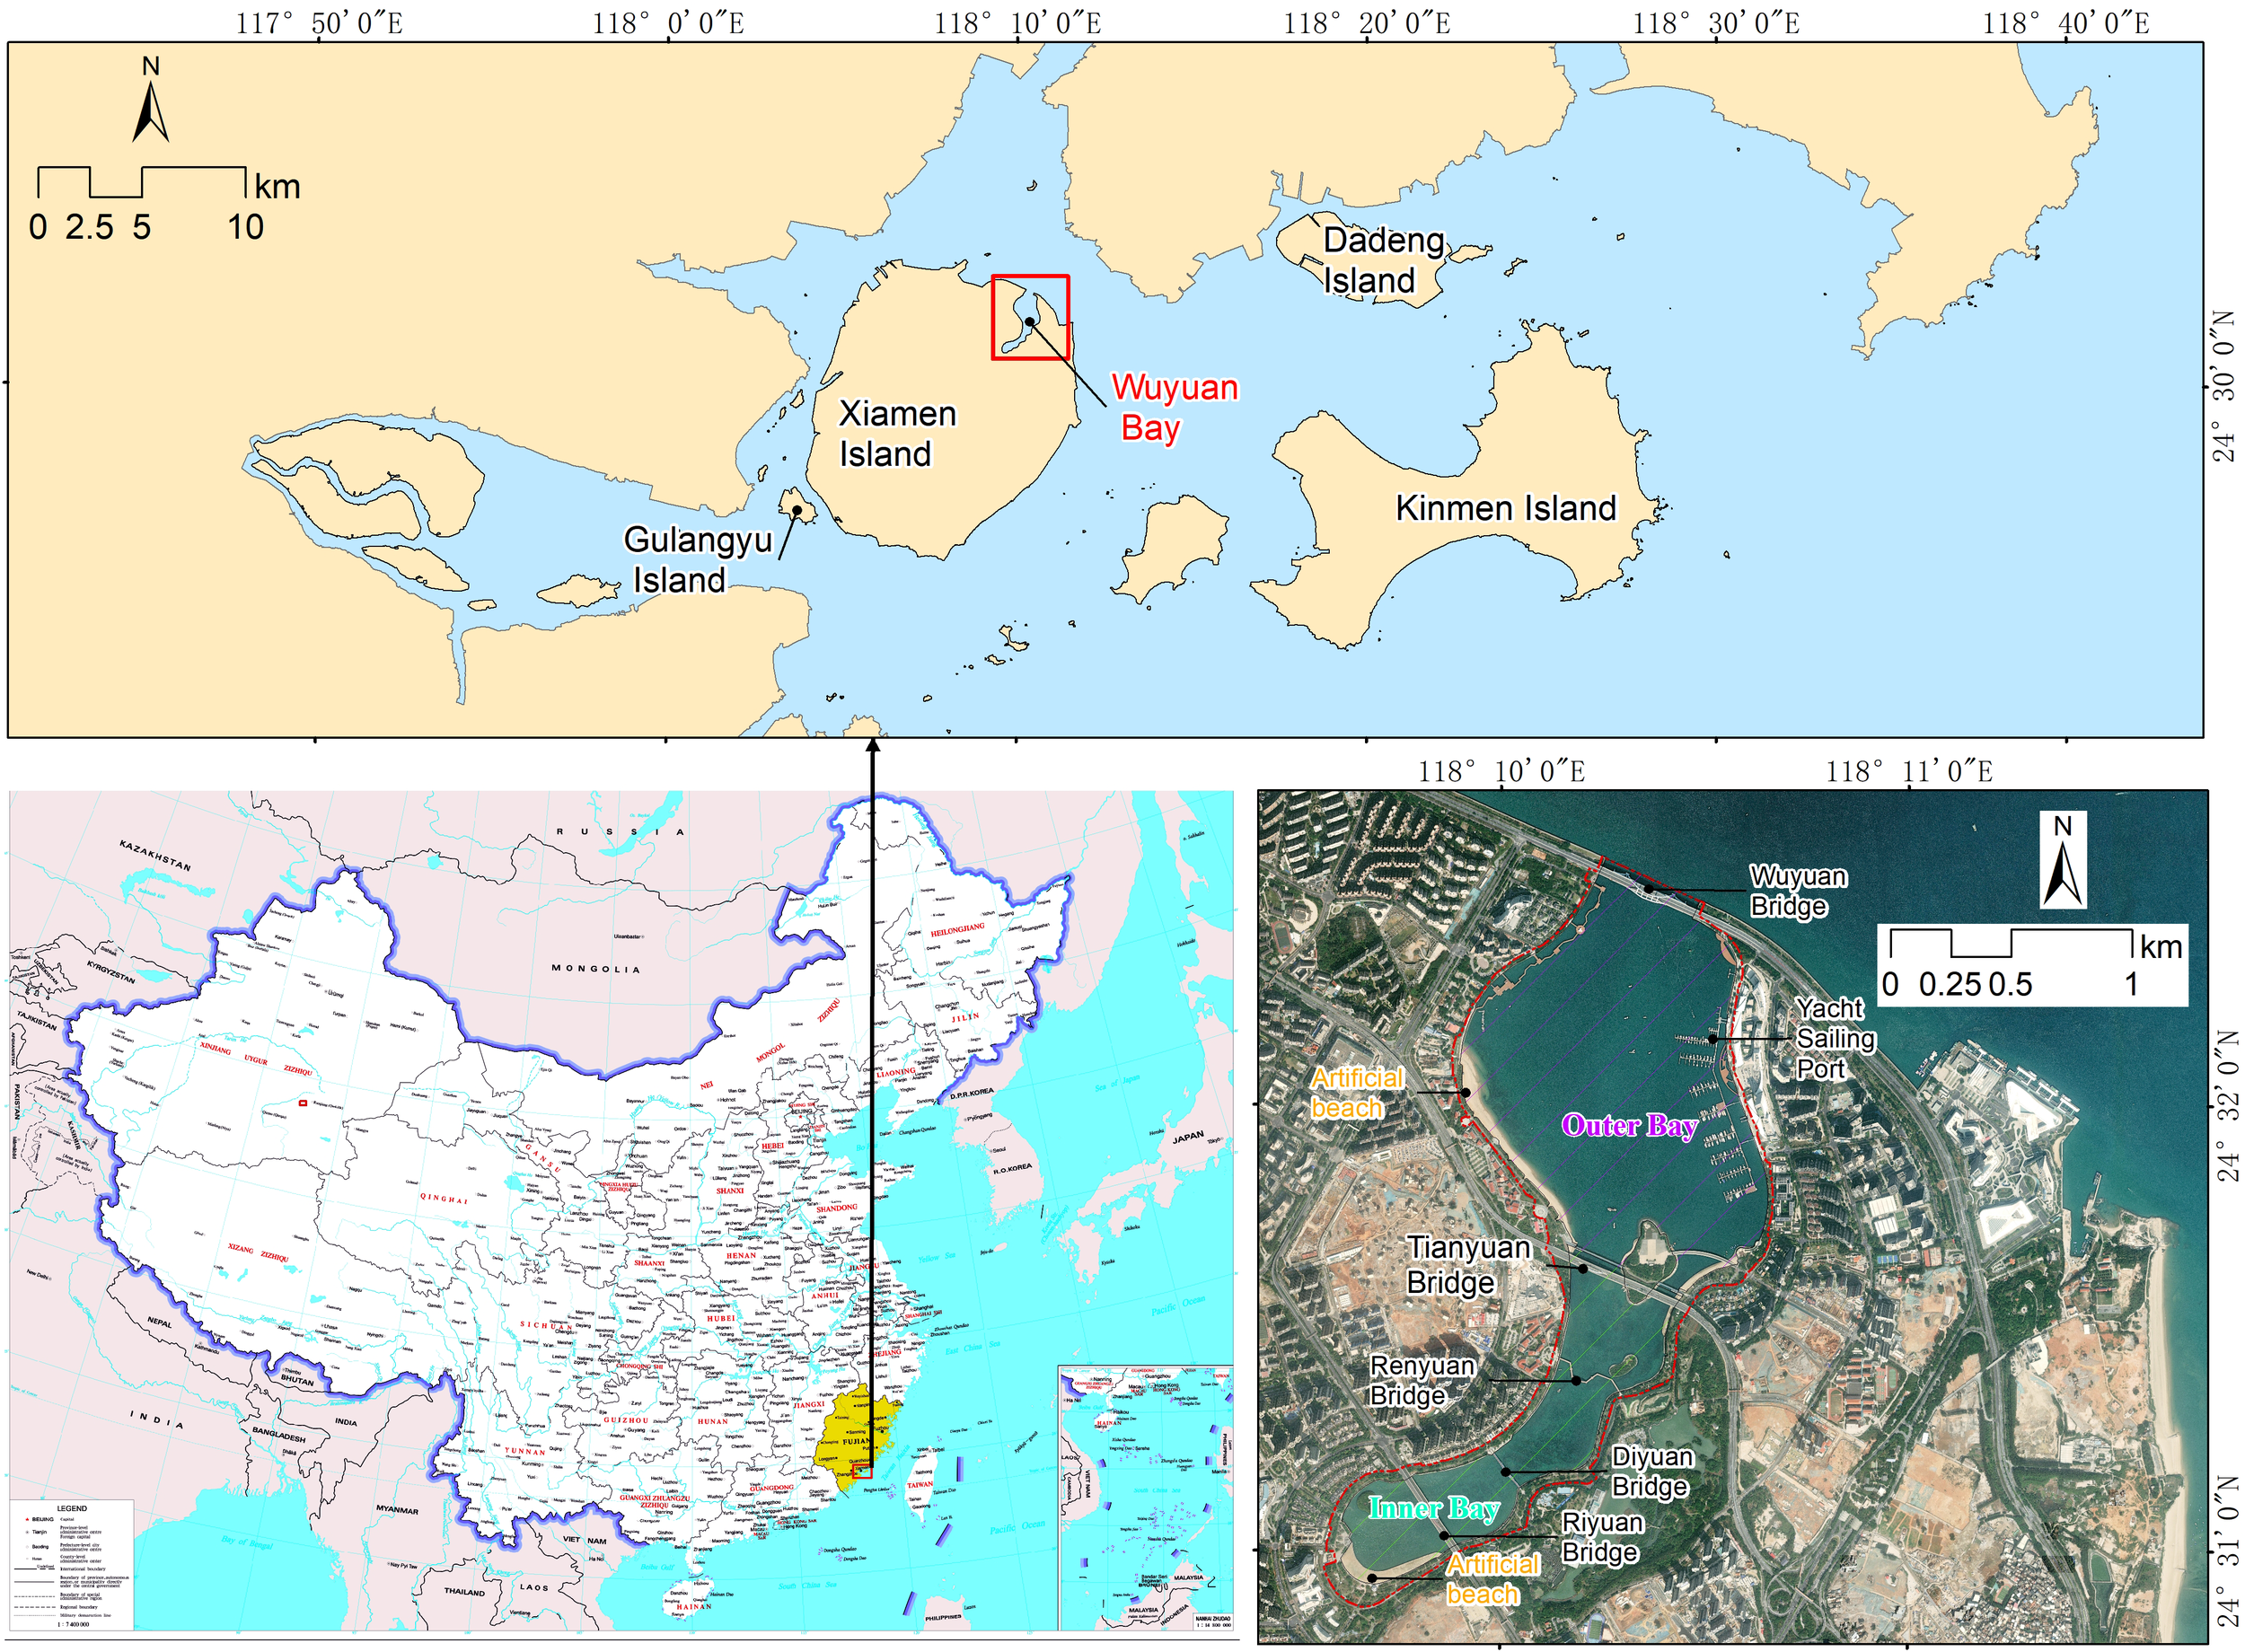
Location of Wuyuan Bay.
Before 2002, Wuyuan Bay suffered extensive environmental degradation due to overfishing, improper waste disposal, and the construction of seawalls that disrupted the natural flow of seawater. These problems led to severe pollution in the inner bay, which was characterized by foul odors, whereas the outer bay experienced prolonged erosion, giving rise to expansive tidal flats. The damage to the bay’s natural ecosystem significantly hindered regional economic and social progress, compelling locals to relocate. In 2002, the Xiamen Party Committee of the Municipal Committee and the People’s Government of the Municipality initiated a project aimed at restoring and developing the Huli Wuyuan Bay area ecologically. Since then, two decades of dedicated urban development efforts have transformed Wuyuan Bay into an exemplary eco-space that harmoniously blends water, vegetation, wetlands, and coastal landscapes and has become one of the most desirable residential districts on Xiamen Island, commanding premium real estate prices. A suite of ecological conservation and restoration strategies has successfully rejuvenated the bay’s ecological foundation and natural assets (Chen et al., 2012). As a result, the bay’s waters have been classified as a recreational sea area in the most recent territorial spatial planning.
The selection of Wuyuan Bay as the study area is driven by its exceptional significance as a microcosm of sustainable coastal urban development challenges and opportunities in China. Economically, it represents a pivotal zone for Xiamen’s transition towards a blue economy model, moving beyond traditional fisheries towards high-value marine industries, recreational tourism, and premium residential development. The bay hosts a prominent marina, a developing cruise terminal, and a growing cluster of marine-related service industries, positioning it as a future hub for marine leisure and innovation. While agriculture is not a primary industry within the immediate bay area due to its high degree of urbanization, the bay’s ecological health directly supports the broader regional food security through its contributions to coastal ecosystems and indirectly enhances the quality of life for a populace that values local seafood products. Moreover, its transformation from a severely degraded ecosystem to a high-value residential and recreational area underscores its critical role in Xiamen’s urban planning and sustainable development strategies. The bay’s status as a recreational sea area further highlights its increasing importance for urban tourism and leisure activities, drawing both local residents and visitors. However, despite its ecological recovery and prime location, the potential of the bay’s sea area remains largely underutilized beyond the northeastern marina. This situation creates a tension between its realized ecological value, its high-end residential appeal, and its untapped potential for sustainable blue economic growth. Consequently, understanding and optimizing the vitality of this unique coastal urban space is crucial for informing future MSP, fostering balanced economic development, and ensuring the long-term environmental integrity and social well-being of a premier coastal urban area. This makes Wuyuan Bay an ideal and urgent case study for examining the multifaceted dimensions of coastal city vitality. Currently, however, bay development is focused primarily on a marina on the bay’s northeastern side, leaving much of the sea area underutilized. This situation impedes the growth of the blue economy in the region. Consequently, there is a pressing call from marine authorities, tourist bodies, tourism developers, and the local community to foster sustainable economic development in Wuyuan Bay. These entities advocate balanced growth that preserves the delicate ecological balance and will thereby enrich the local socioeconomic fabric without compromising the bay’s environmental integrity.
2.2 Methodological process
The overarching methodological framework of this study integrates multi-source data analysis, sea-use directions analysis, the development of a novel assessment framework, and the formulation of MSP schemes (Figure 2). This comprehensive process unfolds in four main steps:
Figure 2
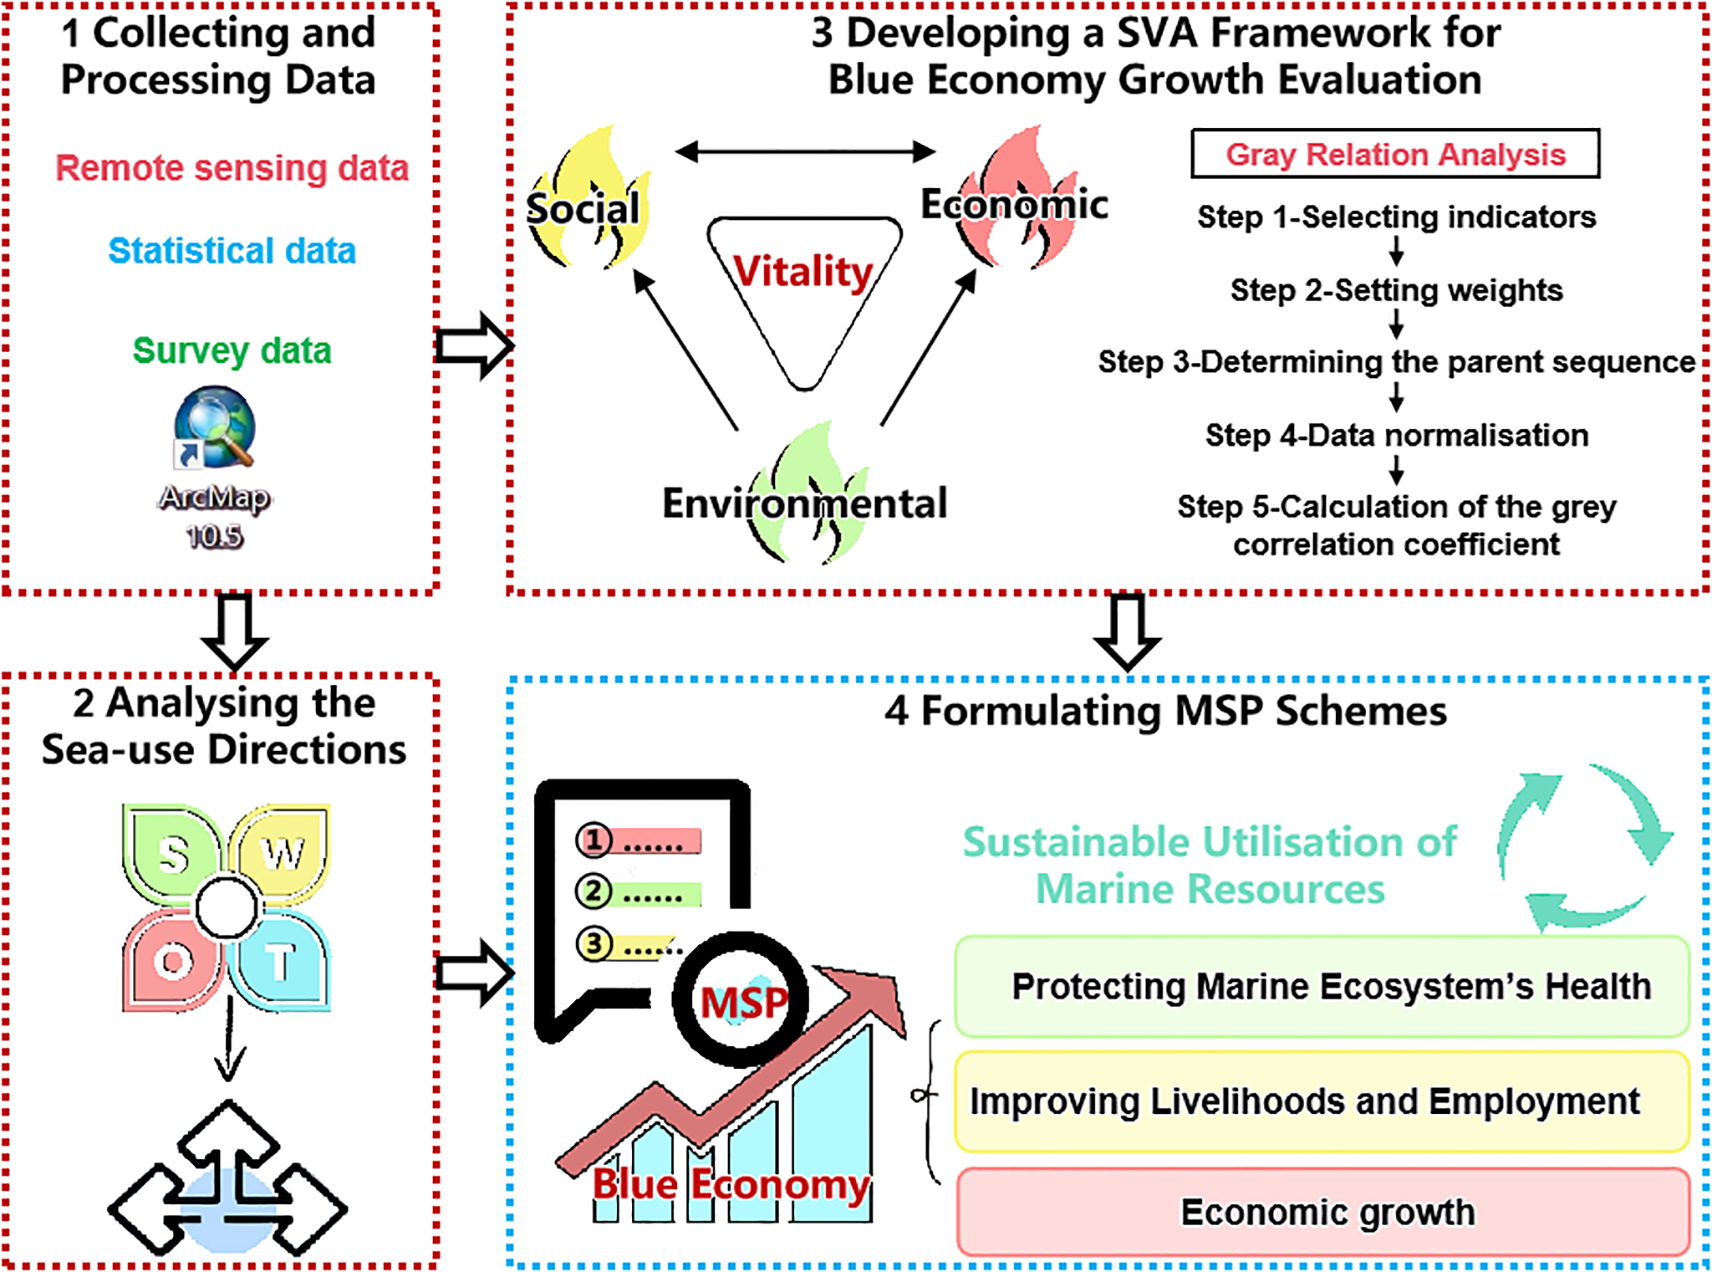
Technical roadmap.
Firstly, collecting the comprehensive various essential datasets, including remote sensing data for spatial features, statistical data for socio-economic and environmental indicators, and survey data to capture specific local insights. These diverse data types are then meticulously processed, integrated, and managed using ArcMap 10.5 to ensure their spatial accuracy and readiness for subsequent analytical stages.
Secondly, conducting a comprehensive SWOT (Strengths, Weaknesses, Opportunities, Threats) analysis. The insights derived from the SWOT analysis provide crucial contextual understanding, informing the strategic direction and considerations for the subsequent MSP phase. Crucially, the findings from this SWOT analysis are then utilized to guide the selection and refinement of relevant indicators for the SVA framework, ensuring that the SVA effectively captures the most critical factors influencing blue economy growth in the study area.
Then, constructing and applying the SVA framework by Gray Relation Analysis (GRA) to assess the multi-dimensional vitality of coastal areas. The framework considers critical indicators across Social, Economic, and Environmental dimensions, which are carefully selected based on the insights from the preceding SWOT analysis. The output of this stage yields the SVA scores, which serve as a robust measure for blue economy growth evaluation.
Finally, the detailed SVA results, which quantify blue economy growth levels, are integrated with the strategic insights from the SWOT analysis to inform and guide the formulation of MSP schemes, which are designed to achieve targeted blue economy objectives, specifically focusing on protecting marine ecosystem health, improving livelihoods and employment opportunities, and fostering sustainable economic growth within the coastal region. This step highlights the practical utility of the SVA framework in translating assessment findings into actionable MSP initiatives.
2.2.1 Collecting and processing data
To ensure the contemporary relevance and comprehensiveness of our analysis, we diligently collected up-to-date, multi-source data related to Wuyuan Bay. These datasets included remote sensing imagery, historical documents, drone data, field surveys, and interviews. The specific sources, content, and temporal scope of each dataset are thoroughly documented in Table 1, ensuring transparency and reproducibility.
Table 1
| Data category | Data content | Data time | Data sources |
|---|---|---|---|
| Remote sensing data | High-resolution (approximately 1 m) historical remote sensing images | 2023 | google.cn/maps/ |
| Statistical data | Inner bay seawater quality | 2020 | (Xie et al., 2020) |
| Outer bay seawater quality | 2021 | Third Institute of Oceanography, Ministry of Natural Resources | |
| Hydrodynamics | 2016 | ||
| Charts | 2016 | Maritime Safety Administration of the People’s Republic of China | |
| Information on projects with sea-use licenses | 2023 | Marine and Island Affairs Division, Xiamen Bureau of Natural Resources and Planning | |
| Shoreline survey data (resolution 0.1 m) | 2023 | ||
| Road network | 2023 | https://www.openstreetmap.org/ | |
| POI (Points of Interest) | 2023 | GaoDe Map, Baidu Map | |
| Housing price | 2024 | https://yibin.lianjia.com/; https://xm.fang.com/ | |
| Marine economic output | 2021 | Annual Reports of Enterprise | |
| Survey data | DOM (Digital Orthophoto Map) (resolution 5 cm) data of low tide level of Wuyuan Bay | 2020 | Drone |
| Seashore stability, Shorelines with direct access to water | 2023 | Field survey | |
| Development, investment, and management opinions | 2023 | Tourism Management Departments, Tourism Development Company, Ocean Management Departments | |
| Information on competition and cooperation | 2023 | Tourism Management Departments, field survey |
Data sources for Wuyuan Bay.
All acquired data underwent rigorous preprocessing within ArcGIS 10.5 to ensure spatial accuracy, consistency, and analytical readiness for subsequent stages of the methodology. The detailed processing workflow is outlined below, with visual examples presented in Figure 3.
Figure 3
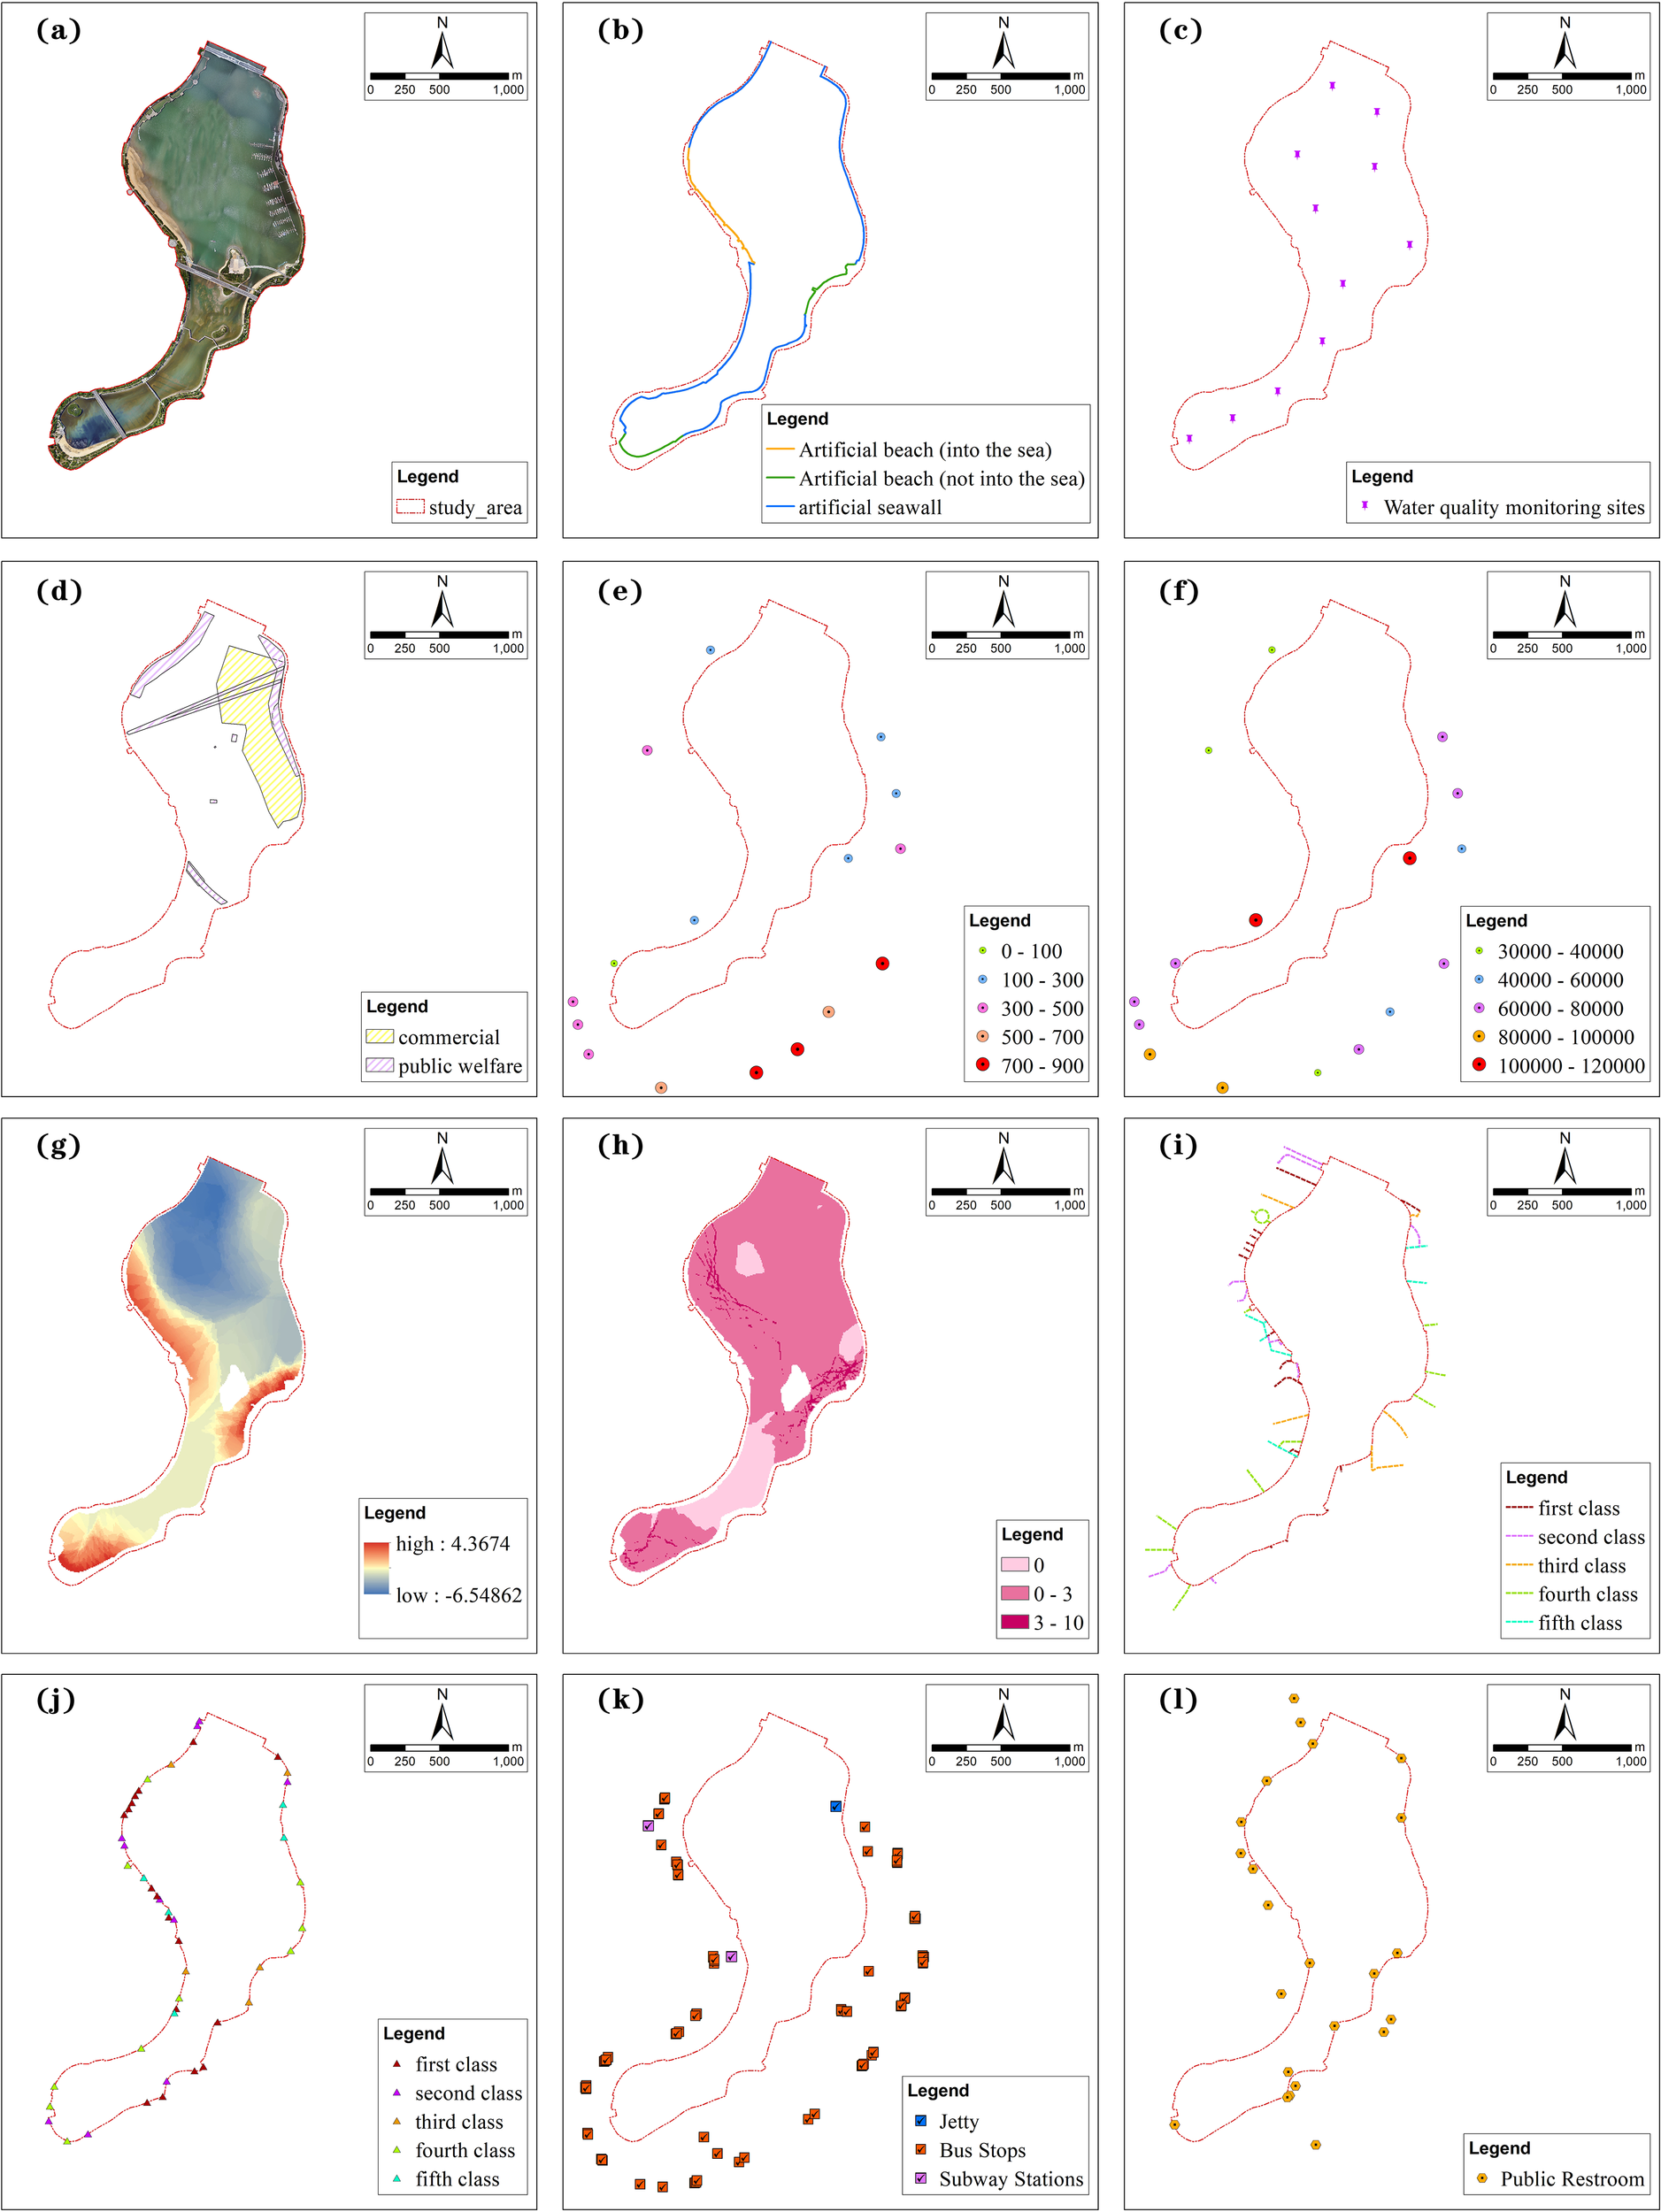
Data processing and analysis maps. ((a Study area; (b) Coastline; (c) Water quality monitoring sites; (d) Scope of marine areas with use permits; (e) Distances of the nearest communities from the coastline; (f) House prices in the nearest communities to the coastline; (g) Topographic map of the seabed; (h) Slope map of the seabed; (i) Roads leading to the study area; (j) Entrances to the study area; (k) Bus stops, subway stations and jetties in and around the study area; (l) Public restrooms in and around the study area.
A fundamental initial step involved unifying all collected geospatial data into a common projected coordinate system (CGCS2000_3_Degree_GK_CM_118.5E). This standardization was essential to facilitate accurate spatial overlay and analysis, eliminating potential geometric inconsistencies across diverse datasets.
For precise spatial base mapping, high-resolution images captured by drones (2020) served as a geometric benchmark to accurately calibrate historical remote sensing imagery from 2023. Subsequently, a visual interpretation method, augmented by intensive field surveys, was employed to delineate public space boundaries. This demarcation relied on identifiable physical features such as fences, maneuvering lanes, and buildings, as well as clear public/non-public land-use characteristics (Figure 3a).
Following spatial alignment, key thematic layers were vectorized into a unified geodatabase to represent critical features of Wuyuan Bay. This encompassed essential spatial information such as shoreline, water quality monitoring sites, and licensed marine areas (Figures 3b–d). Vectorization ensured the data were in an analyzable format for spatial operations.
To integrate socio-economic factors, housing price information from adjacent neighborhoods along the shoreline was collected from leading real estate platforms (LIANJIA and xm.fang.com) for the first quarter of 2024. These point data were then used to generate a housing price map by employing the nearest-neighbor analysis tool in ArcGIS, which calculated and spatialized the nearest-neighbor distances to the shoreline, reflecting urban development intensity and land value gradients (Figures 3e, f).
For comprehensive topographic representation, elevation data below the 0-meter line were extracted from nautical charts, while on-site measurements using RTK (Real-Time Kinematic) tools provided precise elevation data above the 0-meter line. Recognizing the sparsity and potential incompleteness of nautical chart points, a densification process was first applied to these points. Subsequently, the Kriging interpolation method within the raster interpolation tool was utilized to generate a continuous raster topography, which was then accurately clipped to the study area using a mask extraction method. This detailed topographic surface was critical for conducting subsequent slope analysis, informing geomorphological assessments (Figures 3g, h).
The road network data, initially downloaded from OpenStreetMap (OSM), underwent rigorous correction and refinement in ArcGIS. This involved combining high-resolution imagery and field survey pictures to ensure geographical accuracy. Roads connecting to the study area were meticulously organized, and specific entrances and exits were identified. These access points were then assigned values reflecting their road level and the density of surrounding pedestrian flow, which is vital for accessibility analysis and understanding human-sea interactions (Figures 3i, j).
Similarly, POI data from GaoDe Map and Baidu Map were subject to verification and correction using DOM. The spatial scope of these POIs, including traffic data and basic service facilities, was delimited from the nearest main road to the coastline. This process ensured that the POI data accurately represented the distribution and accessibility of key services and infrastructure within the coastal influence zone (Figures 3k, l).
2.2.2 Analyzing the sea-use directions by SWOT
SWOT analysis is a widely employed strategic planning tool, gaining a significant advantage from its inherent simplicity, as it traditionally serves as an effective brainstorming technique (Phadermrod et al., 2019). This structured framework for systematically evaluating internal capabilities (Strengths and Weaknesses) and external environmental factors (Opportunities and Threats) is particularly advantageous in complex, multifaceted environments. Such an approach is crucial in domains like MSP and tourism development, where a comprehensive understanding of diverse influencing factors is essential for the robust interpretation of findings and the formulation of informed decisions. In accordance with territorial spatial planning, the resource endowment of Wuyuan Bay’s sea area has been explicitly determined to be suitable for tourism and recreational use. Consequently, we communicated with the tourism management department, tourism development companies with capability and interest, and all relevant marine management departments through various consultative channels, including meetings and interviews, and determined that the main method of sea use is sports tourism (Appendix D). Subsequently, we analyzed neighboring competing products through a combination of literature surveys and onsite surveys and consolidated all the data to summarize the SWOT analysis of the development of the bay.
To further substantiate the methodological choice of SWOT analysis for evaluating this development initiative, its extensive application in analogous marine and tourism-related studies within the academic literature provides robust justification and highlights its inherent merits. For instance, within the domain of sports tourism directly pertinent to this study, a research conducted a comprehensive SWOT analysis on the development status of sports tourism in Hainan, and effectively demonstrated the utility of SWOT in analyzing the current conditions, identifying significant development potential, and pinpointing existing gaps within the soft environmental aspects of the region (Xia et al., 2012). In the broader context of MSP, SWOT analysis is consistently recognized as an effective methodology for evaluating management strategies and identifying critical issues. For example, employed a SWOT analysis, grounded in a 3D MSP approach, to comprehensively ascertain the current and prospective coastal and marine management practices and associated challenges in Pakistan (Ullah et al., 2017). Their work provided an invaluable baseline for informed resource allocation and the promotion of sustainable utilization within these marine areas.
From the specific perspective of coastal tourism, a research developed an Integrated Coastal Tourism Zone Management (ICTZM) plan for the southern coastline of the Caspian Sea, showed that SWOT analysis played a pivotal role in their strategic planning framework, facilitating the precise identification of areas possessing significant tourism potential while concurrently exhibiting lower environmental vulnerability, and this systematic approach enabled the formulation of conservative yet effective development strategies (Monavari et al., 2013). Furthermore, another research utilized a refined SWOT-TWOS matrix as an integral component of their marine-coastal spatial planning strategies for conservation areas. This methodological integration proved highly effective in proposing ecosystem-based strategies and ensuring the long-term viability of marine-coastal protection initiatives (Escandón-Panchana et al., 2022). Collectively, these diverse case studies provide compelling evidence of the broad applicability and powerful analytical capacity of SWOT analysis. It consistently proves instrumental in understanding intricate socio-ecological systems, meticulously evaluating multiple interacting drivers, and formulating actionable strategies for sustainable management and comprehensive development across various marine and coastal contexts.
By rigorously integrating insights derived from targeted literature surveys, conducting thorough onsite investigations of neighboring competing products, and consolidating all collected data, the application of SWOT analysis to the development prospects of Wuyuan Bay provides a robust and comprehensive framework. This framework enables the systematic summarization of internal capabilities, external environmental dynamics, inherent development potential, and strategic directions, all of which are consistent with established best practices in both marine and tourism planning research.
2.2.3 Constructing the SVA framework by GRA
The coastal zone, as a dynamic interface between land and sea, demands a comprehensive assessment methodology to support sustainable planning and management due to its inherent complexity and multi-functionality (Wang et al., 2024). The SVA is a multifaceted concept encompassing environmental, social, and economic dimensions, requires a robust multi-criteria decision-making (MCDM) framework. In existing literature on city vitality, several MCDM methods have been widely applied, such as Principal Component Analysis (PCA) (Lang et al., 2022), Analytic Hierarchy Process (AHP) (Zhang and Han, 2022), deviation maximization method (Shi et al., 2021), Data Envelopment Analysis (DEA) (Lopes and Camanho, 2013), GIS-sDNA (Wang et al., 2022), and projection pursuit model (Yue et al., 2019). However, these methods present distinct challenges when applied to the comprehensive and integrated assessment of seashore vitality. For instance, the AHP, while effective for structuring complex problems, relies heavily on expert judgment and pairwise comparisons, potentially introducing significant subjectivity and becoming cumbersome with numerous indicators. Quantitative methods such as PCA and projection pursuit models are primarily designed for data reduction or identifying optimal projections, often assuming specific statistical distributions or requiring large datasets, which may not fully capture the nuanced, often non-linear, interrelationships crucial for a holistic vitality assessment. DEA focuses specifically on evaluating the relative efficiency of decision-making units, rather than providing a comprehensive score of multi-dimensional vitality. Similarly, specialized spatial analysis tools like GIS-sDNA, while powerful for analyzing spatial configurations and network accessibility, do not offer a unified MCDM framework to integrate diverse socio-economic and environmental dimensions into a single vitality score. The deviation maximization method, though useful for determining indicator weights, can be sensitive to data distribution outliers and may not fully reflect the dynamic changes within the system. These inherent limitations in reliably capturing the complex interdependencies, dynamic nature, and potentially limited data characteristics of SVA’s multi-dimensional components underscore the necessity for an alternative, more robust, and objective approach.
Consequently, this study adopts the GRA method for SVA. The fundamental principle of GRA is to measure the degree of geometric similarity between the data curves of a comparative sequence (the actual values of indicators for each unit) and a reference sequence (the ideal values). A higher degree of similarity (i.e., a higher gray correlation grade) implies a closer proximity to the ideal state, thus indicating higher vitality (Ban et al., 2023; Deng, 1989). GRA is particularly well-suited for our study as it effectively handles systems with limited or uncertain data, identifies intrinsic relationships between sequences without requiring large sample sizes or strict statistical assumptions (e.g., normality), and is less sensitive to outliers, thus providing a more comprehensive and objective evaluation of the multifaceted seashore vitality.
2.2.3.1 Delineation of seashore units
Seashore landscapes are characterized by significant heterogeneity, with vast differences in physical, ecological, and historical attributes across various areas. To facilitate a precise assessment, this study divided the seashore landscape into units based on distinct categories of intertidal zones and shorelines (Gkoltsiou and Mougiakou, 2021; Zhang et al., 2023). This unit delineation approach draws upon concepts of heterogeneous area management in landscape ecology and aligns with the principle of region-specific assessment emphasized in Integrated Coastal Zone Management (ICZM) (Avila and Jiménez, 2010). By partitioning the coastal zone, we can conduct tailored evaluations and management for each unit based on its unique characteristics, rather than performing a crude analysis of the entire coastline as a homogeneous entity. This significantly enhances the accuracy of assessment results and the targeting of subsequent management strategies. A total of 8 units can be divided into 4 types:
-
T1: “Vertical seawall” seashore unit (1, 4, 8);
-
T2: “Artificial beach (into the sea)” seashore unit (2);
-
T3: “Multistep seawall” seashore unit (3, 6);
-
T4: “Artificial beach (not entering the sea)” seashore unit (5, 7) (Figure 4).
Figure 4

Seashore units distribution map. (Picture source: https://www.720yun.com/vr/b5ajz0kukn2).
2.2.3.2 Constructing the indicator system
For establishing SVA framework, we selected indicators from the three major vitality support systems—environmental, social, and economic—to construct the criterion layer. Subsequently, 11 representative indicators were screened to form the index layer in combination with available data. We considered that environmental, social, and economic vitality are equally important to overall seashore vitality, so the equal weight method was used to assign weights to each criterion layer in the final vitality calculation. The reference sources and detailed descriptions of the indicators are shown in Appendix A and Table 2.
Table 2
| Target layer | Criterion layer | Index code | Index layer | Index code | Indicator quantification |
|---|---|---|---|---|---|
| Seashore vitality | Environmental vitality | A | Water quality | A1 | Determine the water quality of seawater by measuring the regulatory compliance of the following (suspended solids, water temperature, pH, dissolved oxygen, chemical oxygen demand, biochemical oxygen demand, inorganic nitrogen, reactive phosphate). |
| Hydrodynamic | A2 | Judge the suitability of marine activities by assessing a combination of currents, waves, topography, etc. | |||
| Seashore stability | A3 | Stability of shoreline/seawalls in support of human activities | |||
| Shorelines with direct access to water | A4 | Whether tourists can have direct contact with the sea from the shore | |||
| Social vitality | B | Infrastructure services | B1 | Public restroom services | |
| Transport accessibility | B2 | Ease of access to the seashore through transport facilities, characterized by a combination of bus and metro stops on land, road entrances and exits, and the distribution of docks on the seashore | |||
| Seashore public activity space | B3 | Public space available for human activity immediately adjacent to the shoreline, including the back land area and beach directly adjacent to the water | |||
| Economic vitality | C | Sea-use intensity | C1 | Proportion of sea areas with entitlement-to-use permits as a percentage of overall sea areas | |
| Shoreline use intensity | C2 | Proportion of artificial shoreline to overall shoreline | |||
| Marine economic output | C3 | Level of profitability of marine areas | |||
| Seashore house price index | C4 | Apartment prices for coastal homes with seashore views |
Index system for the SVA of Wuyuan Bay.
Note see Appendix B for the assessment methods and measurement standards of indexes.
2.2.3.3 Setting the parent sequence/ideal values
In GRA, the parent sequence represents the ideal or optimal reference behavior pattern. By setting all indicators as positive indicators and using their maximum values as ideal values to construct the parent sequence, we establish a clear optimization target. All assessment units’ indicators will be compared against this ideal state to quantify their “closeness” to the ideal. This ensures that the assessment results have a clear reference frame, which is crucial for identifying areas performing well and those needing improvement.
2.2.3.4 Data normalization
Different assessment indicators often possess varying scales and units. To eliminate the influence of these disparate magnitudes and ensure all indicators contribute equitably to the analysis, data normalization is an essential prerequisite. This study employed the Min-Max normalization method to linearly transform all raw data into a standardized [0, 1] range (Equation 1).
where Y is the original data value for an indicator, Min(Y) and Max(Y) are the minimum and maximum values of that indicator across all units, respectively, and norY is the normalized value. This transformation ensures that the data is dimensionless and comparable before calculating the gray correlation coefficient.
2.2.3.5 Calculation of the gray correlation coefficient
The gray correlation θij is calculated as follows (Equation 2):
where is the absolute difference between the jth assessment indicator at points ai and a0, is the two-level minimum difference, is the two-level maximum difference, β is the resolution, 0<β<1, and β is taken as 0.5 for the study. θij is the correlation coefficient between assessment indicator aij and optimal vector a0, and the gray correlation coefficient matrix [R] is obtained as follows (Equation 3):
The overall vitality of each unit is then calculated by averaging the correlation coefficients of all its indicators.
3 Results
To comprehensively understand the characteristics and distribution of the study data, and in response to reviewer comments, detailed descriptive statistics and a collinearity assessment for each indicator were performed, with complete results provided in Appendix E and Appendix F. Appendix E revealed that most indicators (seven out of eleven) exhibited non-normal distributions, as indicated by the Shapiro-Wilk test (P<0.05), alongside diverse skewness and kurtosis. This justified the subsequent use of non-parametric methods and underscored the challenges of definitively interpreting distribution patterns with a severely limited sample size (N = 8). Furthermore, a Spearman correlation analysis (Appendix F) identified significant interdependencies among several indicator pairs, with absolute correlation coefficients exceeding 0.8 and p-values below 0.05 (e.g., A1 with A2 and A3; A3 with C4; B3 with C1). While these strong correlations suggest potential multicollinearity, and the small sample size limits the generalizability of findings, the selected GRA method is inherently robust to such issues. GRA’s core principle—evaluating the similarity of data sequence shapes relative to a reference series rather than estimating independent causal effects—makes it particularly well-suited for analyzing systems with limited observations and potential multicollinearity. These preliminary analyses thus establish a robust foundation for the subsequent grey relational evaluation, providing essential context for interpreting the relative importance of each indicator in assessing seashore vitality.
3.1 Wuyuan Bay’s marine development direction: “ecology + tourism + sports”
Based on discussions with multiple stakeholders (Appendix D), we conducted several rounds of brainstorming, which led to the determination of the bay’s development positioning as follows: (1) promote high-quality development and high-level protection, help realize the value of marine ecological products, and create a benchmark for the harmonious coexistence of people and the sea in the bay; (2) activate the bay’s vitality, focusing on high-end marine sports and coastal recreational experience, and create a sports holiday and international coastal recreational and leisure resort; and (3) promote human fitness, push the high-quality development of the sports industry, and create a marine sports training, education and event base.
According to the positioning of development as well as the development history of Wuyuan Bay, resource and neighboring industry competition analyses were used to carry out SWOT analysis of the development of Wuyuan Bay. The results are as follows (Figure 5).
Figure 5
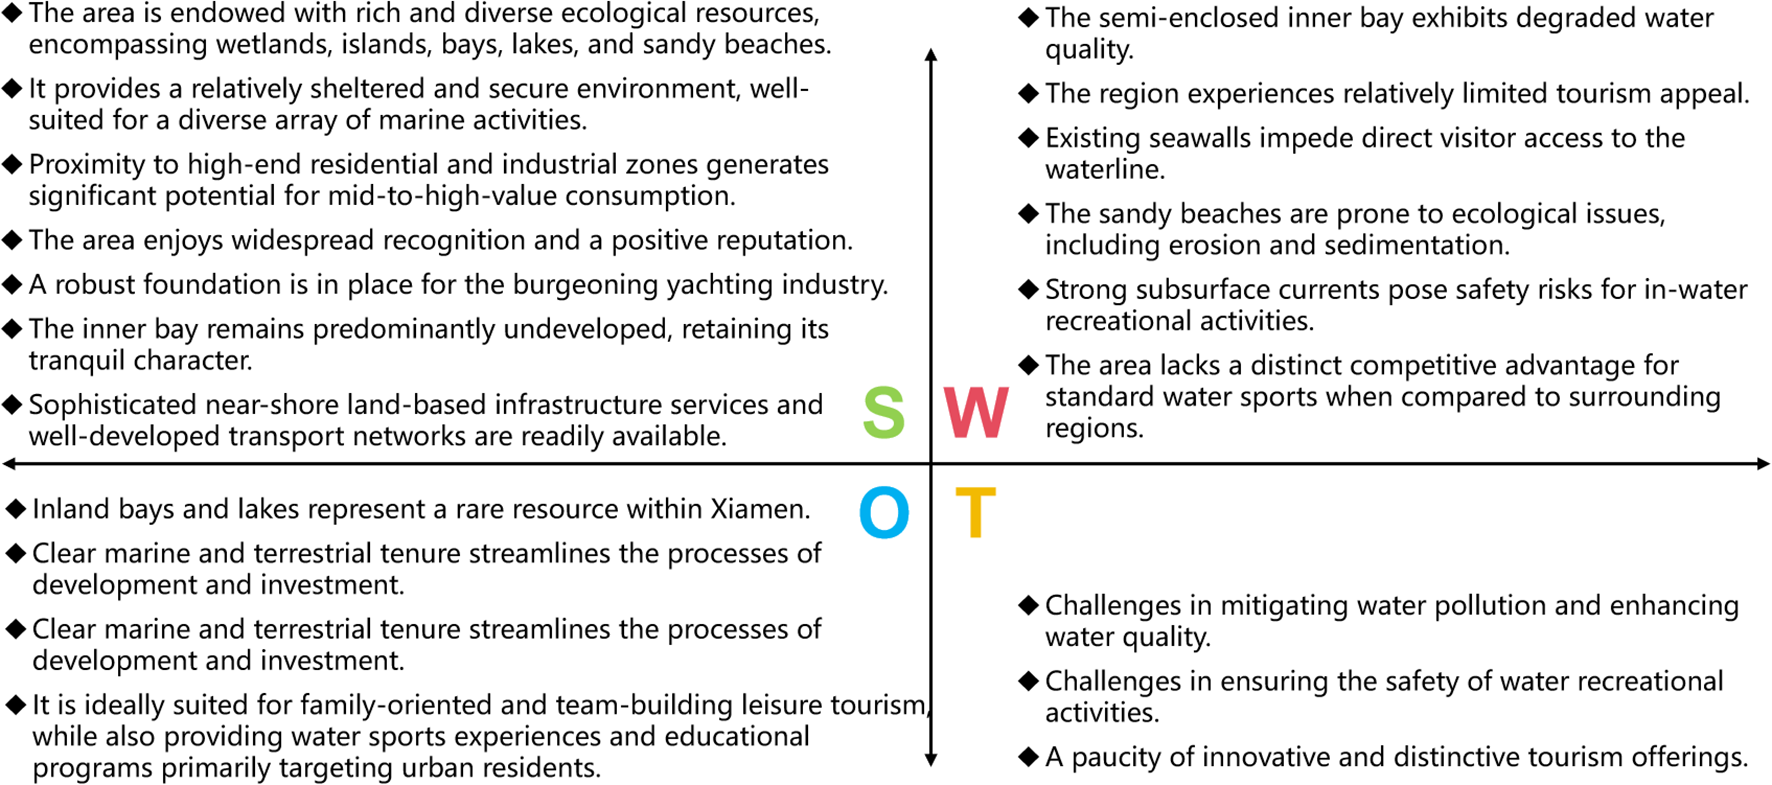
SWOT analysis results for Wuyuan Bay.
3.2 SVA results for Wuyuan Bay
3.2.1 SVA reveals significant potential for improvement in Wuyuan Bay
It is important to note that, due to data limitations regarding temporal consistency, our current SVA provides a one-time comprehensive assessment of the present situation in Wuyuan Bay in 2024 and does not reflect annual variations. The results of the SVA show that, overall, the average seashore vitality score (Target layer) of Wuyuan Bay is 0.604, which still indicates a large potential for improvement compared with the ideal state. The environmental vitality (A) of the criterion layers is slightly greater than the average, whereas the social and economic vitality (B and C) are both lower. Specifically, for the index layers, the hydrodynamic (A2) and shoreline use intensity (C2) indices are both far above the average, whereas the sea-use intensity (C1) and marine economic output (C3) indices are both far below the average (Figure 6).
Figure 6
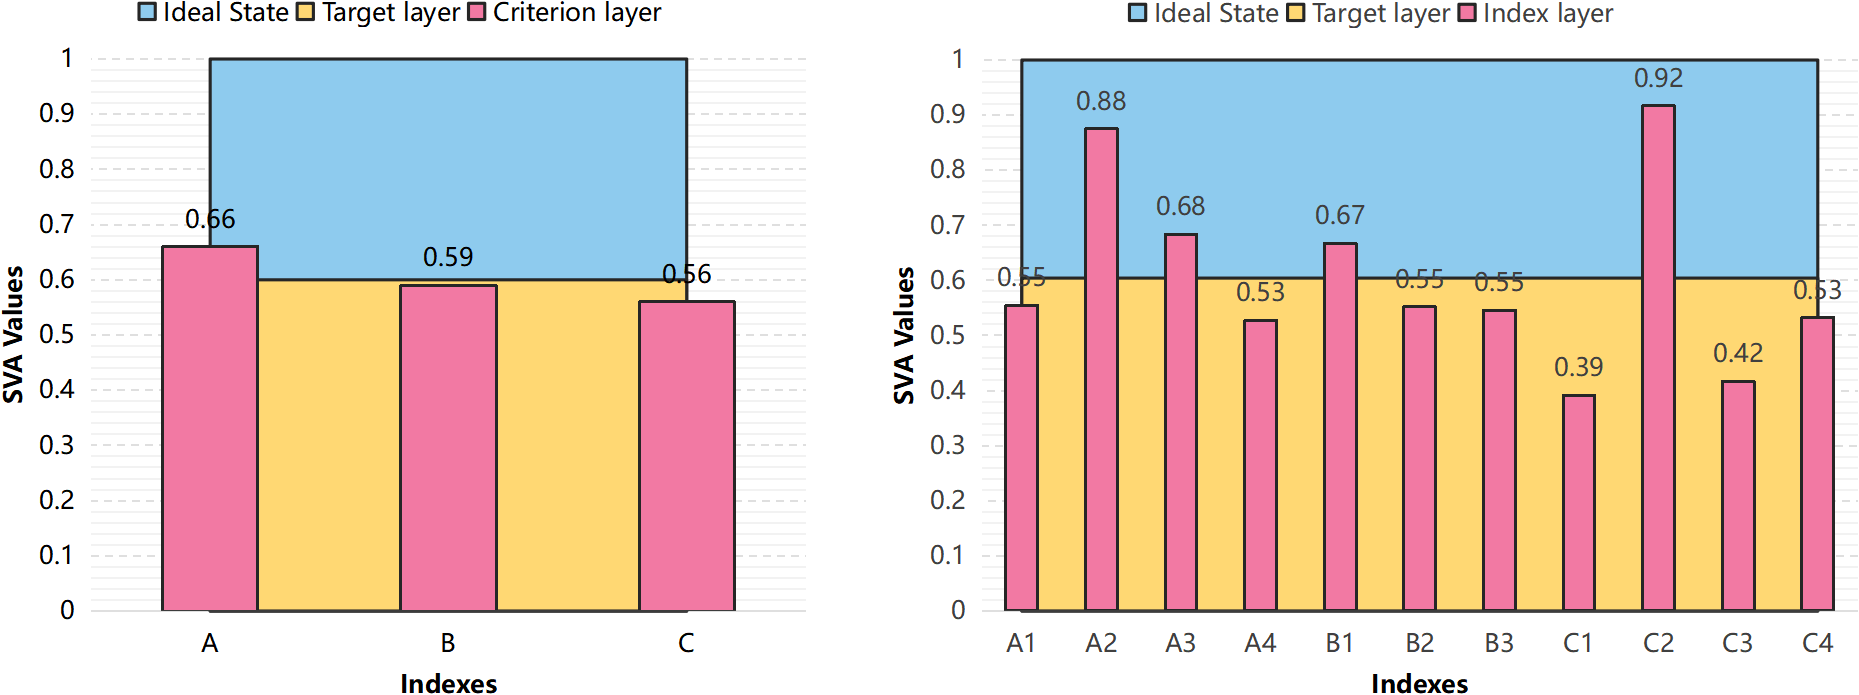
SVA results for Wuyuan Bay.
Therefore, in general, the most important factor restricting the sustainable development of the blue economy in Wuyuan Bay is economic vitality, especially in sea areas. The sea-use intensity and direct economic output from marine areas are relatively low, which supports the feasibility of our study, and the development of MSP strategies has the most significant effect on promoting the growth of the blue economy in Wuyuan Bay.
3.2.2 There are wide vitality disparities among seashore units
There are large differences in seashore vitality among the eight different units (Figure 7), with Unit 6 having the highest overall vitality of 0.727; Unit 4 having the lowest overall vitality of 0.513; and the other units having values of approximately 0.600. This indicates that Unit 6 has a high level of blue economy development, while Unit 4 has the highest potential.
Figure 7
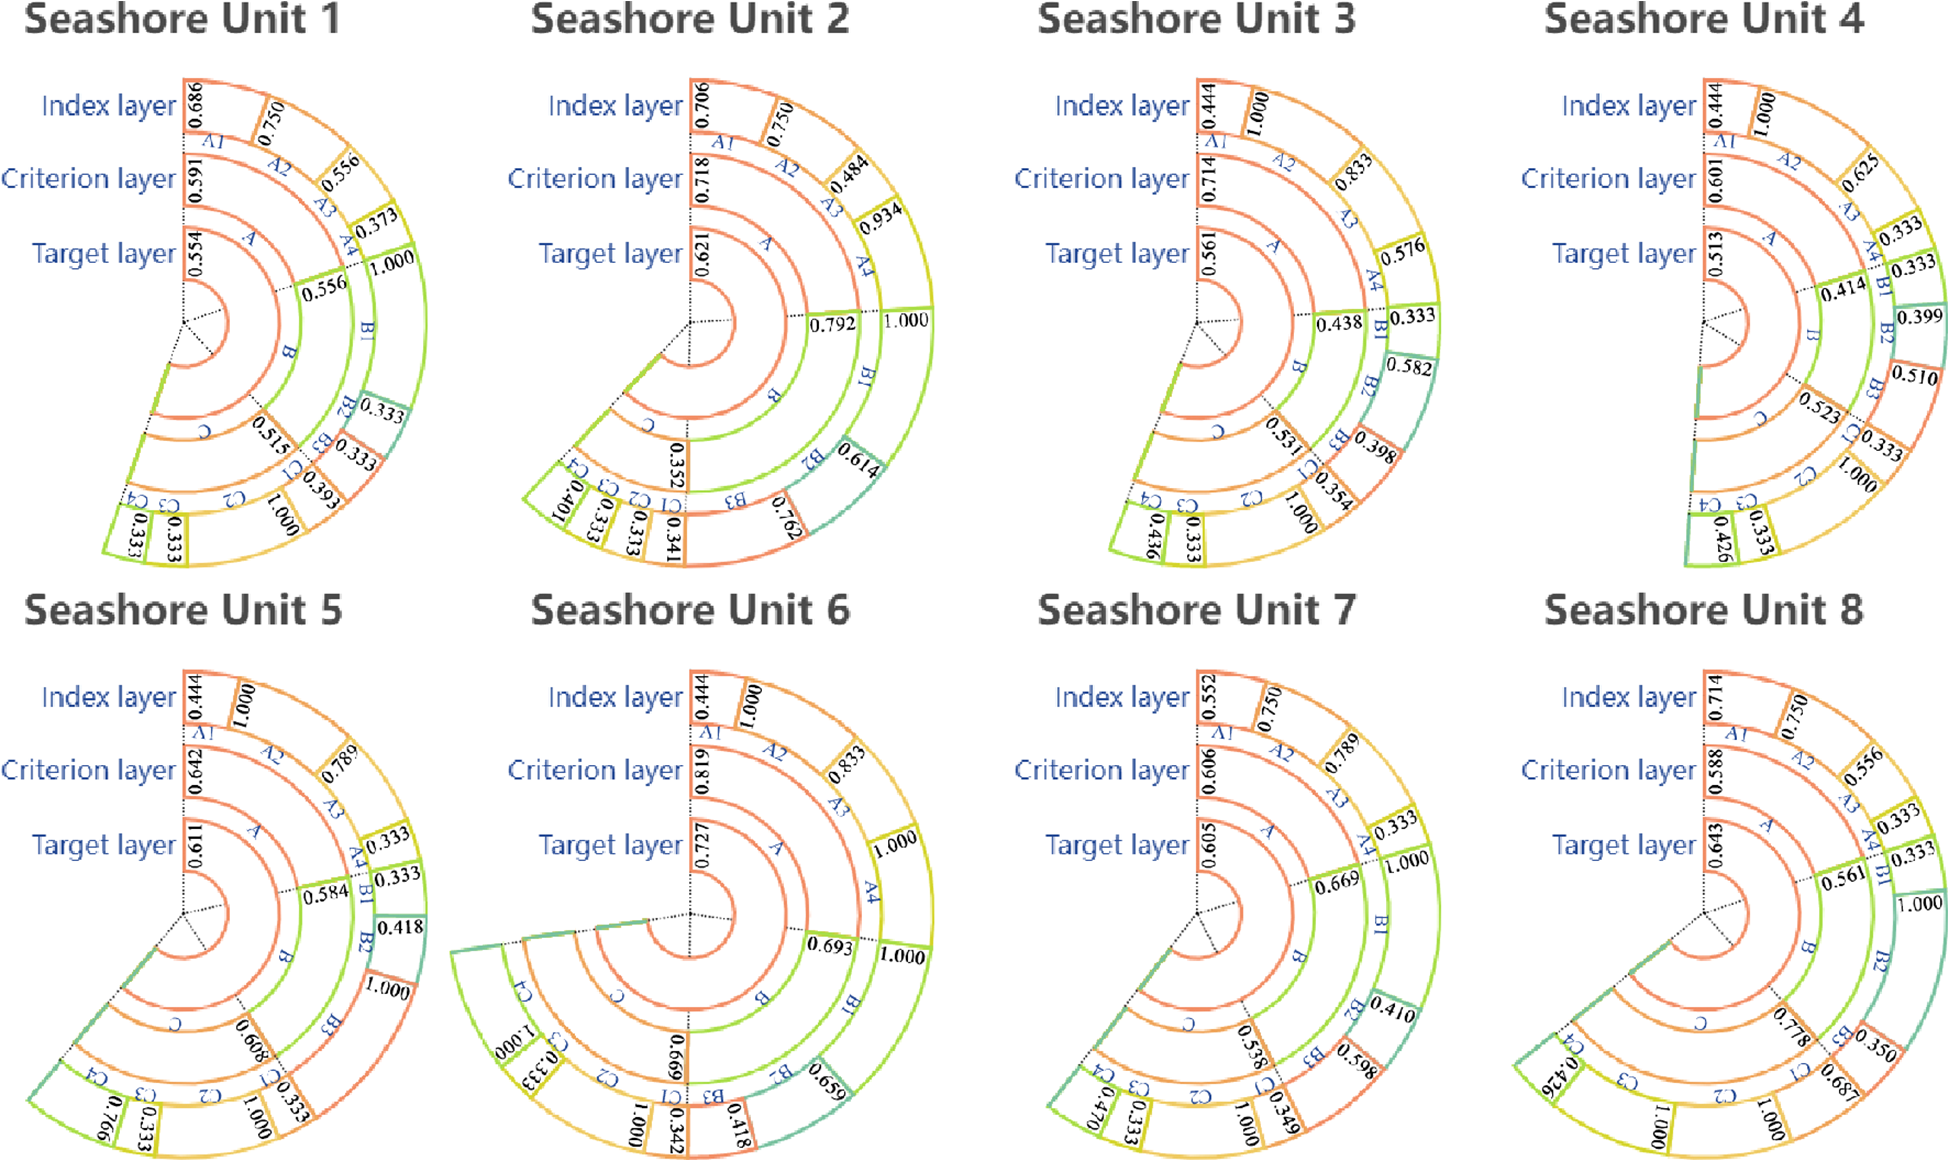
Results of the seashore unit vitality assessment.
The environmental vitality is highest in Unit 6 (0.819) and lowest in Unit 8 (0.588). In terms of specific indicators, there are large differences in A1 and A4: the water quality of the outer bay seashores (1,2,8), which are directly connected to the sea, is significantly better than the water quality of the inner bay (3,4,5,6,7), where the exchange of water is controlled by the gates. The score of A4 in Units 2 and 6 is approximately 1, whereas that of the remaining units is approximately 0, which is a large difference.
The highest social vitality is found in Unit 2 (0.792), and the lowest is found in Unit 4 (0.414). In terms of specific indicators, indicators B1, B2 and B3 all show great variability: the coasts of Units 1, 2, 6 and 7 have high levels of basic service facilities (1.000, 1.000, 1.000, and 1.000), and the coasts of Units 3, 4, 5 and 8 have insufficient levels (0.333, 0.333, 0.333, and 0.333, respectively). The coast of Unit 8 has the highest level of accessibility (1.000) because it has the only dock in Wuyuan Bay and presents comprehensive land transport facilities, whereas Unit 1 has the weakest level of accessibility (0.333). Unit 5 has the best performance in B3 because it has a large sandy beach (1.000), whereas Unit 1 has the worst performance for this indicator (0.333).
The economic vitality is highest in Unit 8 (0.778) and lowest in Unit 2 (0.352). For specific indicators, C2, C3 and C4 all present high degrees of variability. Except Unit 2, which is an artificially restored sandy beach shoreline with direct access to the sea and has a low shoreline use intensity (0.333), the remaining units are artificial shorelines with hard seawalls separating the sea from the land have high values (1.000). For C3, only Unit 8 has profitable sea use, and the annual business income reaches 580 million RMB or more, while the rest of the coast has public sea use or no sea use; thus, Unit 8 has the highest level of marine economic income (1.000), while the rest have a low level (0.333). For C4, Unit 6 has the highest score (1.000) because it is one of the highest-priced neighborhoods in Xiamen, Unit 5 has the next highest score (0.766), and the rest have scores of approximately 0.400 due to the large differences in housing prices, with Unit 1 having the lowest score (0.333).
4 Discussion
4.1 The SVA framework as an effective indicator of the blue economy growth in coastal zones
First, we focused on the research gap of city vitality study in the urban planning field with respect to coastal and sea spaces. For the first time, we chose the simple and easy-to-operate GRA method to construct an SVA framework and used ArcGIS to process the data. The indicators are representative and easy to obtain, and the processing method is simple and clear. It can thus be used for reference and support in studies of other coastal cities.
Second, because the connotations and goals of the blue economy and city vitality are consistent with sustainable development (Wuwung et al., 2022), we introduced a mature method developed in previous research of city vitality land space and measured the blue economy development level in the coastal space, which is the connecting point between land and sea and a hotspot of conflict. This method has two advantages: it not only complements the framework and methodology of small- and medium-scale research on the basis of current conventional large-scale blue economy research (Maskaeva et al., 2024) but also enables consideration of the spillover effects of marine impacts, unlike the current common practice, which focuses only on narrowly defined marine activities, such as shipping, fisheries, aquaculture, and tourism (Phang et al., 2023). Therefore, we included nearshore land areas, which are inevitably affected by the sea, and considered the blue economy benefits of land areas that are closely related to the sea, such as nearshore shorelines, public activity spaces and housing prices, which are environmentally, socially, and economically important.
Therefore, the framework and methodology of this study are innovative in the fields of city vitality and blue economy research, and the SVA framework can be used to effectively measure the development level of the blue economy in coastal spaces, which can promote sustainable regional development.
4.2 SVA results reveal keys to blue economy growth in Wuyuan Bay
4.2.1 Coastal and marine zones are new growth points for the blue economy of Wuyuan Bay
If we subdivide coastal space into three consecutive habitats, coastal land, coastal and nearshore sea areas, the indicators of marine economic vitality (C1, C3) have significantly lower values than the other indicators. This is in line with the current status of land and sea development and utilization of Wuyuan Bay, where land and coastal development is relatively mature and where coastal and nearshore sea areas have undergone many rounds of environmental remediation and ecological restoration, such that the environmental vitality performance of these areas is relatively good. In contrast, the degree of operational development and utilization of the coastal and sea areas is low, which leads to low economic vitality, and the social vitality of the sea area is poor. Therefore, the coastal and sea spaces represent new growth points for the blue economy of Wuyuan Bay.
4.2.2 Differences in the vitality of different types of seashores
The results of the SVA of Wuyuan Bay revealed obvious differences in the vitality performance of different seashore types. Overall, T3 (0.644) > T2 (0.621) > T4 (0.608) > T1 (0.570). Specifically, in terms of environmental vitality, T3 (0.766) > T2 (0.718) > T1 (0.593) > T4 (0.573); in terms of social vitality, T2 (0.792) > T4 (0.627) > T3 (0.565) > T1 (0.510); and in terms of economic vitality, T1 (0.605) > T3 (0.600) > T4 (0.573) > T2 (0.352).
Therefore, diverse strategies to promote vitality and blue economy growth should be developed for different seashore types. T3 has excellent environmental and economic vitality but weak social vitality, and planners should therefore focus mainly on improving social vitality. T2 has excellent social and environmental vitality but poor economic vitality, and planners should focus mainly on improving economic vitality. T4 has good social vitality but poor environmental and economic vitality, such that planners should focus on improving both environmental and economic vitality. Finally, T1 has excellent economic vitality but poor environmental and social vitality, and planners therefore need to increase both environmental and economic vitality.
4.3 Developing regional MSP schemes based on SVA results
Numerous studies and practical projects have shown that MSP is a key enabler of and priority for the transformation of the traditional marine economy into a blue economy (McKinley et al., 2019; Neimane, 2020; Troya et al., 2023). Projections indicate that by 2030, marine and coastal tourism will emerge as the most valuable component of the blue economy, contributing an estimated 26% of the total value added by ocean-based industries (Narwal et al., 2024; Picken, 2025). This trend profoundly underscores the significant strategic importance of tourism-focused MSP in fostering the sustainable development of Wuyuan Bay’s blue economy, aligning with global practices (Kabil et al., 2021; Papageorgiou, 2016).
In accordance with the “Xiamen Coastal Zone Protection and Utilization Plan”, which is statutory, the planned uses of Wuyuan Bay concern culture, sports, leisure and entertainment. Informed by the foundational policy framework, substantiated by our comprehensive SVA and SWOT analysis, and drawing lessons from both domestic and international experiences in coastal management (Jurkus et al., 2021; Katila et al., 2019; Liu et al., 2022; Xu et al., 2020), we have systematically formulated four integrated MSP strategies for Wuyuan Bay. These strategies are specifically designed to address the identified challenges and leverage the unique potentials derived from our SVA results:
(1) Strengthening Marine Ecological Product Supply through Ecological Restoration: This strategy aims to enhance the environmental vitality (Criterion A) by targeting identified deficiencies in water quality and coastal morphology. This aligns with national marine ecological civilization construction goals (Zhang et al., 2019). (2) Developing Resource-Specific Potentials (Strategies in Light of Local Conditions): This focuses on maximizing the unique natural and human resources of Wuyuan Bay, as highlighted by our SWOT analysis, to boost social and economic vitality (Criterion B & C). This approach is consistent with place-based development principles widely adopted in sustainable tourism planning (McLoughlin and Hanrahan, 2023); (3) Enhancing Land-Sea Coordination for Integrated Activity Networks: This strategy directly addresses the low economic vitality of sea and coastal areas (C1 & C3 from SVA) by creating seamless connections between water, sand, and forest zones. This integrated land-sea planning framework is advocated by contemporary coastal management theories (Wang et al., 2024). (4) Supporting Integrated Active and Passive Recreational Activities: This aims to diversify recreational offerings to cater to various age groups and preferences, thereby boosting social vitality (Criterion B) and addressing the previous lack of competitive advantage in standard water sports. This approach reflects modern trends in diversified leisure and wellness tourism (Luo et al., 2018).
The final MSP scheme (Figure 8) for Wuyuan Bay adopts a spatial pattern of ‘one ring and three zones’, meticulously designed to align with the specific characteristics and potentials of distinct seashore units and coastal areas within the study site (as indicated in Figure 8a). Each zone is tailored to optimize specific uses: ①Vitality Sports Bay Zone: This zone, encompassing the main bay area, will focus on enhancing active recreational opportunities. Building upon proposed beach restoration efforts, it will facilitate a range of bay vitality sports such as beach sports, ropeway water skiing, water flyers, stand-up paddleboarding, and dragon boating. This responds to the potential for high-intensity water activities while improving visitor access. ② Quiet Recreation Lake Zone: Situated in the quieter inner lake sections, this zone is designated for passive recreation. Based on stringent pollution prevention and control measures, it will support relaxing activities like fishing, stand-up paddleboarding, dragon boating (for quieter group activities), water yoga, and boat trips. This leverages the tranquil character of the inner bay identified in our analysis. ③ Ecological Viewing Wetland Zone: Utilizing the existing wetland park in a specific river section, this zone will primarily focus on ecological appreciation. Activities such as guided visits, leisurely strolls, and running will be encouraged, promoting environmental education and low-impact recreation. This directly builds upon the rich ecological resources identified. ④ Public Health Greenway Ring: This proposed greenway will physically connect the three aforementioned zones, forming a cohesive network. It will serve as a continuous corridor for public health and sports, enabling activities such as triathlons and connecting various landscape nodes that link leisure and recreational activities throughout the entire region (Figures 8a, b). This directly addresses the need for enhanced land-sea coordination and diversified activity networks.
Figure 8
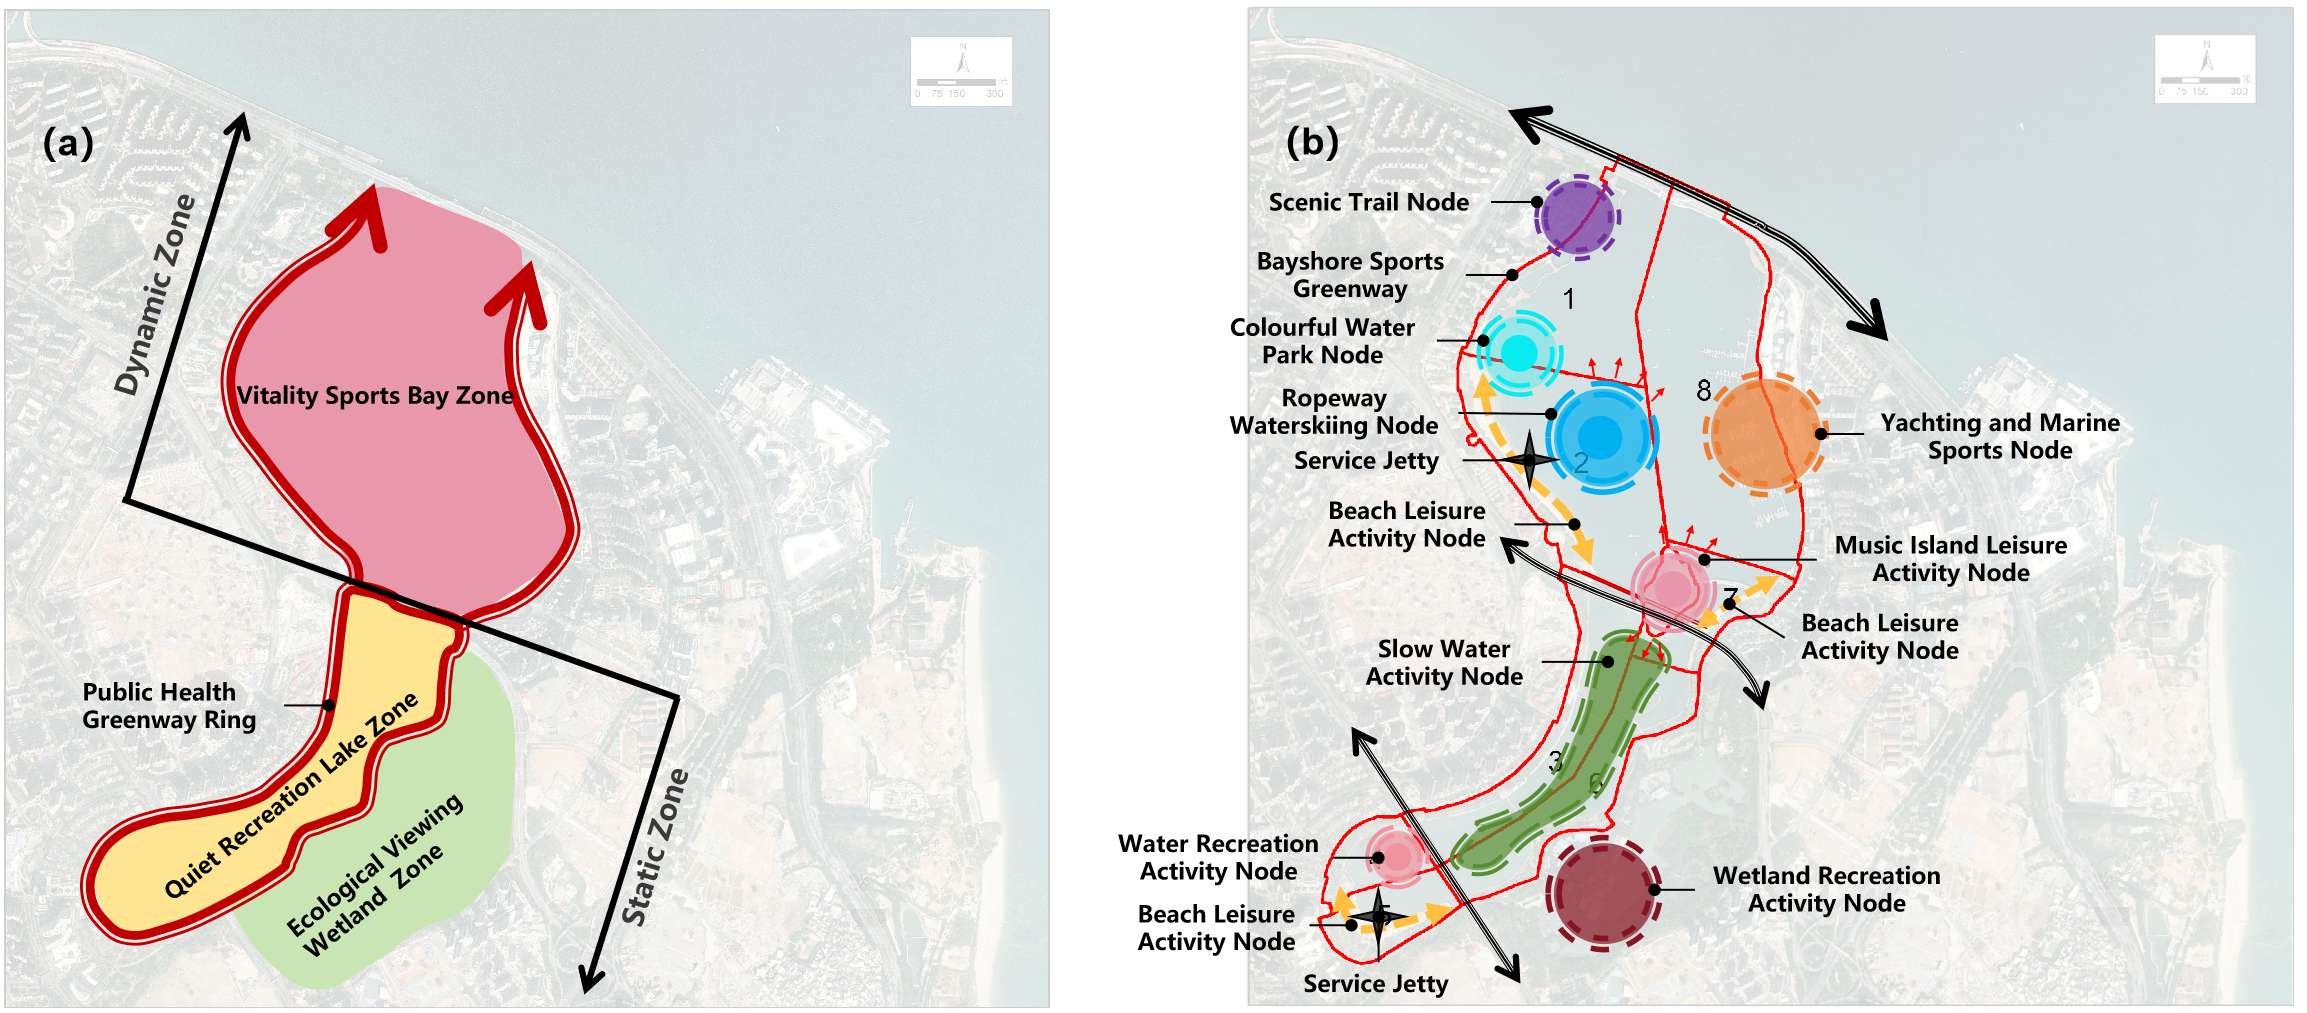
The MSP scheme in Wuyuan Bay. [(a) MSP functional layout map; (b) MSP landscape network map].
4.3.1 Ecological restoration strategies
Although the SVA results indicate that Wuyuan Bay’s environmental vitality (Criterion A) is slightly better than its social and economic counterparts, detailed analysis revealed specific deficiencies in various units and indicators. To address these, a multi-pronged ecological restoration strategy is proposed, drawing upon established principles of coastal environmental management (Ma et al., 2017): (1) This involves implementing stricter regulations on land-based pollutant discharge into the semi-enclosed inner bay, alongside promoting ecological engineering solutions (e.g., constructed wetlands, biofilters) through specific projects such as enhanced urban runoff treatment systems and wetland park expansions. These efforts aim to enhance natural purification capacity. Improved water quality directly benefits marine wildlife by reducing contaminant loads, supporting healthier aquatic food webs, and creating more viable habitats for fish, shellfish, and migratory birds. This directly responds to the identified challenge of poor water quality in the inner bay. (2) Targeted beach nourishment and soft engineering solutions (e.g., vegetation planting, dune restoration) will be employed to counteract erosion and sedimentation issues on sandy beaches, through initiatives like strategic sand replenishment programs and native coastal plant reintroduction. These measures thereby enhance their ecological integrity and recreational value. For wildlife, restored beaches provide crucial nesting sites for shorebirds, foraging grounds for various marine species, and stabilize coastal ecosystems, offering resilience against environmental pressures. This directly tackles the ecological problems identified for sandy beaches. (3) Vertical Reconstruction of Seawalls into Multi-Segmented Stepped Structures: This strategy aims to replace existing impervious seawalls that impede ecological connectivity and access with multi-segmented stepped designs, through pilot projects focusing on specific high-priority shoreline sections. This not only increases the water accessibility of the shoreline for visitors but also integrates ecological functions by creating diverse intertidal habitats (e.g., tide pools, calmer shallow water zones). These new structures will foster biodiversity by expanding niche habitats for intertidal organisms, providing shelter for juvenile fish, and offering new resting and feeding areas for migratory birds, thus enhancing the overall ecological value of the coastline, aligning with modern coastal protection and recreational access guidelines (Qin et al., 2024).
4.3.2 Strategies in light of local conditions (resource-specific potential development)
These strategies are tailored to leverage Wuyuan Bay’s unique attributes, as identified through our SWOT analysis and SVA, aligning with place-based development frameworks (Weck et al., 2022): (1) Harnessing Diverse Natural and Human Resources: Wuyuan Bay’s exceptional location, coupled with its rich array of natural and human resources (e.g., seas, lakes, sandy beaches, wetlands, islands, art galleries, and ancient houses), provides a strong foundation for supporting a wide range of diverse activities. This multitude of resources offers inherent potential for varied tourism and leisure offerings, allowing for distinct branding. (2) Capitalizing on High-Consumption Potential: The high-quality communities surrounding Wuyuan Bay represent a significant local market with high consumption potential. Strategies will focus on developing premium services and facilities that cater to this demographic, ensuring local economic benefits. This directly addresses the potential for medium-to-high-level consumption. (3) Leveraging Positive Social Vitality Indicators: The favorable performance of social vitality indicators suggests a potentially lower development cost for community engagement and social acceptance of new projects. This can lead to more efficient implementation of MSP initiatives, fostering indigenous-led tourism development (Jagadish et al., 2024).
4.3.3 Land–sea coordination strategies
Addressing the particularly low economic vitality observed in Wuyuan Bay’s sea and coastal areas through the SVA (specifically C1 and C3), these strategies focus on integrated land-sea planning, a critical component of modern MSP to unlock full blue economy potential (Reuter et al., 2016): (1) Improving Marine Traffic Networks and Expanding Water Activity Space: This involves constructing strategically located nearshore docks and designated access points to enhance marine connectivity and expand safe, accessible water activity spaces. This directly responds to the need for improved sea-use intensity. (2) Renovating Vertical Berms at Key Nodes to Open Up Land-to-Sea Activity Channels: Transforming existing vertical barriers into more permeable structures at critical junctures will establish seamless physical and visual links between land-based and marine activities, fostering integrated experiences. (3) Planning Integrated Land-Sea Cooperative Activities (e.g., Triathlons) to Increase Resource Efficiency: Developing events and programs that organically link land and sea components, such as triathlons or integrated eco-tours, will maximize the synergistic use of both environments, thereby enhancing resource efficiency and diversifying visitor experiences.
4.3.4 Dynamic and static integration strategies
These strategies are designed to cater to diverse demographic preferences, integrating both active (“dynamic”) and passive (“static”) recreational opportunities, aligning with principles of inclusive tourism development (Biddulph and Scheyvens, 2018): (1) Catering to the Elderly Population: Planning activities such as fishing spots, tranquil tea rooms, and accessible walking greenways will meet the specific recreational needs of elderly residents, promoting their well-being and social engagement. (2) Meeting the Needs of Middle-Aged Adults: Developing offerings like water skiing, triathlons, and yachting will appeal to middle-aged individuals seeking active sports and leisure consumption, enhancing the area’s appeal for high-value tourism. (3) Addressing the Needs of Youth and Children: Planning dedicated facilities and activities, such as water parks, will cater to young people and children, providing engaging opportunities for sports, education, and recreation.
4.4 Limitations and future research directions
While this study has diligently attempted to comprehensively integrate factors influencing the blue economy development of Wuyuan Bay and to formulate supportive planning strategies, several inherent limitations warrant acknowledgment and future research endeavors.
-
Insufficient Depth and Dynamism in Data Analysis: A primary limitation of this study, as highlighted by the reviewer, lies in the current depth of our data analysis. While the SVA provides a robust foundational assessment and identifies key areas for intervention, it predominantly offers a cross-sectional snapshot. Future research must move beyond this by incorporating longitudinal data sets, more granular spatial analysis techniques, and advanced statistical modeling to uncover dynamic trends and interdependencies, thereby providing a more profound and comprehensive understanding of the blue economy’s evolution in Wuyuan Bay and supporting more refined planning decisions.
-
Quantification and Integration of Cultural Aspects: Our initial SVA framework, while encompassing environmental, social, and economic dimensions, did not explicitly integrate cultural factors into regional development assessment due to their inherent quantification challenges. However, future work will actively explore the inclusion of cultural indicators. This could involve leveraging readily available data from statistical yearbooks related to cultural and entertainment activities, as well as utilizing web search indices (e.g., Baidu Index) to gauge public interest and engagement with MSP and coastal cultural elements. Such an approach, combining official statistics and big data analysis, would provide a more holistic understanding of regional development.
-
Absence of Empirical Effectiveness Evaluation of Strategies: As the proposed MSP strategies are prospective and have not yet been implemented, this study is inherently limited in providing an empirical evaluation of their effectiveness. Subsequent research will be crucial for developing robust monitoring and evaluation frameworks. These frameworks will rigorously assess the actual impact of the strategies post-implementation, comparing outcomes against the baseline data established in this study and potentially incorporating comparative analyses with similar interventions in other regions, both domestically and internationally, to validate their generalizability and efficacy.
-
Stakeholder Engagement and Implementation Challenges: While this study identifies the critical role of stakeholder collaboration, it does not delve into a detailed stakeholder analysis or implementation roadmap. The successful execution of these strategies fundamentally hinges on the active cooperation of diverse entities, including governmental management departments, investment groups, and local communities. Future research should prioritize comprehensive stakeholder engagement studies, including surveys and participatory workshops, to map out interests, identify potential conflicts, and design effective governance mechanisms for strategy execution.
5 Conclusion
The blue economy stands as a pivotal instrument for achieving SDG14, with China’s active engagement significantly influencing global ocean governance. While China has made substantial progress in its territorial spatial planning system, integrating coastal zone and MSP to establish top-down legal frameworks and action guidelines at various scales, a discernible gap persists in “bottom-up” development methodologies and actionable strategies at the small regional scale. This study addresses this critical void by employing SWOT analysis to delineate marine development directions, constructing a novel SVA framework, and proposing sustainable MSP strategies for Wuyuan Bay.The research not only fills a significant gap in city vitality studies within coastal and marine spaces by focusing on the intricate land-sea interface and the spillover effects of marine influences but also contributes to the broader blue economy discourse by providing a regionally scaled assessment framework. The methodological framework, characterized by its operational simplicity and effectiveness, offers a valuable reference for planners in other regional-scale coastal areas seeking to formulate robust blue economy development plans. The MSP strategies developed for Wuyuan Bay, informed by local conditions and global best practices, are designed to benefit multiple stakeholders—environmentally, socially, and economically—directly contributing to local blue economy growth and regional sustainable development. Specifically, this study demonstrates that: (1) The SVA framework effectively measures the blue economy development level of coastal zones, providing a robust, data-driven assessment tool. (2) Its application to Wuyuan Bay revealed that the coastal and marine zones are key growth points, with economic vitality being the primary limiting factor. Consequently, strategically formulated MSP, tailored to the distinct vitality profiles of different seashore types, represents the most effective pathway for enhancement. (3) The identified marine development direction for Wuyuan Bay is “ecology + tourism + sports”, which is operationalized through four integrated MSP strategies: ecological restoration, resource-specific potential development, land-sea coordination, and dynamic and static activity integration. These strategies are intrinsically linked to the specific seashore units delineated in the study area, ensuring their spatial relevance and targeted impact. For future research, it is imperative to deepen the analytical rigor by incorporating longitudinal datasets and advanced statistical modeling to capture dynamic changes. Furthermore, cultural vitality should be systematically integrated, leveraging diverse data sources such as statistical yearbooks for cultural and entertainment indicators, and web search indices to gauge public interest and engagement with MSP. Finally, comprehensive effectiveness evaluation frameworks and adaptive regulatory schemes are essential to assess the real-world impact of implemented MSP strategies and ensure their long-term sustainability, potentially incorporating comparative analyses with similar interventions in other regions, both domestically and internationally.
Statements
Data availability statement
The original contributions presented in the study are included in the article/Supplementary Material. Further inquiries can be directed to the corresponding authors.
Author contributions
YZ: Conceptualization, Methodology, Investigation, Formal analysis, Writing – original draft, Visualization, Validation, Data Curation. FH: Investigation, Resources, Project administration, Funding acquisition, Writing – review & editing. XX: Conceptualization, Writing – review & editing, Supervision. YL: Writing – review & editing. ZZ: Writing – review & editing. MX: Investigation, Writing – review & editing. PS: Investigation, Writing – review & editing.
Funding
The author(s) declare financial support was received for the research and/or publication of this article. This work was supported by (Culture and Tourism Bureau of Huli District, Xiamen) (Grant Number: ZX-2024-088); (China Oceanic Development Foundation) (Grant Number: XDHT2020689A); and (Xiamen University of Technology) (Grant Number: YKJ24008R).
Acknowledgments
We would like to thank all stakeholders who participated in the SWOT analysis (Appendix D). We would also like to thank the editors and experts who worked hard to improve the quality of this study and manuscript.
Conflict of interest
The authors declare that the research was conducted in the absence of any commercial or financial relationships that could be construed as a potential conflict of interest.
Generative AI statement
The author(s) declare that no Generative AI was used in the creation of this manuscript.
Any alternative text (alt text) provided alongside figures in this article has been generated by Frontiers with the support of artificial intelligence and reasonable efforts have been made to ensure accuracy, including review by the authors wherever possible. If you identify any issues, please contact us.
Publisher’s note
All claims expressed in this article are solely those of the authors and do not necessarily represent those of their affiliated organizations, or those of the publisher, the editors and the reviewers. Any product that may be evaluated in this article, or claim that may be made by its manufacturer, is not guaranteed or endorsed by the publisher.
Supplementary material
The Supplementary Material for this article can be found online at: https://www.frontiersin.org/articles/10.3389/fmars.2025.1674044/full#supplementary-material
References
1
Avila J. I. E. Jiménez A. C. (2010). Regionalizing coastal zones with geospatial tools for integrated coastal zone management. Coast. Mar. Geospatial Technol.13, 139–13+. doi: 10.1007/978-1-4020-9720-1_14
2
Ban Y. X. Liu X. Yin Z. T. Li X. L. Yin L. R. Zheng W. F. (2023). Effect of urbanization on aerosol optical depth over Beijing: Land use and surface temperature analysis. Urban Climate51. doi: 10.1016/j.uclim.2023.101655
3
Bank W. (2017). The potential of the blue economy: Increasing long-term benefits of the sustainable use of marine resources for small island developing states and coastal least developed countries. Available online at: https://openknowledge.worldbank.org/bitstream/handle/10986/26843/115545.pdf?sequence=1&isAllowed=y (Accessed March 15, 2025).
4
Bennett N. J. Cisneros-Montemayor A. M. Blythe J. Silver J. J. Singh G. Andrews N. et al . (2019). Towards a sustainable and equitable blue economy. Nat. Sustainability2, 991–993. doi: 10.1038/s41893-019-0404-1
5
Biddulph R. Scheyvens R. (2018). Introducing inclusive tourism. Tourism Geographies20, 583–588. doi: 10.1080/14616688.2018.1486880
6
Chen B. Yu W. W. Liu W. H. Liu Z. H. (2012). An assessment on restoration of typical marine ecosystems in China - Achievements and lessons. Ocean Coast. Manage.57, 53–61. doi: 10.1016/j.ocecoaman.2011.11.007
7
Cisneros-Montemayor A. M. Moreno-Báez M. Voyer M. Allison E. H. Cheung W. W. L. Hessing-Lewis M. et al . (2019). Social equity and benefits as the nexus of a transformative Blue Economy: A sectoral review of implications. Mar. Policy109. doi: 10.1016/j.marpol.2019.103702
8
Crona B. Wassénius E. Troell M. Barclay K. Mallory T. Fabinyi M. et al . (2020). China at a crossroads: an analysis of China's changing seafood production and consumption. One Earth3, 32–44. doi: 10.1016/j.oneear.2020.06.013
9
Deng J. L. (1989). Introduction to Grey system theory. J. Grey System1, 1–24. Available online at: https://api.semanticscholar.org/CorpusID:9121622.
10
Ding J. Ge X. Q. Casey R. (2014). Blue competition" in China: Current situation and challenges. Mar. Policy44, 351–359. doi: 10.1016/j.marpol.2013.09.028
11
Duan X. Y. Zhao X. N. Zou M. Chang Y. C. (2024). Maritime laws and sustainable development of Blue Economy: Conference report. Mar. Policy169. doi: 10.1016/j.marpol.2024.106339
12
Escandón-Panchana J. Vallejo R. E. Escandón-Panchana P. Velastegui-Montoya A. Herrera-Franco G. (2022). Spatial planning of the coastal marine socioecological system-case study: Punta Carnero, Ecuador. Resources-Basel11. doi: 10.3390/resources11080074
13
Fabinyi M. Wu A. N. Lau S. Mallory T. Barclay K. Walsh K. et al . (2021). China's blue economy: A state project of modernisation. J. Environ. Dev.30, 127–148. doi: 10.1177/1070496521995872
14
Fan Z. X. Duan J. Luo M. L. Zhan H. R. Liu M. R. Peng W. C. (2021). How did built environment affect urban vitality in urban waterfronts? A case study in Nanjing reach of Yangtze River. Isprs Int. J. Geo-Information10. doi: 10.3390/ijgi10090611
15
Fan Y. T. Kuang D. Tu W. Ye Y. (2023). Which spatial elements influence waterfront space vitality the most?-A comparative tracking study of the Maozhou river renewal project in Shenzhen, China. Land12. doi: 10.3390/land12061260
16
Germond-Duret C. Heidkamp C. P. Morrissey J. (2023). (In)justice and the blue economy. Geographical J.189, 184–192. doi: 10.1111/geoj.12483
17
Gkoltsiou A. Mougiakou E. (2021). The use of Islandscape character assessment and participatory spatial SWOT analysis to the strategic planning and sustainable development of small islands. The case of Gavdos. Land Use Policy103. doi: 10.1016/j.landusepol.2021.105277
18
Gómez-Varo I. Delclòs-Alió X. Miralles-Guasch C. (2022). Jane Jacobs reloaded: A contemporary operationalization of urban vitality in a district in Barcelona. Cities123. doi: 10.1016/j.cities.2022.103565
19
Hoareau K. (2025). Knowledge, power and the blue economy: Breaking down barriers. Mar. Policy182. doi: 10.1016/j.marpol.2025.106883
20
Hodgson E. E. Essington T. E. Samhouri J. F. Allison E. H. Bennett N. J. Bostrom A. et al . (2019). Integrated risk assessment for the blue economy. Front. Mar. Sci.6. doi: 10.3389/fmars.2019.00609
21
Huang L. S. Han Y. Ye Y. (2022). Coastal waterfront vibrancy: an exploration from the perspective of quantitative urban morphology. Buildings12. doi: 10.3390/buildings12101585
22
Jagadish A. Freni-Sterrantino A. He Y. F. O'Garra T. Gecchele L. Mangubhai S. et al . (2024). Scaling Indigenous-led natural resource management. Global Environ. Change-Human Policy Dimensions86. doi: 10.1016/j.gloenvcha.2024.102824
23
Jurkus E. Taminskas J. Povilanskas R. Kontautiene V. Baltranaite E. Dailide R. et al . (2021). Delivering tourism sustainability and competitiveness in seaside and marine resorts with GIS. J. Mar. Sci. Eng.9. doi: 10.3390/jmse9030312
24
Kabil M. Priatmoko S. Magda R. David L. D. (2021). Blue economy and coastal tourism: A comprehensive visualization bibliometric analysis. Sustainability13. doi: 10.3390/su13073650
25
Katila J. Ala-Rämi K. Repka S. Rendon E. Törrönen J. (2019). Defining and quantifying the sea-based economy to support regional blue growth strategies - Case Gulf of Bothnia. Mar. Policy100, 215–225. doi: 10.1016/j.marpol.2018.11.035
26
Knol-Kauffman M. Nielsen K. N. Sander G. Arbo P. (2023). Sustainability conflicts in the blue economy: planning for offshore aquaculture and offshore wind energy development in Norway (vol 22,47,2023). Maritime Stud.22. doi: 10.1007/s40152-023-00342-0
27
Lang W. Lang H. Hui E. C. M. Chen T. T. Wu J. M. Jahre M. (2022). Measuring urban vibrancy of neighborhood performance using social media data in Oslo, Norway. Cities131. doi: 10.1016/j.cities.2022.103908
28
Latinopoulos D. (2018). Using a spatial hedonic analysis to evaluate the effect of sea view on hotel prices. Tourism Manage.65, 87–99. doi: 10.1016/j.tourman.2017.09.019
29
Liang J. Yin Z. Yang J. Li Y. Xu M. Li J. et al . (2022). Bibliometrics and visualization analysis of research in the field of sustainable development of the blue economy, (2006-2021). Front. Mar. Sci.9. doi: 10.3389/fmars.2022.936612
30
Lin Y. Xue X. Hu W. Chen Q. Zhang Y. Huang F. et al . (2022). Implementing Regional Sea Use Planning system in China: Evolution, drivers and experiences. Mar. Policy146, 105298. doi: 10.1016/j.marpol.2022.105298
31
Liu L. Zhang X. J. Chen Z. Q. Zhou H. L. Li C. Chen Y. J. (2022). Assessment of ecological sustainability for international bays in the context of common prosperity-A case study of Sanmen Bay in Zhejiang province. Front. Environ. Sci.10. doi: 10.3389/fenvs.2022.944936
32
Lopes M. N. Camanho A. S. (2013). Public green space use and consequences on urban vitality: an assessment of European cities. Soc. Indic. Res.113, 751–767. doi: 10.1007/s11205-012-0106-9
33
Luo Y. Lanlung C. Kim E. Tang L. R. Song S. M. (2018). Towards quality of life: the effects of the wellness tourism experience. J. Travel Tourism Marketing35, 410–424. doi: 10.1080/10548408.2017.1358236
34
Ma D. Q. Zhang L. Y. Fang Q. H. Jiang Y. W. Elliott M. (2017). The cumulative effects assessment of a coastal ecological restoration project in China: An integrated perspective. Mar. pollut. Bull.118, 254–260. doi: 10.1016/j.marpolbul.2017.02.043
35
Maas P. R. (1984). Towards a theory of urban vitality ( University of British Columbia). Available online at: https://open.library.ubc.ca/collections/ubctheses/831/items/1.0096212 (Accessed March 15, 2025).
36
Maskaeva A. Failler P. Cowaloosur H. Lallemand P. Mang'ena J. (2024). Assessment of socioeconomic and ecosystem services of the blue economy in Tanzania using the UNECA's Blue Economy Valuation Toolkit. Mar. Policy159. doi: 10.1016/j.marpol.2023.105920
37
McKinley E. Aller-Rojas O. Hattam C. Germond-Duret C. San Martín I. V. Hopkins C. R. et al . (2019). Charting the course for a blue economy in Peru: a research agenda. Environ. Dev. Sustainability21, 2253–2275. doi: 10.1007/s10668-018-0133-z
38
McLoughlin E. Hanrahan J. (2023). Evidence-informed planning for tourism. J. Policy Res. Tourism Leisure Events15, 1–17. doi: 10.1080/19407963.2021.1931257
39
Meng Y. Xing H. F. (2019). Exploring the relationship between landscape characteristics and urban vibrancy: A case study using morphology and review data. Cities95. doi: 10.1016/j.cities.2019.102389
40
Monavari M. Abed M. H. Karbassi A. R. Farshchi P. Abedi Z. (2013). Integrated Coastal Tourism Zone Management (ICTZM) as a basis for sustainable development of the south coastline of the Caspian Sea. Indian J. Geo-Marine Sci.42, 635–646.
41
Narwal S. Kaur M. Yadav D. S. Bast F. (2024). Sustainable blue economy: Opportunities and challenges. J. Biosci.49. doi: 10.1007/s12038-023-00375-x
42
Neimane L. (2020). “ Maritime spatial planning as "Key enabler" of blue growth through "Just transformations" in the European Union,” in 8th International Scientific Conference Changes in Social and Business Environment Cisabe 2020). (Panevezys: EDITOGRAFICA S R L), 33–43.
43
Noonan-Birch R. Adams M. Ross M. C. (2024). Utilizing the SDGs to develop a blue economy capacity framework enabling a shift from an ocean economy to a blue economy in Canada. Front. Mar. Sci.11. doi: 10.3389/fmars.2024.1400043
44
Papageorgiou M. (2016). Coastal and marine tourism: A challenging factor in Marine Spatial Planning. Ocean Coast. Manage.129, 44–48. doi: 10.1016/j.ocecoaman.2016.05.006
45
Phadermrod B. Crowder R. M. Wills G. B. (2019). Importance-Performance Analysis based SWOT analysis. Int. J. Info. Manage.44, 194–203. doi: 10.1016/j.ijinfomgt.2016.03.009
46
Phang S. March A. Touron-Gardic G. Deane K. Failler P. (2023). A review of the blue economy, potential, and opportunities in seven Caribbean nations pre-COVID-19. Ices J. Mar. Sci.80, 2233–2243. doi: 10.1093/icesjms/fsac230
47
Picken F. (2025). Tourism and the blue economy. Tourism Geographies27, 538–546. doi: 10.1080/14616688.2023.2291821
48
Pournara A. Sakellariadou F. Kitsiou D. (2023). Toward a sustainable blue economy in the coastal zone: case study of an industrialized coastal ecosystem in Greece. Sustainability15. doi: 10.3390/su151411333
49
Qin P. Jiang Y. Cheng C. M. (2024). How do structural safety, ecological functions and social development influence construction of ecological seawalls for coastal protection and sustainability? Water Resour. Manage.38, 1807–1824. doi: 10.1007/s11269-024-03768-1
50
Reusch T. B. H. Dierking J. Andersson H. C. Bonsdorff E. Carstensen J. Casini M. et al . (2018). The Baltic Sea as a time machine for the future coastal ocean. Sci. Adv.4. doi: 10.1126/sciadv.aar8195
51
Reuter K. E. Juhn D. Grantham H. S. (2016). Integrated land-sea management: recommendations for planning, implementation and management. Environ. Conserv.43, 181–198. doi: 10.1017/S0376892916000023
52
Shi J. A. Miao W. Si H. Y. Liu T. (2021). Urban vitality evaluation and spatial correlation research: A case study from Shanghai, China. Land10. doi: 10.3390/land10111195
53
Stephenson R. L. Hobday A. J. Butler I. Cannard T. Cowlishaw M. Cresswell I. et al . (2023). Integrating management of marine activities in Australia. Ocean Coast. Manage.234. doi: 10.1016/j.ocecoaman.2022.106465
54
Sui X. T. Wang X. H. Zhao L. D. (2020). Using the resource-environment-economy coordination degree model to guide China's national blue bay remediation action plan in Qingdao. J. Oceanology Limnology38, 1846–1857. doi: 10.1007/s00343-020-9268-5
55
Surís-Regueiro J. C. Santiago J. L. González-Martínez X. M. Garza-Gil M. D. (2021). An applied framework to estimate the direct economic impact of Marine Spatial Planning. Mar. Policy127. doi: 10.1016/j.marpol.2021.104443
56
Troya M. D. Ansong J. O. O'Hagan A. M. (2023). Transitioning from blue growth to the sustainable blue economy: A review of Ireland's new marine governance in the aquaculture sector. Front. Mar. Sci.10. doi: 10.3389/fmars.2023.1075803
57
Ullah Z. Wu W. Guo P. F. Yu J. (2017). A study on the development of marine functional zoning in China and its guiding principles for Pakistan. Ocean Coast. Manage.144, 40–50. doi: 10.1016/j.ocecoaman.2017.04.017
58
UN (2012) in Blue Economy Concept Paper: Rio+20 United Nations Conference on Sustainable Development. (New York: United Nations).
59
UNAO (2016). Facts. Available online at: http://www.oceansatlas.org/facts/en/ (Accessed March 15, 2025).
60
Voyer M. Benzaken D. Rambourg C. (2022). Institutionalizing the Blue Economy: an examination of variations and consistencies among Commonwealth countries. Philos. Trans. R. Soc. B-Biological Sci.377. doi: 10.1098/rstb.2021.0125
61
Voyer M. Farmery A. K. Kajlich L. Vachette A. Quirk G. (2020). Assessing policy coherence and coordination in the sustainable development of a Blue Economy. A case study from Timor Leste. Ocean Coast. Manage.192. doi: 10.1016/j.ocecoaman.2020.105187
62
Wang S. Y. Deng Q. T. Jin S. Wang G. B. (2022). Re-examining urban vitality through Jane Jacobs' Criteria using GIS-sDNA: the case of Qingdao, China. Buildings12. doi: 10.3390/buildings12101586
63
Wang S. Lin J. J. Xue X. Z. Lin Y. H. (2024). Benefits and approaches of incorporating land-sea interactions into coastal spatial planning: evidence from Xiamen, China. Front. Mar. Sci.11. doi: 10.3389/fmars.2024.1337147
64
Wang X. Y. Su F. Z. Wang X. G. Pan T. T. Cui Y. K. Lyne V. et al . (2024). Adaptive integrated coastal zone planning: history, challenges, advances, and perspectives. Chin. Geographical Sci.34, 599–617. doi: 10.1007/s11769-024-1440-y
65
Wang X. Y. Zhang M. Y. Jie S. Y. Zhang M. Zhang Z. (2023). Exploring the coordinated evolution mechanism of regional sustainable development and tourism in China's "Beautiful China" Initiative. Land12. doi: 10.3390/land12051003
66
Weck S. Madanipour A. Schmitt P. (2022). Place-based development and spatial justice. Eur. Plann. Stud.30, 791–806. doi: 10.1080/09654313.2021.1928038
67
Wei H. K. Nian M. Li L. (2020). China's strategies and policies for regional development during the period of the 14th five-year plan. Chin. J. Urban Environ. Stud.8. doi: 10.1142/S2345748120500086
68
Wu J. Chen X. R. Chen S. L. (2019). Temporal characteristics of waterfronts in Wuhan City and people's behavioral preferences based on social media data. Sustainability11. doi: 10.3390/su11226308
69
Wuwung L. Croft F. Benzaken D. Azmi K. Goodman C. Rambourg C. et al . (2022). Global blue economy governance - A methodological approach to investigating blue economy implementation. Front. Mar. Sci.9. doi: 10.3389/fmars.2022.1043881
70
Xia M. H. Su Y. Wang X. L. Yu H. R. (2012). “ A research on the SWOT analysis and special project of sports tourism development in Hainan,” in Proceedings of the Xi'an 2012 International Conference of Sport Science & Physical Education, Vol I: Science and Innovation in Sports. (Xian: Changan University), 434–437.
71
Xia C. Yeh A. G. O. Zhang A. Q. (2020). Analyzing spatial relationships between urban land use intensity and urban vitality at street block level: A case study of five Chinese megacities. Landscape Urban Plann.193. doi: 10.1016/j.landurbplan.2019.103669
72
Xie D. Xie X. Lin X. Lin X. Zhao M. Huang X. (2020). Study on the condition of water environment in Inner Bay, Wuyuan Bay. J. Shaoguan Univ.12, 46–49.
73
Xu X. Li B. G. Zhao F. (2020). The temporal and spatial variation of the flow and direction of marine sports tourism based on economic development. J. Coast. Res.112, 180–182. doi: 10.2112/Jcr-Si112-051.1
74
Yang J. H. Yang J. Y. Chang Y. (2025). Toward sustainable development in the ocean: A framework for blue economy marine spatial planning. Sustain. Dev. doi: 10.1002/sd.70183
75
Yin Y. T. Shao Y. H. Lu H. L. Han Y. (2022). Environmental drivers of the vital urban coastal zones: An explorative case study based on the data-driven multi-method approach. Front. Ecol. Evol.10. doi: 10.3389/fevo.2022.962299
76
Yue W. Z. Chen Y. Zhang Q. Liu Y. (2019). Spatial explicit assessment of urban vitality using multi-source data: A case of Shanghai, China. Sustainability11. doi: 10.3390/su11030638
77
Zhang Y. Han Y. K. (2022). Vitality evaluation of historical and cultural districts based on the values dimension: districts in Beijing City, China. Heritage Sci.10. doi: 10.1186/s40494-022-00776-5
78
Zhang C. Quan Y. B. Zhong H. Y. (2019). The building of marine ecological civilization and sustainable development: conference report. Mar. Policy110. doi: 10.1016/j.marpol.2019.103627
79
Zhang Y. Xue X. Z. Lin Y. H. Chen H. X. Chen Q. M. Huang F. M. et al . (2023). Developing a multiscale landscape assessment framework integrating multiobjectives to identify priority action plans for sustainable development of small inhabited islands. Ocean Coast. Manage.243. doi: 10.1016/j.ocecoaman.2023.106735
80
Zhao Q. W. Teng X. Meng X. Du Z. M. Zhang P. P. Kang W. C. (2025). China's practice from coastline management towards sea-land integration. Front. Mar. Sci.12. doi: 10.3389/fmars.2025.1603839
Summary
Keywords
blue economy, Marine Spatial Planning (MSP), seashore vibrancy/vitality, gray relation analysis, sustainable development
Citation
Zhang Y, Huang F, Xue X, Lin Y, Zhang Z, Xu M and Song P (2025) A Seashore Vitality Assessment framework for blue economy growth evaluation in coastal cities: the case of Wuyuan Bay, Xiamen. Front. Mar. Sci. 12:1674044. doi: 10.3389/fmars.2025.1674044
Received
27 July 2025
Accepted
31 October 2025
Published
20 November 2025
Volume
12 - 2025
Edited by
Xuemei Li, Ocean University of China, China
Reviewed by
Salvatore Siciliano, Fundação Oswaldo Cruz (Fiocruz), Brazil
Yang Yang, Nanjing University, China
Updates
Copyright
© 2025 Zhang, Huang, Xue, Lin, Zhang, Xu and Song.
This is an open-access article distributed under the terms of the Creative Commons Attribution License (CC BY). The use, distribution or reproduction in other forums is permitted, provided the original author(s) and the copyright owner(s) are credited and that the original publication in this journal is cited, in accordance with accepted academic practice. No use, distribution or reproduction is permitted which does not comply with these terms.
*Correspondence: Faming Huang, huangfaming@tio.org.cn; Xiongzhi Xue, xzxue@xmu.edu.cn
Disclaimer
All claims expressed in this article are solely those of the authors and do not necessarily represent those of their affiliated organizations, or those of the publisher, the editors and the reviewers. Any product that may be evaluated in this article or claim that may be made by its manufacturer is not guaranteed or endorsed by the publisher.