Abstract
In benthic marine ecosystems, small organisms that dwell within the habitat matrix comprise the majority of species richness but are inherently difficult to sample. This limits our ability to document the biodiversity of these ecosystems. Autonomous Reef Monitoring Structures (ARMS), artificial reefs that mimic the three-dimensional complexity of benthic habitats, can alleviate this challenge. However, ARMS have been applied infrequently in many temperate locations, including the United Kingdom (UK). To showcase the applicability of ARMS to the UK, this paper applies standardized Smithsonian ARMS protocols for image analysis as well as DNA barcoding and metabarcoding of the cytochrome c oxidase subunit I (COI) gene to 3 ARMS units deployed in the Sussex Inshore Fisheries and Conservation Authority (IFCA) Nearshore Trawling Exclusion zone, a conservation area created in 2021 to facilitate the recovery of seabed habitats. We document 176 genera across 22 eukaryotic phyla as well as 1,920 > 2 mm motile specimens with a biomass of 312 g. We identify 15 notable species, including the 4th UK record of Cephalothrix simula, a non-native poisonous nemertean with the potential to enter the food supply. We also assess the complementarity of image analysis and DNA metabarcoding in describing sessile communities, finding that the two methods produce meaningfully different estimates of relative abundance for some phyla, particularly Cnidaria (77x difference) and Bryozoa (72x difference). As our oceans come increasingly under threat from global change, it is imperative that we can accurately describe their biodiversity. We advocate for ARMS as a critical tool for measuring UK marine benthic biodiversity and discuss the use of ARMS in closing gaps in reference databases as well as in assessing ecosystem function and environmental disturbance in benthic habitats.
Introduction
Natural ecosystems are facing a range of increasing threats that are cumulatively contributing to global biodiversity loss, species range shifts, and ecosystem degradation (Díaz et al., 2019). In the UK, many ecosystems have suffered significant historical biodiversity losses and indicators of species abundance show continued declines, resulting in the UK being considered “one of the most nature-depleted countries on Earth” (Burns et al., 2023). To arrest this decline in biodiversity, the UK government has enacted a variety of legal frameworks, such as the 2021 Environment Act, which established legally binding biodiversity targets (Environment Act, 2021), and the Environmental Improvement Plan 2023, which prioritized “thriving plants and wildlife” as its apex goal (Department for Environment, Food and Rural Affairs (DEFRA), 2023).
To assess the impact of management decisions aiming to enhance and protect biodiversity (e.g. the establishment of 377 Marine Protected Areas in the UK; Noble-James et al., 2023), and the impact of continued human development on biodiversity (e.g. the development of offshore wind farms; Watson et al., 2024), rigorous and comprehensive monitoring of biodiversity is imperative. The UK Government has set out to develop and implement a monitoring framework to achieve this, the Outcome Indicator Framework (OIF) (Department for Environment, Food and Rural Affairs (DEFRA), 2021), but to date many key indicators remain in development and significant increases in biodiversity have yet to be achieved (Office for Environmental Protection, 2024).
The lack of biodiversity monitoring data suitable for evaluating long term trends is a gap that is particularly acute for marine benthic (seafloor) ecosystems. Life on the seafloor in the UK is highly diverse, with more than 10,000 species, however it is challenging to obtain data about these organisms due to where they live (Burns et al., 2023). While the OIF provides long term tracking of the relative abundance of 1,177 species under “Wildlife” (Theme D), the only benthic marine species included are a small number of fish, none of which are given priority status (Department for Environment, Food and Rural Affairs (DEFRA), 2024a). Under “Seas and Estuaries” (Theme C) benthic habitats are assessed directly (indicator C4, “Diverse seas: condition of seafloor habitats”) but this indicator includes just 4 benthic habitat types, covers a narrow taxonomic range, and doesn’t provide species level data (Department for Environment, Food and Rural Affairs (DEFRA), 2024a). The lack of information on the state of the marine environment means that it is not possible to determine progress towards legal targets and the current infrequency of monitoring makes it difficult to provide timely course correction (Office for Environmental Protection, 2024).
This is a major concern because marine biota constitute billions of pounds of public value to the UK in the form of fisheries, carbon sequestration, recreation, and protecting against coastal erosion (Office for Natural Statistics, 2021). Benthic habitats act as refugia and nesting grounds for a broad array of taxa and so play a significant role in supporting overall marine biodiversity (Kritzer et al., 2016). For example, over 1800 species have been documented in UK kelp forests, with a single kelp holdfast containing up to 70 macrofaunal species (Smale et al., 2013). Seagrass (Zostera sp.) beds, European oyster (Ostrea edulis) reefs, and rocky reefs have also been shown to exhibit high levels of macrofaunal biodiversity (Tu Do et al., 2012; Kennon et al., 2023; Kostylev et al., 2005) as well as provide ecosystem services such as carbon sequestration, water purification, and wave and flood attenuation (Eger et al., 2023; do Amaral Camara Lima et al., 2023). Therefore, losing these habitats also means losing much of the diverse “cryptobiome” of small organisms that comprises the majority of diversity in these three-dimensionally complex benthic habitats. These organisms include diverse invertebrate (e.g. sponges, ascidians, and crabs), algal, and microbial communities, which are major regenerators of organic (de Goeij and Van Duyl, 2007; de Goeij et al., 2013) and inorganic (Gast et al., 1998; Rasheed et al., 2002) nutrients.
Many of these ecosystems have shown significant declines due to physical disturbance from fishing, sand extraction, and offshore construction (Joint Nature Conservation Committee (JNCC), 2017), as well as from sedimentation (Hinchen et al., 2021), excess nitrogen, low light levels (Jones and Unsworth, 2016), and over-harvesting (Helmer et al., 2019). Four canopy-forming kelp species have decreased in abundance in some parts of their range (Smale et al., 2013; Yesson et al., 2015), severe population declines have been shown for seagrass (since the 1869, peaking in the 1970’s; de los Santos et al., 2019), European oysters have declined across their biogeographic range (Helmer et al., 2019), and declines in rock-dependent taxa such as seaweeds imply increased pressure on rocky reefs (Brodie et al., 2023). Simultaneously, the UK marine environment has seen increased numbers of invasive species (Joint Nature Conservation Committee (JNCC), 2025) and artificial structures such as wind farms (Bugnot et al., 2020), changing the composition and habitat structure of marine benthic communities (Smale et al., 2013; Yesson et al., 2015). Restoration efforts are underway to conserve and restore many of these natural coastal ecosystems (e.g. the Sussex Kelp Recovery Project), but measuring the impact of these efforts remains an important task.
Here we evaluate the value that Autonomous Reef Monitoring Structures (ARMS) (Zimmerman and Martin, 2004) can provide in measuring biodiversity gains for such projects and, more generally, for monitoring benthic biodiversity in the UK. ARMS consist of a stack of PVC plates that mimic the three-dimensional complexity of benthic habitats such as coral, oyster and chalk reefs, kelp forests, and human-made structures. After being deployed and colonized by the diverse and hard to sample “cryptobiome” found in these habitats, ARMS are retrieved with little disturbance to natural substrates and analyzed using standardized protocols for image and molecular analysis (Leray and Knowlton, 2015; Ransome et al., 2017). This provides a comprehensive insight into diversity that goes beyond conspicuous macrofauna. Originally designed for use on tropical reefs, very few studies using ARMS have been carried out in temperate regions (Cecchetto et al., 2024; Lee et al., 2024; Pagnier et al., 2025), and ARMS have yet to be used to assess UK benthic biodiversity.
Materials and methods
ARMS deployment & collection
ARMS (n = 3) were deployed on July 15, 2022 at a site off the coast of Sussex (50.784452, -0.372378; Figure 1A) in an area targeted for seabed recovery after the loss of an extensive kelp habitat (Williams and Davies, 2019). Depth at deployment was 7m (at chart datum).To promote recovery of essential fish and kelp habitat in this area, a nearshore trawling byelaw was implemented in 2021 by the Sussex Inshore Fisheries and Conservation Authority (IFCA) to protect the seabed from the impact of demersal trawls and enable habitat restoration (Sussex Inshore Fisheries and Conservation Authority (IFCA), 2019). The seabed at the site was consistent with EUNIS habitat classification 5.5 (sublittoral macrophyte-dominated sediment). After 15 months, on October 30, 2023, ARMS were collected and processed according to Smithsonian Global ARMS protocols 2–7 and 9 (The Smithsonian Institution, 2024). See Figure 1B for an image of one of the ARMS post-colonization.
Figure 1

Study location and example ARMS. (A) Study location and freshly deployed ARMS units (Ward, 2022) (B) Comparison between temperate rocky reef seabed (Ward, 2022) and colonised ARMS unit from this study.
ARMS plate image annotation
Coverage of the sessile biota on ARMS plate faces (e.g. Figure 1B) was assessed according to Smithsonian Global ARMS protocol 15 (The Smithsonian Institution, 2024). Images were analyzed in CoralNet (CoralNet, 2024) using 225 annotation points per image, generated using a 15 x 15 cell grid, with one point randomly placed within each cell. Each annotation point was assigned 1 of 32 labels following the National Oceanic and Atmospheric Administration’s “Coral Reef Ecosystem Division/Program for standardizing ARMS analysis” protocol (Lamirand et al., 2022), with some additional groupings (see Supplementary Table 1), with all identifications performed manually without CoralNet’s machine learning engine. Labels covered 21 sessile functional groups, 1 motile fauna group, 7 substrate types, unknown taxa, no recruitment or unavailable recruitment space (see Supplementary Table 1 for full descriptions).
Motile specimen morphosorting and DNA barcoding
Large (> 2 mm) motile specimens were sorted into morphotypes based on physical characteristics (e.g., number and shape of appendages) cross referencing vs Howson and Picton (1997). Individual specimens were weighed to within 0.01 g and up to 5 specimens from each morphotype were selected as type specimens. Some arthropods and annelids were fragmented during morphotyping, so counts are approximate for these taxa. Photographs of specimens were taken using either a Celestron microscope or a Nikon D810 Digital SLR camera with a 105 mm lens. All specimens were preserved in 95% ethanol at -20°C prior to and following morphosorting.
DNA was extracted from 10–20 mg of tissue (if available) from individual specimens covering all morphotypes (n = 46; see Supplementary Table 2 for photos and details) using a DNEasy Blood and Tissue Kit (Qiagen) following manufacturer’s instructions for the spin column protocol. Multiple morphologically distinct specimens were sequenced for more abundant morphotypes. DNA extracts were amplified through Polymerase Chain Reaction (PCR) targeting a 658 base pair region of the cytochrome c oxidase subunit I (COI) gene (primers dgLCO1490/dgHCO2198; Meyer, 2003). Because these protocols were applied to novel taxa, multiple rounds of PCR were run to establish optimal parameters for amplification for each specimen (see Supplementary Table 2). Results were imaged on a 1% agarose gel. All samples were run in 50 μL volumes, which included 10 μL HOTFIREPol Taq mix (Solis BioDyne), 2 μL forward primer at 10 mM, 2 μL reverse primer at 10 mM, 35 μL PCR-grade H2O, and 1 μL extracted DNA. A negative control was included in all runs. The PCR consisted of an initial denaturation at 95°C for 15 minutes, 37 cycles of 95°C denaturation for 40 seconds, annealing for 40 seconds at various temperatures, and 72°C extension for 60 seconds, followed by a final 72°C extension for 10 minutes. Amplicons were quantified using a Qubit BR Assay Kit (Thermo Fisher Scientific) following manufacturer’s instructions and sent to Eurofins Genomics for purification and Sanger sequencing of the forward read.
DNA metabarcoding of bulk fractions
The sessile, 106 µm-500 µm motile, and 500 µm-2 mm motile bulk fraction samples (n = 9) were prepared for DNA extraction according to Smithsonian ARMS protocol 10 (The Smithsonian Institution, 2024) with some alterations (see Supplementary Materials for details). Adhering to Smithsonian ARMS protocols, DMSO preserved samples were used for sessile fraction metabarcoding and ethanol preserved samples were used for motile fraction metabarcoding. DMSO better preserves DNA in the homogenized sessile fraction (Ransome et al., 2017), whereas it does not preserve the morphological features of some invertebrates (Ogiso-Tanaka et al., 2025), so is avoided for unhomogenised motile specimens.
DNA was extracted and cleaned using a DNEasy PowerMax Soil Kit (Qiagen) and a DNEasy PowerClean Pro Cleanup Kit (Qiagen), according to Smithsonian ARMS protocol 11 (The Smithsonian Institution, 2024) except where the protocol specified it followed the manufacturer’s instructions. DNA concentrations of cleaned samples were measured using a Qubit HS Assay Kit (Thermo Fisher Scientific) following manufacturer’s instructions. A 313 base pair region of the COI gene (Leray et al., 2013; The Smithsonian Institution, 2024) was amplified via PCR. PCRs were run in triplicates in 20 μL volumes and included 4 μL HOT FIREPol Taq Mix (Solis BioDyne), 1 μL of forward primer mlCOIint_F (including Illumina forward overhang adapter sequence) at 10 mM, 1 μL of reverse primer jgHCO2198 (including Illumina reverse overhang adapter sequence) at 10 mM, and 2 ng of DNA for sessile samples or 5 ng of DNA for motile samples. The PCR profile from Smithsonian protocol 11 was used with the initial denaturation step extended to 15 minutes and the final extension step extended to 10 minutes. A negative control was run for each PCR reaction and results were imaged on a 1% agarose gel.
Library preparation consisted of a custom version of the Illumina 16S Metagenomic Sequencing Library Preparation protocol. PCR triplicates were pooled and cleaned using AMPure XP beads (Beckman Coulter). An indexing PCR was run in 50 μL volumes and included 10 μL HOT FIREPol Taq Mix (Solis BioDyne), 5 μL of Index primer 1, 5 μL of Index primer 2, 25 μL PCR-grade H2O, and 5 μL cleaned first round PCR product. Indexes were chosen from a Nextera XT DNA Library Preparation Kit (Illumina) to provide a unique combination for each sample. The PCR profile used was as follows: an initial denaturation at 95°C for 15 minutes, then 8 cycles of 95°C denaturation for 30 seconds, 55°C annealing for 60 seconds, and 72°C extension for 60 seconds, followed by a final 72°C extension for 10 minutes. Indexed product was cleaned using AMPure XP beads (Beckman Coulter) and DNA concentration measured using a Qubit HS Assay Kit (Thermo Fisher Scientific) following manufacturer’s instructions. Samples were then normalized and pooled. Libraries were denatured, diluted, spiked with 10% PhiX, loaded onto a MiSeq Reagent Nano Kit v2 (500-cycles) (Illumina) and sequenced on a MiSeq platform.
Data analysis
Unless otherwise noted, analysis was performed using R (v4.4.2) in R Studio (v2024.04.2 + 764) and applying a common set of packages for data manipulation, summary, and plotting. Package details and scripts are available at https://github.com/MGJordan/SKRP/.
Image annotations were extracted from CoralNet and the percentage cover of individual sessile phyla on available recruitment space was calculated. Organisms were visually identified to species level where possible (Marine Life Information Network (MarLIN), 2016; Howson and Picton, 1997). Community composition across ARMS was visualised via non-metric multidimensional scaling (NMDS) using the vegan R package (Oksanen et al., 2024) with Bray-Curtis distances and a fourth-root transformation of count data to prevent highly abundant species from dominating the results. Using the negative binomial distribution and a log link function, the manyglm function from the mvabund R package (v.4.2.1) (Wang et al., 2012) was used to run a multivariate generalized linear model (GLM) on the effect of plate face (top or bottom ARMS plate surfaces, see Figure 1B) on sessile community composition. Univariate GLMs and subsequent analyses of variance (ANOVA) were then run to assess the effect of plate face on the abundance of individual sessile functional groupings with at least 30 annotation points.
Barcoding sequences were trimmed on both the 5’ and 3’ ends using the Trim Ends function in Geneious Prime (v2024.07) with an Error Probability Limit of 0.05. The dgLCO1490 primer was trimmed allowing up to 5 mismatches. Trimmed sequences were queried using the Barcode of Life Datasystem (BOLDv5; using BOLDigger3 command line application (–db 3 –mode 3) with default similarity thresholds (species: 97%, genus: 95%, family: 90%, order: 85%) and the Genbank nucleotide collection (Geneious Prime (v2024.0.7); using Megablast search and default parameters). A taxonomic assignment from each database was produced for each sequence. For BOLD, the BOLDigger3 algorithm assigned taxonomy following Buchner and Leese (2020). For Genbank, up to 100 hits were returned and the taxonomy with the greatest number of hits that were > 85% query coverage and > 97% pairwise identity was used (Ransome et al., 2017). Genbank results were checked for synonymity using the World Registry of Marine Species (WoRMS) and resolved to the accepted taxonomy (World Registry of Marine Species (WoRMS) Editorial Board, 2025). Sequences for which taxonomic assignments did not match specimen morphology (e.g., an arthropod specimen assignment to a sponge taxonomy) were left unassigned. Where BOLD and Genbank produced different assignments (n = 1), the assignment from the database with more hits above the threshold was used.
Metabarcoding sequences were processed using the SimpleMetaPipeline (v0.0.0.9000) command line application running in a miniconda (v24.5.0) environment (Williams et al., 2024). Briefly, this pipeline uses DADA2 (v1.26.0) to perform primer trimming, quality filtering, denoising, merging, and chimera removal, VSEARCH (v2.14.2) to cluster amplicon sequence variants (ASVs) into operational taxonomic units (OTUs), and LULU (v0.1.0) to curate OTUs by identifying erroneous OTUs and merging them with their parent (Callahan et al., 2016; Rognes et al., 2016; Frøslev et al., 2017). The IDTAXA algorithm (Murali et al., 2018) was used to classify sequences against a custom classifier designed for marine COI metabarcoding by curating MIDORI2 (v248) (Leray et al., 2022) and BIOCODE (Ransome et al., 2017) databases. The confidence of assignment threshold was 60%, corresponding to very high confidence (Murali et al., 2018), which is appropriate for identifying taxa at lower taxonomic levels. The pipeline also queried sequences against the same custom database using BLAST (Camacho et al., 2009) and assignments above specific similarity threshold were retained depending on the taxonomic rank (species: 97%, genus: 95%, family: 90%, order: 85%, class: 80%, phylum: 0%). IDATAXA and BLAST results were imported into R Studio using the SimpleMetaPackage (v0.0.0.9000) R package (Williams et al., 2024) and curated OTUs for clustering. BLAST results were filtered to include only assignments with >= 85% query coverage and >= 97% percent identity. Because IDTAXA has been shown to produce lower rates of over-classification (Murali et al., 2018), final assignments were first granted to IDTAXA and then granted to BLAST if no IDTAXA assignment was made. Final assignments were cleaned and (to facilitate comparison between datasets) taxonomies missing a phylum were assigned a phylum by searching the next lowest taxon versus the Catalogue of Life (Bánki et al., 2024). The microViz (v0.12.5) R package was used to remove non-eukaryotic OTUs (Barnett et al., 2021) to ensure non-target OTUs were removed from our dataset. Multiple rarefactions were performed (1,000 iterations) to the lowest read count among samples (30,295) (Mikryukov, 2023). Rarefied reads were calculated by taking the mean reads per OTU across iterations.
Negative controls were checked for OTUs. The sessile negative control contained no OTUs. The motile negative control contained 10 OTUs of which 7 were eukaryotic (Amphinema dinema, Balanidae sp., Crepidula fornicata, Demospongiae sp., Phyllodocidae sp., Polynoidae sp., Sabellaria spinulosa). These 7 OTUs were also present in all sessile samples, suggesting that their presence in the motile negative control was due to cross-contamination between samples. Because this does not impact comparisons reported below, these OTUs were not removed to preserve the fullest estimate of biodiversity at the site.
Species of special interest
The presence of species of conservation value, of commercial value, or previously undocumented in the UK was evaluated across image, barcoding, and metabarcoding datasets using WoRMS (World Registry of Marine Species (WoRMS) Editorial Board, 2025), MarLIN (Marine Life Information Network (MarLIN), 2016), the Global Biodiversity Information Facility (Global Biodiversity Information Facility (GBIF), 2025), and the National Biodiversity Network (NBN) Atlas (National Biodiversity Network (NBN) Trust, 2024). The presence of non-native and invasive species was evaluated using the World Register of Introduced Marine Species (Costello et al., 2021) versus records downloaded for the Atlantic Ocean (General Sea Area) including subareas and distributions from synonyms. The presence of threatened seaweed species was also evaluated based on the British Red List of seaweeds (Brodie et al., 2023) and for 7 kelps with broad UK distribution (Smale et al., 2013). Due to uncertainty in potential species assignment, species of special interest with UK congenerics and with missing representation from reference libraries were not reported as special interest but remained in the results.
Comparison between image analysis and metabarcoding data
Phyla-level community composition recovered by image analysis and metabarcoding approaches was compared, using only phyla identified in image analysis. For image analysis, the relative abundance of each phylum was calculated as the number of annotation points assigned to that phylum out of the total number of points assigned to living sessile organisms. Any points assigned to empty or broken shells or bare substrate were not included in this calculation. For metabarcoding, the relative abundance of each phylum was calculated as the number of rarefied eukaryotic reads assigned to a phylum out of the total number of rarefied eukaryotic reads among phyla only identified in image analysis.
Results
A total of 176 genera, from 22 phyla were identified across three ARMS
A total of 176 genera of organisms, from 153 families (across 42 classes, 81 orders, and 22 phyla), were recovered from ~0.15m2 of planar benthic surface area (ARMS n = 3) at a single site off the Sussex coast using barcoding, metabarcoding and image analysis. The majority of the species retrieved were animals (82%) with some algae (15%) and a small proportion of other groups, including fungi (2%) and non-algal protists (2%) (see Supplementary Table 3 for a full list of identified taxa). The three phyla showing the greatest richness at Family level were the Arthropoda (35 families), Annelida (23 families), and Mollusca (21 families).
Image analysis alone identified 10 phyla across 18 sessile functional groups
Image analysis of ARMS plates identified 10 phyla across 13 sessile invertebrate and 5 algal functional groupings (see Supplementary Table 1 for details). A total of 16 species were identified (see Supplementary Table 3) including three species of interest: the invasive slipper limpet Crepidula fornicata (Costello et al., 2021), the habitat forming honeycomb worm Sabellaria alveolata and sand mason worm Lanice conchilega (De Smet et al., 2015; Jones et al., 2018).
Among the 10,347 points annotated, 57.9% were assigned to sessile organisms (53.9% invertebrates, 4.1% algae), 21.2% to substrate (e.g. sediment), 15.8% to no recruitment, 4.5% to unknown, and 0.4% to motile organisms. Among all annotation points assigned to live sessile organisms, a majority (93%) were assigned to sessile invertebrates, in particular bryozoans (43%), annelids (33%), and porifera (10%) (Figure 2). ARMS communities separated into two distinct clusters in an NMDS, based on plate surface (top or bottom) (see Supplementary Figure 1). Plate face had a significant effect on the abundance of 7 out of 10 sessile invertebrate functional groupings (ANOVA, p<0.05; see Supplementary Table 4), with crustose coralline algae and serpulid worm sediment found in higher abundances on top plate surfaces, and bryozoans, calcareous worms, and sponges found in higher abundances on bottom plate surfaces.
Figure 2
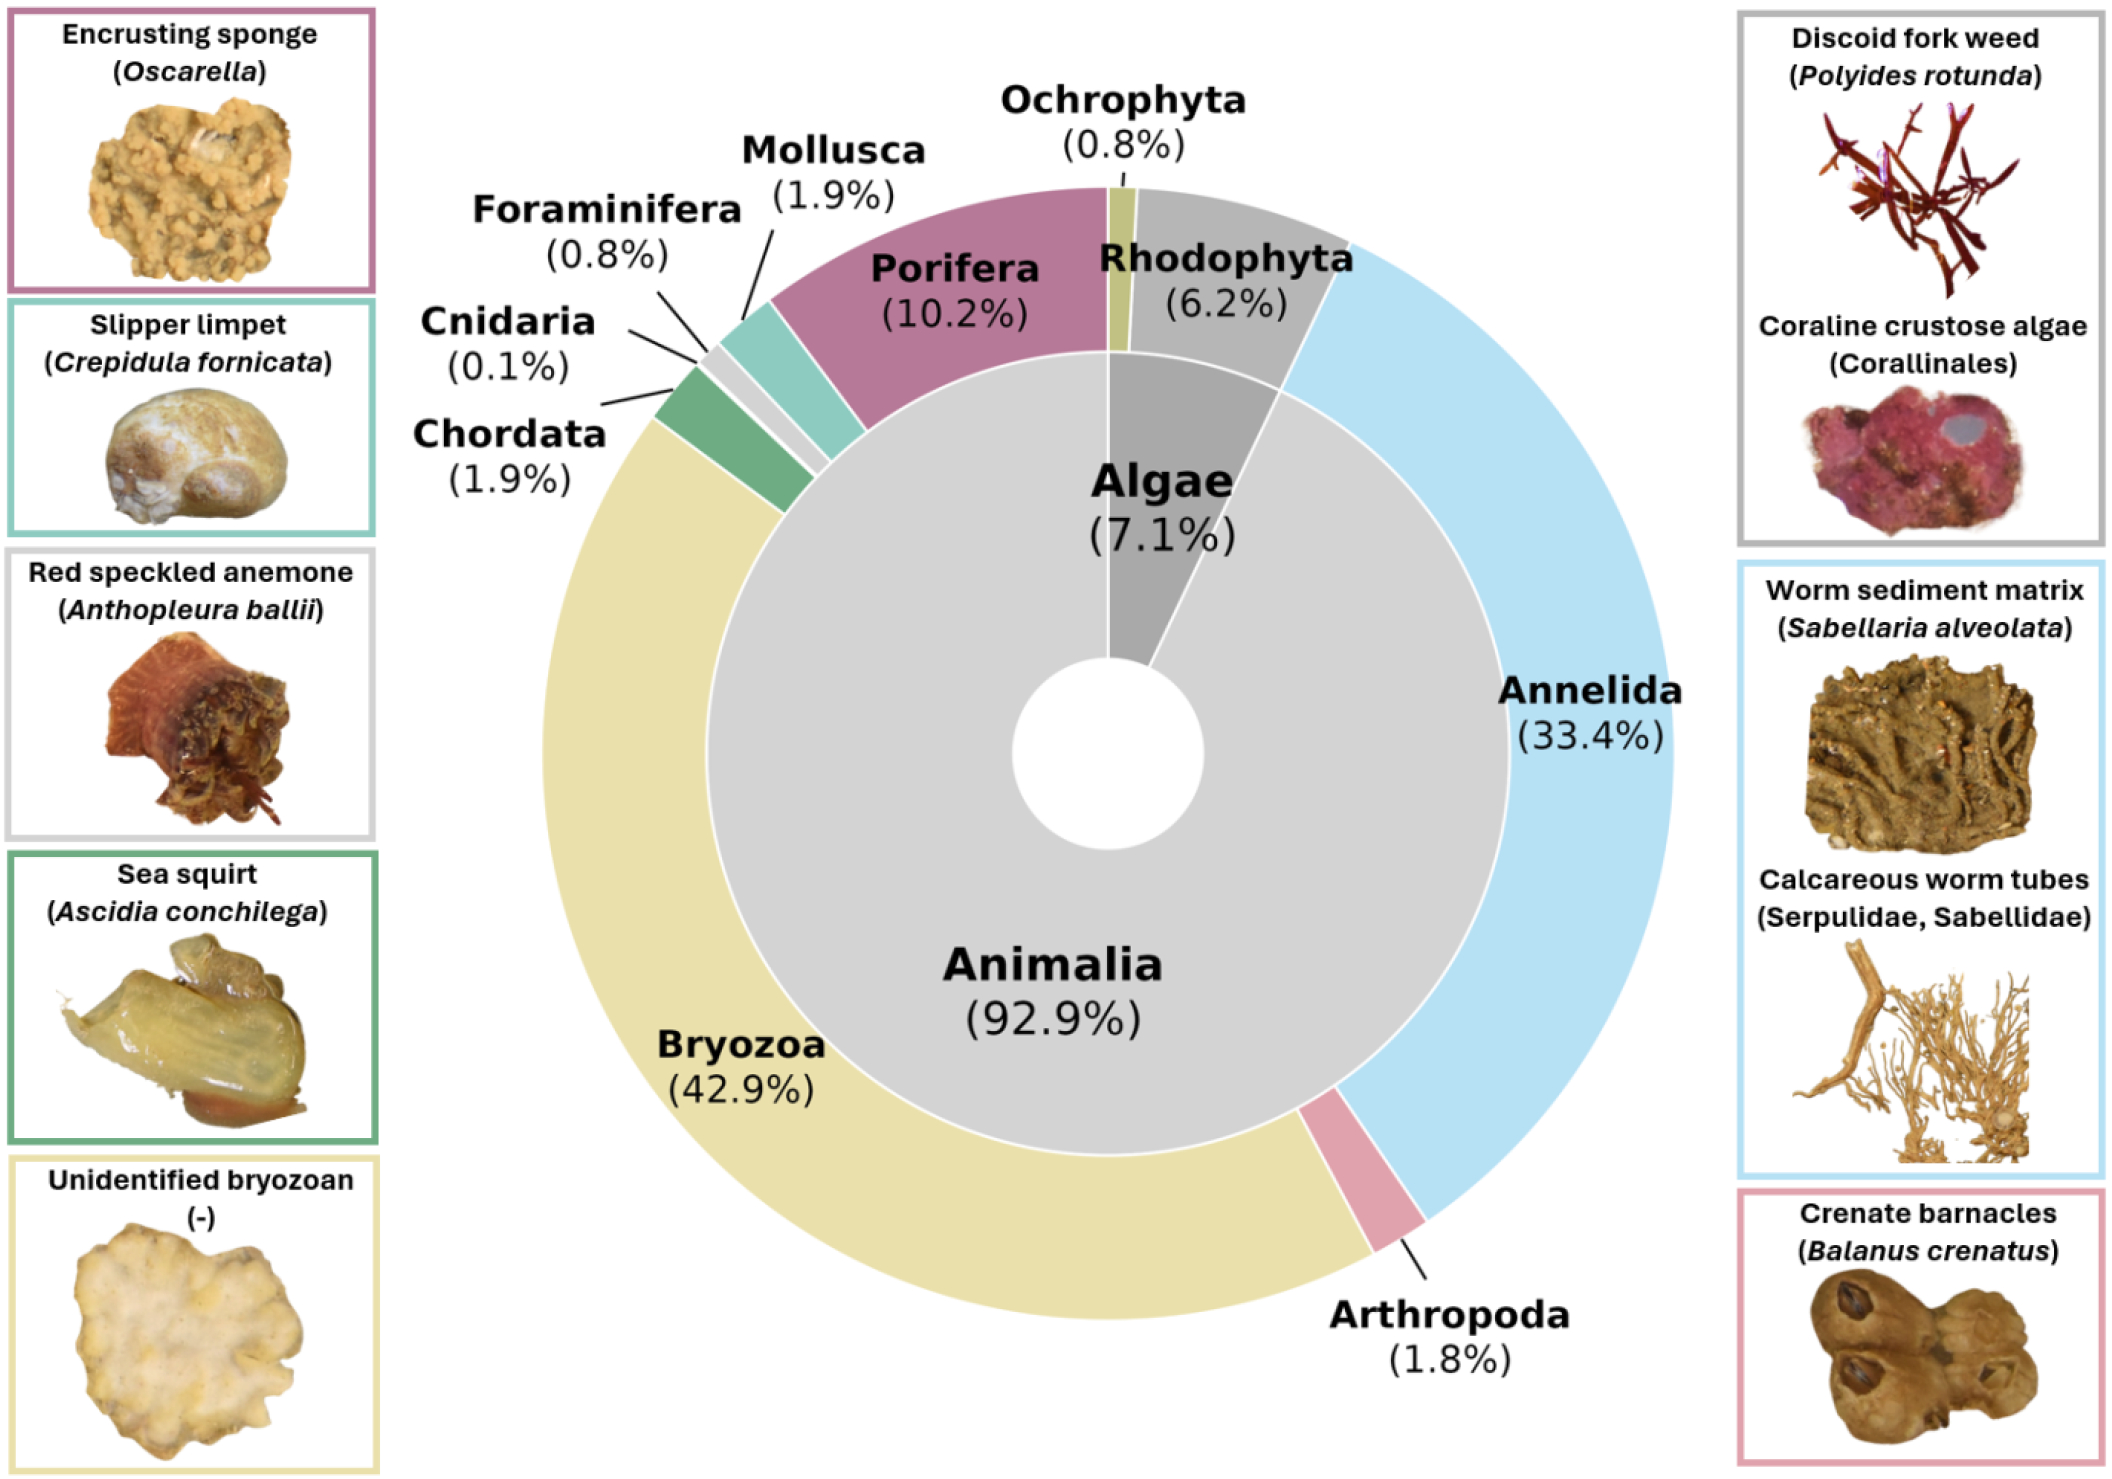
Community composition recovered using image annotation across ARMS, with broad taxonomic groupings (internal arc) and phyla-level abundances (outer arc) presented. See Supplementary Table 5 for plot values. Species from some phyla are shown and images are taken from ARMS plates. Coloured borders highlight phyla that each species belongs to.
Recovered large motile (> 2mm) fauna consisted of 1920 specimens and 312 grams of biota mass
One thousand nine hundred and twenty motile organisms, sorted into 35 morphospecies, were collected from 3 ARMS. Of the 46 specimens picked for barcoding, 28 specimens (19 morphotypes) were assigned a taxonomy, 27 to species-level. BOLD and Genbank taxonomic assignments were identical for all but 1 specimen. Taxonomic identification confirmed unique identities of each morphotype (Supplementary Table 2). These 19 morphotypes accounted for 91% of all large motile individuals collected and 75% of the total motile biomass (312 grams) (see Figure 3, Supplementary Table 6 for morphotype counts and weights). The remaining 18 specimens (15 morphotypes) were not assigned a taxonomy for a variety of reasons including lack of matches to taxonomic records despite average sequence quality, poor sequence quality, and non-specific PCR amplification (see Supplementary Table 2 for full details).
Figure 3
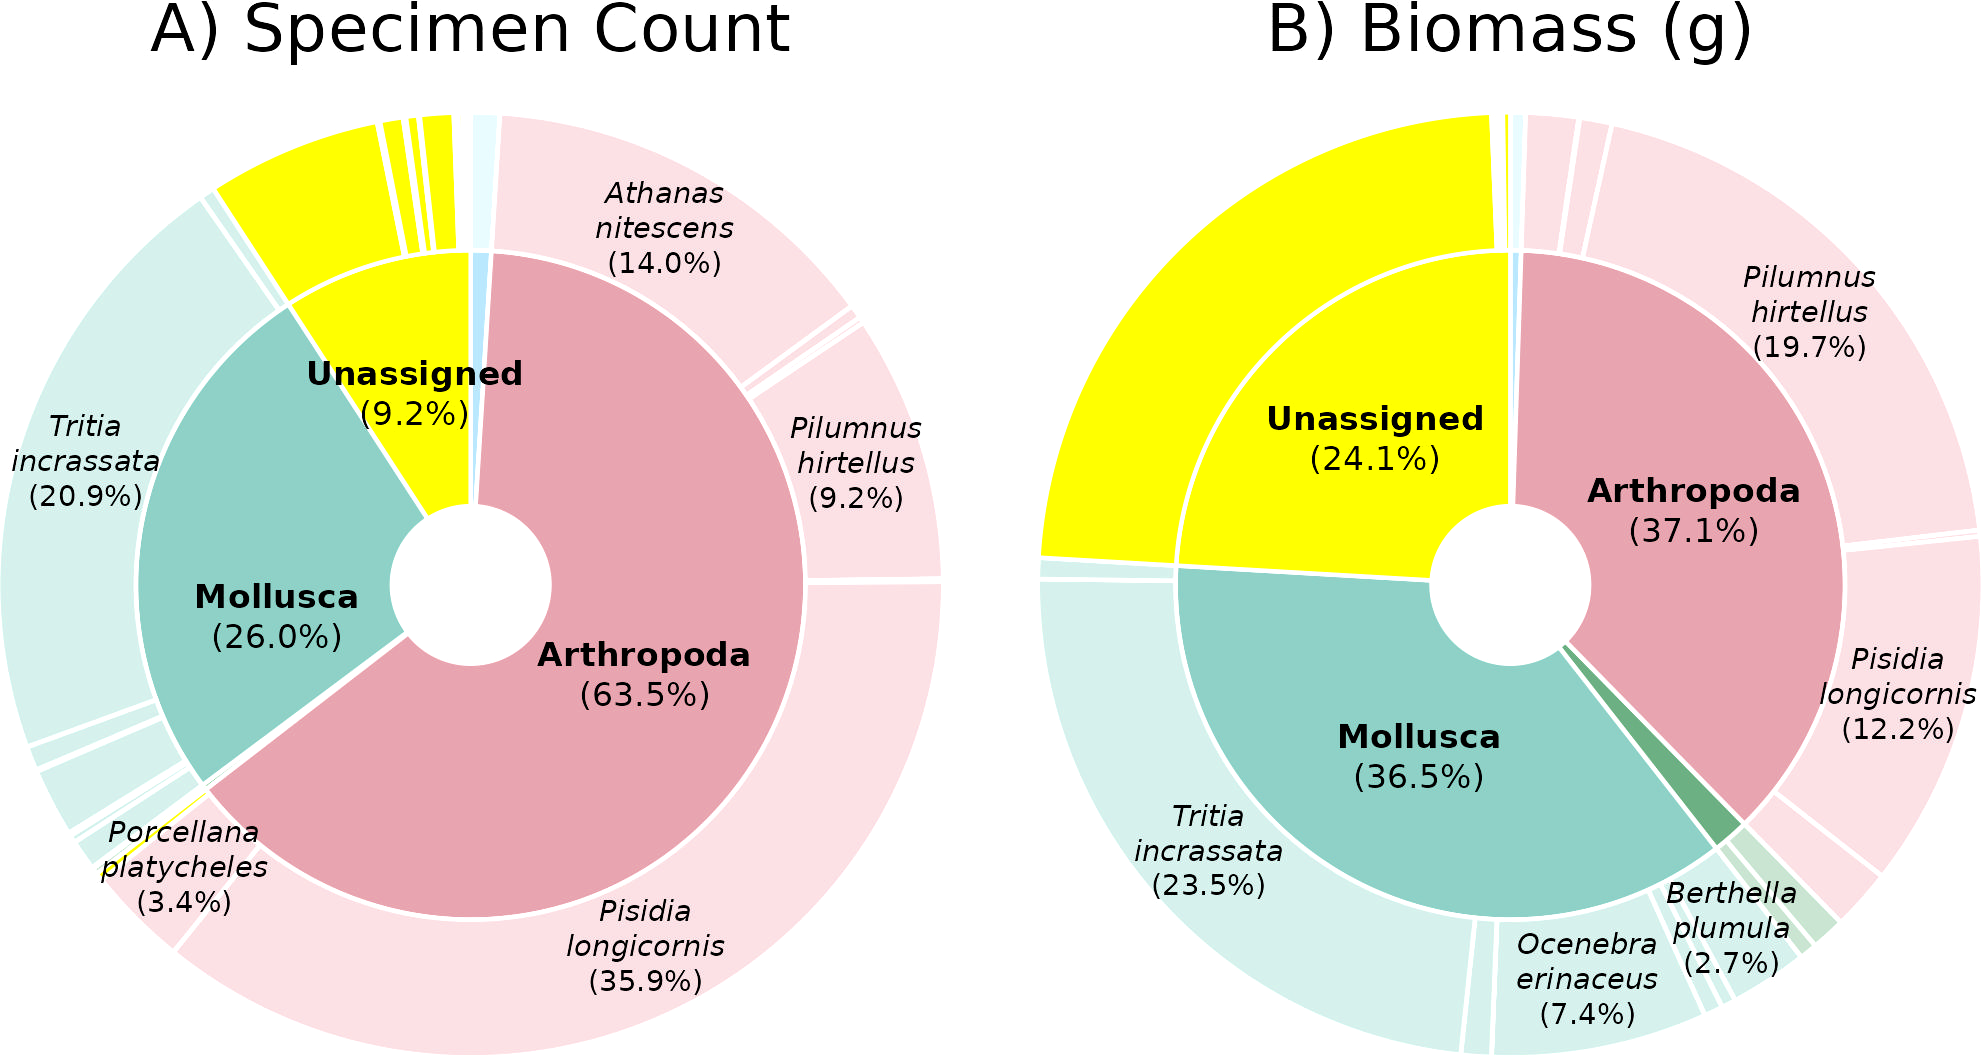
Barcoding specimen count and biomass distribution. Summaries of > 2 mm motile fauna (A) specimen count and (B) biomass across ARMS across phyla (internal arc) and species (outer arc) with non-assigned specimens in yellow. Only segments comprising >4% for phyla and >2.5% for species of the total are labelled (see Supplementary Table 6 for plot values).
The > 2 mm motile assemblage was dominated by arthropods (63.5% of specimens, 37.1% of biomass) and molluscs (26% of specimens, 36.5% of biomass) (Figure 3), including Pisidia longicornis (long-clawed porcelain crab), Tritia incrassata (thick-lipped dogwhelk), Athanas nitescens (hooded shrimp), and Pilumnus hirtellus (bristly crab) (Figure 4), which collectively comprised 80% of all specimens and 57% of the total biomass.
Figure 4
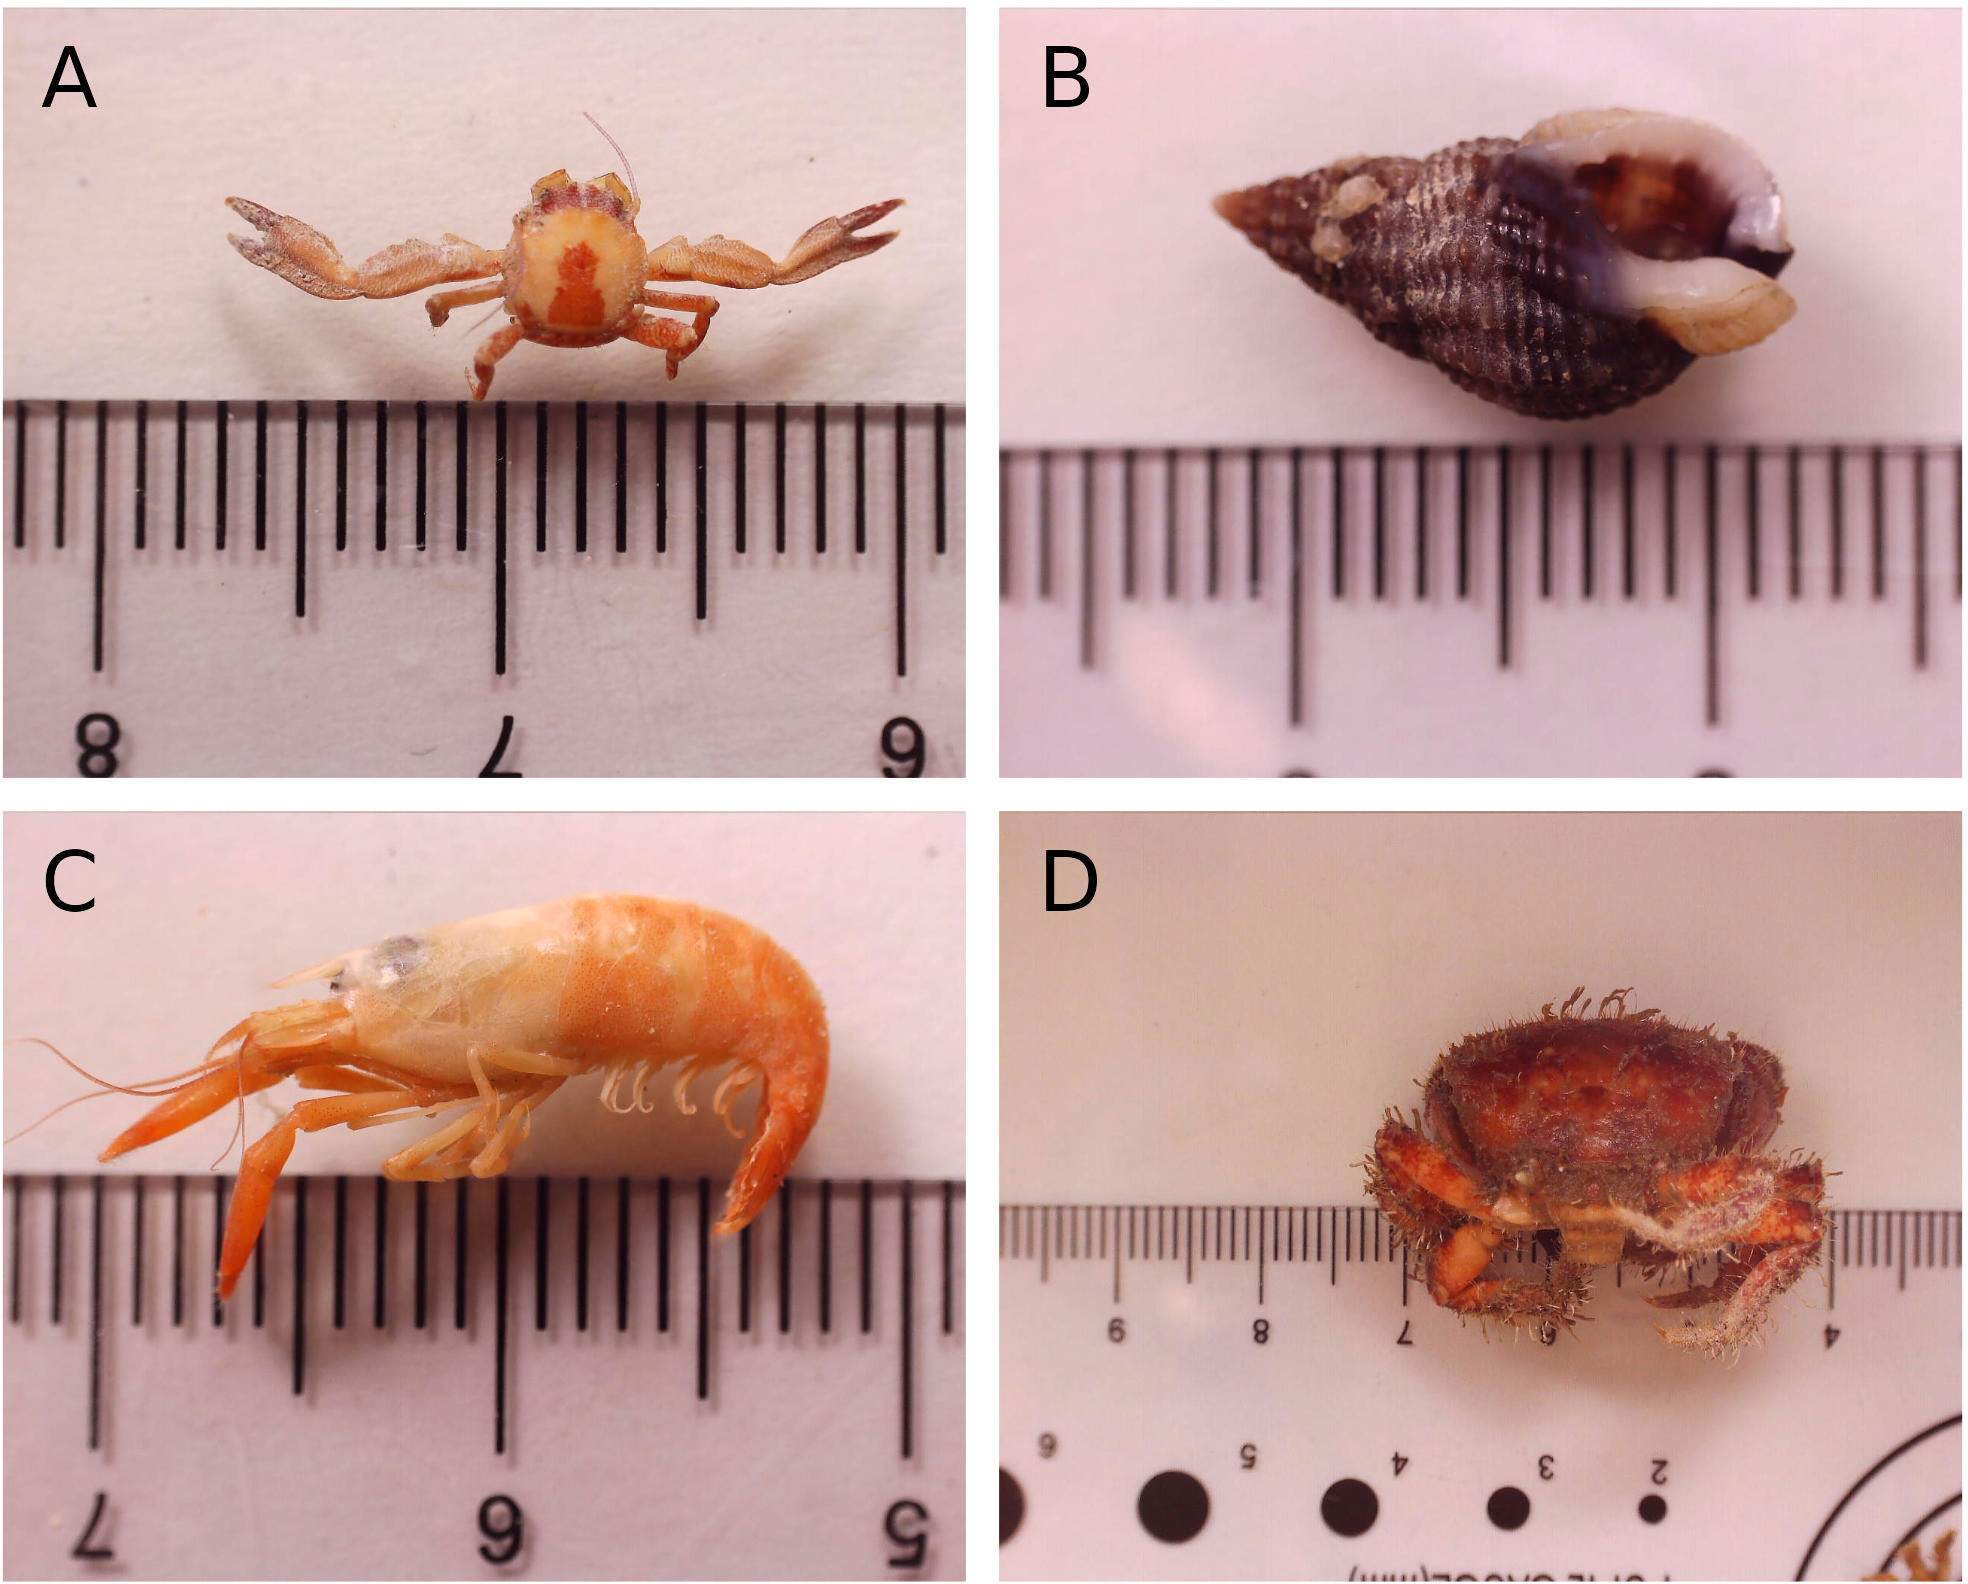
Images of the 4 most abundant > 2 mm motile morphotypes taken during vouchering: (A) Pisidia longicornis, (B) Tritia incrassata, (C) Athanas nitescens, (D) Pilumnus hirtellus. Ruler scale in mm. See Supplementary Table 2 for images of more barcoded specimens.
Metabarcoding of sessile and small motile (<2mm) communities recovered 215 eukaryotic OTUs
A total of 1,051,408 reads were generated from metabarcoding 9 bulk ARMS samples, of which 889,457 passed quality control, denoising, merging, and chimera-removal steps. The mean cleaned reads per sample was 98,823. Reads were clustered into 1,641 OTUs of which 87% (41% of reads) were removed from further analysis as they were not identified as eukaryotic, leaving 215 eukaryotic OTUs comprising 525,029 reads for downstream analysis.
In terms of read abundance, the ARMS assemblage was dominated by annelids (61% of reads) including Pholoe inornata (scale worm, 23% of reads) and Sabellaria spinulosa (ross worm, 21% of reads) (Figure 5). Arthropods (15% of reads), sponges (10% of reads), cnidarians (5% of reads), and molluscs (4% of reads) were also abundant. The assemblage was much more evenly distributed when considering sequence diversity (OTU richness; Figure 5), with annelids as the most diverse phyla (21% of OTUs), followed by arthropods (19% of OTUs), molluscs (11% of OTUs), sponges (9% of OTUs), and cnidarians (7% of OTUs). Multiple OTUs were also recovered for the rhodophytes (8% of OTUs), bryozoa (5% of OTUs), chordates (5% of OTUs), and ochrophytes (5% of OTUs), despite relatively low read abundances for these phyla (Figure 5).
Figure 5
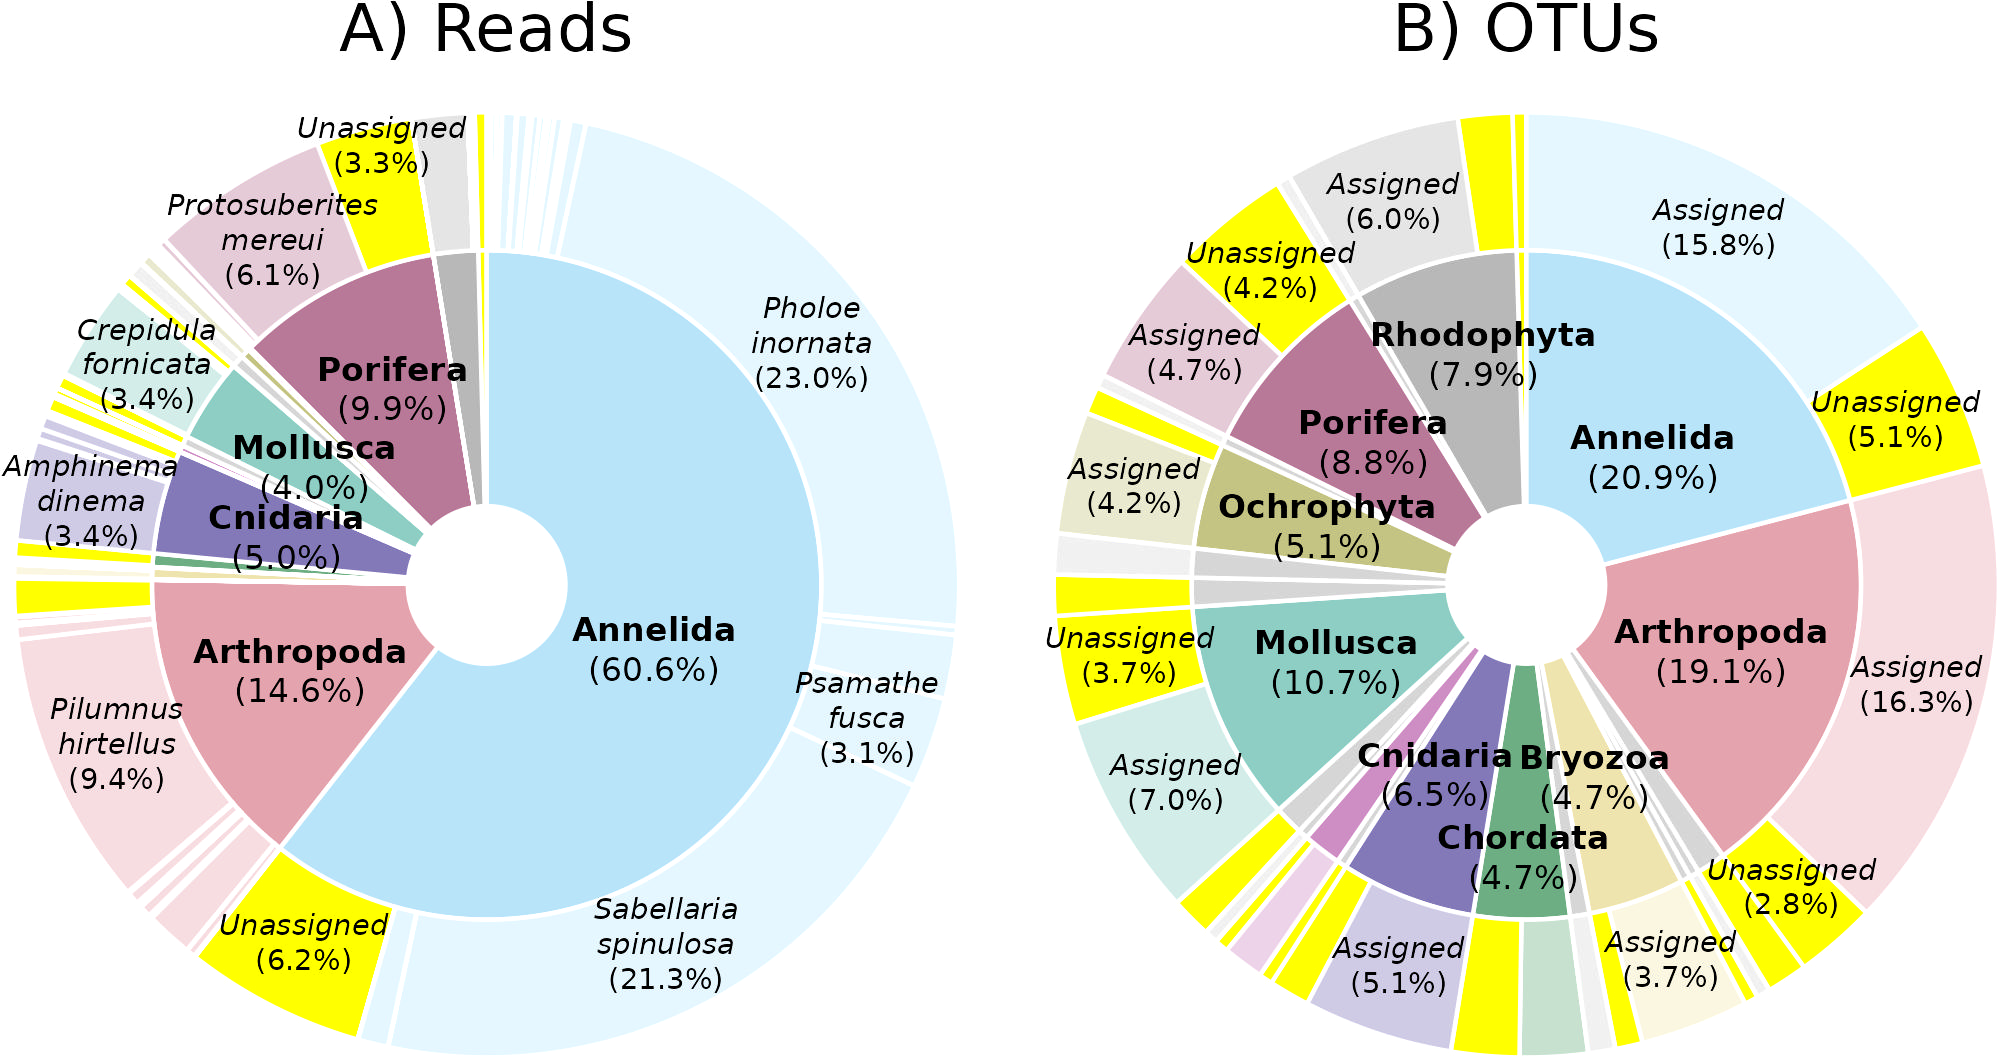
Metabarcoding read and OTU abundance across taxonomic groups. Summary of COI metabarcoding of bulk ARMS fractions by (A) multi-rarefied read count and (B) multiple-rarefied OTU count with phylum as the internal pie, species as the outer donut for plot (A), and whether or not an OTU was assigned a species as the outer donut for plot (B). Proportion of non-assigned reads and OTUs are highlighted in yellow. Only segments comprising >4% of phyla or >2.5% for species are labeled. See Supplementary Table 7 for precise figures for all phyla and species.
Taxonomic assignment at phylum and species-level was 99.6% and 86.4% of reads assigned respectively. Taxonomic assignment of OTUs was also high at the phylum level (99.5%), but considerably lower at the species-level (70.7%) (Figure 5).
Fifteen species of interest were identified, but no kelp was detected
Species of interest identified included 4 habitat forming species, 3 commercially fished species, 1 established non-native species, 2 recently introduced non-native species, 4 British Red List seaweeds, and 1 species with no prior recorded distribution in the UK (Table 1). Of these, 4 were identified by image analysis, none were identified by barcoding, and 11 were identified by metabarcoding, with no overlap between methods. No kelp were identified in metabarcoding libraries, although all 7 UK kelp species had representative sequences in our reference databases.
Table 1
| Species | Common name | Status notes | Method |
|---|---|---|---|
| Lanice conchilega | Sand Mason worm | • Habitat forming • OIF (C4) |
IA |
| Ostrea edulis | European oyster | • Habitat forming • OSPAR • OIF (C6) |
MB |
| Sabellaria alveolata | Honeycomb worm | • Habitat forming • OIF (C4) |
IA |
| Sabellaria spinulosa | Ross worm | • Habitat forming • OSPAR • OIF (C6) |
MB |
| Aequipecten opercularis | Queen scallop | • Commercially fished in UK | IA |
| Raja clavata | Thornback skate | • Commercially fished in UK • IRL Near-Threatened |
MB |
| Symphodus melops | Corkwing wrasse | • Commercially fished in UK | MB |
| Crepidula fornicata | Slipper limpet | • Long established non-native • Invasive |
MB |
| Cephalothrix simula | – | • Recently introduced non-native • Invasive |
MB |
| Perophora japonica | – | • Recently introduced non-native | MB |
| Halidrys siliquosa | Sea oak | • NRL Near-Threatened | MB |
| Polyides rotunda | Discoid Forked Weed | • NRL Near-Threatened | IA |
| Porphyra umbilicalis | Laver | • NRL Critically Endangered | MB |
| Rhodymenia delicatula | – | • NRL Vulnerable | MB |
| Igernella notabilis | – | • Potential first UK record | MB |
Notable species identified with notes on status and assignment method [metabarcoding (MB) or image analysis (IA)].
Status notes include the species’ conservation status (National Red List for British Seaweeds (NRL), Brodie et al., 2023; IUCN Red List of Threatened Species (IRL), Ellis et al., 2016) and whether the species is habitat forming (Oslo and Paris (Oslo and Paris Conventions (OSPAR) Commission, 2024a, 2024), OSPAR listed (Oslo and Paris Conventions (OSPAR) Commission, 2024a; 2024b), included in an OIF indicator (with which indicator) (Department for Environment, Food and Rural Affairs (DEFRA), 2021), commercially fished in the UK (Department for Environment, Food and Rural Affairs (DEFRA), 2024b; 2024c; Devon and Severn Inshore Fisheries and Conservation Authority (IFCA), 2017), not native (Martin et al., 2006; Nishikawa et al., 2000), invasive (Costello et al., 2021), or a potential first UK record (World Registry of Marine Species (WoRMS) Editorial Board, 2025).
Taxonomic variability between image analysis and metabarcoding
Of the 10 phyla identified using image analysis, metabarcoding identified 9, omitting Foraminifera. A two-fold difference in relative abundance was observed between the two methods for 6 phyla (Figure 6). The largest differences were observed for Cnidaria (77x higher relative abundance in metabarcoding than in image analysis) and Bryozoa (72x higher relative abundance in image analysis than in metabarcoding) (Figure 6).
Figure 6
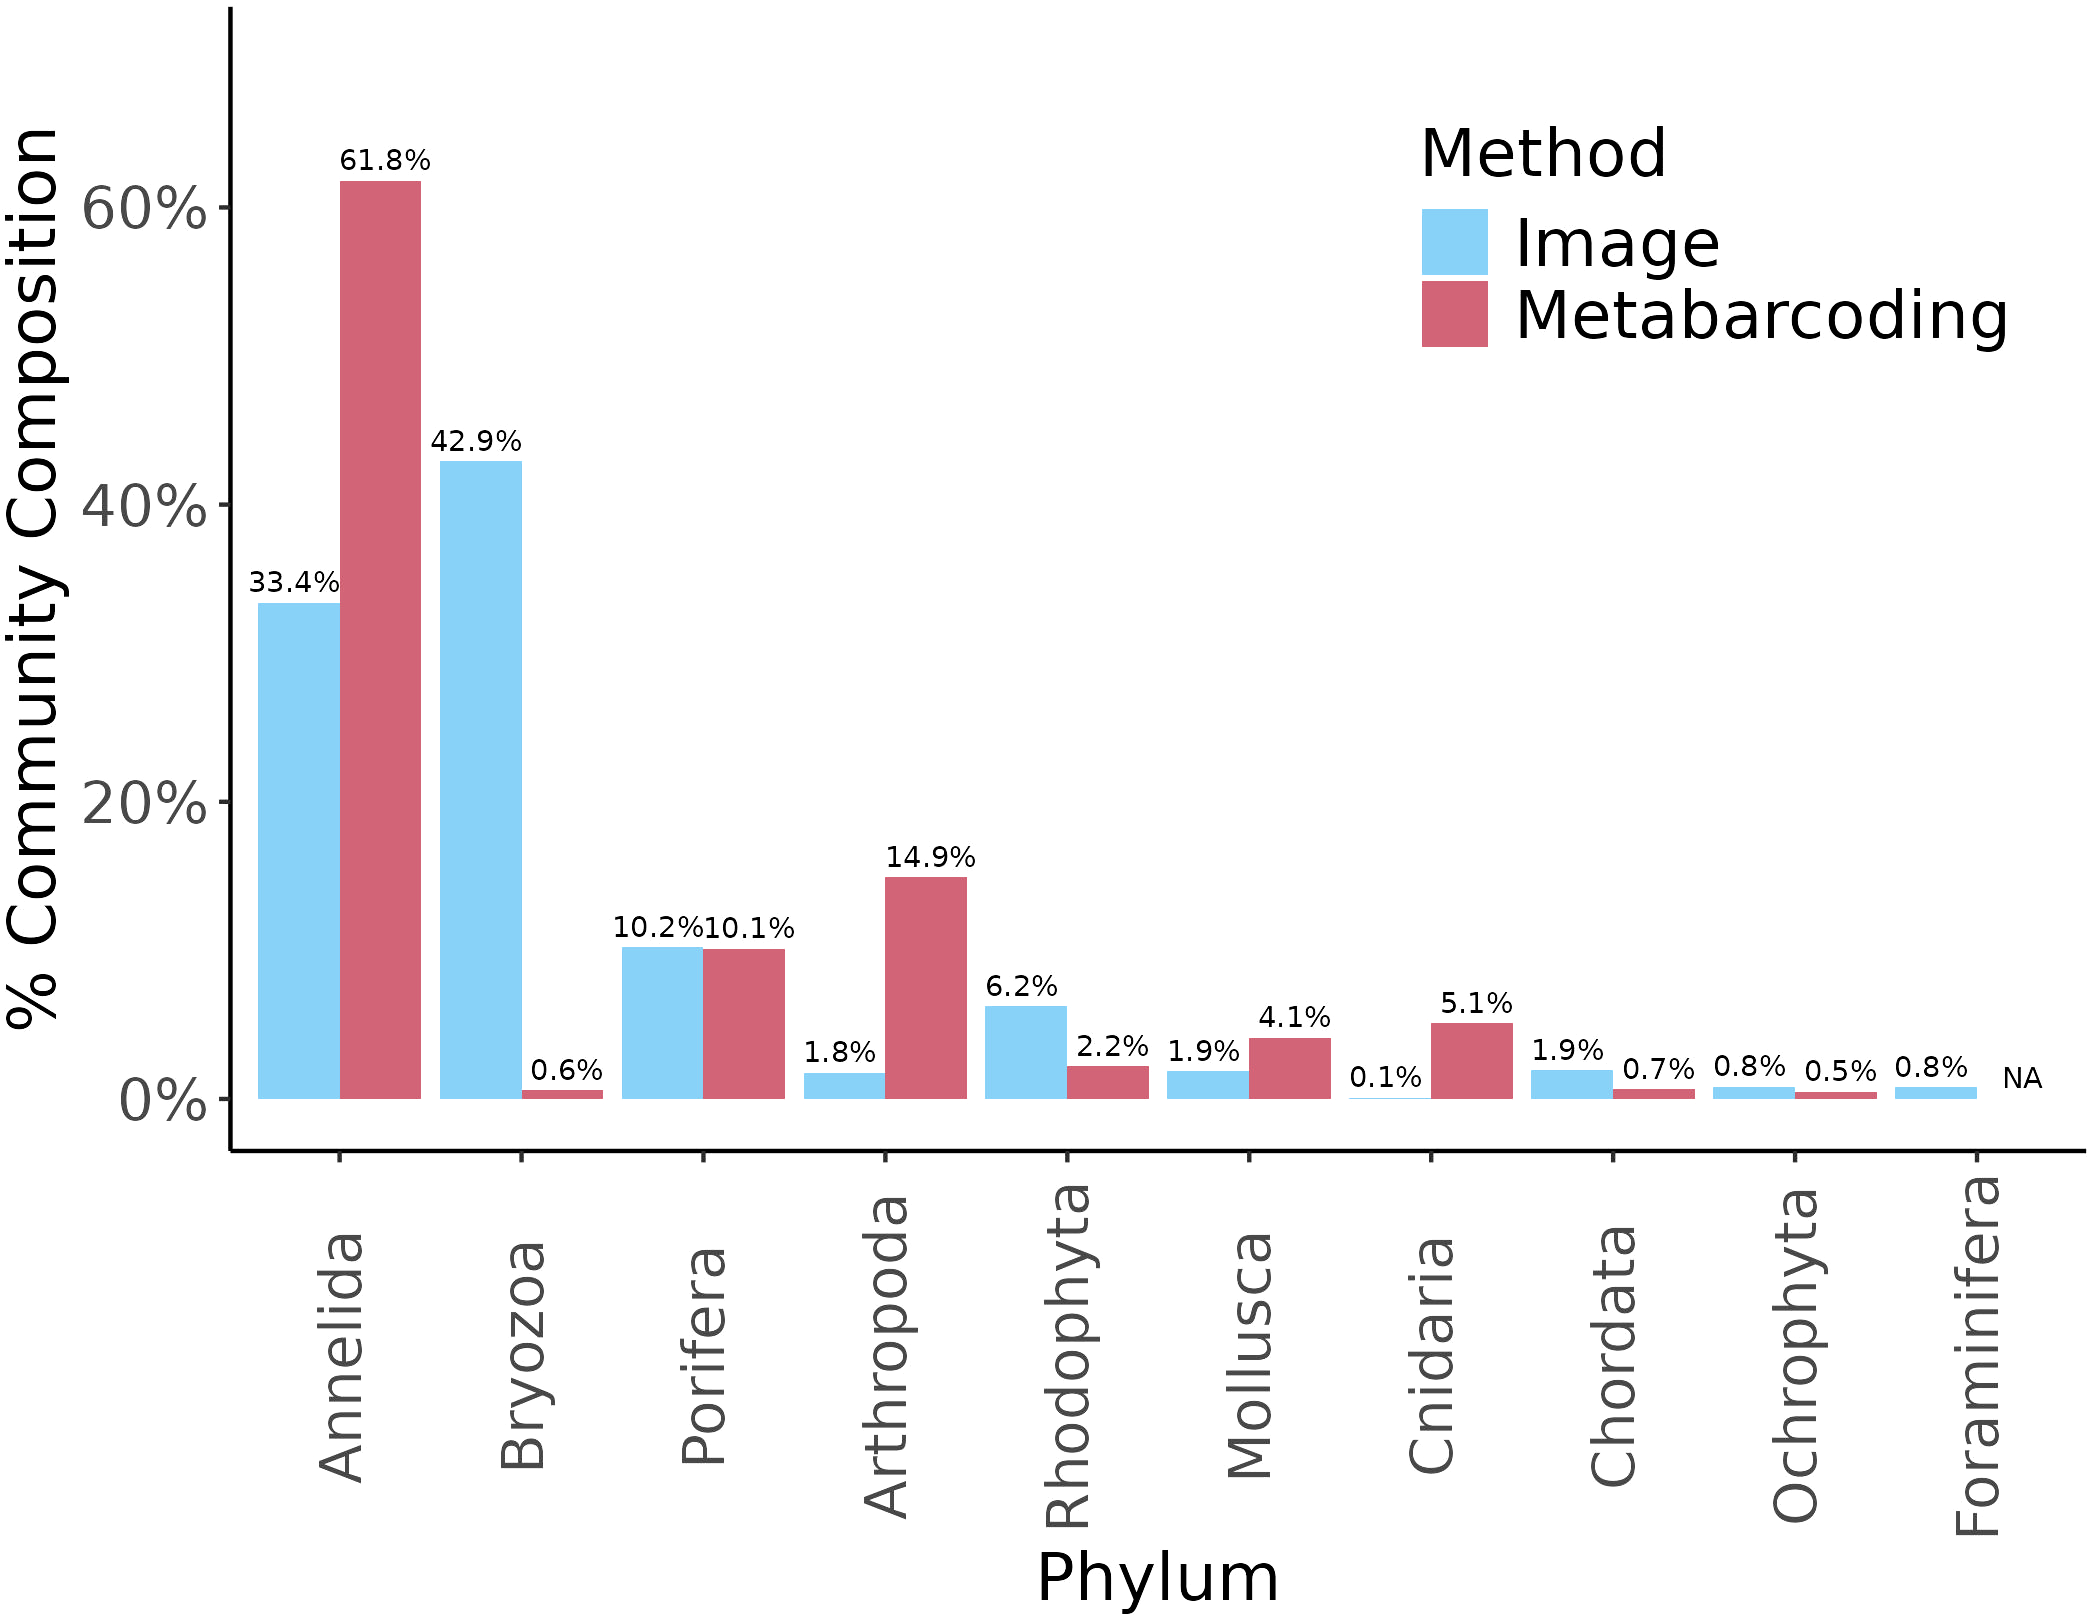
Relative abundance of sessile phyla summed across ARMS units retrieved from image (blue) and rarefied metabarcoding (red) datasets.
Discussion
Here we recovered a diverse benthic community in an important UK seabed recovery zone, highlighting the utility of ARMS for seabed biomonitoring. In total, 176 genera were identified across 22 eukaryotic phyla using image analysis, barcoding, and metabarcoding approaches, which included 15 species of interest. We observed that after one-and-a-half years, sessile organisms covered about half (57.9%) of available ARMS plate surfaces, providing habitat to 1,920 motile specimens with a biomass of 312 g across just 0.15 m2 of planar space. Additionally, metabarcoding detected the presence of 215 eukaryotic OTUs.
Using ARMS provides a more detailed visual analysis of sessile benthic taxonomic richness compared to previous efforts that are biased toward conspicuous taxa such as diver surveys (Seasearch, 2025), towed video cameras (Mallinson and Yesson, 2021), and baited remote underwater video cameras (Clark et al., 2024). Because these methods rely on visual inspection of the habitat surface through the water column, they are prone to under-detection of the small or cryptic organisms (Bozec et al., 2011; Willis, 2001; Cresswell et al., 2021; Lowry et al., 2012) that comprise the majority of benthic biodiversity (Steyaert et al., 2022a). In contrast, image analysis of ARMS plate faces facilitates identification of small and cryptic organisms by exposing the habitat matrix interior and obviating visibility bias caused by factors such as water turbidity (Durden et al., 2016), camera orientation (Durden et al., 2016), and habitat complexity (Cresswell et al., 2021). This is evident when comparing our results to Mallinson and Yesson (2021) towed video camera census in Sussex, which identified sessile animalia from 4 phyla (Annelida, Bryozoa, Cnidaria, Porifera); ARMS image analysis identified sessile animalia from 8 phyla (the same plus Arthropoda, Mollusca, Chordata, and Foraminifera), and included small organisms such as barnacles and tunicates that are unlikely to be evident in towed video images.
ARMS also provide the opportunity to collect benthic samples for molecular analysis in a non-destructive and standardized way, while still recovering diverse epibenthic communities. Previous UK environmental DNA biodiversity monitoring studies have typically sampled DNA from the demersal layer (water above the benthos; Clark et al., 2024) or sediment cores (Steyaert et al., 2020), and protocols have recently been developed for eDNA benthic sampling from boat grabs (e.g. Van Veen grabs or box cores) for the statutory monitoring of benthic species and habitats of conservation importance (NatureMetrics, 2022). However, while demersal samples are far easier to obtain, they fail to detect species that are embedded in the sediment (e.g. crustaceans and molluscs; Le Joncour et al., 2024), and in reef crevices (Nichols et al., 2022). They have also been shown to be a poor proxy for the analysis of benthic structure compared to direct sampling methods (Antich et al., 2021), potentially underrepresenting groups such as polychaetes, shrimps, mollusks, brittle stars, and red algae (Nichols et al., 2022). In contrast, while eDNA sampling from sediment cores and grabs likely provide more pertinent information about benthic community structure, these methods are destructive to natural ecosystems and are likely difficult to sample in a standardized way when dominated by mixed or rocky substrate due to the complex structure of hard habitats (Rees, 2009). ARMS plug this gap for UK biodiversity monitoring by providing a standardized sample area and access to communities found in three-dimensional habitats, such as those found living on rocky reefs, seagrass and kelp.
In addition to providing more complete biodiversity estimates, these results demonstrate the ability of ARMS to non-destructively recover both species of conservation value and invasive species. Included in this list is Ostrea edulis, Rhodymenia delicatula, Crepidula fornicata, and Cephalothrix simula. O. edulis has seen massive declines with urgent need for active management (Helmer et al., 2019), making in situ observations valuable. Nationally vulnerable red seaweed R. delicatula is predominantly reported from SW England, Wales and West Scotland, with no recent observations in the eastern Channel (Brodie et al., 2023), thus expanding our knowledge of its current distribution is important. The observed invasive C. fornicata has been shown to alter benthic community composition and trophic structure (Martin et al., 2006; Joint Nature Conservation Committee (JNCC), 2025), and the invasive C. simula is notable because its tissue contains Tetrodotoxin (TTX), a potent neurotoxin (Turner et al., 2018), with an individual worm potentially carrying lethal doses of TTX for humans (Asakawa et al., 2013). Although the sample first reported in the UK was below the lethal dose, it is nonetheless important to understand the distribution of C. simula in the UK due to its co-occurrence with shellfish and potential to enter the food supply (Turner et al., 2018). With only two other confirmed records in the UK, both in Southern England (Dhanji-Rapkova et al., 2024; Holman et al., 2019), our study presents a valuable data point about its distribution.
No kelp taxa (families Laminariaceae, Phyllariaceae) were identified in our study. Notably, the pseudo-kelp Saccorhiza polyschides is commonly observed near the deployment site (Ray Ward pers. com.) but was not recovered. However, testing the metabarcoding primers versus publicly accessible COI accessions for this species shows a 5 base pair mismatch for this species in the forward primer. This highlights the value of understanding primer applicability for local species of interest. To date this research has focused on particular taxa such as fish (e.g. Schenekar et al., 2020), rather than habitat forming benthic species.
Metabarcoding studies also depend on quality reference sequences for the identification of organisms (Weigand et al., 2019). However, there are currently large taxonomic gaps in marine barcoding databases, particularly for marine invertebrate COI sequences in the EU (Weigand et al., 2019), hampering taxonomic assignment, particularly to the species level (Wort et al., 2022). We show that species level identification rates vary greatly for UK marine benthic habitats. For example, 15% of Arthropoda OTUs and 47% of Porifera OTUs were left unidentified at the species level. Some less abundant phyla such as Nematoda had no OTUs assigned at the species level. This lack of species level information makes confirmation of range extensions difficult and makes it challenging to understand the impact of conservation measures on marine biodiversity. While direct sampling of biomass is best suited for building taxonomies (Nichols et al., 2022), it is challenging to obtain these samples from benthic grabs, where the community has been mixed and crushed. ARMS provide the opportunity to collect clean samples for barcoding, which would greatly improve our taxonomic coverage of UK marine benthic taxa in reference databases.
The combination of image and molecular analysis of ARMS communities can provide important insights for benthic biomonitoring. Few studies to date have analysed images from ARMS plates (Sembiring et al., 2023; Steyaert et al., 2022a, 2022; David et al., 2019), and even fewer in combination with metabarcoding (Casey et al., 2021; Lee et al., 2024). Here, integrating ARMS image data resulted in the identification of four species of special interest that are not present in our metabarcoding libraries and provided a less costly alternative to metabarcoding. However, the resulting biodiversity data from both methods need to be interpreted with care. While our study found that metabarcoding and image analysis produced highly similar estimates for sponge abundance, for other phyla, different results were obtained across methods. Metabarcoding detected 9 out of the 10 phyla identified by image analysis. Foraminifera, the only phylum not identified by metabarcoding, requires taxon specific primers (Macher et al., 2022). Metabarcoding retrieved higher abundances of motile phyla (e.g. Arthropoda) and Cnidaria (e.g. hydroids), both of which are difficult to pick up from images. In contrast, image analysis retrieved significantly higher abundances of Bryozoa, which are one of the most abundant and diverse groups of invertebrates in coastal marine ecosystems, but are underrepresented in genetic databases due to the difficulty of sampling (Dick et al., 2005). These results highlight strength in using both methods. However, the accumulating global dataset of ARMS images is a vastly untapped resource, and with the use of machine-learning approaches such as CoralNet’s neural networks, may provide expedited and important outputs when analysed alongside key environmental and anthropogenic variables.
A further untapped use of ARMS is their ability to provide standardized biomass-size spectrum data of benthic communities. Here we show that while morphotypes identified in this study were similar to the number retrieved in other temperate studies (e.g. in Virginia, USA 38 morphotypes were retrieved from 9 ARMS after a 6 month deployment; Leray and Knowlton, 2015), we retrieved significantly more large (>2mm) specimens (n = 1,920) than other studies. The number of large motile specimens identified here from 3 ARMS is almost 5x greater than the 498 specimens across 9 ARMS in Virgina. It is also ~3x greater than the 725 specimens identified from 12 ARMS deployed for 24 months in Singapore (Chang et al., 2020). In size-based ecosystem modelling, the biomass-size spectrum is the most widely used method to express the size structure of a community (Blanchard et al., 2017) and refers to the distribution of living biomass across organism size range (Tung et al., 2023). It has been applied in many settings, including in benthic intertidal communities, showing that the physical environment affects communities by creating habitats for organisms of different size classes (Schwinghamer et al., 1986). Communities of different size spectrums may carve distinct niches by influencing biological processes (e.g. metabolism and carbon flux; Blanchard et al., 2017) and deviations in size spectrum may be used to identify environmental impacts (Tung et al., 2023). For example, as larger organisms have higher energetic requirements, slower growth, and lower reproductive output (Brey, 1999), they are more vulnerable to environmental disturbances (Austen and Widdicombe, 2006). Given the history of bottom trawling as well as the concerns about pollution in Sussex waters (Williams and Davies, 2019), the large abundance of small organisms found here may be a direct response to the degraded environment or a result of species flux during recovery at our sites, as has been noted in other coastal ecosystems (Duarte et al., 2015). We suggest that biomass, size and count data is useful to collect and share across ARMS studies and could provide data about environmental disturbance and ecosystem function for UK biomonitoring.
Conclusion
Although ARMS were originally designed to mimic the matrix of coral reefs (Zimmerman and Martin, 2004), deployments in polar and temperate regions have demonstrated that they have broader applicability to benthic biodiversity monitoring (Autonomous Reef Monitoring Structures - Marine Biodiversity Observation Network (ARMS-MBON), 2025). Our results highlight the variety of applications of the multidimensional data collected under standardized ARMS protocols. This includes describing patterns of community composition and abundance, identifying species that are invasive or of conversation value, improving sequence reference libraries, and gaining information on ecosystem function and environmental disturbance in a non-destructive way. The processing of ARMS is time-intensive and so we do not recommend that these tools supersede less time-intensive methods, such as eDNA sampling, or established methods such as benthic grabs. Rather we advocate for the use of ARMS as a tool to ground truth eDNA methods, provide important benthic data that other methods cannot, and establish trends in sensitive habitats (e.g. MPAs) where benthic grabs are not warranted.
Statements
Data availability statement
The raw data supporting the conclusions of this article will be made available by the authors, without undue reservation.
Ethics statement
Ethical approval was not required for the study involving animals in accordance with the local legislation and institutional requirements because research involved the collection of surplus material for DNA analysis and did not involve the removal of material from any natural habitat.
Author contributions
MJ: Data curation, Formal Analysis, Investigation, Methodology, Visualization, Writing – original draft. MS: Conceptualization, Funding acquisition, Investigation, Methodology, Project administration, Supervision, Writing – review & editing. NN: Data curation, Formal Analysis, Investigation, Methodology, Visualization, Writing – review & editing. KH: Methodology, Supervision, Writing – review & editing. RW: Investigation, Resources, Writing – review & editing. CY: Conceptualization, Funding acquisition, Investigation, Project administration, Supervision, Writing – review & editing. ER: Conceptualization, Funding acquisition, Investigation, Project administration, Supervision, Writing – review & editing.
Funding
The author(s) declared that financial support was received for this work and/or its publication. The Sussex Kelp Recovery Project provided funds for deployment and recovery of ARMS.
Conflict of interest
The authors declared that this work was conducted in the absence of any commercial or financial relationships that could be construed as a potential conflict of interest.
Generative AI statement
The author(s) declared that generative AI was not used in the creation of this manuscript.
Any alternative text (alt text) provided alongside figures in this article has been generated by Frontiers with the support of artificial intelligence and reasonable efforts have been made to ensure accuracy, including review by the authors wherever possible. If you identify any issues, please contact us.
Publisher’s note
All claims expressed in this article are solely those of the authors and do not necessarily represent those of their affiliated organizations, or those of the publisher, the editors and the reviewers. Any product that may be evaluated in this article, or claim that may be made by its manufacturer, is not guaranteed or endorsed by the publisher.
Supplementary material
The Supplementary Material for this article can be found online at: https://www.frontiersin.org/articles/10.3389/fmars.2025.1674917/full#supplementary-material
Supplementary Figure 1NMDS of Image Analysis Functional Grouping Community Composition x Plate Face.
Supplementary Figure 2Boxplots of Percentage Cover Between Plate Faces.
References
1
Antich A. Palacín C. Cebrian E. Golo R. Wangensteen O. S. Turon X. (2021). Marine biomonitoring with eDNA: Can metabarcoding of water samples cut it as a tool for surveying benthic communities? Mol. Ecology.30, 3175–3188. doi: 10.1111/mec.15641
2
Asakawa M. Ito K. Kajihara H. (2013). Highly toxic ribbon worm cephalothrix simula containing tetrodotoxin in hiroshima bay, hiroshima prefecture, Japan. Toxins.5, 376–395. doi: 10.3390/toxins5020376
3
Austen M. C. Widdicombe S. (2006). Comparison of the response of meio-and macrobenthos to disturbance and organic enrichment. J. Exp. Mar. Biol. Ecol.330, 96–104. doi: 10.1016/j.jembe.2005.12.019
4
Autonomous Reef Monitoring Structures - Marine Biodiversity Observation Network (ARMS-MBON) (2025). ARMS-MBON home page. Available online at: https://data.arms-mbon.org/ (Accessed July 18, 2025).
5
Bánki O. Roskov Y. Döring M. Ower G. Hernández Robles D. R. Plata Corredor C. A. et al . (2024). Catalogue of life (Version 2024-11-18). Available online at: https://www.catalogueoflife.org/ (Accessed November 30, 2024).
6
Barnett D. Arts I. Penders J. (2021). microViz: an R package for microbiome data visualization and statistics. J. Open Source Software6, 3201. doi: 10.21105/joss.03201
7
Blanchard J. L. Heneghan R. F. Everett J. D. Trebilco R. Richardson A. J. (2017). From bacteria to whales: using functional size spectra to model marine ecosystems. Trends Ecol. Evolution.32, 174–186. doi: 10.1016/j.tree.2016.12.003
8
Bozec Y.-M. Kulbicki M. Laloë F. Mou-Tham G. Gascuel D. (2011). Factors affecting the detection distances of reef fish: implications for visual counts. Mar. Biol.158, 969–981. doi: 10.1007/s00227-011-1623-9
9
Brey T. (1999). “ Growth Performance and Mortality in Aquatic Macrobenthic Invertebrates,” in Advances in Marine Biology (UK: Elsevier), 153–223. doi: 10.1016/s0065-2881(08)60005-x
10
Brodie J. Wilbraham J. Maggs C. A. Baldock L. Bunker F. Mieszkowska N. et al . (2023). Red List for British seaweeds: evaluating the IUCN methodology for non-standard marine organisms. Biodiversity Conserv.32, 3825–3843. doi: 10.1007/s10531-023-02649-0
11
Buchner D. Leese F. (2020). BOLDigger – a Python package to identify and organise sequences with the Barcode of Life Data systems. Metabarcoding Metagenomics.4, e53535. doi: 10.3897/mbmg.4.53535
12
Bugnot A. B. Mayer-Pinto M. Airoldi L. Heery E. C. Johnston E. L. Critchley L. P. et al . (2020). Current and projected global extent of marine built structures. Nat. Sustainability.4, 33–41. doi: 10.1038/s41893-020-00595-1
13
Burns F. Mordue S. al Fulaij N. Boersch-Supan P. H. Boswell J. Boyd R. J. et al . (2023). State of nature 2023 (UK: State of Nature partnership). doi: 10.13140/RG.2.2.20636.26245
14
Callahan B. J. McMurdie P. J. Rosen M. J. Han A. W. Johnson A. J. A. Holmes S. P. (2016). DADA2: High-resolution sample inference from Illumina amplicon data. Nat. Methods13, 581–583. doi: 10.1038/nmeth.3869
15
Camacho C. Coulouris G. Avagyan V. Ma N. Papadopoulos J. Bealer K. et al . (2009). BLAST+: architecture and applications. BMC Bioinf.10, 421. doi: 10.1186/1471-2105-10-421
16
Casey J. M. Ransome E. Collins A. G. Mahardini A. Kurniasih E. M. Sembiring A. et al . (2021). DNA metabarcoding marker choice skews perception of marine eukaryotic biodiversity. Environ. DNA.3, 1229–1246. doi: 10.1002/edn3.245
17
Cecchetto M. Dettai A. Gallut C. Obst M. Kuklinski P. Balazy P. et al . (2024). Seasonality of primary production explains the richness of pioneering benthic communities. Nat. Commun.15, 8340. doi: 10.1038/s41467-024-52673-z
18
Chang J. J. M. Ip Y. C. A. Bauman A. G. Huang D. (2020). MinION-in-ARMS: nanopore sequencing to expedite barcoding of specimen-rich macrofaunal samples from autonomous reef monitoring structures. Front. Mar. Sci.7. doi: 10.3389/fmars.2020.00448
19
Clark A. J. Atkinson S. R. Scarponi V. Cane T. Geraldi N. R. Hendy I. W. et al . (2024). Cost-effort analysis of Baited Remote Underwater Video (BRUV) and environmental DNA (eDNA) in monitoring marine ecological communities. PeerJ.12, e17091. doi: 10.7717/peerj.17091
20
CoralNet (2024). CoralNet. Available online at: https://coralnet.ucsd.edu/ (Accessed November 7, 2024).
21
Costello M. J. Dekeyzer S. Galil B. Hutchings P. Katsanevakis S. Pagad S. et al . (2021). Introducing the world register of introduced marine species (WRiMS). Manage. Biol. Invasions.12, 792–811. doi: 10.3391/mbi.2021.12.4.02
22
Cresswell A. K. Ryan N. M. Heyward A. J. Smith A. N. H. Colquhoun J. Case M. et al . (2021). A quantitative comparison of towed-camera and diver-camera transects for monitoring coral reefs. PeerJ.9, e11090. doi: 10.7717/peerj.11090
23
David R. Uyarra M. C. Carvalho S. Anlauf H. Borja A. Cahill A. E. et al . (2019). Lessons from photo analyses of Autonomous Reef Monitoring Structures as tools to detect (bio-)geographical, spatial, and environmental effects. Mar. pollut. Bulletin.141, 420–429. doi: 10.1016/j.marpolbul.2019.02.066
24
de Goeij J. M. Van Duyl F. C. (2007). Coral cavities are sinks of dissolved organic carbon (DOC). Limnology Oceanography.52, 2608–2617. doi: 10.4319/lo.2007.52.6.2608
25
de Goeij J. M. Van Oevelen D. Vermeij M. J. A. Osinga R. Middelburg J. J. De Goeij A. F. P. M. et al . (2013). Surviving in a marine desert: the sponge loop retains resources within coral reefs. Science.342, 108–110. doi: 10.1126/science.1241981
26
de los Santos C. B. Krause-Jensen D. Alcoverro T. Marbà N. Duarte C. M. van Katwijk M. M. et al . (2019). Recent trend reversal for declining European seagrass meadows. Nat. Commun.10, 3356. doi: 10.1038/s41467-019-11340-4
27
Department for Environment, Food and Rural Affairs (DEFRA) (2021). Outcome indicator framework for the 25 year environment plan: 2021 update. Available online at: https://assets.publishing.service.gov.uk/media/60c23609e90e0743ae8c28e2/Outcome_Indicator_Framework_for_the_25_Year_Environment_Plan_2021_Update.pdf (Accessed April 11, 2025).
28
Department for Environment, Food and Rural Affairs (DEFRA) (2023). Environmental improvement plan 2023. Available online at: https://www.gov.uk/government/publications/environmental-improvement-plan (Accessed September 18, 2024).
29
Department for Environment, Food and Rural Affairs (DEFRA) (2024a). Outcome indicator framework for the 25 year environment plan. Available online at: https://oifdata.defra.gov.uk/ (Accessed October 21, 2024).
30
Department for Environment, Food and Rural Affairs (DEFRA) (2024b). Proposed fisheries management plan for queen scallop in English waters. Available online at: https://consult.defra.gov.uk/fisheries-management-plans-1/queen-scallop-fmp-consultation/supporting_documents/Proposed%20Queen%20scallop%20FMP.pdf (Accessed March 14, 2025).
31
Department for Environment, Food and Rural Affairs (DEFRA) (2024c). Proposed fisheries management plan for Southern North Sea and Channel skates and rays. Available online at: https://consult.defra.gov.uk/fisheries-management-plans-1/skates-and-rays-fmp-consultation/supporting_documents/Proposed%20SNS%20and%20Channel%20Skates%20and%20Rays%20FMP.pdf (Accessed March 14, 2025).
32
De Smet B. D’Hondt A.-S. Verhelst P. Fournier J. Godet L. Desroy N. et al . (2015). Biogenic reefs affect multiple components of intertidal soft-bottom benthic assemblages: the Lanice conChilega case study. Estuarine Coast. Shelf Science.152, 44–55. doi: 10.1016/j.ecss.2014.11.002
33
Devon and Severn Inshore Fisheries and Conservation Authority (IFCA) (2017). Report for D&S IFCA byelaw and permitting subCommittee – may 2017. Available online at: https://www.devonandsevernifca.gov.uk/wp-content/uploads/2023/09/FinalMobilefishing3yearreviewforSubComMay2017.pdf (Accessed March 14, 2025).
34
Dhanji-Rapkova M. Hatfield R. G. Walker D. I. Hooper C. Alewijnse S. Baker-Austin C. et al . (2024). Investigating non-native ribbon worm cephalothrix simula as a potential source of tetrodotoxin in british bivalve shellfish. Mar. Drugs22, 458. doi: 10.3390/md22100458
35
Díaz S. Settele J. Brondízio E. S. Ngo H. T. Agard J. Artneth A. et al . (2019). Pervasive human-driven decline of life on Earth points to the need for transformative change. Science366, eaax3100. doi: 10.1126/science.aax3100
36
Dick M. H. Grischenko A. V. Mawatari S. F. (2005). Intertidal bryozoa (Cheilostomata) of ketchikan, alaska. J. Natural History.39, 3687–3784. doi: 10.1080/00222930500415195
37
do Amaral Camara Lima M. Bergamo T. F. Ward R. D. Joyce C. B. (2023). A review of seagrass ecosystem services: providing nature-based solutions for a changing world. Hydrobiologia850, 2655–2670. doi: 10.1007/s10750-023-05244-0
38
Duarte C. M. Borja A. Carstensen J. Elliott M. Krause-Jensen D. Marbà N. et al . (2015). Paradigms in the recovery of estuarine and coastal ecosystems. Estuaries Coasts38, 1202–1212. doi: 10.1007/s12237-013-9750-9
39
Durden J. M. Schoening T. Althaus F. Friedman A. Garcia R. Glover A. G. et al . (2016). Perspectives in visual imaging for marine biology and ecology: from acquisition to understanding. Oceanography Mar. Biology: Annu. Rev.54, 1–72. doi: 10.1201/9781315368597
40
Eger A. M. Marzinelli E. M. Beas-Luna R. Blain C. O. Blamey L. K. Jarrett E. K. et al . (2023). The value of ecosystem services in global marine kelp forests. Nat. Commun.14, 1894. doi: 10.1038/s41467-023-37385-0
41
Ellis J. Dulvy N. Walls R. Serena F. (2016). “ Raja clavata (Europe assessment),” in The IUCN red list of threatened species 2016 (Gland, Switzerland: IUCN), e.T39399A103111648. Available online at: https://www.iucnredlist.org/ja/species/39399/103111648assessment-information (Accessed March 14, 2025).
42
Environment Act (2021). Environment act 2021. Available online at: https://www.legislation.gov.uk/ukpga/2021/30/part/1/chapter/1/crossheading/environmental-targets (Accessed September 18, 2024).
43
Frøslev T. G. Kjøller R. Bruun H. H. Ejrnæs R. Brunbjerg A. K. Pietroni C. et al . (2017). Algorithm for post-clustering curation of DNA amplicon data yields reliable biodiversity estimates. Nat. Commun.8, 1188. doi: 10.1038/s41467-017-01312-x
44
Gast G. Wiegman S. Wieringa E. Van Duyl F. Bak R. (1998). Bacteria in coral reef water types:removal of cells, stimulation of growth and mineralization. Mar. Ecol. Prog. Series.167, 37–45. doi: 10.3354/meps167037
45
Global Biodiversity Information Facility (GBIF) (2025). GBIF home page. Available online at: https://www.gbif.org (Accessed February 3, 2025).
46
Helmer L. Farrell P. Hendy I. Harding S. Robertson M. Preston J. (2019). Active management is required to turn the tide for depleted Ostrea edulis stocks from the effects of overfishing, disease and invasive species. PeerJ.7, e6431. doi: 10.7717/peerj.6431
47
Hinchen H. Gallyot J. Carter A. Ferguson M. Webb K. Nelson M. et al . (2021). Detecting the impacts on UK sublittoral rock communities of resuspended sediments from fishing activity. Ecol. Indicators.125, 107545. doi: 10.1016/j.ecolind.2021.107545
48
Holman L. E. De Bruyn M. Creer S. Carvalho G. Robidart J. Rius M. (2019). Detection of introduced and resident marine species using environmental DNA metabarcoding of sediment and water. Sci. Rep.9, 11559. doi: 10.1038/s41598-019-47899-7
49
Howson C. M. Picton B. E. (Eds.) (1997). The species directory of the marine fauna and flora of the british isles and surrounding seas. 2nd ed (Belfast: Ulster Museum).
50
Joint Nature Conservation Committee (JNCC) (2017). Assessment of the status of benthic habitats. Available online at: https://jncc.gov.uk/media/4075/msfd_ospar_-benthic-overview_project_summaryv05_edited.pdf (Accessed July 20, 2025).
51
Joint Nature Conservation Committee (JNCC) (2025). Pressure from invasive species. Available online at: https://jncc.gov.uk/our-work/ukbi-invasive-species (Accessed February 9, 2025).
52
Jones A. G. Dubois S. F. Desroy N. Fournier J. (2018). Interplay between abiotic factors and species assemblages mediated by the ecosystem engineer Sabellaria alveolata (Annelida: Polychaeta). Estuarine Coast. Shelf Science.200, 1–18. doi: 10.1016/j.ecss.2017.10.001
53
Jones B. L. Unsworth R. K. F. (2016). The perilous state of seagrass in the British Isles. R. Soc. Open Science.3, 150596. doi: 10.1098/rsos.150596
54
Kennon N. A. Robertson-Jones A. Jemmett S. Hugh-Jones T. Bell M. C. Sanderson W. G. (2023). Rotational fishing enables biodiversity recovery and provides a model for oyster (Ostrea edulis) habitat restoration J.A. Fernández Robledo (ed.). PloS One18, e0283345. doi: 10.1371/journal.pone.0283345
55
Kostylev V. E. Erlandsson J. Ming M. Y. Williams G. A. (2005). The relative importance of habitat complexity and surface area in assessing biodiversity: Fractal application on rocky shores. Ecol. Complexity.2, 272–286. doi: 10.1016/j.ecocom.2005.04.002
56
Kritzer J. P. DeLucia M.-B. Greene E. Shumway C. Topolski M. F. Thomas-Blate J. et al . (2016). The importance of benthic habitats for coastal fisheries. BioScience.66, 274–284. doi: 10.1093/biosci/biw014
57
Lamirand M. Lozada-Misa P. Vargas-Ángel B. Couch C. Schumacher B. D. Winston M. (2022). Analysis of Benthic Survey Images via CoralNet: A Summary of Standard Operating Procedures and Guidelines, (2022 update) (Honolulu: National Oceanic and Atmospheric Administration). doi: 10.25923/NHX2-6J45
58
Lee K. T. Kim T. Park G. H. Oh C. Park H. S. Kang D. H. et al . (2024). Assessment of sessile benthic communities in jeju island, Republic of Korea, using autonomous reef monitoring structures (ARMS). Diversity.16, 83. doi: 10.3390/d16020083
59
Le Joncour A. Mouchet M. Boussarie G. Lavialle G. Pennors L. Bouche L. et al . (2024). Is it worthy to use environmental DNA instead of scientific trawling or video survey to monitor taxa in soft-bottom habitats? Mar. Environ. Res.200, 106667. doi: 10.1016/j.marenvres.2024.106667
60
Leray M. Knowlton N. (2015). DNA barcoding and metabarcoding of standardized samples reveal patterns of marine benthic diversity. Proc. Natl. Acad. Sci.112, 2076–2081. doi: 10.1073/pnas.1424997112
61
Leray M. Knowlton N. Machida R. J. (2022). MIDORI2: A collection of quality controlled, preformatted, and regularly updated reference databases for taxonomic assignment of eukaryotic mitochondrial sequences. Environ. DNA.4, 894–907. doi: 10.1002/edn3.303
62
Leray M. Yang J. Y. Meyer C. P. Mills S. C. Agudelo N. Ranwez V. et al . (2013). A new versatile primer set targeting a short fragment of the mitochondrial COI region for metabarcoding metazoan diversity: Application for characterizing coral reef fish gut contents. Front. Zoology.10. doi: 10.1186/1742-9994-10-34
63
Lowry M. Folpp H. Gregson M. Suthers I. (2012). Comparison of baited remote underwater video (BRUV) and underwater visual census (UVC) for assessment of artificial reefs in estuaries. J. Exp. Mar. Biol. Ecology.416–417, 243–253. doi: 10.1016/j.jembe.2012.01.013
64
Macher J.-N. Bloska D. M. Holzmann M. Girard E. B. Pawlowski J. Renema W. (2022). Mitochondrial cytochrome c oxidase subunit I (COI) metabarcoding of Foraminifera communities using taxon-specific primers. PeerJ.10, e13952. doi: 10.7717/peerj.13952
65
Mallinson S. Yesson C. (2021). Comparing benthic seaweed communities within Sussex in 2019 and 2020 through towed video transects. A report to Sussex Inshore Fisheries and Conservation Authority. Available online at: https://secure.toolkitfiles.co.uk/clients/34087/sitedata/files/Conservation-Research/Video-Survey-Report-2019-2020.pdf (Accessed June 3, 2024).
66
Marine Life Information Network (MarLIN) (2016). Marine life information network. Plymouth: marine biological association of the United Kingdom. Available online at: https://www.marlin.ac.uk (Accessed February 3, 2025).
67
Martin S. Thouzeau G. Chauvaud L. Jean F. Guérin L. Clavier J. (2006). Respiration, calcification, and excretion of the invasive slipper limpet, Crepidula fornicata L.: Implications for carbon, carbonate, and nitrogen fluxes in affected areas. Limnology Oceanography.51, 1996–2007. doi: 10.4319/lo.2006.51.5.1996
68
Meyer C. P. (2003). Molecular systematics of cowries (Gastropoda: Cypraeidae) and diversification patterns in the tropics. Biol. J. Linn. Society.79, 401–459. doi: 10.1046/J.1095-8312.2003.00197.X
69
Mikryukov V. (2023). metagMisc: Miscellaneous functions for metagenomic analysis. Available online at: https://github.com/vmikk/metagMisc (Accessed January 16, 2025).
70
Murali A. Bhargava A. Wright E. S. (2018). IDTAXA: a novel approach for accurate taxonomic classification of microbiome sequences. Microbiome.6, 140. doi: 10.1186/s40168-018-0521-5
71
National Biodiversity Network (NBN) Trust (2024). The national biodiversity network (NBN) atlas. Available online at: https://nbnatlas.org/ (Accessed February 3, 2025).
72
NatureMetrics (2022). Protocol for sampling marine benthic sediment for DNA-based analysis (Peterborough: JNCC).
73
Nichols P. K. Timmers M. Marko P. B. (2022). Hide ‘n seq: Direct versus indirect metabarcoding of coral reef cryptic communities. Environ. DNA.4, 93–107. doi: 10.1002/edn3.203
74
Nishikawa T. Bishop J. D. D. Sommerfeldt A. D. (2000). Occurrence of the alien ascidian Perophora japonica at Plymouth. J. Mar. Biol. Assoc. United Kingdom.80, 955–956. doi: 10.1017/S0025315400003003
75
Noble-James T. Bullimore R. McBreen F. O’Connor J. Highfield J. McCabe C. et al . (2023). Monitoring benthic habitats in English Marine Protected Areas: Lessons learned, challenges and future directions. Mar. Policy.157, 105852. doi: 10.1016/j.marpol.2023.105852
76
Office for Environmental Protection (2024). Progress in improving the natural environment in England 2022/2023. Available online at: https://www.gov.uk/government/publications/progress-in-improving-the-natural-environment-in-england-2022-to-2023 (Accessed February 9, 2025).
77
Office for Natural Statistics (2021). Marine accounts, natural capital, UK: 2021. Available online at: https://www.ons.gov.uk/economy/environmentalaccounts/bulletins/marineaccountsnaturalcapitaluk/2021 (Accessed February 9, 2025).
78
Ogiso-Tanaka E. Shimada D. Ogawa A. Ishiyama G. Okumura K. Hosaka K. et al . (2025). DNA specimen preservation using DESS and DNA extraction in museum collections. Biology.14, 730. doi: 10.3390/biology14060730
79
Oksanen J. Simpson G. Blanchet F. Kindt R. Legendre P. Minchin P. et al . (2024). vegan: community ecology package. Available online at: https://github.com/vegandevs/vegan (Accessed February 7, 2025).
80
Oslo and Paris Conventions (OSPAR) Commission (2024a). Ostrea edulis Beds. Available online at: https://www.ospar.org/work-areas/bdc/species-habitats/list-of-threatened-declining-species-habitats/habitats/ostrea-edulis-beds (Accessed February 6, 2025).
81
Oslo and Paris Conventions (OSPAR) Commission (2024b). Sabellaria spinulosa Reefs. Available online at: https://www.ospar.org/work-areas/bdc/species-habitats/list-of-threatened-declining-species-habitats/habitats/sabellaria-spinulosa-reefs (Accessed February 6, 2025).
82
Pagnier J. Daraghmeh N. Obst M. (2025). Using the long-term genetic monitoring network ARMS-MBON to detect marine non-indigenous species along the European coasts. Biol. Invasions.27, 77. doi: 10.1007/s10530-024-03503-2
83
Ransome E. Geller J. B. Timmers M. Leray M. Mahardini A. Sembiring A. et al . (2017). The importance of standardization for biodiversity comparisons: A case study using autonomous reef monitoring structures (ARMS) and metabarcoding to measure cryptic diversity on Mo’orea coral reefs, French Polynesia. PloS One12, (4). doi: 10.1371/journal.pone.0175066
84
Rasheed M. Badran M. Richter C. Huettel M. (2002). Effect of reef framework and bottom sediment on nutrient enrichment in a coral reef of the Gulf of Aqaba, Red Sea. Mar. Ecol. Prog. Series.239, 277–285. doi: 10.3354/meps239277
85
Rees H. L. (Ed.) (2009). “ Guidelines for the study of the epibenthos of subtidal environments,” in ICES techniques in marine environmental sciences 42 ( International Council for the Exploration of the Sea, Copenhagen).
86
Rognes T. Flouri T. Nichols B. Quince C. Mahé F. (2016). VSEARCH: a versatile open source tool for metagenomics. PeerJ.4, e2584. doi: 10.7717/peerj.2584
87
Schenekar T. Schletterer M. Lecaudey L. A. Weiss S. J. (2020). Reference databases, primer choice, and assay sensitivity for environmental metabarcoding: Lessons learnt from a re-evaluation of an eDNA fish assessment in the Volga headwaters. River Res. Applications.36, 1004–1013. doi: 10.1002/rra.3610
88
Schwinghamer P. Hargrave B. Peer D. Hawkins C. (1986). Partitioning of production and respiration among size groups of organisms in an intertidal benthic community. Mar. Ecol. Prog. Series.31, 131–142. doi: 10.3354/meps031131
89
Seasearch (2025). Seasearch home page. Available online at: https://www.seasearch.org.uk (Accessed July 17, 2025).
90
Sembiring A. Malik M. D. A. Wahyudi A. Cahyani N. K. D. Pertiwi N. P. D. Yusmalinda N. L. A. et al . (2023). Utilizing the Autonomous Reef Monitoring Structure (ARMS) to study the temporal variation of benthic community on coral reef ecosystems in Pemuteran, Bali, Indonesia. Regional Stud. Mar. Sci.62, 102925. doi: 10.1016/j.rsma.2023.102925
91
Smale D. A. Burrows M. T. Moore P. O’Connor N. Hawkins S. J. (2013). Threats and knowledge gaps for ecosystem services provided by kelp forests: a northeast A tlantic perspective. Ecol. Evolution.3, 4016–4038. doi: 10.1002/ece3.774
92
Steyaert M. Lindhart M. Khrizman A. Dunbar R. B. Bonsall M. B. Mucciarone D. A. et al . (2022a). Remote reef cryptobenthic diversity: Integrating autonomous reef monitoring structures and in situ environmental parameters. Front. Mar. Science.9. doi: 10.3389/fmars.2022.932375
93
Steyaert M. Mogg A. Dunn N. Dowell R. Head C. E. I. (2022b). Observations of coral and cryptobenthic sponge fluorescence and recruitment on autonomous reef monitoring structures (ARMS). Coral Reefs.41, 877–883. doi: 10.1007/s00338-022-02283-2
94
Steyaert M. Priestley V. Osborne O. Herraiz A. Arnold R. Savolainen V. (2020). Advances in metabarcoding techniques bring us closer to reliable monitoring of the marine benthos. J. Appl. Ecology.57, 2234–2245. doi: 10.1111/1365-2664.13729
95
Sussex Inshore Fisheries and Conservation Authority (IFCA) (2019). MARINE AND COASTAL ACCESS ACT 2009 (c.23) nearshore trawling byelaw 2019. Available online at: https://secure.toolkitfiles.co.uk/clients/34087/sitedata/files/Byelaws/Nearshore-Trawling-Byelaw.pdf (Accessed March 14, 2025).
96
The Smithsonian Institution (2024). Global ARMS program: ARMS protocols. Available online at: https://naturalhistory.si.edu/research/global-arms-program/protocols (Accessed October 22, 2024).
97
Tu Do V. De Montaudouin X. Blanchet H. Lavesque N. (2012). Seagrass burial by dredged sediments: Benthic community alteration, secondary production loss, biotic index reaction and recovery possibility. Mar. pollut. Bulletin.64, 2340–2350. doi: 10.1016/j.marpolbul.2012.08.025
98
Tung C.-C. Chen Y.-T. Liao J.-X. Wei C.-L. (2023). Response of the benthic biomass-size structure to a high-energy submarine canyon. Front. Mar. Sci.10. doi: 10.3389/fmars.2023.1122143
99
Turner A. D. Fenwick D. Powell A. Dhanji-Rapkova M. Ford C. Hatfield R. G. et al . (2018). New invasive nemertean species (Cephalothrix simula) in england with high levels of tetrodotoxin and a microbiome linked to toxin metabolism. Mar. Drugs16, 452. doi: 10.3390/md16110452
100
Wang Y. Naumann U. Wright S. T. Warton D. I. (2012). mvabund– an R package for model-based analysis of multivariate abundance data. Methods Ecol. Evolution.3, 471–474. doi: 10.1111/j.2041-210X.2012.00190.x
101
Ward R. (2022). 15th July 2022 Autonomous Reef Monitoring Structures (ARMS) installation dive Sussex. Available online at: https://www.youtube.com/watch?v=IMtsfq1msz8 (Accessed March 17, 2025).
102
Watson S. C. L. Somerfield P. J. Lemasson A. J. Knights A. M. Edwards-Jones A. Nunes J. et al . (2024). The global impact of offshore wind farms on ecosystem services. Ocean Coast. Management.249, 107023. doi: 10.1016/j.ocecoaman.2024.107023
103
Weigand H. Beermann A. J. Čiampor F. Costa F. O. Csabai Z. Duarte S. et al . (2019). DNA barcode reference libraries for the monitoring of aquatic biota in Europe: Gap-analysis and recommendations for future work. Sci. Total Environment.678, 499–524. doi: 10.1016/j.scitotenv.2019.04.247
104
Williams C. Davies W. (2019). Valuing the ecosystem service benefits of kelp bed recovery off West Sussex.
105
Williams J. Pettorelli N. Dowell R. Macdonald K. Meyer C. Steyaert M. et al . (2024). SimpleMetaPipeline: Breaking the bioinformatics bottleneck in metabarcoding. Methods Ecol. Evolution.15, 1949–1957. doi: 10.1111/2041-210X.14434
106
Willis T. J. (2001). Visual census methods underestimate density and diversity of cryptic reef fishes. J. Fish Biol.59, 1408–1411. doi: 10.1111/j.1095-8649.2001.tb00202.x
107
World Registry of Marine Species (WoRMS) Editorial Board (2025). World register of marine species. Available online at: https://www.marinespecies.org (Accessed January 31, 2025).
108
Wort E. Flintham H. Good E. Bakker J. Craig H. Egeter. B. (2022). Review of DNA-based marine benthic monitoring protocols (Peterborough: JNCC). Available online at: https://data.jncc.gov.uk/data/4397e5f3-7ffd-4130-8fc2-811d693a776d/jncc-report-705-final-web.pdf (Accessed July 18, 2025).
109
Yesson C. Bush L. E. Davies A. J. Maggs C. A. Brodie J. (2015). Large brown seaweeds of the british isles: Evidence of changes in abundance over four decades. Estuarine Coast. Shelf Science.155, 167–175. doi: 10.1016/j.ecss.2015.01.008
110
Zimmerman T. L. Martin J. W. (2004). Artificial reef matrix structures (Arms): an inexpensive and effective method for collecting coral reef-associated invertebrates. Gulf Caribbean Res.16, 59–64. doi: 10.18785/gcr.1601.08
Summary
Keywords
barcoding, benthic biodiversity, kelp, marine, metabarcoding
Citation
Jordan M, Steyaert M, Ng NYN, Hopkins K, Ward RD, Yesson C and Ransome E (2026) Autonomous reef monitoring structures as a tool for assessing UK marine benthic biodiversity. Front. Mar. Sci. 12:1674917. doi: 10.3389/fmars.2025.1674917
Received
28 July 2025
Revised
26 November 2025
Accepted
27 November 2025
Published
02 February 2026
Volume
12 - 2025
Edited by
Pierre Yves Le Traon, Mercator Ocean, France
Reviewed by
Cory Douglas Bishop, St. Francis Xavier University, Canada
Hyunsung Yang, Korea Institute of Ocean Science and Technology (KIOST), Republic of Korea
Updates
Copyright
© 2026 Jordan, Steyaert, Ng, Hopkins, Ward, Yesson and Ransome.
This is an open-access article distributed under the terms of the Creative Commons Attribution License (CC BY). The use, distribution or reproduction in other forums is permitted, provided the original author(s) and the copyright owner(s) are credited and that the original publication in this journal is cited, in accordance with accepted academic practice. No use, distribution or reproduction is permitted which does not comply with these terms.
*Correspondence: Emma Ransome, e.ransome@imperial.ac.uk
Disclaimer
All claims expressed in this article are solely those of the authors and do not necessarily represent those of their affiliated organizations, or those of the publisher, the editors and the reviewers. Any product that may be evaluated in this article or claim that may be made by its manufacturer is not guaranteed or endorsed by the publisher.