 Tamara Cibic1*†
 Laura Baldassarre1†
 Rocco Auriemma1
 Cecilia Balestra1
 Elisa Banchi1
 Greta Battaggia2Matteo Bazzaro1Federica Cerino1
 Fabio De Pascale2Tommaso Diociaiuti1
 Irene Guarneri3Martina Kralj1
 Francesca Malfatti4
 Vincenzo Manna1Vanessa Natali1Federica Nasi1
 Federica Relitti1
 Alessandro Vezzi2Davide Tagliapietra3‡
- 1Section of Oceanography, National Institute of Oceanography and Applied Geophysics - OGS, Trieste, Italy
- 2Department of Biology, University of Padua, Padua, Italy
- 3Institute of Marine Sciences, National Research Council (ISMAR-CNR), Venice, Italy
- 4Department of Life Sciences, University of Trieste, Trieste, Italy
The MOSE (Experimental Electromechanical Module), consisting of rows of mobile gates can temporarily isolate the Venice lagoon from the Adriatic Sea during extreme high tides. To investigate how the lagoon ecosystem is affected by a prolonged segregation from the oxygenating seawater, we performed two enclosure experiments in July 2019 (48h) and October 2020 (28h) by artificially secluding small portions of the organic-enriched Palude di Cona area, using 18 mesocosms (~ 0.8 m3 each). We followed the closure effects on planktonic and benthic communities at several trophic levels (i.e. prokaryotes, microalgae, consumers). Our results suggest that the reduced hydrodynamics induced by the MOSE closure, leading to an enhanced deposition of the suspended material over time, affects the main biological processes and the pelagic-benthic coupling in the Venice lagoon. Over the summer experiment, the concentrations of N-NO3 and N-NO2, and some phototrophic components and functions (i.e. chl-a, Synechococcus, picoeukaryotes, primary production) in the water column were significantly reduced. The smallest phototrophs gradually settled towards the sediments, drastically diminishing their abundance, whereas the largest phytoplankton cells (dinoflagellates and diatoms) took advantage and increased their density during the experiment due to the significantly higher availability of N-NH4, deriving from the prompt degradation of organic matter. The higher Total Organic C content in surface sediments, deriving from the gradual sinking of suspended particulate organic matter, stimulated the microbial components and processes notably, both in the water column and in the sediments. In parallel, the higher availability of N-NH4 stimulated the microphytobenthic abundance and benthic primary production. In the autumn experiment, most of the investigated variables displayed opposite patterns, likely ascribable to the different season and diverse meteorological conditions. Our holistic approach represents a reference to evaluate the impact of floodgates on coastal ecosystems, an increasingly frequent engineering solution around the world to rising sea levels.
1 Introduction
Shallow coastal areas worldwide are threatened by the negative consequences of flood risk associated with climate change and rising sea levels (AR4 Climate Change, 2007). To mitigate the risk of flooding, many coastal cities have taken extreme protection measures by building storm surge barriers (Tognin et al., 2022).
The Venice lagoon is situated at the northwestern end of the Adriatic Sea, where the highest tides of the Mediterranean flush out brackish waters and replace them with marine waters from the coastal shelf in front of the lagoon. However, climate change is threatening this sensitive system (Umgiesser, 2020). According to the most recent Intergovernmental Panel on Climate Change (IPCC) Assessment Report (AR6), released in 2021, a sea level rise between 42 cm and 78 cm is expected by the end of this century (Intergovernmental Panel On Climate Change, 2023). Such an increase in water level would be fatal for the city of Venice that is situated on average only 80 cm above the mean sea level, inside the Venice lagoon. In the past, Venice was subjected to intermittent high-water events. The highest event happened in 1966 with a water level of 194 cm (Trincardi et al., 2016). Recently, on 12th November 2019, the second highest high-water level since the beginning of precise measurements (1923), namely 187 cm, struck Venice, flooding 85% of the city. During that event, water levels were persistently very high for a week and exceeded 140 cm for 4 days, a threshold that classifies the high-water events as exceptional (Umgiesser, 2020). Historically, only 23 of these exceptional events occurred in the last 150 years, 9 before the 2000s, 14 in this millennium, and have increased in frequency in the last years (Cavaleri et al., 2020). This is a clear sign that Venice will have to face these high-water events ever more frequently in the near future. With a sea level rising above a certain level, the only feasible way to defend the city against high tides is blocking the water fluxes at the inlets of the lagoon. To this end, the project MOSE (Modulo Sperimentale Elettromeccanico, i.e. Experimental Electromechanical Module) was designed, a tide regulation engineering work that consists of rows of mobile gates installed at the three lagoon inlets, able to temporarily isolate the Venice lagoon from the Adriatic Sea during extreme high tides (‘acqua alta’) (Fletcher and Spencer, 2005). The construction of the mobile barriers started in 2003, with the goal of defending the city of Venice against high tides and storm surges (Magistrato Alle Acque, 1997). The MOSE system was operated for the first time in October 2020 (Mel et al., 2021) becoming fully operational at the end of 2023, when the longest closure period occurred lasting about 42h (from 4th to 6th December 2020) (MOSE Venezia). According to the current management protocol, due to high operational costs, the barriers are raised only with tides higher than 110 cm (Ruol et al., 2020). The system implies a modification of hydrological conditions and sediment displacement in the vicinity of the inlets and is expected to increase water residence time in the lagoon (Ferrarin et al., 2013) particularly now that it is fully operational. While recent studies have investigated how the MOSE might impact the hydrology, the sediment fluxes, and the dissolved oxygen dynamics of the lagoon (Leoni et al., 2022; Scarpa et al., 2022), there are no manipulative field experiments reporting its effects on the structure and function of biological communities. Indeed, it is of paramount importance to understand how a prolonged period of segregation from the oxygen-enriched seawater, and increased deposition of suspended material due to lower hydrodynamics, will affect the lagoon ecosystem and particularly the microbial benthic and pelagic communities.
For this purpose, we set up two field experiments, one in summer and one in autumn, lasting up to 48 h, artificially secluding small portions of the lagoon to mimic the MOSE closure and investigate its effects on the lagoon ecosystem. We designed ad-hoc mesocosms that preserve the vertical fluxes between the two boundary layers (i.e. water/air and water/sediment), while blocking the horizontal ones (i.e. water exchange between the inside and outside of the mesocosms) (Figure 1E). To assess the ecosystem functioning we applied a holistic approach, by integrating the ecosystem structure, its functioning and biological diversity at several trophic levels, in the sediments as well as in the water column, considering the pelagic-benthic unicum (Cibic et al., 2022b). For a more comprehensive characterization of the communities, we coupled classical taxonomy techniques and flow-cytometry with molecular analyses. In the first experiment, performed during the hottest week of summer 2019, we simulated the worst-case scenario, i.e. the potential effects of prolonged MOSE closure times on an organic-enriched shallow area often subjected to hypoxia. The second experiment was instead performed in autumn 2020, in similar conditions to the actual ones, i.e. when it is more likely that the MOSE is activated.
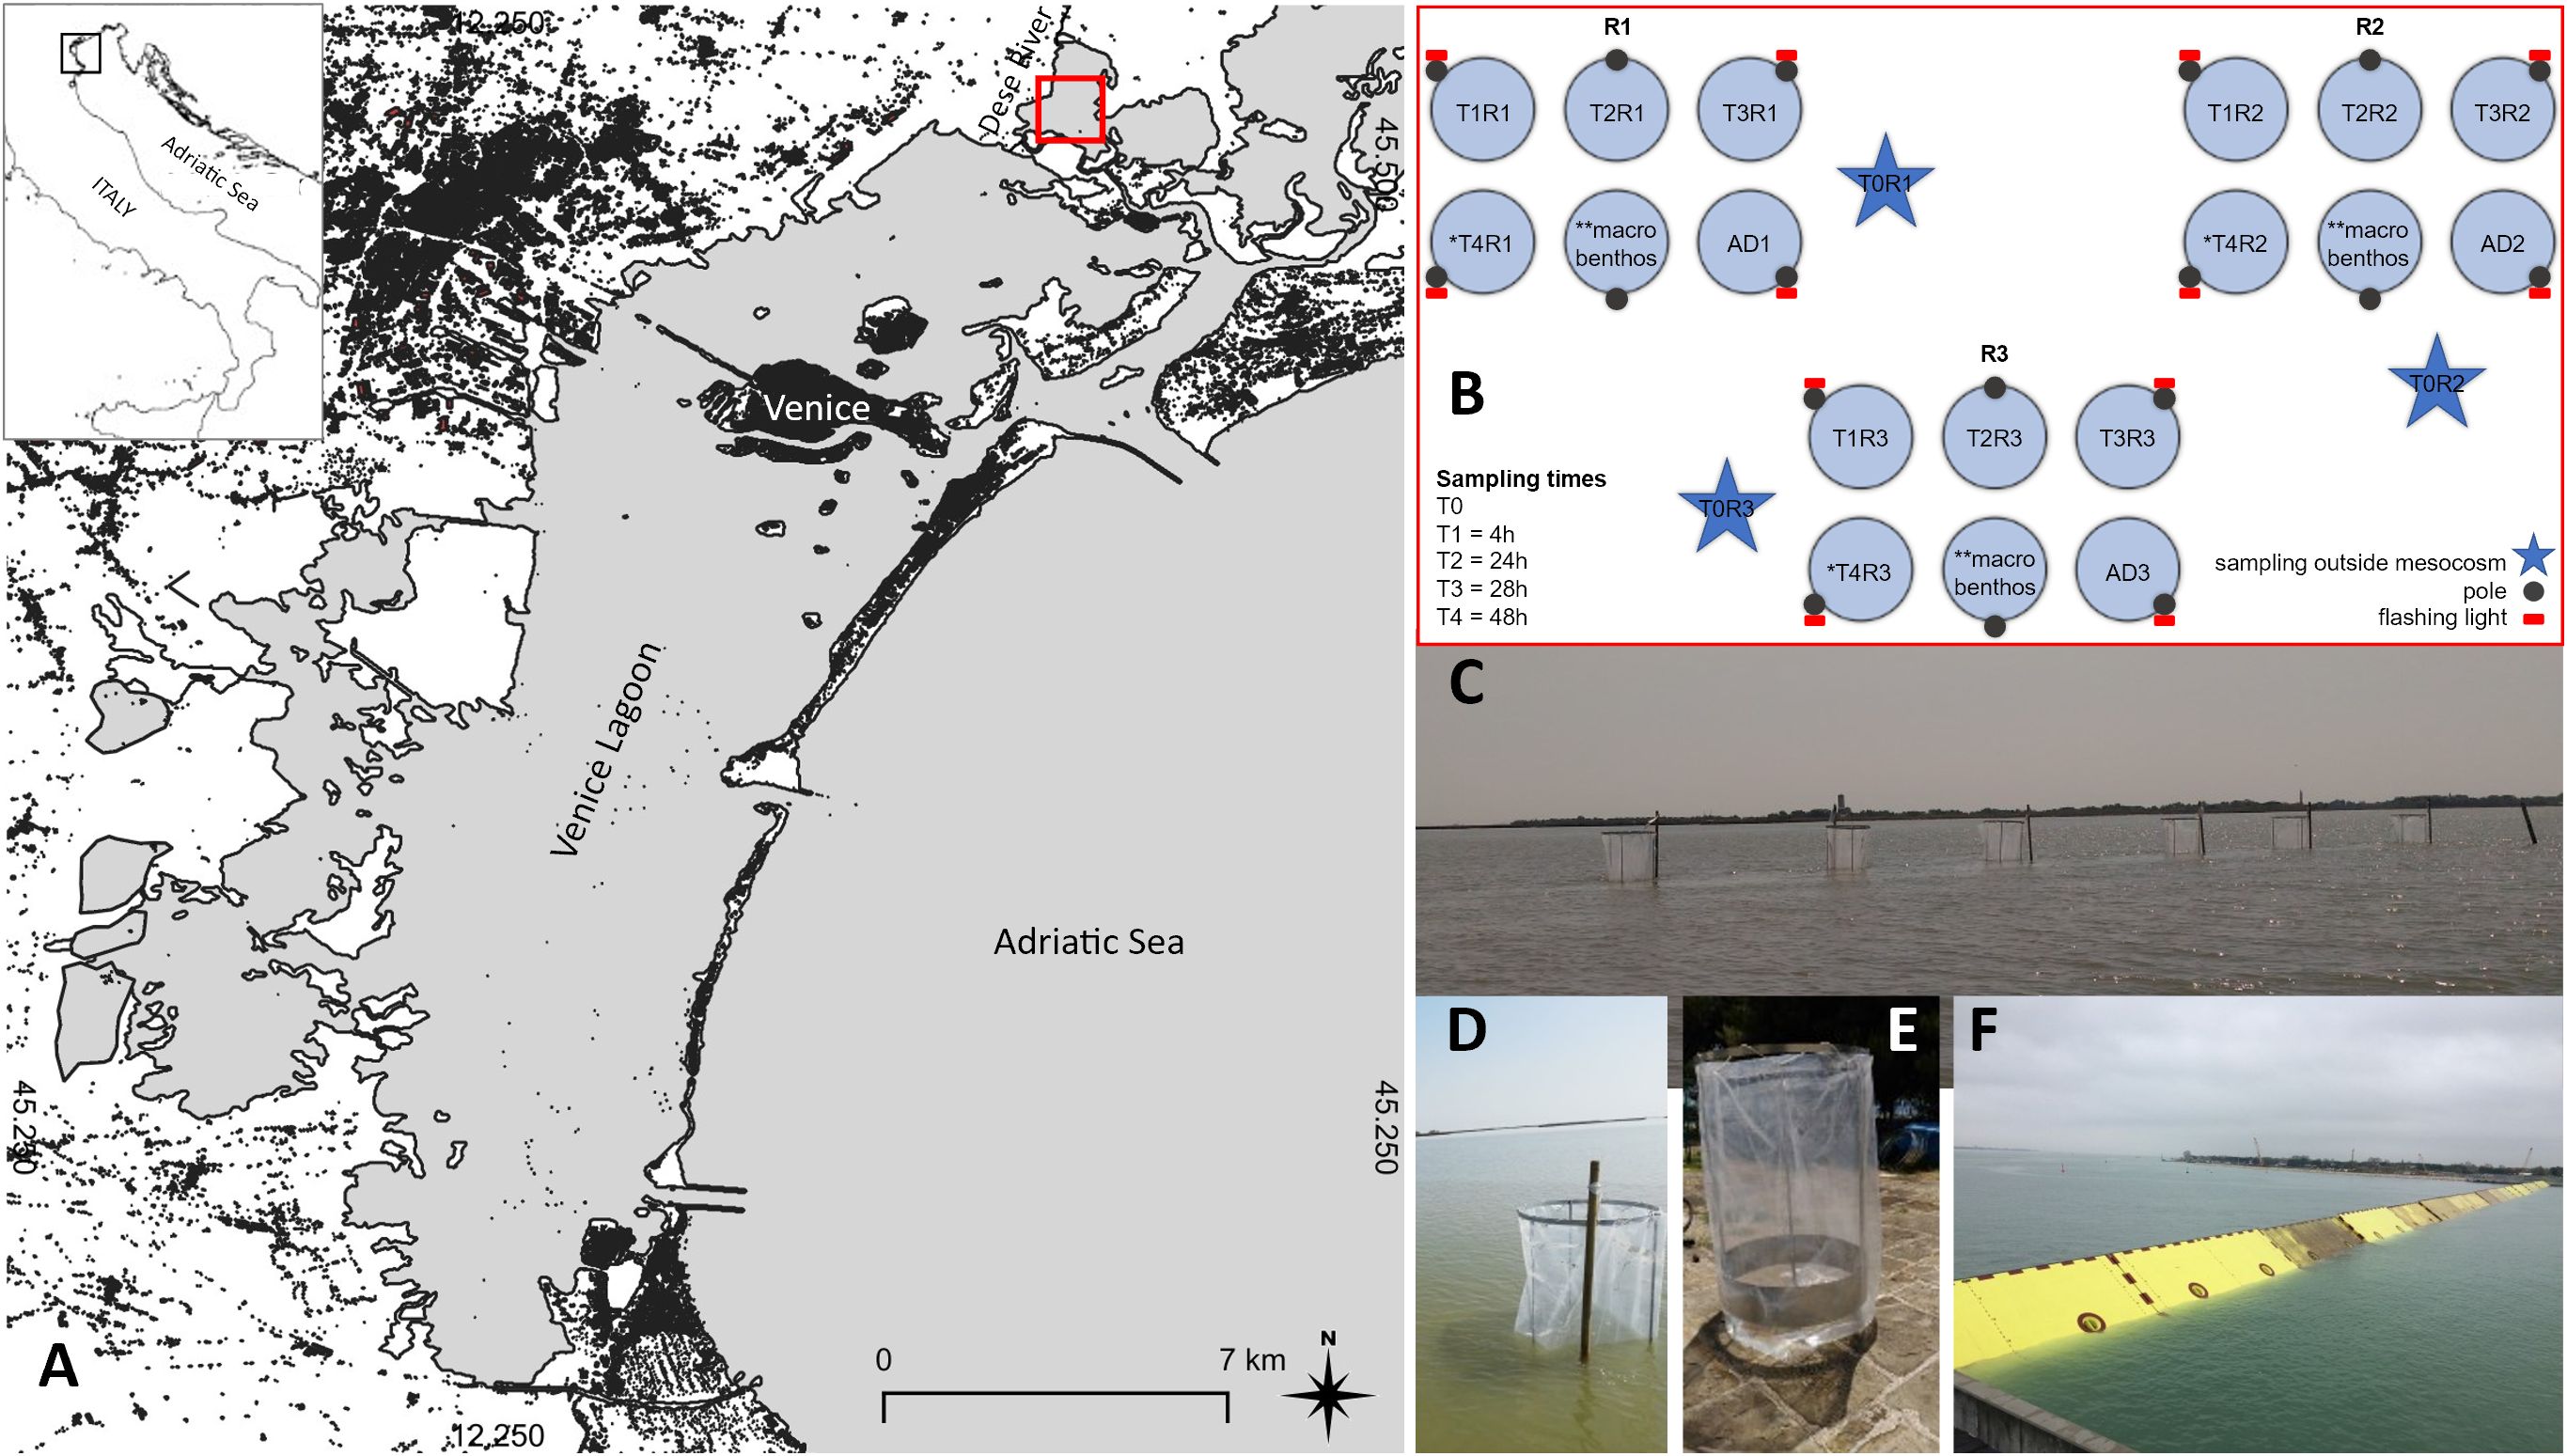
Figure 1. (A) Study area; (B) Experimental design: 18 mesocosms were placed in 3 groups of 6 to enable sampling in 3 replicates per 5 experimental times. Each mesocosm was sampled only once. At each sampling time (T1-T4), one mesocosm per cluster (R1-R3) was sampled. Three replicate mesocosms were further allotted to macrofaunal samples that were collected outside the mesocosms at the beginning and inside them at the end of the experiment, only. One additional mesocosm per cluster was positioned as backup (* T4 not present in October 2020, ** sampled at Tf, see the text, ADn: additional backup mesocosms); (C) Mesocosms placed in Palude di Cona; (D, E) Detail of the mesocosms; (F) MOSE gates in operation (from Baldassarre et al., 2023).
Our guiding questions and expected results were: Q1) Could the MOSE closure lead to a progressive oxygen depletion inside the lagoon? By preventing the horizontal oxygen exchange with the seawater, but allowing the vertical exchanges at the two boundary layers (air/water and water/sediment), we expect to observe hypoxia/anoxia inside the mesocosm, at least in the summer experiment. Q2) Could the lower hydrodynamics and enhanced deposition of suspended material induce a shift in the composition of pelagic and benthic microbial communities? We expect to observe differences in the abundance and structure of prokaryotic and eukaryotic microbial communities at the end of each experiment. Q3) Could the MOSE closure affect the main microbial processes and the benthic-pelagic coupling of the Venice lagoon? We expect to observe progressively lower primary and secondary production rates, and degradative activities in the water column, and gradually higher ones in the surface sediments.
2 Materials and methods
2.1 Study area
The Venice Lagoon is a polyeuhaline microtidal transitional environment with a surface area of 550 km2 and a mean water depth of about 1 m (Figure 1). It includes islands, tidal marshes, mudflats and a complex network of tidal channels. The shallow water areas account for ca. 75% of the whole surface (ca. 415 km2). During a single tidal cycle (12 h), approx. 60% of the lagoon volume is exchanged with the waters of the north-western Adriatic Sea through three seaward inlets (Lido, Malamocco and Chioggia) (Gačić et al., 2004) (Figure 1A). The mean sea level is 30 and 80 cm in neap and spring tide conditions, respectively (Zonta et al., 2005). The drainage basin, with a total area of ca. 1850 km2 and a population of about one million inhabitants, hosts important urban areas, intensive husbandry activities, and industrial districts (Zonta et al., 2005). Twelve main tributaries drain the catchment, providing a mean freshwater discharge of about 35.5 m3 s-1 to the lagoon (Zuliani et al., 2005). The 3 inlets allow tidal flushing twice a day: every day the lagoon exchanges about 400 x 106 m3 of water with the sea, while the inland inflow through the rivers and subsoil is about 3.7 x 10⁶ m3 (Bernstein and Montobbio, 2011). Tides, the largest in the Mediterranean, are a main factor in shaping the morphology of the lagoon and driving water exchange, dissolved oxygen, salinity, nutrients, and sediment distribution (Tagliapietra and Ghirardini, 2006).
The Palude di Cona (PdC) is a shallow water area surrounded by saltmarshes and located in the northern sector of the lagoon (Figure 1A). It is 4 km long, 0.9 km to 1.7 km wide, with an average depth of 80 cm during mean tidal conditions of the microtidal cycle (Sarretta et al., 2010). Its hydrology is influenced by the presence of both continental fresh water (Dese River) and tidal seawater. Its morphology and proximity to rich nutrient sources favors eutrophication (Zuliani et al., 2005). The shallow waters of PdC promote rapid temperature equilibrium between water and air, with water temperature following the seasonal trends of air temperature (Guerzoni et al., 2006), i.e. the highest water temperature values reach 26–27 °C in summer, while the lowest winter values are typically around 5–7 °C (Pesce et al., 2018). Dissolved oxygen (DO) concentrations fluctuate with water temperature seasonally as well as on a daily basis (Pesce et al., 2018). Due to its shallow depth and its innermost position with respect to the lagoon inlets, this organic-enriched area is subjected to low water renewal and the occurrence of hypoxic and anoxic events during the summer season (Sarretta et al., 2010).
2.2 Experimental design
Two MOSE closures of up to 48h were simulated by means of two field mesocosm experiments carried out in PdC. The first experiment took place in July 2019 in the hottest week of the year (24th-26th). A total of 18 mesocosms (~ 0.8 m3 each) were deployed in 3 clusters corresponding to three experimental replicates, R1-R3, (Figure 1B) along transects with similar bathymetry (<75 cm) (coordinates are reported in Supplementary Table S1). Each mesocosm was composed of 2 galvanized ion rings (∅ ca. 100 cm) connected by 3 bars in a cylindrical frame that was wrapped in a robust plastic transparent bag (∅ ca. 106 cm) opened at both lower and upper sides (Figure 1E). This setup allowed to preserve the vertical fluxes between the two boundary layers (i.e. water/air and water/sediment), whereas the horizontal ones (i.e. water exchange between the inside and outside of the mesocosms) were blocked, mimicking the segregation of the lagoon from the oxygen-enriched seawater when the MOSE flood barriers are raised for several hours.
The sampling times were scheduled to assess short-term (4h, T1) and long-term (24h, T2; 28h, T3 and 48h, T4) effects on planktonic and benthic communities at different trophic level resolution. At the first sampling time (T0), water and sediments were sampled outside the three replicate mesocosms, in their proximity (Figure 1B). Then, the cylindrical nylon bags of the 18 mesocosms, initially lowered to allow the water exchange, were pulled up and the experiment began at 9.00 a.m. on day 0. T1 was performed after 4 h (1.00 p.m.) the same day, T2 at 9.00 a.m. on day +1 (24 h), T3 at 1.00 p.m. on day +1 (28 h) and T4 at 9.00 a.m. on day +2 (48 h). Each mesocosm was sampled only once, due to major sediment resuspension after sediment sampling by means of a hand corer (see Sampling section). At each sampling time, one mesocosm per cluster was sampled. Three replicate mesocosms were further devoted to macrofaunal samples that were collected outside the mesocosms at the beginning (T0) and inside them at the end of the experiment (T4 or T3), only (Figure 1B). One additional mesocosm (AD) per cluster was positioned as backup.
The second experiment was carried out in October 2020 (13th-14th), a period when MOSE is more likely to operate. This in fact happened during the last day of the experiment when the flood barriers were raised for a tide peak of 135 cm (Figure 1F). Due to bad weather conditions with very strong southern wind that would have unhinged our mesocosms, we were forced to stop the experiment at T3. Moreover, in presence of strong winds, there is a ban on navigation which would have prevented us from reaching the mesocosms.
2.3 Sampling
At each sampling time, water temperature, salinity, pH and dissolved oxygen were recorded at half the water column (see Supplementary Table S1, S2 for water depths) by a multiparameter probe YSI ECO2 EXP 7–20014 prior to water and sediment sampling, inside and outside the mesocosms.
Water secluded in the enclosures was collected by means of a 5L-horizontal Niskin bottle. In the three replicate mesocosms, the samples for nutrients were collected and processed on site. The remaining water in the Niskin was collected in acid washed (HCl 1M) polyethylene 1L-bottles, previously rinsed 3 times with seawater, for the subsequent analyses (prokaryotic abundance and diversity, heterotrophic C production, exoenzymatic activities, chlorophyll-a and phaeopigments) in the laboratory. Separately, 500-mL polycarbonate carboys were deployed for water samples dedicated to primary production estimates. Further, 500 mL-water samples for phytoplankton analyses were taken, and additional water aliquots were collected in 3L-dark plastic carboys for DNA extraction but only at T0 and T4 (T3 for the autumn experiment). All the bottles were stored in coolers and processed within 2h from samples collection.
For sediment sampling, two sediment cores were collected from each mesocosm by means of a hand operated sediment corer HAPS, KC Denmark (internal diameter: 14 cm, surface area: 154 cm2, sample depth: max. 31 cm). The first core was extruded and subsampled (0–1 cm) on board and the homogenized sediment was allotted to grain-size, Total Organic Carbon (TOC), Total Nitrogen (TN), Biopolymeric Carbon (BPC) and meiofauna analyses. The second sediment core was collected and carefully stored in a cooler. Once in the laboratory, the three replicate cores were extruded and the top sediment layer (0–1 cm) was separately collected for microbial analyses (abundance and community composition of prokaryotes and microphytobenthos, primary production, and heterotrophic C production). We focused on the uppermost centimeter of sediment in which changes in the structure of the microbial communities and the main biological processes are more evident as a result of lower hydrodynamics, and increased deposition of material from the water column. The water content was estimated by weighing fresh and dried (105 °C for 24 h) sediment aliquots (2 cm3). Experimental procedures for the analysis of dissolved inorganic nutrients, pigments, TOC, TN, BPC, sediment grain-size, exoenzymatic activities, and meiofaunal and macrozoobenthos community composition are detailed in the Supplementary Material.
2.4 Prokaryotes, picoeukaryotes and virus-like particles (flow-cytometry)
The abundance of Synechococcus (SYN), heterotrophic bacteria (HB), picoeukaryotes (PE) and virus-like particles (VLP) in the water column, and of total prokaryotes in surface sediments, was estimated by FACSCanto II (Becton Dickinson BioSciences Inc, USA) flow cytometer equipped with an air-cooled argon laser at 488 nm and standard filter setup.
For the water samples, 1mL of water in duplicate was fixed with 0.5% (final concentration, f.c.) glutaraldehyde solution (Grade I for EM analyses, Sigma Aldrich), kept 15 min at 4 °C and then stored at –80 °C until processing. Once thawed at room temperature, samples for SYN and PE were analyzed, without staining, based on their natural fluorescence (chlorophyll-a and phycoerythrin), while samples for HB and VLP were diluted 1:10 (HB) and 1:50 (VLP) with 0.2 μm-filtered Tris-EDTA buffer 1 ×. HB samples were then stained with SYBR Green I 1X (final concentration, Life Technologies), incubated for 10 minutes in the dark at room temperature following Marie et al., 1999. VLP samples were stained with SYBR Green I 0.5X (final concentration), incubated at 80 °C for 15 min following Brussaard, 2004. Total VLP abundance was obtained by correcting the total count for noise, with 0.2 μm-filtered Tris-EDTA buffer 1 × as blank. Data acquisition was performed with FACSDiva software (Becton Dickinson Franklin Lake, USA) and the files analyzed using FCS Express 7 Research (7.18.0021, DeNovo Software, Glendale, USA).
For the surface sediments, aliquots of 2 cm3 of homogenized sediment, subsampled with 5 mL cut-off syringes, were fixed with 5 mL of formaldehyde (4 %) and kept at 4 °C for 24 h. The samples were then washed with 7.5 mL of 1X phosphate buffered saline (PBS), resuspended in 5 mL of a solution of 1:1 ethanol: 1X-PBS and stored at −20 °C until processing. Prior to enumeration, the samples were processed following Deng et al., 2019 with modifications. First, 100 μL of sediment slurry was diluted 1:10 in milli Q water, and then 600 μL of milli Q water and 100 μL of detergent mix [100 mM ethylenediaminetetraacetic acid (EDTA), 100 mM sodium pyrophosphate, 1% (v/v) Tween 80] were added prior to mechanical (shaking and ultrasonication) and hydrofluoridric acid (HF) treatment. Then, 250 μL of cells extract was mixed with Stop Solution [1 M Tris–HCl, pH 8.0; 0.125 M Calcium chloride and 25% methanol] and filtered with a syringe provided with a 10 μm porosity filter. Then the samples were diluted to 1:400 with 0.2 μm-filtered 1X Tris-EDTA buffer and stained with SYBR Green I. Prokaryotic abundance was obtained by correcting the total count for sediment debris, running the unstained samples. Data acquisition was performed with FACSDiva software (Becton Dickinson Franklin Lake, USA) and the files analyzed using FCS Express 7 Research (7.18.0021, DeNovo Software, Glendale, USA). Prokaryotic cells per gram of sediment were calculated for each sample considering the dry fraction weight.
2.5 Phytoplankton and microphytobenthos (Microscopy-based taxonomy)
For the determination of phytoplankton, 500-mL water samples were collected in opaque polyethylene bottles, immediately fixed with prefiltered and neutralized formaldehyde (1.6% final concentration) (Throndsen, 1978) and kept cool and in the dark until laboratory analysis. An inverted microscope with phase contrast (Olympus IX71 and Leica DMi8) was used for taxonomic identification, and a variable sample volume (2.5–50 mL) was analyzed according to the Utermöhl method (Zingone et al., 2010). Counts were made along transects across the microscope chambers at 400× magnification for small (5-20 µm) or very abundant species and by observing half of the sedimentation chamber at 200× magnification for less abundant microphytoplankton (>20 μm). Phytoplankton specimens were identified to the lowest possible taxonomic level, and abundance was expressed as number of cells per liter (cells L-1). Identified taxa were reported by major groups such as diatoms, dinoflagellates, coccolithophores and flagellates, the latter comprising several phytoplankton classes (mostly forms less than 10 μm in size, whose taxonomic identification under LM is uncertain). Taxonomic identifications were made according to Avancini et al., 2006; Bérard-Therriault et al., 1999; Hoppenrath et al., 2009; Kraberg et al., 2010; Tomas, 1997.
For the determination of microphytobenthos (MPB), for each mesocosm replicate, aliquots of 2 cm3 of homogenized sediment were withdrawn using a syringe and directly fixed with 10 mL of formaldehyde (4% f.c.) buffered solution CaMg(CO3)2 (Carlo Erba, Rodano, Italy), in pre-filtered bottom seawater (0.2 µm filters) (Schleicher&Schuell, Dassel, Germany). After manual stirring, 20 µL aliquots of the sediment suspension were drawn off from the slurries and placed into a counting chamber (Thalassia, Trieste, Italy). Only cells containing pigments and not empty frustules were counted under a Leitz inverted light microscope (Leica Microsystems AG, Wetzlar, Germany) using a 32× objective (320× final magnification) (Zingone et al., 2010). The microalgal taxonomy was based on Round et al., 1990 and the AlgaeBase website (Guiry et al., 2014). The qualitative identification of microphytobenthic assemblages was carried out to the genus and, when possible, to the species level using floras cited in Rogelja et al., 2016. To allow a comparison between classical taxonomy and rRNA genes metabarcoding, Cyanobacteria, which in these samples accounted on average for less than 1% of the total MPB community, were excluded from these results and presented instead together with the other data on the prokaryotic fractions. A focus on these MPB data is presented in Baldassarre et al., 2023.
2.6 DNA collection and extraction from water and sediments
The seawater sampled from each mesocosm replicate at T0 and Tf was filtered on 0.22 µm Sterivex cartridges (Merck Millipore) until clogging, using a peristaltic pump. Volumes filtered ranged from 2 to 3 L. After removing the excess water with a syringe, the cartridges were frozen and kept at -80°C until DNA extraction. DNA was extracted using the DNeasy PowerWater Sterivex Kit (Qiagen) following the manufacturer’s instructions and quantified with a Qubit Fluorimeter (Thermo Fisher Scientific).
The surface sediment (≅ 0.5g dry weight) from each mesocosm replicate of T0 and Tf was sampled with a sterile spatula and stored at −80 °C until further processing. DNA was extracted from each sample using the DNeasy PowerSoil Pro Kit (Qiagen) following the manufacturer’s instructions and quantified with a Qubit Fluorimeter (Thermo Fisher Scientific).
2.7 Prokaryotes in water and sediments (metabarcoding)
The V4 16S rRNA gene was amplified with degenerate primers 515F-Y (GTGYCAGCMGCCGCGGTAA; (Parada et al., 2016) and 806RB (GGACTACNVGGGTWTCTAAT; (Apprill et al., 2015). The PCR products were indexed according to the “16S Metagenomic Sequencing Library Preparation'' protocol (Illumina), normalized using the SequalPrep Normalization Plate kit (Thermo Fisher Scientific), and sequenced in two separate 2 × 300 bp runs of Illumina MiSeq System, corresponding to the two experiments. Primers and low-quality positions were removed using cutadapt v.2.1 (Martin, 2011). The analyses were carried out within the R environment (R Core Team, 2021) and the phyloseq package (McMurdie and Holmes, 2013). The sequences were processed with dada2 v.1.20 (Callahan et al., 2016) to identify and remove errors and then the resulting amplicon sequence variants (ASVs) were assigned to different taxonomic levels using the SILVA v.138 database (Quast et al., 2013). The sequences assigned to chloroplasts and mitochondria were removed. After this purging step, rare and low abundant ASVs (i.e. features with abundances across all samples lower than 10 total counts and present only in less than three samples) were filtered out. The remaining ASVs were kept for the following analysis.
2.8 Phytoplankton and microphytobenthos (metabarcoding)
The V9 18S rRNA gene was amplified with degenerate primers 1389F (TTGTACACACCGCCC) and 1510R (CCTTCYGCAGGTTCACCTAC) (Amaral-Zettler et al., 2009). The PCR products were indexed according to the “16S Metagenomic Sequencing Library Preparation'' protocol (Illumina Inc., USA), normalized using the SequalPrep Normalization Plate kit (Thermo Fisher Scientific, USA) and finally sequenced in two separate 2 × 300 bp runs of Illumina MiSeq System, corresponding to the two experiments. A water sample from 2019 that did not work in the first sequencing run, was sequenced again in a separate run. The analyses were carried out within the R environment (R Core Team, 2021) and the phyloseq package (McMurdie and Holmes, 2013). Primers were removed using cutadapt v.2.1 (Martin, 2011). The sequences were then processed with dada2, v.1.20 (Callahan et al., 2016). The taxonomic assignment of the ASVs was performed using the Protist Ribosomal Reference (PR2) v.4.14 database (Guillou et al, 2013) and unassigned sequences were removed. After these purging steps, rare and low abundant ASVs (i.e. features with abundances across all sediment samples lower than 10 total counts and present only in less than three samples) were filtered out. The remaining ASVs were kept for the following analysis.
2.9 Pelagic and benthic primary production
We estimated primary production in water samples (PP-W) and surface sediments (PP-S) by the 14C uptake method (Nielsen, 1952). The incubation time was kept to 1 hour for both water and sediment samples, therefore in both cases a gross primary production rate was measured (Gazeau et al., 2004). During the transfer to the laboratory, water samples collected from each mesocosm were kept in coolers in the dark to stop the residual photosynthetic activity. Once in the laboratory, water samples were poured into 75-mL translucent and dark polycarbonate carboys (Nalgene). Subsequently, 6 μCi (0.22 MBq) of NaH14CO3 (DHI, Denmark) was added per bottle. Three light and one dark samples per mesocosm (12 samples in total per each experimental time) were fixed on a rosette and incubated in situ, on the dock in front of ISMAR laboratory, for 1h under natural light conditions. At the end of the incubation, samples were transferred to 100-mL bottles and supplemented with 320 μL of 5 N HCl (Cibic et al., 2011) to stop the photosynthetic activity and remove the residual labelled bicarbonate, not assimilated by the phototrophic plankton. Subsequently, samples were treated as described in Cibic et al., 2018.
PP-S was estimated from 14C-incubation of slurries (Cibic et al., 2008). For each mesocosm, an aliquot of 2.5 cm3 of homogenized sediment was re-suspended in 50 mL of filtered seawater (0.22 µm filter) and 250 μL of 14C (NaH14CO3, DHI, Denmark) were added to reach a final activity of 1 µCi mL-1 (37 kBq mL-1) (Nielsen, 1952). The suspension was then transferred into two dark and three light 9 mL-glass vials. For each experimental time, a total of 12 samples (deriving from the three mesocosms) were fixed on a rosette and incubated in situ. To the remaining three dark samples, needed for the assessment of the sediment matrix effect, 200 µL of HCl 5N were added immediately to stop the PP activity (Cibic and Virgilio, 2010). The other replicates were stopped after incubation by adding the same volume of the acid solution. Subsequently, samples were treated as described by Cibic et al., 2008.
Disintegrations per minute (DPM) were measured by a QuantaSmart TRI-CARB 2900 TR Liquid Scintillation Analyzer (Packard BioScience, USA) including quenching correction, obtained using internal standards. Assimilation of carbon was calculated as described by Gargas, 1975, assuming 5 % isotope discrimination. Activity of the added NaH14CO3 and inorganic carbon concentration (tCO2) were calculated based on total alkalinity measured in the same samples. Photosynthetically available radiation (PAR) was recorded in the water column, using a Profiling Natural Fluorometer PNF-300A (Biospherical Instruments Inc., San Diego, CA, USA) before and after each incubation. Since incubations were carried out in different light conditions (morning vs afternoon), PP-W and PP-S data were normalized for light intensity of 1000 μE, representing the average PAR value measured in situ during morning and afternoon incubations.
2.10 Heterotrophic C production
Heterotrophic prokaryotes carbon production (HCP) was measured with the method of 3H-leucine (Leu) incorporation according to Kirchman et al., 1985 for water samples and to Van Duyl and Kop, 1994, as detailed by Franzo et al., 2016 for sediment samples.
Triplicate 1.7 mL water subsamples and one killed control (5% trichloroacetic acid - TCA) were amended with 20 nM radiotracer (50.2 Ci mmol-1; Perkin Elmer) and incubated for 1 h in the dark at in situ temperature. The extraction of 3H-labelled proteins was carried out following the microcentrifugation method (Smith and Azam, 1992). After the addition of 1 mL of scintillation cocktail (Ultima Gold™ MV; Packard), the activity was determined by a TRI-CARB 2900 TR Liquid Scintillation Analyzer. A conversion factor of 3.1 kg C mol-1 Leu incorporated was used to estimate carbon biomass production, assuming a 2-fold isotope dilution (Simon and Azam, 1989).
Each sediment sample (0.2 mL of 1:1 v/v slurry) was incubated with 6 µCi of 3H-leucine (Perkin Elmer) in the dark for 1h at in situ temperature; incubations were terminated with 80% ethanol (1.7 mL). After washing the samples twice with ethanol (80%) by mixing, centrifuging and supernatant removal, the sediment was transferred with ethanol (80%) onto a polycarbonate filter (0.2 µm mesh size). The filters were then washed twice with 5% TCA and heated in 2M NaOH for 2 h in a water bath at 100°C, cooled on ice and centrifuged at 425 (g-force) for 3 minutes. One mL of supernatant was transferred to scintillation vials; after the addition of 10 mL of Hionic Fluor (Perkin Elmer) scintillation fluid, the activity in the sediments was determined by a TRI-CARB 2900 TR Liquid Scintillation Analyzer. For each sample, three replicates and two ethanol-treated blanks were analyzed.
2.11 Statistical analyses
All statistical analyses were performed using PRIMER 7.0.21 (https://www.primer-e.com/). To distinguish between the same variable measured in the water or sediment samples, -W and -S suffixes, respectively, were appended to variables short names. A Wilcoxon–Mann–Whitney U test was performed to test the statistical significance of the difference between the oxygen trends outside and inside the mesocosms. For multivariate analyses, all variables were checked for autocorrelation (threshold ≥ 0.95). Abundance data of phytoplankton and MPB taxa were divided into two separated matrices. Two additional matrices for each experiment were generated with the abiotic parameters (temperature, salinity, O2 concentration, inorganic nutrients and pigments) and the biological processes rates (enzymatic activity, PP-W and HCP-W) for the water column; temperature, salinity, O2 concentration, TN, TOC, BPC and grain-size, and the biological processes rates (PP-S and HCP-S) for the sediment. Before the multivariate analysis, the abiotic matrices were normalized (z-standardization), and the biotic ones were log (x + 1) transformed and Bray-Curtis similarity was applied.
A Principal Component Analysis (PCA) was carried out on physical-chemical data of each sampling time for all the four matrices to visualize the temporal distribution of the main abiotic variables: salinity, temperature and oxygen plus nutrients and pigments for the water column and plus grain-size and the different fractions of organic matter for the sediments. The significance of differences among the time points was tested by ANOSIM (ANalysis Of SIMilarity) (Clarke et al., 2001). All variables (including the abundances of the major taxonomic groups and the biological processes as supplementary variables) were fitted on the plots as vectors. In order to test which, among the environmental variables, correlated best with the patterns of microeukaryotic taxa according to the experimental time point, a BEST (BIO-ENV + STEPWISE) analysis based on Spearman's coefficient (Clarke and Ainsworth, 1993) was performed between the biotic and abiotic matrices.
Taxa and ASVs differentially represented at the beginning (T0) or at the end (T4 or T3) of the two experiments and the two matrices were identified by LDA Effect Size (LEfSe) (Galaxy; Segata et al., 2011). LEfSe uses the non-parametric factorial Kruskal-Wallis sum-rank test among all the experimental replicates, to detect features (ASVs or microscopy-identified species in this case) with significant differential abundance (or relative number of reads in this case), according to the biological conditions of interest (i.e. experimental time point); subsequently, it uses Linear Discriminant Analysis (LDA) to estimate the effect size of each differentially abundant feature. The taxonomy of the discriminant ASVs was re-assigned through NCBI BLAST (Camacho et al., 2009) for the 16S sequences and through EukRibo (Berney, 2022) for the 18S sequences.
In order to summarize the overall impact of the confinement on the study area, a non-parametric Kruskal-Wallis test was performed on every measured abiotic and biotic variable, using the experimental time as fixed factor.
3 Results
3.1 Variation of physical-chemical variables in water and surface sediments
The coordinates of the 18 mesocosms are indicated in Supplementary Table S1. During the autumn experiment, the mesocosms were positioned at the same georeferenced points. The water depth inside and outside the mesocosms, however, was higher in autumn than in summer due to the high tide (Supplementary Table S2). Comparing the inside and outside mean values of the physical variables, after excluding the T0 values, in summer temperature and salinity values were comparable (T = 30.1 ± 1.0°C and S = 22.0 ± 2.9 outside vs T = 30.3 ± 0.9°C and S = 22.3 ± 1.0 inside) whereas oxygen concentration was significantly lower (Mann-Whitney U test, z = 2.42; p < 0.05) inside the mesocosms (O2% = 73.5 ± 21.5 outside vs 58.7 ± 14.8 inside) (Supplementary Table S1). Similarly, in autumn, temperature and salinity values were highly comparable (T = 14.2 ± 0.4°C and S = 25.1 ± 2.6 outside vs T = 14.2 ± 0.4°C and S = 25.7 ± 1.2 inside), and only a slight reduction in oxygen concentration was registered inside the enclosures (O2% = 91.8 ± 14.4 outside vs 88.8 ± 6.5 inside) (Supplementary Table S2).
3.2 Prokaryotic abundance and community composition
In summer, the HB-W abundance showed an overall decrease through the course of the experiment with slight increase at T2. In autumn, the flow-cytometry data showed a slight increase from T0 up to T2 and then a decrease again at the end of the experiment at values similar to the initial ones (Figure 2A). At the beginning of the summer experiment, SYN abundance sharply decreased up to T3 with a slight recovery at T4 (Figure 2B). In autumn, the abundances were an order of magnitude higher than in summer with a maximum observed at T1 followed by a constant decrease until T3 (Figure 2B). In summer, HB-S abundance showed a sharp decrease from T1 to T3 followed by a sharp increase at T4 reaching higher values than the initial ones (Figure 3A). In autumn, it displayed a slight abundance decrease through the course of the experiment (Figure 3A). Cyanobacteria abundances in summer showed an oscillating trend with higher values at T0, T2 (maximum) and T4 (Figure 3B), and lower values at T1 and T3 (minimum). In autumn, the cyanobacteria abundances showed a slight decrease at T1 and a maximum at T3 (Figure 3B).
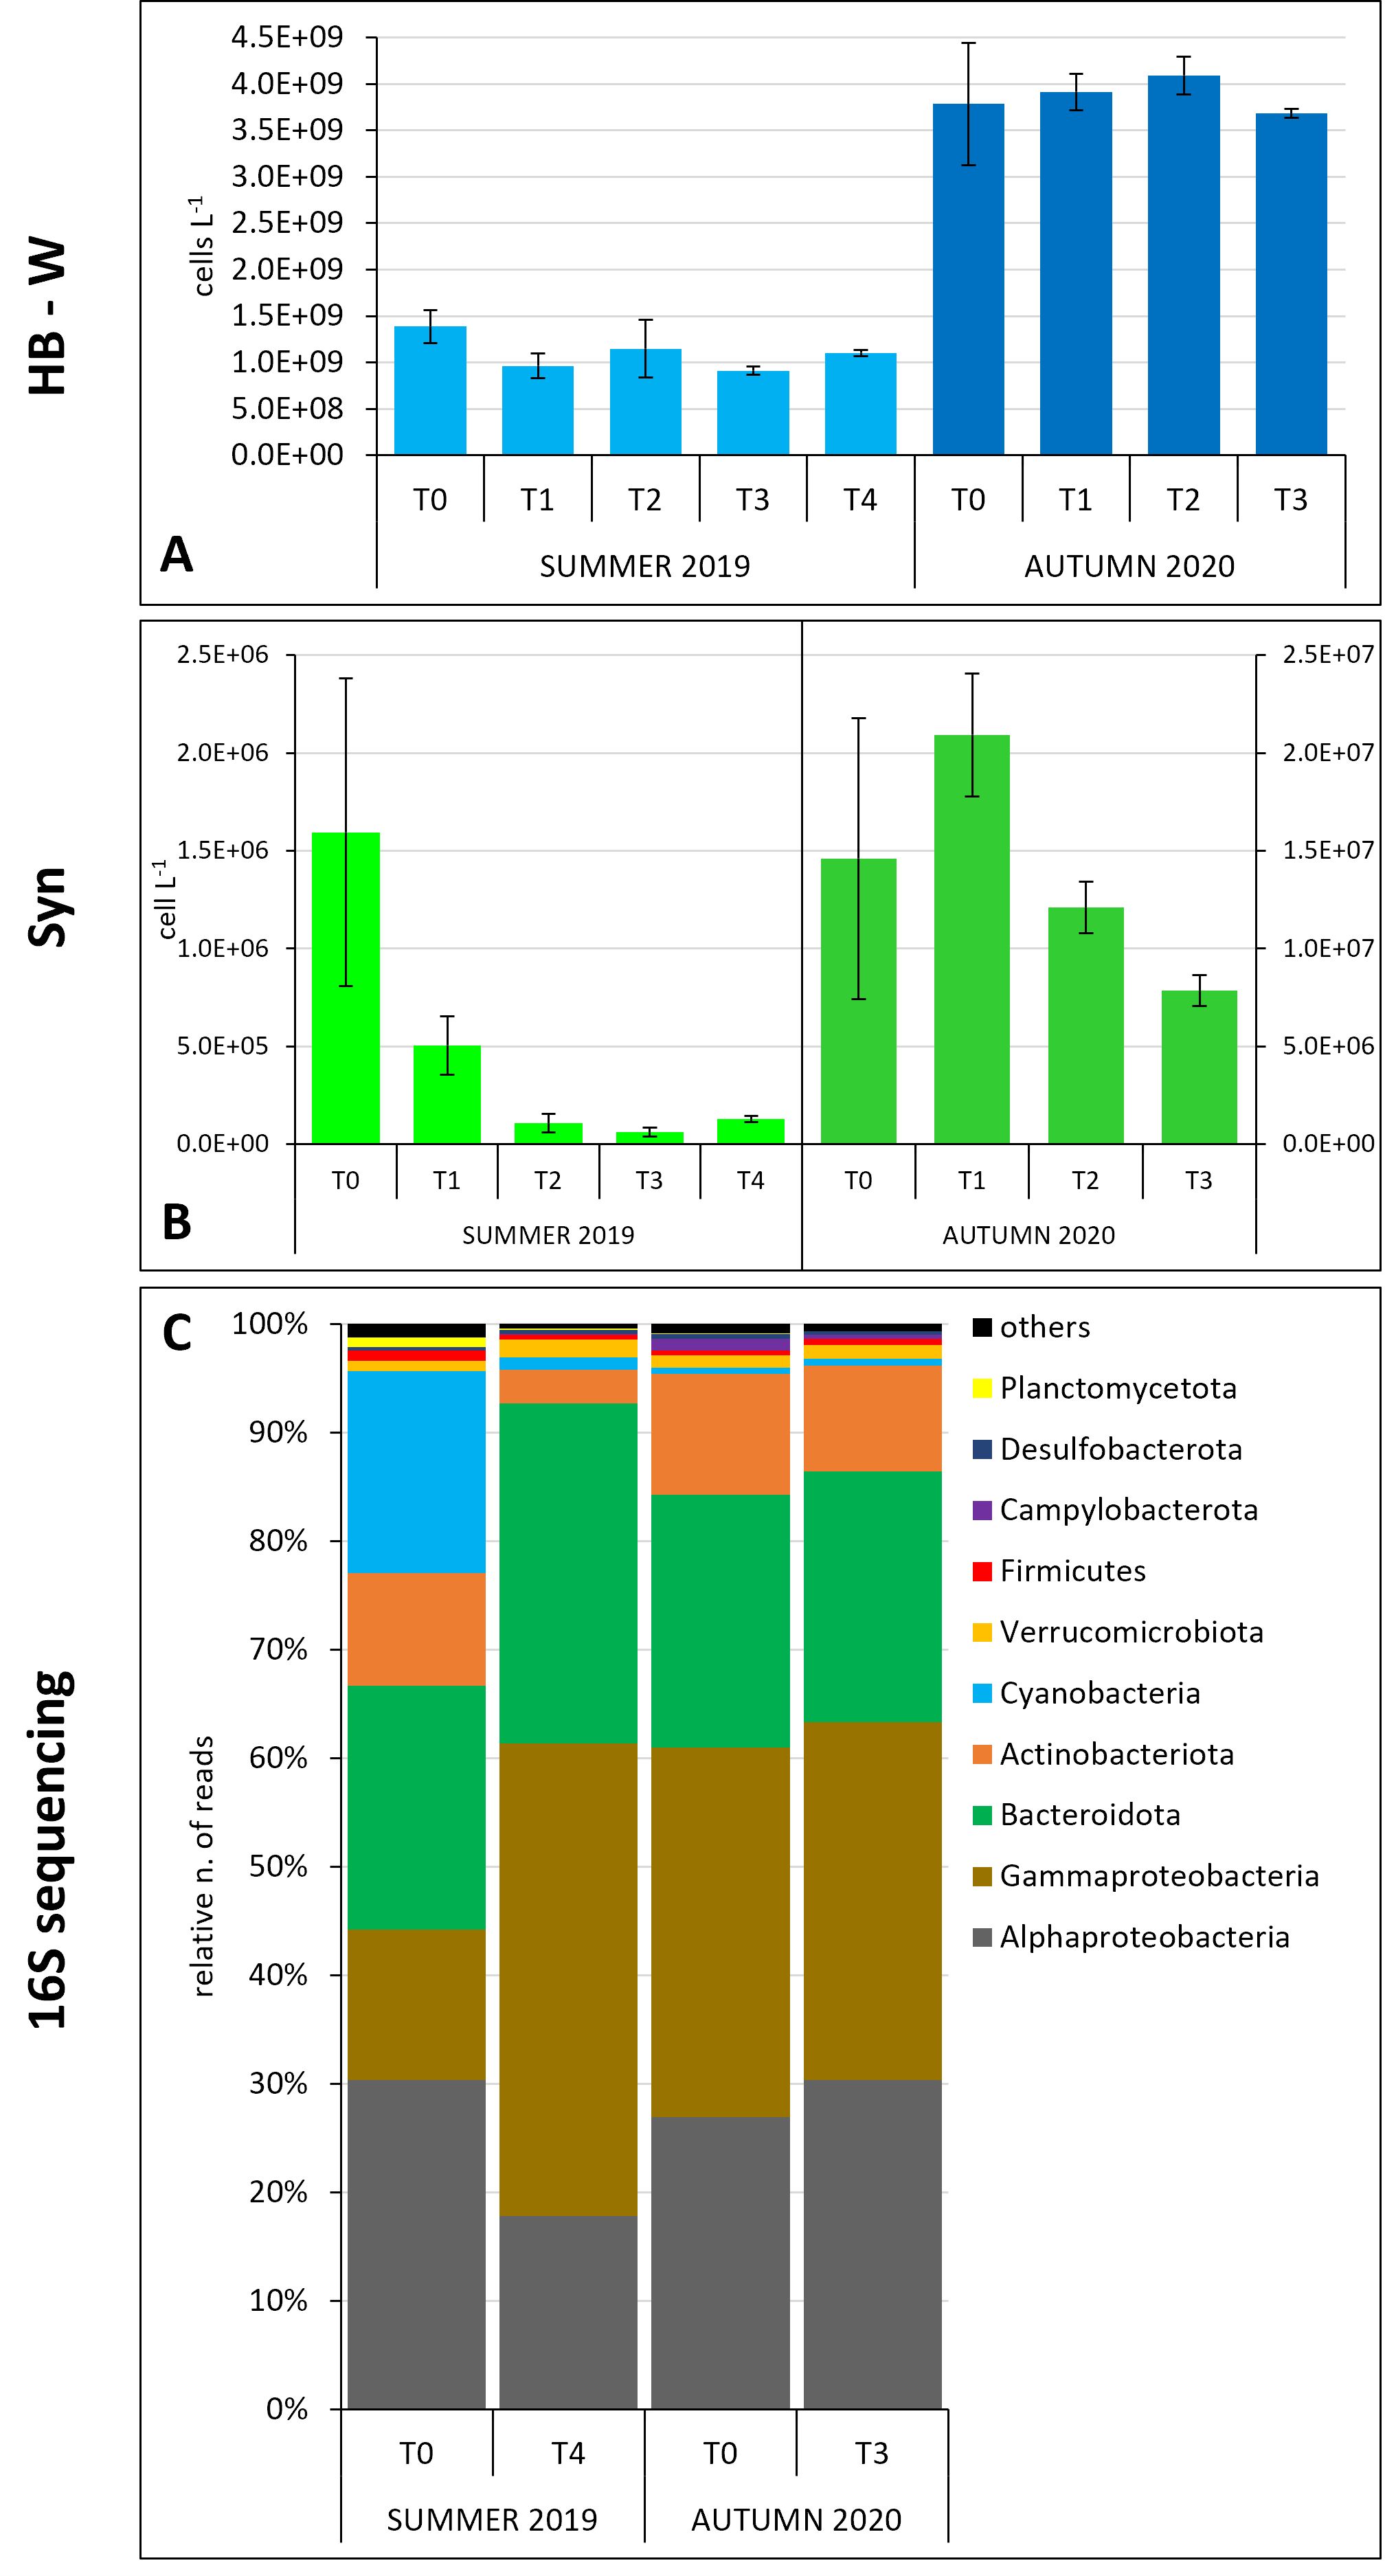
Figure 2. Prokaryotic community dynamics in the water column in the two experiments. (A) Heterotrophic bacteria (flow-cytometry data); (B) Synechococcus (flow-cytometry data); (C) major prokaryotic groups relative abundances (16S gene sequencing data) (the taxa representing relative number of reads ≥ 0.3% are shown).
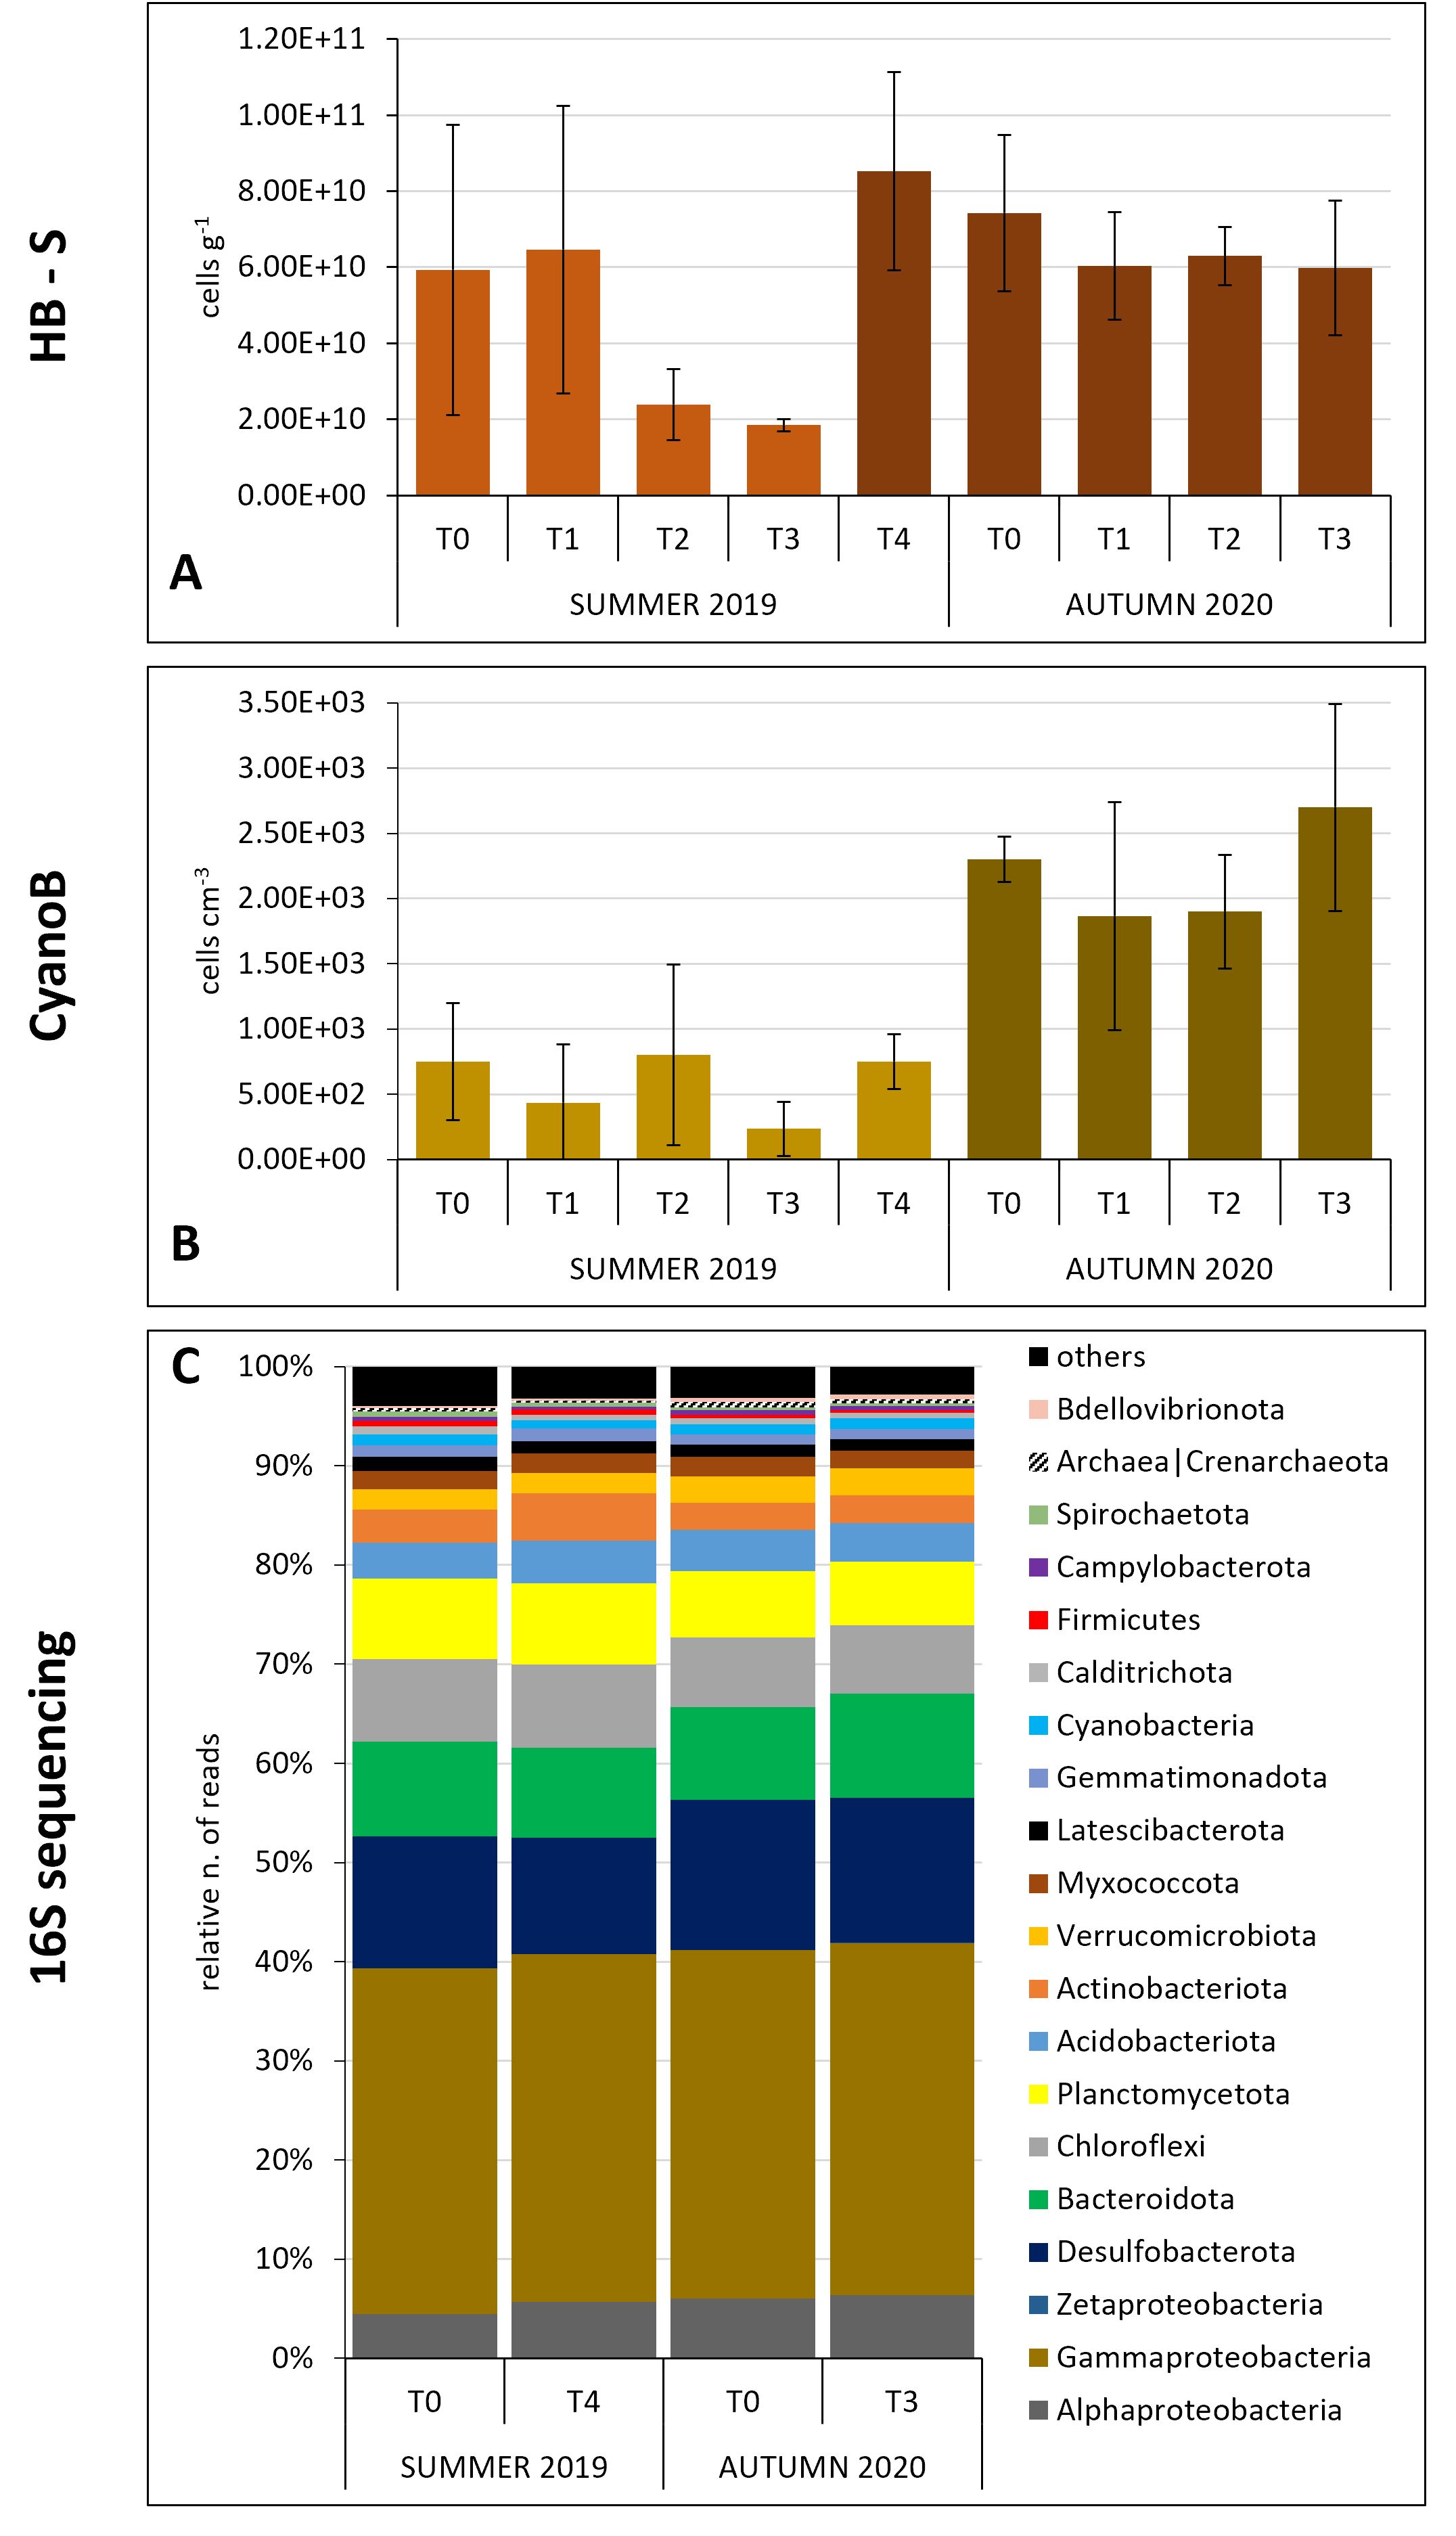
Figure 3. Prokaryotic community dynamics in the sediments in the two experiments. (A) Heterotrophic bacteria (flow-cytometry data); (B) cyanobacteria (microscopy data); (C) major prokaryotic groups relative abundances (16S gene sequencing data) (the taxa representing relative number of reads ≥ 0.3% are shown).
For the 16S sequencing data the initial number of total ASVs was 19592 which after filtering became 18957. The rarefaction curves confirm that all the samples reached the plateau despite the different sequencing depth. A total of 78 phyla were identified in the dataset.
Considering the main bacterial phyla (relative number of reads > 0.3%), the different proteobacteria classes and the archaea, a sharp decrease in the relative abundances of cyanobacteria reads was evident in the water column in summer, consistently with what was observed through flow-cytometry for Synechococcus, from the beginning of the experiment to the end (p = 0.017, H = 12.1). Actinobacteria and Alphaproteobacteria also showed a decrease at T4 compared with T0 (Figure 2C). In autumn, the prokaryotic community in water samples appeared to be more stable with no evident changes over the experiment (Figure 2C), except for the Synechococcus that showed a sharp decrease from the initial times of the experiment through the end (Figure 2B, p = 0.041, H = 8.231). Similarly, in the sediments, the dynamics of the major bacterial groups, in terms of relative abundance, appeared to be stable during both the experiments (Figure 3C).
The LEfSe analyses on the prokaryotic community in the water column evidenced a higher number of differentially abundant ASVs at the beginning compared to the end of the first experiment, when ASVs ascribable to high G+C Gram-positive bacteria (Longivirga, Amycolatopsis, Nakamurella) became more abundant (Supplementary Table S3A). In autumn, the decrease in the abundance of specific ASVs during the experiment was less evident, but a notable decrease in Betaproteobacteria taxa was observed at T3 compared to T0 and an increase in genera (e.g.Azotobacter and Sulfurimonas) usually associated with sediments (Supplementary Table S3B). Regarding the sediments, the LEfSe analyses did not show an evident change in the absolute number of differentially abundant ASVs between T0 and T4. It must be noted that, at T4, cyanobacterial and archaeal taxa disappeared from the relatively highly represented ASVs, while one Firmicutes and two other green-non sulfur bacteria appeared (Supplementary Table S4A). In contrast, in autumn, a higher number of differentially abundant ASVs was observed in the sediments at the end of the experiment compared to the initial situation. These differences were due especially to members of the group Cytophaga-Fusobacterium-Bacteroides and two verrucomicrobial ASVs that emerged at T3 compared to T0, coupled with the disappearance of Firmicutes and fusobacteria (Supplementary Table S4B).
3.3 Phytoplankton community
In the first experiment, phytoplankton analyses revealed an initial community (T0) composed of flagellates (44.9 ± 14.5%), dinoflagellates (38.8 ± 18.0%, particularly small (< 20 µm) undetermined 'naked'), and diatoms (16.4 ± 6.9%) (Figure 4A). Among the diatoms, Thalassiosira sp. and a small (<10 µm) pennate diatom were the dominant taxa (Figure 4C). However, over the course of the experiment, Thalassiosira sp. decreased, while the small pennate diatoms increased further. Finally, undetermined forms < 10 µm, cryptophytes and coccoid forms were the most abundant among the flagellates (Figure 4C). The higher abundance of dinoflagellates in the classical taxonomy was matched by the high prevalence of dinoflagellate sequences in the 18S-sequencing dataset (Figures 4C, D). Compared to T0, total phytoplankton abundance increased almost twofold and threefold at T2 and T3, respectively, and then decreased, to approximately the initial values, at T4 (Figure 4A).
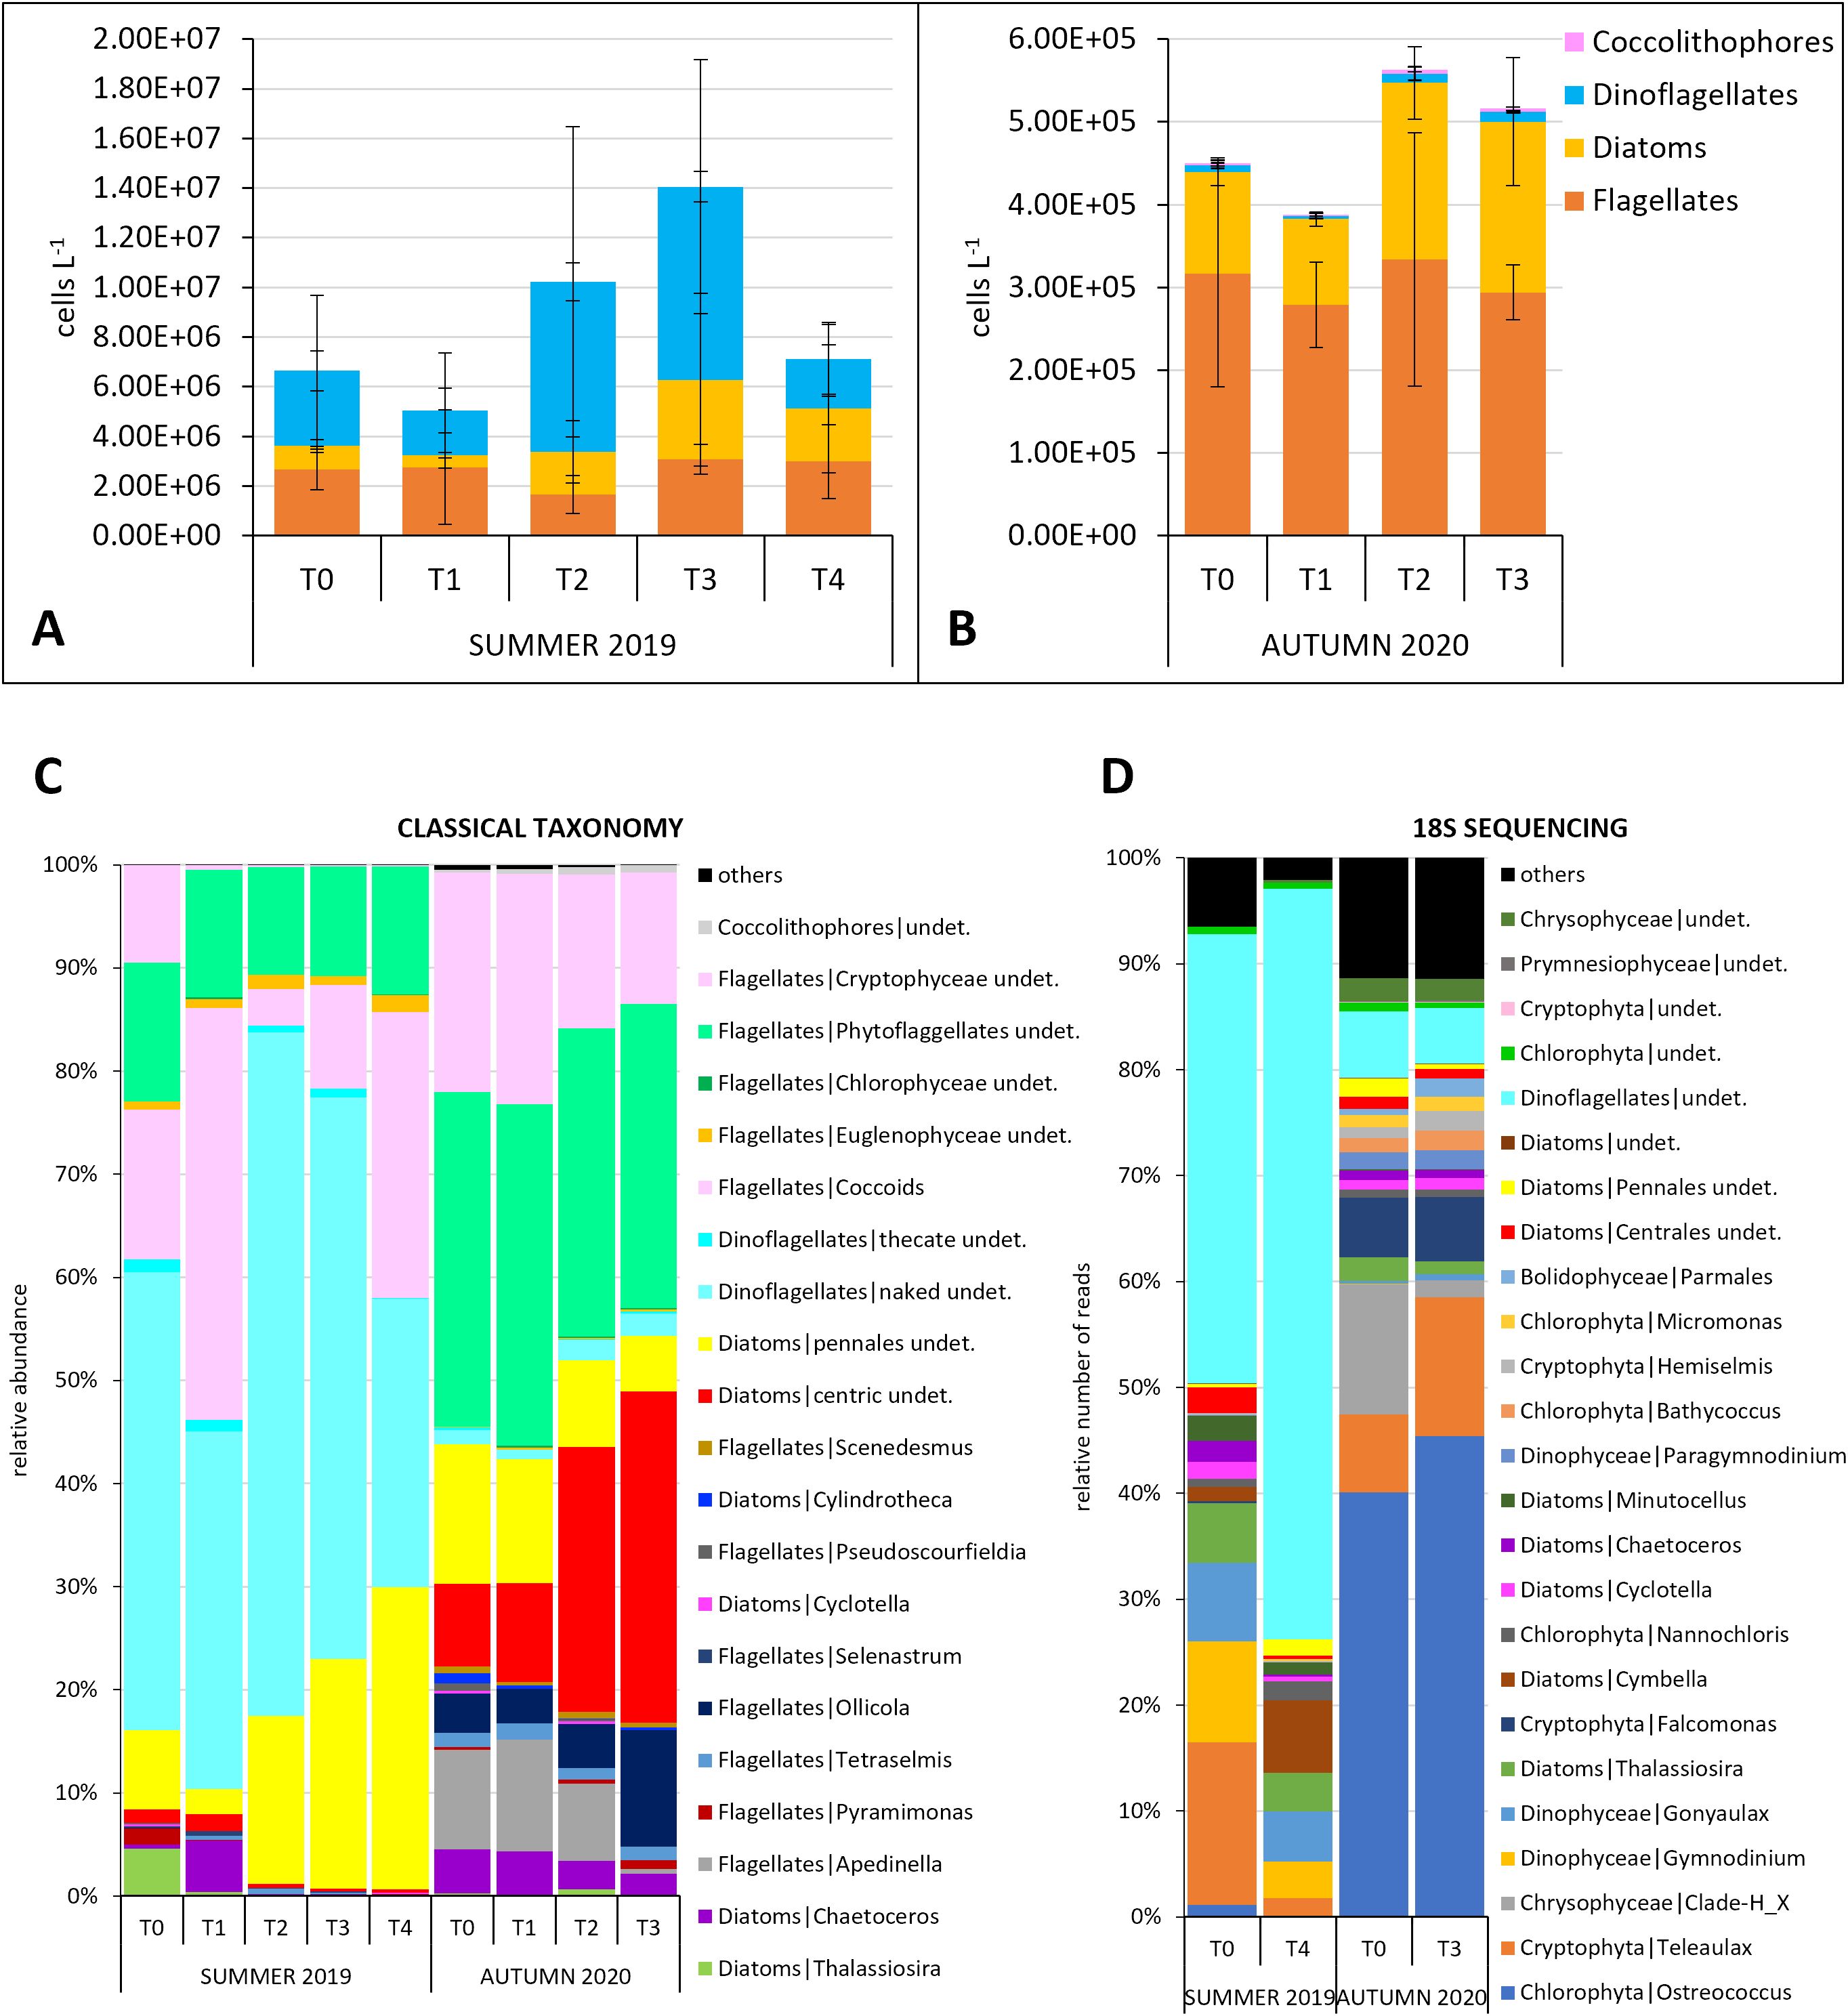
Figure 4. Phytoplankton community dynamics. (A, B) Total abundances divided in the main microalgal groups for the two experiments (microscopy data); comparison between the taxonomic composition of the phytoplankton community obtained through (C) microscopy and (D) 18S RNA gene sequencing (the species/ASVs representing relative number of cells/number of reads ≥ 0.5% are shown).
In the second experiment, the phytoplankton initial total abundance was much reduced, by about two orders of magnitude, compared to the summer conditions (Figure 4B). Dinoflagellates numbers dropped considerably to give space to diatoms. The initial community (T0) consisted mainly of flagellates (68.4 ± 9.7%) and diatoms (29.5 ± 10.5%). Among the flagellates, undetermined forms < 10 µm and cryptophytes dominated, while among the diatoms, species < 20µm belonging to the genus Chaetoceros, a small (< 20 µm) undetermined centric diatom and pennate species < 20 µm were the most abundant (Figure 4C). The diatoms doubled in number from T0 to T3, mainly due to small (< 20 µm) undetermined centric forms (p = 0.041, H = 8.276) (Figures 4B, C). The high abundance of diatoms observed in the microscopy analysis was not matched in the metabarcoding dataset (Figures 4C, D).
In the summer experiment, the LEfSe analysis applied to 18S sequencing data identified two Thalassiosira species that showed higher abundances at the beginning (T0). Also in light microscopy, the genus Thalassiosira was observed with higher abundances at T0, while it decreased at T4, when the LEfSe analysis no longer revealed its presence but a higher representation of dinoflagellates (Supplementary Table S5A). In autumn, many diatom species were the most discriminating for the T0, while at T3 different dinoflagellate and flagellate taxa took over (Supplementary Table S5B).
3.4 Microphytobenthic community
In the first experiment, the average MPB abundance of the three replicates showed a 3-fold increase from T0 to T4. The MPB community was dominated by diatoms (RAs > 92%) (Figure 5A). Through microscopy-based taxonomy, 26 diatom genera were identified, among which the most abundant were Tryblionella and Thalassiosira. During the experiment Tryblionella and the epipelic Psammodictyon increased, whereas the planktonic genus Thalassiosira and the tychopelagic diatom Paralia decreased in abundance (Figure 5B). In the second experiment, the average MPB abundance almost doubled at T3 compared to T0. As in the first experiment, the MPB community was strongly dominated by diatoms (RAs > 98% in all samples) (Figure 5A). We observed an increase in the abundance of Gyrosigma and Surirella at the expense of Tryblionella, Nitzschia and Paralia. The 18S rRNA gene metabarcoding applied to summer data revealed that Nitzschia, Cymbella, and Navicula, increased their occurrence over the experiment whereas Thalassosira displayed a slight decrease as other undetermined centric diatoms (Figure 5C). During the second experiment, Thalassosira, although not observed through classical microscopy, was detected with metabarcoding. Similarly, also small (<10 µm) diatoms e.g.Minutocellus and Chlorophyta were detected. As in the first experiment, Navicula increased its occurrence as well as Pleurosigma.
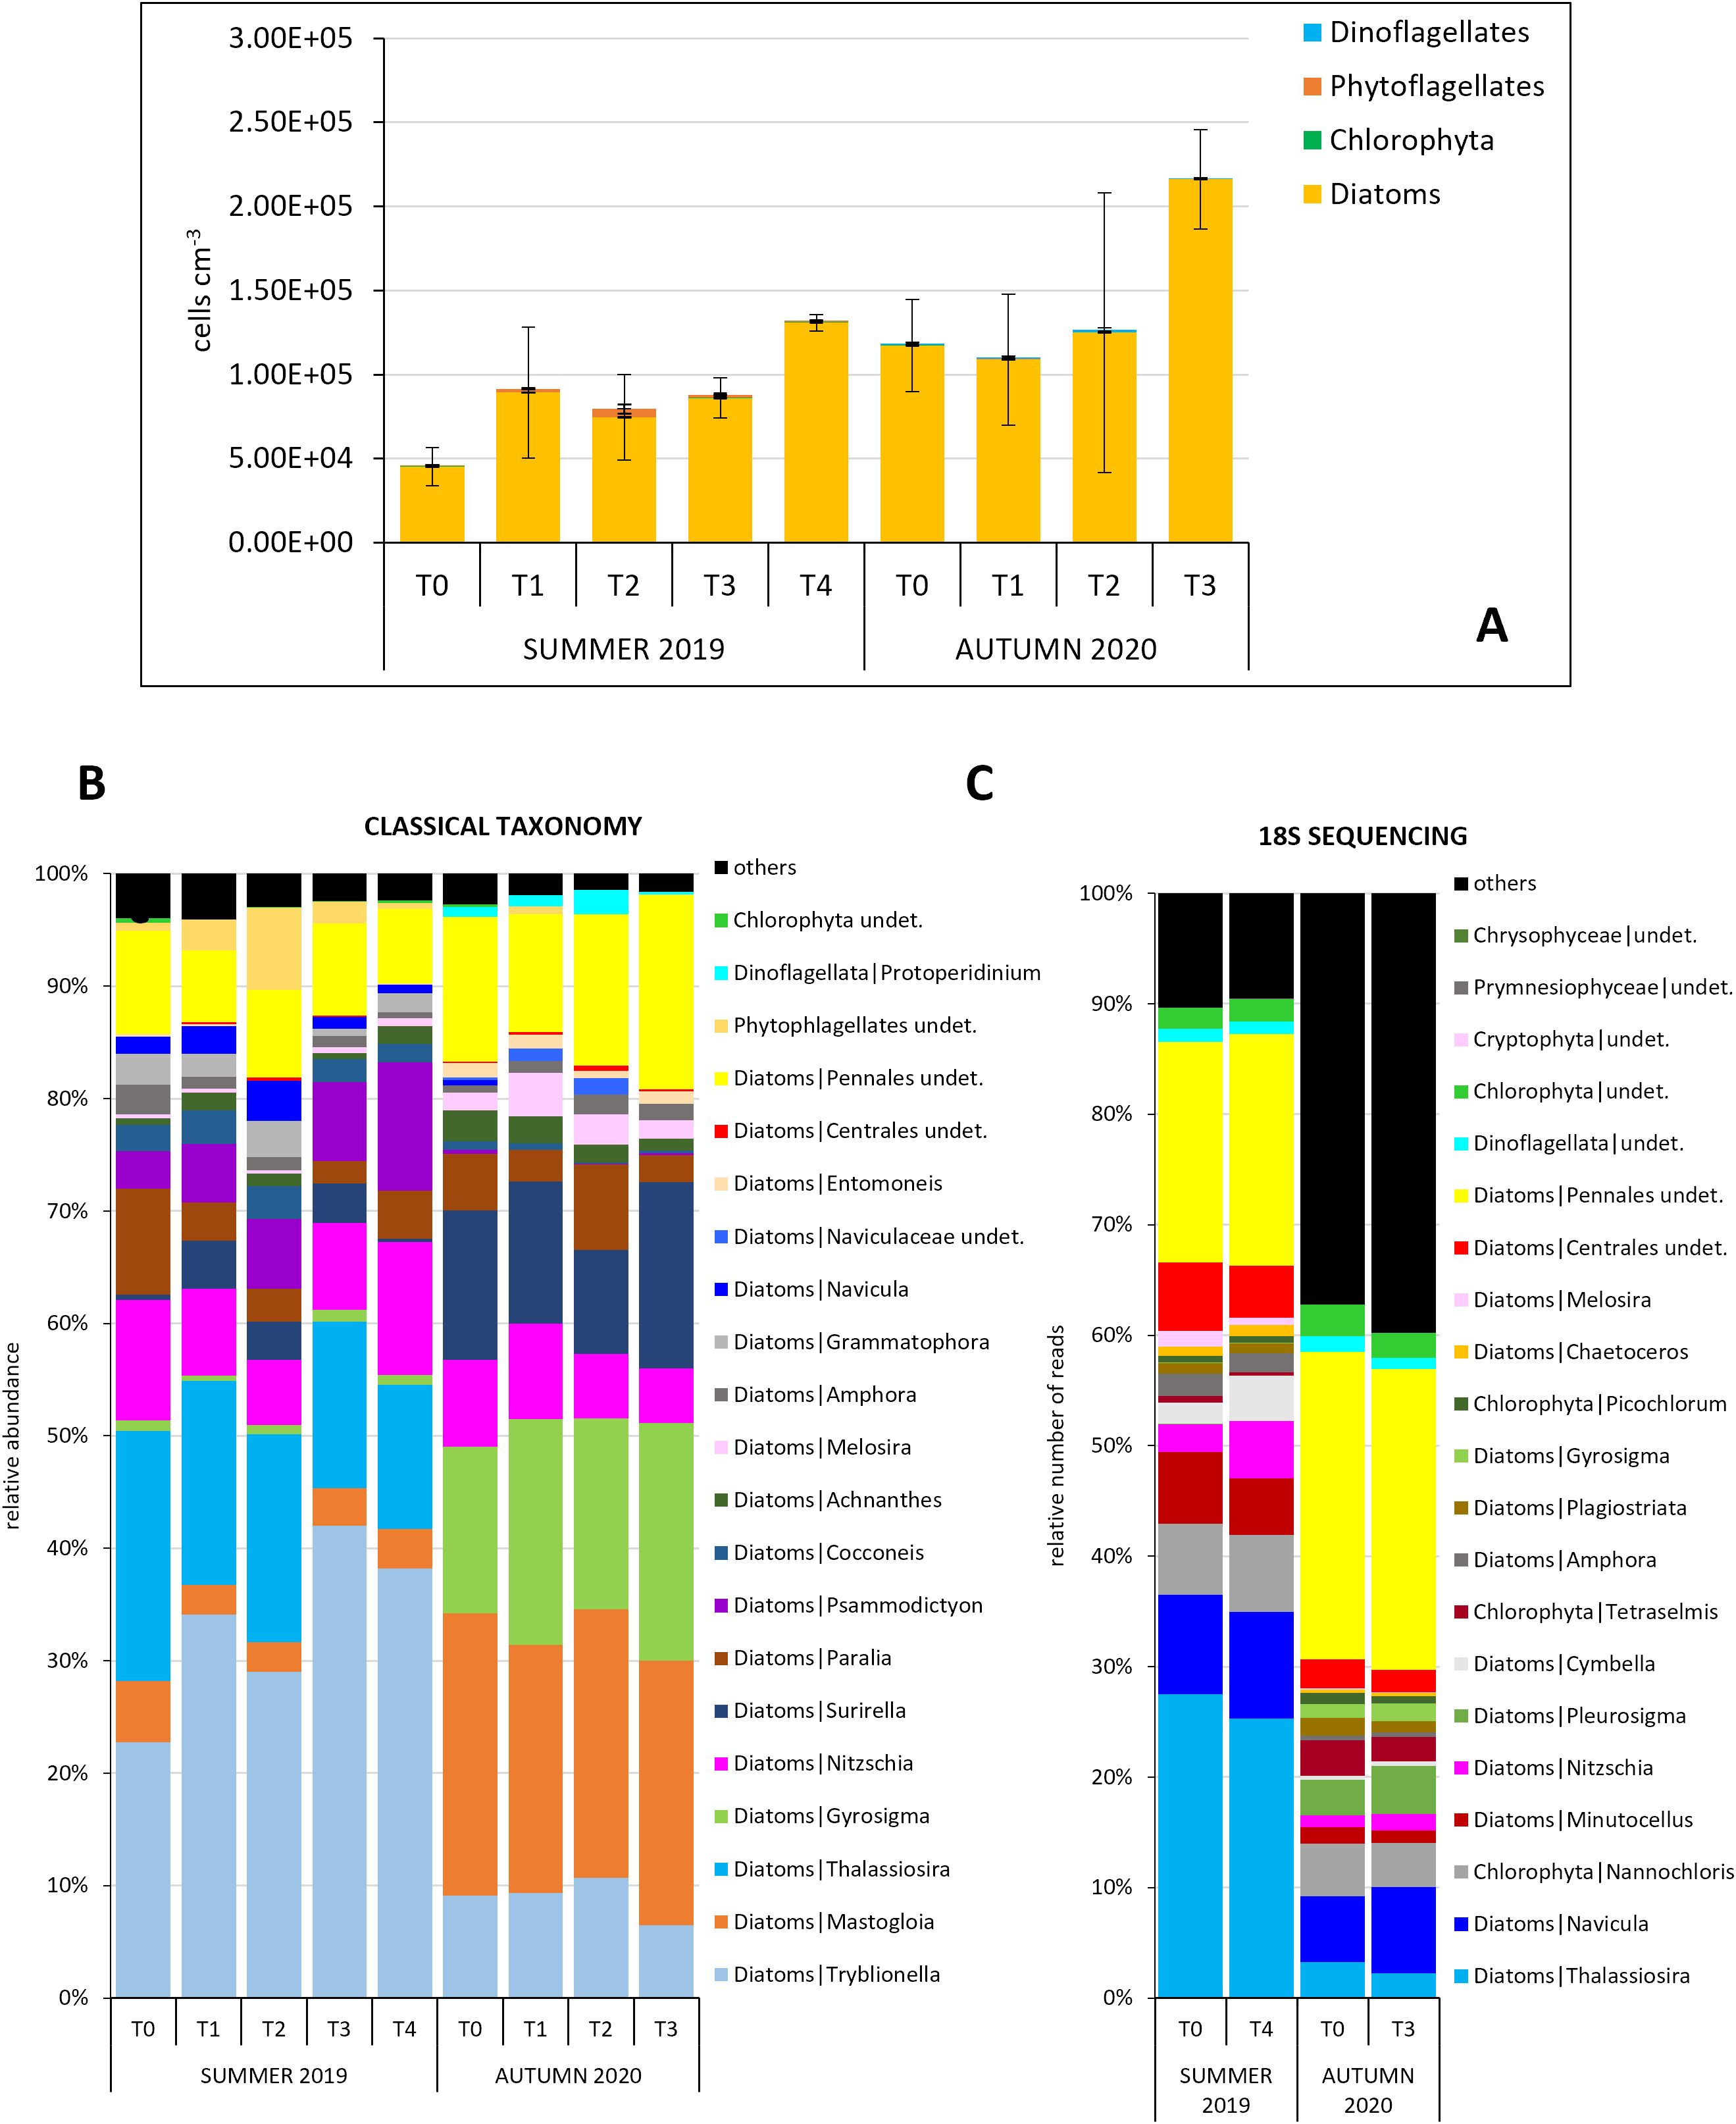
Figure 5. Microphytobenthic community dynamics. (A) Total abundances divided in the main microalgal groups for the two experiments (microscopy data); comparison between the taxonomic composition of the MPB community obtained through (B) microscopy and (C) 18S RNA gene sequencing (the species/ASVs representing relative number of cells/number of reads ≥ 0.5% are shown) (Data presented in Baldassarre et al., 2023).
The LEfSe analysis applied to metabarcoding data allowed us to identify which MPB taxa were the most discriminating between the beginning (T0) and the end of the experiment (T4). In the summer experiment, several diatoms belonging to the order Fragilariales significantly decreased in abundance at T4, while the diatom Tryblionella, along with few dinoflagellate taxa increased (Supplementary Table S6A). In autumn, the LEfSe analysis at T3 determined several species belonging to the diatom genus Navicula as the most discriminating taxa. In contrast, again several taxa of the order Fragilariales together with Staurosiraceae displayed significantly higher abundances at T0 than at T3 (Supplementary Table S6B).
3.5 Primary production and heterotrophic carbon production
In summer, a sharp drop in the PP-W rate was recorded after 4h from the beginning of the experiment (p = 0.02, H = 11.7) (Figures 6A). In contrast, during the second experiment, PP-W showed an absolute peak at T1, consistently observed in all three enclosures, and a progressive decrease up to T3 (p = 0.016, H = 10.385) (Figures 6B). Not surprisingly, in summer the PP-W rate was one order of magnitude higher than in autumn.
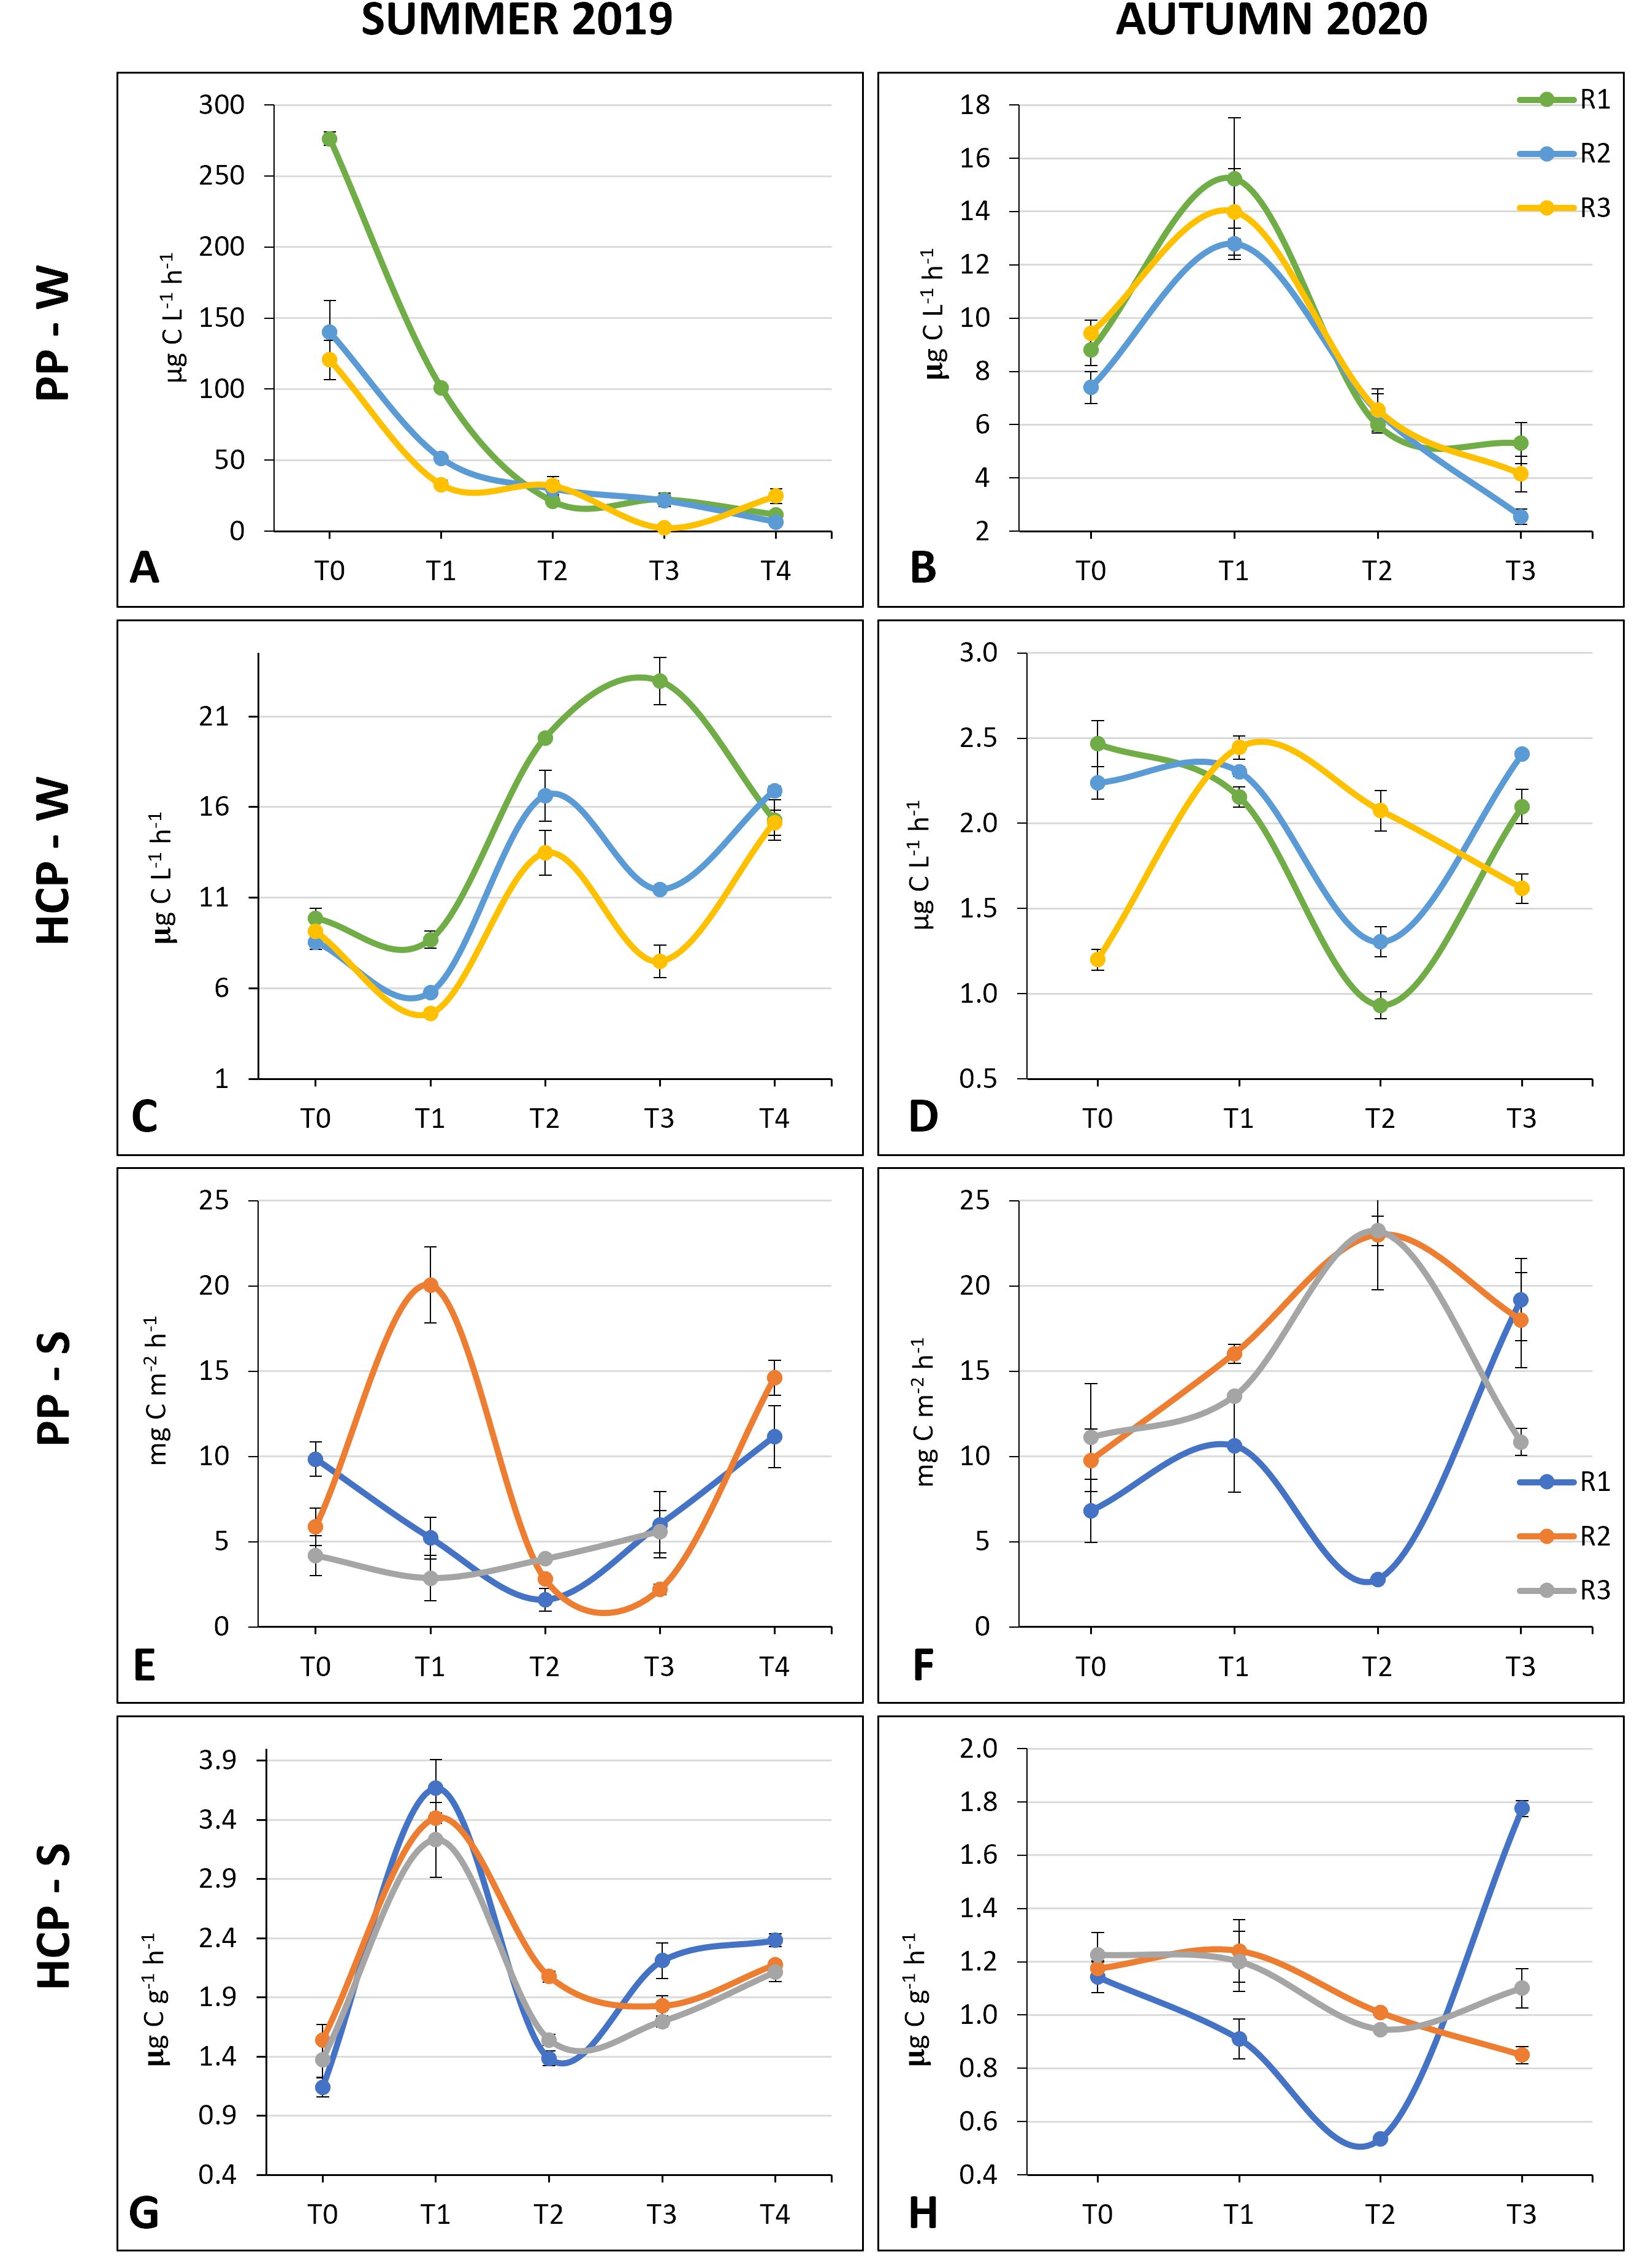
Figure 6. (A–F) Primary production and (C–H) Heterotrophic bacteria production rates in the water column and in the sediments in the summer and in the autumn experiment.
Regarding the PP-S, dissimilar dynamics among the three different enclosures were displayed. In summer, a peak was observed at T1 in one enclosure, and higher rates were reached at the end of the experiment compared to T0 (Figure 6E). In the second experiment, in the enclosures R2 and R3, maxima PP-S rates were estimated at T2, when in R1 was obtained the minimum PP-S of the experiment (Figure 6F). In summer, an increase in the HCP-W rate was observed in all replicates at T2 and at the end of the experiment (Figure 6C). In autumn, the HCP-W rates were up to one order of magnitude lower than those observed in summer (Figure 6D). In two enclosures, the HCP-W rates dropped at T2, while at the end of the experiment they were comparable or slightly lower than at the beginning of the experiment.
In the first experiment, the peak in the HCP-S rates was observed in advance compared to the HCP-W (T1 vs T2 respectively) and the pattern was consistent among the three experimental replicates. HCP-S rates increase of almost 4 times after 4h (p = 0.014, H = 12.456) (Figures 6G). In the second experiment, similarly to what was observed for the HCP-W, the HCP-S rates were lower than those measured in summer. The pattern was constant over the course of the experiment for two replicates, with comparable or slightly lower HCP-S rates at T3 compared to T0 (Figure 6H).
3.6 Meiofauna
To have an indication of the predatory pressure on the microphytobenthic community, the meiofauna were sampled and analyzed in the top (0–1 cm) sediment layer, where the majority of the benthic microalgae thrive. Overall, the highest meiofaunal abundance was observed at T2, after 24h from the beginning of the experiment (Supplementary Figure S6). The composition of the large meiofaunal groups revealed a community predominantly consisting of nematodes at all sampling times. The second dominant group were the harpacticoid copepods and their naupliar forms, whose abundance increased at T2 by around 50%.
3.7 Macrozoobenthos
In both sampling periods, the macrofaunal community was characterized by euryhaline and eurythermal species. In summer, the polychaete Hediste diversicolor dominated the community at T0 and T4 (37.7 ± 16.6 and 36.3 ± 10.3 ind. m-2, respectively). In contrast, the polychaete Aphelochaeta filiformis and the crustacean Cyathura carinata were the most abundant species at T0 (355.6 ± 320.5 and 103.7 ± 25.7 ind. m-2, respectively) and T3 (474.1 ± 295.9 and 281.5 ± 142.9 ind. m-2, respectively) in autumn (Supplementary Figure S7).
3.8 Influence of abiotic variables on the structure and function of microbial communities
To test if the modified physical and chemical features of the water column and surface sediments inside the enclosures affected the structure and function of pelagic and benthic microbial communities, a Principal Component Analysis (PCA) was carried out on the four abiotic data matrices, separately. In water, the total variance explained by the first two PC axes accounted for 71.8% and 73.6% of the total variance for the summer and autumn experiment, respectively, whereas for the sediment, PC1 + PC2 explained 58.6% and 71.1% of the total variance, in the first and second experiment, respectively (Figure 7). For the summer water column data, the PCA revealed the significant correlation between the biotic and abiotic variables, in particular Synechococcus, picoeukaryotes and PP-W, with N-NO2 and N-NO3, and HCP-W with N-NH4. Sampling times were positioned accordingly: T1 group in correspondence to higher autotrophic abundances and rates, T2 and T4 groups close to the highest HCP-W and N-NH4 values (Figure 7A). For the PCA performed on the autumn water column data, a higher diatom abundance was evidenced in correspondence to an increase in N-compounds and silicates, at T3, whereas the maximum PP-W rate, observed at T1, was linked to Synechococcus (Figure 7B). For the sediment data of the first experiment, HCP-S was strongly linked to lipids and proteins (Figure 7C), while for the sediment autumn data, there was no clear relation between the abiotic and biotic variables (Figure 7D). The physical-chemical features of water and sediments inside the enclosures significantly differed among experimental times in both seasons (RANOSIM = 0.63 and 0.62, p = 0.001 in water; RANOSIM = 0.409, p = 0.006 in sediments) except for those in the sediments of the second experiment (RANOSIM = 0.115, p = 0.191).

Figure 7. PCA plots calculated on the environmental variables in the water column (A, B) and in the sediments (C, D) in the two experiments. Base environmental variables (blue), and supplementary major taxonomic groups (red) and biological processes (dark red) are overlaid as vectors; ANOSIM test results are reported at the bottom-left corner of each plot.
The BIO-ENV analysis (Supplementary Table S7) indicated that in summer 2019 the planktonic microbial communities were best correlated (R = 0.900) with three inorganic nutrients (N-NH4+P-PO4+Si-Si(OH)4), while in autumn 2020, the abiotic variables that best correlated (R = 0.625) were salinity, and again P-PO4 and N-NH4. In the first experiment, the benthic microbial communities were equally best correlated (R = 0.750) with two variables, namely TOC and complex carbohydrates, and three variables, i.e. labile and complex carbohydrates together with lipids. In the second experiment, only lipids emerged as the best correlated (R = 0.750) variable with the benthic communities.
4 Discussion
4.1 Variation in oxygen concentration in the enclosures
Unlike benthic chambers, the enclosures were built to preserve the vertical fluxes between both boundary layers (i.e. water/air and water/sediment), whereas the horizontal ones (i.e. water exchange between the inside and outside of the mesocosms) were blocked, to mimic the segregation of the lagoon from the oxygen-enriched seawater when the MOSE flood barriers are raised for several hours. Although the duration of the experiment could seem very long (48h), after our experiments were concluded, it sometimes occurred that the MOSE was kept closed also up to 2 days, for instance from 4th to 6th December 2020, when the flood barriers were up uninterruptedly for 48 hours due to very strong southern wind (MOSE Venezia).
During the summer experiment, the oxygen concentration inside the enclosures was significantly lower compared to outside but, contrarily to our hypothesis, hypoxia did not develop in the enclosures although the first experiment was carried out during the second heatwave of 2019 (SNPA - Arpa-Appa-Ispra, 2024). In the Venice lagoon, continuous hypoxic conditions generally last less than 24h and, in the confined sites at temperatures of ca. 25 °C dissolved oxygen concentration in the water column can be depleted in about a day (Leoni et al., 2022).
During the autumn experiment, we observed only a slight reduction in oxygen concentration inside the enclosures over 28h. It is likely that a longer period of segregation from the oxygenating seawater should be maintained to reach hypoxic conditions in the enclosures. The MOSE system is currently activated mostly in autumn (MOSE Venezia), when low water temperatures do not trigger a relevant consumption of dissolved oxygen in the lagoon (Leoni et al., 2022). Moreover, the overall higher hydrodynamics of the lagoon in autumn, the windy conditions during our experiment and the greater tidal excursions might have caused a certain degree of water mixing inside the mesocosms that did not occur in summer. Nevertheless, the ongoing climate change, with an increase of the average sea-level and higher incidence of severe storms, could lead to longer lasting MOSE closure also at higher temperatures in the future (Cavaleri et al., 2020; Leoni et al., 2022). This could in turn lead to higher oxygen consumption rates in the water column, particularly in the most confined areas of the lagoon (Brigolin et al., 2021).
4.2 Temporal changes in the prokaryotic communities’ structure and abundance
In the water column the cyanobacterial fraction was negatively impacted by the reduction of the hydrodynamics so that it almost disappeared over the course of the summer experiment. This could be due to the decreasing concentration of some inorganic nutrients (i.e. nitrites and nitrates) that affected the photosynthetic activity of these organisms. Contrarily, Gammaproteobacteria and high G+C Gram-positive bacteria (i.e. the actinobacteria taxa: Longivirga, Amycolatopsis and Nakamurella) became more abundant at T4, possibly, taking advantage of the additional organic matter load derived from the lysis of the photoautotrophic cells (Ul-Hassan and Wellington, 2009). Interestingly, in the sediments at the end of the summer experiment, we observed some taxa that usually belong to the water column (i.e. some green-non sulfur ASVs) that likely settled because of the lower hydrodynamics. In autumn, a higher number of differentially abundant ASVs was observed in the sediments at the end of the experiment compared to the T0. In particular, members of the group Cytophaga-Fusobacterium-Bacteroides and two verrucomicrobial ASVs, known to be anaerobic organoheterotrophs and fermenters (Flint and Stewart, 1999; Fuerst, 2019) increased in abundance, probably stimulated by the increased sinking of organic matter. On the other hand, members of the Firmicutes and of the Fusobacteria disappeared; the latter, obligate anaerobes (Brook, 2010), were probably inhibited by the slow diffusion of brackish water at the bottom of the mesocosms.
4.3 Variation in abundance and structure of eukaryotic microbial communities inside the enclosures
During the first experiment, small pennate diatoms were highly abundant in the water column, indicating that a certain degree of resuspension occurred in the enclosures. In both experiments, particularly in summer, the total phytoplankton abundance increased, up to three times, likely due to the higher availability of ammonium and N-compounds in the water column after 24 hours (Supplementary Figure S1). During the first experiment, Thalassiosira sp., previously reported to dominate the diatom community in the innermost part of the Venice Lagoon in summer (Bernardi Aubry et al., 2022; Facca et al., 2002), decreased, settling from the water column towards the sediments due to lower hydrodynamics in the enclosures, and becoming part of the MPB community.
A shift in the phytoplankton community composition was also observed in both experiments and confirmed by LEfSe analysis: in summer from diatom- to dinoflagellate-dominance, and in autumn from diatoms to flagellates and dinoflagellates; the latter, though not particularly abundant, strongly differed between the beginning and the end of the experiment. Although the composition of the plankton community was thoroughly different in the autumn experiment, diatoms again appeared to be favorably influenced by both the lower hydrodynamics, and higher availability of nitrates. In this case, small, opportunistic, centric diatoms increased in density. Cyclotella and other small, centric planktonic taxa are good indicators of major nutrient concentrations, eutrophication and poor water quality (Weckström and Juggins, 2006).
Generally, the 18S sequencing was able to detect many small phytoflagellates (i.e. Chrysophyceae, Prymnesiophyceae and Chlorophyta) without a hard theca or shell, otherwise non-detectable through microscopy because of their small size or because they were ruptured (Baldassarre et al., 2023).
During both experiments, the benthic diatom abundance doubled from the beginning to the end of the experiment likely due to TOC and BPC enrichment (Supplementary Figure S3) in the surface sediments deriving from the deposition of fresh organic material from the water column. This was confirmed by the BIO-ENV analysis, in which TOC, lipids and carbohydrates were the best correlated variables. The MPB community is known to be strongly stimulated by high organic loads (Cibic et al., 2017; Franzo et al., 2014; Rogelja et al., 2018). Over the first experiment, nutrient-loving species belonging to the genera Tryblionella and Psammodictyon, that thrive under high organic matter conditions (Agatz et al., 1999; Cibic et al., 2019; Rogelja et al., 2018), proliferated inside the mesocosms. In the second experiment, taxa belonging to the diatom genus Gyrosigma, which thrives in organic enriched sediments (Franzo et al., 2014; Hunter, 2007), took advantage of the modified physical-chemical conditions inside the mesocosms. Also, Mastogloia, whose occurrence was found to be positively correlated with phosphate (Sabanci, 2012) doubled its density from the beginning to the end of the experiment. Similarly, in autumn, several Navicula species tolerant to high organic loads took over and became dominant components of the MPB community (Cibic et al., 2017; Franzo et al., 2014; Rogelja et al., 2016).
Modifications in lagoon hydrodynamics during prolonged MOSE closure could lead to shifts in the structure of the benthic diatom community and this, in turn, could have severe ecological repercussions. Pennate diatoms secrete extracellular polymeric substances (EPS) (Underwood and Paterson, 2003) and are therefore crucial bio-stabilizers of cohesive sediments, reducing resuspension and preventing erosion in shallow water systems (De Brouwer et al., 2005). Since EPS production is species-specific, the degree of sediment stabilization depends on the structure of the MPB community (Bruckner et al., 2011; Underwood and Smith, 1998). Navicula, Nitzschia, Amphora and Thalassiosira, and in general motile, large-sized diatoms are all EPS-producers, Paralia is not, while there is limited information on Tryblionella (Kim et al., 2021; Underwood and Smith, 1998). Navicula is also reported to be the key diatom genus in sediment bio-stabilization (Kim et al., 2021). Modifications in the structure of the MPB community, induced by prolonged MOSE closures, could therefore lead to possible changes in their ability to bio-stabilize cohesive sediments, should non-EPS producers largely replace the EPS-producers (Baldassarre et al., 2023). Since loosely bio-stabilized sediments are easily suspended, this could negatively affect water column turbidity (Pivato et al., 2019) and the overall primary production of the lagoon ecosystem.
4.4 Influence of induced confinement on benthic fauna
In summer, the increase of harpacticoid copepods and their naupliar forms in the uppermost sediment after 24 hours from the beginning of the experiment, was likely due to their migration from deeper sediments towards the surface layer (Supplementary Figure S6). This is in line with their lower tolerance to low oxygen availability compared to nematodes (Danovaro, 2009; Franzo et al., 2019). In contrast, closure periods of up to 48h were not long enough to affect the lagoon macrozoobenthic community (Supplementary Figure S7), naturally adapted to large fluctuations in salinity, temperature, and also oxygen (Elliott and Quintino, 2007).
4.5 Influence of MOSE closure on benthic-pelagic coupling and lagoon ecosystem functioning
During both seasons, we observed a slight increase of the clay fraction over the experiment (Supplementary Figure S3 and Supplementary Text), most likely due to increased hydrological stability inside the enclosures, which facilitated the sedimentation of fine particles previously suspended in the water. The higher occurrence of the clay fraction, already after 4 hours from the beginning of the experiment, could be attributed to flocculation of the particles with organic matter such as EPS in the water column (Ho et al., 2022; Ye et al., 2023), produced mostly by planktonic diatoms and microbes (Underwood et al., 2022), and quantified as carbohydrates, proteins and lipids in our study (Supplementary Figure S3 D, H). Also, the BGLU activity (Supplementary Figure S5D) increased over the summer experiment, indicating an active polysaccharide degradation occurring in the water.
Both the PCA and Kruskal-Wallis test (Figure 8) confirmed that the concentrations of N-NO2 and N-NO3, and some phototrophic components and functions (chl-a, Synechococcus, picoeukaryotes, PP-W) in the water column were significantly reduced over the summer experiment. The initial high concentrations of N-NO3 and N-NO2, originating from the Dese River (Zuliani et al., 2005), were likely promptly consumed by the prokaryotic and microbial eukaryotic communities in the enclosures. The smallest phototrophs gradually settled towards the sediments, drastically diminishing their abundance, whereas the largest phytoplankton cells (dinoflagellates and diatoms) took advantage and increased their density over the course of the experiment due to the significantly higher availability of N-NH4 (2.4 times higher after 24h), deriving from the prompt degradation of organic matter. Both large diatoms and dinoflagellates prefer to take up ammonium over nitrate (Huang et al., 2020). N-NH4 was found to be an important driver in shaping the structure of the phytoplankton community at the near bottom coastal waters where it is regenerated from the microbial activity, particularly in summer (Cibic et al., 2022a; Souza et al., 2011). Indeed, the higher TOC content and TOC/TN ratio in surface sediments, deriving from the gradual sinking of suspended particulate organic matter, highly stimulated the microbial components and processes, both in the water column (HCP-W increase of 86% after 24 h) and in the sediments (HCP-S increase of 2.7× after already 4 hours). In parallel, this higher availability of N-NH4 in the water stimulated the MPB abundance and the PP-S, in line with previous studies (Cibic et al., 2012; Sundbäck et al., 2004).
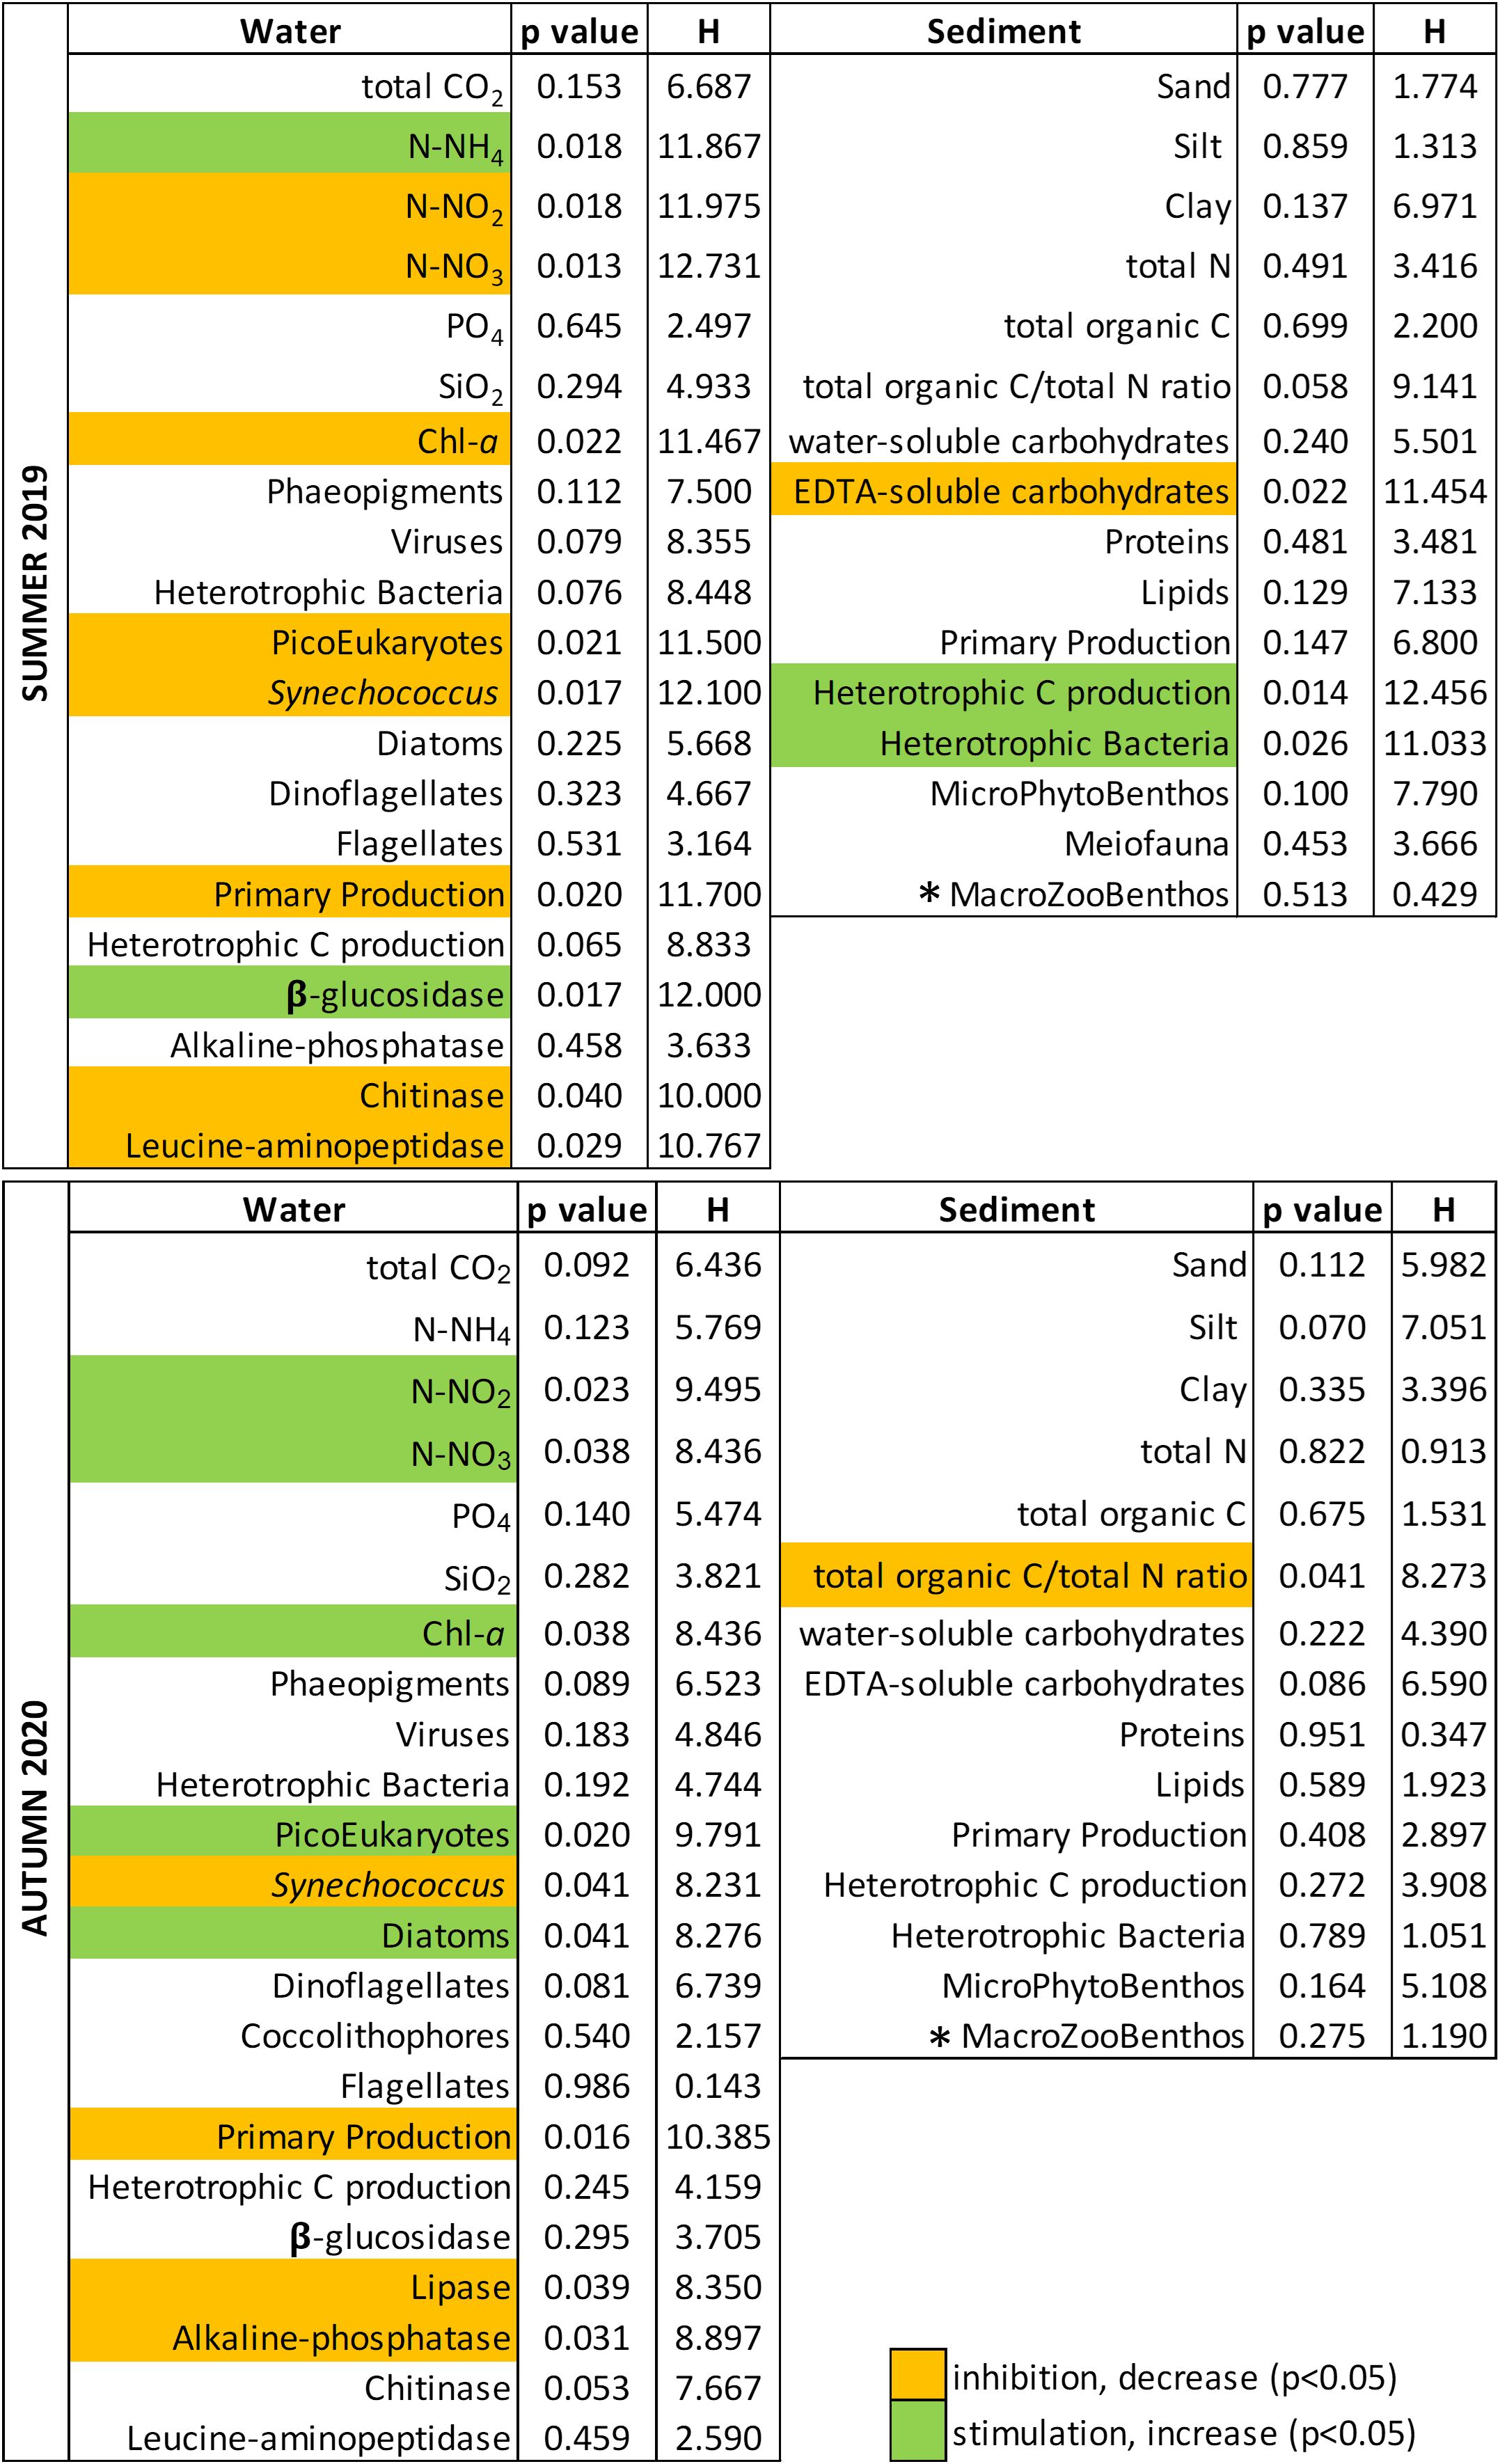
Figure 8. Kruskal-Wallis test results on all the parameters measured in the study according to the experimental time (the colors indicate the trend of each significantly affected parameter between the T0 and Tf of the two experiments), (* for the macrozoobenthos the test was performed only between T0 and Tf).
In the autumn experiment, most of the investigated variables displayed opposite patterns, likely ascribable to the different season and diverse meteorological conditions. HCP-W and exoenzymatic rates (Supplementary Figure S5) were one order of magnitude lower than in summer as a result of lower temperature (Celussi et al., 2019; Manna et al., 2019). Regarding the phototrophs, in October Synechococcus abundance was one order of magnitude higher than in July, in accordance with previous studies in the Venice lagoon and northern Adriatic Sea (Bernardi Aubry et al., 2006; Celussi et al., 2019). Since the large phytoplankton absolute densities were about two orders of magnitude lower than in summer, this cyanobacterium was likely the major contributor of PP-W. Indeed, PP-W dynamics during the autumn experiment closely mirrored the pattern of Synechococcus abundance. In coastal waters, when the micro-sized phytoplankton fraction is very scarce, the high photosynthetic rates are ascribable to cyanobacterial biomass (Cibic et al., 2018). Interestingly, the drop in the concentration of all N-compounds after 4 h was likely due to dissolved inorganic N uptake by Synechococcus, whereas the higher concentration of N-compounds at the end of the experiment might be attributed to the drop in its abundance (about half compared to the initial value) and therefore lower PP-W rate and N-assimilation. Although the microphytoplankton increased towards the end of the experiment, its overall abundance was still scarce and the experimental condition mostly favored small centric diatoms, with relatively small nutrient storage vacuoles. Further, the huge amount of dead Synechoccocus cells accumulated over 20 h, from T1 to T2, likely stimulated the lipid degradation rates (Supplementary Figure S5) and eventually HCP.
5 Conclusions
The different results obtained in July and October indicate a seasonal diversification of the effects of the closures on the lagoon ecosystem functioning. The effects were more pronounced in summer when inside the mesocosms the water confinement led to a slight oxygen depletion inside the mesocosms compared to the outside. Concurrently, primary production decreased over time and, contrarily, heterotrophic C production increased. This could indicate that: (i) part of the suspended material settled; (ii) organic matter was mineralized by heterotrophic processes releasing N-NH4 in the water. Consequently, our results suggest that the reduced hydrodynamics induced by the MOSE closure might lead to an enhanced deposition of the suspended material over time, affecting the structure and functioning of the resident microbial communities, and the pelagic-benthic coupling at least in the most isolated and shallow portions of the Venice lagoon. Considering the ongoing and future climate change, it is possible that the frequency and intensity of high-tide events will increase, causing the MOSE to operate more often and for longer periods. In this context, we believe that our experimental efforts represent a valuable and comprehensive picture of the effects of this engineering platform on the Venice lagoon ecosystem. This pioneer study may serve as a reference to evaluate the impact of similar engineering works, that are multiplying around the world, needed to protect lagoons and shallow coastal ecosystems from storm surges due to climate change.
Data availability statement
The raw data of the metabarcoding analyses are deposited at the Sequence Read Archive (SRA) under the project identifier PRJNA915329.
Ethics statement
The manuscript presents research on animals that do not require ethical approval for their study.
Author contributions
TC: Conceptualization, Investigation, Supervision, Validation, Writing – original draft, Writing – review & editing. LB: Data curation, Formal Analysis, Validation, Visualization, Writing – original draft, Writing – review & editing. RA: Formal Analysis, Investigation, Writing – review & editing. CB: Formal Analysis, Investigation, Writing – original draft. EB: Data curation, Formal Analysis, Writing – original draft. GB: Data curation, Formal Analysis, Writing – review & editing. MB: Data curation, Formal Analysis, Writing – original draft. FC: Data curation, Formal Analysis, Writing – original draft. FD: Data curation, Formal Analysis, Writing – original draft. TD: Formal Analysis, Investigation, Writing – review & editing. IG: Formal Analysis, Investigation, Writing – review & editing. MK: Data curation, Formal Analysis, Writing – review & editing. FM: Data curation, Formal Analysis, Writing – original draft. VM: Data curation, Formal Analysis, Writing – original draft. VN: Data curation, Formal Analysis, Writing – review & editing. FN: Formal Analysis, Investigation, Writing – original draft. FR: Data curation, Formal Analysis, Writing – original draft. AV: Validation, Writing – original draft, Writing – review & editing. DT: Conceptualization, Methodology, Supervision, Writing – original draft.
In memoriam
Sadly, the last author, Davide Tagliapietra, passed away on the 15th of September 2023 and could not see the final version of this article. We would like to express our sincere thanks for his valuable contribution.
Funding
The author(s) declared that financial support was received for the research and/or publication of this article. Scientific activities were performed with the contribution of the Provveditorato for the Public Works of Veneto, Trentino Alto Adige and Friuli Venezia Giulia, provided through the concessionary of State Consorzio Venezia Nuova and coordinated by CORILA in the framework of the Venezia2021 Research Program.
Acknowledgments
We are very grateful to Nicoletta Nesto, Vanessa Moschino, Lucia Bongiorni and Roberto Zonta for their kind hospitality at the CNR-ISMAR laboratories in Venice, and to Daniele Cassin and Marco Sigovini for logistic support during the activities at CNR-ISMAR. We also thank Loris Dametto for support during sampling.
In memoriam
Sadly, the last author, Davide Tagliapietra, passed away on the 15th of September 2023 and could not see the final version of this article. We would like to express our sincere thanks for his valuable contribution.
Conflict of interest
The authors declare that the research was conducted in the absence of any commercial or financial relationships that could be construed as a potential conflict of interest.
The reviewer LB declared a shared affiliation with the authors IG, DT to the handling editor at the time of review.
Generative AI statement
The author(s) declare that no Generative AI was used in the creation of this manuscript.
Any alternative text (alt text) provided alongside figures in this article has been generated by Frontiers with the support of artificial intelligence and reasonable efforts have been made to ensure accuracy, including review by the authors wherever possible. If you identify any issues, please contact us.
Publisher’s note
All claims expressed in this article are solely those of the authors and do not necessarily represent those of their affiliated organizations, or those of the publisher, the editors and the reviewers. Any product that may be evaluated in this article, or claim that may be made by its manufacturer, is not guaranteed or endorsed by the publisher.
Supplementary material
The Supplementary Material for this article can be found online at: https://www.frontiersin.org/articles/10.3389/fmars.2025.1675001/full#supplementary-material
Glossary
ß-glu: ß-glucosidase
AMA: leucine-aminopeptidase
APA: phosphatase
ASV: amplicon sequence variant
BPC: biopolymeric carbon
Chl-a: chlorophyll-a
Chit: chitinase
C-CHO-H2O: water-extractable carbohydrates
C-CHO-EDTA: EDTA-extractable carbohydrates
C-LIP: lipids
C-PROT: proteins.
DO: dissolved oxygen
EEA: extracellular enzymatic activities
HB-W: heterotrophic bacteria in water
HB-S: heterotrophic bacteria in sediment
HCP-W: heterotrophic C production in water
HCP-S: heterotrophic C production in sediment
MOSE: Experimental Electromechanical Module
MPB: microphytobenthos
OLEA: lipase
PdC: Palude di Cona
PE: picoeukaryotes
PP-W: primary production in water
PP-S: primary production in sediment
SYN-W: Synechococcus in water
SYN-S: Synechococcus in sediment
TOC: total organic carbon
TN: total nitrogen
VLP: virus-like particles
References
Agatz M., Asmus R. M., and Deventer B. (1999). Structural changes in the benthic diatom community along a eutrophication gradient on a tidal flat. Helgol Mar. Res. 53, 92–101. doi: 10.1007/PL00012144
Amaral-Zettler L. A., McCliment E. A., Ducklow H. W., and Huse S. M. (2009). A Method for Studying Protistan Diversity Using Massively Parallel Sequencing of V9 Hypervariable Regions of Small-Subunit Ribosomal RNA Genes. PloS One 4, e6372. doi: 10.1371/journal.pone.0006372
Apprill A., McNally S., Parsons R., and Weber L. (2015). Minor revision to V4 region SSU rRNA 806R gene primer greatly increases detection of SAR11 bacterioplankton. Aquat. Microb. Ecol. 75, 129–137. doi: 10.3354/ame01753
AR4 Climate Change (2007). Impacts, Adaptation, and Vulnerability (IPCC). Available online at: https://www.ipcc.ch/report/ar4/wg2/ (Accessed February 21, 2024).
Avancini M., Cicero A. M., Di Girolamo I., Innamorati M., Magaletti E., and Zunini T. S. (2006). Guida Al Riconoscimento Del Plancton Dei Mari Italiani. Vol. I: Fitoplancton (Ministero dell’ Ambiente della Tutela del Territorio e del Mare - ICRAM).
Baldassarre L., Natali V., De Pascale F., Vezzi A., Banchi E., Bazzaro M., et al. (2023). The Impact of MOSE (Experimental Electromechanical Module) Flood Barriers on Microphytobenthic Community of the Venice Lagoon. Microorganisms 11, 936. doi: 10.3390/microorganisms11040936
Bérard-Therriault L., Poulin M., Bossé L., and Canada N. R. C. (1999). “Guide d’identification du phytoplancton marin de l’estuaire et du golfe du Saint-Laurent: incluant également certains protozoaires,” in Canadian special publication of fisheries and aquatic sciences (Presses scientifiques du CNRC).
Bernardi Aubry F., Acri F., Bastianini M., Bianchi F., Cassin D., Pugnetti A., et al. (2006). Seasonal and interannual variations of phytoplankton in the Gulf of Venice (Northern Adriatic Sea). Chem. Ecol. 22, S71–S91. doi: 10.1080/02757540600687962
Bernardi Aubry F., Acri F., Bastianini M., Finotto S., and Pugnetti A. (2022). Differences and similarities in the phytoplankton communities of two coupled transitional and marine ecosystems (the Lagoon of Venice and the Gulf of Venice - Northern Adriatic Sea). Front. Mar. Sci. 9. doi: 10.3389/fmars.2022.974967
Berney C. (2022). EukRibo: a manually curated eukaryotic 18S rDNA reference database. doi: 10.5281/zenodo.6896896
Bernstein A. and Montobbio L. (2011). La gestione dei sedimenti in laguna di Venezia. Sintesi dei principali risultati acquisiti da studi e indagini di base.
Brigolin D., Rabouille C., Demasy C., Bombled B., Monvoisin G., and Pastres R. (2021). Early Diagenesis in Sediments of the Venice Lagoon (Italy) and Its Relationship to Hypoxia. Front. Mar. Sci. 7. doi: 10.3389/fmars.2020.575547
Brook I. (2010). Chapter 173 - Anaerobic bacteria, Editor(s): Jonathan Cohen, Steven M. Opal, William G. Powderly, Infectious Diseases (Third Edition), Mosby, 1757–1776. doi: 10.1016/B978-0-323-04579-7.00173-8
Bruckner C. G., Rehm C., Grossart H.-P., and Kroth P. G. (2011). Growth and release of extracellular organic compounds by benthic diatoms depend on interactions with bacteria. Environ. Microbiol. 13, 1052–1063. doi: 10.1111/j.1462-2920.2010.02411.x
Brussaard C. P. D. (2004). Optimization of Procedures for Counting Viruses by Flow Cytometry. Appl. Environ. Microbiol. 70, 1506–1513. doi: 10.1128/AEM.70.3.1506-1513.2004
Callahan B. J., McMurdie P. J., Rosen M. J., Han A. W., Johnson A. J. A., and Holmes S. P. (2016). DADA2: High-resolution sample inference from Illumina amplicon data. Nat. Methods 13, 581–583. doi: 10.1038/nmeth.3869
Camacho C., Coulouris G., Avagyan V., Ma N., Papadopoulos J., Bealer K., et al. (2009). BLAST+: architecture and applications. BMC Bioinf. 10, 421–421. doi: 10.1186/1471-2105-10-421
Cavaleri L., Bajo M., Barbariol F., Bastianini M., Benetazzo A., Bertotti L., et al. (2020). The 2019 Flooding of Venice and Its Implications for Future Predictions. Oceanography 33(1):42–49. doi: 10.5670/oceanog.2020.105
Celussi M., Zoccarato L., Bernardi Aubry F., Bastianini M., Casotti R., Balestra C., et al. (2019). Links between microbial processing of organic matter and the thermohaline and productivity features of a temperate river-influenced Mediterranean coastal area. Estuarine Coast. Shelf Sci. 228, 106378. doi: 10.1016/j.ecss.2019.106378
Cibic T., Baldassarre L., Cerino F., Comici C., Fornasaro D., Kralj M., et al. (2022a). Benthic and Pelagic Contributions to Primary Production: Experimental Insights From the Gulf of Trieste (Northern Adriatic Sea). Front. Mar. Sci. 9. doi: 10.3389/fmars.2022.877935
Cibic T., Blasutto O., Burba N., and Fonda Umani S. (2008). Microphytobenthic primary production as 14C uptake in sublittoral sediments of the Gulf of Trieste (northern Adriatic Sea): Methodological aspects and data analyses. Estuarine Coast. Shelf Sci. 77, 113–122. doi: 10.1016/j.ecss.2007.09.005
Cibic T., Cerino F., Karuza A., Fornasaro D., Comici C., and Cabrini M. (2018). Structural and functional response of phytoplankton to reduced river inputs and anomalous physical-chemical conditions in the Gulf of Trieste (northern Adriatic Sea). Sci. Total Environ. 636, 838–853. doi: 10.1016/j.scitotenv.2018.04.205
Cibic T., Fazi S., Nasi F., Pin L., Alvisi F., Berto D., et al. (2019). Natural and anthropogenic disturbances shape benthic phototrophic and heterotrophic microbial communities in the Po River Delta system. Estuarine Coast. Shelf Sci. 222, 168–182. doi: 10.1016/j.ecss.2019.04.009
Cibic T., Franzo A., Celussi M., Fabbro C., and Del Negro P. (2012). Benthic ecosystem functioning in hydrocarbon and heavy-metal contaminated sediments of an Adriatic lagoon. Mar. Ecol. Prog. Ser. 458, 69–87. doi: 10.3354/meps09741
Cibic T., Franzo A., Nasi F., Auriemma R., and Del Negro P. (2017). The Port of Trieste (Northern Adriatic Sea)—A Case Study of the “Ecosystem Approach to Management. Front. Mar. Sci. 4. doi: 10.3389/fmars.2017.00336
Cibic T., Orlando-Bonaca M., and Rubino F. (2022b). Editorial: New perspectives in benthic-pelagic coupling in marine and transitional coastal areas. Front. Mar. Sci. 9. doi: 10.3389/fmars.2022.1009078
Cibic T. and Virgilio D. (2010). Different fixatives and chloridric acid concentrations in microphytobenthic primary production estimates using radiolabeled carbon: their use and misuse. Limnology Oceanography: Methods 8, 453–461. doi: 10.4319/lom.2010.8.453
Cibic T., Virgilio D., Cibic T., and Virgilio D. (2011). “In Situ Primary Production Measurements as an Analytical Support to Remote Sensing - An Experimental Approach to Standardize the 14C Incorporation Technique,” in Biomass and Remote Sensing of Biomass (IntechOpen). doi: 10.5772/17175
Clarke K. and Ainsworth M. (1993). A method of linking multivariate community structure to environmental variables. Mar. Ecol. Prog. Ser. 92, 205–219. doi: 10.3354/meps092205
Clarke K. R., Warwick R. M., and Laboratory P. M. (2001). “Change in Marine Communities: An Approach to Statistical Analysis and Interpretation,” (PRIMER-E Limited, Plymouth Marine Laboratory, Plymouth).
Danovaro R. (2009). Methods for the Study of Deep-Sea Sediments, Their Functioning and Biodiversity (CRC Press).
De Brouwer J. F. C., Wolfstein K., Ruddy G. K., Jones T. E. R., and Stal L. J. (2005). Biogenic Stabilization of Intertidal Sediments: The Importance of Extracellular Polymeric Substances Produced by Benthic Diatoms. Microb. Ecol. 49, 501–512. doi: 10.1007/s00248-004-0020-z
Deng L., Fiskal A., Han X., Dubois N., Bernascon S. M., and Lever M. A. (2019). Improving the Accuracy of Flow Cytometric Quantification of Microbial Populations in Sediments: Importance of Cell Staining Procedures. Front. Microbiol. 10. doi: 10.3389/fmicb.2019.00720
Elliott M. and Quintino V. (2007). The Estuarine Quality Paradox, Environmental Homeostasis and the difficulty of detecting anthropogenic stress in naturally stressed areas. Mar. pollut. Bull. 54, 640–645. doi: 10.1016/j.marpolbul.2007.02.003
Facca C., Sfriso A., and Socal G. "Temporal and Spatial Distribution of Diatoms in the Surface Sediments of the Venice Lagoon", De Gruyter Brill, vol. 45, no. 2, 2002, pp. 170–183. https://doi.org/10.1515/BOT.2002.016
Ferrarin C., Ghezzo M., Umgiesser G., Tagliapietra D., Camatti E., Zaggia L., et al. (2013). Assessing hydrological effects of human interventions on coastal systems: numerical applications to the Venice Lagoon. Hydrology Earth System Sci. 17, 1733–1748. doi: 10.5194/hess-17-1733-2013
Fletcher C. A. and Spencer T. (2005). Flooding and Environmental Challenges for Venice and Its Lagoon: State of Knowledge (Cambridge University Press).
Flint H. J. and Stewart C. S. (1999). “Bacteroides And Prevotella,” in Encyclopedia of Food Microbiology. Ed. Robinson R. K. (Elsevier, Oxford), 198–203. doi: 10.1006/rwfm.1999.0160
Franzo A., Asioli A., Roscioli C., Patrolecco L., Bazzaro M., Del Negro P., et al. (2019). Influence of natural and anthropogenic disturbances on foraminifera and free-living nematodes in four lagoons of the Po delta system. Estuarine Coast. Shelf Sci. 220, 99–110. doi: 10.1016/j.ecss.2019.02.039
Franzo A., Cibic T., and Del Negro P. (2016). Integrated approach for the assessment of the benthic ecosystem functioning at a coastal site in the northern Adriatic Sea. Continental Shelf Res. 121, 35–47. doi: 10.1016/j.csr.2015.12.005
Franzo A., Cibic T., Del Negro P., and Solidoro C. (2014). Microphytobenthic response to mussel farm biodeposition in coastal sediments of the northern Adriatic Sea. Mar. pollut. Bull. 79, 379–388. doi: 10.1016/j.marpolbul.2013.11.002
Fuerst J. A. (2019). “Phylum Verrucomicrobia,” in Encyclopedia of Microbiology, 4th ed. Ed. Schmidt T. M. (Academic Press, Oxford), 551–563. doi: 10.1016/B978-0-12-809633-8.20772-3
Gačić M., Mancero Mosquera I., Kovačević V., Mazzoldi A., Cardin V., Arena F., et al. (2004). Temporal variations of water flow between the Venetian lagoon and the open sea. J. Mar. Syst. 51, 33–47. doi: 10.1016/j.jmarsys.2004.05.025. Lagoon of Venice. Circulation, Water Exchange and Ecosystem Functioning.
Gazeau F., Smith S. V., Gentili B., Frankignoulle M., and Gattuso J.-P. (2004). The European coastal zone: characterization and first assessment of ecosystem metabolism. Estuarine Coast. Shelf Sci. 60, 673–694. doi: 10.1016/j.ecss.2004.03.007
Guerzoni S., Tagliapietra D., Venezia O., Naturalistico Della L., and Del C. (2006). Atlante della laguna: Venezia tra terra e mare, Libri illustrati. Grandi libri (Marsilio).
Guillou L., Bachar D., Audic S., Bass D., Berney C., Bittner L., et al. (2013). The Protist Ribosomal Reference database (PR2): a catalog of unicellular eukaryote Small Sub-Unit rRNA sequences with curated taxonomy. Nucleic Acids Res. 41, D597–D604. doi: 10.1093/nar/gks1160
Guiry M. D., Guiry G. M., Morrison L., Rindi F., Miranda S. V., Mathieson A. C., et al. (2014). AlgaeBase: An On-line Resource for Algae. CRYA 35, 105–115. doi: 10.7872/crya.v35.iss2.2014.105
Ho Q. N., Fettweis M., Spencer K. L., and Lee B. J. (2022). Flocculation with heterogeneous composition in water environments: A review. Water Res. 213, 118147. doi: 10.1016/j.watres.2022.118147
Hoppenrath M., Elbrächter M., Drebes G., Meeresforschung A.-W.-I., and für P. (2009). “Marine Phytoplankton: Selected Microphytoplankton Species from the North Sea Around Helgoland and Sylt,” in Kleine Senckenberg-Reihe (E. Schweizerbart’sche Verlagsbuchhandlung).
Huang K., Feng Q., Zhang Y., Ou L., Cen J., Lu S., et al. (2020). Comparative uptake and assimilation of nitrate, ammonium, and urea by dinoflagellate Karenia mikimotoi and diatom Skeletonema costatum s.l. in the coastal waters of the East China Sea. Mar. pollut. Bull. 155, 111200. doi: 10.1016/j.marpolbul.2020.111200
Hunter J. (2007). Diatoms As Environmental Indicators: A Case Study In The Bioluminescent Bays Of Vieques, Puerto Rico.
Intergovernmental Panel On Climate Change (2023). Climate Change 2021 – The Physical Science Basis: Working Group I Contribution to the Sixth Assessment Report of the Intergovernmental Panel on Climate Change. 1st ed (Cambridge University Press). doi: 10.1017/9781009157896
Kim B., Lee J., Noh J., Bae H., Lee C., Ha H. J., et al. (2021). Spatiotemporal variation of extracellular polymeric substances (EPS) associated with the microphytobenthos of tidal flats in the Yellow Sea. Mar. pollut. Bull. 171, 112780. doi: 10.1016/j.marpolbul.2021.112780
Kirchman D., K’nees E., and Hodson R. (1985). Leucine incorporation and its potential as a measure of protein synthesis by bacteria in natural aquatic systems. Appl. Environ. Microbiol. 49, 599–607. doi: 10.1128/aem.49.3.599-607.1985
Kraberg A., Baumann M., and Dürselen C. D. (2010)Coastal Phytoplankton: Photo Guide for Northern European Seasin Handbooks on marine flora and faunaEd. Pfeil V.Dr. F.
Leoni S., Dominik J., Cassin D., Manfè G., Tagliapietra D., Acri F., et al. (2022). Sediment oxygen demand rate in a flow regulated lagoon (Venice, Italy). Front. Environ. Sci. 10. doi: 10.3389/fenvs.2022.1000665
Magistrato Alle Acque (1997). Interventi alle bocche lagunari per la regolazione dei flussi di marea–Studio di impatto ambientale del progetto di massima 163.
Manna V., Fabbro C., Cerino F., Bazzaro M., Del Negro P., and Celussi M. (2019). Effect of an extreme cold event on the metabolism of planktonic microbes in the northernmost basin of the Mediterranean Sea. Estuarine Coast. Shelf Sci. 225, 106252. doi: 10.1016/j.ecss.2019.106252
Marie D., Brussaard C. P. D., Thyrhaug R., Bratbak G., and Vaulot D. (1999). Enumeration of Marine Viruses in Culture and Natural Samples by Flow Cytometry. Appl. Environ. Microbiol. 65, 45–52. doi: 10.1128/AEM.65.1.45-52.1999
Martin M. (2011). Cutadapt removes adapter sequences from high-throughput sequencing reads. EMBnet.Journal 17, 10–12. doi: 10.14806/ej.17.1.200
McMurdie P. J. and Holmes S. (2013). phyloseq: An R Package for Reproducible Interactive Analysis and Graphics of Microbiome Census Data. PloS One 8, e61217. doi: 10.1371/journal.pone.0061217
Mel R. A., Viero D. P., Carniello L., Defina A., and D’Alpaos L. (2021). The first operations of Mo.S.E. system to prevent the flooding of Venice: Insights on the hydrodynamics of a regulated lagoon. Estuarine Coast. Shelf Sci. 261, 107547. doi: 10.1016/j.ecss.2021.107547
Nielsen E. S. (1952). The Use of Radio-active Carbon (C14) for Measuring Organic Production in the Sea. ICES J. Mar. Sci. 18, 117–140. doi: 10.1093/icesjms/18.2.117
Parada A. E., Needham D. M., and Fuhrman J. A. (2016). Every base matters: assessing small subunit rRNA primers for marine microbiomes with mock communities, time series and global field samples. Environ. Microbiol. 18, 1403–1414. doi: 10.1111/1462-2920.13023
Pesce M., Critto A., Torresan S., Giubilato E., Santini M., Zirino A., et al. (2018). Modelling climate change impacts on nutrients and primary production in coastal waters. Sci. Total Environ. 628–629, 919–937. doi: 10.1016/j.scitotenv.2018.02.131
Pivato M., Carniello L., Moro I., and D’Odorico P. (2019). On the feedback between water turbidity and microphytobenthos growth in shallow tidal environments. Earth Surface Processes Landforms 44, 1192–1206. doi: 10.1002/esp.4567
Quast C., Pruesse E., Yilmaz P., Gerken J., Schweer T., Yarza P., et al. (2013). The SILVA ribosomal RNA gene database project: improved data processing and web-based tools. Nucleic Acids Res. 41, D590–D596. doi: 10.1093/nar/gks1219
R Core Team (2021). R: The R Project for Statistical Computing. Available online at: https://www.r-project.org/ (Accessed March 31, 2023).
Rogelja M., Cibic T., Pennesi C., and De Vittor C. (2016). Microphytobenthic community composition and primary production at gas and thermal vents in the Aeolian Islands (Tyrrhenian Sea, Italy). Mar. Environ. Res. 118, 31–44. doi: 10.1016/j.marenvres.2016.04.009
Rogelja M., Cibic T., Rubino F., Belmonte M., and Del Negro P. (2018). Active and resting microbenthos in differently contaminated marine coastal areas: insights from the Gulf of Trieste (northern Adriatic, Mediterranean Sea). Hydrobiologia 806, 283–301. doi: 10.1007/s10750-017-3366-1
Round F. E., Crawford R. M., and Mann D. G. (1990). Diatoms: Biology and Morphology of the Genera (Cambridge University Press).
Ruol P., Favaretto C., Volpato M., and Martinelli L. (2020). Flooding of Piazza San Marco (Venice): Physical Model Tests to Evaluate the Overtopping Discharge. Water 12, 427. doi: 10.3390/w12020427
Sabanci F. (2012). An illustrated survey on the morphological characters in three species of the diatom genus Mastogloia (Bacillariophyceae). Turkish J. Bot. 36, 727–737. doi: 10.3906/bot-1111-18
Sarretta A., Pillon S., Molinaroli E., Guerzoni S., and Fontolan G. (2010). Sediment budget in the Lagoon of Venice, Italy. Continental Shelf Res. 30, 934–949. doi: 10.1016/j.csr.2009.07.002
Scarpa G. M., Braga F., Manfè G., Lorenzetti G., and Zaggia L. (2022). Towards an Integrated Observational System to Investigate Sediment Transport in the Tidal Inlets of the Lagoon of Venice. Remote Sens. 14, 3371. doi: 10.3390/rs14143371
Segata N., Izard J., Waldron L., Gevers D., Miropolsky L., Garrett W. S., et al. (2011). Metagenomic biomarker discovery and explanation. Genome Biol. 12(6), R60–R60. doi: 10.1186/gb-2011-12-6-r60
Simon M. and Azam F. (1989). Protein content and protein synthesis rates of planktonic marine bacteria. Mar. Ecol. Prog. Ser. 51, 201–213. doi: 10.3354/meps051201
Smith D. C. and Azam F. (1992). A simple, economical method for measuring bacterial protein synthesis rates in seawater using 3H-leucine. Mar. Microb. Food Webs. 6, 107–114.
SNPA (2024). “Sistema nazionale protezione ambiente,” in La rete delle agenzie ambientali (Arpa-Appa-Ispra) per l’ambiente. Available online at: https://www.snpambiente.it/.
Souza A. C., Pease T. K., and Gardner W. S. (2011). The direct role of enzyme hydrolysis on ammonium regeneration rates in estuarine sediments. Aquat. Microbial Ecol. 65, 159–168. doi: 10.3354/ame01541
Sundbäck K., Linares F., Larson F., Wulff A., and Engelsen A. (2004). Benthic nitrogen fluxes along a depth gradient in a microtidal fjord: The role of denitrification and microphytobenthos. Limnology Oceanography 49, 1095–1107. doi: 10.4319/lo.2004.49.4.1095
Tagliapietra D. and Ghirardini A. V. (2006). Notes on coastal lagoon typology in the light of the EU Water Framework Directive: Italy as a case study. Aquat. Conservation: Mar. Freshw. Ecosyst. 16, 457–467. doi: 10.1002/aqc.768
Throndsen J. (1978). “Preservation and storage,” in Phytoplankton manual. Ed. Sournia A. (UNESCO), 69–74.
Tognin D., Finotello A., D’Alpaos A., Viero D. P., Pivato M., Mel R. A., et al. (2022). Loss of geomorphic diversity in shallow tidal embayments promoted by storm-surge barriers. Sci. Adv. 8, eabm8446. doi: 10.1126/sciadv.abm8446
Trincardi F., Barbanti A., Bastianini M., Benetazzo A., Cavaleri L., Chiggiato J., et al. (2016). The 1966 Flooding of Venice: What Time Taught Us for the Future. Oceanog 29(4):178–186. doi: 10.5670/oceanog.2016.87
Ul-Hassan A. and Wellington E. M. (2009)Actinobacteria,” in Encyclopedia of Microbiology, 3rd ed. Ed. Schaechter M. (Academic Press, Oxford), 25–44. doi: 10.1016/B978-012373944-5.00044-4
Umgiesser G. (2020). The impact of operating the mobile barriers in Venice (MOSE) under climate change. J. Nat. Conserv. 54, 125783. doi: 10.1016/j.jnc.2019.125783
Underwood G. J. C., Dumbrell A. J., McGenity T. J., McKew B. A., and Whitby C. (2022). “The Microbiome of Coastal Sediments,” in The Marine Microbiome, The Microbiomes of Humans, Animals, Plants, and the Environment. Eds. Stal L. J. and Cretoiu M. S. (Springer International Publishing, Cham), 479–534. doi: 10.1007/978-3-030-90383-1_12
Underwood G. J. C. and Paterson D. M. (2003). “The importance of extracellular carbohydrate productionby marine epipelic diatoms,” in Advances in Botanical Research (Academic Press), 183–240. doi: 10.1016/S0065-2296(05)40005-1
Underwood G. J. C. and Smith D. J. (1998). Predicting Epipelic Diatom Exopolymer Concentrations in Intertidal Sediments from Sediment Chlorophyll a. Microb. Ecol. 35, 116–125. doi: 10.1007/s002489900066
Van Duyl F. C. and Kop A. J. (1994). Bacterial production in North Sea sediments: clues to seasonal and spatial variations. Mar. Biol. 120, 323–337. doi: 10.1007/BF00349694
Weckström K. and Juggins S. (2006). Coastal Diatom–Environment Relationships from the Gulf of Finland, Baltic Sea1. J. Phycology 42, 21–35. doi: 10.1111/j.1529-8817.2006.00166.x
Ye L., Wu J., Huang M., and Yan J. (2023). The role of suspended extracellular polymeric substance (EPS) on equilibrium flocculation of clay minerals in high salinity water. Water Res. 244, 120451. doi: 10.1016/j.watres.2023.120451
Zingone A., Totti C., Sarno D., Cabrini M., Caroppo C., Giacobbe M., et al. (2010). Fitoplancton: metodiche di analisi quali-quantitativa. 213–237.
Zonta R., Costa F., Collavini F., and Zaggia L. (2005). Objectives and structure of the DRAIN project: An extensive study of the delivery from the drainage basin of the Venice Lagoon (Italy). Environ. Int. 31, 923–928. doi: 10.1016/j.envint.2005.05.002. Lagoon of Venice: Loads, Distribution, and Effects of Nutrients and Pollutants.
Keywords: ecosystem functioning, pelagic-benthic coupling, biological process, microbial community, Venice lagoon, rising sea
Citation: Cibic T, Baldassarre L, Auriemma R, Balestra C, Banchi E, Battaggia G, Bazzaro M, Cerino F, De Pascale F, Diociaiuti T, Guarneri I, Kralj M, Malfatti F, Manna V, Natali V, Nasi F, Relitti F, Vezzi A and Tagliapietra D (2025) Effects of the mobile gates (MOSE) closure on the ecosystem functioning of the Venice lagoon: an experimental assessment with enclosures. Front. Mar. Sci. 12:1675001. doi: 10.3389/fmars.2025.1675001
Received: 28 July 2025; Accepted: 17 November 2025; Revised: 14 November 2025;
Published: 10 December 2025.
Edited by:
Michael Yu Roleda, University of the Philippines Diliman, PhilippinesReviewed by:
Oskars Purmalis, University of Latvia, LatviaLucia Bongiorni, National Research Council (CNR), Italy
Valentina Pitacco, National Institute of Biology (NIB), Slovenia
Copyright © 2025 Cibic, Baldassarre, Auriemma, Balestra, Banchi, Battaggia, Bazzaro, Cerino, De Pascale, Diociaiuti, Guarneri, Kralj, Malfatti, Manna, Natali, Nasi, Relitti, Vezzi and Tagliapietra. This is an open-access article distributed under the terms of the Creative Commons Attribution License (CC BY). The use, distribution or reproduction in other forums is permitted, provided the original author(s) and the copyright owner(s) are credited and that the original publication in this journal is cited, in accordance with accepted academic practice. No use, distribution or reproduction is permitted which does not comply with these terms.
*Correspondence: Tamara Cibic, dGNpYmljQG9ncy5pdA==
†These authors have contributed equally to this work
‡Deceased