Abstract
Introduction:
In recent years, as floating wind turbines advance into deeper waters, mooring systems represent a growing share of the overall investment. Shared mooring can simplify mooring arrangements and improve the economic efficiency of wind farms. However, it also increases the dynamic complexity of multi-turbine systems, introducing risks of high tension levels and snap events under extreme conditions, which must be addressed during the mooring design phase.
Methods:
This study compares the coupled dynamic responses of three typical shared mooring systems: pure steel cable, polyester rope with a clump weight, and chain with a buoy. Mooring design is based on the catenary equation, and time-domain simulations are conducted using OrcaFlex to analyze the impact of various shared mooring configurations on the hydrodynamics and mooring performance of wind turbine systems.
Results:
The results show that, compared to the baseline configuration, the taut single-weighted configuration is more effective in reducing the fluctuation of mooring tension under extreme conditions, thus avoiding the occurrence of snap events. As the clump weight mass increases, the surge motion of the platform is effectively suppressed, but the heave and pitch motions may become more pronounced. Therefore, a balance must be struck between the clump weight mass, platform motion, and mooring tension to achieve optimal overall performance. The catenary with buoy configuration shows similar results to the taut single-weighted configuration; however, the maximum tension of shared mooring may occur at the buoy connection. Additionally, excessive net buoyancy can exacerbate the dynamic characteristics of the buoy and raise the risk of collision between the buoy and passing vessels. This study contributes to a deeper understanding of shared mooring systems and provides valuable guidance for their design.
1 Introduction
Wind energy, as a clean and sustainable power source, has garnered global attention in recent years, driving rapid advancements in wind turbine technologies. However, the development of nearshore wind power faces significant constraints. As a result, the deep offshore areas, characterized by stable wind speeds and high wind energy density, are becoming increasingly important for wind power deployment. Given current technological and economic evaluation, deep-water floating offshore wind turbines (FOWTs) have emerged as a rational choice. According to DNV (DNV, 2020), the installed capacity of floating wind is projected to reach 250 GW by 2050, accounting for over 20% of the global offshore wind market and supplying approximately 2% of worldwide electricity.
The supporting platforms for FOWTs can be classified into four types based on their static stability design: barge-type, spar-type, semi-submersible, and tension leg platform (TLP) (Zhang et al., 2020). Among these, the Spar-type FOWT is one of the most technically mature and widely studied concepts, owing to its deep draft and ballasting stability characteristics. Goupee et al. (2014) compared the performance of the Spar-type FOWT with other FOWT concepts, such as the semi-submersible and TLP FOWTs. The study indicates that, in in wave-only conditions, the Spar-type FOWT typically exhibits smaller surge responses but larger pitch responses.
In numerical simulation studies of FOWTs, various methods have been developed and applied for hydrodynamic analysis, with significant differences in accuracy and efficiency among different numerical tools. Research by Yu et al. (2025) indicate that tools based on potential flow theory (PT), such as OpenFAST and HAWC2, offer high computational efficiency but may have accuracy limitations under certain nonlinear conditions. For example, Rivera-Arreba et al. (2019) pointed out that potential flow methods may severely underestimate the heave motion of the floating body under severe wave conditions. Cheng et al. (2019) also found that these methods are less accurate than CFD approaches in predicting hydrodynamic damping. On the other hand, CFD methods, such as OpenFOAM and STAR-CCM+, can more accurately capture viscous effects and nonlinear wave forces (Li and Bachynski, 2021), but come with significantly higher computational costs. Chen et al. (2024) developed a CFD-mooring coupled model based on OpenFOAM to simulate the dynamic response of multi-floating structures. The study showed that the model accurately captures heave and pitch motions of floating bodies in long waves, although there is some deviation in surge responses in short waves. Given the extensive simulations required in this study, OrcaFlex software was ultimately selected for subsequent analysis to balance engineering practicality with computational efficiency.
The Spar-type FOWT is a complex dynamic system consisting of blades, nacelle, tower, floating platform, and mooring system. Among them, the mooring system is not only a key factor in determining the platform motion performance and structural safety, but also one of the critical cost elements influencing the levelized cost of electricity (LCOE) of the FOWT. As estimated by James and Ros (2015) , it accounts for about 10%-15% of the capital expenditure, and this proportion will further rise as the water depth increases. To reduce mooring costs, researchers have proposed several innovative design concepts, among which two concepts deserve special attention. The first concept, proposed by Fontana (2019), is the shared anchor. This concept involves multiple mooring lines connecting to a single anchor, thereby reducing the number of anchors required. However, an inherent challenge with this design is that the anchor must withstand multi-directional loading, which may compromise its performance. The other innovative concept is shared mooring lines, where some mooring lines are not anchored to the seabed but are connected to adjacent FOWTs. Shared mooring can simplify mooring arrangements, effectively avoid interference between underwater cables, and increase turbine density within the same sea area, thereby improving the economic efficiency of wind farms. Therefore, this novel mooring device is the focus of this study, which will be discussed in detail in the following text.
In the design of shared mooring systems, Yamamoto and Colburn (2006) explored the layout forms and suggested that floating offshore wind farms (FOWF) adopt a triangular or hexagonal layout. Connolly and Hall (2019) proposed a simplified algorithmic approach for FOWF layout design across varying water depths. Barajas et al. (2024) investigated the nonlinear effects of current loads on the hydrodynamic response of FOWTs and proposed spacing design recommendations for FOWT arrays. Wilson et al. (2021) proposed a linearized method for the initial design of shared mooring systems. This method is based on the force-displacement relationship of mooring lines, and simplifying the parameter adjustment for individual mooring lines within the FOWF to satisfy design constraints at the minimal cost. Hall et al. (2022) developed a systematic design framework for shared mooring systems and applied it to a FOWF with 10 turbines. Their study shows that the shared system, compared to the traditional three-line individual mooring system, maintains similar dynamic responses while reducing installation costs by 13%. Additionally, in the event of mooring line failure, the shared system retains advantages, with offset and redundancy comparable to the four-line individual system.
In the study of dynamic response characteristics, Hall and Connolly (2018) coupled FOWF with shared mooring lines through the MoorDyn module in FAST. Their study revealed that compared to traditional systems without shared mooring lines, FOWFs with shared mooring systems exhibit more complex restoring characteristics and greater susceptibility to resonance. Munir et al. (2021) investigated the influence of turbine spacing (750 m and 1,000 m) on the overall responses of shared mooring systems. The research indicates that differences in motion across all degrees of freedom are not significant when there are changes to the spacing of FOWTs, as the shared mooring system provides little contribution to restoring forces. Hall (2020) carried out time-domain simulations of mooring failure scenarios for FOWFs with shared mooring systems. Wang et al. (2022) explored the motion response of shared mooring systems in ultra-deep water (1,000 m). Liang et al. (2020) investigated the effects of steel wire ropes with varying diameters as shared mooring lines on the dual-spar wind farms. Their work included an analysis of the natural periods and mode shapes of the dual-spar configurations. Lopez-Olocco et al. (2023) noted that shared mooring systems are susceptible to exhibiting high tension and snap events under extreme environmental conditions.
The above researches indicate that shared mooring increases the dynamic complexity of the dual-turbine system, potentially leading to severe consequences such as snap loads or cable breakage under extreme conditions. Therefore, optimizing the shared mooring configurations to avoid these potential issues holds significant engineering importance. As shown in Figure 1, this study takes a dual-spar FOWF as research objects and design three shared mooring configurations with different cable materials. The first configuration employs steel wire rope, the second configuration uses polyester ropes with a clump weight, and the third configuration uses chains with a buoy. To investigate the effects of the three configurations on the dynamic characteristics of the FOWF, fully coupled numerical simulations were conducted in the commercial software OrcaFlex. Firstly, a sensitivity analysis is conducted to investigate the effect of the clump weight mass on the dynamic responses of the taut single-weighted configuration and the influence of the buoys’ net buoyancy on the catenary with buoy configuration. Subsequently, the baseline configuration is studied and its performance is compared against the two configurations (the taut single-weighted configuration and the catenary with buoy configuration). Finally, considering both safety factors and mooring line costs, a technical and economic analysis of the shared mooring systems was conducted. This study provides valuable insights for the design of shared mooring systems from both technical and economic perspectives, demonstrating considerable potential for practical engineering application.
Figure 1
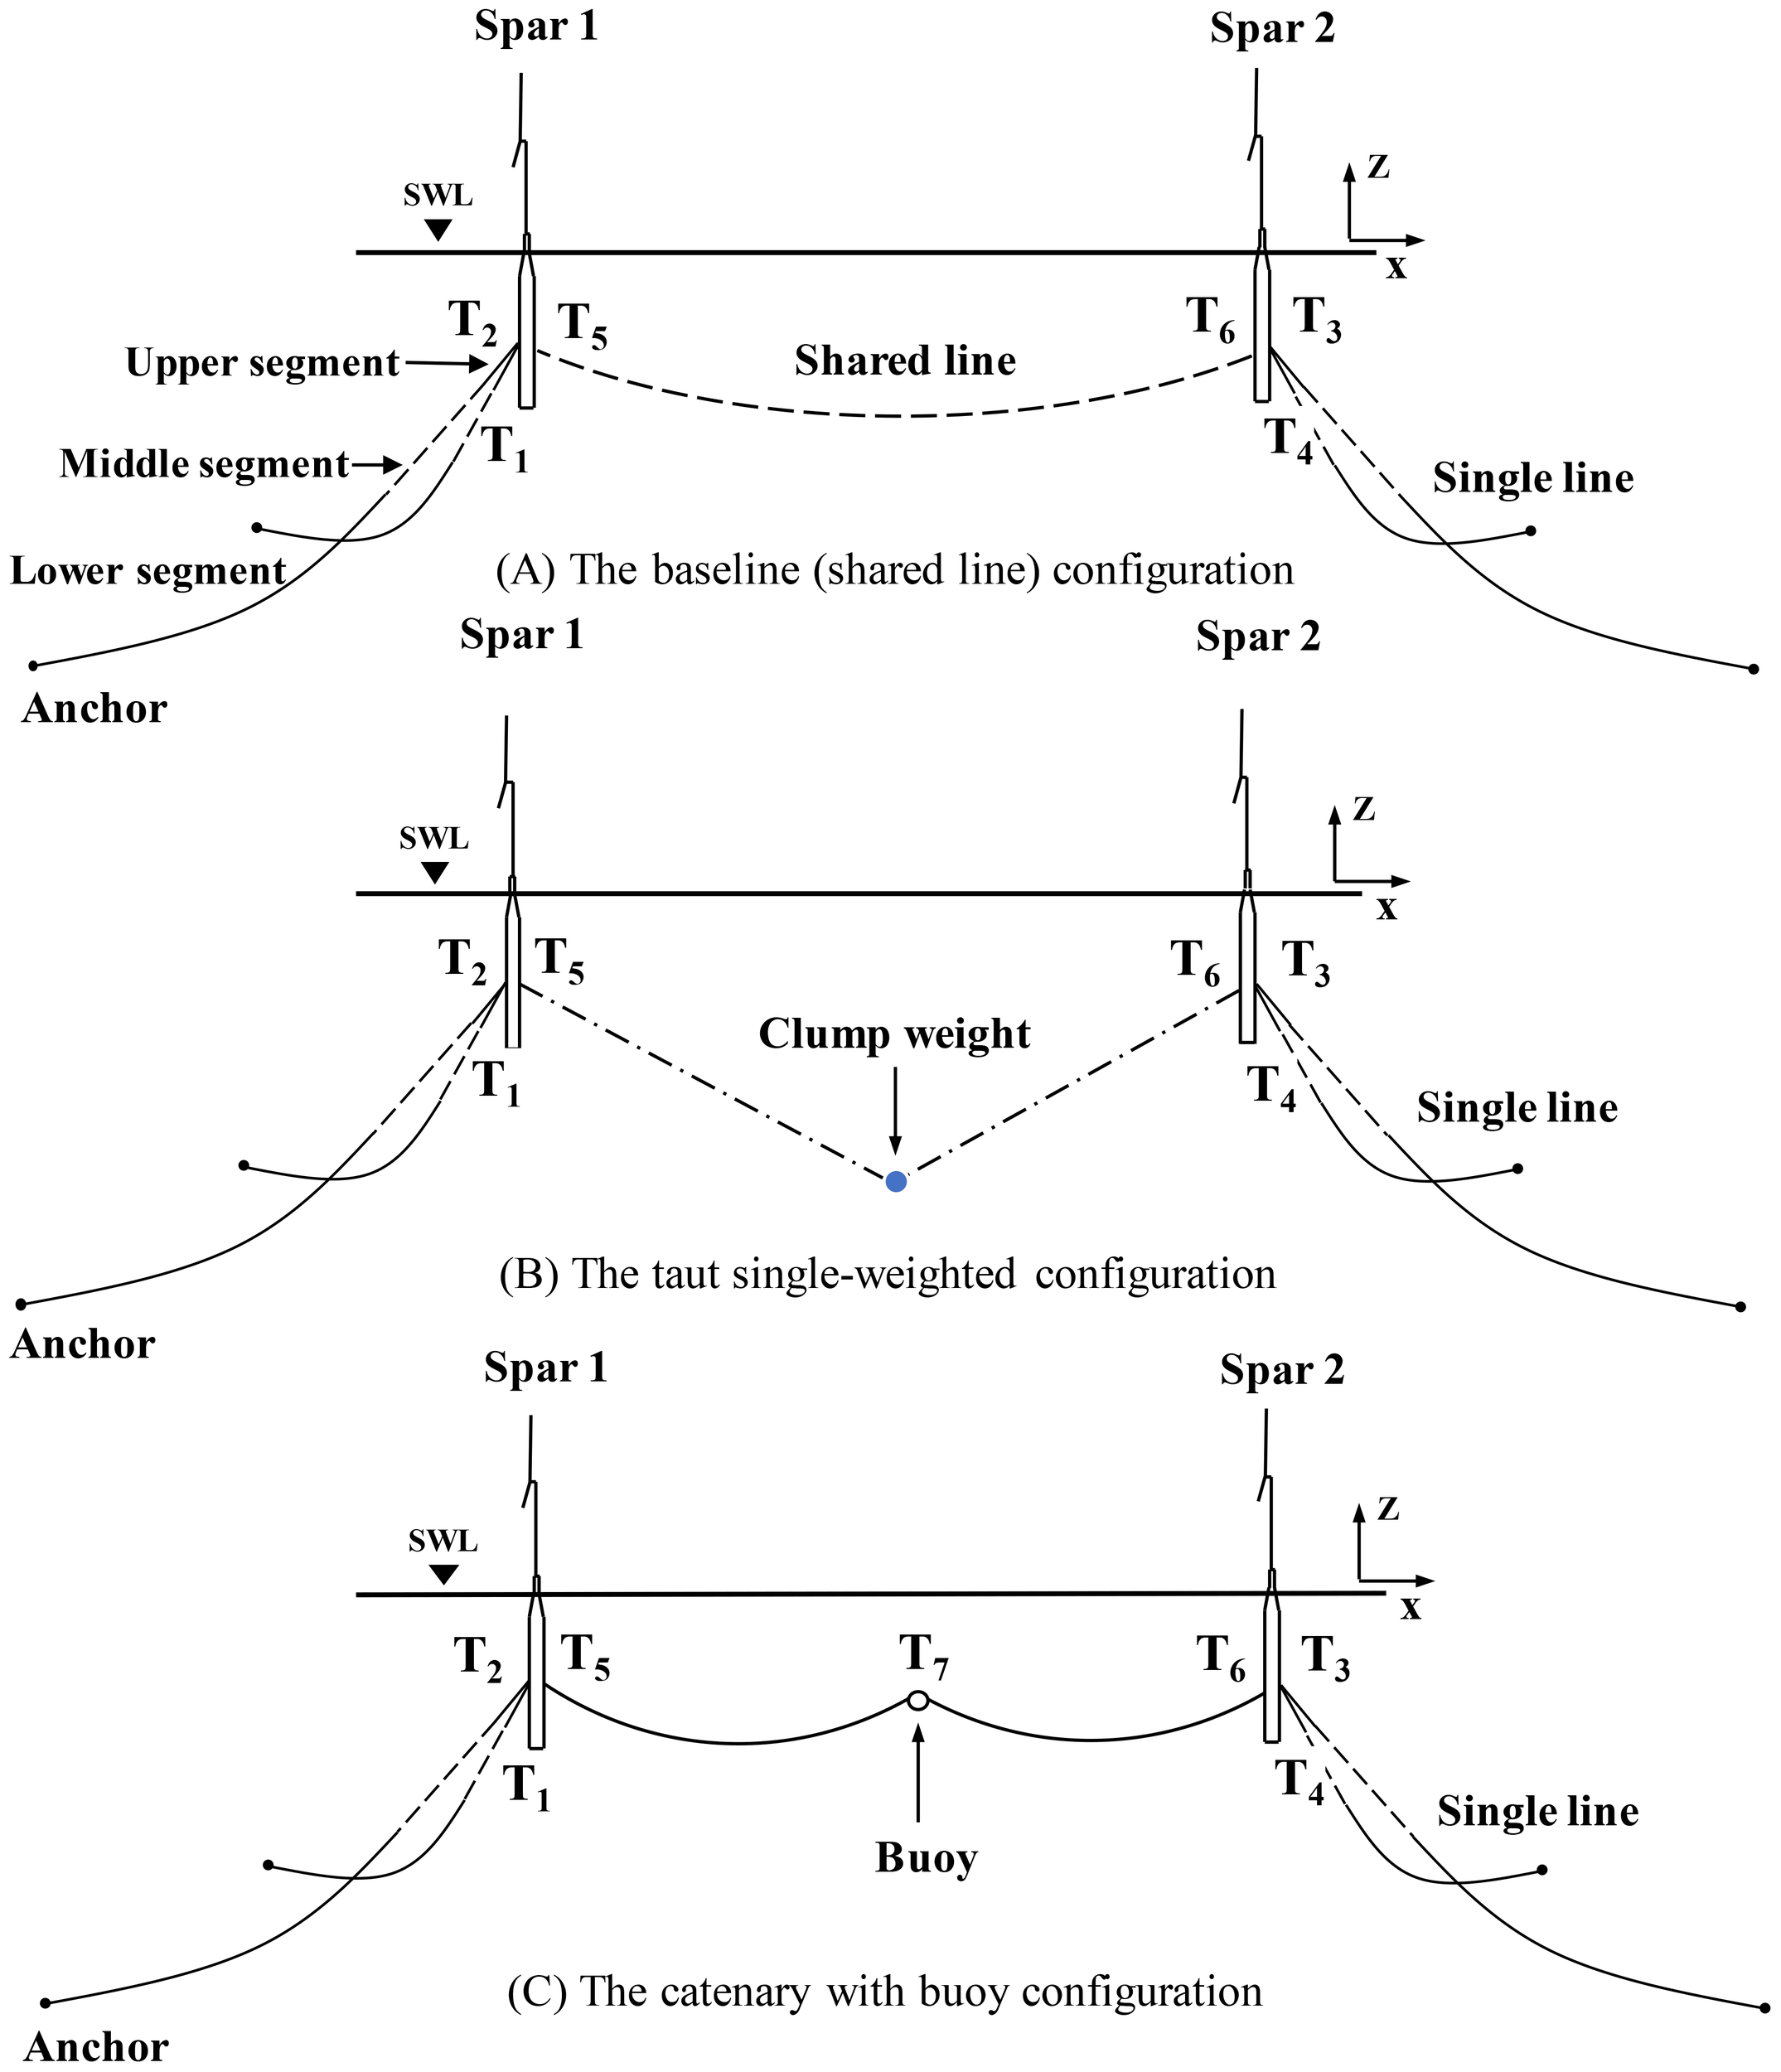
Illustration of the three dual-spar FOWFs with different shared mooring configurations (dashed line: wire, dashed-dotted line: polyester rope, solid line: chain, black solid circle: anchor, blue solid circle: clump weight, hollow circle: buoy): (A) the baseline configuration; (B) the taut single-weighted configuration; (C) the catenary with buoy configuration.
2 Dual-spar FOWF configurations and methodology
2.1 OC3 Hywind spar FOWT
As shown in Figure 2, the OC3 Hywind FOWT comprises a deep-draft spar platform and a 5MW baseline wind turbine developed by NREL. The 5 MW wind turbine employs a standard configuration with collective variable-speed and variable blade-pitch-to-feather (Jonkman et al., 2009); its main parameters are detailed in Table 1.
Figure 2
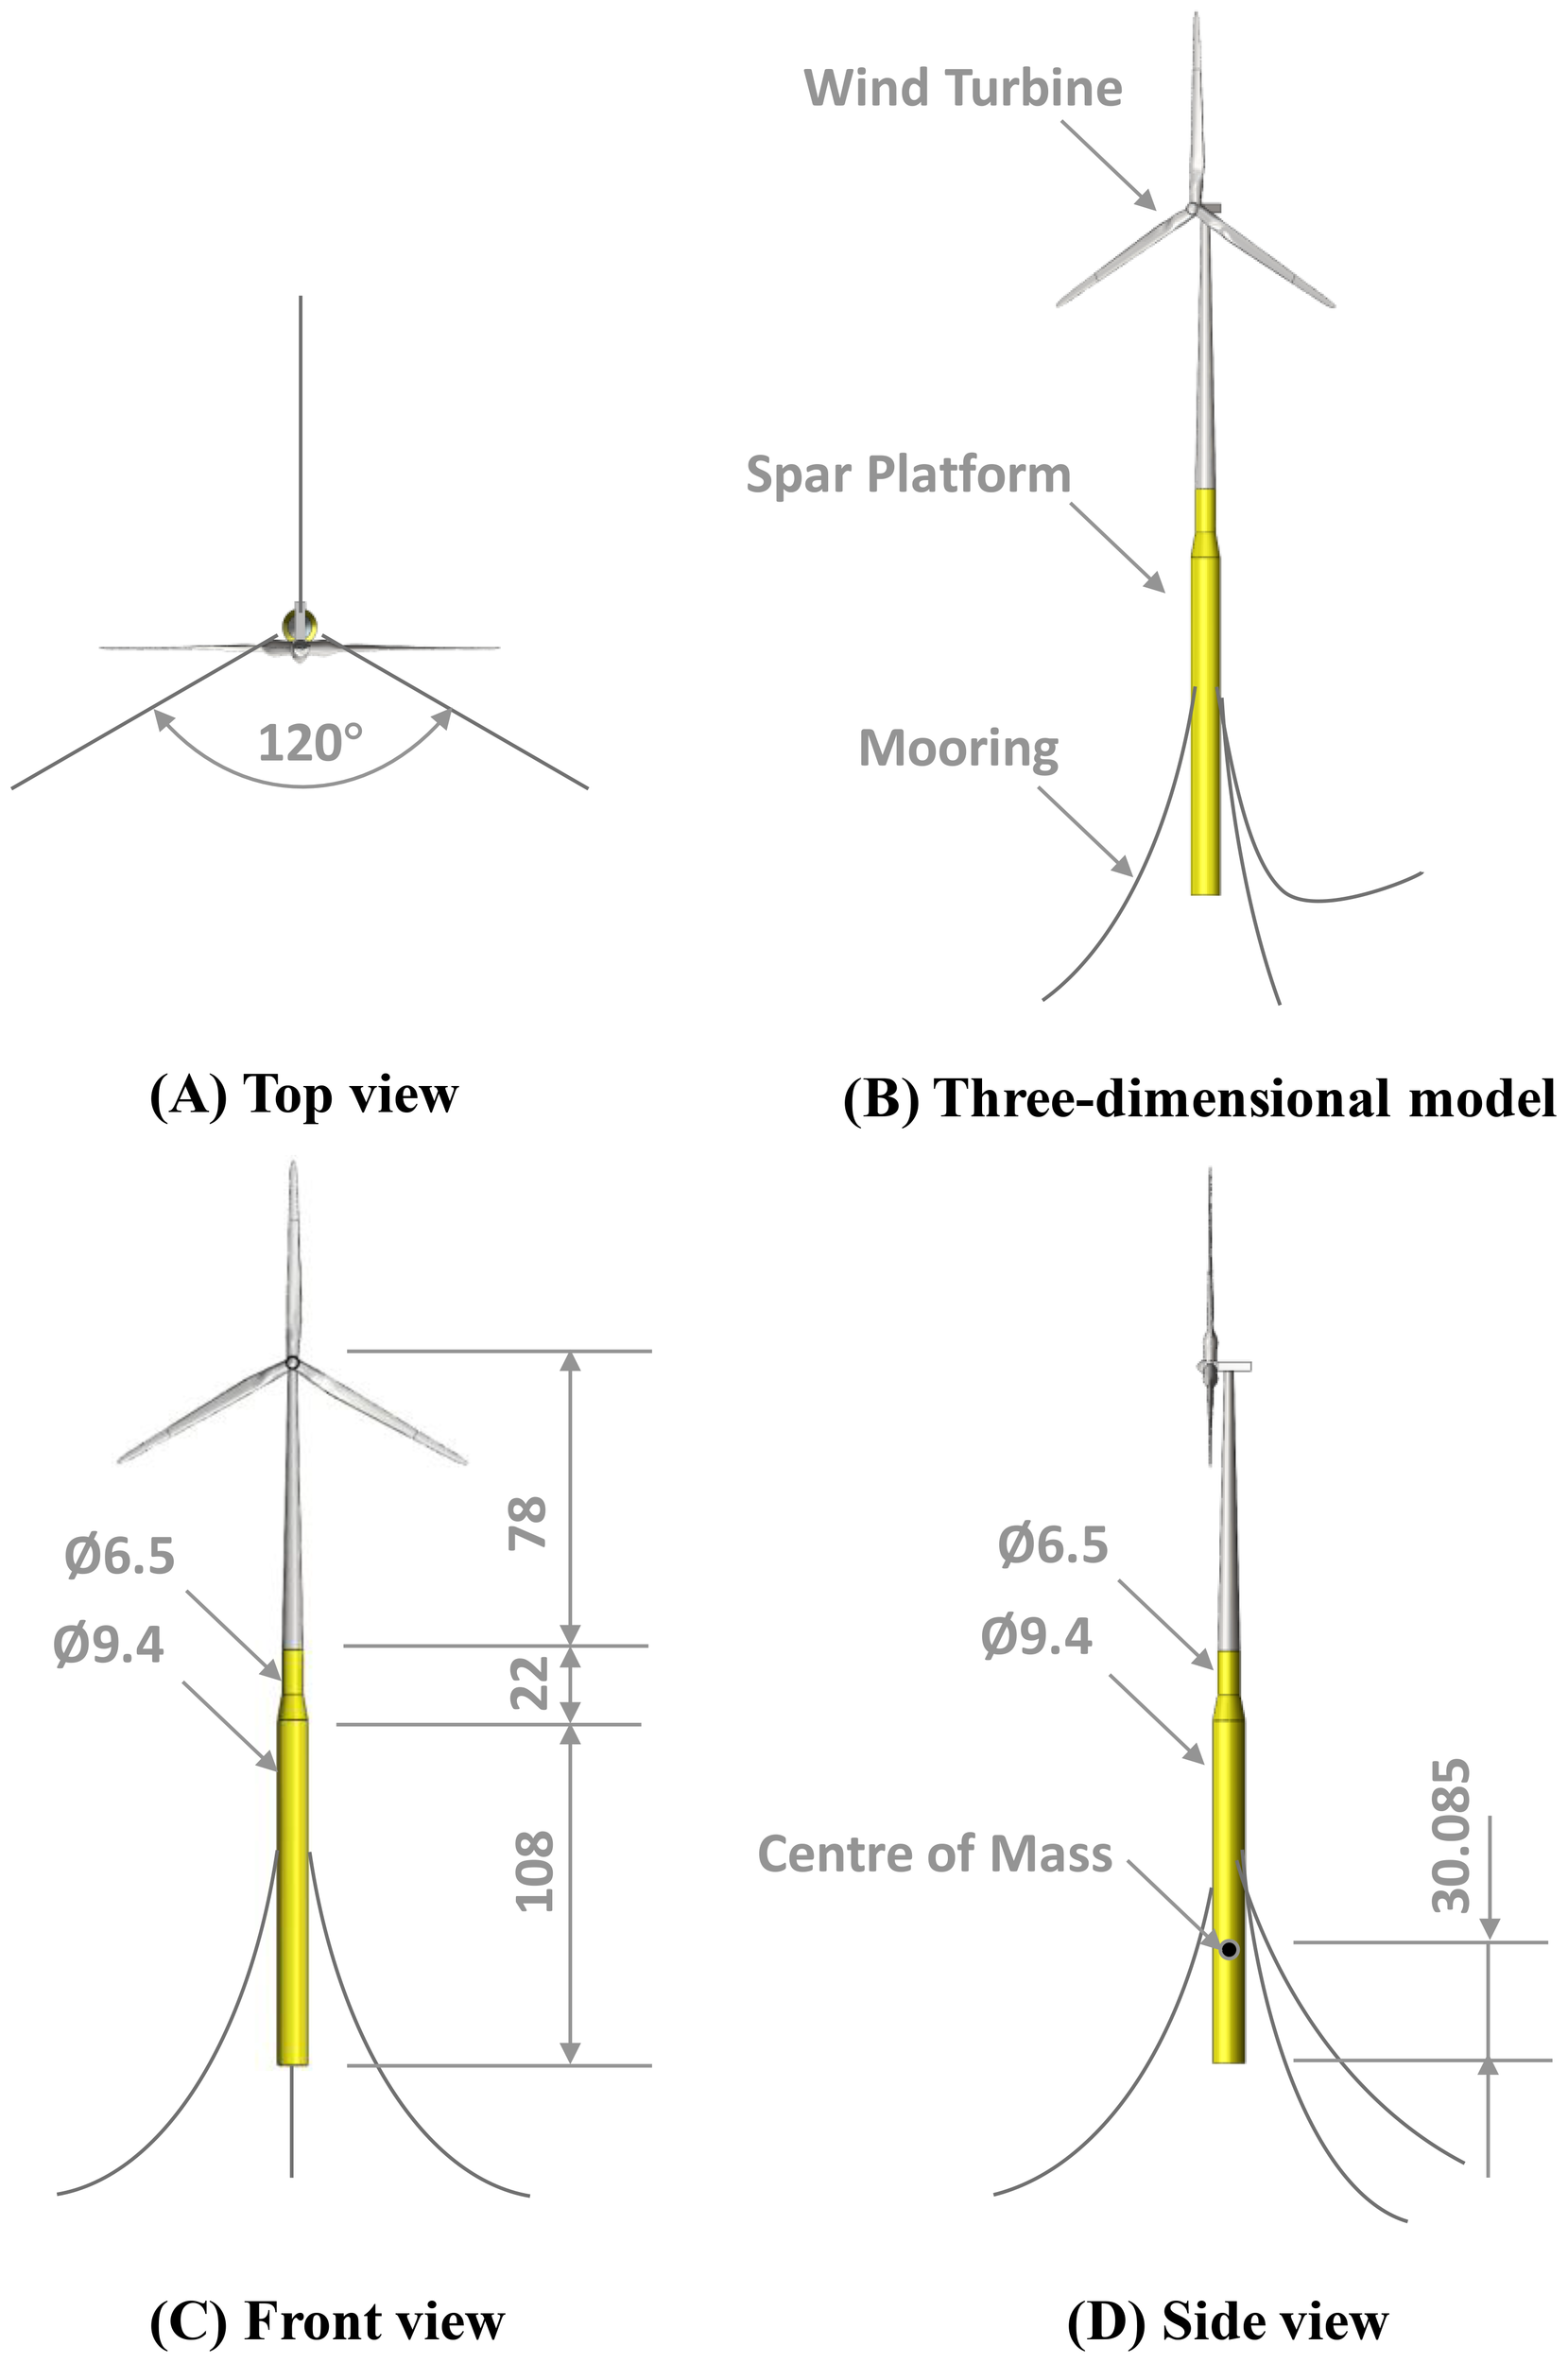
Schematic diagram of the 5MW- OC3 Hywind spar FOWT (unit: m): (A) top view; (B) three-dimensional model; (C) front view; (D) side view.
Table 1
| Property | Value |
|---|---|
| Rating | 5-MW |
| Rotor diameter | 126.0 m |
| Hub diameter | 3.0 m |
| Control system | Variable speed; Variable blade pitch |
| Drivetrain | High speed; Multiple-stage gearbox |
| Cut-in, Rated, Cut-out wind speed | 3.0 m/s, 11.4 m/s, 25 m/s |
| Main shaft tilt | 5 o |
| Rotor mass | 110.00 t |
| Nacelle mass | 240.00 t |
| Tower mass | 347.46 t |
The main properties of NREL 5MW wind turbine.
The spar platform is made up of upper and lower cylindrical segments connected together by a conical segment (Jonkman, 2010). The platform parameters are listed in Table 2. The mooring system consists of three catenary mooring lines, spaced 120° apart.
Table 2
| Property | Value |
|---|---|
| Overall mass | 7,466.33 t |
| Seawater displacement | 8,029.21 t |
| Water depth | 500 m |
| Total draft | 120 m |
| Center of mass (rel. to platform base) | 30.085 m |
| Roll inertia about the center of mass | 4,229,230 t·m2 |
| Pitch inertia about the center of mass | 4,229,230 t·m2 |
| Yaw inertia about the center of mass | 164,230 t·m2 |
The main properties of the OC3 spar platform.
2.2 Single mooring line modeling
A mooring system, which is designed to hold a floating platform in position and provide sufficient restoring force under various environmental conditions (Huang et al., 2024). Based on the water depth, mooring specifications, and the restoring stiffness of the platform, a quasi-static design was conducted for a single mooring line in this study. As illustrated in Figure 1, this study utilizes a chain-wire-chain configuration for the single mooring line. Each FOWT has two single anchor mooring lines at the sides with a 120° angle between them.
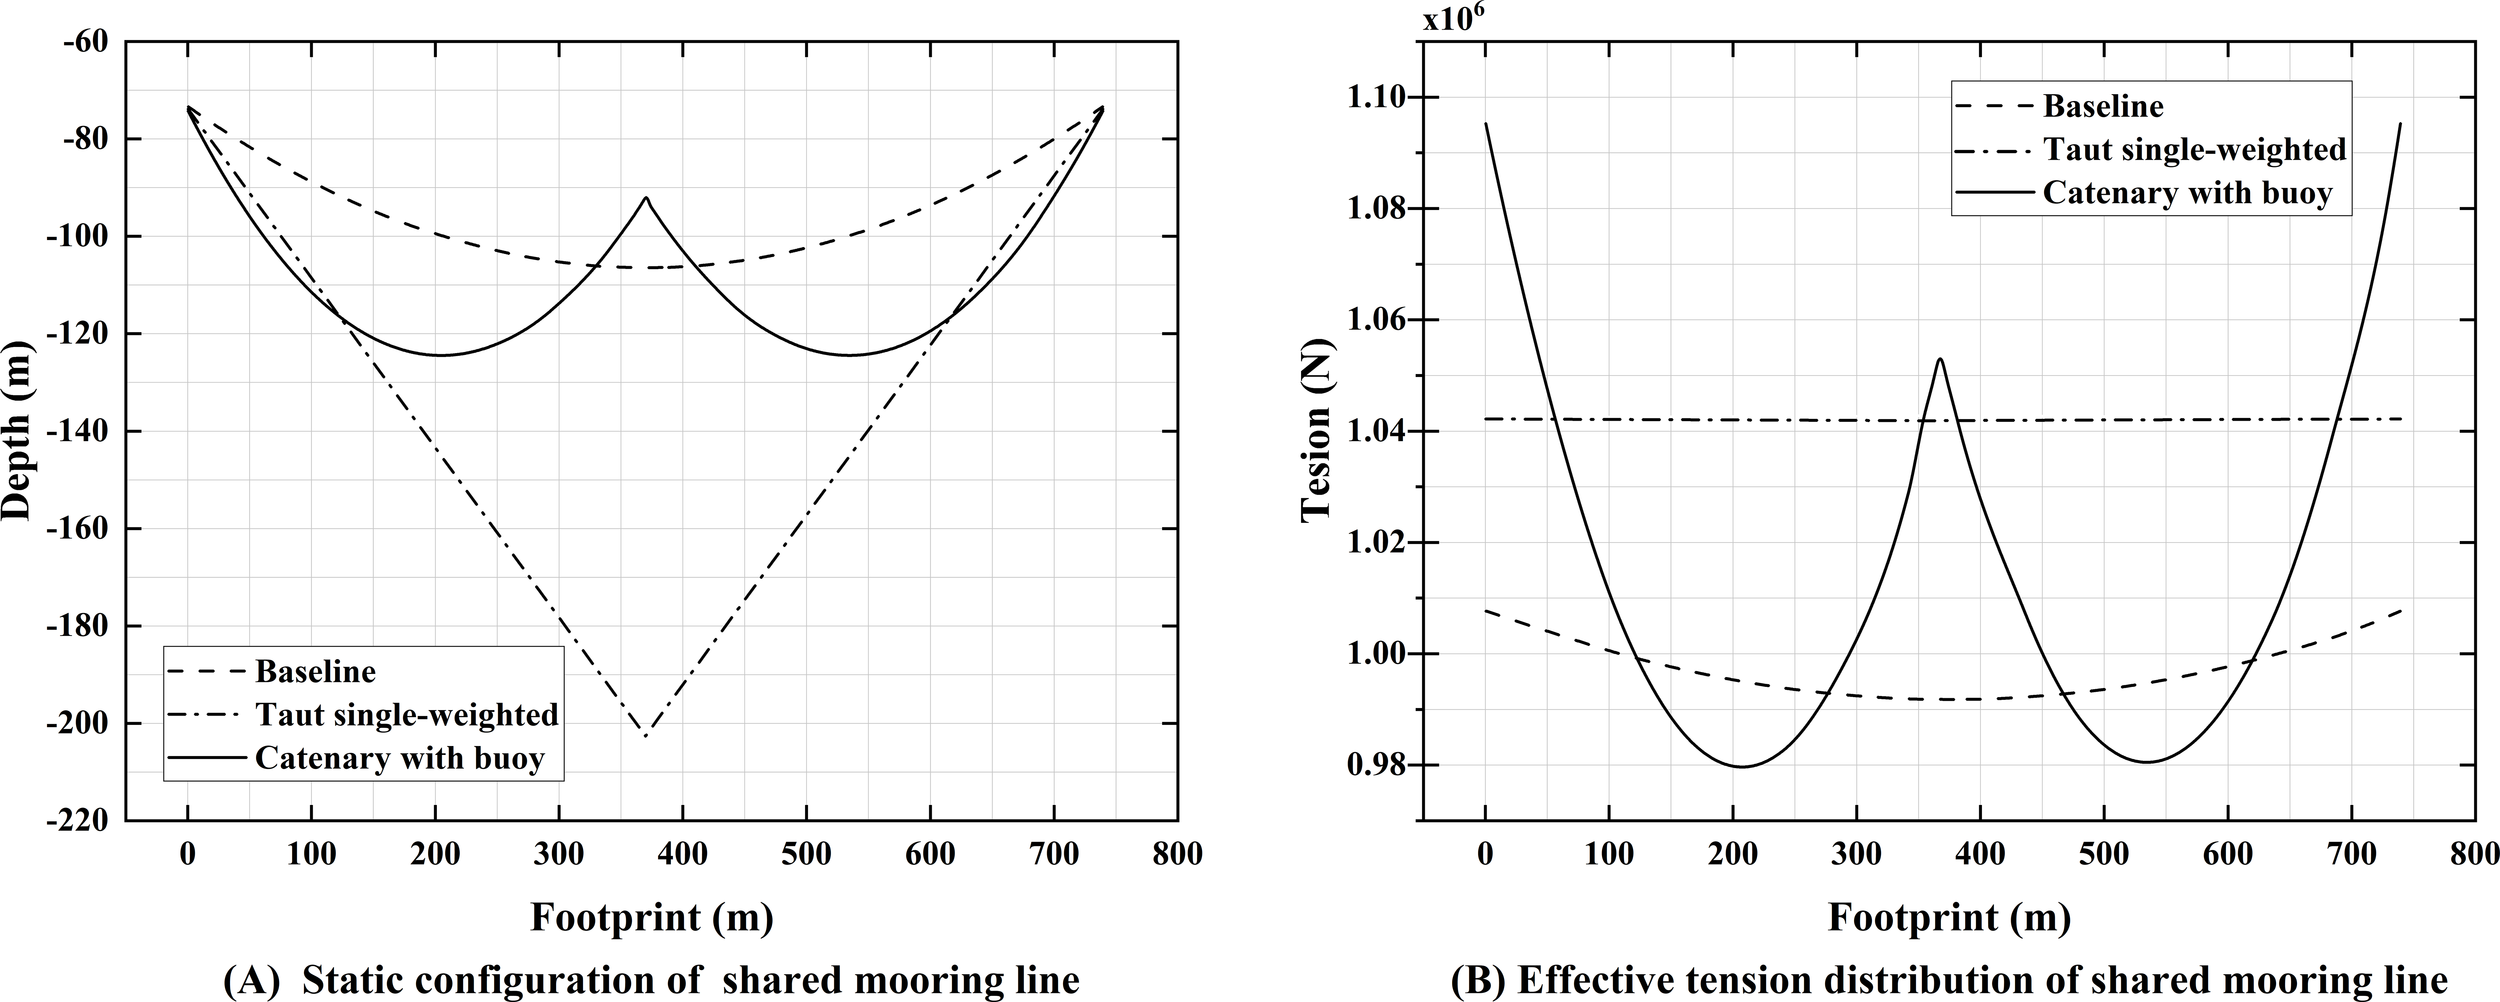
Furthermore, an elastic model is used to simulate the interaction between the touch-down point (TDP) and the anchor segment, simplifying the seabed as an elastic spring. The normal stiffness is used to define the normal spring characteristics, while the shear stiffness is applied to calculate the frictional forces. In this linear stiffness model, the stiffness value represents the reaction force generated per unit contact area and unit penetration depth on the seabed. Since these parameters must be determined through detailed geological surveys, which are beyond the scope of this study, the default stiffness value in OrcaFlex (100 kN/m³) was used. The stiffness of the mooring lines consists of both material stiffness and geometric stiffness. The force-displacement properties of the single line system are determined by material characteristics, cable geometry, and the overall mooring system configuration. Detailed properties of the single mooring lines are provided in Table 3. The static configuration of the single mooring line and the corresponding effective tension distribution are presented in Figures 3A, B, respectively.
Table 3
| Mooring property | Upper segment | Middle segment | Lower segment |
|---|---|---|---|
| Mooring line type | R3 studless chain | Steel wire rope | R3 studless chain |
| Mooring line length (m) | 100 | 360 | 950 |
| Diameter of mooring line (m) | 0.12 | 0.127 | 0.12 |
| Dry weight (kg/m) | 291 | 68 | 291 |
| Wet weight (kg/m) | 253 | 59.1 | 253 |
| Extensional stiffness (N) | 1.23E+09 | 8.35E+08 | 1.23E+09 |
| Minimum breaking strength (N) | 1.10E+07 | 1.14E+07 | 1.10E+07 |
The main properties of the single mooring line.
Figure 3
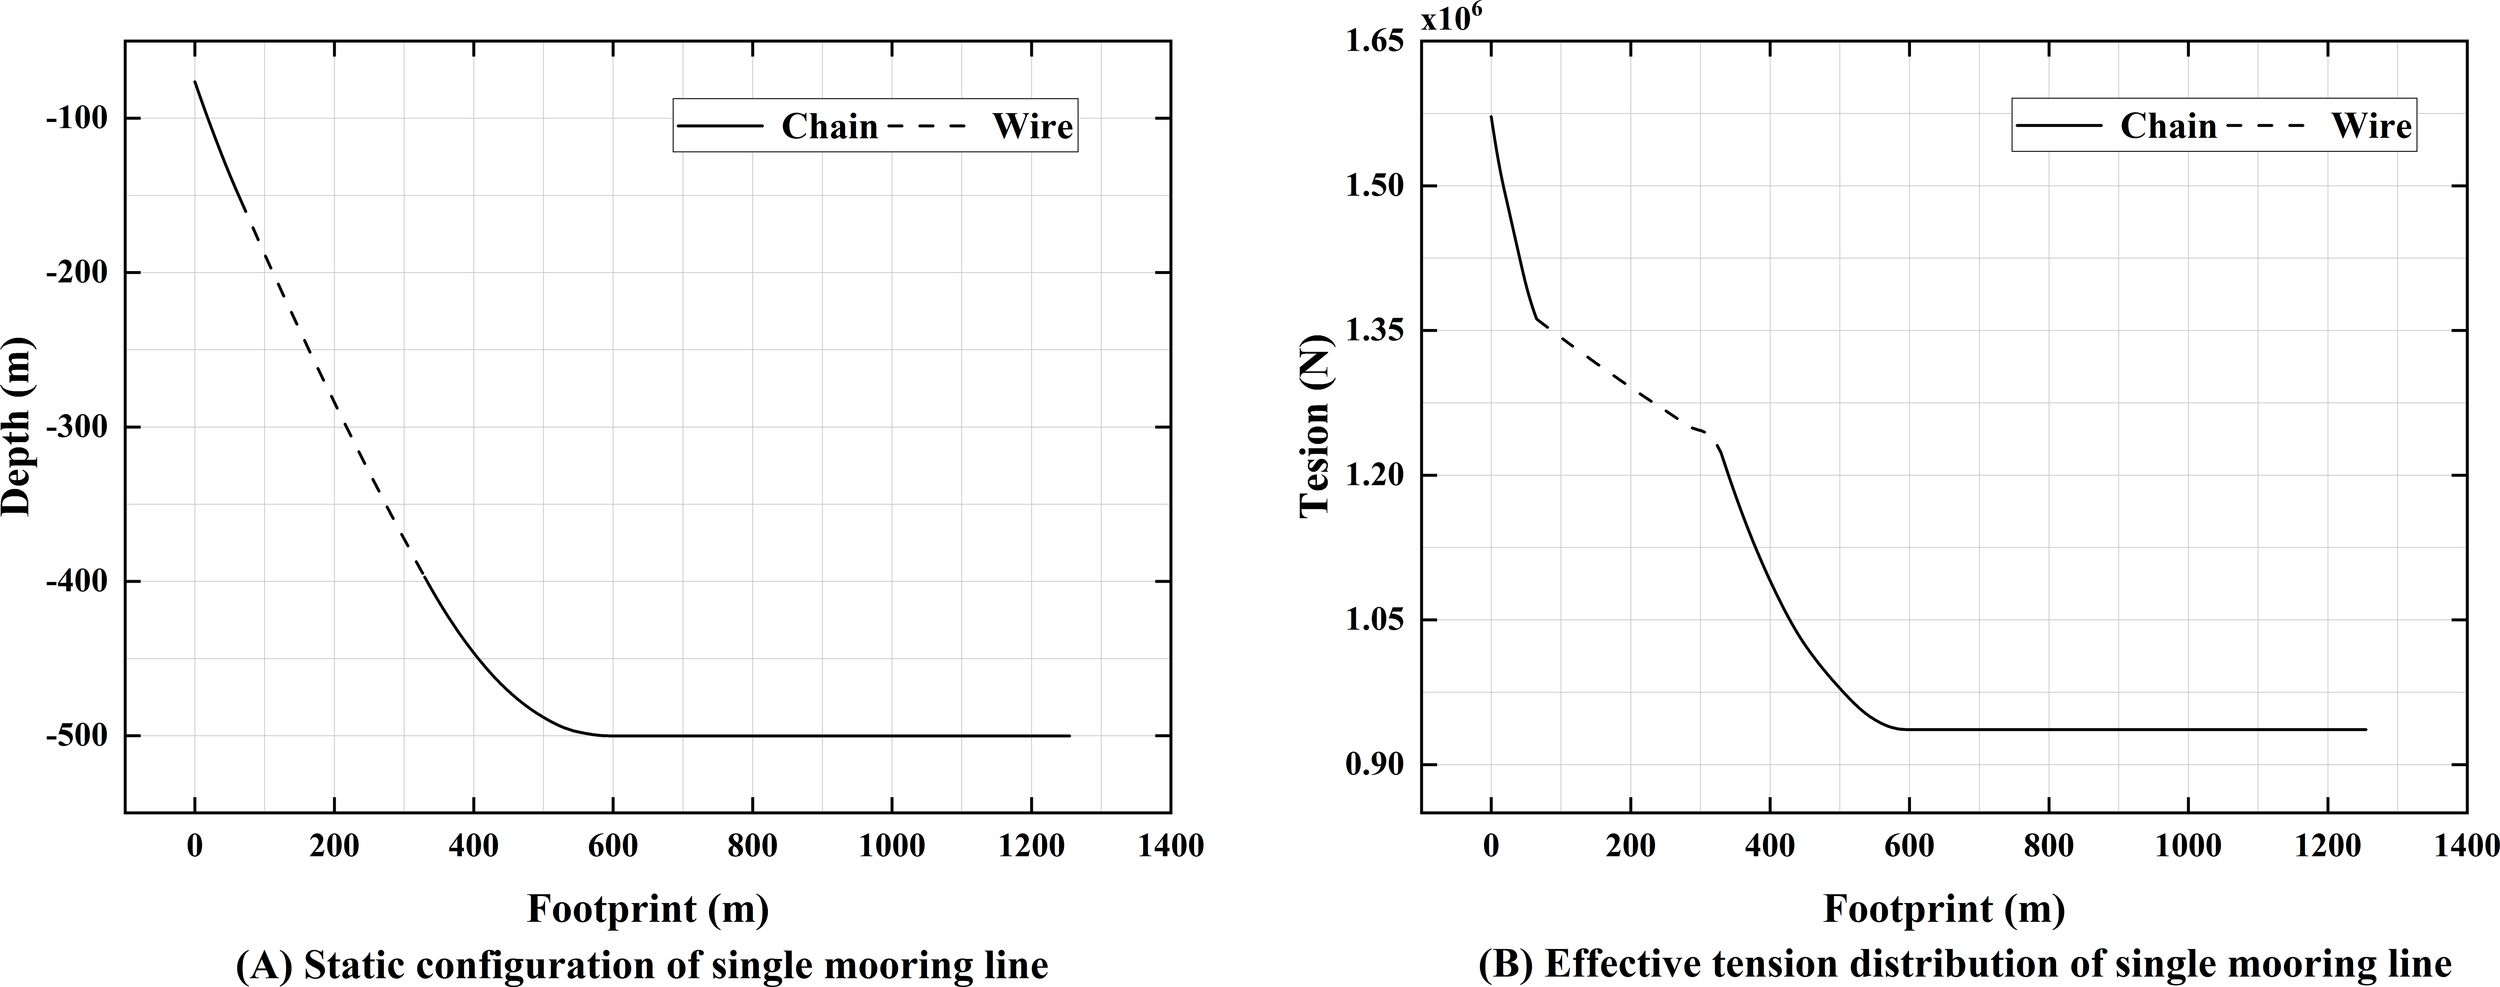
Static analysis of the single mooring line: (A) static configuration; (B) effective tension distribution.
2.3 Shared mooring line modeling
Based on the horizontal components of the fairlead tension obtained from the single mooring design and the turbine spacing, a quasi-static design for the shared mooring system was conducted. Liang et al. (2021) conducted a quasi-static analysis of the shared mooring lines and introduced a set of assumptions based on the DNVGL-OS-E301 standard (DNV, GL, 2015), which included neglecting the dynamic response, bending stiffness, and the effects of current loads on the mooring lines. Figure 4 illustrates the shared line in the catenary plane, with the origin of the coordinate system positioned at one of the fairleads (). When the two fairleads are positioned at different water depths, Irvine’s modeling method becomes applicable for the hanging mooring structures (Liang et al., 2021). Reference (Liang et al., 2020) provides a description of this modeling approach. The nonlinear elastic catenary equations for the shared mooring line are expressed by Equations 1 and 2.
Figure 4
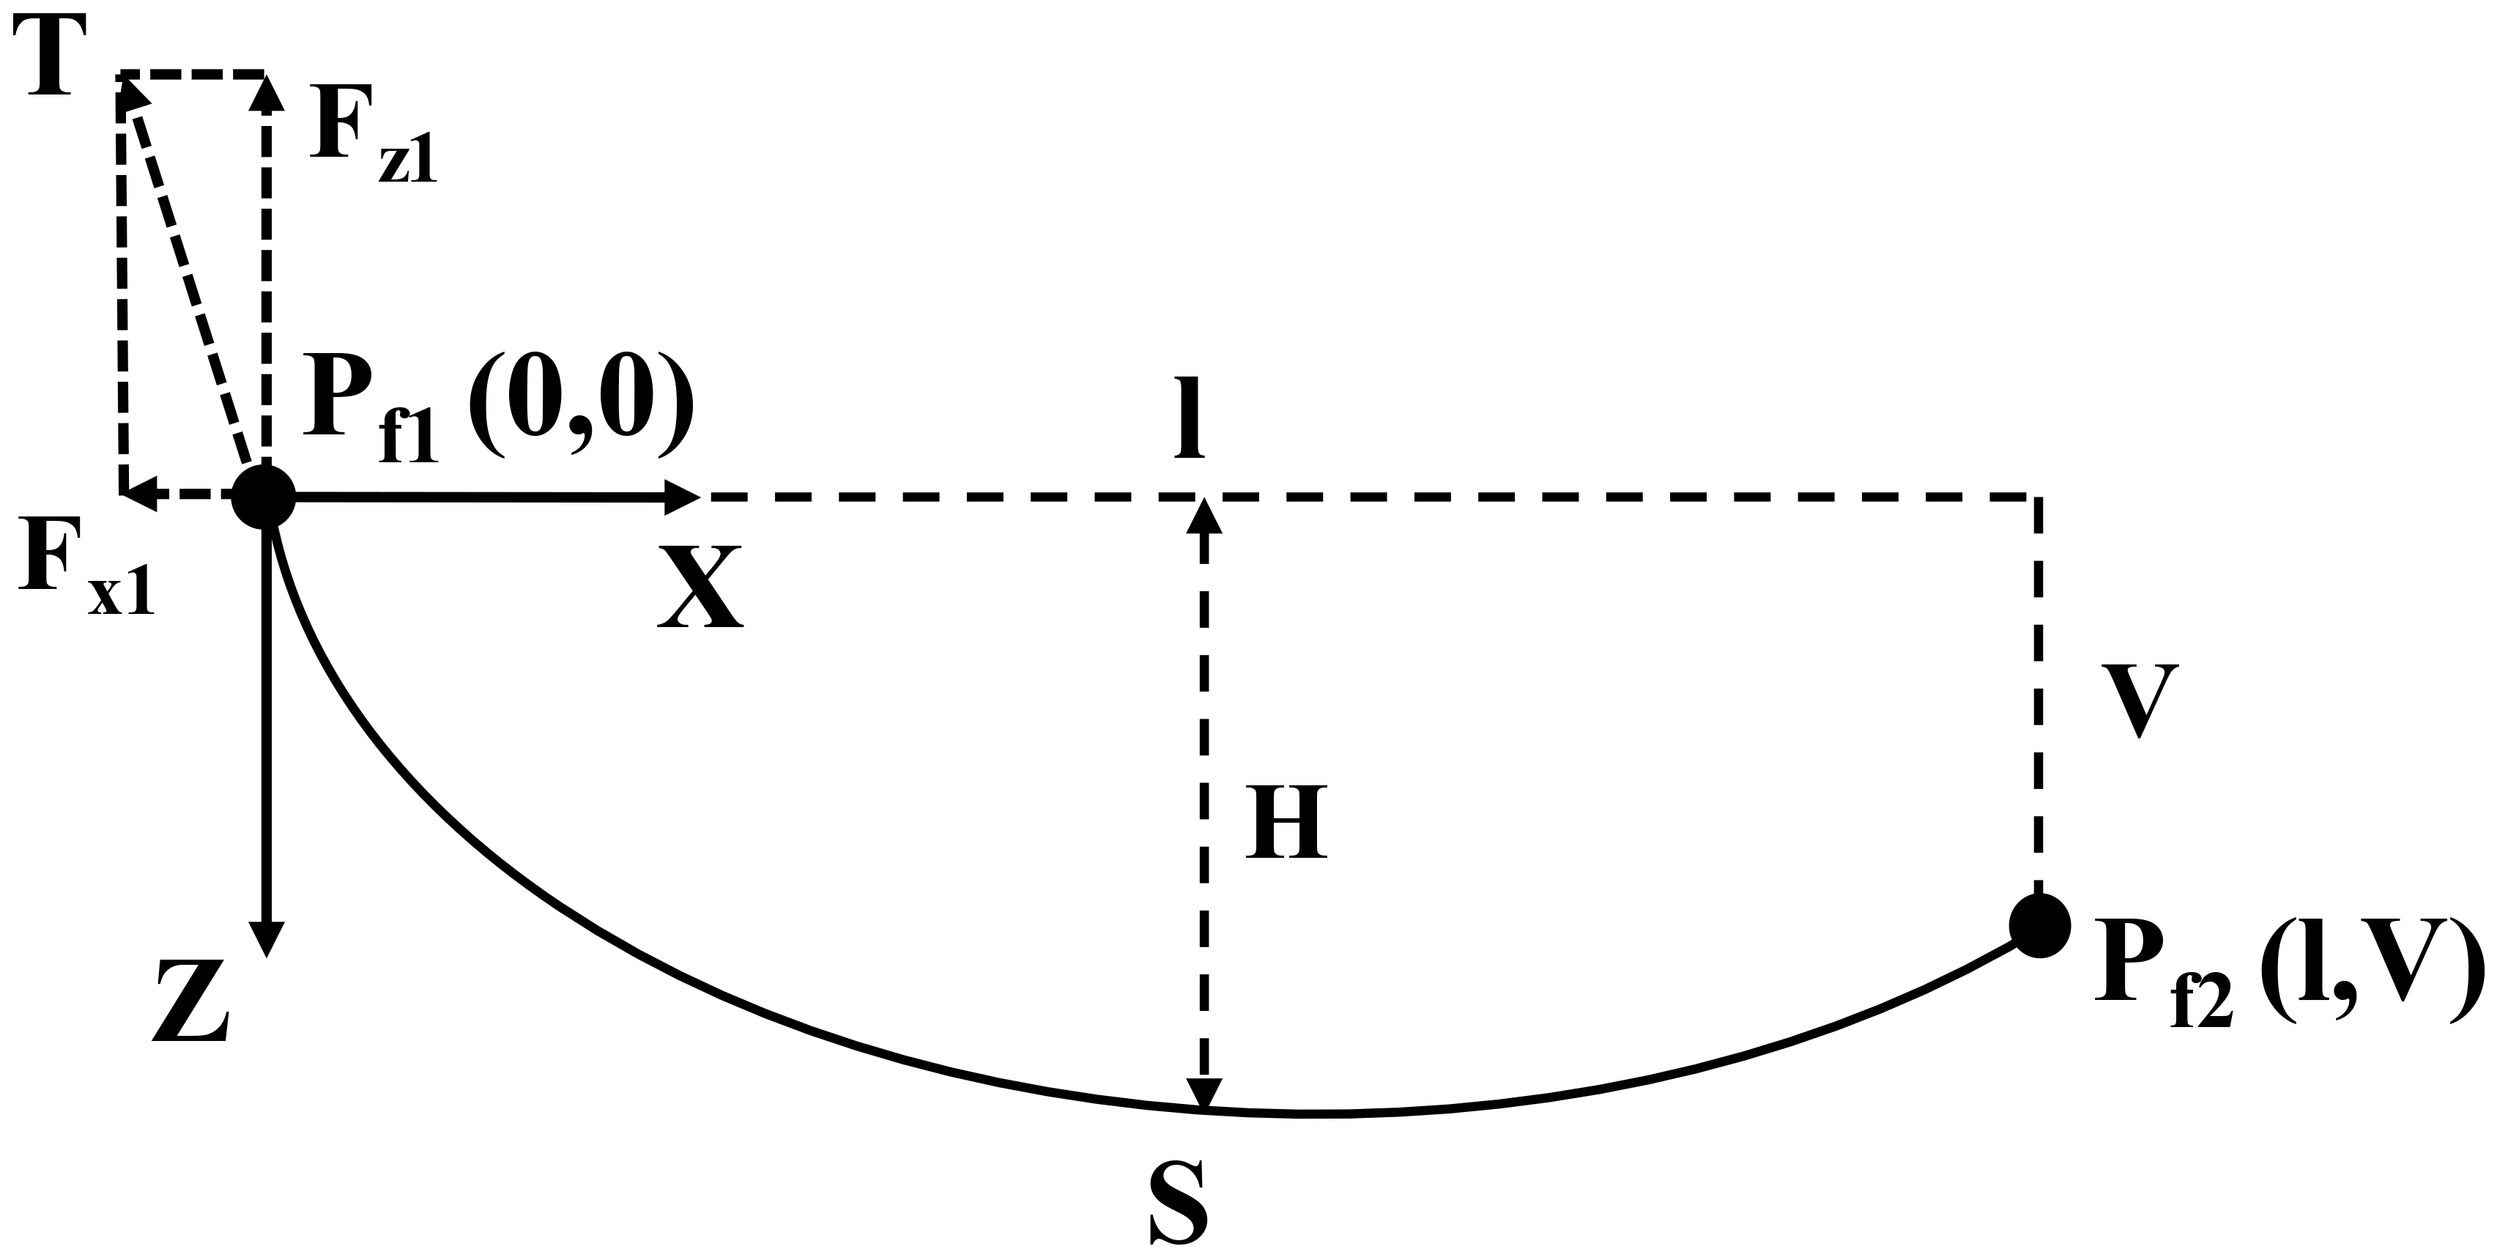
Illustration of a shared line in the catenary plane.
where, and respectively represent the horizontal distance and vertical distance between and (m). and (N) denote the horizontal and vertical components of the total tension acting at . is the total suspended length of the mooring line (m). is the submerged weight per unit length of the mooring line (kg/m). represents the extensional stiffness of the mooring line, where is the material’s elastic modulus (Pa) and is the cross-sectional area of the line (m2).
Given the coordinates of and , and an initial value of , the catenary configuration of the shared line can be solved by iteration. As shown in Tables 4 and 5, due to differences in the mooring materials used in these three configurations, this study selects three materials with similar breaking strengths. Additionally, the horizontal tension at the fairlead is kept consistent. For the three configurations, the differences in the initial platform positions and the minimum breaking strength of the mooring lines are both less than 1%, ensuring the comparability of platform displacements and mooring tensions. For all three configurations, the initial platform positions and the minimum breaking strength of the mooring lines are both less than 1%, ensuring the comparability of platform displacements and mooring tensions. The static configurations and effective tensions of the three shared mooring line configurations studied in this study are shown in Figure 5.
Figure 5
Static analysis of the shared mooring line: (A) static configuration; (B) effective tension distribution.
Table 4
| Mooring property | Baseline | Taut single-weighted | Catenary with buoy |
|---|---|---|---|
| Mooring line type | Steel wire rope | Polyester rope | R3 studless chain |
| Mooring line length (m) | 741.6 | 780 | 762.5 |
| Diameter of mooring line (m) | 0.118 | 0.197 | 0.111 |
| Dry weight (kg/m) | 60.2 | 31 | 245 |
| Wet weight (kg/m) | 52.1 | 7 | 212 |
| Extensional stiffness (N) | 7.21E+08 | 3.18E+08 | 1.05E+09 |
| Minimum breaking strength (N) | 9.68E+06 | 9.63E+06 | 9.65E+06 |
| Horizontal pretension Fx1 (N) | 9.86E+05 | 9.86E+05 | 9.86E+05 |
| Vertical pretension Fz1 (N) |
1.78E+05 | 3.43E+05 | 4.90E+05 |
Properties of shared mooring lines for the three configurations.
Table 5
| Parameter | Taut single-weighted | Catenary with buoy |
|---|---|---|
| Mass (kg) | 8.07E+04 | 3.34E+04 |
| Volume (m3) | 10.27 | 110.12 |
| Net buoyancy (N) | / | 7.78E+05 |
| Submerged weight (kg) | 7.01E+04 | / |
Properties of the buoy and the clump weight.
2.4 Dual-spar FOWF configurations
This study analyzes three distinct shared mooring line configurations (see Figure 1). In the Baseline configuration, steel wire rope is employed for the shared mooring. Research by Liang et al. (2024a) on this configuration demonstrated that significant dynamic tension fluctuations occur in the shared lines due to the relative motions between the two FOWTs. These fluctuations pose a risk of inducing snap loads, potentially leading to structural failure. The study by Xu et al. (2025) demonstrated that a mooring system incorporating clump weights and buoys effectively enhances the stability of floating structures. Based on this, two alternative configurations are proposed in this study. The taut single-weighted configuration incorporates a clump weight in the middle section of the polyester rope, and the catenary with buoy configuration adds a buoy to the middle section of the chain.
As shown in Figure 6, the three configurations were deployed along the Xg-axis of the global coordinate system with the OC3 Hywind FOWTs. The initial turbine spacing is 750 m which is approximately six times the rotor diameter, and the water depth was 500 m. For each FOWT, the projection angle of any two adjacent mooring lines on the horizontal plane is 120°. Moreover, each FOWT is connected to the anchor points through two single mooring lines, and the horizontal distance between the anchor point and the corresponding fairlead is 1260 m. For all configurations, a three-section single line design was selected: the upper and lower segments use chain, while the middle segment is steel wire rope. More detailed data can be found in Section 2.2.
Figure 6
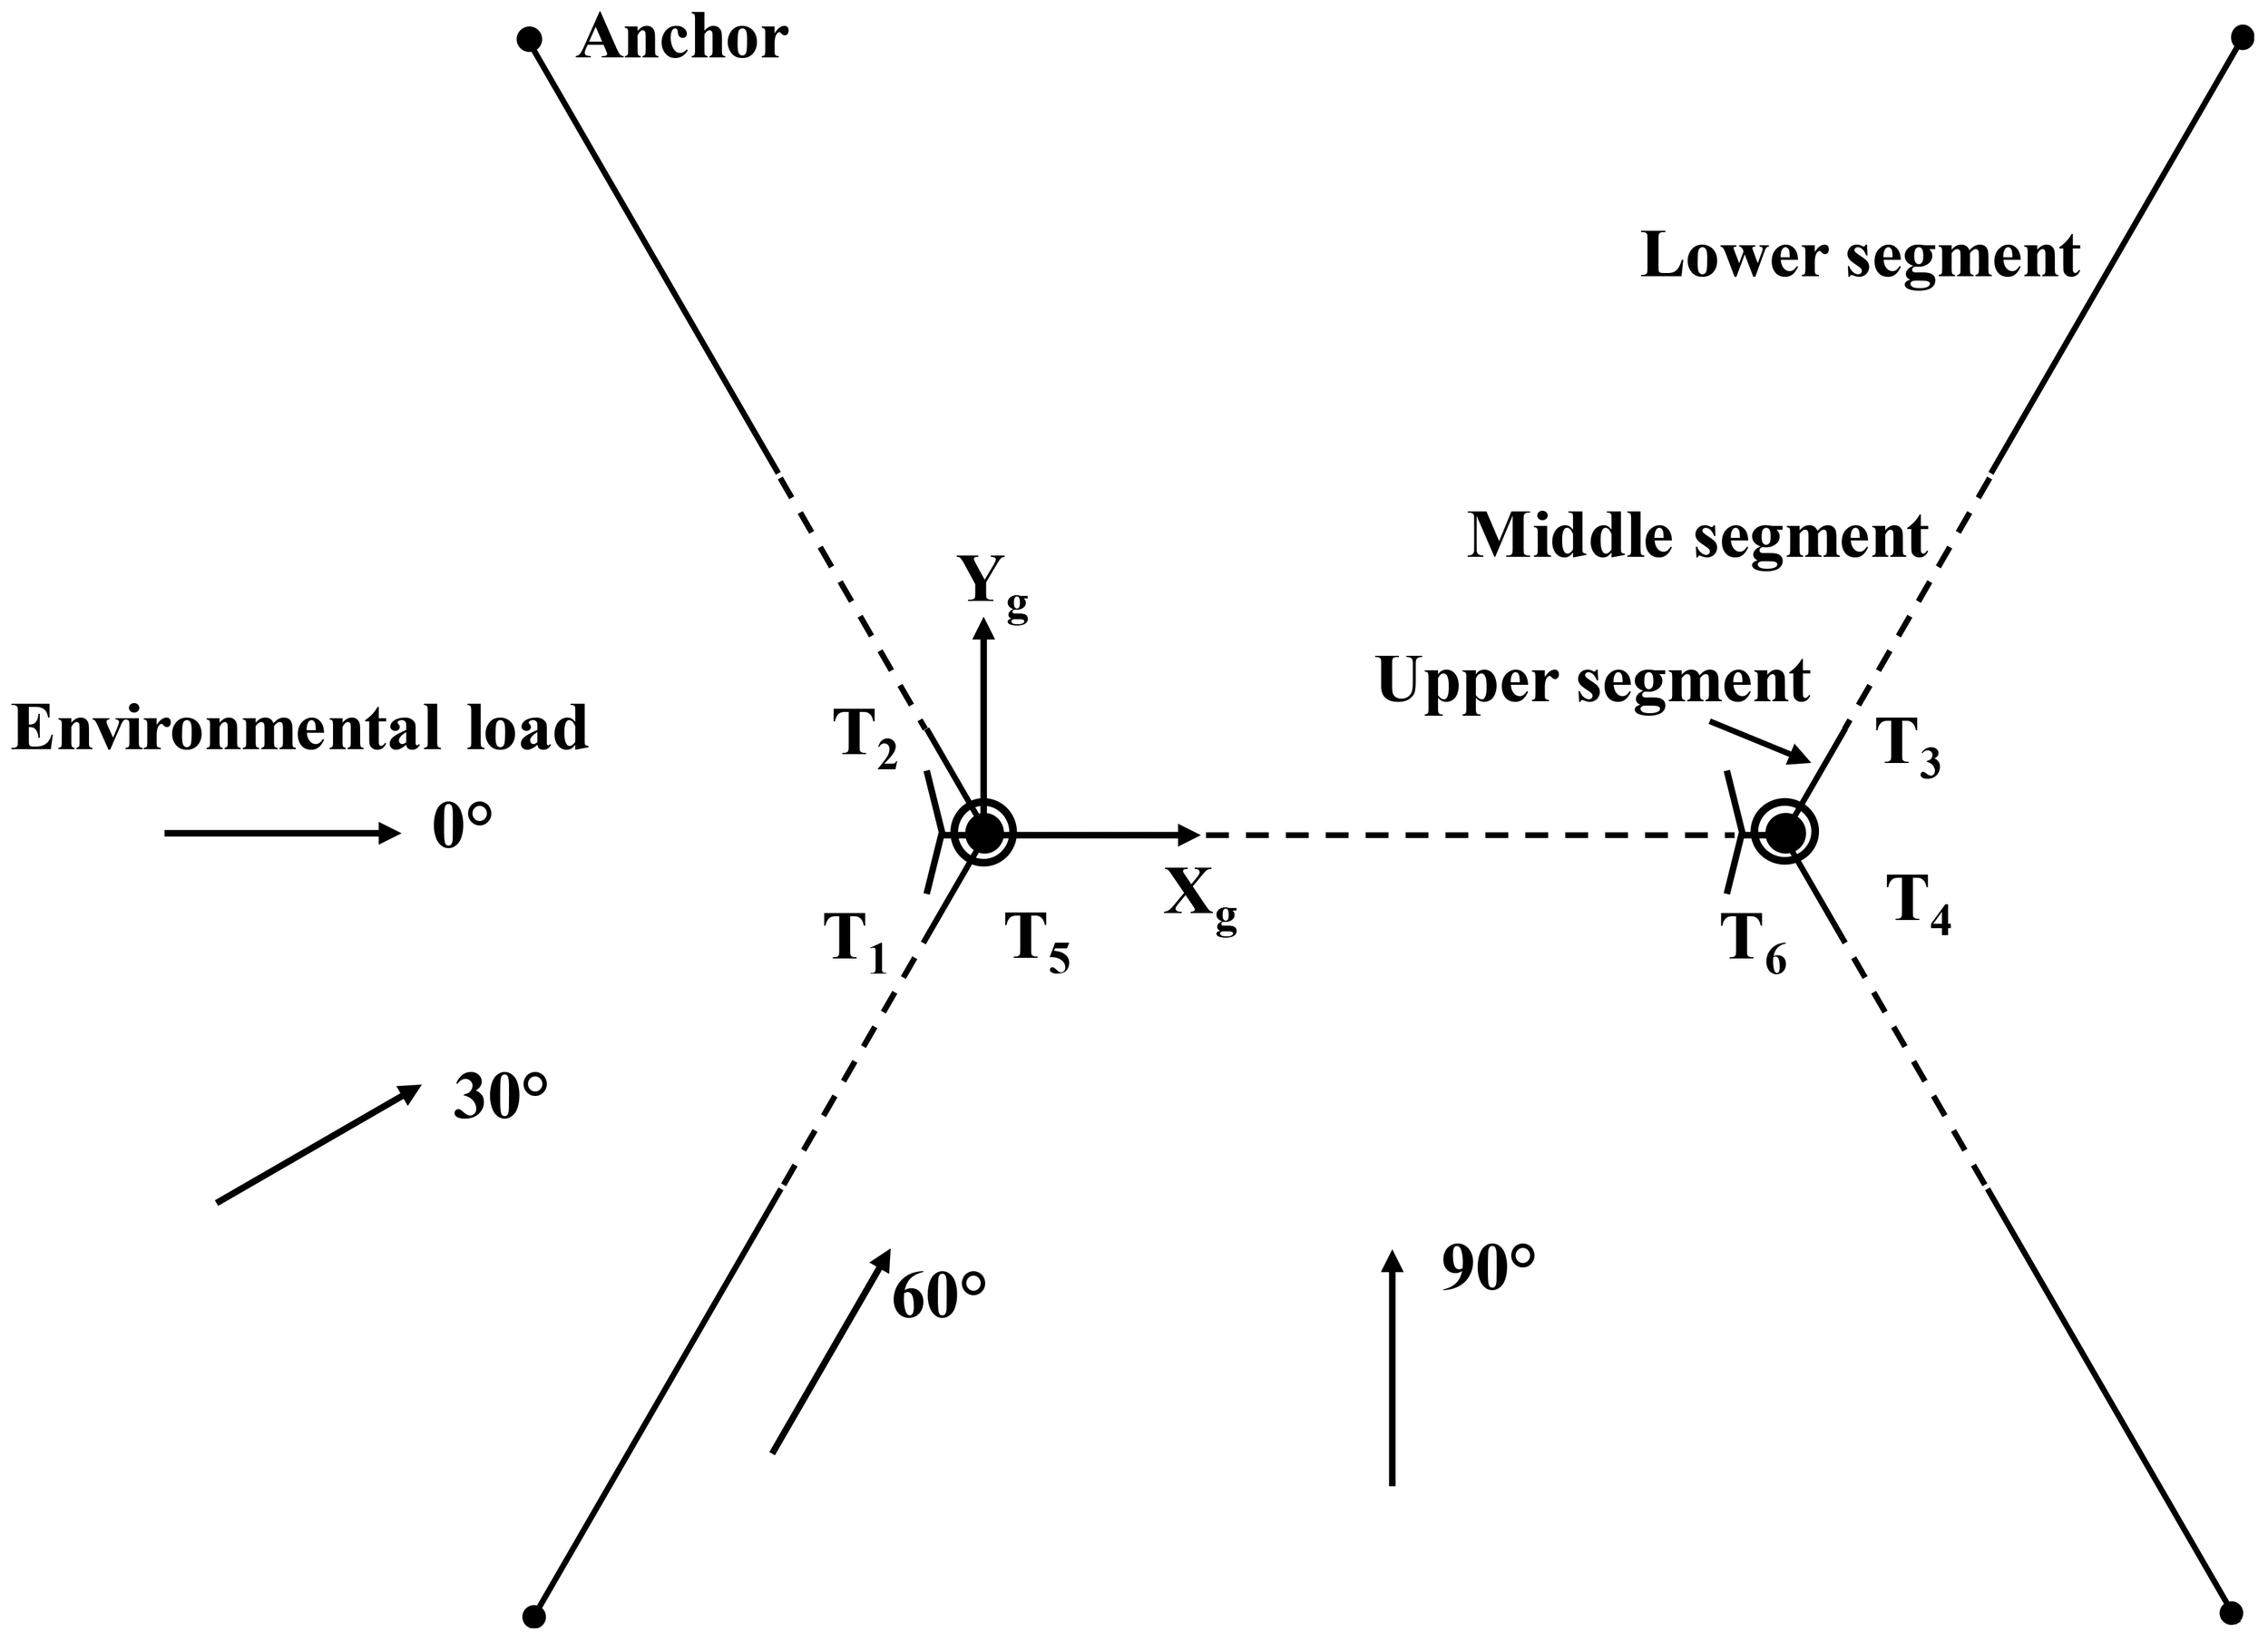
Top view of the dual-spar baseline FOWF.
2.5 Numerical methodology
This section presents the complete numerical analysis procedure, as shown in Figure 7. The process involves two critical preprocessing steps: TurbSim is used to generate a three-dimensional turbulent wind field based on the Kaimal spectrum, while ANSYS-AQWA is employed to compute the frequency-domain hydrodynamic coefficients of the platform. In the post-processing phase, MATLAB is utilized to conduct snap event analysis and fatigue damage evaluation on the time series of mooring tension output from OrcaFlex.
Figure 7
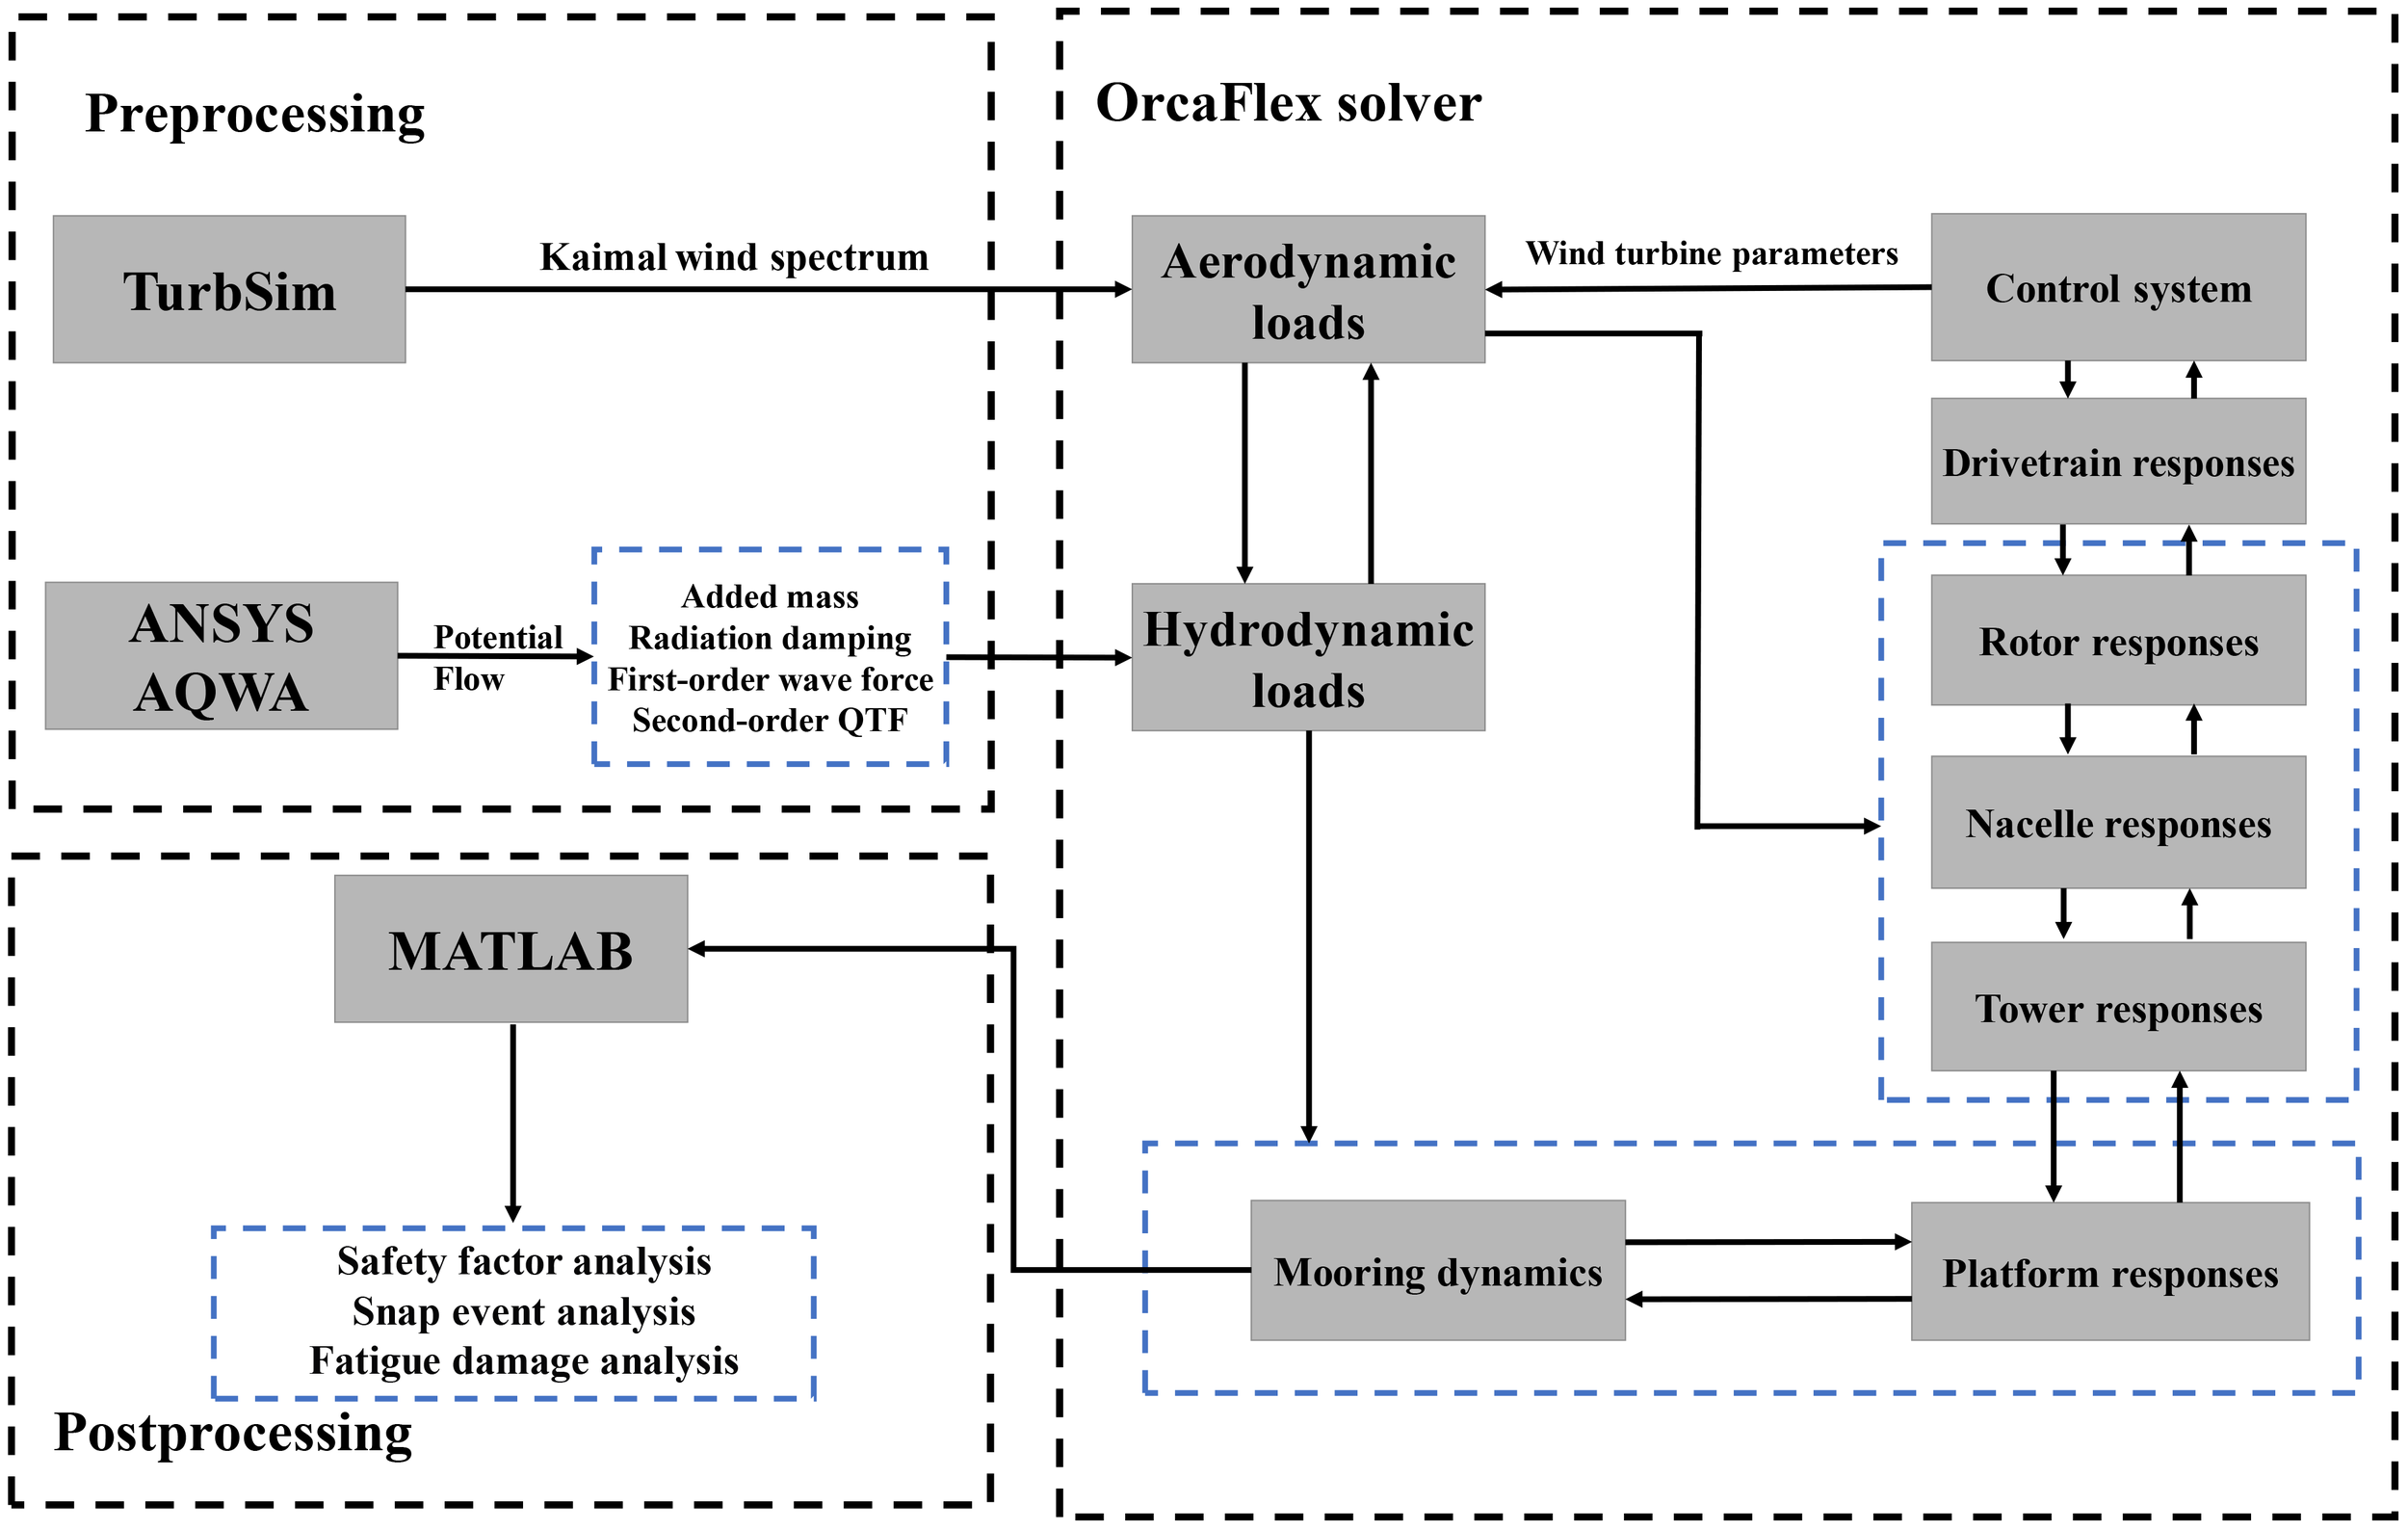
Aero-hydro-moor-servo time-domain fully coupled process.
The modeling process is based on the official report from Orcina (Ross and McKinnon, 2018), which provides detailed modeling and validation for the 5 MW wind turbine and the OC3 Hywind system. The modeling procedure is as follows: first, a panel model of the Spar platform is established in AQWA, followed by a frequency-domain hydrodynamic analysis. Based on potential flow theory, key hydrodynamic coefficients are obtained, including added mass, radiation damping, hydrostatic restoring forces, first-order wave load transfer functions, and second-order quadratic transfer function (QTF) (Zou et al., 2023). Subsequently, the hydrodynamic parameters extracted from AQWA are imported into the vessel type defined within OrcaFlex (Lian et al., 2024).
The blades of the 5 MW wind turbine are modeled as flexible bodies. The nacelle is represented using a lumped six-dimensional (6D) buoy model. The 6D buoy is a rigid body that exhibits all six degrees of freedom, including three translational and three rotational movements. The tower is modeled using a line type. A baseline controller (DISCON) is employed to control the generator torque and blade pitch angle in order to maintain the rated power output of the FOWT. The tuning parameters of the controller are set according to the study by Jonkman et al. (2009). For the operating rotor, revised blade element momentum (BEM) theory is applied to calculate aerodynamic loads (Wang et al., 2023). For the parked rotor with feathered blades, aerodynamic loads are computed based on the airfoil coefficients specified in Reference (Jonkman et al., 2009).
In OrcaFlex, the lumped mass method is used to calculate mooring line tension. In this method, each line is divided into equal segments, with loads concentrated at the nodes. When defining a line type, parameters such as line diameter, mass per unit length, axial stiffness, added mass coefficient, and drag coefficient are input (Hall and Goupee, 2015). Clump weights and buoys are modeled as lumped 6D buoys possessing corresponding mass properties, including mass, mass moment of inertia, and center of gravity position. Furthermore, the added mass and drag forces on the mooring line, clump weight, and buoy are calculated by setting the corresponding hydrodynamic coefficients, with reference to design standard (DNV, 2010) and relevant commercial data.
3 Study conditions
3.1 Metocean condition
The FOWF studied in this paper is deployed in the South China Sea with a depth of 500 m and a wave period range of 10–14 s (Zheng, 2014). Research by Xu et al. (2025) indicated that mooring systems equipped with clump weights and buoys exhibit excellent stability across various water depths. Based on the finding, this study focuses on a representative depth of 500 m to conduct a detailed analysis.
In the operational condition, the rated wind speed of the FOWT corresponds to the mean wind speed (Vw), while the significant wave height (Hs), peak spectral period (TP), and mean current speed (Vc) are derived from the mean values of their conditional distributions. The extreme condition is derived from the 50-year return period environmental contour. Following standard practice (DNV, 2015), the sea state associated with the highest Hs value along this contour is designated as the extreme event for analysis. The wave spectrum is modeled using the JONSWAP spectrum, while the wind spectrum follows the Kaimal spectrum. Specific parameters for both operational and extreme conditions are provided in Table 6. For mooring system analysis, the simulation is usually carried out under the worst sea states, and the wind, wave and current acting in the same direction (DNV, 2010). The direction of environmental loads is illustrated in Figure 6.
Table 6
| Environmental conditions | Turbulence Intensity (%) | Vw (m/s) | Hs (m) | TP (s) | Vc (m/s) |
|---|---|---|---|---|---|
| OC1: Operational | 14 | 11.4 | 6.5 | 11.3 | 0.14 |
| EC2: Extreme | 11 | 45.7 | 13.0 | 13.6 | 0.47 |
Environmental data under operational and extreme conditions.
3.2 Load cases
To study the overall dynamic response of FOWF under wind-wave-current combined loads, time-domain numerical simulations are performed in OrcaFlex. Liang et al. (2024b) conducted a convergence analysis of the shared mooring system under extreme conditions, investigating the sample averages of platform motion and mooring response statistics. The results showed that 15 simulations, each lasting 1 hour, were sufficient for the dynamic response statistics to converge. Therefore, after excluding the initial transient period, fifteen 1-hour simulations were conducted for each case using different random seeds. The random seeds adopted correspond to the default seeds 1–15 in OrcaFlex. A time step of 0.1 s was chosen to ensure accurate capture of the system’s dynamic characteristics (Liu et al., 2024). As shown in Table 7, Cases 1–4 are used to analyze the impact of submerged weight of the clump weight, Cases 5–8 are for assessing the effect of net buoyancy of the buoy, and Cases 9–14 are used to compare the performance of the three shared mooring systems. In addition, based on the simulation results of Cases 1-8, an analysis was conducted on the material costs of shared mooring. The specific analysis results are presented in Sections 4, 5, and 6, respectively.
Table 7
| Case | Configuration | Load scenario | Environmental condition | Load direction | Turbine state | |
|---|---|---|---|---|---|---|
| Spar 1 | Spar 2 | |||||
| 1 | Taut single-weighted (TW1) | Extreme | EC2 | 0° | Parked | Parked |
| 2 | Taut single-weighted (TW2) | |||||
| 3 | Taut single-weighted (TW3) | |||||
| 4 | Taut single-weighted (TW4) | |||||
| 5 | Catenary with buoy (CB1) | Extreme | EC2 | 0° | Parked | Parked |
| 6 | Catenary with buoy (CB2) | |||||
| 7 | Catenary with buoy (CB3) | |||||
| 8 | Catenary with buoy (CB4) | |||||
| 9 | Baseline | Operational | OC1 | 0°30°60°90° | Operating | Operating |
| 10 | Taut single-weighted (TW2) | |||||
| 11 | Catenary with buoy (CB2) | |||||
| 12 | Baseline | Extreme | EC2 | 0° | Parked | Parked |
| 13 | Taut single-weighted (TW2) | |||||
| 14 | Catenary with buoy (CB2) | |||||
Numerical simulation conditions.
4 Sensitivity study
This section presents and discusses the results of Cases 1-8. Specifically, Section 4.1 introduces the relevant parameters for the clump weight and buoy selected for the sensitivity study. Section 4.2 focuses on the effect of the clump weight mass on the taut single-weighted configuration. Section 4.3 examines the influence of net buoyancy on the catenary with buoy configuration. The relevant fairlead tensions ( to ) discussed in this section are marked in Figure 1.
4.1 Relevant parameters of the selected clump weight and buoy
The clump weight mass and the buoy’s net buoyancy are significant parameters influencing the dynamic response of FOWF. This study explores their effects through sensitivity analyses. As shown in Figure 8A, for the taut single-weighted configuration, with the same horizontal pretension of the shared mooring line, the vertical pretension increases with the clump weight. TW1, TW2, TW3, and TW4 in Table 8 represent the lengths of the four polyester cables used in this configuration, along with their corresponding clump weight parameters. Figure 8B shows that for the catenary with buoy configuration, with the same horizontal pretension as the taut single-weighted configuration, the vertical pretension decreases as the buoyancy increases. CB1, CB2, CB3, and CB4 in Table 9 represent the lengths of the four chains used in this configuration, along with their corresponding buoy parameters.
Figure 8
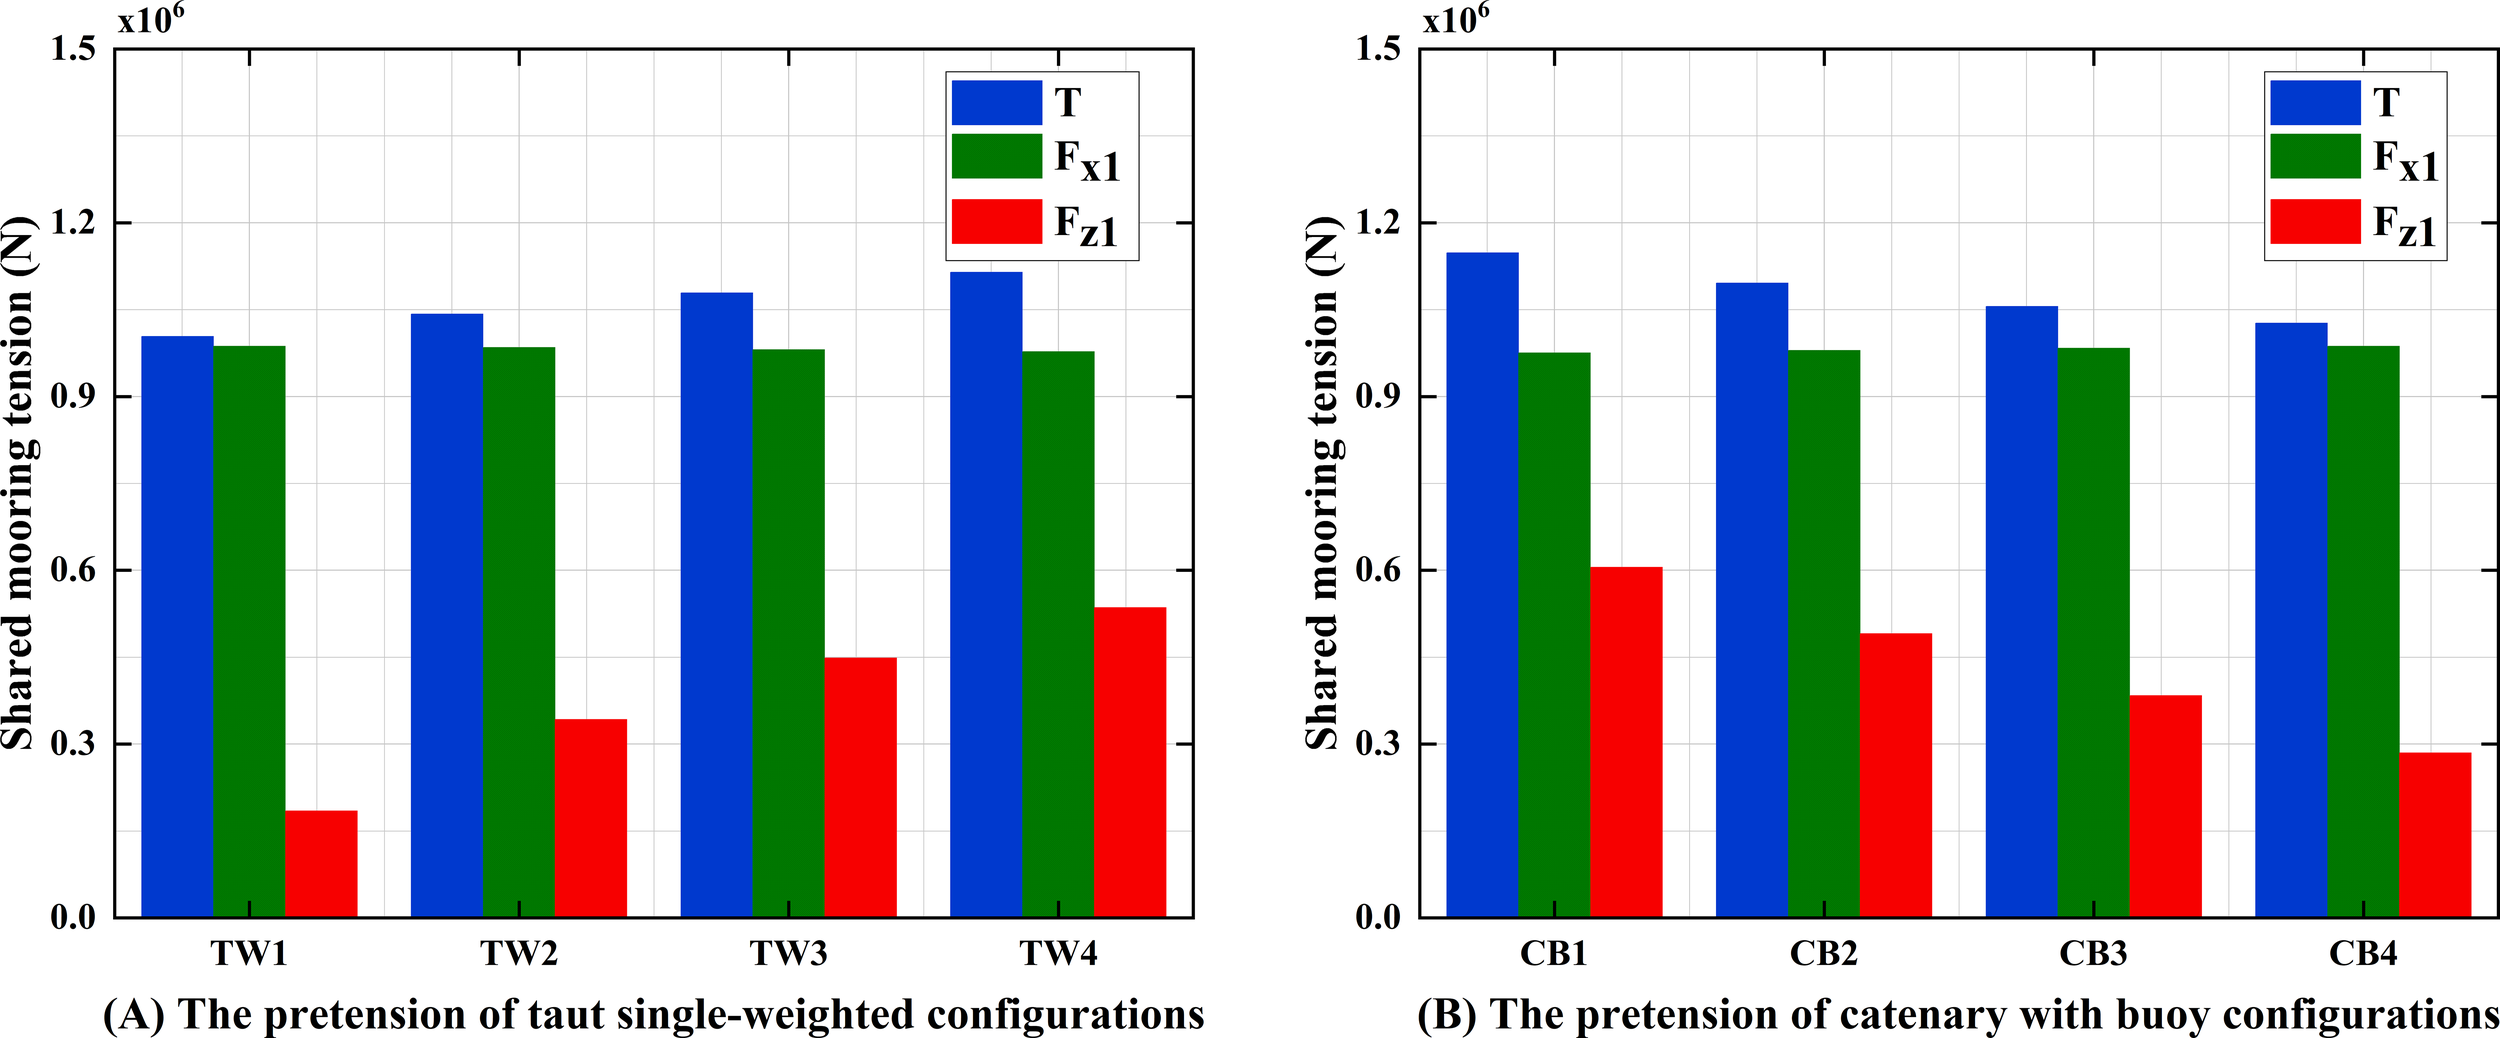
Comparison of pretension in shared mooring lines (the abbreviations in the legend are marked in Figure 4): (A) the taut single-weighted configuration; (B) the catenary with buoy configuration.
Table 8
| Taut single-weighted configuration | Length of the polyester rope (m) | Submerged weight of the clump weight (kg) | Mass of the clump weight (kg) |
|---|---|---|---|
| TW1 | 750 | 3.78E+04 | 4.34E+04 |
| TW2 | 780 | 7.01E+04 | 8.07E+04 |
| TW3 | 810 | 9.17E+04 | 10.55E+04 |
| TW4 | 840 | 10.95E+04 | 12.59E+04 |
Properties of the selected polyester rope length and corresponding clump weight in the sensitivity study.
Table 9
| Catenary with buoy configuration | Length of the chain (m) | Net buoyancy of the buoy (N) | Mass of the buoy (kg) |
|---|---|---|---|
| CB1 | 770.5 | 5.66E+05 | 2.43E+04 |
| CB2 | 762.5 | 7.78E+05 | 3.34E+04 |
| CB3 | 762.5 | 9.91E+05 | 4.25E+04 |
| CB4 | 769.4 | 12.03E+05 | 5.16E+04 |
Properties of the selected chain length and corresponding buoy in the sensitivity study.
As shown in Table 7, Cases 1–8 were analyzed to evaluate shared mooring configurations under different submerged masses and net buoyancy. For each load case, numerical simulations were conducted using 15 different random wind and wave seeds. Furthermore, the extreme scenario was employed to assess the system’s performance, ensuring that the design is robust enough to handle extreme load conditions. Section 5.2 concludes that under the 0° environmental load direction, the dynamic response of Spar1 and its fairlead tensions are greater than those of Spar2. Therefore, this section focuses on analyzing the motion response of Spar1 and the tension characteristics of and .
4.2 Sensitivity study in the taut single-weighted configuration
For the taut single-weighted configuration, the polyester rope length and corresponding clump weight parameters were selected according to Table 8, and time-domain simulations were conducted under the extreme scenario. The results will be discussed in the following sections.
4.2.1 Impact of submerged mass on platform dynamics
As shown in Table 8, with the increase of polyester rope length, the mass of the clump weight needs to be correspondingly increased to maintain the same horizontal pretension of the mooring system. The time series of the surge, heave, and pitch motions for Spar1 are plotted in Figure 9, which includes insets focusing on the region of maximums. It should be noted that the selected simulation result was calculated based on a specific random seed whose statistical characteristics (mean and standard deviation) are closest to the mean value of all seeds. In addition, the motion statistics for TW1 to TW4 are summarized in Table 10.
Figure 9
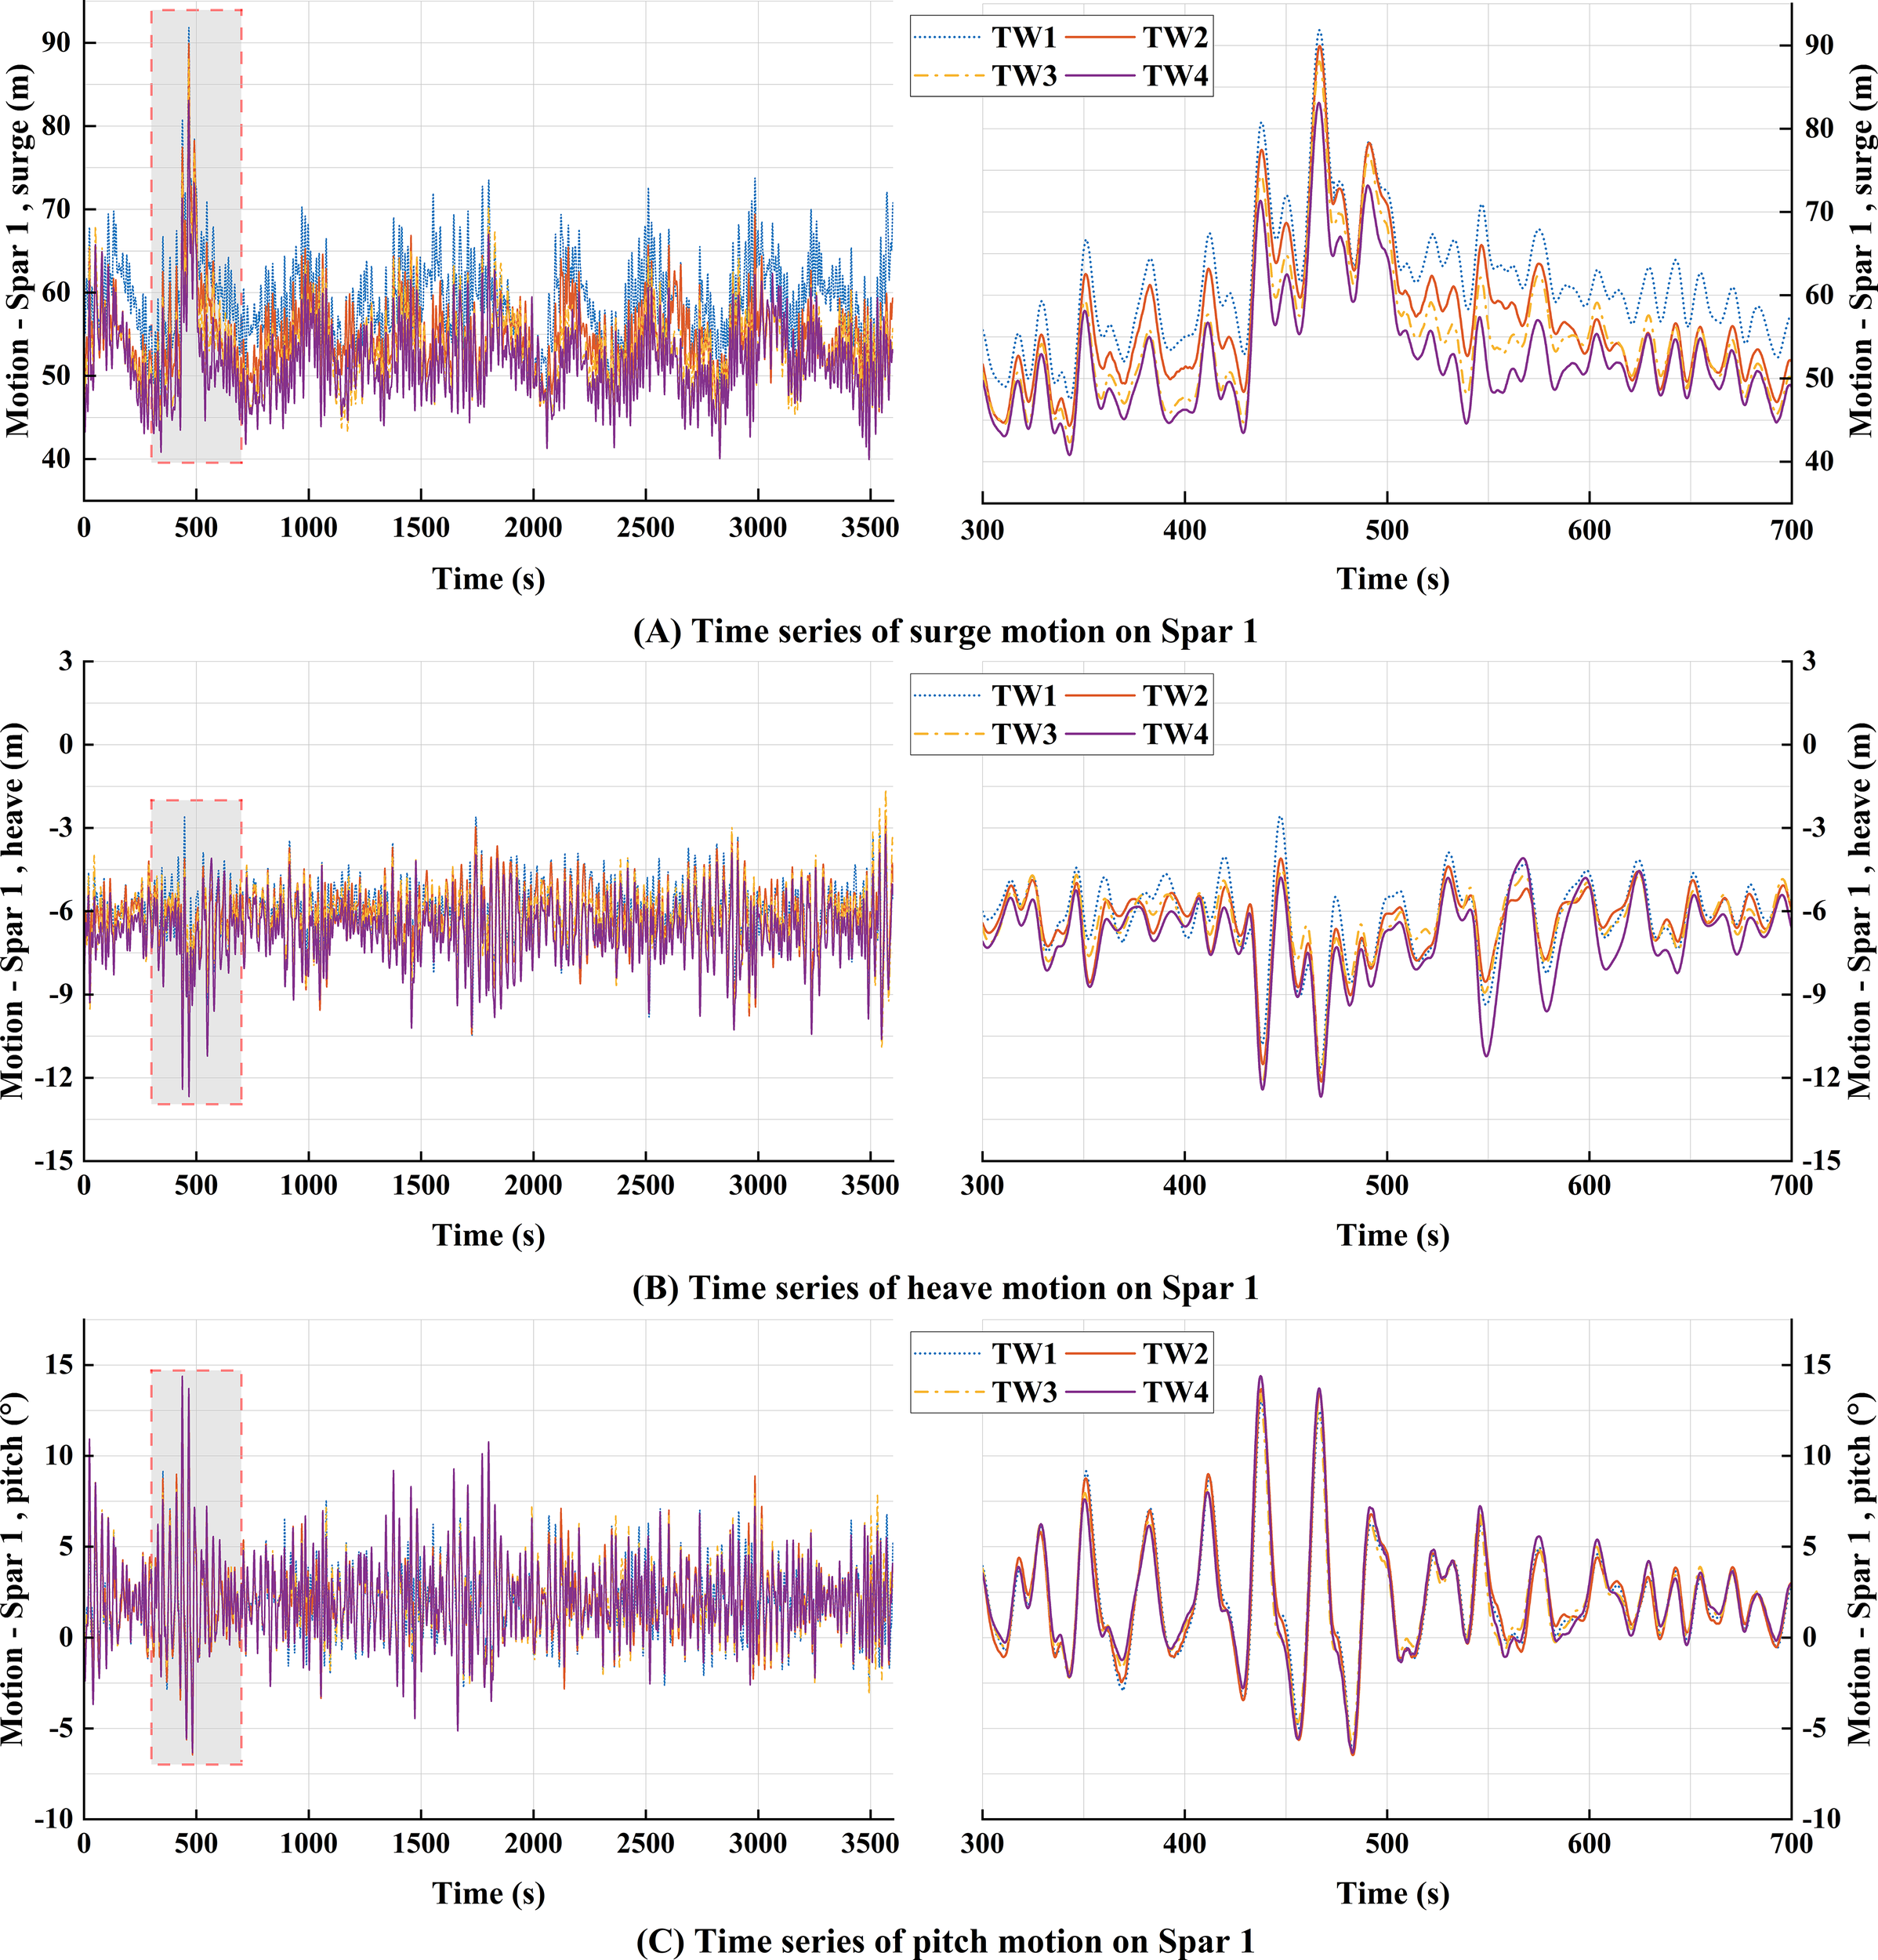
Motion response of Spar 1 for TW1 to TW4 under the extreme scenario (random wave seed = 3): (A) surge motion; (B) heave motion; (C) pitch motion.
Table 10
| Platform motion | Item | TW1 | TW2 | TW3 | TW4 |
|---|---|---|---|---|---|
| Surge (m) | Mean value | 59.421 | 55.011 | 53.127 | 51.564 |
| STD | 5.105 | 4.756 | 4.720 | 4.613 | |
| Minimum | 46.279 | 42.893 | 41.496 | 39.955 | |
| Maximum | 87.263 | 86.332 | 85.824 | 82.195 | |
| Heave (m) | Mean value | -6.004 | -6.206 | -6.404 | -6.674 |
| STD | 1.060 | 1.071 | 1.074 | 1.087 | |
| Minimum | -11.633 | -12.062 | -12.277 | -12.630 | |
| Maximum | -2.560 | -2.902 | -3.278 | -3.890 | |
| Pitch (deg) | Mean value | 2.008 | 2.030 | 2.059 | 2.065 |
| STD | 2.055 | 2.072 | 2.163 | 2.296 | |
| Minimum | -6.224 | -6.465 | -6.237 | -5.871 | |
| Maximum | 13.154 | 13.688 | 14.156 | 14.572 |
The motion statistics of the Spar1 for TW1 to TW4 under the extreme scenario.
As shown in Figure 9, the maximum surge motion (89.929m) was observed in the TW1 under the extreme scenario. The results of Table 10 show that the mean motion and oscillation amplitude of the platform in the surge direction decrease significantly with the increase of the submerged weight. This is mainly due to the increased submerged mass enhancing stiffness of the mooring system, which effectively improves its ability to restrain the horizontal motion of the platform. In addition, the TW4 exhibited the largest heave motion (12.752 m) and pitch motion (14.388°). And as the submerged mass increased from TW1 to TW4 , the mean motions and oscillation amplitudes of the platform in both heave and pitch directions also increased. The cause of this phenomenon is that the increase of submerged mass leads to a significant increase in the vertical tension of the shared mooring, which produces a greater torque in the pitch direction at the center of gravity of the platform. This enhanced torque intensifies the rotation of the platform around the horizontal axis. At the same time, the increase of pitch motion further induces additional motion in the heave direction.
To sum up, the refined design of polyester rope length and clump weight mass has an important impact on the overall motion performance of the floating platform in extreme conditions. The design of the taut single-weighted mooring configuration must balance its impact on surge, heave, and pitch motions, in order to achieve optimal motion control performance.
4.2.2 Impact of submerged mass effects on mooring dynamics
Figure 10 presents the time series curves of the fairlead tension in and . It should be noted that Figure 10 uses the same wind and wave seeds as the Section 4.2.1. The average statistical properties of the tensions for and are summarized in Table 11. The numerical results indicate that the maximum tension shown in the TW1 is 3000.48 kN at and 2720.95 kN at , respectively. With the increase in the clump weight mass, both the mean tension and dynamic tension at and exhibit a decreasing trend. This is because the tension characteristics at are primarily influenced by the motion of Spar 1, while those at are determined by the relative motion between Spar 1 and Spar 2. From Section 4.2.1, as the submerged weight increases, both the mean displacement and the motion range of the platform in the surge direction decrease, which indicates that the tension characteristics of the mooring system are significantly affected by the surge motion. Additionally, it is particularly noteworthy that TW1 exhibits a significant dynamic tension amplitude at , with its standard deviation reaching 2.91 times that of TW2.
Figure 10
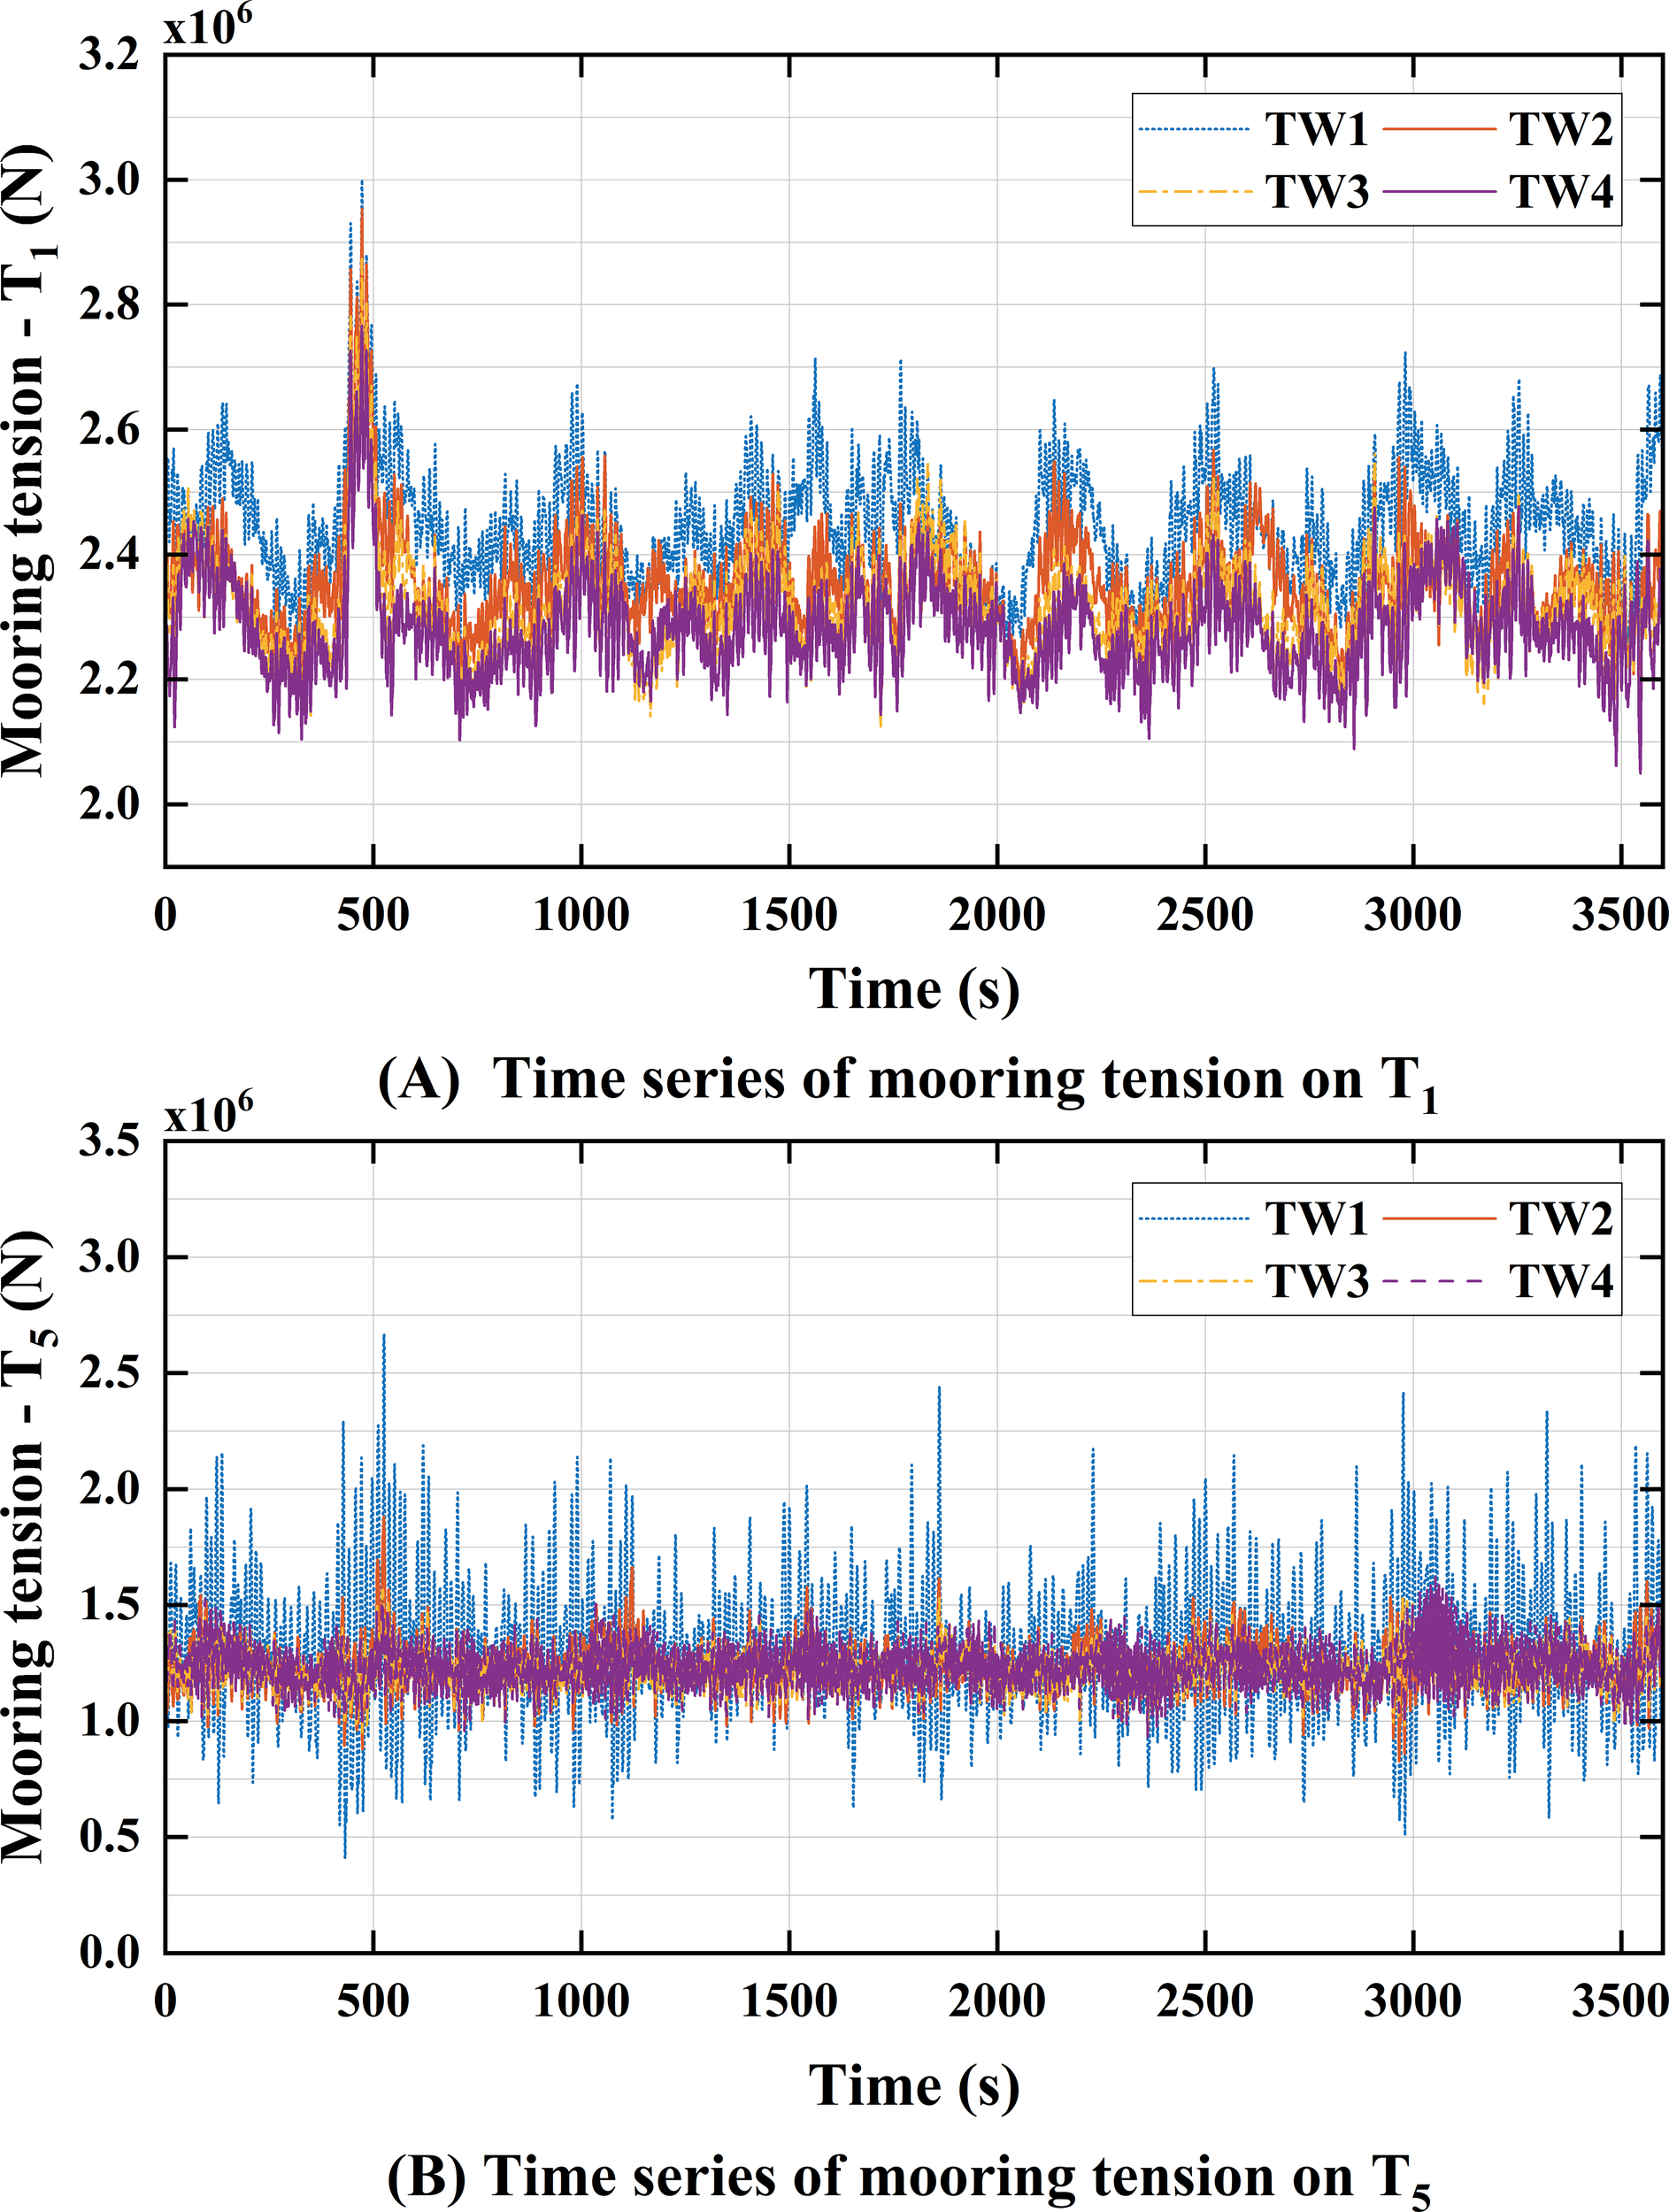
Time series of fairlead tension for TW1 to TW4 under the extreme scenario (random wave seed = 3): (A) tension of T1; (B) tension of T5.
Table 11
| Fairlead tension | Item | TW1 | TW2 | TW3 | TW4 |
|---|---|---|---|---|---|
| T1 (KN) | Mean value | 2452.35 | 2356.21 | 2313.94 | 2280.47 |
| STD | 96.12 | 83.99 | 81.93 | 77.52 | |
| Minimum | 2212.81 | 2111.81 | 2108.01 | 2069.65 | |
| Maximum | 3052.48 | 2973.56 | 2885.62 | 2766.34 | |
| T5 (KN) | Mean value | 1312.59 | 1236.13 | 1233.70 | 1222.98 |
| STD | 314.47 | 107.95 | 84.49 | 79.29 | |
| Minimum | 409.99 | 827.42 | 930.30 | 945.23 | |
| Maximum | 2737.46 | 1874.81 | 1659.68 | 1610.28 |
Statistics of fairlead tension for TW1 to TW4 under the extreme scenario.
In summary, for the taut single-weighted configuration, insufficient submerged weight can cause significant tension fluctuations in the critical fairleads. However, excessive mass will exacerbate the heave and pitch motion responses of the platform, and increase the material cost of the mooring system. Compared to TW1, the tension standard deviation at for TW2 is reduced by 65.67%. Relative to TW4, the maximum heave displacement and pitch angle for TW2 are reduced by 4.50% and 6.07%, while the material cost decreases by 21.58% (as detailed in Section 6.3). Among the four configurations, TW2 is the preferred configuration based on trade-off analysis.
4.3 Sensitivity study in the catenary with buoy configuration
For the catenary with buoy configuration, the chain length and corresponding buoy parameters were selected according to Table 9, and time-domain simulations were conducted under the extreme scenario. The results will be discussed in the following sections.
4.3.1 Impact of net buoyancy on platform dynamics
Figure 11 presents the time series of surge, heave, and pitch motions for Spar1 under catenary with buoy configurations with different net buoyancy. The corresponding mean statistics are summarized in Table 12. Under the extreme scenario, CB4 exhibited the largest surge motion (90.906m). As shown in Table 12, as net buoyancy increases from CB1 to CB4, the mean motion and oscillation amplitude of the platform in the surge direction continues to increase. This is mainly because the stiffness of the mooring system decreases with the increase in net buoyancy. In addition, CB1 shows the maximum heave motion (13.09m) and pitch motion (14.749°). The results show that with the increase of net buoyancy, the mean motion and oscillation amplitude of the platform in the heave and pitch directions show a decreasing trend. This is because the increase of net buoyancy significantly reduces the vertical tension of the shared mooring, which reduces the force in the heave direction and the torque in the pitch direction.
Figure 11
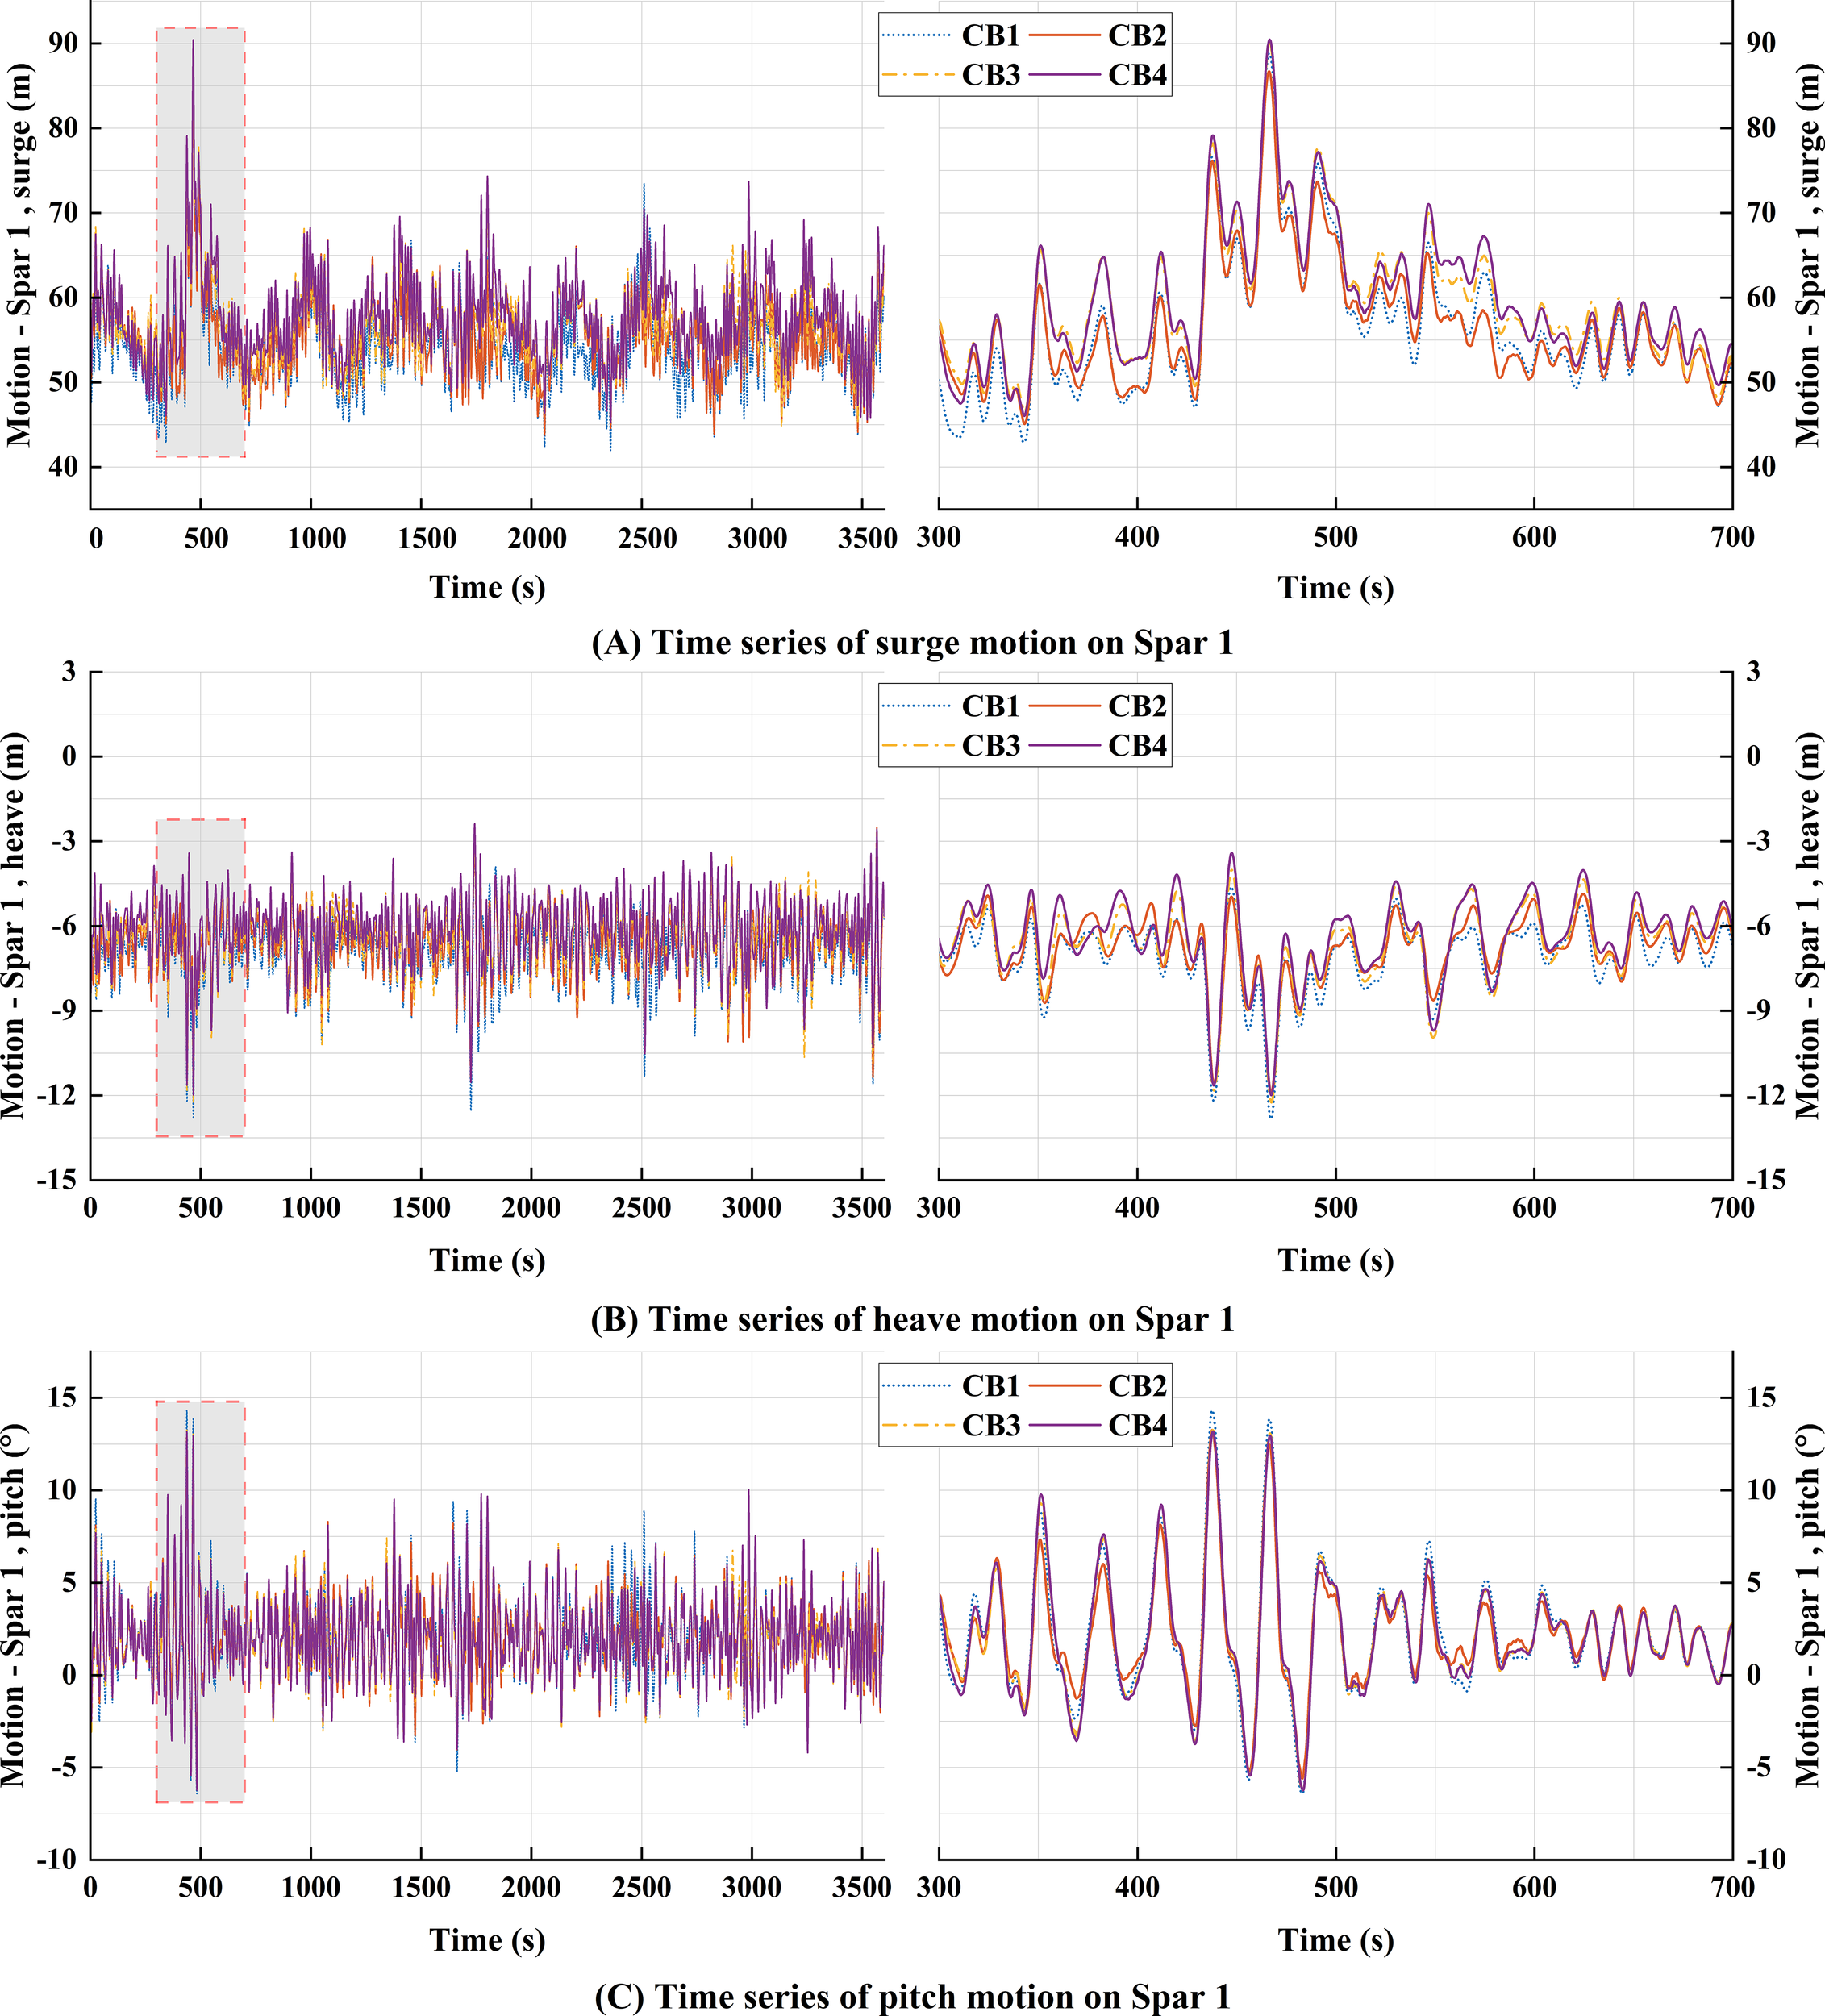
Motion response of Spar 1 for CB1 to CB4 under the extreme scenario (random wave seed = 3): (A) surge motion; (B) heave motion; (C) pitch motion.
Table 12
| Platform motion | Item | CB1 | CB2 | CB3 | CB4 |
|---|---|---|---|---|---|
| Surge (m) | Mean value | 54.138 | 55.393 | 56.635 | 57.672 |
| STD | 4.618 | 4.635 | 4.740 | 4.956 | |
| Minimum | 42.966 | 43.748 | 44.807 | 45.251 | |
| Maximum | 85.888 | 86.714 | 90.065 | 90.449 | |
| Heave (m) | Mean value | -6.867 | -6.593 | -6.388 | -6.132 |
| STD | 1.098 | 1.095 | 1.096 | 1.093 | |
| Minimum | -13.114 | -12.576 | -12.048 | -11.897 | |
| Maximum | -2.684 | -2.531 | -2.390 | -2.196 | |
| Pitch (deg) | Mean value | 2.069 | 2.060 | 2.041 | 2.022 |
| STD | 2.163 | 2.096 | 2.091 | 2.085 | |
| Minimum | -6.756 | -6.443 | -6.106 | -5.846 | |
| Maximum | 14.788 | 13.710 | 13.594 | 13.457 |
The motion statistics of spar 1 for CB1 to CB4 under the extreme scenario.
In summary, net buoyancy significantly influences the overall motion performance of the floating wind turbine platform under extreme conditions. The design of the catenary with buoy configuration must comprehensively consider its effects on the surge, heave, and pitch motions.
4.3.2 Impact of net buoyancy effects on mooring dynamics
Figure 12 presents the time histories of tensions in lines , and , and the average statistical properties are summarized in Table 13. In CB4, maximum tensions of 2970.78kN, 2003.67kN, and 2059.15 kN were measured at , and , respectively, and all maximum tensions are far below the minimum breaking strength listed in Table 4. For , and , the dynamic tension amplitudes increase with the increase of net buoyancy, as the overall stiffness of the floating system decreases.
Figure 12
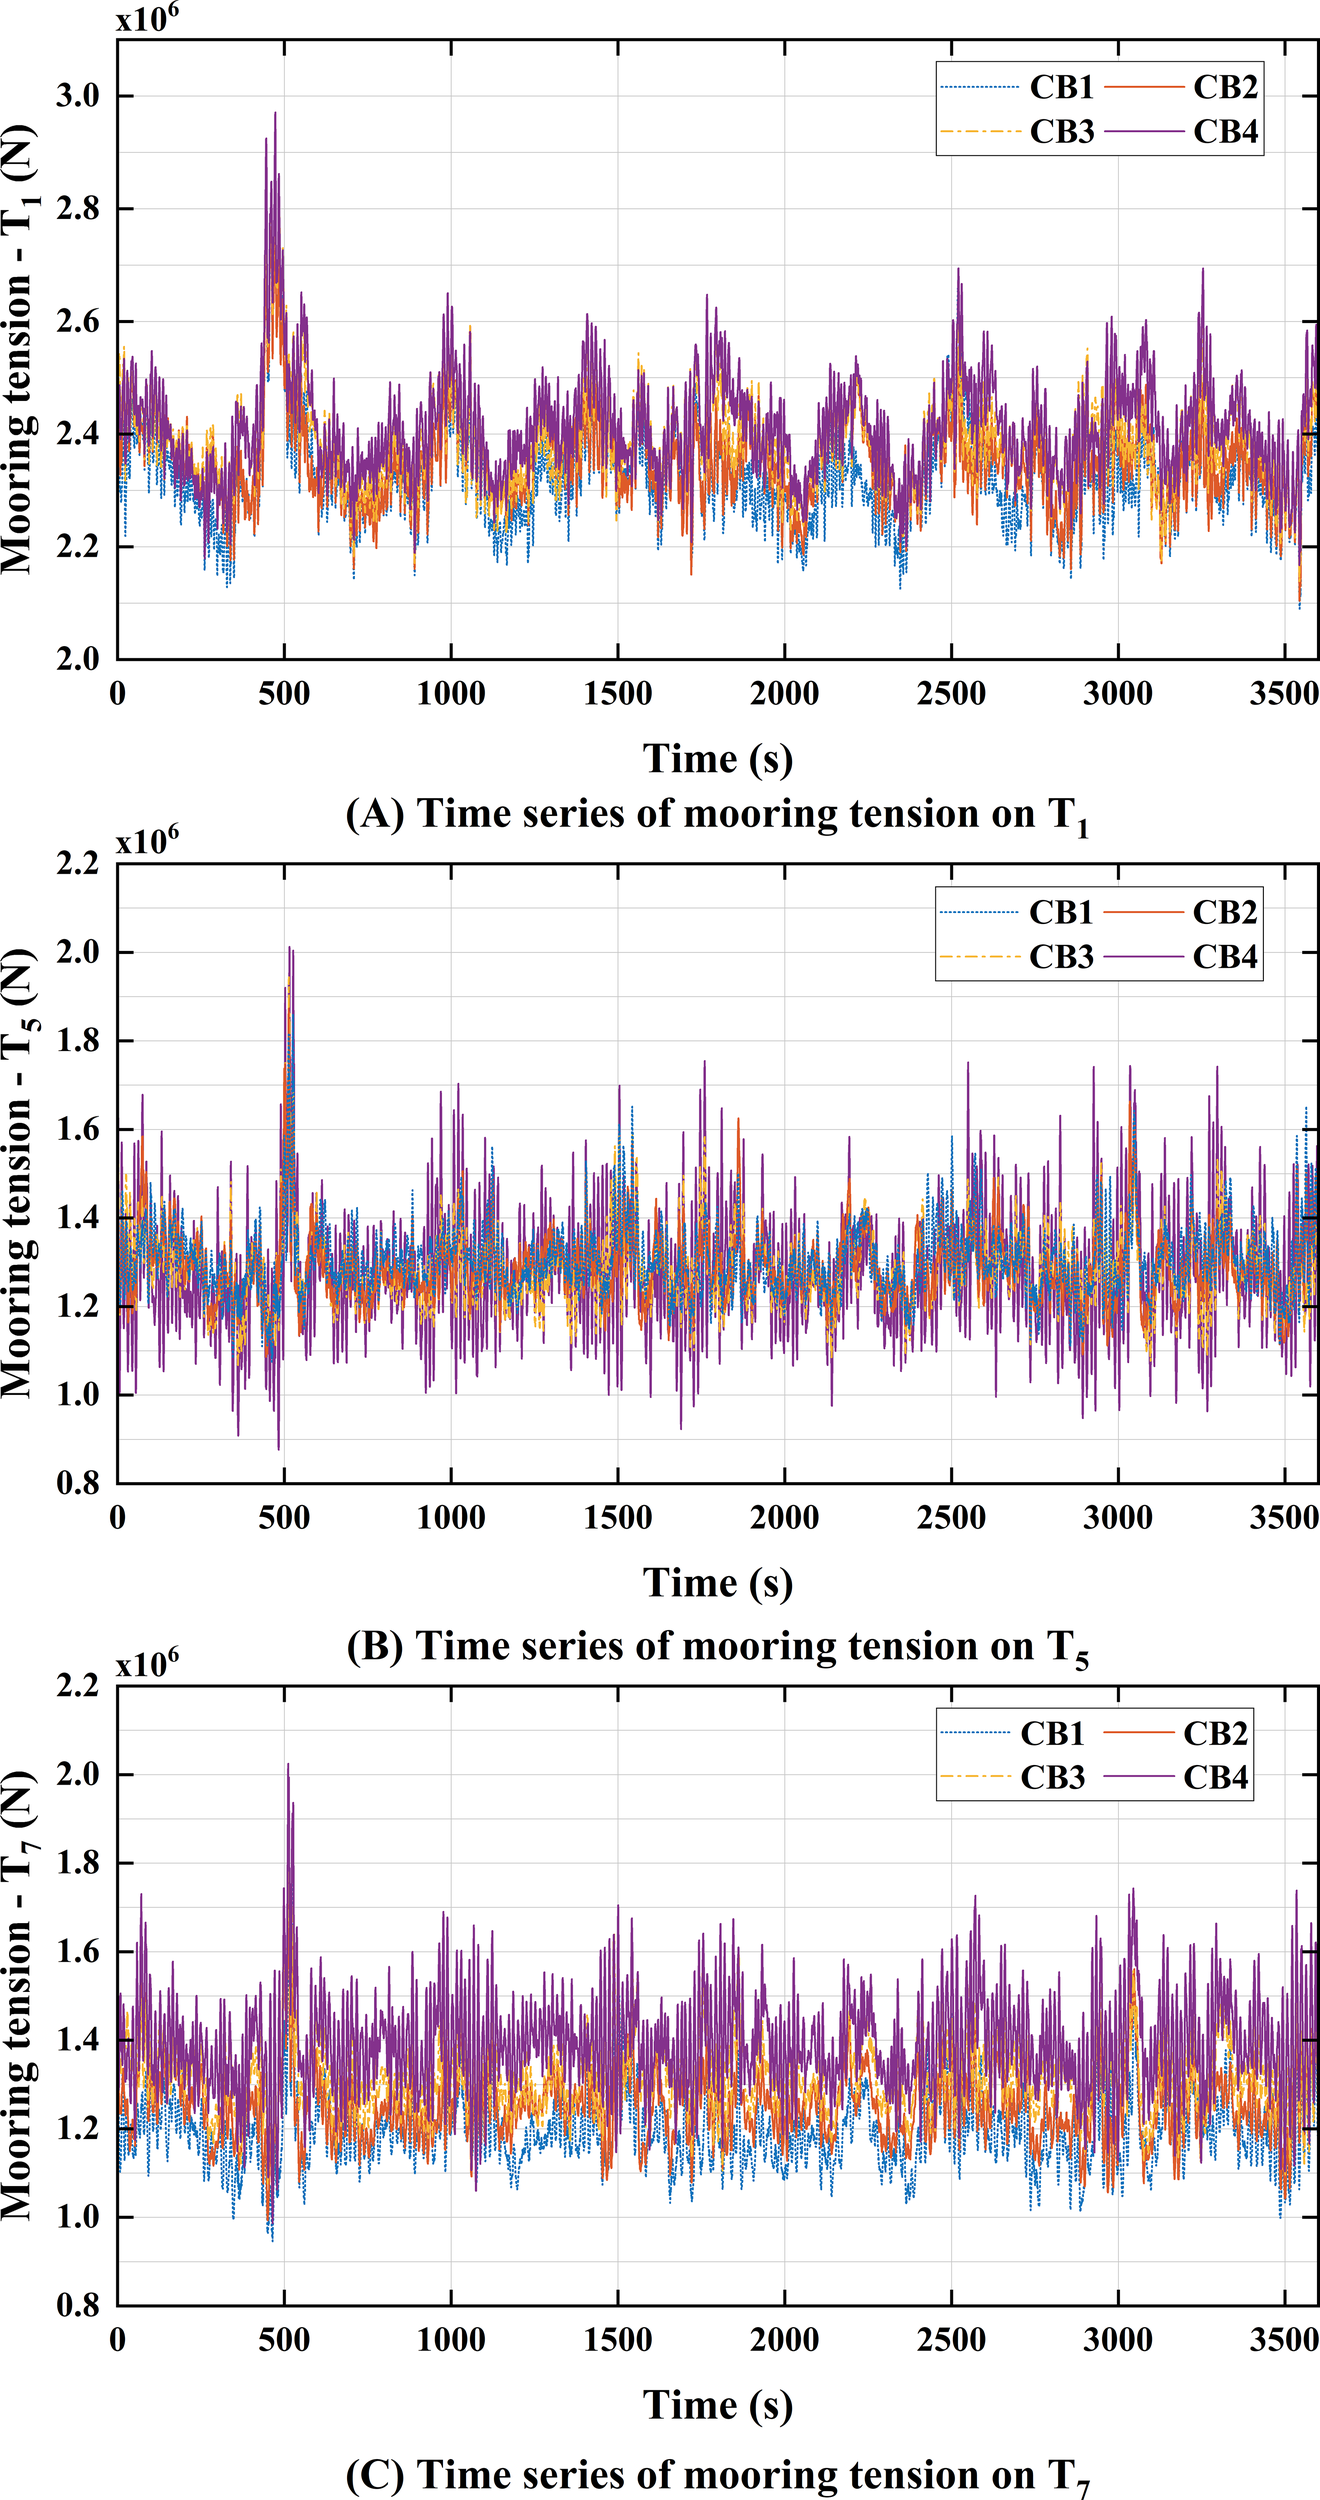
Time series of fairlead tension for CB1 to CB4 under the extreme scenario (random wave seed = 3): (A) tension of T1; (B) tension of T5; (C) tension of T7.
Table 13
| Fairlead tension | Item | CB1 | CB2 | CB3 | CB4 |
|---|---|---|---|---|---|
| T1 (KN) | Mean value | 2322.83 | 2355.76 | 2385.67 | 2412.47 |
| STD | 82.09 | 82.56 | 84.95 | 90.10 | |
| Minimum | 2089.93 | 2104.01 | 2137.89 | 2167.39 | |
| Maximum | 2859.38 | 2855.35 | 2953.35 | 2973.55 | |
| T5 (KN) | Mean value | 1302.29 | 1292.99 | 1282.81 | 1281.33 |
| STD | 78.52 | 80.56 | 83.35 | 127.87 | |
| Minimum | 1092.94 | 1085.16 | 1068.04 | 902.11 | |
| Maximum | 1825.33 | 1873.16 | 1926.86 | 1982.92 | |
| Mean value | 1189.18 | 1253.23 | 1309.21 | 1367.62 | |
| T7 (KN) | STD | 80.56 | 83.38 | 87.60 | 108.72 |
| Minimum | 959.80 | 953.45 | 1049.80 | 974.14 | |
| Maximum | 1736.47 | 1816.83 | 1942.73 | 2045.21 |
Statistics of fairlead tension for CB1 to CB4 under the extreme scenario.
The mean tension of shows an upward trend with the rise of net buoyancy, since its tension characteristics are predominantly determined by the surge motion of Spar 1. As indicated in Section 4.3.1, when the net buoyancy increases, both the average motion and motion amplitude of Spar 1 in the surge direction will increase. In addition, the average tensions of and on the shared mooring line exhibit opposite trends. The mean tension of decreases as the net buoyancy increases, as the higher net buoyancy reduces the vertical tension at fairlead . is located at the connection between the shared mooring and the buoy, and its average tension is mainly affected by the net buoyancy of the buoy. Therefore, when the net buoyancy is excessively high, the maximum tension on the shared mooring may occur at . For the catenary with buoy configuration, it is essential to study the tension characteristics at both the fairlead and the connection point to the buoy.
In summary, for the catenary with buoy configuration, an excessive net buoyancy of the buoy will cause significant tension fluctuations in the critical fairleads and increase the material cost of the mooring system. On the other hand, insufficient net buoyancy will exacerbate the heave and pitch motion responses. Compared to CB1, the maximum heave displacement and pitch angle for CB2 are reduced by 4.11% and 7.29%, respectively. Relative to CB4, the tension standard deviation at for CB2 is reduced by 37.01%, and the material cost decreases by 4.20% (as detailed in Section 6.3). Among the four configurations, CB2 is the preferred configuration based on trade-off analysis.
5 Comparison of the dynamic response under the three configurations
As shown in Table 7, Cases 9–14 are presented and discussed in this section. Firstly, Section 5.1 discusses the dynamic response of FOWF under the operating scenario and sets up environmental loads at 0°, 30°, 60°, and 90°for comparative analysis. Then, Section 5.2 focused on the mooring response under the extreme scenario.
5.1 Response analysis under the operational scenario
5.1.1 Analysis of platform motion responses
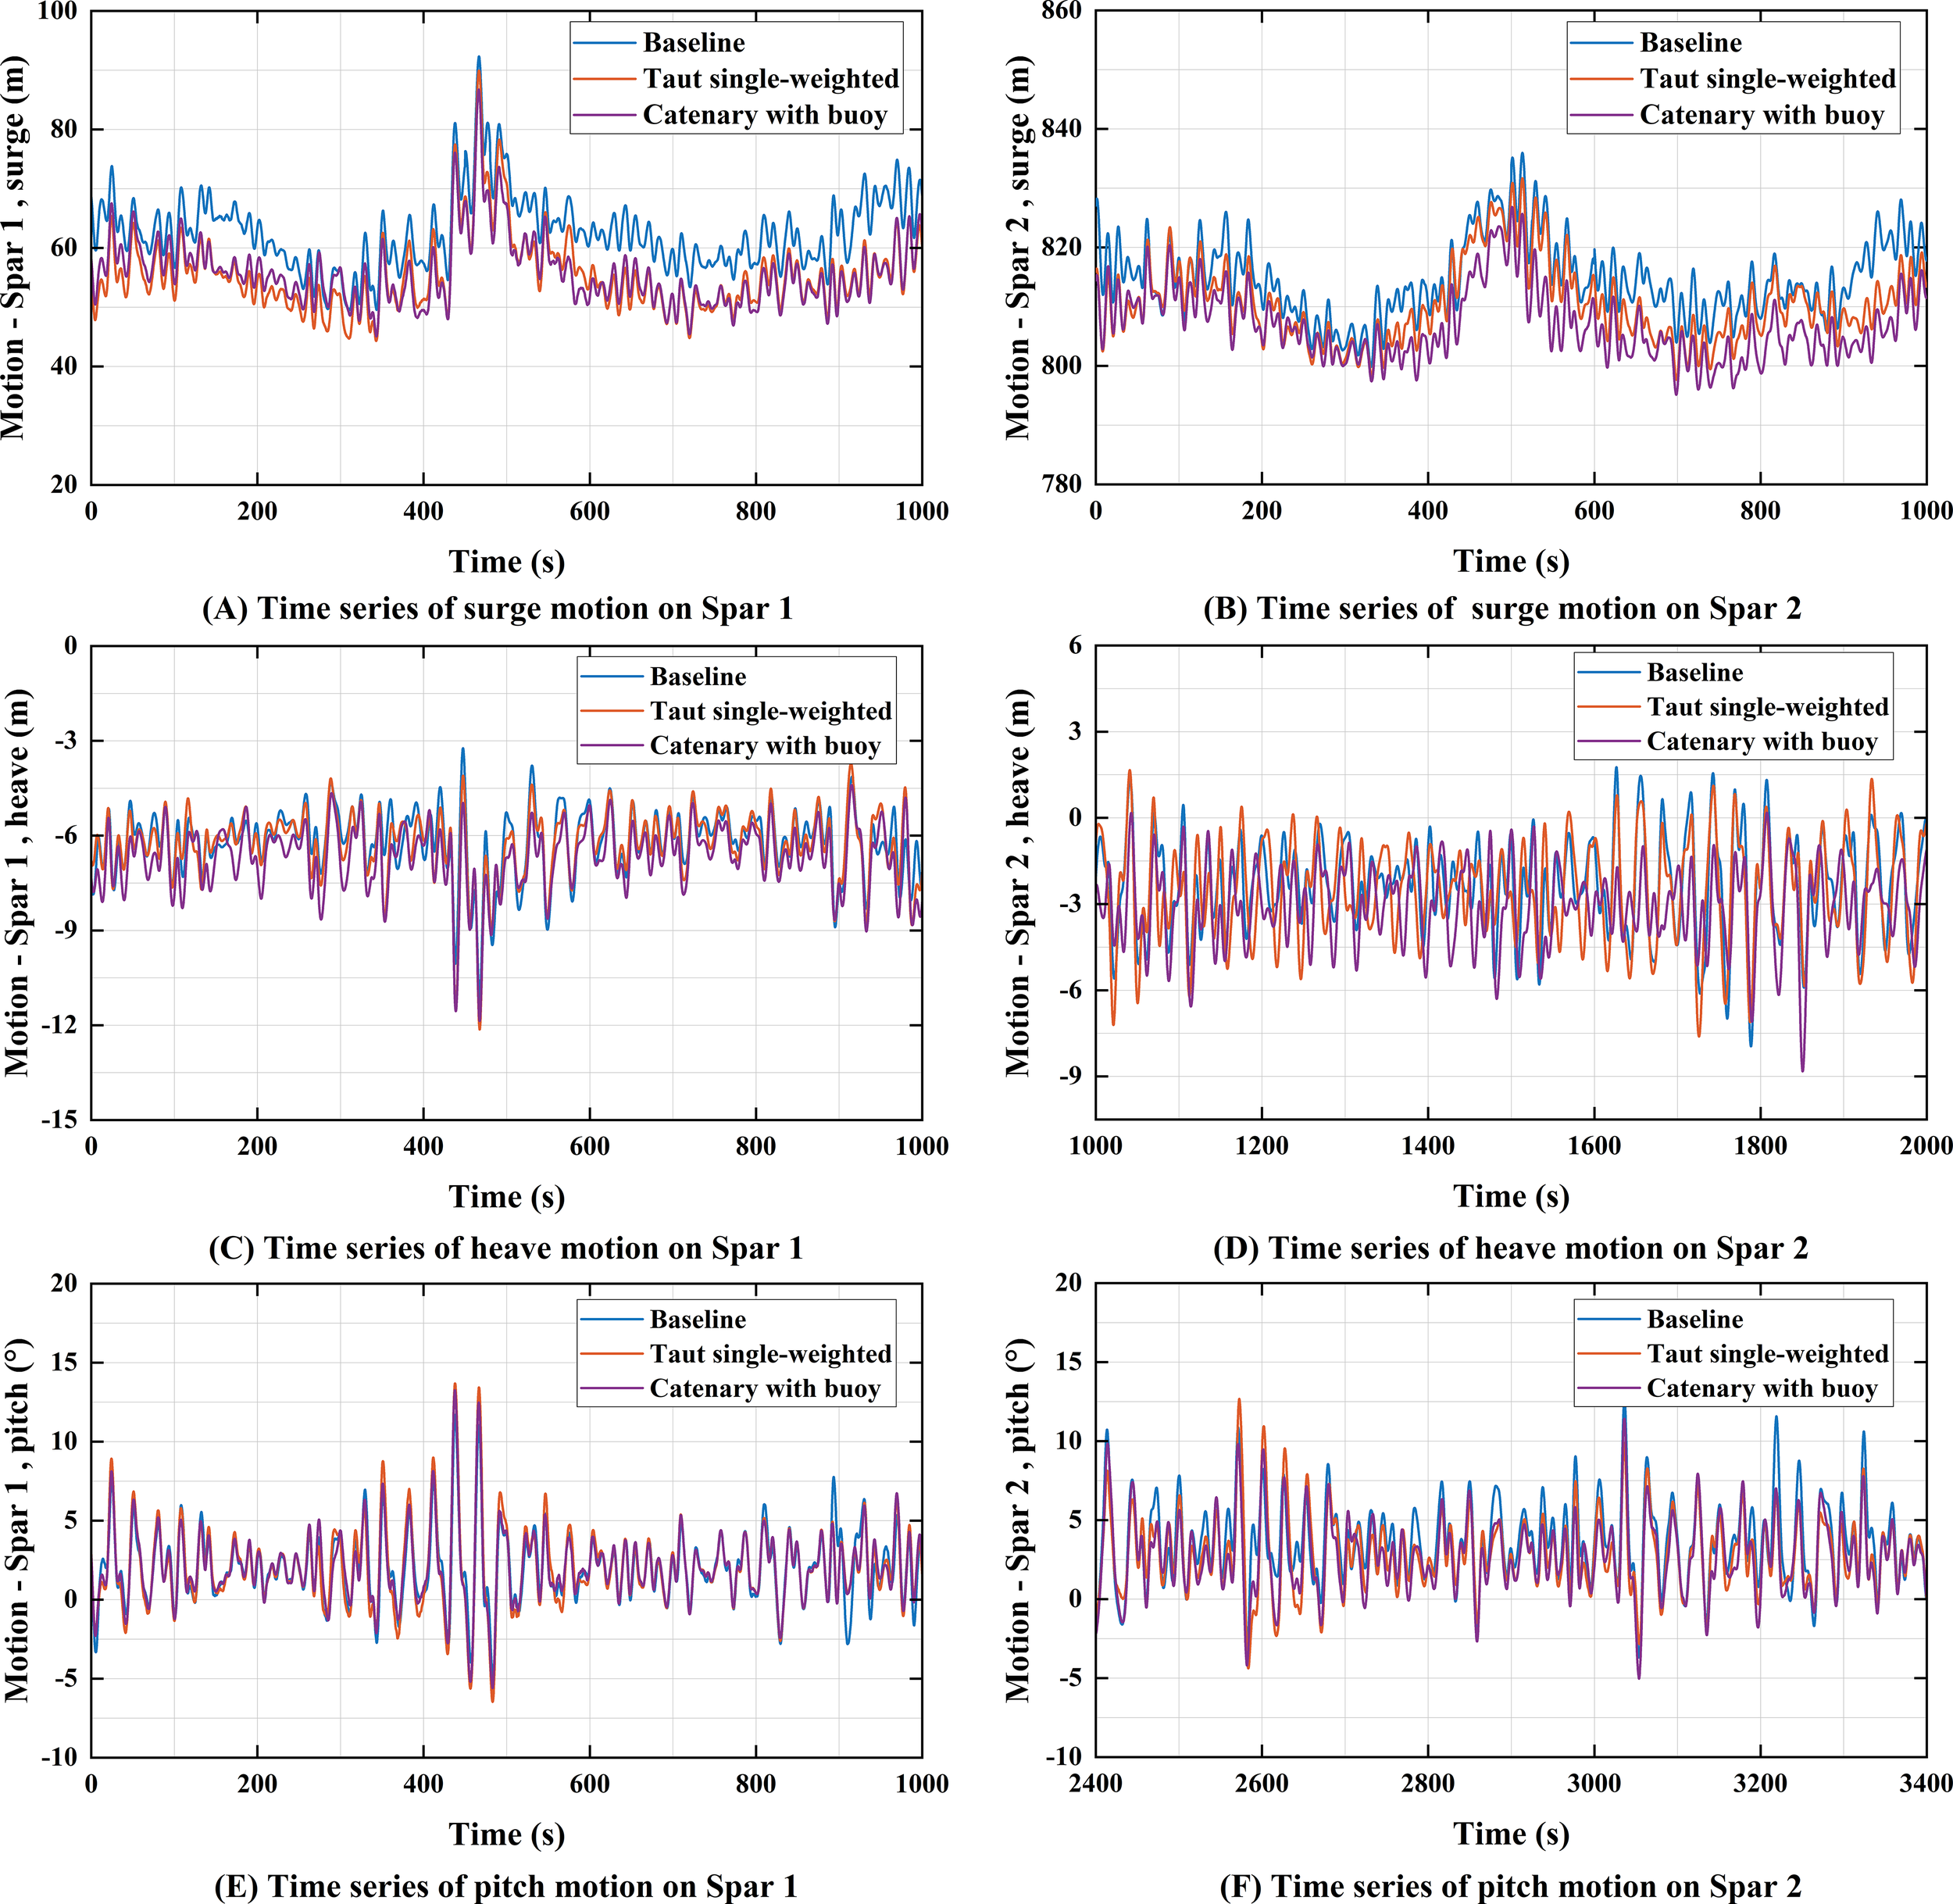
Figure 13 presents the time series of surge, heave, and pitch motions for Spar1 and Spar2 under a 0° environmental load direction. A 1000-second time segment containing the maximum response values was selected for comparative analysis. For Spar1, the baseline configuration exhibits the largest surge displacement (64.02 m), although the motion patterns of the three configurations are generally similar. This is due to surge motion being primarily governed by the horizontal stiffness of the mooring system, with all three configurations having similar horizontal pretension settings, resulting in comparable constraints on platform horizontal motion. In the heave direction, the mean motion of different configurations shows significant differences, with the catenary with buoy configuration exhibiting the largest displacement (8.42 m). This difference mainly arises from variations in the vertical pretension across the configurations. In the pitch direction, there is no significant difference in the motion responses between the different mooring configurations, as they are primarily dominated by the platform’s mass distribution and hydrodynamic stiffness characteristics. For Spar2, the motion response differences in surge, heave, and pitch directions across the three configurations are similar to those observed for Spar1. However, for the baseline configuration, the average surge, heave, and pitch motion responses of Spar2 are 17.9%, 55.4%, and 10.3% lower, respectively, than those of Spar1. The results indicate that, under the 0° environmental load direction, the overall motion response of Spar2 is significantly smaller than that of Spar1.
Figure 13
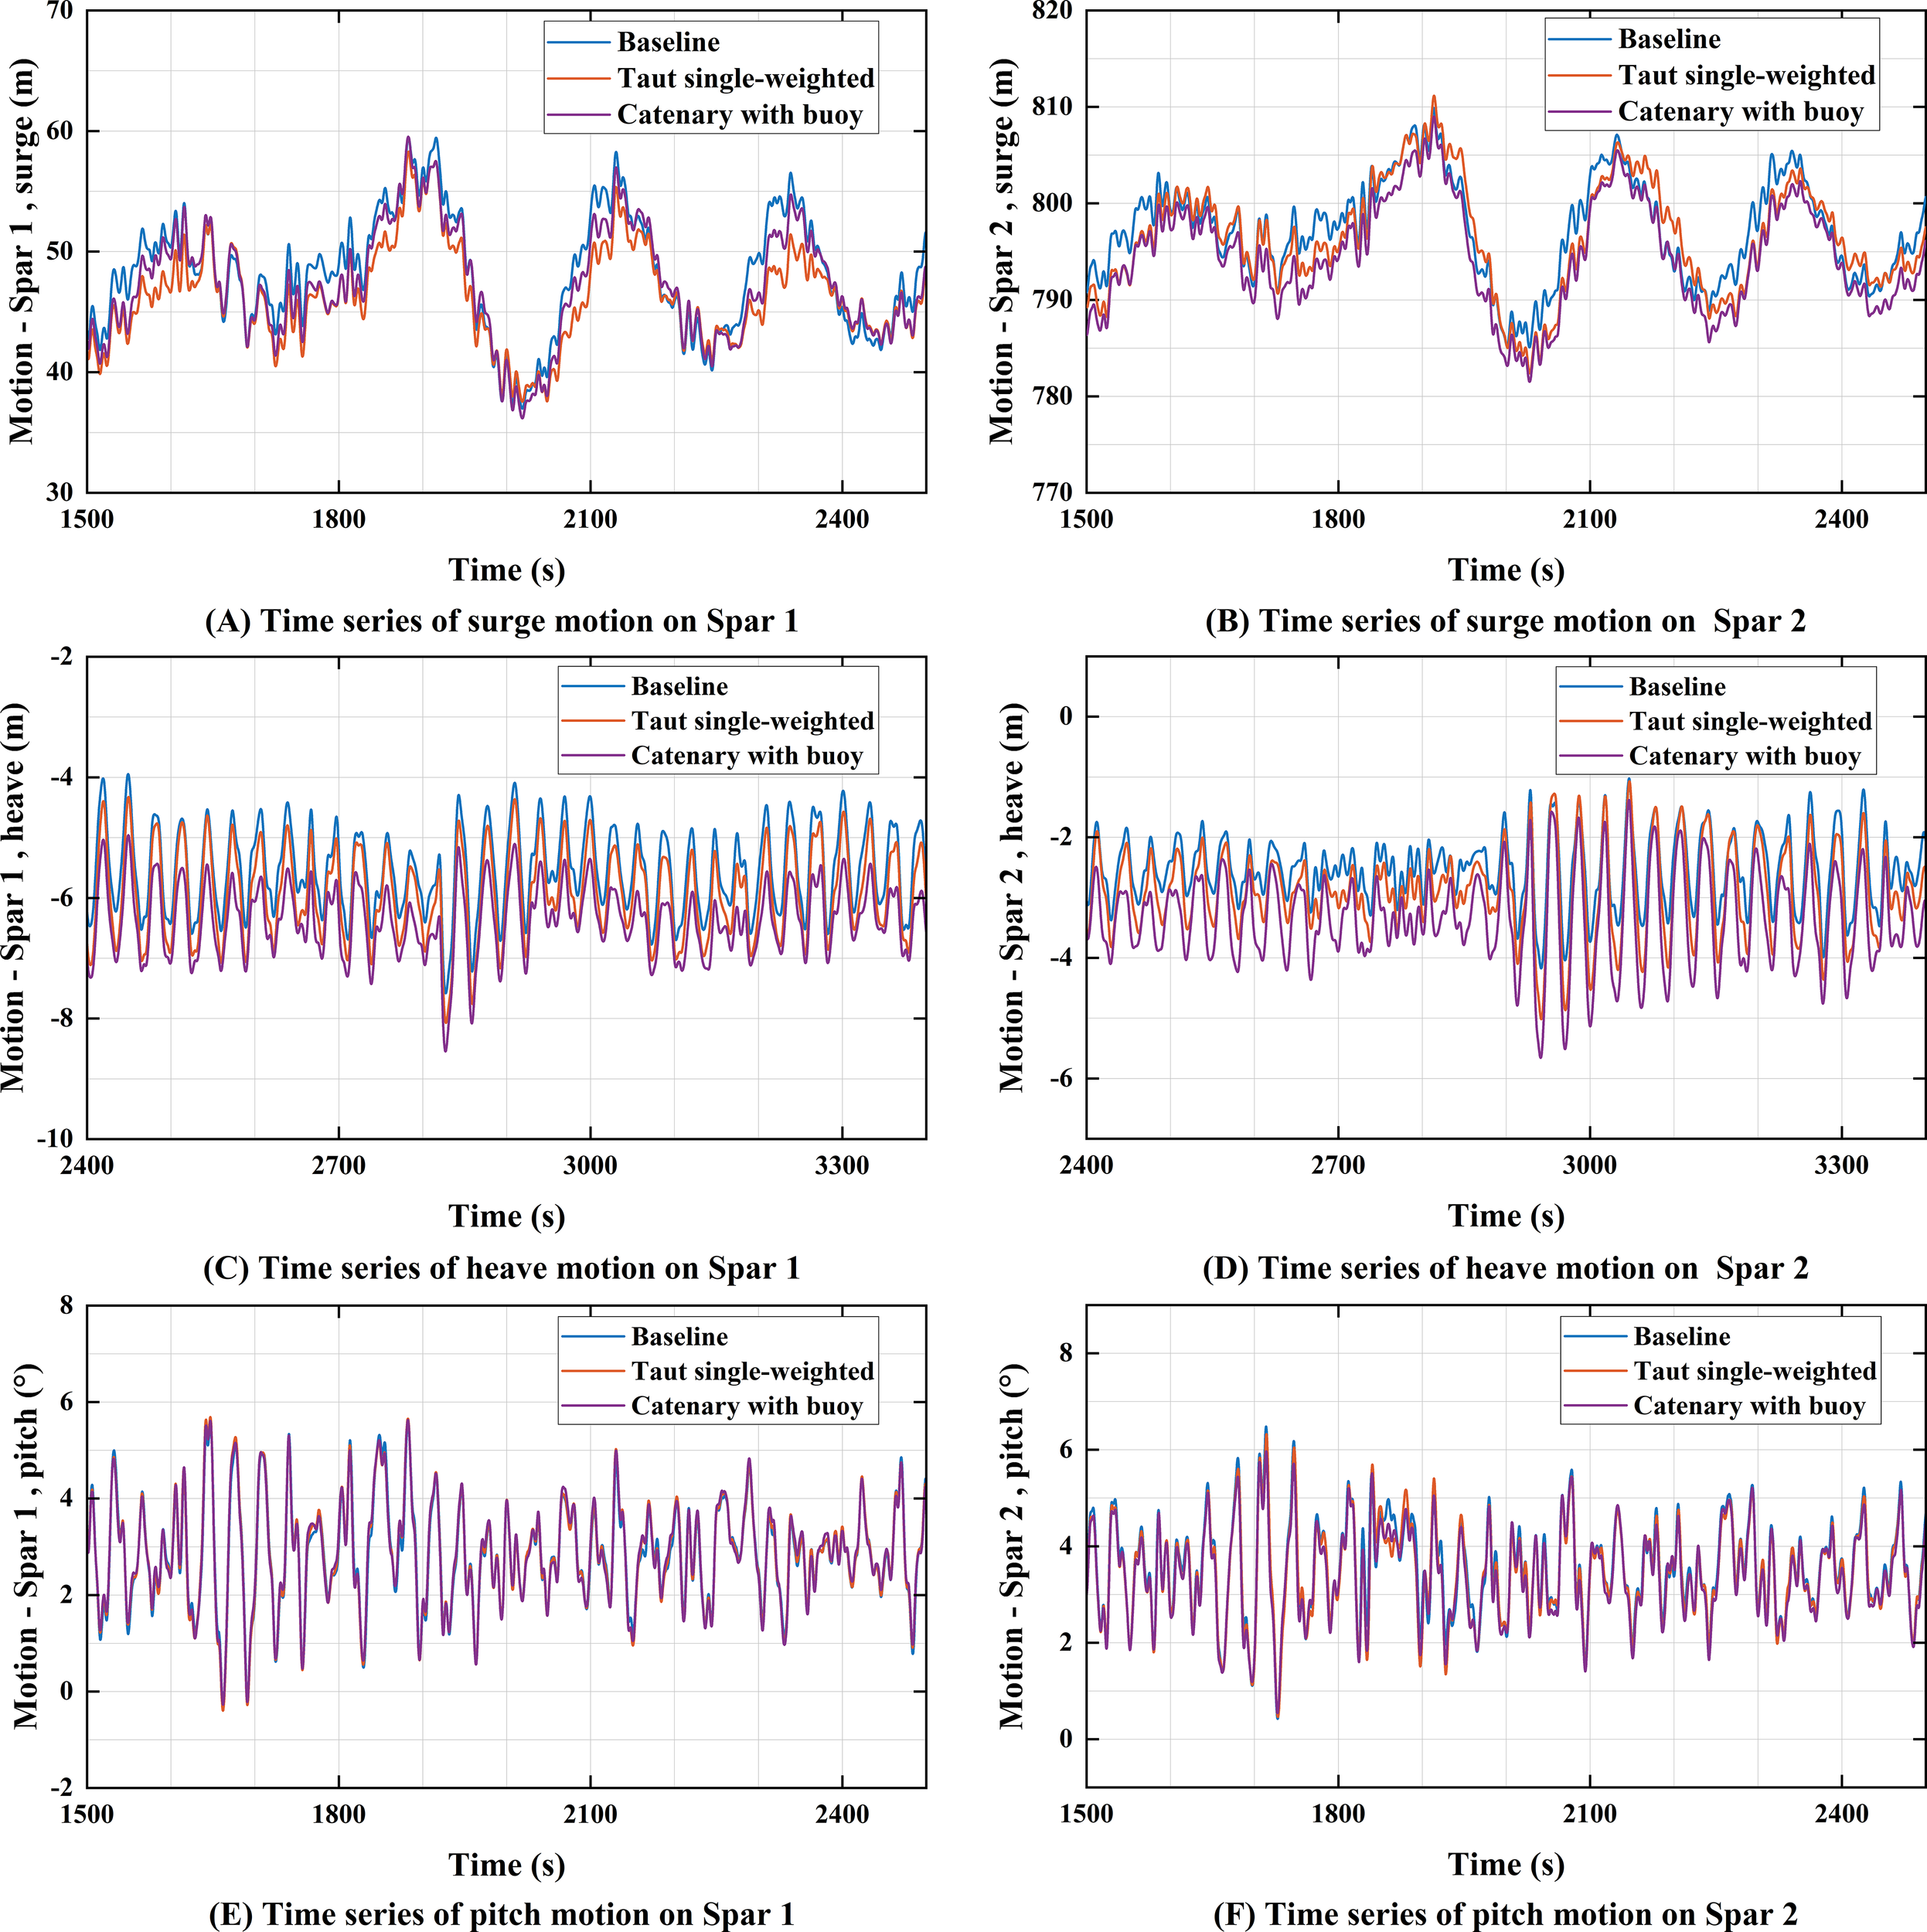
Motion response of Spar 1 and Spar 2 under the operational scenario (random wave seed = 3): (A) surge motion of Spar 1; (B) surge motion of Spar 2; (C) heave motion of Spar 1; (D) heave motion of Spar 2; (E) pitch motion of Spar 1; (F) pitch motion of Spar 2.
Figure 14 presents the statistical results of the platform’s heave, surge, and pitch motion responses under different environmental load directions. Taking the baseline configuration as an example, at a 90° environmental load direction, the average surge motion of Spar1 and Spar2 decreased by 56.4% and 48.7%, compared to the 0° load direction. Meanwhile, the average heave and pitch motions of Spar1 decreased by 28.6% and 8.7%, while those of Spar2 increased by 70.2% and 10.6%. Among the three degrees of freedom, surge motion is found to be most sensitive to changes in environmental load direction. As the environmental load direction increases from 0° to 90°, both the range, mean, and standard deviation of surge displacement for Spar1 and Spar2 decrease significantly. In terms of heave motion, the displacement mean of Spar1 shows a decreasing trend with increasing load direction, while for Spar2, it shows an increasing trend. Additionally, changes in environmental load direction have a relatively minor impact on the pitch motion.
Figure 14
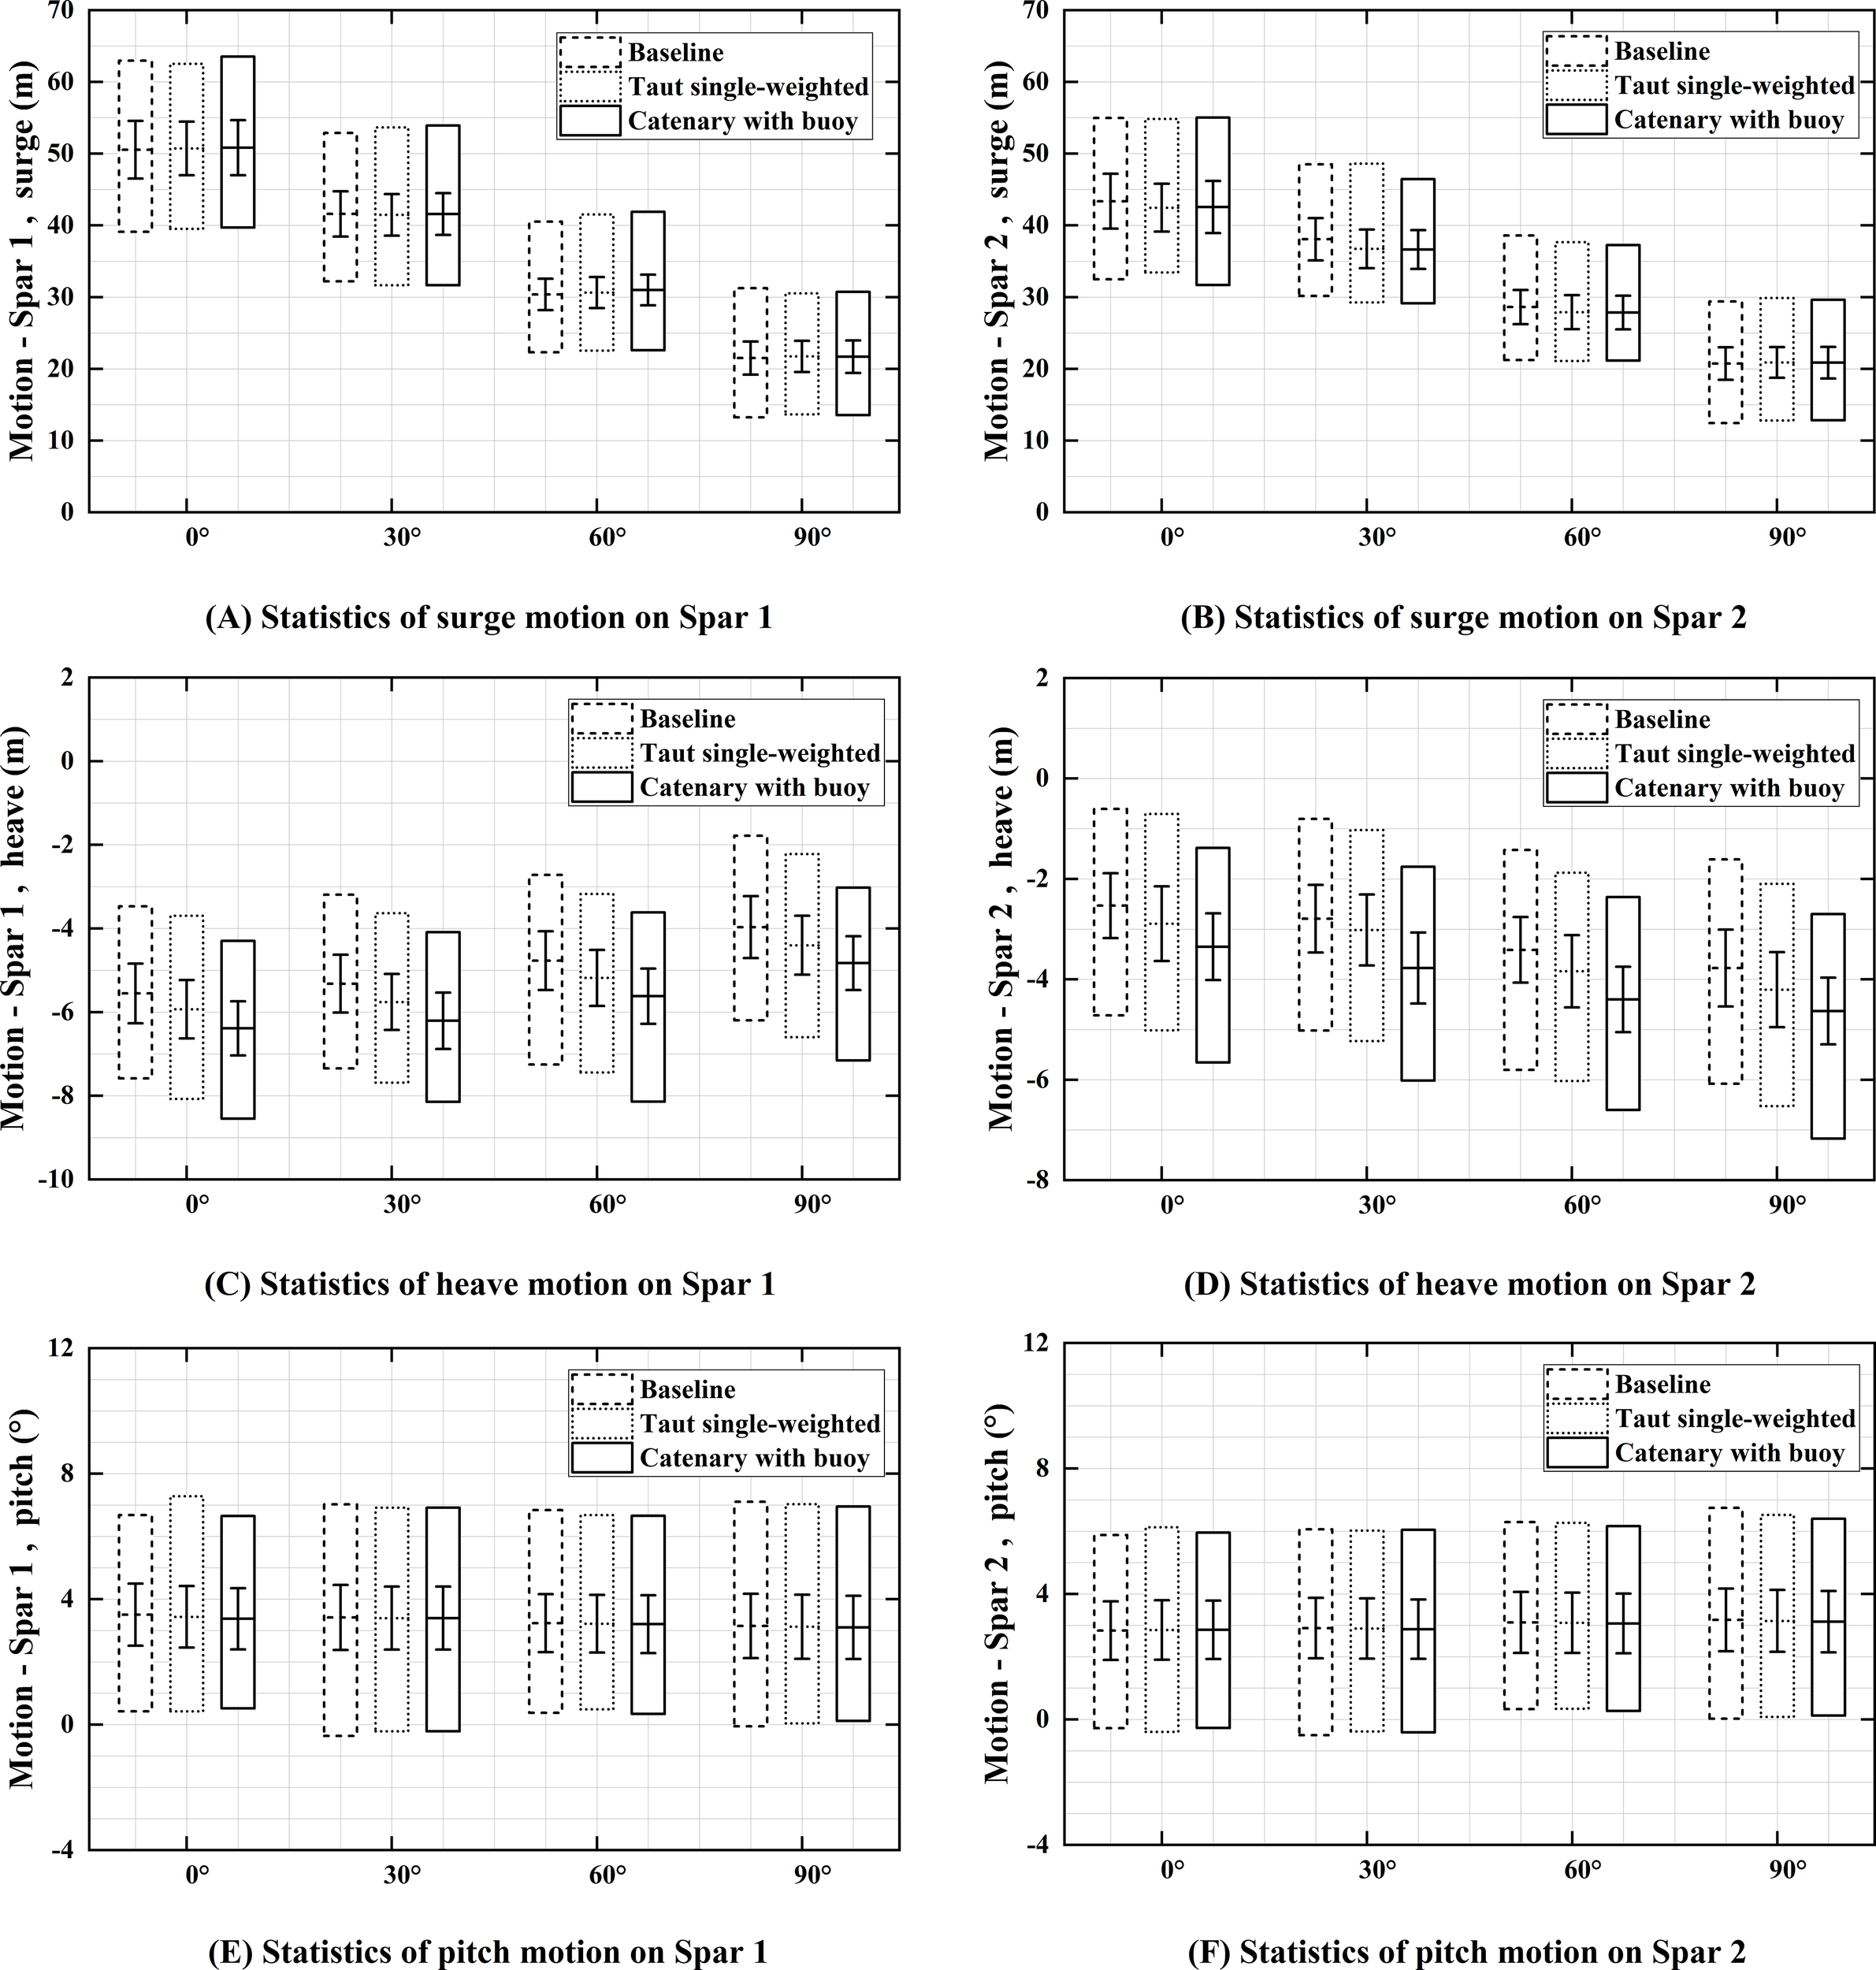
Statistics of the heave, sway and heave motions under different environmental load directions (middle line: mean, box: motion range [max and min], error bar: SD): (A) surge motion of Spar 1; (B) surge motion of Spar 2; (C) heave motion of Spar 1; (D) heave motion of Spar 2; (E) pitch motion of Spar 1; (F) pitch motion of Spar 2.
5.1.2 Analysis of fairlead tension responses
Figure 15 presents the time series of the fairlead tensions , , , and for the same wave seed as that in Section 5.1.1. At the 0°load direction, the tension variation patterns for and show similar among the three configurations. For and , the baseline configuration exhibits significant dynamic tension fluctuations, with a standard deviation of tension 6.31 times greater than that of the catenary with buoy configuration. The average tension of the catenary with buoy configuration is slightly higher than the other two configurations, measuring 1.05 times that of the baseline configuration.
Figure 15
Time series of fairlead tension under the operational scenario (random wave seed = 3): (A) tension of T1; (B) tension of T4; (C) tension of T5; (D) tension of T7.
Figure 16 shows the statistical results of , , , and under different environmental load directions. For and , the differences in both the mean and dynamic tension among the three configurations are relatively small. At the 30° load direction, the tension at in the baseline configuration reaches its maximum value (2584.85 kN), while at the 90° load direction, the tension at reaches its maximum (2171.39 kN). As the environmental load direction increases from 0° to 90°, the mean, maximum, and standard deviation of decrease gradually, while the tension at first increases and then decreases. This variation trend is closely related to changes in the environmental load direction and the horizontal projection angle of the mooring lines for and . For and , the differences in dynamic tension among the three configurations are most pronounced at a 0° load direction. As the load direction increases, the dynamic tension differences between the configurations gradually decrease, while the average tension remains relatively stable. Furthermore, at a 0° load direction, the mean and maximum tension at are significantly higher than those at , , and , primarily due to the movement of Spar1 and Spar2 along the x-axis, resulting in higher loads on the upwind fairlead. As the load direction increases, the tension difference between and decreases gradually.
Figure 16
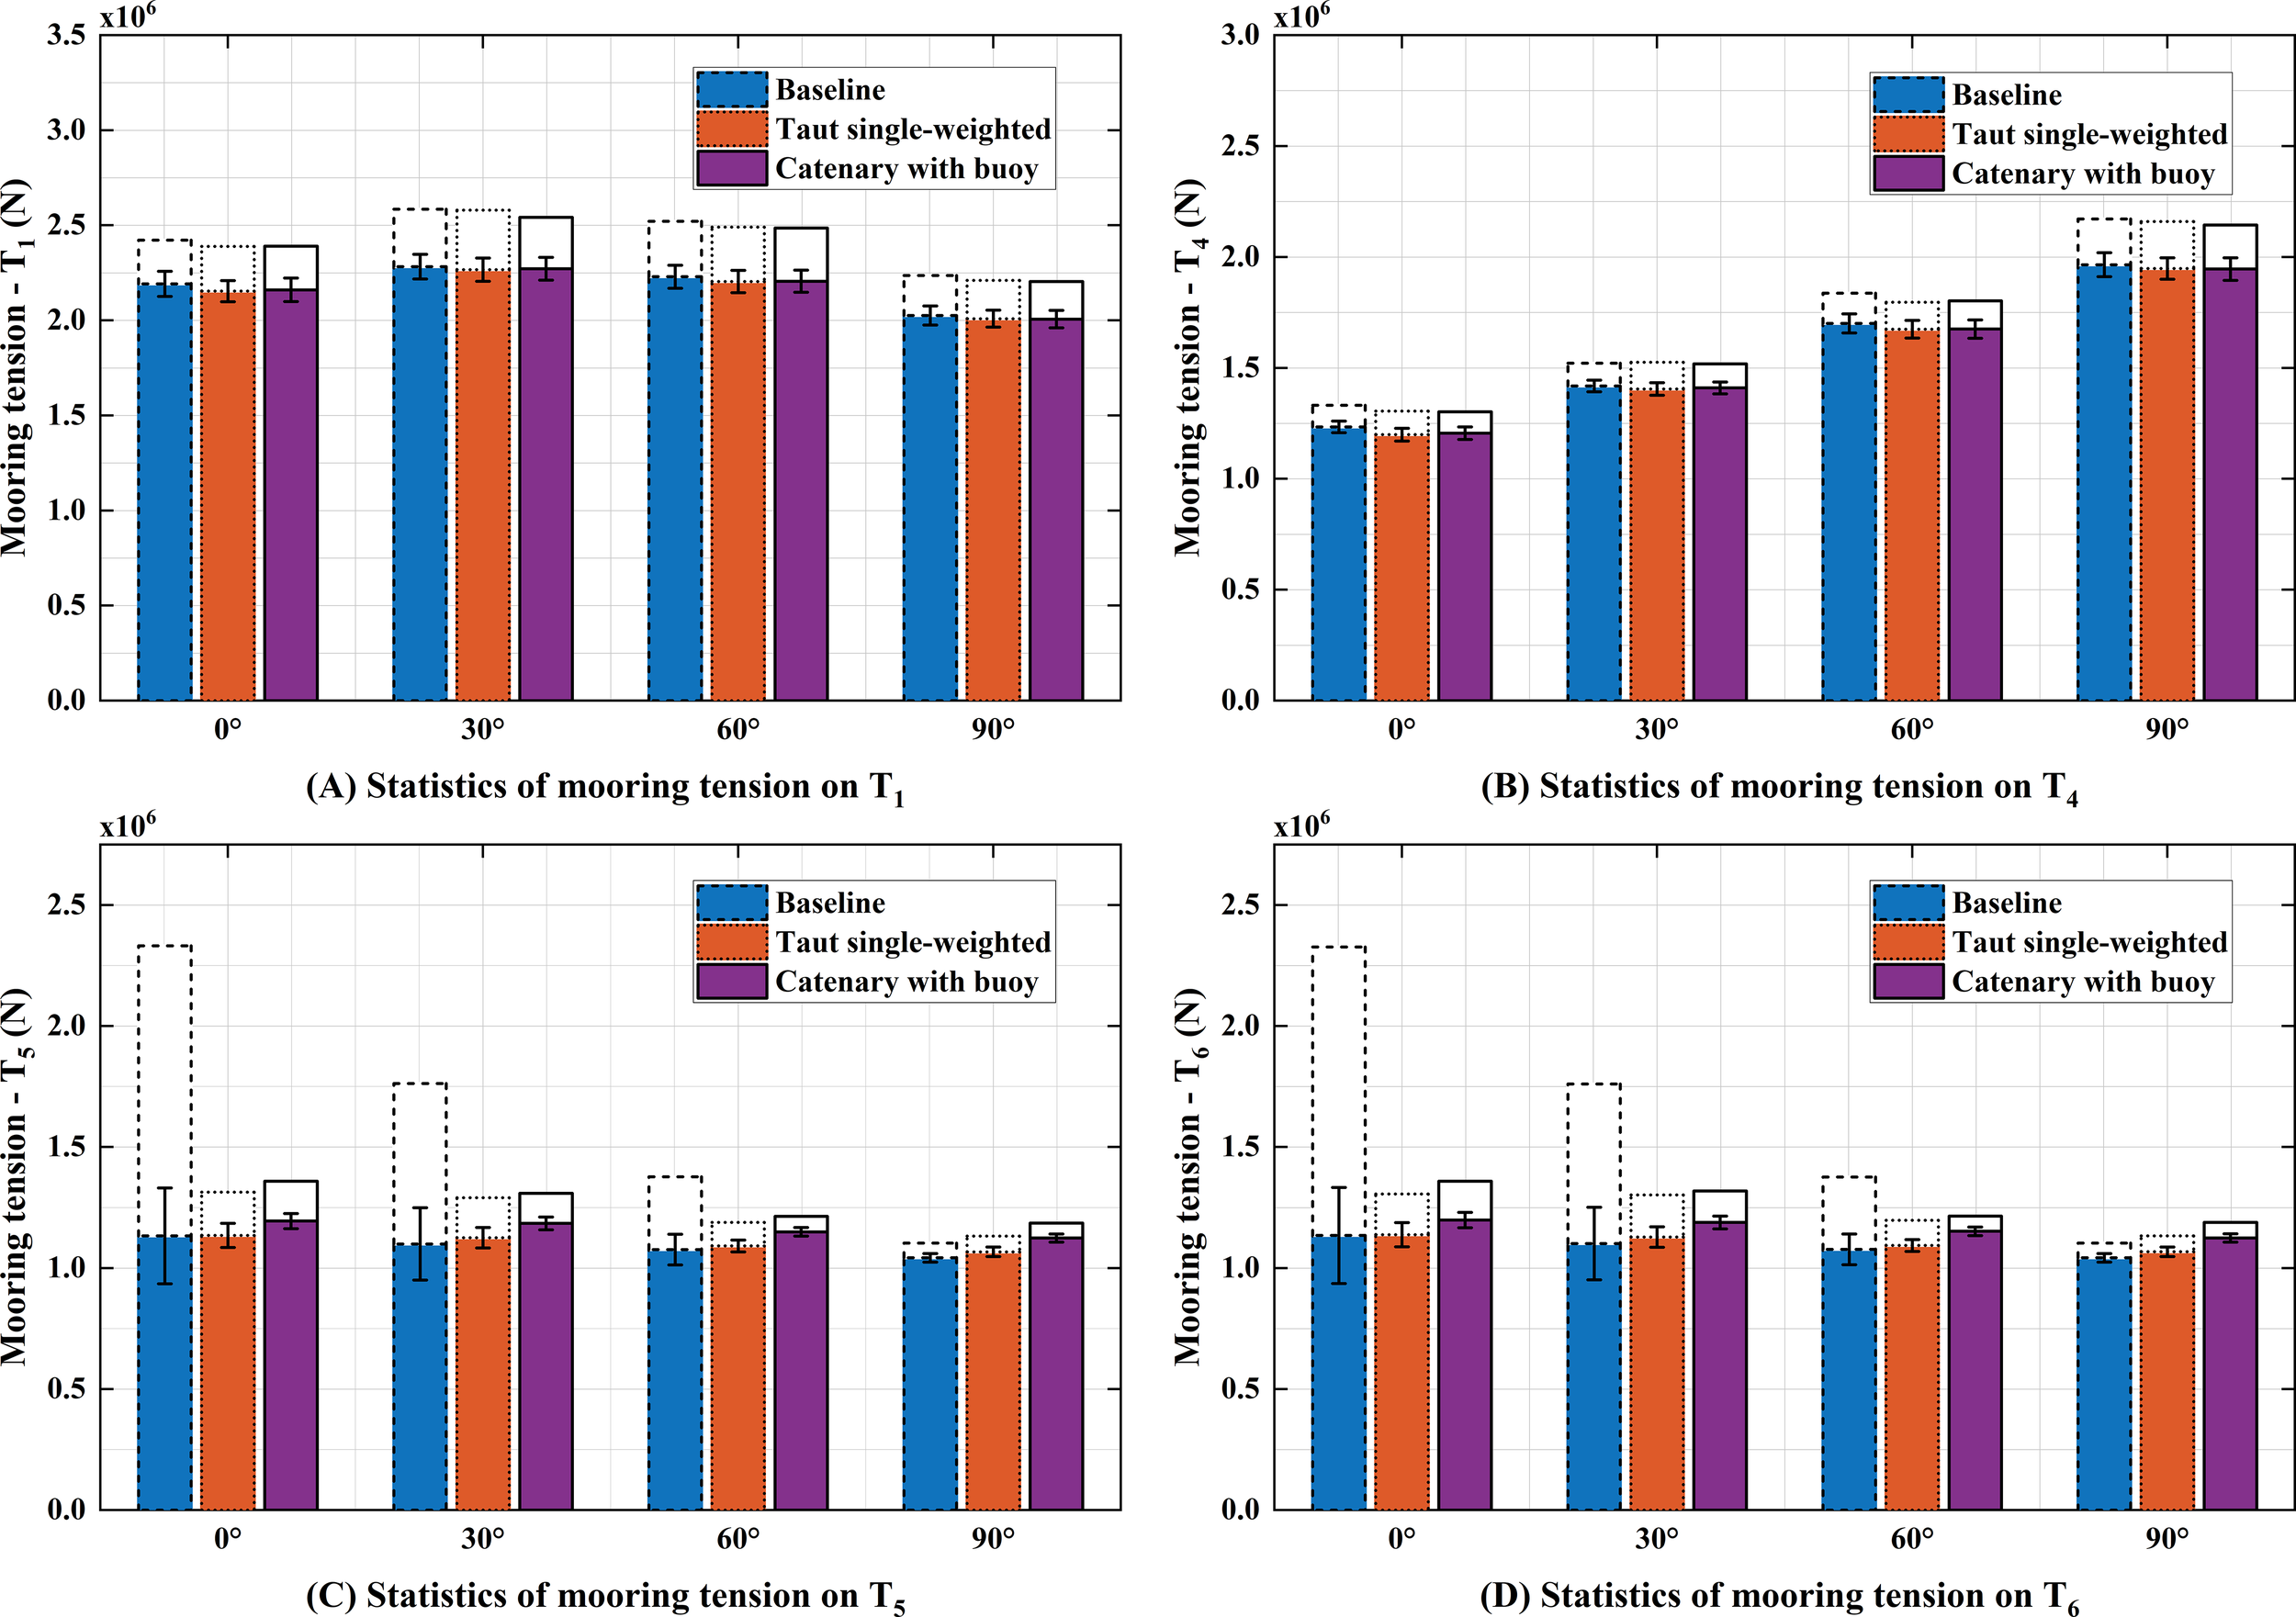
Statistics of the fairlead tension under different environmental loading directions (shadow bar: mean, white bar: max, error bar: SD): (A) tension of T1; (B) tension of T4; (C) tension of T5; (D) tension of T7.
5.2 Response analysis under the extreme scenario
5.2.1 Analysis of platform motion responses
According to the analysis in Section 5.1, under 0° environmental loading, the FOWF exhibits larger platform motions and higher fairlead tensions. The three configurations show significantly different fairlead tension characteristics under this loading direction. Therefore, this section focuses on the platform motion and mooring response characteristics under 0° environmental loading.
Figure 17 presents the time series of surge, heave, and pitch motions for the three configurations under the extreme scenario. Figure 18 shows the statistical results of the motion responses for Spar1 and Spar2. Figures 17 and 18 illustrate that, under the extreme scenario, the baseline configuration exhibits significantly higher average displacements and standard deviations in both surge and pitch directions compared to the other two configurations. As shown in Figure 18, the motion response of Spar1 is significantly greater than that of Spar2; therefore, Spar1 is selected for analysis. In the surge direction, the average displacement and standard deviation of the baseline configuration are 1.17 times and 1.23 times those of the catenary with buoy configuration. In the pitch direction, the average displacement and standard deviation of the baseline configuration are 1.12 times and 1.26 times those of the catenary with buoy configuration. In contrast, in the heave direction, the response of the catenary with buoy configuration is greater than that of the baseline configuration, with the average displacement and standard deviation being 1.08 times and 1.05 times those of the baseline configuration. These results suggest that the taut single-weighted configuration can reduce both displacement and motion fluctuations in surge and pitch directions. Although the catenary with buoy configuration reduces surge and pitch motions, it amplifies the heave motion response.
Figure 17
Motion response of spar 1 and spar 2 under the extreme scenario (random wave seed = 3): (A) surge motion of Spar 1; (B) surge motion of Spar 2; (C) heave motion of Spar 1; (D) heave motion of Spar 2; (E) pitch motion of Spar 1; (F) pitch motion of Spar 2.
Figure 18
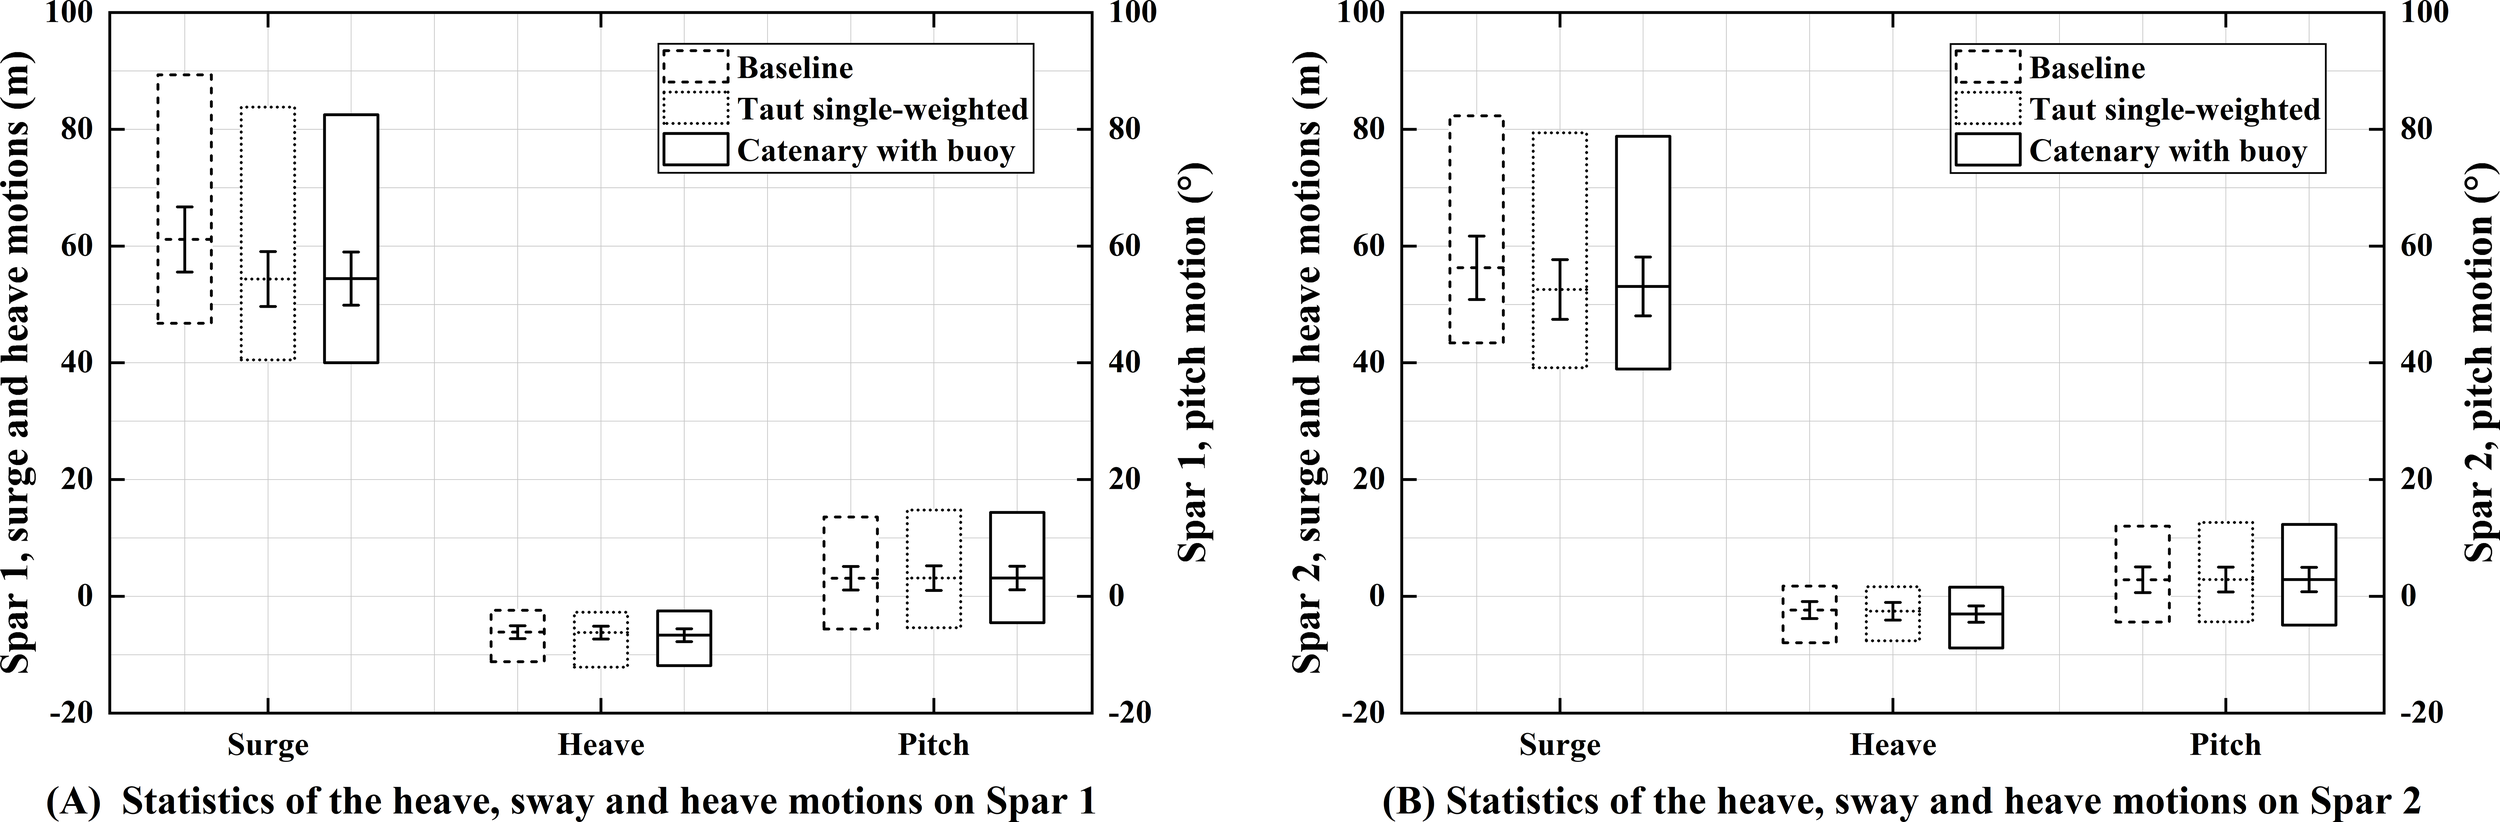
Statistics of the heave, sway and heave motions under the extreme scenario (middle line: mean, box: motion range [max and min], error bar: SD): (A) motion statistics of Spar 1; (B) motion statistics of Spar 2.
5.2.2 Analysis of fairlead tension responses
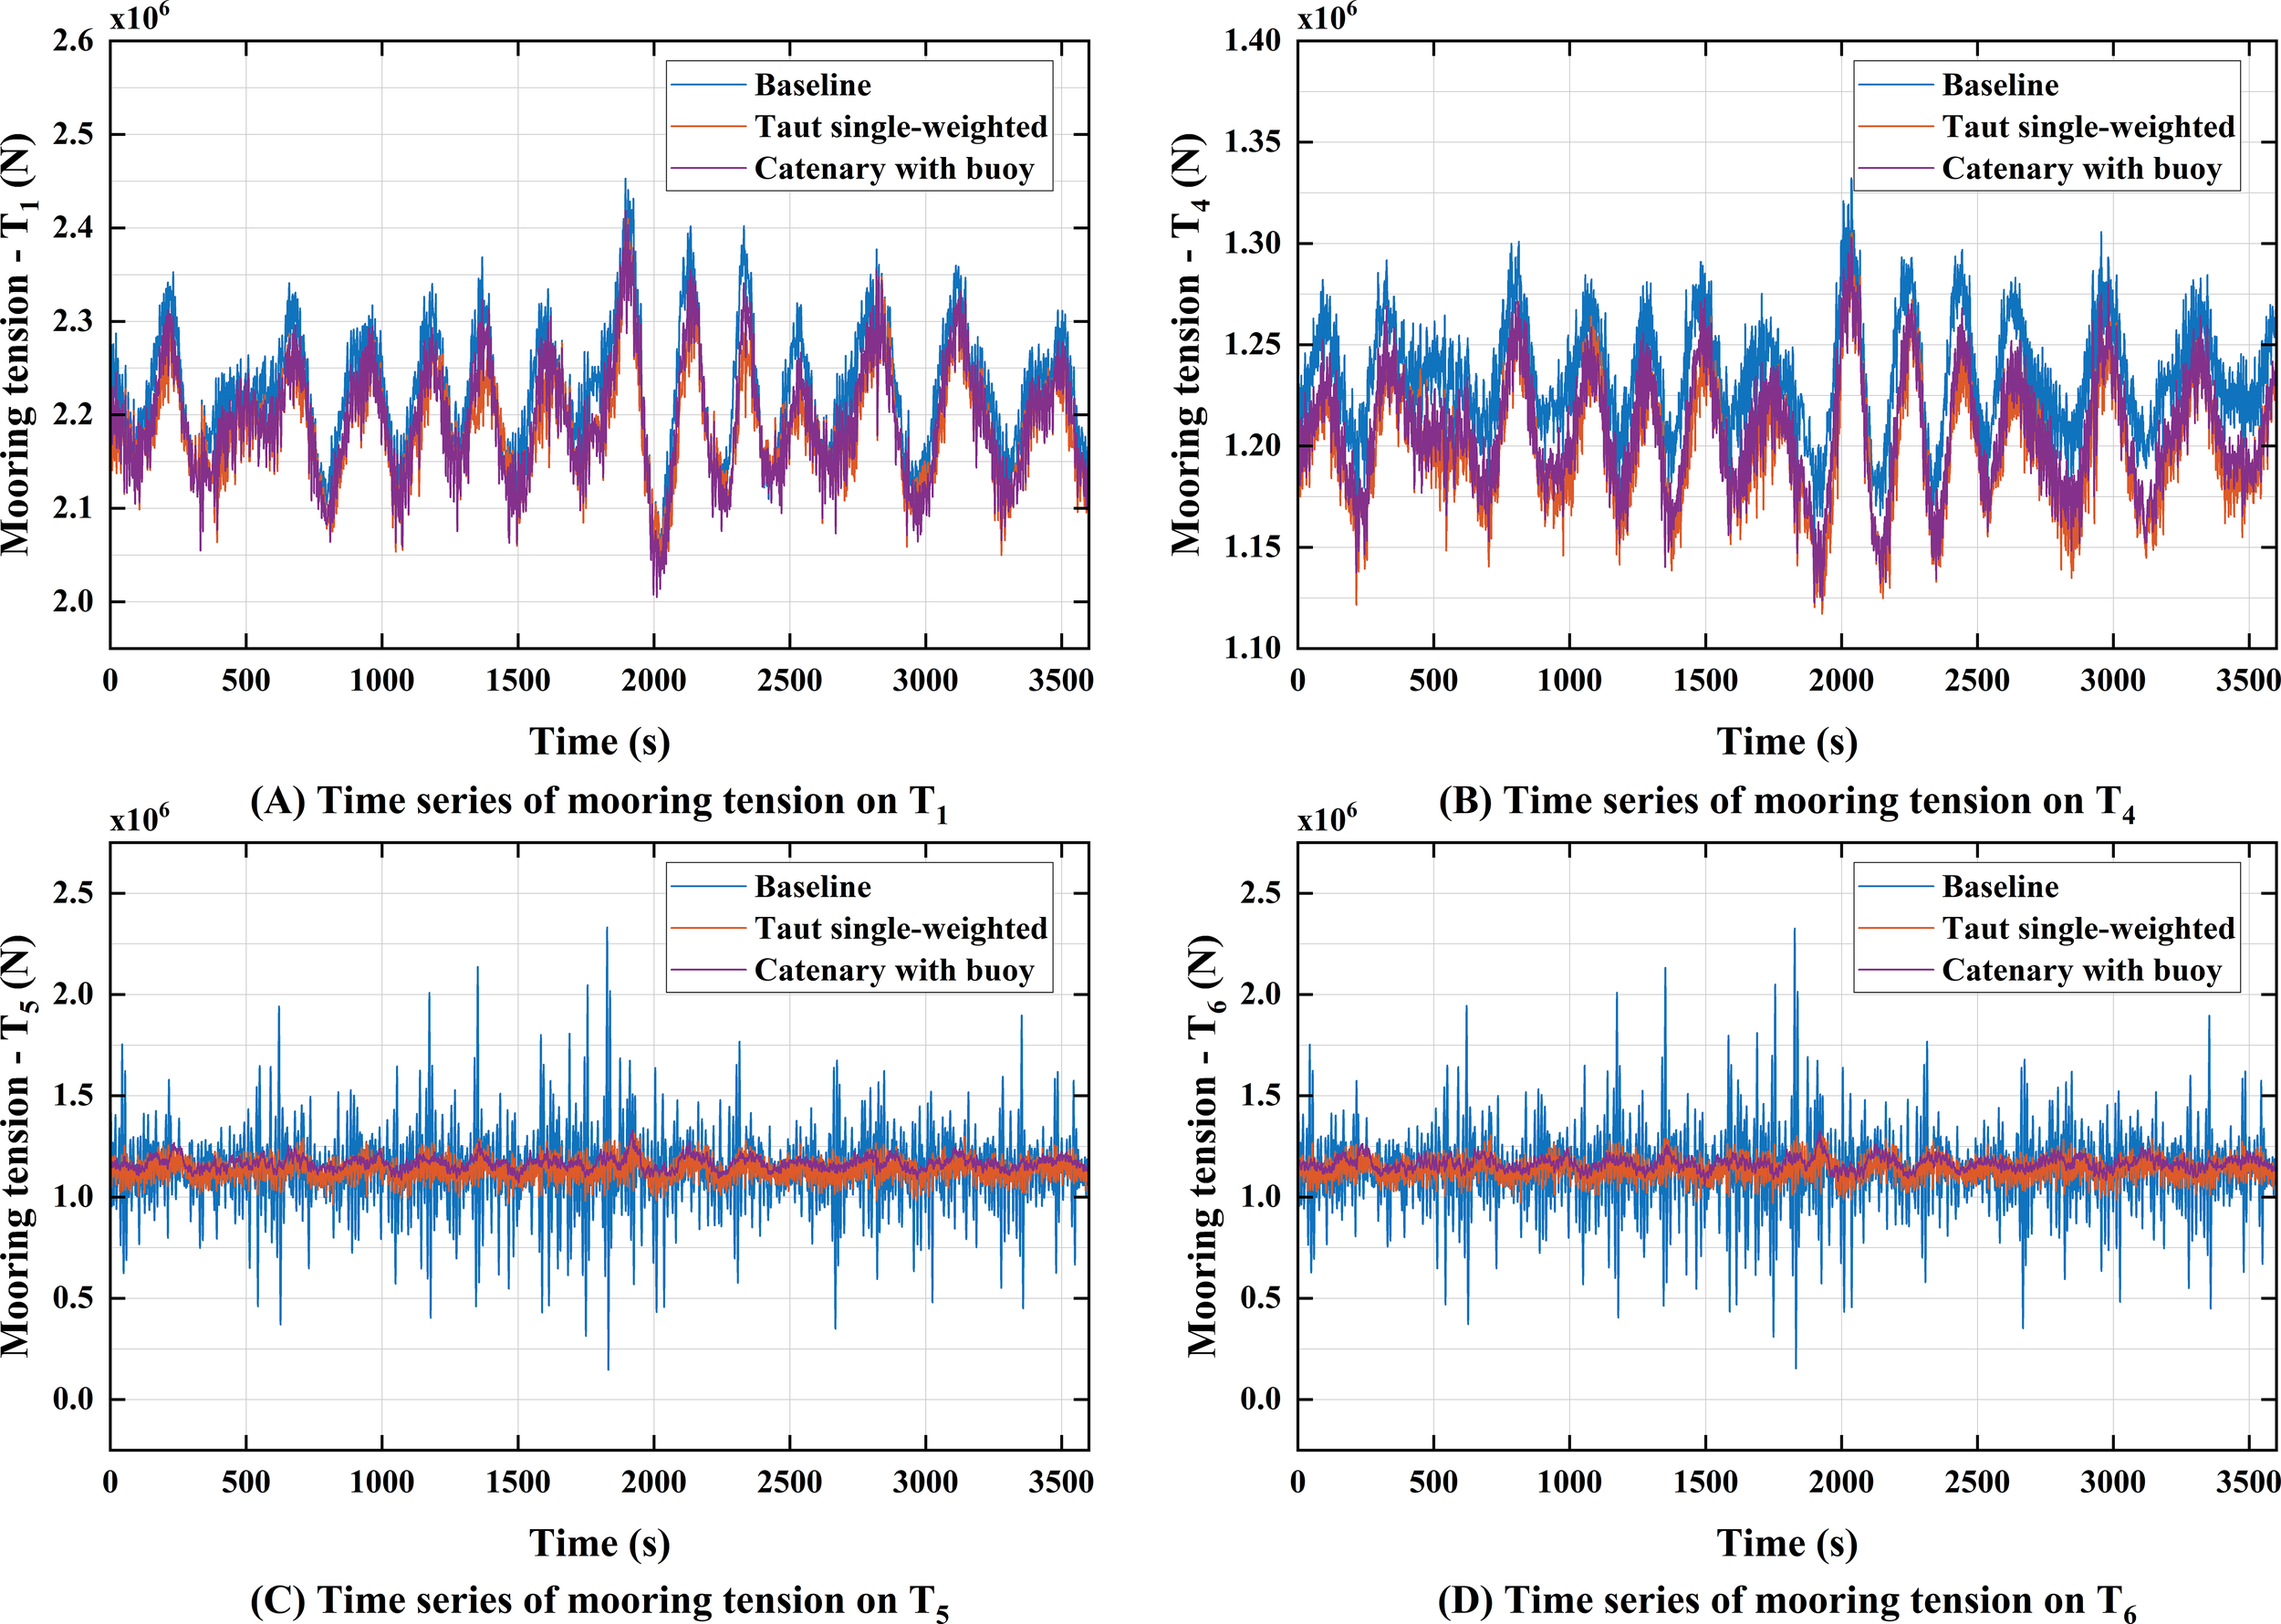
Figure 19 presents the time series of , , , and under the extreme scenario, while Figure 20 provides the corresponding statistics. For , the average and dynamic tensions for the baseline configuration are significantly higher than those for the other two configurations, with average values and standard deviations 1.06 times and 1.39 times those of the catenary with buoy configuration, respectively. For , the average tensions for the three configurations are similar; however, the baseline configuration exhibits a significantly larger standard deviation, which is 1.71 times that of the catenary with buoy configuration. The tension fluctuation characteristics for and are similar, so only is analyzed here. At , the dynamic tension for the baseline configuration is the most significant, followed by the taut single-weighted configuration, with the catenary with buoy configuration exhibiting the smallest dynamic tension. Specifically, the tension standard deviation of the baseline configuration is 9.76 times that of the catenary with buoy configuration.
Figure 19
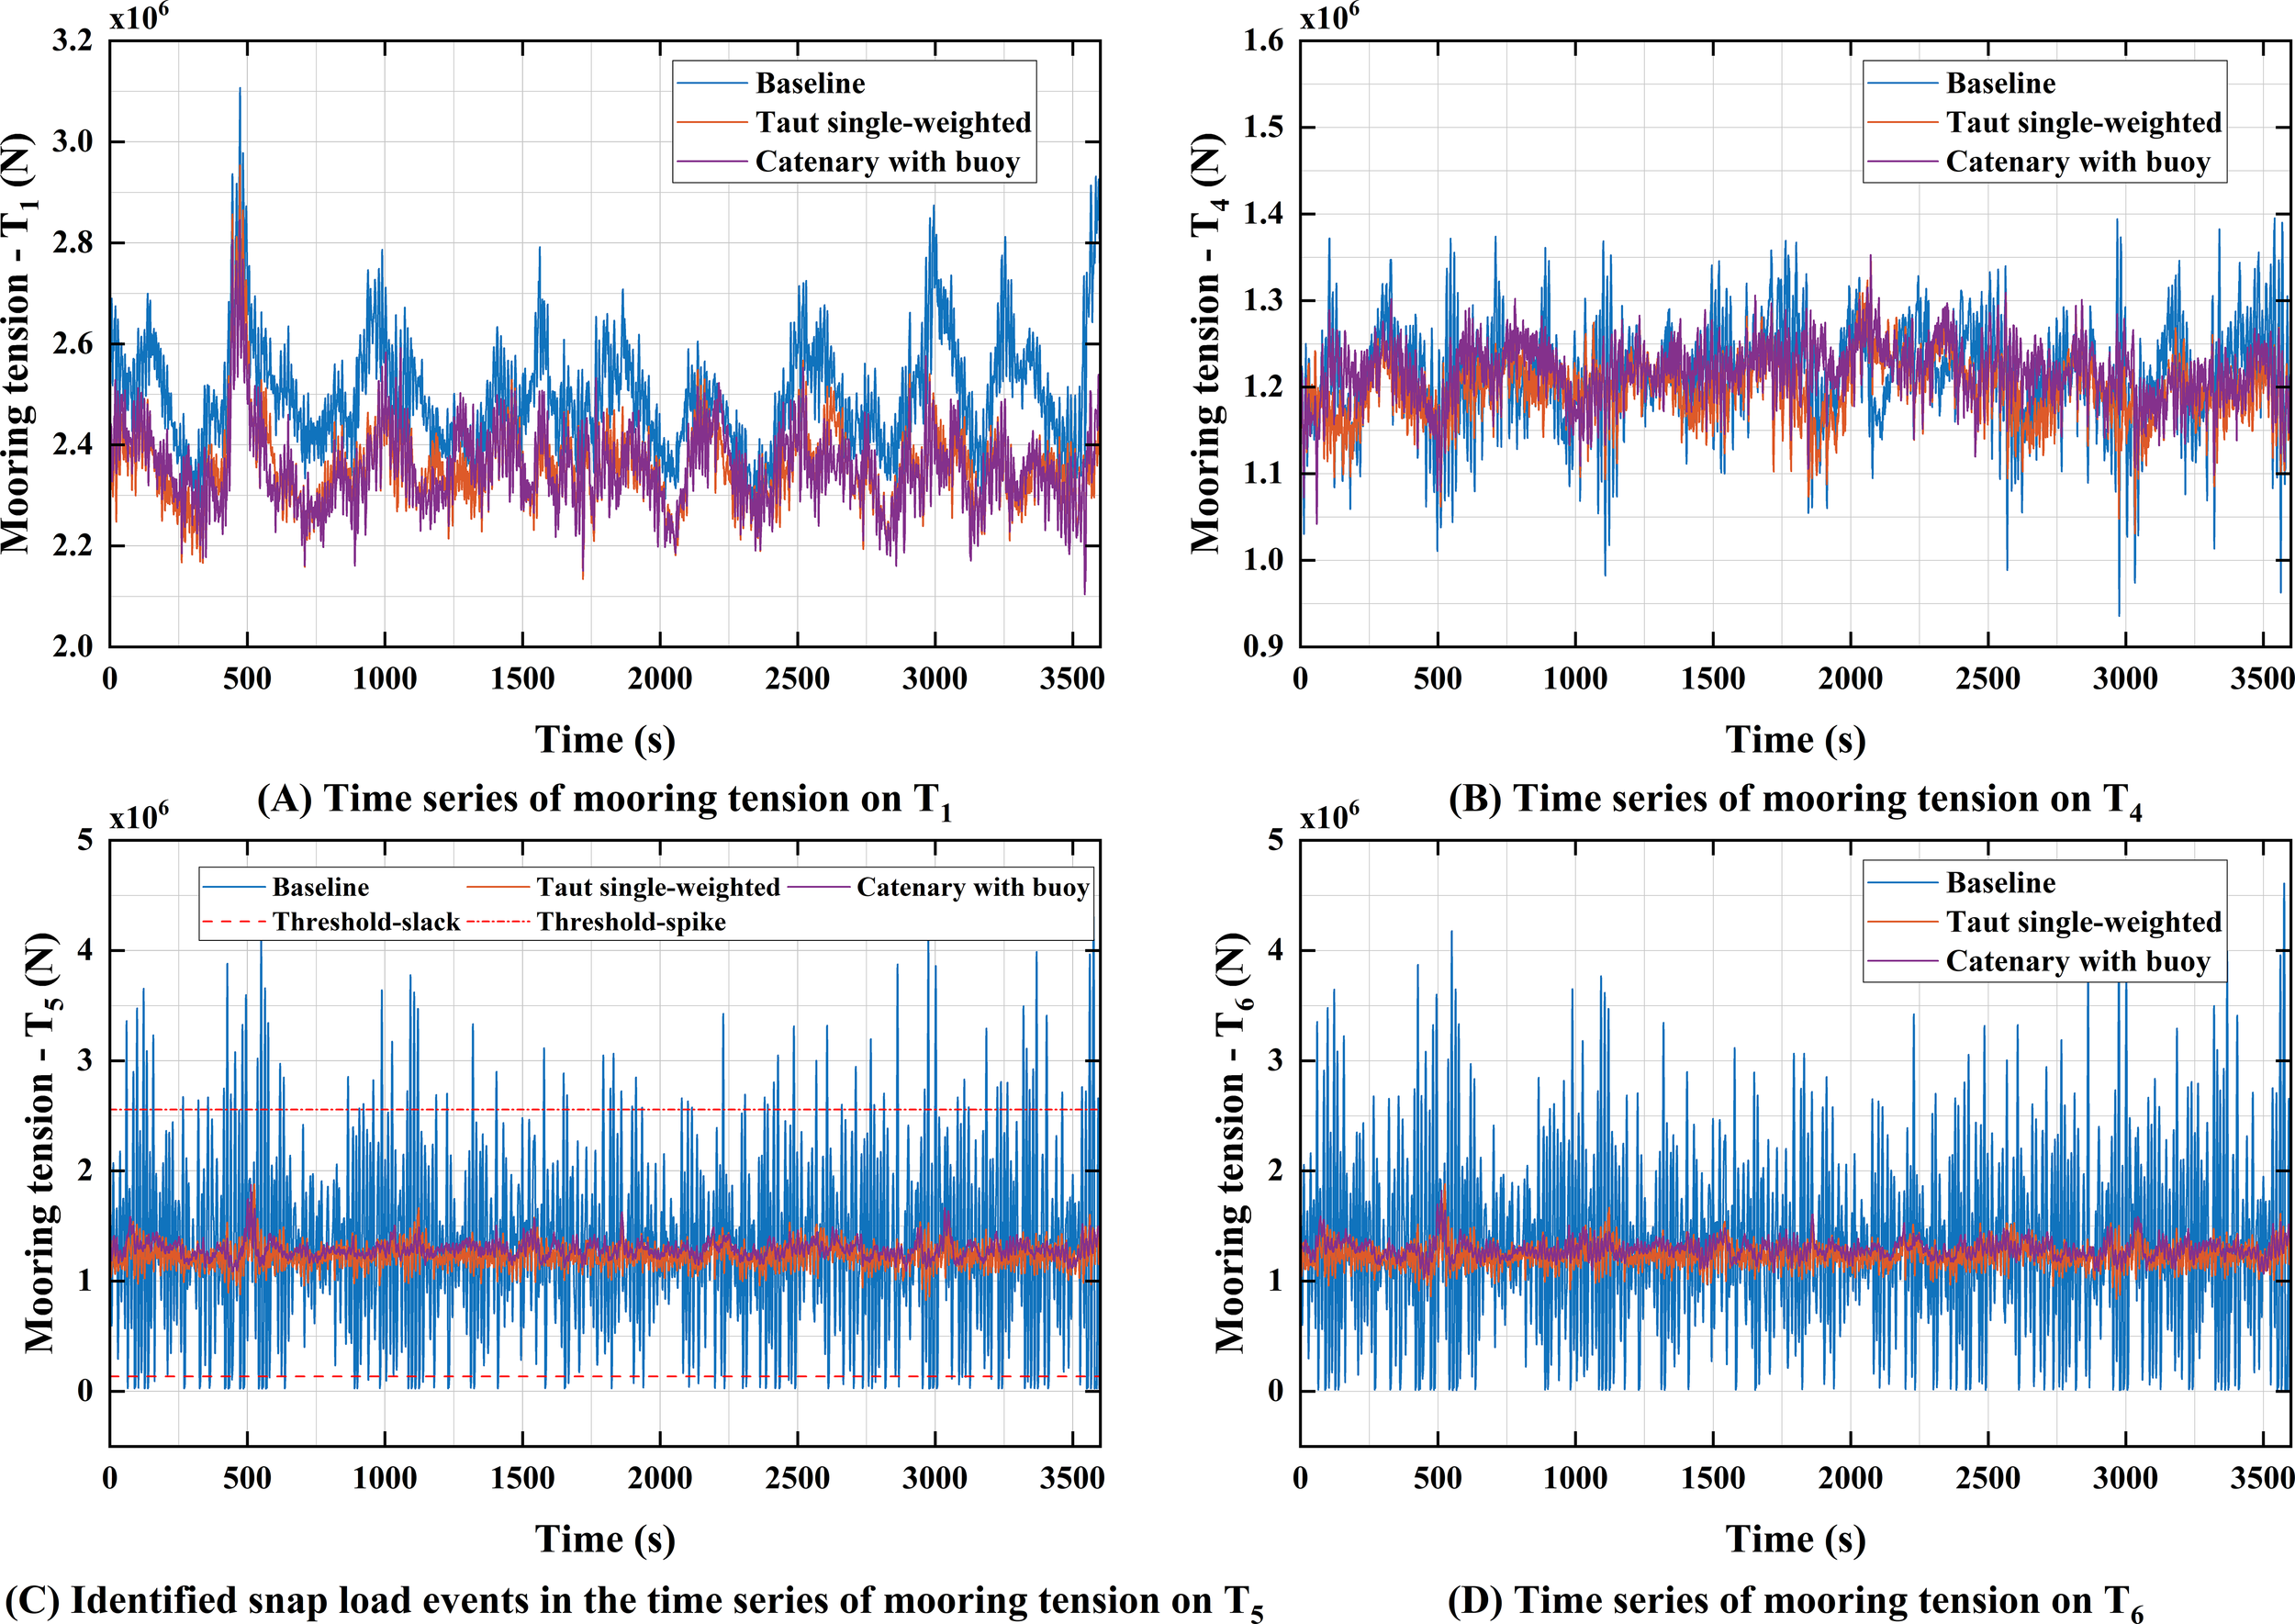
Time series of fairlead tension under the extreme scenario (random wave seed = 3): (A) tension of T1; (B) tension of T4; (C) tension of T5; (D) tension of T7.
Figure 20
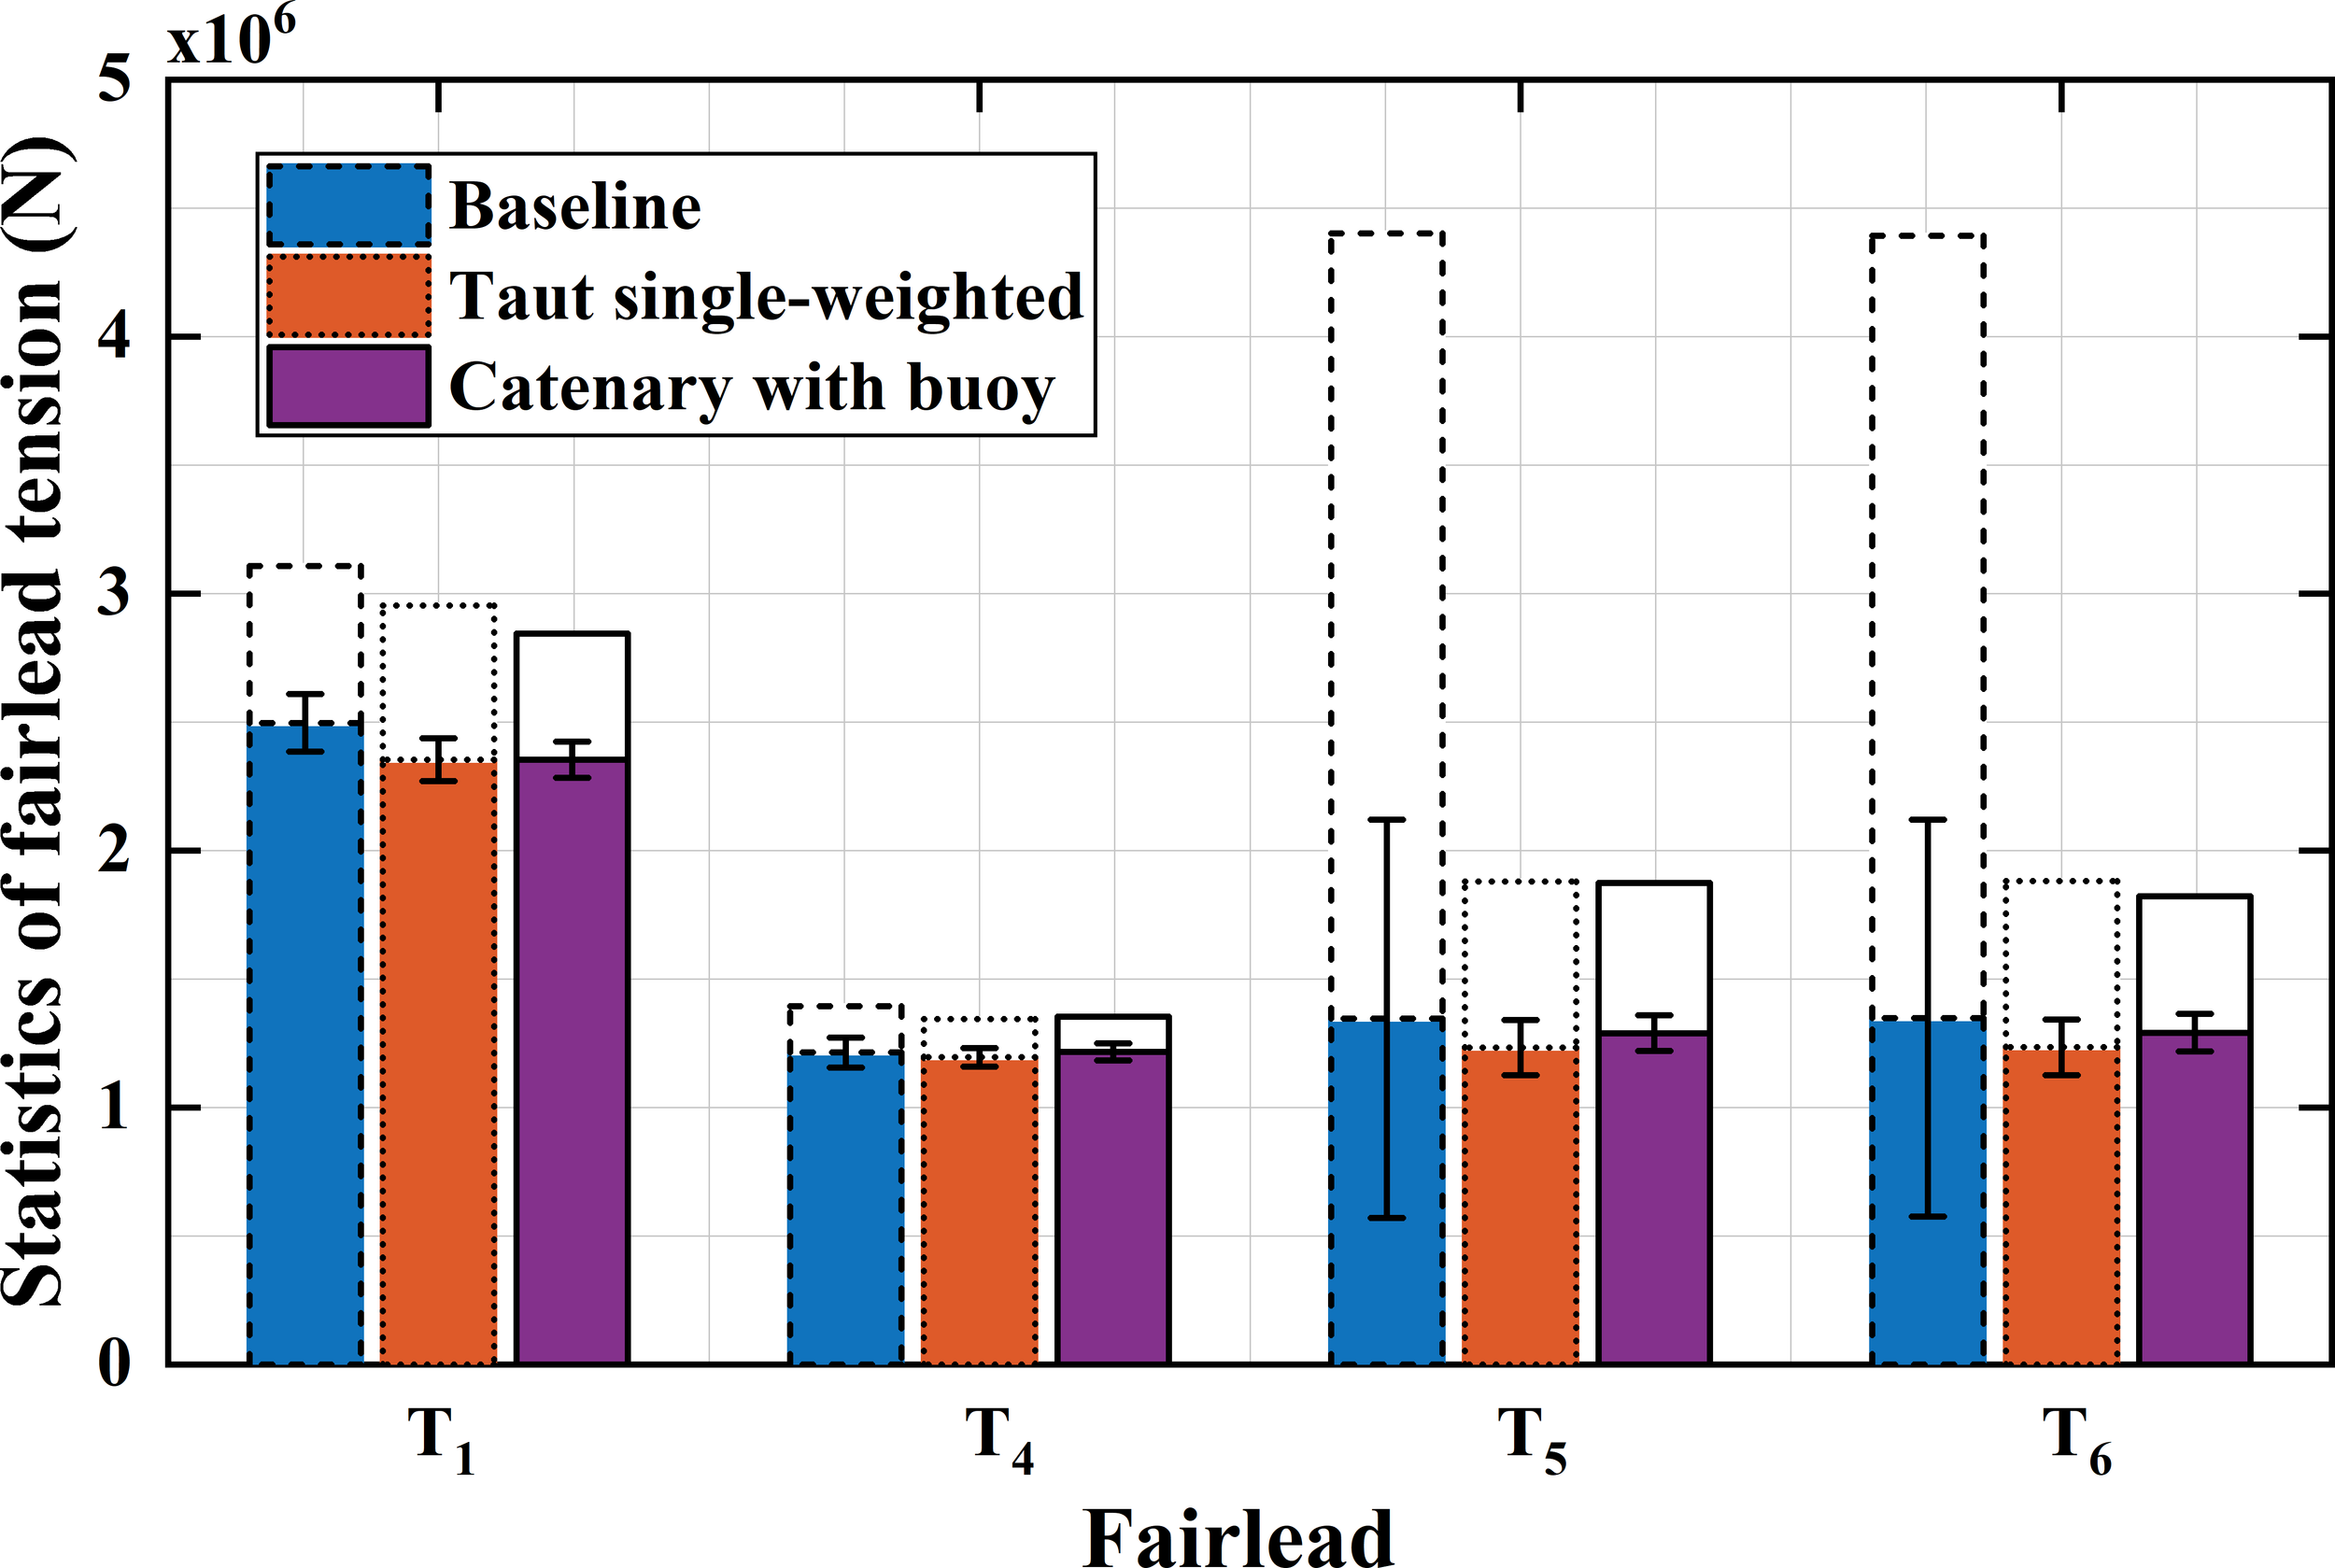
Statistics of the fairlead tension under the extreme scenario (shadow bar: mean, white bar: max, error bar: SD).
In summary, compared to the baseline configuration, both the taut single-weighted and catenary with buoy configurations effectively reduce the tension fluctuations of the shared mooring lines. This allows for a reduction in the safety margin during mooring design, contributing to a more cost-effective shared mooring solution.
5.2.3 Snap events under the extreme scenario
A sharp tension spike occurring in mooring lines following a momentary slack is termed a snap event. Snap events can drastically reduce the mooring line’s fatigue life or even cause immediate failure. Based on DNV standards (DNV, 2011), the snap event was defined by Hsu et al. (2017) as expressed in Equation 3.
where is the local tension minimum (N), is the subsequent local tension maximum (N), is the mean mooring tension (N).
For the extreme scenario, this study conducted snap event analysis on the fairlead tensions of the three configurations. The results revealed that snap events were observed exclusively in the baseline configuration, primarily occurring on and . As indicated in Section 5.2.2, the tension fluctuation characteristics of and are similar; therefore, only is analyzed in this section. Figure 19C presents the tension time history for in the baseline configuration, illustrating the snap events. The average number of snap events recorded for is 62.54. It should be noted that no snap events were observed in the tension time histories for either the taut single-weighted configuration or the catenary with buoy configuration. This is attributed to the significantly reduced maximum tension and dynamic tension of the mooring line achieved by these two configurations.
5.2.4 Fatigue analysis of shared mooring
The fatigue damage caused by snap events should also be analyzed in the fatigue analysis of shared mooring. In such analyses, the T-N curve is commonly used, which considers only the fatigue induced by tension, while neglecting other factors such as torque. The T-N curve describes the relationship between the number of load cycles N at failure and the tension range T, which is given by Equation 4.
The ratio represents the tension range relative to the reference breaking strength (RBS). The parameters M and K are fatigue constants specific to the mooring material. The T-N curve for chain and steel wire rope follows the recommendations outlined in the API-2SK standard (API, 2005). For chain, M=3.0 and K=316; for steel wire rope, M=5.05 and K=166. Similarly, the T-N curve for polyester rope follows the recommendations in the API-2SM standard (API, 2007), with M=9.0 and K=7.5.
A fully coupled dynamic analysis is performed to obtain the tension time series of the mooring line under various sea conditions. The rain-flow counting method (ASTM, 2005) is then employed to statistically quantify the cyclic tension ranges and their corresponding frequencies. Using the Palmgren-Miner cumulative damage criterion, the accumulated fatigue damage calculation for the mooring line is given by the following formula:
where represents the cumulative fatigue damage, is the number of tension range levels, is the fatigue damage at each tension range, is the number of load cycles at the corresponding tension range, and is the number of load cycles required to cause fatigue failure at the given tension range.
The number of cycles for the fairlead across three configurations under the extreme scenario is summarized in Table 14, with cycles measured across various tension ranges. Compared to the baseline configuration, the taut single-weighted configuration and the catenary with buoy configuration exhibit significantly higher cycle counts within the 0–500 KN. Moreover, no cyclic loading was detected at higher tension levels. From a fatigue damage perspective, the taut single-weighted configuration demonstrates the lowest cumulative fatigue damage. Specifically, the cumulative fatigue damage for the baseline configuration and the catenary with buoy configuration is 5.91×10⁶ times and 8.12×10³ times greater than that for the taut single-weighted configuration, respectively. These findings highlight the advantage of the taut single-weighted configuration in terms of fatigue resistance.
Table 14
| Tension range (KN) | Baseline | Taut single-weighted | Catenary with buoy |
|---|---|---|---|
| 0.00 - 500.00 | 417.12 | 756.55 | 1063.63 |
| 500.00 - 1000.00 | 51.95 | 15.79 | 3.32 |
| 1000.00 - 1500.00 | 50.26 | 1.34 | 0 |
| 1500.00 - 2000.00 | 49.37 | 0 | 0 |
| 2000.00 - 2500.00 | 42.52 | 0 | 0 |
| 2500.00 - 3000.00 | 37.51 | 0 | 0 |
| 3000.00 - 3500.00 | 22.88 | 0 | 0 |
| 3500.00 - 4000.00 | 12.06 | 0 | 0 |
| 4000.00 - 4500.00 | 3.14 | 0 | 0 |
The number of cycles at different tension ranges for under the extreme scenario.
6 Cost analysis of the two shared lines configurations
According to Section 5, both the taut single-weighted configuration and the catenary with buoy configuration can effectively enhance the system stability. Therefore, this section focuses on the economic feasibility analysis of these two configurations, aiming to conduct a multi-dimensional comparison of the schemes.
6.1 Model of economic evaluation
The levelized cost of electricity (LCOE) is a core indicator for quantifying the technoeconomic feasibility of energy projects. Initially proposed by the NREL in 1995, this method has been widely used in economic analyses of renewable energy (Revel, 2012). Its fundamental calculation formula can be expressed as:
where is the present value of the cost of the wind power generation project over its life cycle, is the present value of the energy generation of the project over its life cycle. Further decomposed, Equation 6 can be refined into Equation 7 (Benabadji et al., 2025):
where represents the initial capital expenditure, represents the operation and maintenance cost in year n, is the decommissioning cost in year n, is the loan interest and taxes in year n; E(n) is the electricity generation in year n, is the discount rate, and is the design lifetime (in years) of the FOWF system.
For the FOWF system, capital expenditure encompasses equipment costs, installation costs, and other one-time investments. Equipment costs include: (1) turbine components (such as blades, nacelles, towers, and converters), (2) floating substructures and mooring systems, (3) electrical transmission systems (such as submarine cables). This paper focuses on studying different shared mooring configurations. Therefore, the subsequent subsections will specifically compare the material costs of the shared mooring lines, rather than providing a complete assessment of the LCOE.
6.2 Material cost of shared line
Based on data from Table 4 and Table 5, calculate the material cost for the shared mooring configurations. Equation 8 provides the calculation of the material cost for a shared mooring line (Xu et al., 2025):
where is the length of the polyester rope (m), is the dry weight of the polyester rope (t/m), is the price per unit weight of the polyester rope (USD/t), is the mass of the clump weight (t), is the price per unit weight of the clump weight (USD/t), is the length of the chain (m), is the dry weight of the chain (t/m), represents the price per unit weight of the chain (USD/t), is the mass of the buoy (t), and is the price per unit weight of the buoy (USD/t). The cost assumptions shown in Table 14 refer to the research Hall et al. (2022).
6.3 Analysis of unit safety factor cost
According to API standards (SK, 2005), mooring systems must satisfy the safety factor requirements under extreme conditions. The safety factor is calculated using Equation 9:
Where is the safety factor, is the minimum breaking strength of the shared line (N), and represents the maximum tension of the shared line (N). Based on the mooring line parameters from Table 4, as well as the maximum tension of the shared mooring in the extreme scenario from Tables 11 and 13, the safety factors for the two shared mooring configurations are calculated. Then, combining the material costs provided in Table 15, the unit safety factor cost is calculated, following the concept proposed by (Xu et al., 2025). The relevant results are presented in Table 16, and Figure 21.
Table 15
| Cost component | Cost coefficient |
|---|---|
| Chain | $2,585 per ton weight |
| Polyester Rope | $0.162 per ton break strength |
| Clump Weight or Buoy | $1,000 per ton weight |
Assumed coefficients used in cost estimates.
Table 16
| Shared mooring configuration | Item | Maximum mooring tension (KN) | Breaking load (KN) | Safety factor (FS) | Material cost (USD) | Unit safety factor cost (USD) |
|---|---|---|---|---|---|---|
| Taut single-weighted configuration | TW1 | 2737.46 | 9631 | 3.518 | 170,149.60 | 48,365.48 |
| TW2 | 1874.81 | 9631 | 5.137 | 211,443.34 | 41,160.81 | |
| TW3 | 1659.68 | 9631 | 5.803 | 244,942.83 | 42,209.72 | |
| TW4 | 1610.28 | 9631 | 5.981 | 269,698.80 | 45,092.54 | |
| Catenary with buoy configuration | CB1 | 1825.33 | 9650 | 5.287 | 515,894.93 | 97,578.01 |
| CB2 | 1873.16 | 9650 | 5.152 | 519,963.82 | 100,924.64 | |
| CB3 | 1942.73 | 9650 | 4.967 | 529,135.20 | 106,530.11 | |
| CB4 | 2045.21 | 9650 | 4.718 | 542,707.60 | 115,029.22 |
Statistics on the unit safety factor cost.
Figure 21
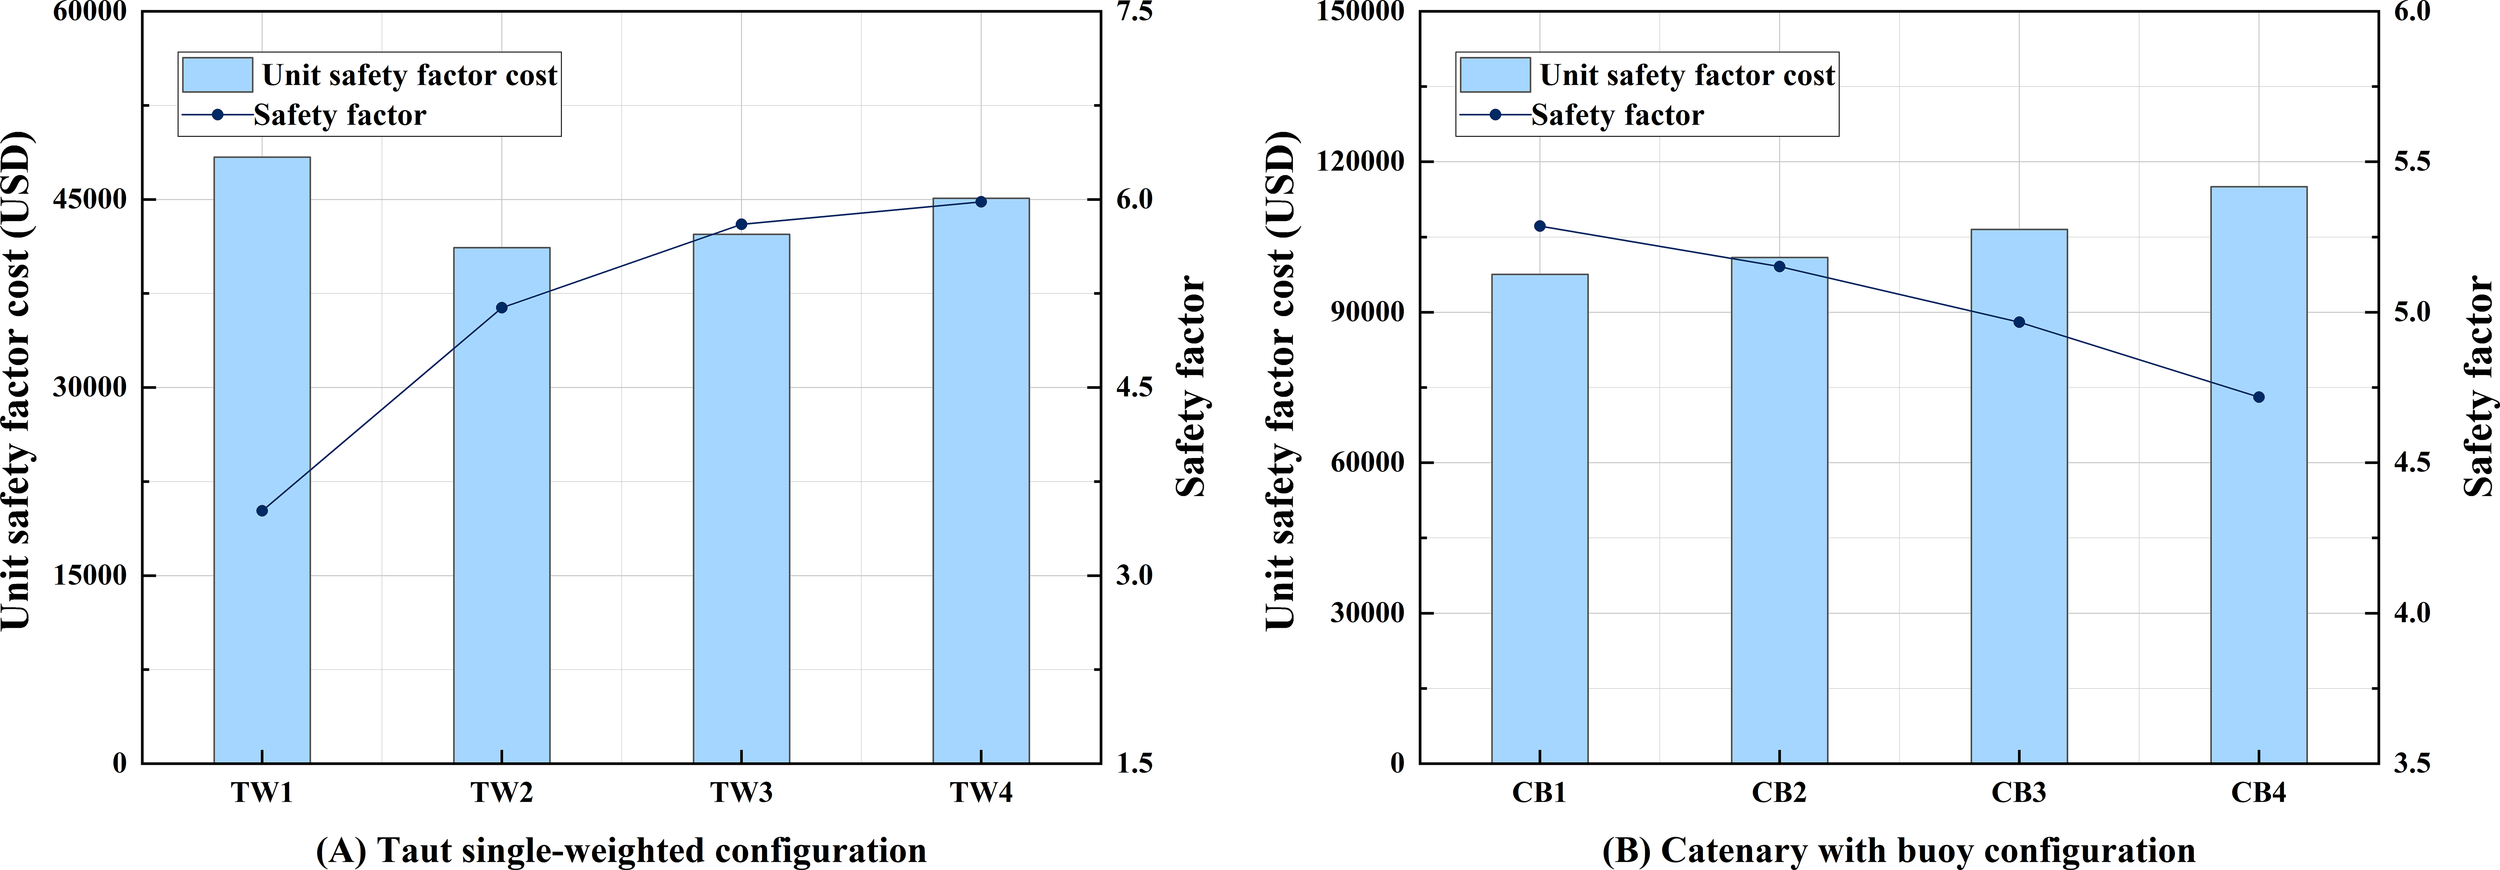
Statistics on safety factor and unit safety factor cost of shared mooring configurations: (A) statistics on the taut single-weighted configuration; (B) statistics on the catenary with buoy configuration.
For the taut single-weighted configuration, TW4 exhibits the highest safety factor (5.981), whereas TW2 achieves the lowest unit safety factor cost (USD 41,160.81). For the catenary with buoy configuration, CB1 has the highest safety factor (5.287), while CB4 has the highest unit safety factor cost (USD 115,029.22). Compared with TW2, the safety factor of CB2 increases by only 0.28%, but its unit safety factor cost rises by 145.19%. The above analysis indicates that as the mass of the ballast increases, the safety factor of the taut single-weighted configuration shows an increasing trend. However, the unit safety factor cost exhibits a non-monotonic pattern, first decreasing and then increasing. In contrast, for the catenary with buoy configuration, the safety factor of the mooring system decreases with increasing net buoyancy of the buoy, while the corresponding unit safety factor cost continues to rise. Considering both material cost and unit safety factor cost, the taut single-weighted configuration demonstrates superior economic performance compared with the catenary with buoy configuration.
7 Conclusions
This study employed a quasi-static method to design three shared mooring configurations for a dual-Spar FOWF, and conducted time-domain analysis of these configurations using OrcaFlex software. Firstly, sensitivity analyses were conducted to investigate the dynamic characteristics of the taut single-weighted configuration with different clump weight masses and the catenary with buoy configuration with varying net buoyancy of the buoy. Then, the dynamic characteristics of the three configurations were compared under both operational and extreme scenarios. Finally, an economic comparison of the different mooring configurations was made. The main conclusions of this study are as follows:
-
For the taut single-weighted configuration, as the clump weight mass increases, the platform’s surge motion is suppressed, but the amplitude of heave and pitch motions increases. In this study, when the clump weight mass is less than TW2, significant tension fluctuations occur in the shared mooring system. As the clump weight mass increases, these tension fluctuations are significantly reduced. For the catenary with buoy configuration, as the net buoyancy of the buoy increases, the platform’s heave and pitch motions are suppressed, while the surge motion increases. Under excessive net buoyancy, significant tension fluctuations occur in the shared mooring line. It should be noted that, in this study, when the net buoyancy of the buoy exceeds CB2, the maximum tension in the shared mooring line might occur at its connection point to the buoy.
-
A comparative analysis of the three mooring configurations indicates that, in the surge and pitch directions, the motion responses are relatively similar among the configurations; however, significant differences are observed in the heave direction. Compared to the other two configurations, the baseline configuration exhibits more pronounced tension fluctuations. In contrast, the taut single-weighted configuration and the catenary with buoy configuration effectively address the snap events in the shared mooring system under the extreme scenario. Furthermore, the taut single-weighted configuration demonstrates a clear advantage in terms of fatigue damage resistance.
-
The techno-economic feasibility analysis indicates that, as the clump weight mass increases, the safety factor of the taut single-weighted configuration gradually improves. However, its unit safety factor cost exhibits a non-monotonic trend, initially decreasing and then increasing. In contrast, as the net buoyancy of the buoy increases, the safety factor of the shared mooring system in the catenary with buoy configuration shows a decreasing trend, while the unit safety factor cost continues to rise. A comprehensive comparison of the two configurations reveals that the taut single-weighted configuration demonstrates superior performance in both technical and economic aspects.
In summary, this study demonstrates that the shared mooring configuration employing polyester rope with a clump weight and chain with a buoy can significantly improves the performance of mooring systems in FOWF. Furthermore, the influence of the clump weight mass and the net buoyancy of the buoy on the mechanical performance of the system has been elucidated. However, this study focuses on the motion responses and mooring tension characteristics of FOWF under both operational and extreme scenarios at a water depth of 500 m, which limits the scope of the research. Future work should be extended to different water depths and a broader range of environmental conditions to enhance the universality of the results. Furthermore, shared mooring configurations with multiple clump weights or multiple buoys are also worthy of further exploration. Regarding the economic analysis aspect, this study offers an initial analysis of mooring material costs. Future research should focus on investigating the installation, maintenance, and inspection costs of various shared mooring configurations to establish a more comprehensive techno-economic evaluation framework.
Statements
Data availability statement
The original contributions presented in the study are included in the article/supplementary material. Further inquiries can be directed to the corresponding author.
Author contributions
XL: Methodology, Conceptualization, Writing – review & editing, Software, Data curation, Writing – original draft. JZ: Formal Analysis, Writing – review & editing, Methodology, Validation. WL: Data curation, Validation, Writing – review & editing. ZL: Formal Analysis, Investigation, Writing – review & editing. ZY: Validation, Methodology, Writing – review & editing.
Funding
The author(s) declare financial support was received for the research and/or publication of this article. This research was supported by the National Natural Science Foundation of China (Grant No. 51879190).
Conflict of interest
WL is employed by the company China National Offshore Oil Corporation Research Institute CNOOCRI.
The remaining authors declare that the research was conducted in the absence of any commercial or financial relationships that could be construed as a potential conflict of interest.
Generative AI statement
The author(s) declare that no Generative AI was used in the creation of this manuscript.
Any alternative text (alt text) provided alongside figures in this article has been generated by Frontiers with the support of artificial intelligence and reasonable efforts have been made to ensure accuracy, including review by the authors wherever possible. If you identify any issues, please contact us.
Publisher’s note
All claims expressed in this article are solely those of the authors and do not necessarily represent those of their affiliated organizations, or those of the publisher, the editors and the reviewers. Any product that may be evaluated in this article, or claim that may be made by its manufacturer, is not guaranteed or endorsed by the publisher.
References
1
Api. API-RP 2SK (2005). Recommended practice for design and analysis of stationkeeping systems for floating structures. 3rd ed. (Washington: American Petroleum Institution).
2
API. API-RP 2SM (2007). Recommended practice for design, manufacture, installation and maintenance of synthetic fiber ropes for offshore mooring. 1st ed. (Washington: American Petroleum Institution).
3
ASTM, E (2005). Standard practices for cycle counting in fatigue analysis. Am. Soc. Testing Materials Standards, E1049–E1085. doi: 10.1520/E1049-85R11E01
4
Barajas G. Lara J. L. Losada I. J. (2024). Hydrodynamic response of a floating offshore wind turbine using openFOAM.
5
Benabadji A. S. Rahmoun K. Bahar F. A. Dahani A. Martinez A. Iglesias G. (2025). Geospatial LCOE analysis for floating offshore wind energy in SW Mediterranean Sea. Renewable Energy245, 122797. doi: 10.1016/j.renene.2025.122797
6
Chen H. Medina T. A. Cercos-Pita J. L. (2024). CFD simulation of multiple moored floating structures using OpenFOAM: An open-access mooring restraints library. Ocean Eng.303, 117697. doi: 10.1016/j.oceaneng.2024.117697
7
Cheng P. Huang Y. Wan D. (2019). A numerical model for fully coupled aero-hydrodynamic analysis of floating offshore wind turbine. Ocean Eng.173, 183–196. doi: 10.1016/j.oceaneng.2018.12.021
8
Connolly P. Hall M. (2019). Comparison of pilot-scale floating offshore wind farms with shared moorings. Ocean Eng.171, 172–180. doi: 10.1016/j.oceaneng.2018.08.040
9
DNV (2010). Recommended practice DNV-RP-C205, Environmental conditions and environmental loads.
10
DNV (2011). DNV-RP-H103: modelling and analysis of marine operations (HøVik, Norway: Det Norske Veritas).
11
DNV, GL . (2015). Offshore Standard DNVGL-OS-E301 Position Mooring . DNV GL AS.
12
DNV (2020). Floating wind: the power to commercialize (Høvik, Norway). Available online at: https://www.energiesdelamer.eu/wp-content/uploads/2020/12/03_12-020_DNV_GL_Floating_Wind_The_Power_to_Commercialize_FINAL-compresse.pdf.
13
Fontana C. (2019). A multiline anchor concept for floating offshore wind turbines. doi: 10.13140/RG.2.2.21780.22400
14
Goupee A. J. Koo B. J. Kimball R. W. Lambrakos K. F. Dagher H. J. (2014). Experimental comparison of three floating wind turbine concepts. J. Offshore Mechanics Arctic Eng.136, 020906. doi: 10.1115/1.4025804
15
Hall M. (2020). MoorDyn V2: new capabilities in mooring system components and load cases: preprint. Renewable Energy. NREL/CP-5000-76555. https://www.nrel.gov/docs/fy20osti/76555.pdf.
16
Hall M. Connolly P. (2018). “ Coupled Dynamics Modelling of a Floating Wind Farm With Shared Mooring Lines,” in Ocean Renewable Energy, vol. 10. ( American Society of Mechanical Engineers, Madrid, Spain). doi: 10.1115/omae2018-78489
17
Hall M. Goupee A. (2015). Validation of a lumped-mass mooring line model with DeepCwind semisubmersible model test data. Ocean Eng.104, 590–603. doi: 10.1016/j.oceaneng.2015.05.035
18
Hall M. Lozon E. Housner S. Sirnivas S. (2022). Design and analysis of a ten-turbine floating wind farm with shared mooring lines. J. Phys.: Conf. Ser.2362, 12016. doi: 10.1088/1742-6596/2362/1/012016
19
Hsu W. Thiagarajan K. P. Manuel L. (2017). Extreme mooring tensions due to snap loads on a floating offshore wind turbine system. Mar. Structures55, 182–199. doi: 10.1016/j.marstruc.2017.05.005
20
Huang J. Xu H. Chen L. Lin K. Guo M. Yang M. et al . (2024). Analysis of mooring performance and layout parameters of multi-segment mooring system for a 15 MW floating wind turbine. Front. Energy Res.12. doi: 10.3389/fenrg.2024.1502684
21
James R. Ros M. C. (2015). Floating offshore wind: market and technology review ( The Carbon Trust). Available online at: https://questfwe.com/wp-content/uploads/2018/02/The-Carbon-Trust-2015-floating-offshore-wind-market-technology-review.pdf.
22
Jonkman J. (2010). Definition of the floating system for phase IV of OC3 (Golden, CO (United States: National Renewable Energy Laboratory (NREL). doi: 10.2172/979456
23
Jonkman J. Butterfield S. Musial W. Scott G. (2009). Definition of a 5-MW reference wind turbine for offshore system development ( Golden, CO: National Renewable Energy Laboratory (NREL). doi: 10.2172/947422
24
Li H. Bachynski E. E. (2021). Experimental and numerical investigation of nonlinear diffraction wave loads on a semi-submersible wind turbine. Renewable Energy171, 709–727. doi: 10.1016/j.renene.2021.02.152
25
Lian Y. Boamah S. O. Pan Z. Zheng J. Chen W. Ma G. et al . (2024). Engineering design and economic analysis of offshore seaweed farm. Front. Mar. Sci.11. doi: 10.3389/fmars.2024.1276552
26
Liang G. Jiang Z. Merz K. (2021). Mooring analysis of a dual-spar floating wind farm with a shared line. J. Offshore Mechanics Arctic Eng.143(6):062003. doi: 10.1115/1.4050965
27
Liang G. Lopez-Olocco T. Medina-Manuel A. Saavedra-Ynocente L. A. Souto-Iglesias A. Jiang Z. (2024a). Experimental investigation of two shared mooring configurations for a dual-spar floating offshore wind farm in irregular waves. Mar. Structures95, 103579. doi: 10.1016/j.marstruc.2024.103579
28
Liang G. Merz K. Jiang Z. (2020). “ Modeling of a Shared Mooring System for a Dual-Spar Configuration,” in Ocean Renewable Energy, vol. 9. ( Virtual, Online: American Society of Mechanical Engineers). doi: 10.1115/omae2020-18467
29
Liang G. Wickmann Hanssen F. Otto Merz K. Jiang Z. (2024b). Numerical analysis of a tethered-buoy mooring system for a prototype floating wind farm. Wind Energy27, 500–529. doi: 10.1002/we.2898
30
Liu Z. Zhao J. Lin X. (2024). Effects of mooring line failure on semi-submersible wind turbine and the study of its mitigation measures. Ocean Eng.311, 118889. doi: 10.1016/j.oceaneng.2024.118889
31
Lopez-Olocco T. Liang G. Medina-Manuel A. Ynocente L. S. Jiang Z. Souto-Iglesias A. (2023). Experimental comparison of a dual-spar floating wind farm with shared mooring against a single floating wind turbine under wave conditions. Eng. Structures292, 116475. doi: 10.1016/j.engstruct.2023.116475
32
Munir H. Lee C. F. Ong M. C. (2021). Global analysis of floating offshore wind turbines with shared mooring system. IOP Conf. Ser.: Mater. Sci. Eng.1201, 12024. doi: 10.1088/1757-899x/1201/1/012024
33
Revel D. (2012). Renewable energy technologies: cost analysis series. Available online at: https://globalccsinstitute.com/archive/hub/publications/138178/hydropower.pdf (Accessed July 19, 2025).
34
Rivera-Arreba I. Bruinsma N. Bachynski E. E. Viré A. Paulsen B. T. Jacobsen N. G. (2019). Modeling of a semisubmersible floating offshore wind platform in severe waves. J. Offshore Mechanics Arctic Eng.141, 061905. doi: 10.1115/1.4043942
35
Ross A. McKinnon G. (2018). Ltd - Orcina Project 1405 Wind Turbine Validation Report.
36
SK A. R. P. (2005). Design and analysis of stationkeeping systems for floating structures. Available online at: https://img.antpedia/standard/files/pdfs_ora/20240220/API%20RP%202SK-2024.pdf (Accessed July 19, 2025).
37
Wang X. Cai C. Cai S.-G. Wang T. Wang Z. Song J. et al . (2023). A review of aerodynamic and wake characteristics of floating offshore wind turbines. Renewable Sustain. Energy Rev.175, 113144. doi: 10.1016/j.rser.2022.113144
38
Wang Y. Wolgamot H. Watson P. Gaudin C. Zhao W. Milne I. (2022). “ Preliminary Investigation of a Shared Mooring Arrangement for a Floating Offshore Wind Turbine Farm in Deep Water,” in Ocean Renewable Energy, vol. 8. ( American Society of Mechanical Engineers, Hamburg, Germany). doi: 10.1115/omae2022-81245
39
Wilson S. Hall M. Housner S. Sirnivas S. (2021). Linearized modeling and optimization of shared mooring systems. Ocean Eng.241, 110009. doi: 10.1016/j.oceaneng.2021.110009
40
Xu W. Zhang X. Sun Y. He Z. (2025). Hydrodynamic characteristics and technoeconomic analysis of floating photovoltaic arrays considering different mooring forms. Ocean Eng.320, 120288. doi: 10.1016/j.oceaneng.2025.120288
41
Yamamoto S. Colburn W. (2006). Power generation assemblies, and apparatus for use therewith, US8578586B2. Available online at: https://image-ppubs.uspto.gov/dirsearch-public/print/downloadPdf/7293960 (Accessed July 19, 2025).
42
Yu S. Ransley E. Qian L. Zhou Y. Brown S. Greaves D. et al . (2025). Modelling the hydrodynamic response of a floating offshore wind turbine – a comparative study. Appl. Ocean Res.155, 104441. doi: 10.1016/j.apor.2025.104441
43
Zhang L. Shi W. Karimirad M. Michailides C. Jiang Z. (2020). Second-order hydrodynamic effects on the response of three semisubmersible floating offshore wind turbines. Ocean Eng.207, 107371. doi: 10.1016/j.oceaneng.2020.107371
44
Zheng C. (2014). Meticulous simulation of seasonal characteristics of the China sea wave period. AMS01, 44–49. doi: 10.12677/AMS.2014.12007
45
Zou Q. Lu Z. Shen Y. (2023). Short-term prediction of hydrodynamic response of a novel semi-submersible FOWT platform under wind, current and wave loads. Ocean Eng.278, 114471. doi: 10.1016/j.oceaneng.2023.114471
Summary
Keywords
shared mooring, clump weight, buoy, floating wind farm, dynamic response
Citation
Lin X, Zhao J, Liang W, Liu Z and Yu Z (2025) Mechanical performance analysis of a dual-spar floating wind farm considering different shared mooring systems. Front. Mar. Sci. 12:1676282. doi: 10.3389/fmars.2025.1676282
Received
30 July 2025
Accepted
01 October 2025
Published
20 October 2025
Volume
12 - 2025
Edited by
Debabrata Karmakar, National Institute of Technology, India
Reviewed by
Gabriel Barajas, Environmental Hydraulics Institute (IHCantabria), Spain; Lucas Do Vale Machado, Universidade Federal do Rio de Janeiro Incubadora de Empresas da Coppe, Brazil
Updates
Copyright
© 2025 Lin, Zhao, Liang, Liu and Yu.
This is an open-access article distributed under the terms of the Creative Commons Attribution License (CC BY). The use, distribution or reproduction in other forums is permitted, provided the original author(s) and the copyright owner(s) are credited and that the original publication in this journal is cited, in accordance with accepted academic practice. No use, distribution or reproduction is permitted which does not comply with these terms.
*Correspondence: Jingrui Zhao, zjr@ytu.edu.cn
Disclaimer
All claims expressed in this article are solely those of the authors and do not necessarily represent those of their affiliated organizations, or those of the publisher, the editors and the reviewers. Any product that may be evaluated in this article or claim that may be made by its manufacturer is not guaranteed or endorsed by the publisher.