Abstract
The rapid growth of marine imaging has outpaced our ability to efficiently analyse the imagery, creating challenges in data management, collaboration, and standardisation. This paper presents Squidle+, a web-based, collaborative platform for the end-to-end management, delivery, discovery, and annotation of marine imagery. Squidle+ provides a centralised portal and annotation repository while linking to imagery hosted on pre-existing cloud storage, eliminating data transfer and duplication. The system features a user-friendly interface with map-based exploration tools, advanced annotation workflows, and integrated analytics through a comprehensive API back-end. Collaboration is managed through user groups with granular permissions, while integrated QA/QC tools enable cross-validation between human annotators and Machine Learning (ML) algorithms. A key innovation is a framework to translate between multiple standardised or user-defined annotation vocabularies. This gives users the flexibility to construct data sets that target specific scientific questions and facilitates data reuse, cross-project syntheses, large-scale ML training, and broad summaries that can be fed into national-level reporting. Squidle+ has been developed in close collaboration with an active user community and currently contains datasets from several platforms and operators around the world. It is currently the largest known repository of openly accessible georeferenced marine images with associated annotations. Squidle+ streamlines complex workflows and significantly enhances the Findability, Accessibility, Interoperability, and Reusability (FAIR) of marine image data.
1 Introduction
Underwater optical imaging has become an essential tool for studying and managing the world’s oceans. It is commonly used for scientific exploration and characterisation from the shallows to the abyss (Zintzen et al., 2017), to inform the designation and assessment of marine protected areas (Goetze et al., 2021), establish environmental baselines (Marsh et al., 2013), and assess human impacts (Bosch et al., 2022), including climate change (Stuart-Smith et al., 2022). However, the rapid collection of imagery has outpaced our ability to efficiently extract useful information and insights from it (Williams et al., 2019). In this context, imagery refers broadly to still photographs, video footage, and derived products such as orthomosaics and photogrammetric reconstructions (although annotation support for these derived products is not widely supported).
A variety of annotation tools have been developed for marine imagery, including desktop applications such as NICAMS (NIWA Image Capture and Management System), VARS (Video Annotation and Reference System; Schlining and Stout, 2006), TransectMeasure (SeaGIS Pty Ltd), EventMeasure (SeaGIS Pty Ltd), and VIDLIB (Marcon et al., 2015), as well as web-based platforms like CoralNet (Beijbom et al., 2015), ReefCloud (Australian Institute of Marine Science (AIMS), 2022), and BIIGLE 2.0 (BioImage Indexing, Graphical Labeling, and Exploration; Langenkämper et al., 2017). All of these tools allow annotators to delineate regions or points in images and assign morphological or taxonomic labels. However, centralised, web-based platforms provide additional advantages, including remote collaboration, integrated data access, and streamlined workflows.
While these centralised, web-based platforms have developed specialised capabilities, most focus primarily on annotation rather than broader data management and discovery, except for ReefCloud, which is dedicated specifically to coral reef monitoring. Squidle+, by contrast, extends beyond annotation to provide a comprehensive portal for the end-to-end management, discovery, annotation, and reuse of marine image data, regardless of the collection method, ecosystem, data formats or project goals. It is media-type agnostic, meaning that it can be used for stills, video and derived data products (like orthomosaics). Its exploration and preparation tools enable spatial and temporal querying and subsetting of survey imagery for detailed annotation within the same interface. Through integration with existing cloud storage repositories, Squidle+ accelerates imagery and annotation delivery to end-users and standardises outputs across operators, institutions, and projects. It supports granular access control and sharing permissions to facilitate collaboration and offers extensive integration options, all contributing to the Findability, Accessibility, Interoperability, and Reusability (FAIR) of marine image data.
Increasingly, annotation tools are offering automated labelling using Machine Learning (ML), but the ML outputs are typically limited to the trained models and algorithms provided by the annotation tool backend, making it challenging to deploy custom algorithms for specific purposes. Squidle+ distinguishes itself by providing a framework for ML researchers to develop and integrate various algorithms. It is easy for any ML researcher to deploy and operationalise trained models, connecting them with end users who can both benefit from the outputs and help validate model performance. This facilitates cross-disciplinary collaboration and ensures that the ML capabilities remain contemporary with the state-of-the-art.
This architecture also allows the incorporation of ML models from other open-source initiatives, like FathomNet, which strives to aggregate images from multiple sources to create a publicly available, curated underwater image training database (Katija et al., 2022). Initiatives like this will be instrumental in generating momentum behind the development of state-of-the-art ML algorithms, but even these curated databases are fraught with challenges resulting from a lack of standardisation between available datasets.
A challenge when working with annotation data from disparate groups and projects is the variability in the vocabularies used to annotate the imagery. Imposing a single standardised vocabulary is impractical, in many scenarios, as different scientists have unique needs and projects. Enforcing a single standardised vocabulary is too restrictive for many scenarios, and tends to inadvertently drive users towards a splintered/bespoke approach to data analysis, using other tools that provide the flexibility they want (Figure 1). In practice, there is little to no standardisation between the vocabularies used for annotation and these can sometimes vary within groups from project to project. This diversity poses a considerable barrier to data reuse, syntheses between projects and the large-scale training of ML algorithms, and has persistently been identified as a major challenge (Przeslawski et al., 2018).
Figure 1
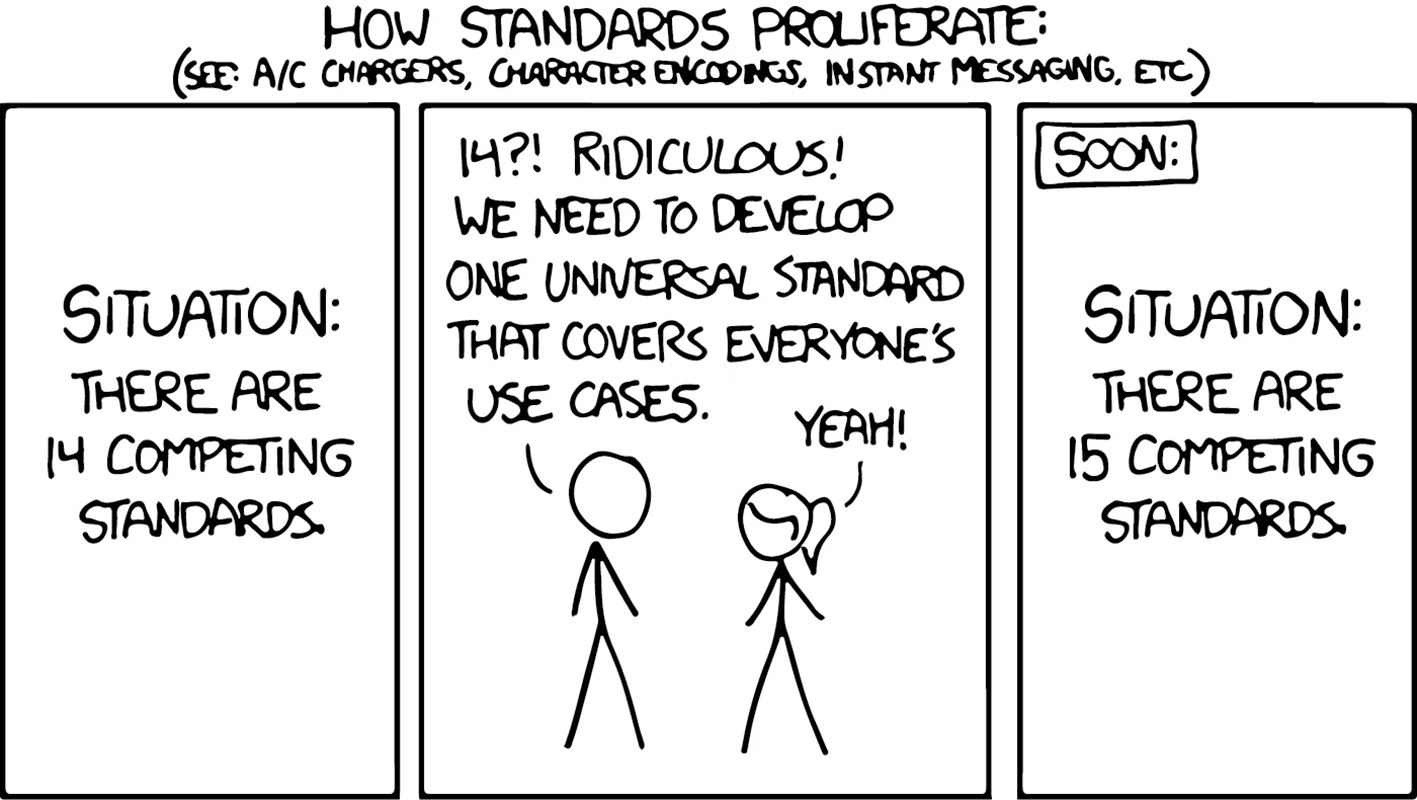
“Standards” from XKCD by Randall Munroe (https://xkcd.com/927, CC BY-NC 2.5).
Squidle+ addresses this challenge by supporting multiple vocabularies that can be standardised using an underlying translation framework. This allows users to export data in their preferred vocabulary and reduces the barriers associated with reusing data across projects for synthesis and ML model training. It can also collapse fine-resolution labels (e.g., specific species or substrata facies) to higher-level indicator groupings for management and decision-making purposes, and national or global reporting. For example, Australia’s State of the Environment (SoE) reports (Trebilco et al., 2021), Australian National Marine Science Committee (Hedge et al., 2022), United Nations World Ocean Assessment (United Nations, 2021), and the Global Ocean Observing System (Miloslavich et al., 2018; Muller-Karger et al., 2018) have identified a set of indicators to monitor the state of the ocean and its ecosystems. Traditionally, obtaining these broad indicator-level groupings from the varied fine resolution labels across different vocabularies was a significant and arduous undertaking, however, the translation framework built into Squidle+ provides these outputs directly by seamlessly collapsing up the labels to higher-level groupings, regardless of the resolution of the original annotations or the vocabularies that were used (refer to Sections 2.5 and 3.4).
Squidle+ solves several problems with existing approaches, offering distinct advantages for:
-
Platform operators and data custodians: Streamlined ingestion of survey data enables decoupling of collection and delivery of data. Platform operators and data custodians can manage their respective online repositories, and with appropriate integration, those datasets can automatically be imported into Squidle+. This simplifies and expedites survey data delivery, avoiding the need to upload, archive and distribute datasets through separate channels.
-
Individual annotators: Expedited data delivery, map-based exploration and query tools, allow annotators to easily and quickly discover datasets and create subsets based on metadata properties such as space and time. They can then analyse these subsets using the integrated full-fledged annotation interface, with access to associated plug-ins, like ML algorithms, automated image segmentation processes and other tools.
-
Annotation teams and collaborators: Geographically dispersed scientists can effectively collaborate through centralised, shared annotations, control over access rights, and the implementation of advanced quality control in their collaborative workflows.
-
Users of the annotation outputs: From summaries and reporting tools, through to the large-scale training of ML algorithms, the automated translation between annotation schemes, streamlined synthesis and a comprehensive backend for flexible querying, filtering, dynamic reporting and exporting of data, ensure that the utility of the annotations can be extended beyond their original purpose.
-
Managers, policy decision-makers and traditional owners: The comprehensive backend, vocabulary translational tools and spatial context of data products enable the direct, seamless integration into high-level reporting and dashboard-style interfaces (e.g., Seamap Australia State-of-Knowledge Reports; Lucieer et al., 2024) to assist with management and policy decision-making, and the development of communication products for traditional owner groups and the wider community.
-
Third-party data consumers and portals: Standard mapping outputs and the documented comprehensive API helps to facilitate third-party integration into external data portals and interfaces.
The Squidle+ platform is unique in its system architecture by providing a collaborative, centralised web-based marine image data management, discovery and annotation platform that offers advanced workflows for analysing marine imagery. The comprehensive Application Programming Interface (API) provides end-points to create, edit and retrieve data, as well as provide access to processed data products in standardised formats. By addressing the challenges of vocabulary variation and enabling flexible ML integration, Squidle+ is a versatile platform that enhances the efficiency and effectiveness of marine image data management, annotation, and analysis. With tools for spatial and temporal subsetting of survey imagery built into the online interface, as well as the integration with existing data storage repositories to automatically import survey imagery, marine image data contributors and custodians can focus on managing their online data storage repository, which will seamlessly be made available for down-stream analysis by users of the imagery. This expedites the delivery of survey imagery and annotations to end-users. This coupled with built-in provisions for configuring granular access and sharing permissions, facilitates collaboration and promotes FAIR principles by addressing the challenges of discovery and sharing of annotated imagery data with a diverse group of users and stakeholders (Wilkinson et al., 2016; Schoening et al., 2022). By conforming to the FAIR principles, Squidle+ extends the utility of marine imagery data beyond its initial purpose, promoting scientific research and management efforts in the study and conservation of the world’s oceans. Squidle+ underpins Australia’s Integrated Marine Observing System’s (IMOS) Understanding Marine Imagery (UMI) initiative. While developed in support of Australian efforts, the platform is globally accessible and actively expanding to support international datasets, users, and repositories.
2 Methods
This section provides an overview of the system design, outlining various workflow aspects including annotation, sharing and collaboration, validation and quality control, and how ML integration is handled. It also shows how datasources are defined and ingested from cloud storage and how datasets are exported. Finally, it provides an overview of the system architecture. For more detailed information on the data models and term definitions, please refer to Section S1 in the supplementary material.
2.1 Annotation workflow & tools
Squidle+ offers flexibility in annotation workflows and different annotation modes (e.g., whole-frame, points, polygons, bounding boxes, multiple labels per annotation with tags and comments), and is designed to be media-type agnostic (i.e., the same annotation framework can be used for images, videos, large scale mosaics, stereo images, transect quadrats and more through the definition of media interpreter plugins). Integrated quality assurance/quality control (QA/QC) tools and cross-validation between annotators enable human-human and human-algorithm cross-checking and validation. The main components required for setting up a dataset for annotation and processing are:
-
Media Collection: this is a user-defined collection of Media Objects grouped for further analysis. It can be built based on filters in the map-based explore tools to create a subset of Media Objects from one or more Deployments. A Media Object can only exist in one Deployment, but can be linked to more than one Media Collection.
-
Annotation Set: this defines how to annotate the Media Collection (i.e., the annotation method, parameters and Label Scheme to be used). The Annotation Set captures additional information, like QA/QC status, labelling objective (i.e., is it full-biodiversity scoring or targeted scoring) and dataset objective (i.e., is it intended for science purposes, or for education and training). These properties are important quality metrics when considering data reuse and sharing. A Media Collection can have more than one associated Annotation Set. This allows users to define multiple sets of Annotations on the same set of Media Objects. Annotation Sets can also be linked to each other as supplementary Annotation Sets, allowing them to be validated against each other (see Section 2.4).
-
Label Scheme: this defines the list of controlled vocabulary/concepts (i.e., Labels) that will be used on an Annotation Set. There are multiple Label Schemes - users can select one of the standardised Label Schemes, define new ones or extend existing ones. Label Schemes can be flat or hierarchical in structure.
-
Annotations, Points & Labels: Annotations bind Labels to Points within Media Objects. They define a link between a Point, which is a localisation within a Media Object, and associate it with one or more Labels. Annotations and Points have a variety of properties, including (but not limited to):
-
x, y, t: the x-y location of a Point within a frame, and in the case of video, t denotes the temporal location within the file (runtime or frame number) for the Annotation.
-
Point layout controls: several different mechanisms for point layouts are supported. An annotator can choose to manually create targeted points, or select from one of the point layout methods, including:
-
N-random points;
-
Regular NxM grid (with optional grid lines);
-
5-point quincunx pattern; or
-
N-random points in a circular distribution (for dealing with illumination patterns).
-
-
Annotation margins: it is possible to define margin parameters that constrain the point layout methods to specific regions of the image. For example, if an oblique forward-facing camera shows half-scorable benthos and the top half is water column, an annotator can apply a margin to constrain all points to the bottom half of the frame.
-
Polygon or Bounding box: a list of vertices associated with a Point to define a bounding box or polygon.
-
Comment: a free-form text entry that can be associated with an Annotation.
-
Tags: each Annotation can be associated with multiple Tags. Tags can be thought of as modifiers that can be applied to any Annotation across all Label Schemes. They can be useful to capture additional attributes, like “Bleached” or “Dead” or “Interesting”, which, if included, each Label Scheme could result in a large number of redundant additional Labels to capture all possible combinations.
-
Likelihood: a parameter defining the uncertainty of the Label assigned to an Annotation. This is available for ML and for human user inputs to convey how much confidence they have in the label that is applied. It can also be used to prioritise suggestions from multiple annotators.
-
h. Needs Review: a flag denoting the Label assigned to an Annotation requires review. This is an important QA/QC tool for multi-annotator cross-validation (see Section 2.4 for more information). Collaborators can quickly find all the Annotations that require review and quickly confirm or assign corrections.
-
i. Linked Observations: Annotations can also be linked between frames. This allows users to capture additional observations of the same object without double-counting. It can also be used to capture tracking of an object between successive keyframes (e.g., in video).
-
j. Targeted or Generated: a flag denoting whether the Point was manually created by the user, targeting a specific object, or if it was auto-generated by a point layout method. This helps when using Point labels for percent cover estimation in dealing with possible sampling biases from targeted points.
-
k. Multi-Labels: a Point can have multiple Annotations, each with their own Label. This allows users to optionally capture additional attributes. For example, if a user wished to log both the substrata and biota for a given Point.
-
l. Label Suggestions: each Point can also include suggested annotations, which are not part of the main Annotation Set, but show upon hover of each point. This can be used to receive suggestions from another user, whether human or ML, and it is also possible to validate against these suggestions.
-
m. Label Synonyms: through the semantic translation framework (explained in Section 2.5), it is possible to optionally search by Label names in other mapped Label Schemes, and also by common names or scientific names, as defined by the Vocab Elements.
-
2.2 Sharing & collaboration between users
A comprehensive, feature-rich user group framework enables the sharing, collaboration and release of datasets, allowing for granular permissions (with optional user agreements), permissions to modify and validate annotations collaboratively (with traceable authorship and attribution) and mechanisms for the public release of data. Users can create sharing groups with the following properties:
-
Data Usage Agreement (DUA): an option to include a DUA. If provided, and the “require agreement” option is activated, members will need to agree to the terms of the linked document before they can access data shared in this group.
-
Public: an option to make datasets shared in a group publicly viewable (read-only) to all users (including non-Group members). Group members can still be selectively granted edit permissions.
-
Restrict data visibility: an option to restrict the visibility of shared data in a group. Members will only see their own datasets and will not be able to see datasets shared by other members. Custodians will be able to see all shared datasets. This can be useful when managing data from lots of different contributors who do not want to share data between them or for automated labelling services where a user may share a dataset with an algorithm’s group for training or automated labelling input, but may not wish to share it with all the other users who are members of that group.
-
Require agreement: an option to enforce the DUA, defined above. Members will be required to agree to usage terms before accessing shared data.
-
Require custodian approval: an option to prevent members from adding other members without approval. All added members will need to be approved by the group custodian and will not have access until approved. If left unchecked, members with the relevant permission can add other members without approval.
In addition to the group properties above, users can be added to a group with granular permissions, like whether they can edit shared datasets or are just read-only, and whether they can add datasets and/or new members. If a member has permission to add other members, they will only be able to assign permissions lower than or equal to their own permission level.
2.3 Automated labelling using ML algorithms
There is a substantial API underpinning Squidle+ that facilitates interaction with the data using a user’s API authentication token. In a similar way that data can be shared, collaborated on and validated between human users (as explained above in Section 2.2), ML algorithms can be set up as “users” of the system and can obtain labelled training datasets, or assist human users in their analysis on datasets that they have been granted access to through the same sharing framework. This architecture makes it possible to offer a variety of different externally (or internally) developed automated processing pipelines. It is possible to integrate traditional supervised ML algorithms, and through the QA/QC and collaboration tools. It is also possible to facilitate Active Learning workflows, which involve an algorithm prompting a human to interactively review Annotations, with iterative training cycles to maximise ML performance, while minimising the amount of human input. Traditionally, annotation tools that offer automation are most often wedded to a particular internal ML pipeline that is “baked” into the backend. In this architecture, each ML researcher or ML service provider can be in charge of administering their ML integrations. This does not preclude the offering of internally provided ML capabilities, but provides greater opportunity for cross-disciplinary collaborations and access to bleeding-edge developments in ML research. Handling algorithms as “users” provides a large degree of flexibility and connects independent ML researchers to real-world ML problems with validated training data, and conversely, provides the marine science user community with access to deployed algorithms that can help bootstrap their analyses. The SQAPI library (Friedman 2023, Section 3.3.1) and the SQBot repository (Friedman et al., 2024, Section 3.3.2) have been built to streamline the deployment of ML integration and make it relatively straightforward to operationalise ML algorithms into the Squidle+ API.
2.4 Validation & quality control
Validation is an important step in controlling the quality of the data that is captured, and transparency and standardisation of the QA/QC process is essential in facilitating dataset reuse and synthesis. There are various mechanisms for validation that are supported by the system:
-
Flag for review: an Annotation property that allows a user to flag it for review. This feature helps ensure high-quality annotation standards by allowing all Annotations that require review to be quickly found. It can also be used by an algorithm to request input on Label predictions that it is unsure about (low probabilities). In an interactive training and validation cycle, this can be used to facilitate active learning.
-
Label Exemplar images: Label Scheme editors can define exemplar Annotations for each Label. Users can quickly verify their Annotations by referring to exemplar sample images for each Label. This helps improve the quality of the Annotations and also facilitates training (see Figures 2b, 3).
-
Supplementary Annotations: A Supplementary Annotation Set can be defined to associate a separate set of Annotations with the same Points contained in a base Annotation Set. Supplementary Annotations appear as Label suggestions for a given Point and can be used to quickly review, assign or correct suggestions. Supplementary Annotations make it possible to cross-validate labels between different users, whether it be human-to-human or human-to-algorithm.
-
Labelling objective: an Annotation Set property that captures its intended objective, i.e., whether the labelling is using the full Label Scheme (full biodiversity scoring) or whether it is only using part of the Label Scheme (targeted scoring). This is important when considering the Annotations for reuse, since the labelling objective can influence whether or not a particular dataset is fit for purpose.
-
Dataset purpose: an Annotation Set property that captures whether it was intended for science purposes, or if it is for experimentation and/or training. This is an important quality indicator that allows filtering out of poor quality or experimental labels.
-
Dataset status: an Annotation Set property that captures whether it has been finalised and completed or is still a work in progress. This helps users to understand if the Annotations are stable or likely to keep changing while they are being worked on.
-
QA/QC status: an Annotation Set property that captures whether or not it has been QA/QC’d and/or reviewed. This helps users to ensure the validity of the Annotations.
-
Validation reports: for Annotation Sets containing Supplementary Annotations, the system generates validation reports that include key performance metrics such as confusion matrices, accuracy, precision, recall, and F1-score. These reports enable a quantitative comparison of labels between different human annotators or between humans and ML algorithms, helping to assess agreement, identify discrepancies, and transparently evaluate model performance.
Figure 2
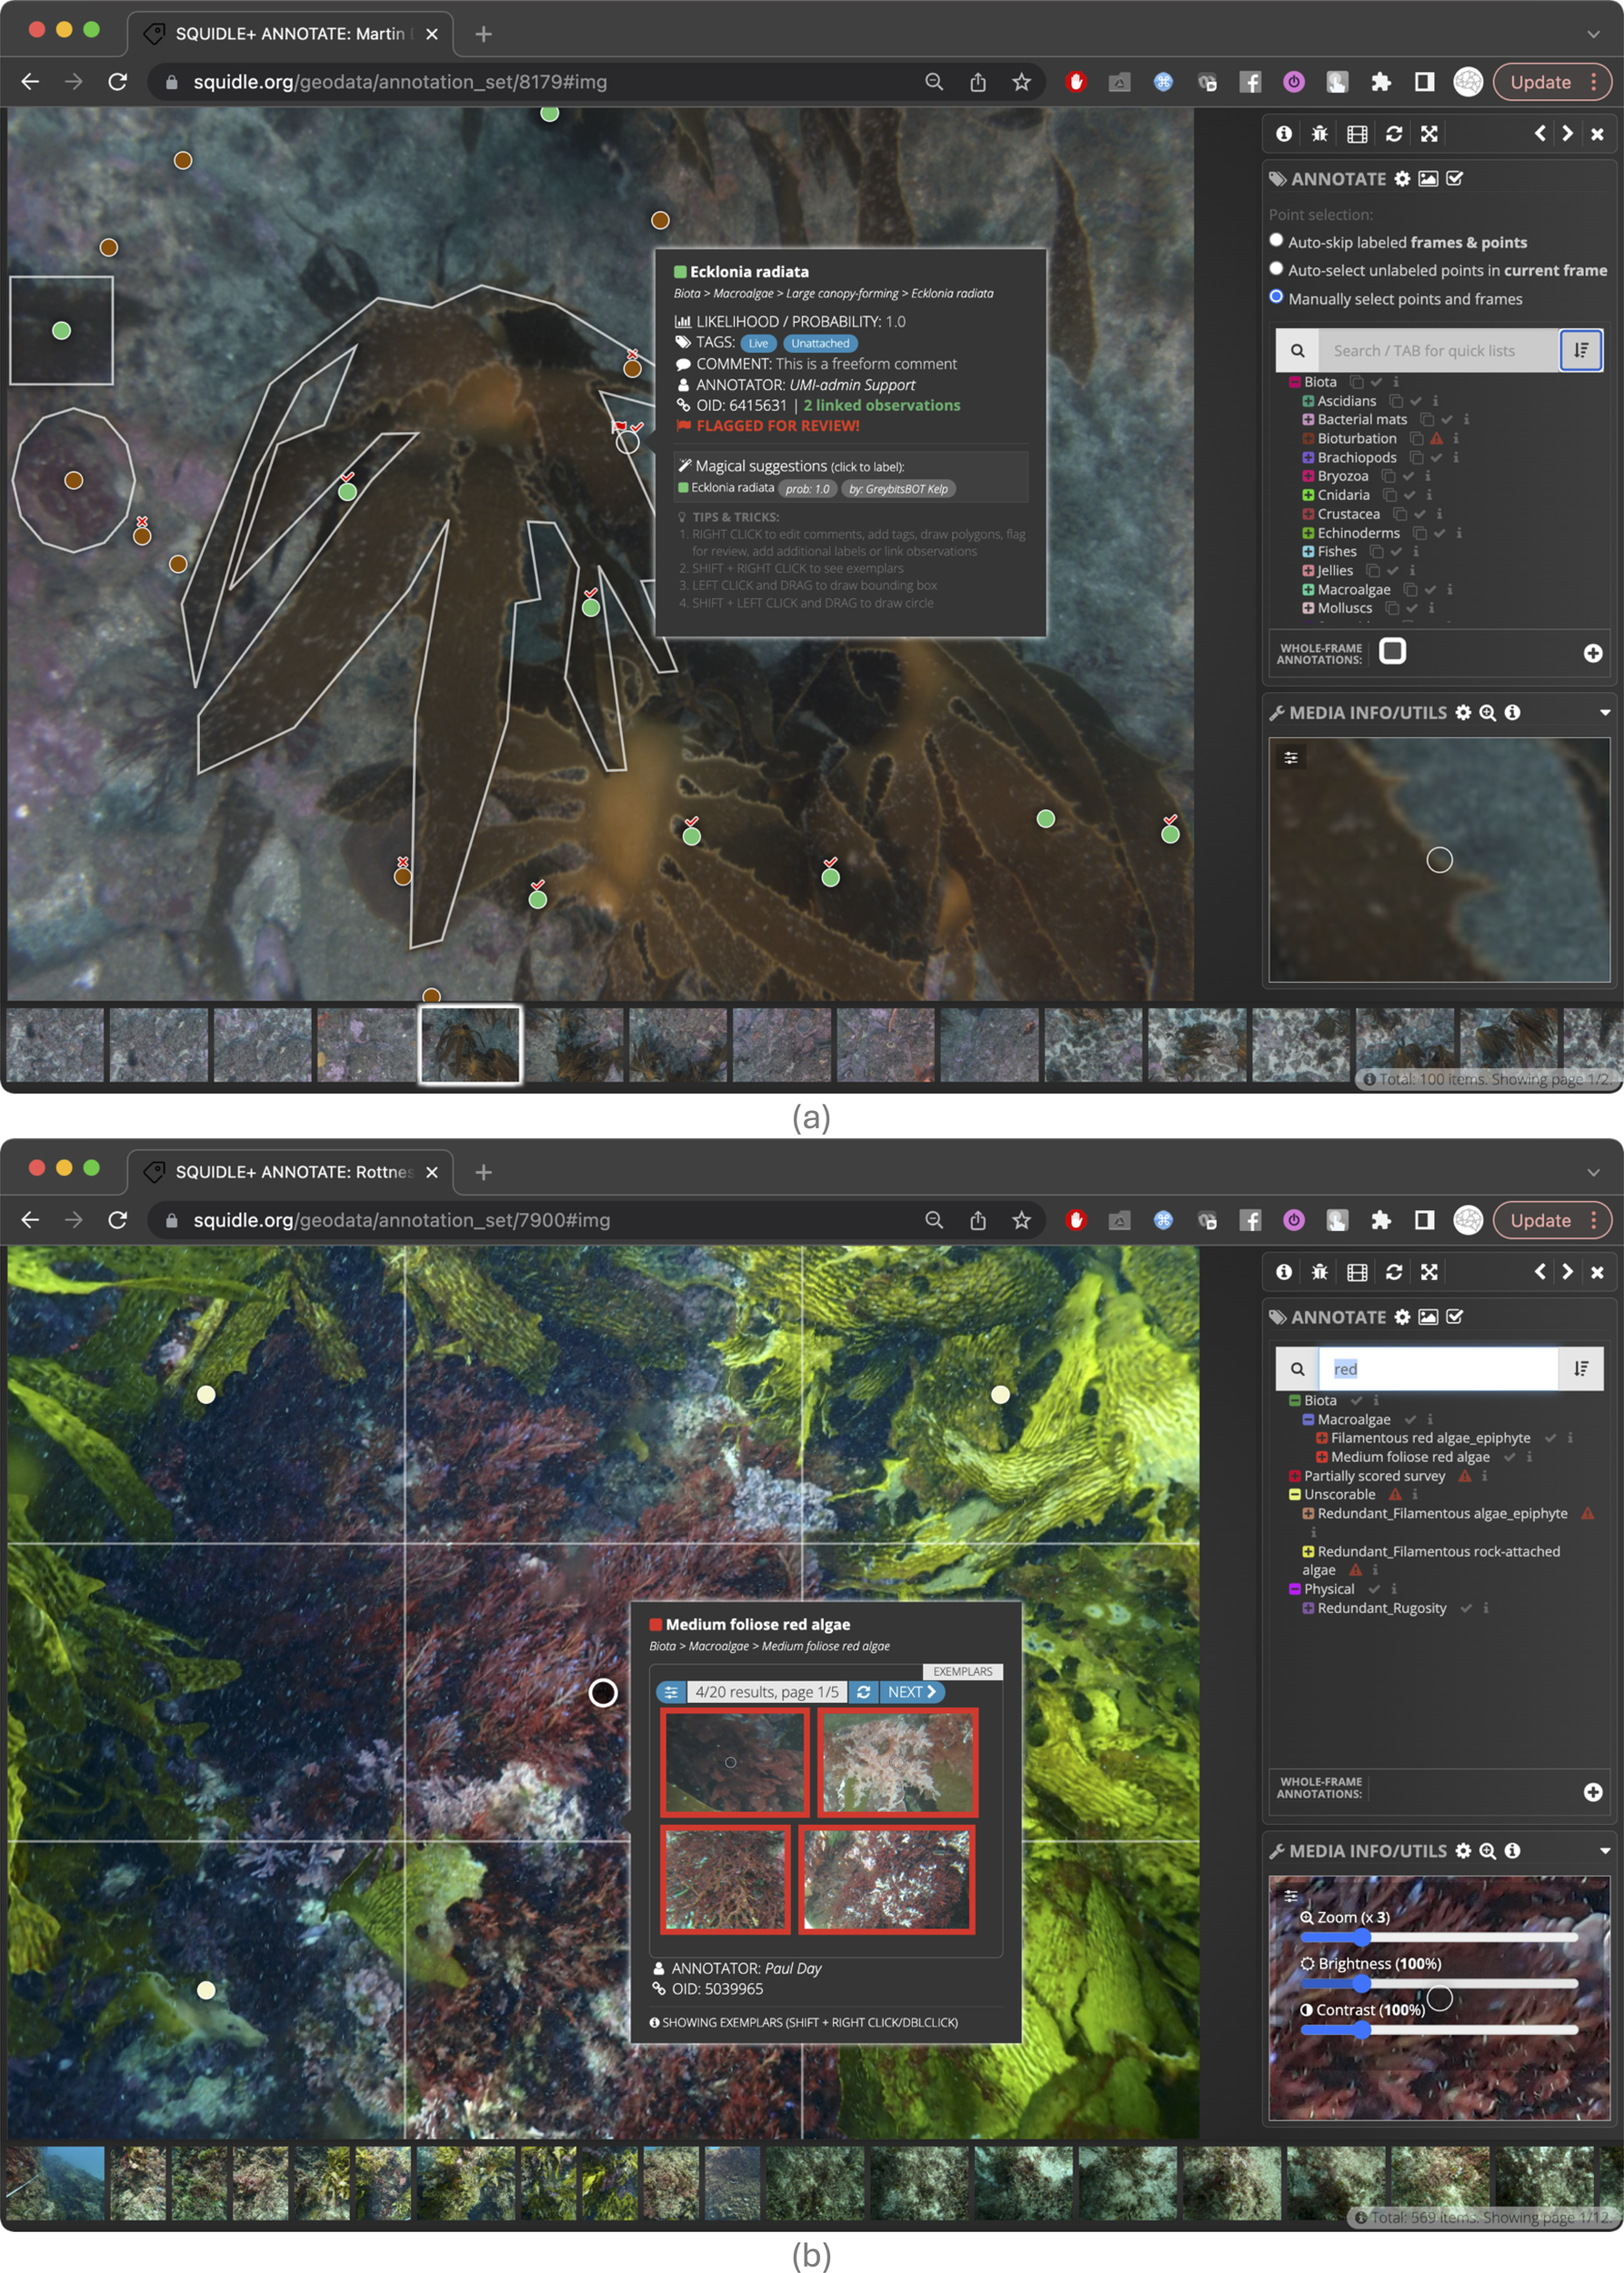
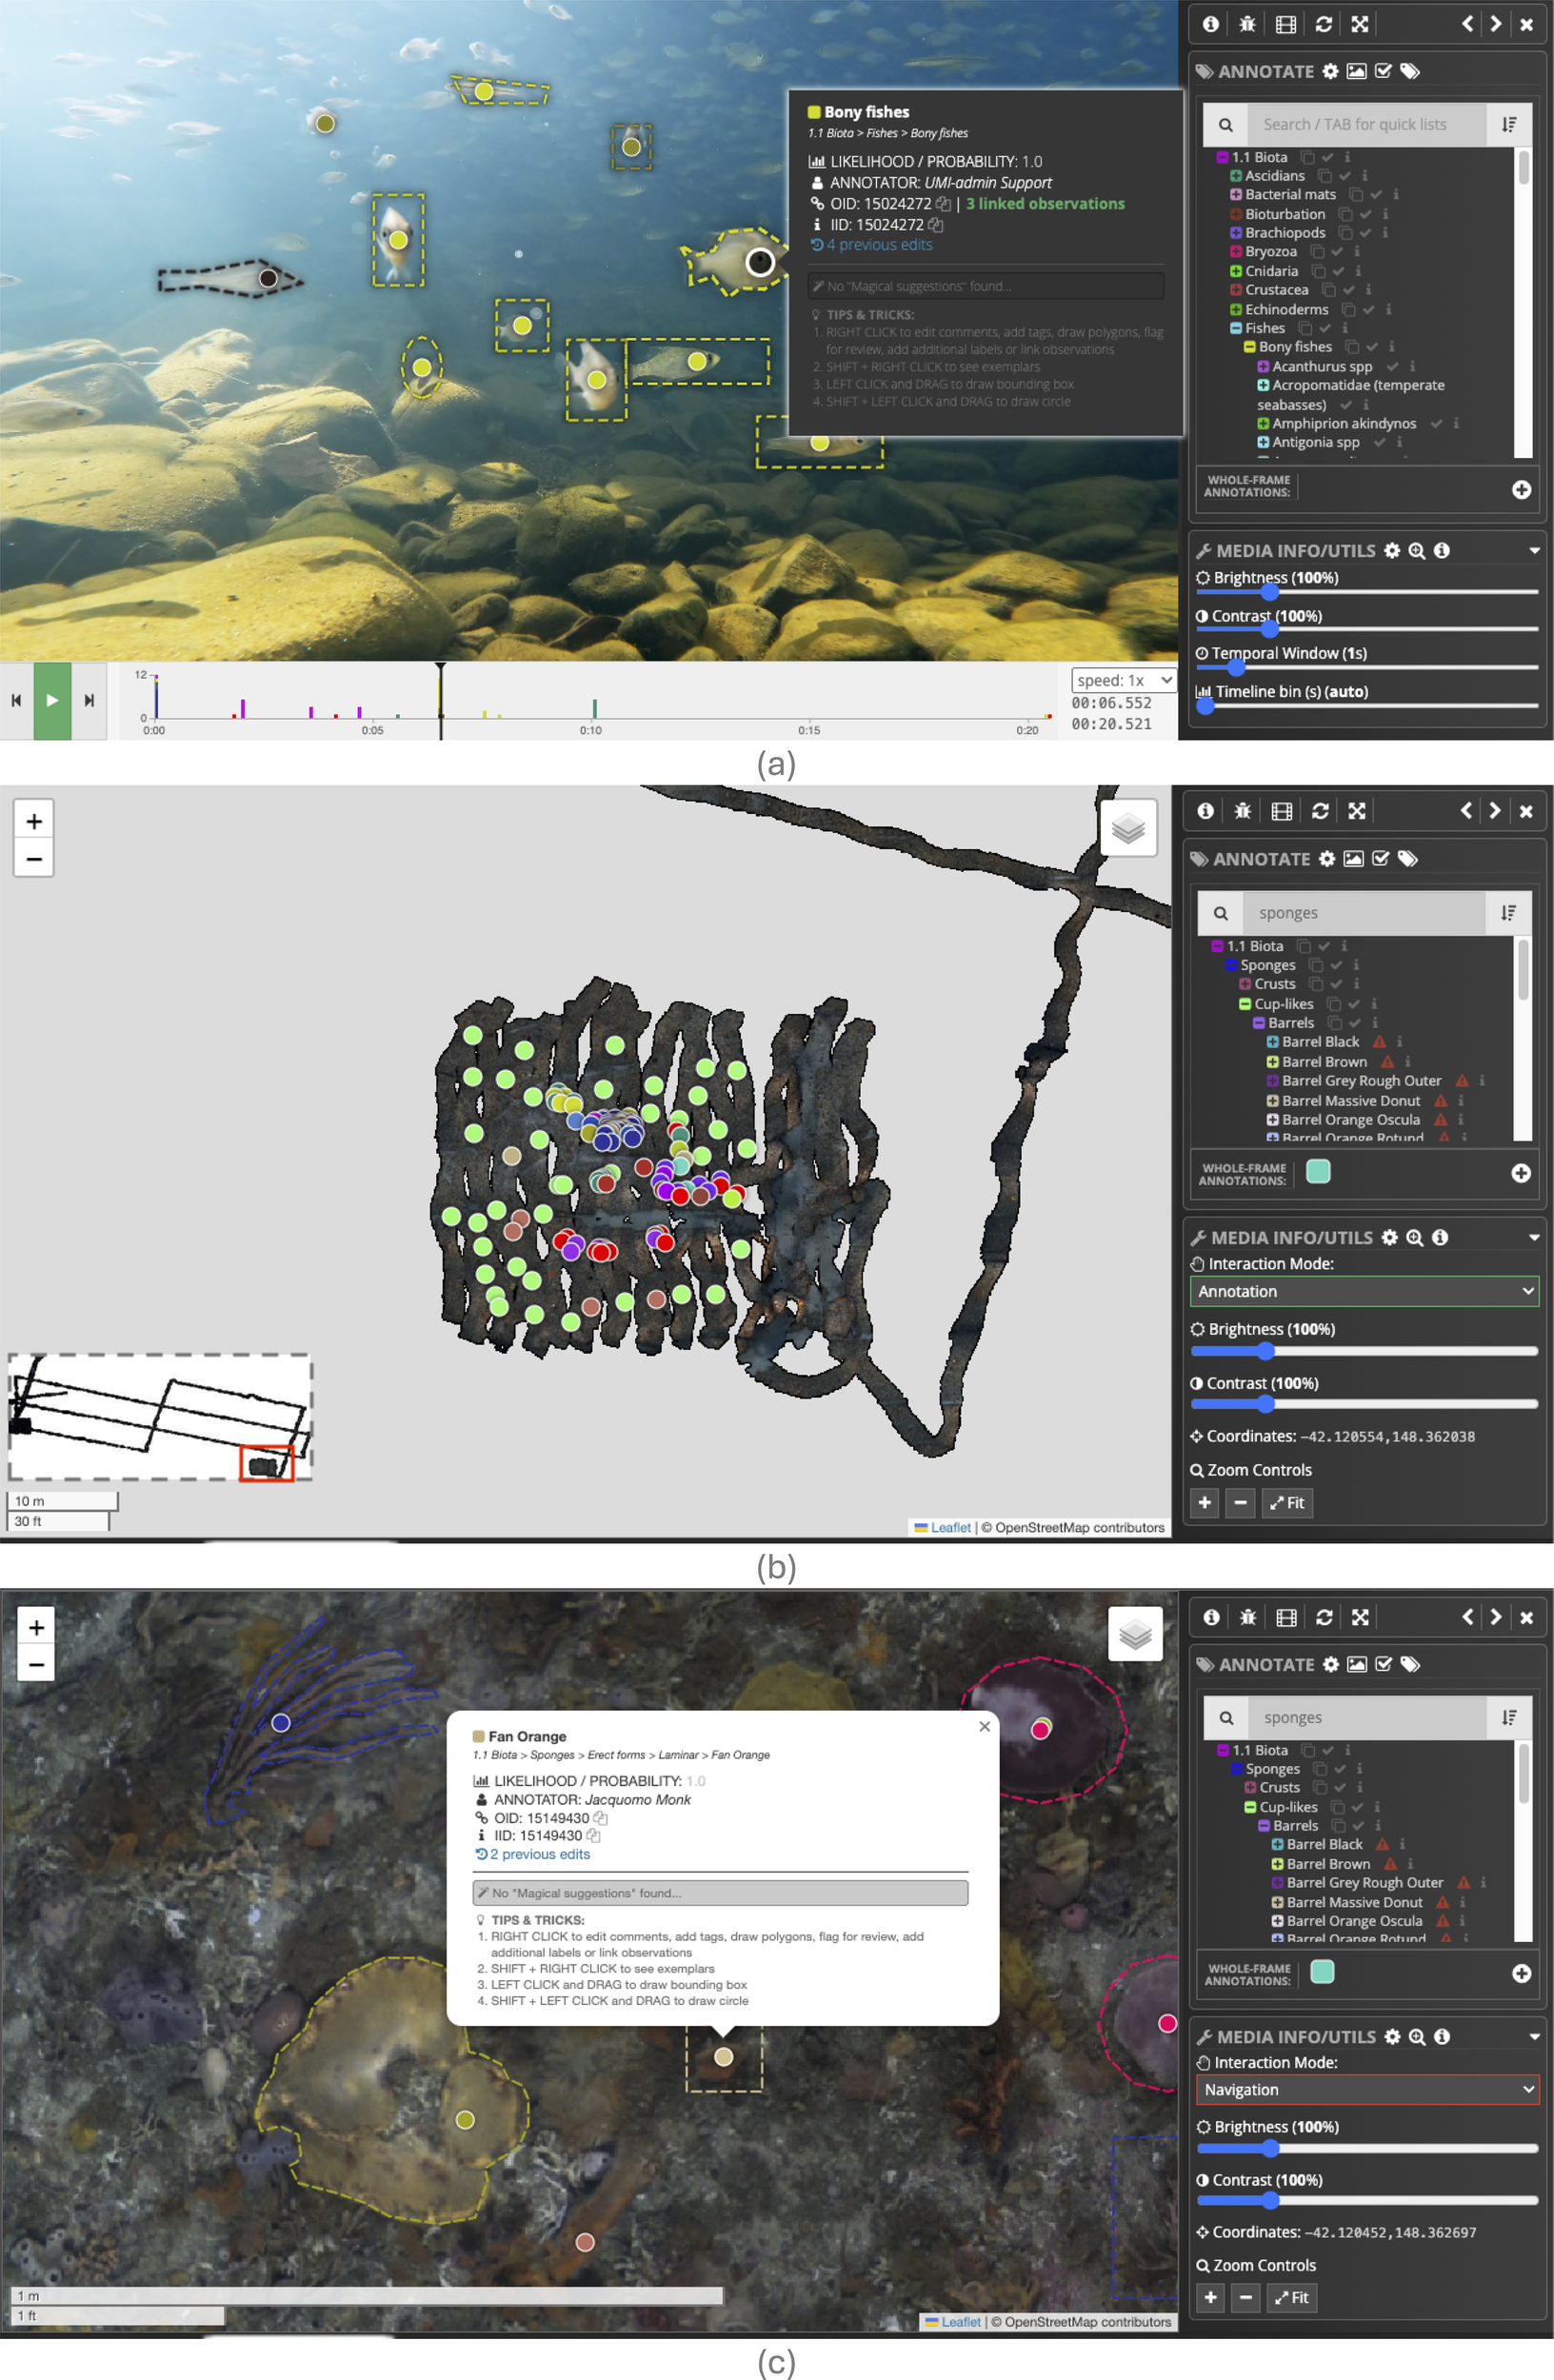
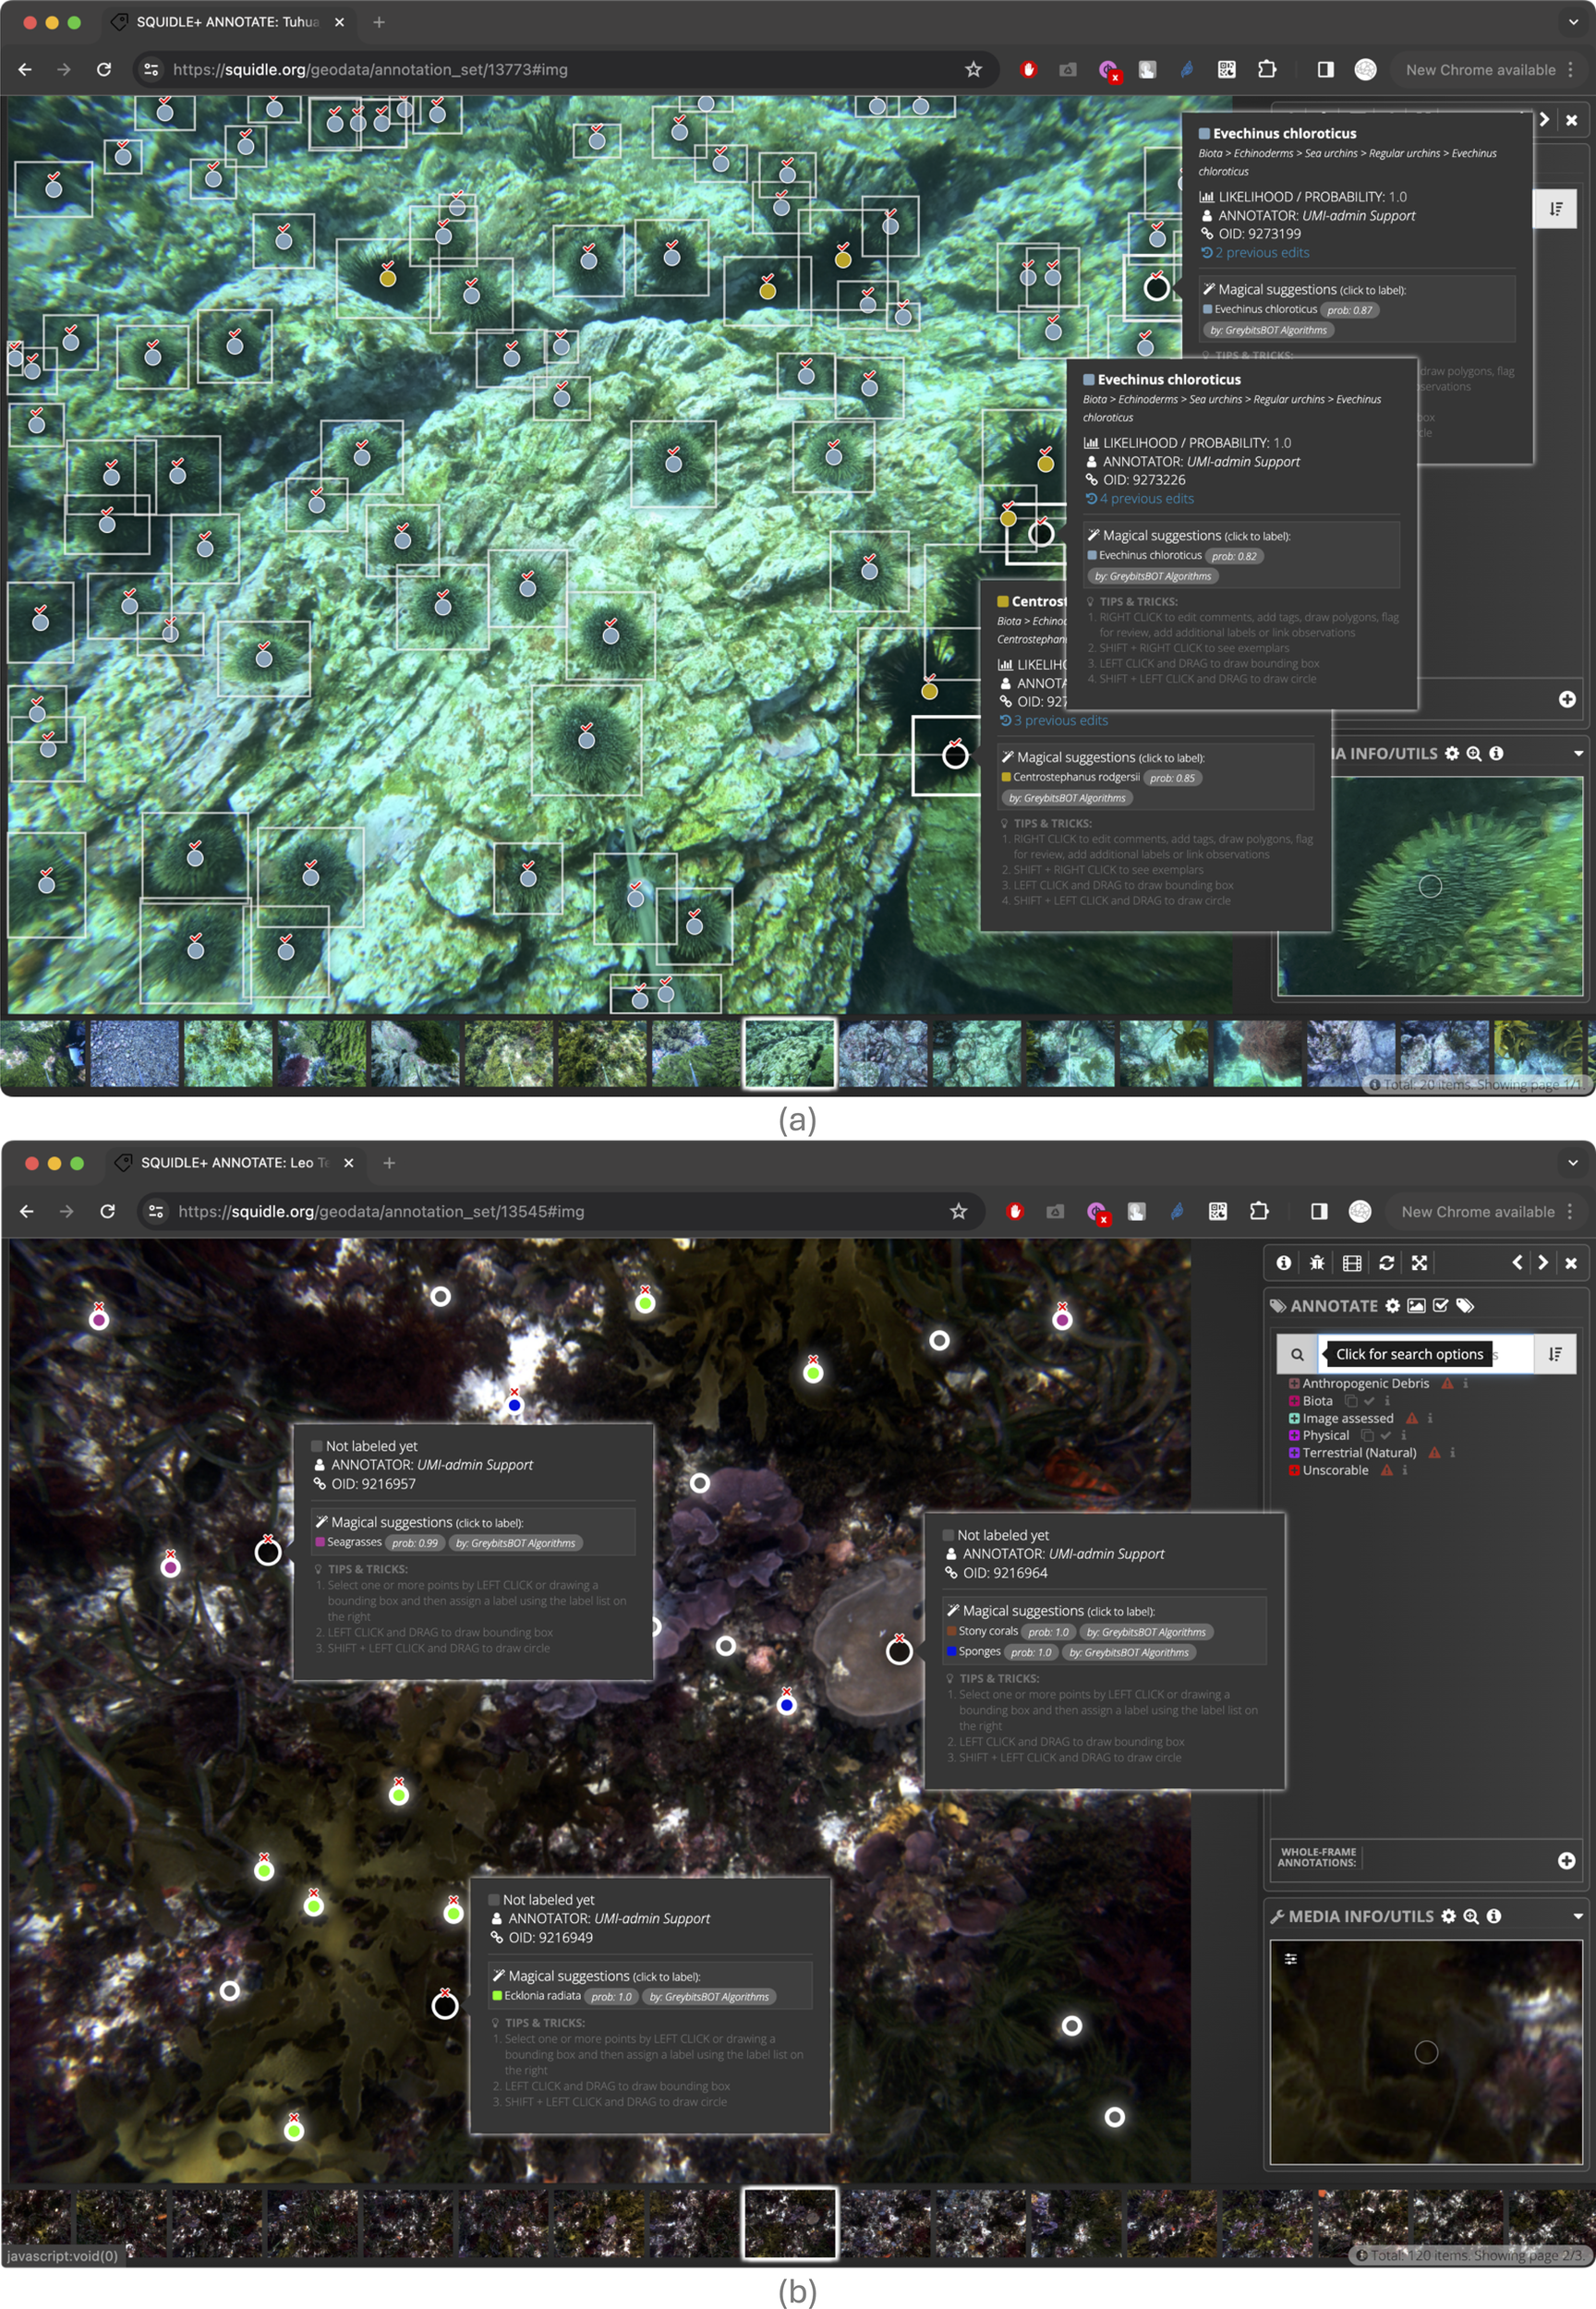
Annotation user interface (UI) (a) showing point labels, polygons and bounding boxes with a random point distribution on an image-type Media Object. Ticks and crosses on points represent agreement with the “Magical Suggestions”, which are Supplementary Annotations from an ML algorithm; and the “Flag For Review” option enables QA/QC and cross-checking between users. The popup shows more information about the label, including Tags, Comments and Magical Suggestions from ML algorithms. The ticks and crosses over the points show agreement with the ML suggestions, and the flag icons show Annotations that have been “flagged for review”. (b) showing 5-point “quincunx” point layout with grid lines overlaid, reference Label exemplars and brightness/contrast adjustments.
Figure 3
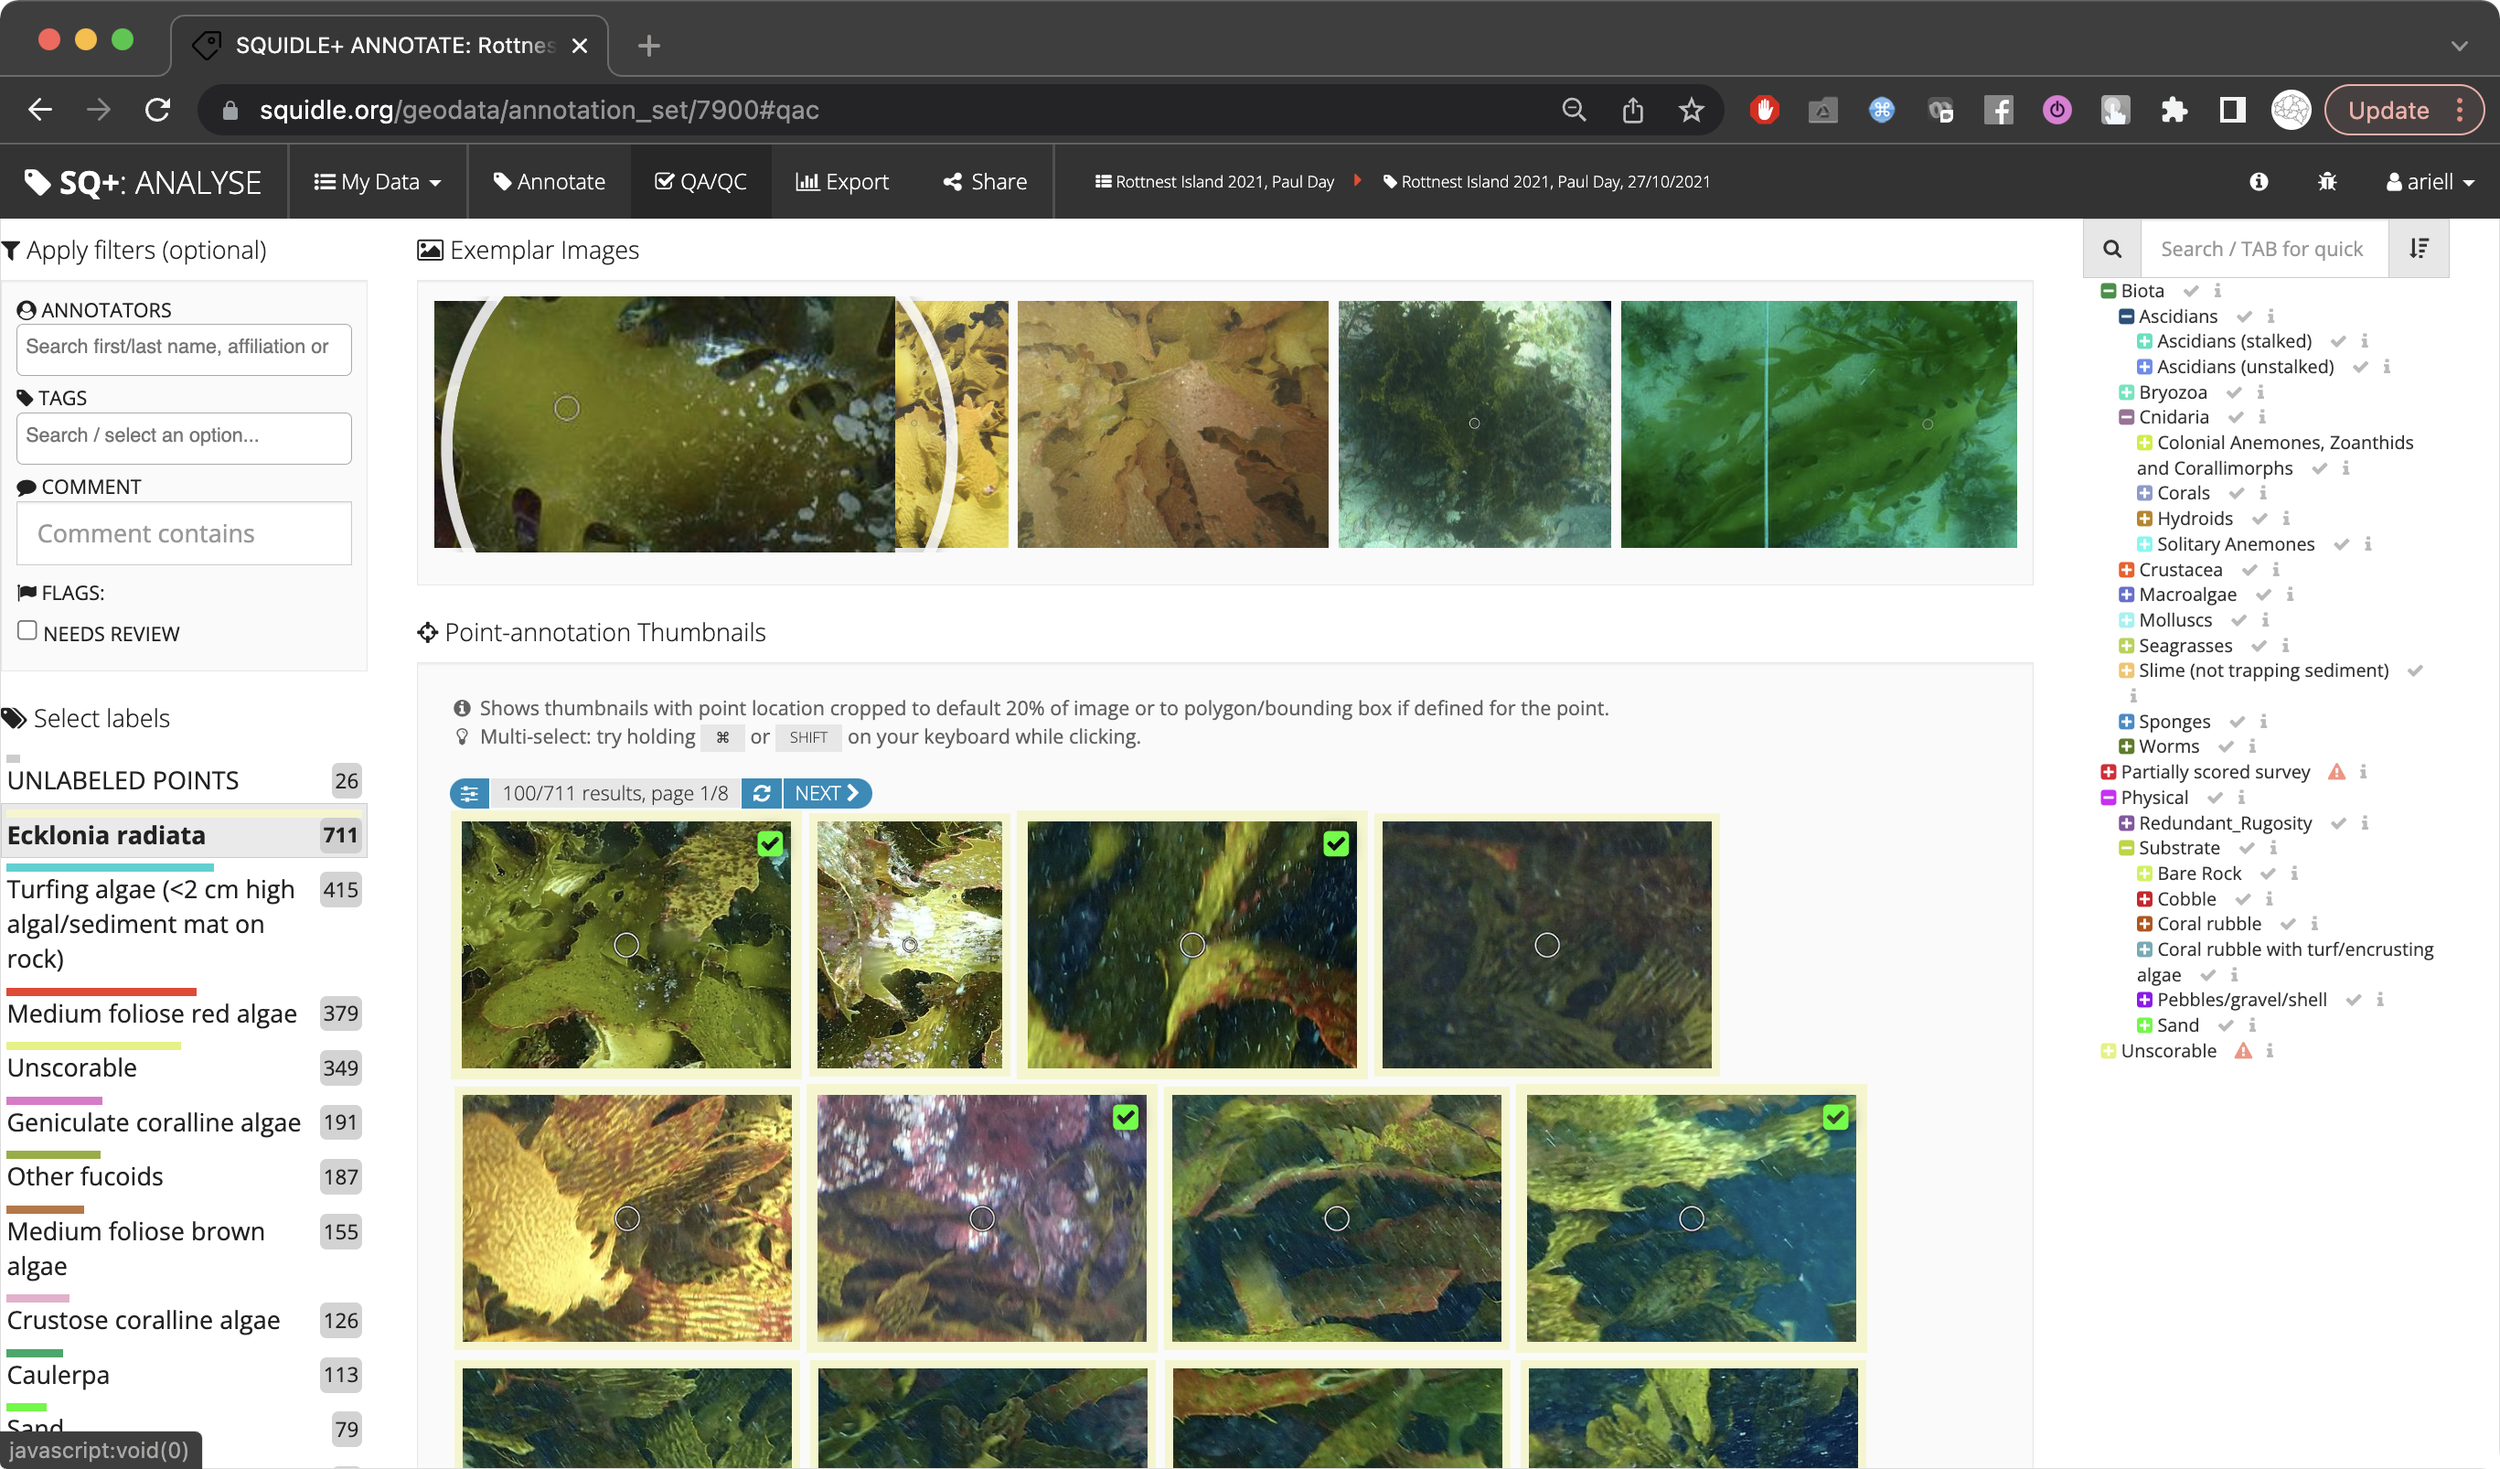
QA/QC UI showing thumbnails cropped around each annotation from all images in the Annotation Set explorable by Label. The grid of thumbnails enables rapid correction/review of labels.
All of the properties above help to capture data quality attributes of the Annotations contained in the system. Most of the properties can be used to filter the Annotations during export to ensure that they are of high quality and fit for purpose.
2.5 Vocabularies & Label Scheme translation framework
Squidle+ offers flexibility by supporting multiple Label Schemes (vocabularies) and analysis workflows. These can be managed and standardised from within Squidle+ by cross-walking between schemes using a Label Scheme translation framework. This makes it possible to analyse data in a manner that suits users’ needs, and then export it in a translated target format of their choosing.
Squidle+ also facilitates the extension of existing schemes, which provides a mechanism to define multiple derived schemes from a single base scheme. This enables (i) seamless translation between a base scheme and a derived scheme using the hierarchical tree structure, (ii) efficient mapping by leveraging base scheme vocabulary elements for translation of the derived scheme with no extra effort.
Squidle+ offers three different mechanisms for translating a source Label into a Label from a target Label Scheme (in priority order):
-
Direct mapping: A method to override translations by predefining a mapping between a source Label and a Label in the target scheme.
-
Tree traversal: Used in special cases where source/target Label Schemes are extended hierarchies of one another. No mapping or translation is required as the source Label will either exist in, or will be collapsible up to, the parent Label in the target.
-
Semantic translation: Matches Vocabulary Elements from Vocabulary Registries by inferring associations from the semantic mappings in the source and target schemes. These are defined as: A Vocabulary Registry is a queryable database of managed Vocabulary Elements (or concepts) that can be used for semantic mappings. Semantic mapping are applied between labels in each scheme and the Vocabulary Elements of one or more central Vocabulary Registries. These are assigned through Vocabulary Elements, which are concepts or entries in the Vocabulary Registries that can be linked to Labels from different Label Schemes for semantic mappings. Each registry may capture different attributes (like taxonomy, morphology or a mixture of the two). A match is found when one or more common Vocabulary Elements are matched between a source Label and a Label in the target Label Scheme. If no match is found, it will move up the hierarchy to attempt to match the parent of the source Label. Mappings need to be defined once per Label Scheme and once defined, it is possible to cross-walk to any other compatible Label Scheme with mappings defined. For more information on what Vocabulary Registries are currently supported, refer to Section 3.1.4.
The translation method used depends on the source and target Label Schemes. If direct mappings are defined, then they will be used. If the source or target are extensions of one another, then tree traversal will be used. Otherwise, the semantic translation mechanisms will be used to find the best match. Semantic matching will only be possible for schemes that have semantic mappings defined. The mappings need only be defined once, and once defined will enable mapping to any other scheme with semantic mappings. Extended schemes automatically inherit the semantic mappings of the base schemes, which enables high-level mapping without any further effort for newly defined extended Label Schemes.
2.6 Datasources: ingesting from cloud storage repositories
Survey data can be imported from a variety of preexisting Datasource (DS) Repositories (i.e., cloud storage repositories). Each supported DS Repository requires a DS Plugin that enables the system to read data from the repository. Each Platform (e.g., ROV, AUV) requires at least one DS Definition.
Flexible data structures and data formats, hosted on a variety of on-line repository architectures are supported (e.g., AWS, GoogleCloud, Apache HTTP directory listing, Thredds, Microsoft Azure, and even custom APIs), and adding new DS Plugins, is relatively straight forward. Leveraging existing data in existing repositories saves costs and prevents duplicating quality control and processing efforts, as well as divergence of sources and downstream products. However, in order to ensure long-term functionality, Squidle+ requires the DS Repositories to be:
-
Persistent. The repository is non-ephemeral and persistent into the future (i.e., once the imagery is linked, the path to the media item must not change or disappear, nor should the underlying data of that media item).
-
Consistent. Flexible data formats are supported by flexible plugins that handle multiple and new definitions. However, once defined, the data format and repository structure for a data source or platform are expected to remain consistent with that definition for any newly uploaded datasets.
-
Accessible. In most cases, the media items (e.g., images) and thumbnails should be accessible through a publicly available (read-only) link. It is possible to set up authenticated proxies for private cloud data, but this is more complex, slows things down and can circumvent any access restrictions if the survey imagery is shared publicly through Squidle+, so for any public data, it is recommended to just provide public links.
Squidle+ maintains links to originating survey data, utilising the existing cloud storage infrastructure, and facilitates a variety of downstream tools to discover, explore and analyse the linked imagery from different repositories in the same standardised and centralised interface. These downstream tools and processes eliminate the need to transfer, duplicate and process survey data to conduct analyses on a third-party platform, and by leveraging preexisting repositories, it expedites data delivery.
The integration of DS Repositories is facilitated through DS Plugins. These plugins enable a consistent DS Definition between different DS Repositories. Each DS Definition is parameterised in the same way, defining search patterns specifying where data should be found in the chosen repository structure. Each can reference a different DS Plugin, which contains all the necessary code to browse and import from the selected repository, enabling standardised parameters across repositories. This makes datasets portable from one repository to another by swapping out the DS Plugin.
For each DS Definition, it is possible to define a sequence of data transformation operations that can be used to prepare the uploaded datasets for import. These operations pre-process the raw input in the repository into the format required by the API, provided the format is consistent for a given DS. This makes it possible to work with most existing data formats without requiring further processing of the data to import it into Squidle+. These are applied to all datasets from a given DS Repository upon import.
Once a DS Definition, DS Plugin and DS Repository have been configured, new datasets that are uploaded to the DS Repository that conform to the DS Definition can be easily ingested into Squidle+. Once the imports have been tested and verified, it is possible to run imports as a scheduled service that can synchronise against the API periodically. This allows a “set-and-forget” workflow where any new datasets uploaded to the DS Repository will automatically be ingested and made available through Squidle+. Upon each synchronisation of the DS Plugin and the DS Repository, the nominated custodians (i.e., data managers or contributors) receive an import report via email summarising what was successfully imported and any errors that occurred, which can point custodians to inconsistencies or issues that need to be resolved on the repository.
The DS Plugins make it possible to synchronise with an existing DS Repository at scale and also enable updating already imported datasets if they have changed. The update mechanisms can keep the Media Objects that have already been imported intact, but can update related Pose objects while importing any new Media Objects. This maintains links to any Annotations that have already been applied to the Media Objects, which avoids exporting and re-importing them if the underlying Deployment survey data requires updating. This commonly occurs in situations where navigation data may need to be reprocessed.
For more detailed information on DS Plugins and Definitions, please refer to Section S2 in the supplementary material.
2.6.1 Additional data streams
In addition to the DS Plugins for survey data, the API facilitates the import of other data streams. The import tools enable data transformations that can be applied to raw data files, to convert them into the formats expected by the API and can be used for:
-
Import annotations from external sources: Ingest and manage Annotations and Points using Annotation Set import endpoints that can import Annotations from external files generated by other annotation tools. The translation framework can be used to ingest and map Labels to an existing Label Scheme, and the datafile transformation operations can be defined to streamline automatic imports. This enables the import of historical annotations or annotations created by external tools, which once imported, can be verified and validated using the QA/QC tools (Section 2.1). It also makes them shareable, discoverable and reusable through the centralised database (Section 2.2). The Annotation import endpoint, provides simple mechanisms to (i) link Annotations to their underlying Media Objects and (ii) find or map the Labels in a supported Label Scheme. To import Annotations, both (i) and (ii) are required.
-
Label import & Label Scheme management: Ingest, manage and synchronise Label Schemes from remotely managed datafiles using the Label Scheme import endpoints. This enables batch imports of Labels into Label Schemes and also facilitates synchronisation of externally managed Label Schemes from third-party vocabulary services (e.g., Ahyong et al., 2024; Rees et al., 2024).
2.7 Export of survey data, annotations and labels
While all of the data models have API endpoints that will retrieve data out of the system (through HTTP GET requests), some specialised export endpoints provide more flexibility and fine-grained control of how to export data. The export endpoints can convert the outputs into different formats through a sequence of data file operations, similar to those explained in for transforming data at import (Section 2.6) but in this case for transforming the format of exported data. The export endpoints also provide a mechanism to define templates as part of the request for different formats for the exported data, including JSON, CSV, HTML table or a more complex formatted HTML templates that can be used to present data from the API into a UI. The Annotation and Label export endpoints all support Label Scheme translation parameters, allowing users to output results in a target vocabulary, as described in Sections 2.5 and 3.1.4. For more detailed information on this, refer to the API documentation (Friedman 2020). Some notable export endpoints include:
-
Survey data export: This endpoint makes it possible to represent all data that have been imported from the external/remote DS Repositories in a consistent and standardised output, regardless of the source format of the data that it was ingested from. This helps to improve the findability, accessibility, interoperability and reuse of all imported datasets contained within the system.
-
Annotation export: Retrieve Annotations with filters and fine-grained control over exactly what properties are returned. For example, whether to include Point information (x-y locations of annotations, bounding boxes, polygons, etc.), Media Object properties (e.g., Media Key, Campaign, Deployment, Platform info), Pose information (i.e., latitude, longitude, depth, datetimes, etc.) or whether to translate the Labels to another target Label Scheme.
-
Annotation summary export: Output summaries of annotations using a variety of filters, to present the Annotation count breakdown by Label, Media Collection, Deployment, Campaign, User, User Group, User Affiliation, etc. These endpoints also support Label Scheme translations.
-
Label Scheme export: Label Schemes can be managed from within the system or synchronised with externally managed vocabularies. The export endpoints enable downloading of Label Schemes in a standardised and consistent way to be used in other annotation platforms or tools. It is possible to apply templates to the exported Labels contained within a Label Scheme to preview graphical catalogues or labelling guides. This endpoint supports Label Scheme translations, which opens up the possibility of using the translation framework in third-party applications as a web-service providing mappings between Label concepts.
2.8 Georeferencing, geospatial map interface & open geospatial consortium services
The data models contained within the system are georeferenced using Pose objects, i.e., Poses are linked to Media Objects, which are contained within Deployments and Media Collections. Deployments are also linked to Campaigns and Annotations to Media Objects. This makes it possible to georeference all of these data models through association with their corresponding Pose objects, enabling their presentation spatially for map-based or Geographic Information System (GIS) applications. The API provides endpoints for working with spatial data and enables spatial queries (e.g., within a polygon or bounding box, within a proximity of a location, etc.). For example, Campaigns and Deployments have optimised endpoints for showing the spatial locations of all records through API requests. However, some data models, for example, Media Objects and Annotations, contain vast amounts of records, so working with the entire database through an API query is infeasible. For this reason, the Squidle+ backend also provides Open Geospatial Consortium (OGC) compliant Web Map and Web Feature Services (WMS & WFS). This makes it possible to visualise potentially tens of millions of spatial points on a map using tiled map services, and the API can then provide feature-rich popups containing contextual information like sample thumbnails of Media Objects at each location, breakdowns of Annotation Labels and Pose statistics. In addition, conforming to these widely supported OGC standards enables interoperability with third-party portals and applications. Some examples of the map-based tools are shown in Section 3.2 and third-party integrations are highlighted in Section 3.4.
2.9 System architecture
The Squidle+ backend is built upon open-source software infrastructure (Friedman, 2018). It consists of a Python Flask web server using a Postgres (with PostGIS) database management system. The database is built through an Object Relational Mapping (ORM) using SQLAlchemy, which enables flexible migrations and maintenance of the database between updates or upgrades. The backend presents an extensive API (Friedman 2020), as well as OGC web map services. The API facilitates integration with external web services, user-created scripts and notebooks; and a suite of plugins and tools, including libraries to facilitate interoperability, including the seamless integration of ML algorithms. An overview of the system architecture is provided in Figure 4.
Figure 4
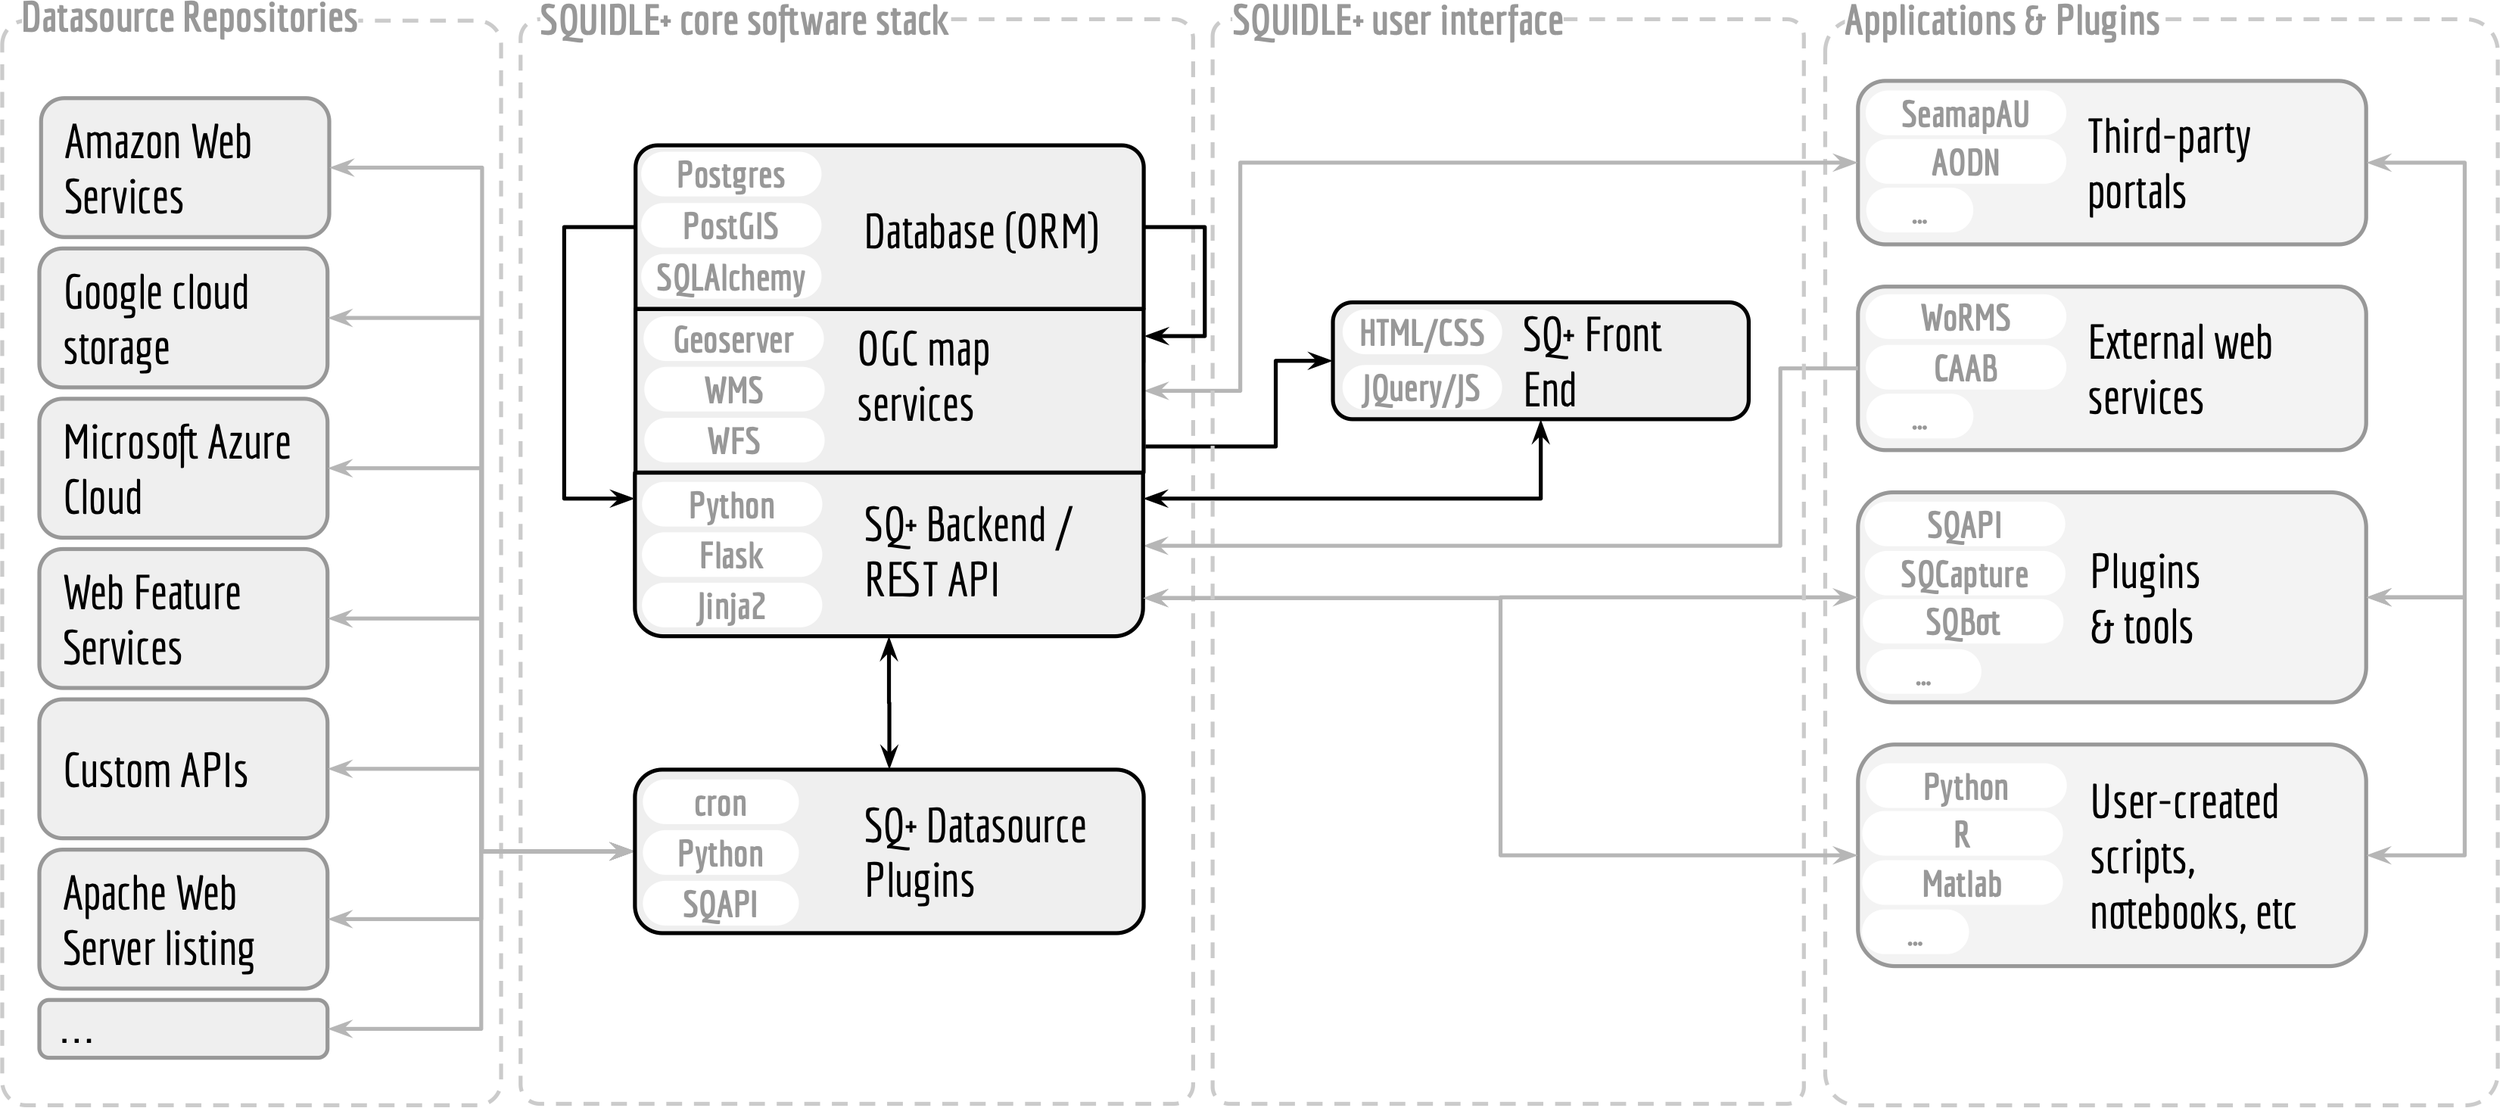
Squidle+ system overview. The core stack is built with Python/Flask, Postgres, Geoserver and includes a Rest API and OGC map services. It offers flexible integration with apps and plugins and seamlessly harvests data from existing repositories and datasources.
3 Results
In this section, we will provide an overview of the current state of the project in terms of the implementation of the methods outlined in the previous section, including the annotation tools, map-based exploration features, plugins, supporting software libraries, ML integrations and other third-party integrations, as well as provide a snapshot of the usage and uptake of the system to date.
3.1 Annotation tools
The annotation UI has been built (and continues to evolve) in collaboration with the science community to create tools and features that adequately capture users’ needs while ensuring a streamlined, efficient workflow.
3.1.1 Annotation UI
The annotation interface supports point, polygon, and bounding box labels, which can be applied to Media Objects (Figures 2a, b). Bounding boxes and regular polygons (e.g., rectangles or dodecagons – approximating ovals) can be quickly created by clicking and dragging from a starting point, while complex polygons can be defined by clicking each vertex. Automatic polygon generation is also supported via API hooks using segmentation algorithms. Additional features include keyboard shortcuts and advanced tools such as auto-selecting unlabelled points, auto-advancing to the next unlabelled frame, selecting all unlabelled points, and batch labelling (Figure 2a).
To assist annotators during labelling reference label exemplar view can be activated by SHIFT+RIGHT-CLICK on a point (Figure 2b). This enables annotators to refer to the exemplar images quickly and easily while annotating, dramatically improving the quality of Annotations, particularly when training up new annotators. Brightness and contrast of images can be adjusted directly in the annotation UI and an adjustable zoom window helps to magnify the points during annotation. The Annotation model is agnostic to the Media Object type. The same framework can be applied to video, photo-mosaics and images, provided an appropriate UI adapter has been developed to work with that Media Object type and make it viewable in a web browser window. Currently Squidle+ supports image annotation, streaming video annotation through a web UI, local video through a custom offline video player and has a web-UI to annotate directly onto orthomosaics. Figure 5 shows the same, consistent annotation UI for videos and photo-mosaics. The framework can readily be extended to support additional media types and derivatives, for example, we are currently building a hyper-spectral image annotation workflow based on the photo-mosaic adaptor, but with additional spectra query controls and popup plots.
Figure 5
Seamless consistent annotation interfaces across different Media Types (a) shows streaming video annotation UI showing multiple linked annotations between successive frames; (b, c) show different zoom levels in the annotation UI for a broadscale photo-mosaic created by stitching together over 10,000 stereo pairs. It shows scale bars and zoom controls with a minimap shown for broader context. Different Media Types have different controls available to them, with different components available in the utilities panel. Many basic controls, like brightness and contrast adjustments, are available for all Media Types.
3.1.2 QA/QC UI
A QA/QC UI enables users to view thumbnails of cropped regions around each Annotation, rather than viewing each full Media Object (Figure 3). This allows users to view Annotations by Label; quickly apply batch corrections by selecting one or more cropped thumbnails and applying new Labels; search Annotations by annotator (user), Tags, Comments and whether or not they have been “flagged for review”. A row of Label exemplar images is available at the top for easy reference. This tool offers an efficient workflow to quickly review the quality of the Annotations and efficiently apply Labels. The QA/QC tools are currently compatible with all supported Media Types, including images, video and photo-mosaics. With an ML algorithm in an interactive training and validation cycle, this interface can be used to facilitate active learning.
3.1.3 Export options
The export tools give fine-grained control over returned properties and enable flexible output formats with filtering, templates and other options. An export UI is provided with common export options preselected for Annotation Sets (Figure 6a). The UI also shows DS attribution information, as well as how the dataset has been shared with a user (along with any Data Usage Agreements that may apply). The user has the ability to specify exactly which properties appear in the output by expanding each of the sections for more detailed options. Clicking on the “ADVANCED” button, allows the user to see the parameters being passed to the API. This is useful for “power users” who may wish to tweak the output formats or template (with options to change between CSV, JSON, HTML table, etc.) or as a tool to help build API queries that can then be executed from an external script (R or Python) for use in third-party integrations or reporting tools.
Figure 6
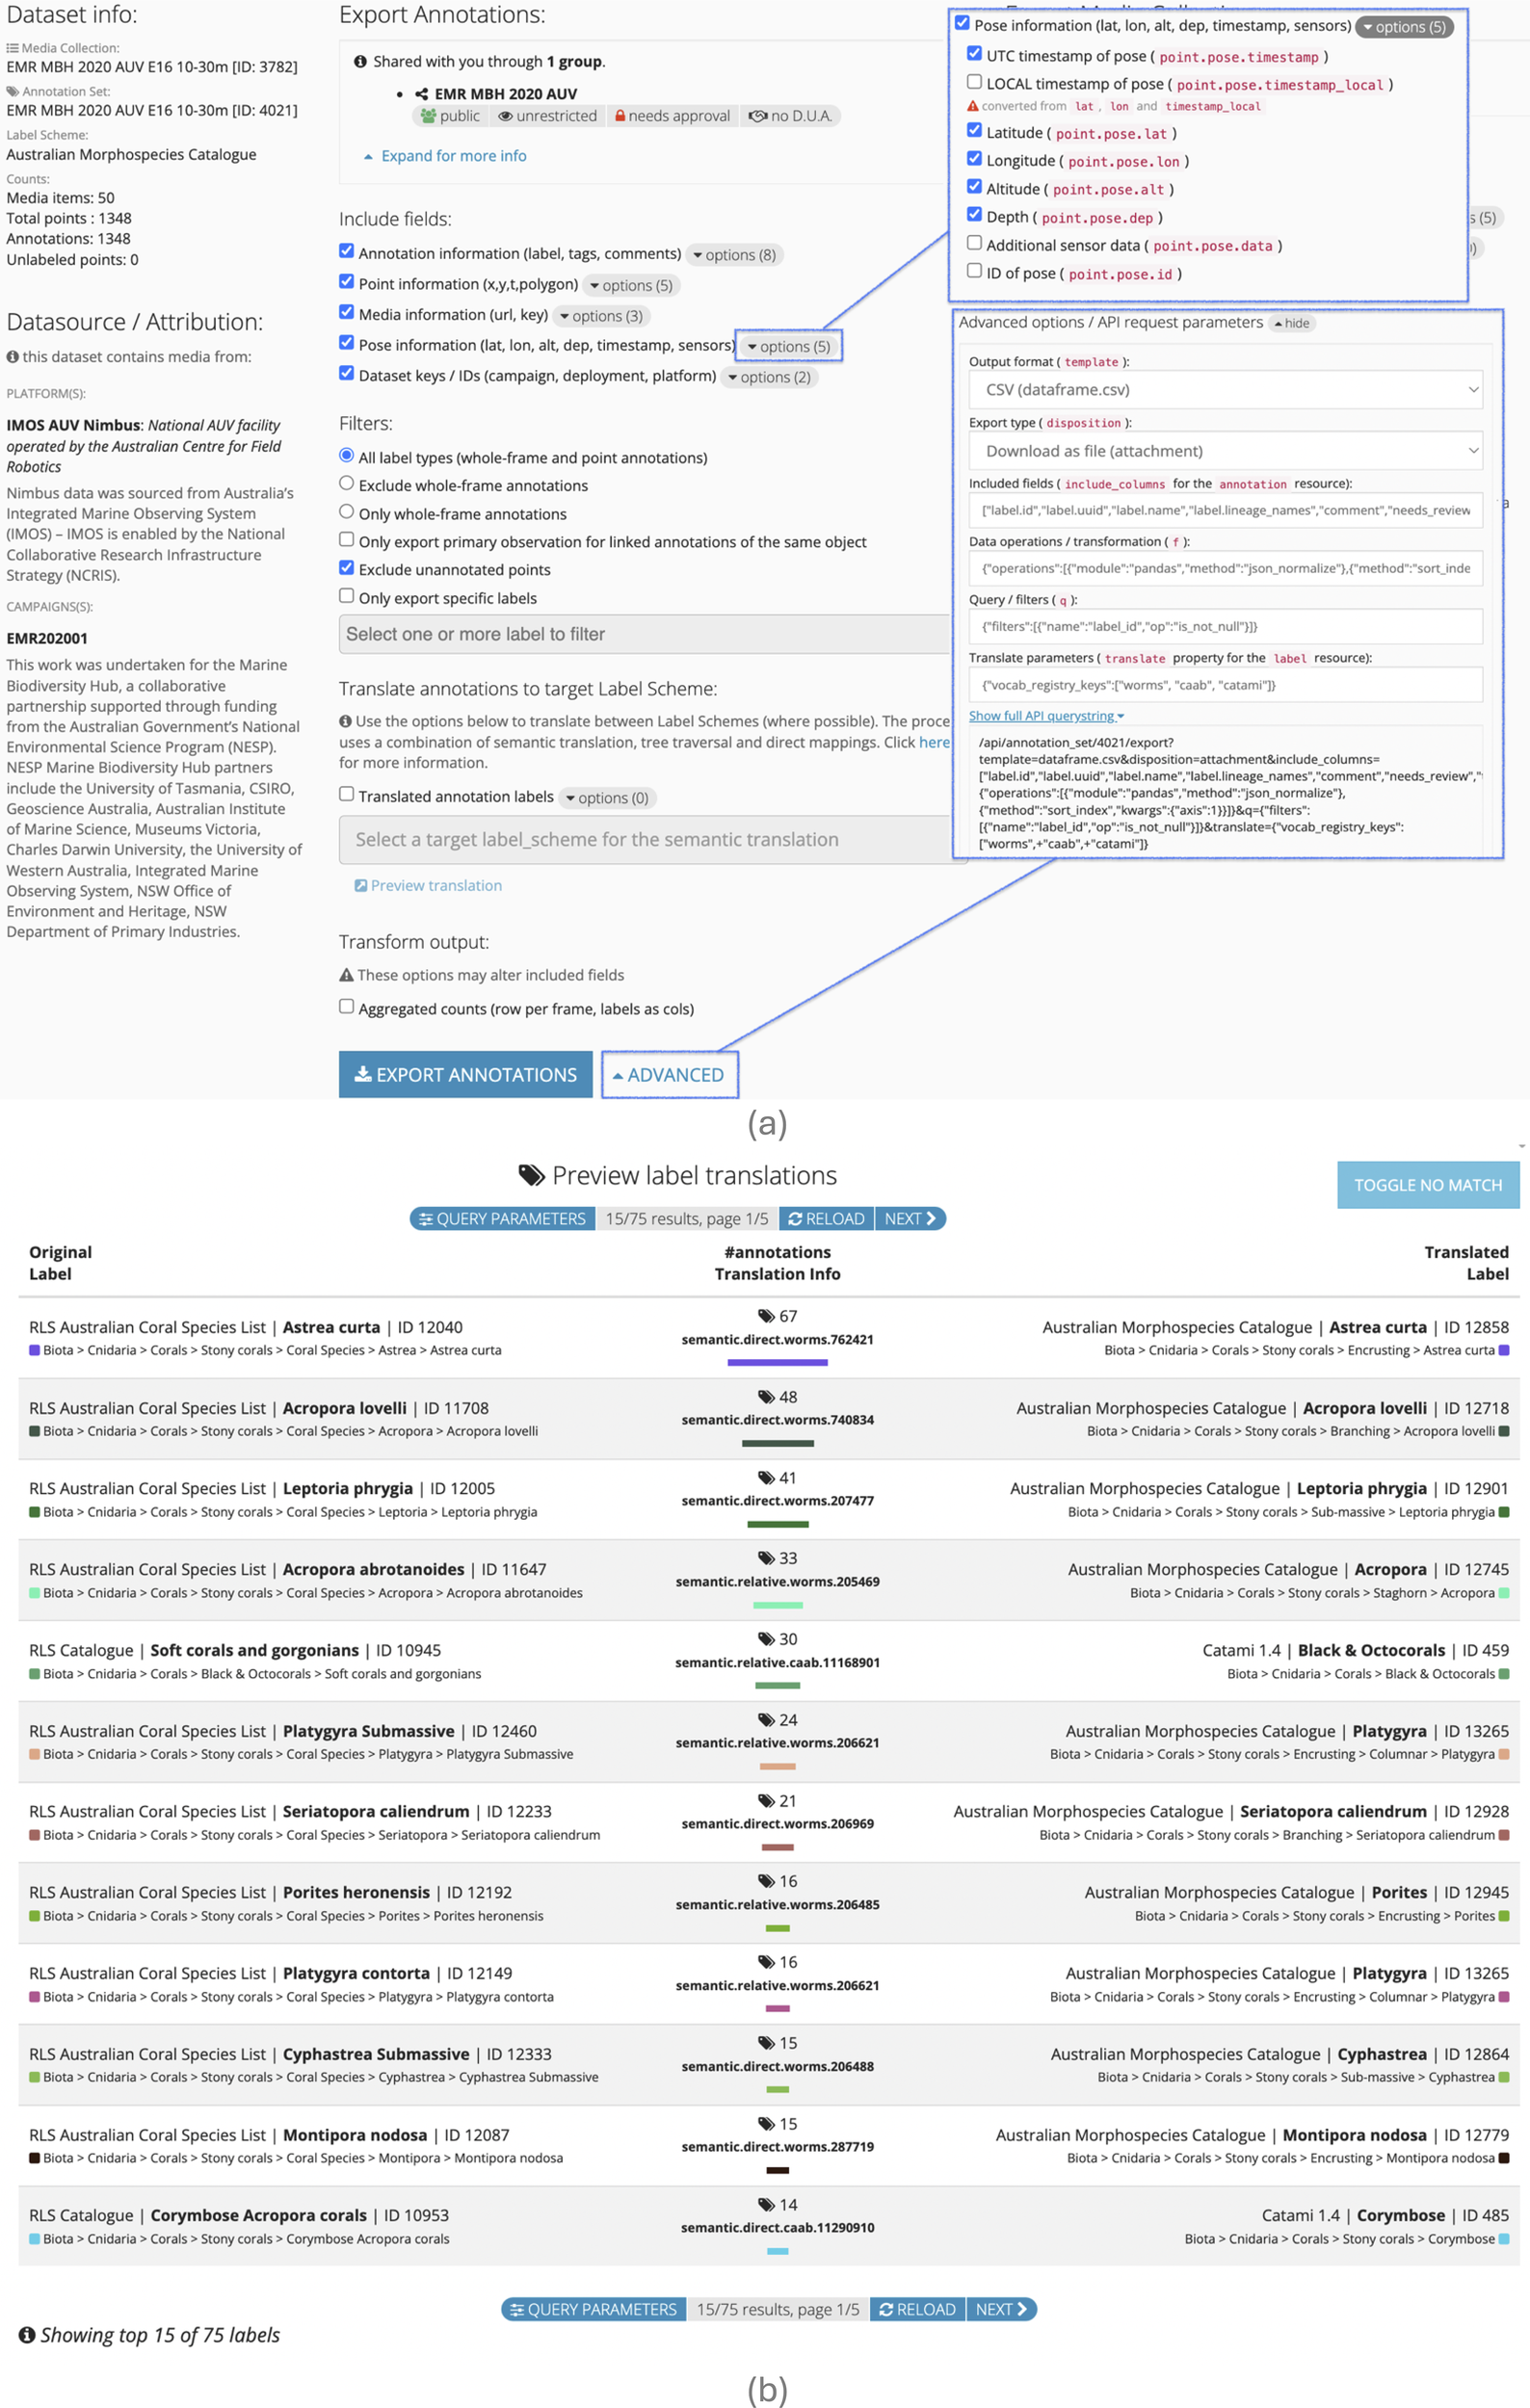
Export options and label translation. (a) shows export interface with fine-grained control over export columns as well as advanced options that help to build API queries; and (b) shows label translation preview with example translation between RLS Catalogue and Australian Morphospecies Catalogue (a CATAMI extension). It shows the original label, the matched translated result as well as how the labels were matched using the Vocabulary Element/Registry.
3.1.4 Label Scheme translation
Squidle+’s Label Scheme translation tools utilise three Vocabulary Registries, including World Register of Marine Species (WoRMs, Ahyong et al., 2024), Codes for Australian Aquatic Biota (CAAB, Rees et al., 2024) codes and the CATAMI morphospecies scheme (Althaus et al., 2015). WoRMS and CAAB codes have their respective APIs and web services and a Vocabulary Registry plugin has been defined for each, however, CATAMI is a managed scheme within Squidle+. The definition of Vocabulary Registries is flexible, and others can be added. Different registries may capture different attributes (e.g., WoRMs is purely taxonomic, CAAB/CATAMI are a mix of morphology and taxonomy). This allows the translation framework to be able to match on both morphology, taxonomy or any other attributes available through the Vocabulary Registries.
In the export UI, there is an option to “Translate annotations to target Label Scheme” (Figure 6a). This enables users to utilise the translation framework to export the Annotation Labels in a target Label Scheme of their choosing. For example, Figure 6b shows a preview of the translation between the RLS Catalogue and the Australian Morphospecies Catalogue (AMC), which are two widely used Label Schemes within Squidle+. The AMC extends the CATAMI Label Scheme by adding additional nested taxa or morphospecies (organisms that exhibit distinct morphological features but are not officially recognised as separate taxa (Bell and Barnes, 2003)). By extending the CATAMI scheme, AMC adopts the high-level structure of CATAMI and inherits all of the pre-existing mappings, and new mappings only need to be defined for the additional Labels. In all translation outputs, the original Label will be returned, along with properties containing the translated Label information, as well as how the translation was done (Figure 6b). It provides a property denoting {method}.{type}.{registry}.{element} where the method is either ‘mapping’, ‘tree_traversal’ or ‘semantic’; the type is direct for an exact match or relative if it had to traverse up the tree to match a parent Label; and if the method is semantic, it will also include the registry and element that was used to match the Labels. In the example shown in Figure 6b, some are direct matches and some are relative, as the translation engine had to traverse up the tree to find a match. Some have used the WoRMS registry and some have been matched against the CAAB database. In most cases, a match is found between the RLS Catalogue Label and a Label in AMC, but in some cases, it matches a Label in the CATAMI 1.4 Label Scheme. This is because AMC is an extension of the CATAMI 1.4 Label Scheme. If the source and target Label Schemes were extensions of one another, the method would be ‘tree_traversal’, and the type would depend on what level in the hierarchy is matched.
3.2 Map-based data exploration
The UI offers different ways of discovering and exploring Deployment and Annotation data, including through the map-based exploration interface. Figure 7 shows the location of the Campaigns contained in the system, clustered with the markers coloured by Campaign (or the relative number of Deployments in each Campaign cluster). As a user zooms in, the clusters disperse and each Campaign and Deployment marker has rich contextual information available in popups about the dataset as well as a breakdown of the Annotations by Label. Zooming in further to the map shows the tracks of each Deployment, and clicking along the tracks shows thumbnails of the Media Objects within the closest proximity of the clicked position, according to their associated Poses. The explore interface can be used to filter Media Objects based on a selection of Deployments, optionally refined by altitude, depth, datetime, etc. As the filters are applied, the resultant Poses are also highlighted on the map tab, as shown in Figure 7. A user can preview the subset of selected Media Objects before creating a Media Collection for further analysis. The map-based interface helps to make data discoverable, showing what data exists in the system, and in addition provides summaries of data as web services that can be leveraged by external/third-party platforms, as highlighted in Section 3.4.
Figure 7
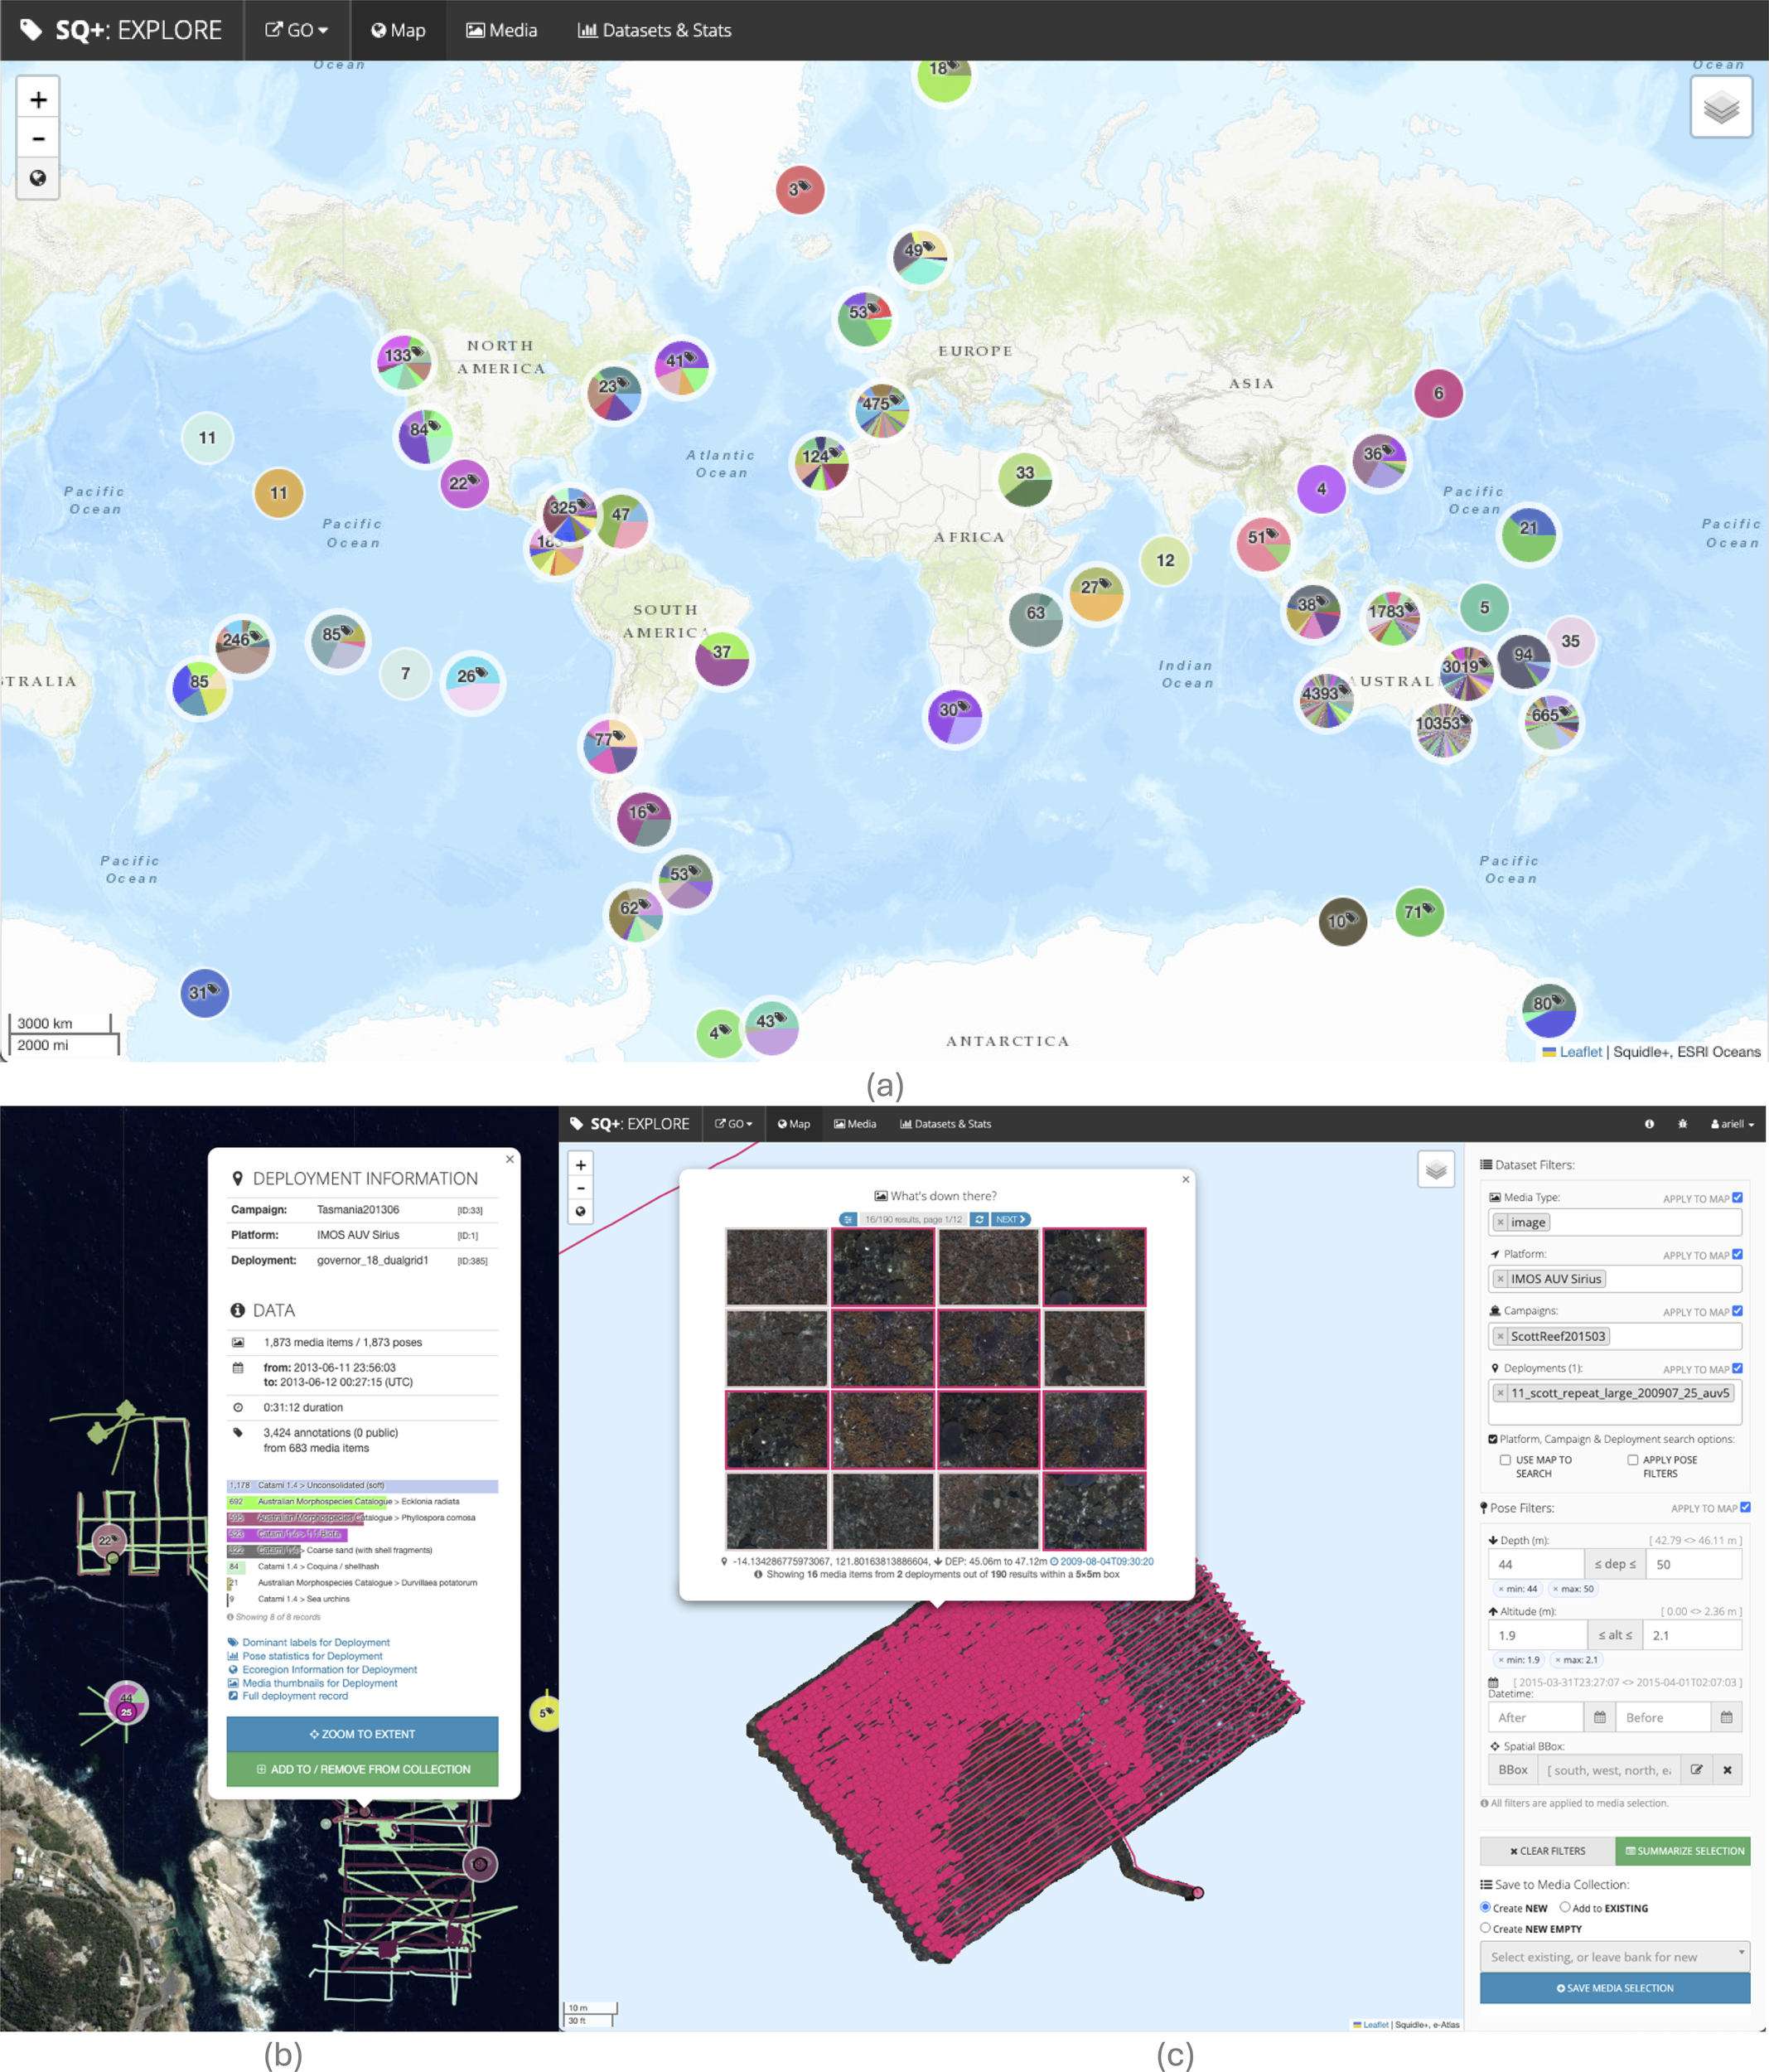
Map-based explore interface. (a) shows a world map with the number of deployments clustered by campaign, (b) shows a satellite basemap with deployment tracks visible as you zoom in with a deployment information popup, and (c) shows a nearby Media Objects popup with a preview of the Media selection for a specific dataset, filtered by Pose that can be saved for further analysis.
3.3 Plugins, supporting software libraries and integrations
While the UI caters to the majority of users and use-cases, the comprehensive RESTful API backend (Friedman 2023) provides a mechanism that enables “power users” and external applications (i.e., clients) to interact directly with Squidle+ data services in a responsive and scalable manner. It handles authentication using an API token, which provides users access to the data that they have permission to view and/or edit.
The API standardises the interface, enabling external services or applications written in almost any programming language to work with Squidle+ data resources. External clients communicate via HTTP requests to perform standard database functions like Creating, Reading, Updating, and Deleting records (CRUD) within a resource. For example, a client would use a GET request to retrieve a record, a POST request to create one, a PUT/PATCH request to update a record, and a DELETE request to delete one. This same API is used to power the front-end UI in conjunction with the templating system, which renders formatted responses for display in a web browser/front-end UI. Refer to the API documentation (Friedman 2020) for more information. Some notable plugins and tools that have been built on top of the Squidle+ API are outlined below.
3.3.1 Simplified API interaction and automated annotation: SQAPI
SQAPI is a pip-installable Python module (Friedman 2023, https://pypi.org/project/sqapi/) with an equivalent R package (https://github.com/sajessop/SQAPI) that is currently being developed, which will be released through CRAN. Both of these software libraries allow for easy interaction with the Squidle+ API. It provides a convenient interface for constructing complex queries and provides useful tools for streamlining integration. The SQAPI module helps to build the HTTP requests that are sent to the Squidle+ API, including GET, POST, PATCH or DELETE requests. It takes care of authentication, and simplifies the creation of API queries. The query structure maps to that of the API definitions and more information about structuring queries is outlined in more detail in the “Making API queries” section of the SQ+ API documentation page (Friedman 2020, https://squidle.org/api/help). An excerpt of the API docs and an example of making a query using SQAPI are included in Section S3 of the supplementary material.
3.3.2 Framework for ML model deployment: SQBot
SQBot is a software repository (Friedman et al., 2024, https://bitbucket.org/ariell/sqbot) to help deploy and operationalise ML algorithms into Squidle+. SQBot is built upon SQAPI, and although SQAPI provides the core tools necessary to create code-based annotators, SQBot introduces a framework to help standardise the integrations. It introduces a notion of ‘models’ and ‘bots’. The models are a collection of pretrained ML models (or “checkpoints”), as well as the parameters to run them, contained in simple, human-readable configuration files. The bots are the software modules, libraries and dependencies required to run the various models, including ML frameworks (e.g., PyTorch, Tensorflow, etc.). The models and bots can be used for detection, classification, segmentation, active learning or any sort of interaction that can be facilitated through the API. Algorithms run as users in Squidle+ using an API key and data can be shared with them using the same sharing framework for sharing and collaborating with other users. SQBot provides convenient mechanisms to test the ML models and bots and also to deploy them as background services leveraging the User Group sharing framework (Section 2.2) that can be used to automatically process Annotation Sets that are shared with it. Models can be run standalone on a specific dataset, or using the model server dashboard that is packaged with SQBot, users can control and administer multiple ML processes. SQBot enables the decoupling of the ML workflows from the UI and backend. This helps to sidestep many of the challenges associated with model IP and deployment of ML. It can be deployed as a service on any machine with access to the Squidle+ API, facilitating its use in Squidle+. This could be on a cloud compute server, an institutional compute resource, or even a machine on the local network. Once deployed, the model server creates a dashboard that can be linked to a Group in Squidle+, which can connect the ML models to the datasets that are shared with it through the group. Anyone with HTTP access to the dashboard and adequate group permissions in SQ+ can connect to that SQBot instance, and run models on datasets within Squidle+.
3.3.3 Real-time field video capture and data integration: SQCapture and the GreybitsBox
Greybits Engineering, the chief architect and developers of Squidle+, offers the GreybitsBOX: a rugged field computer product running an offline instance of Squidle+ and the SQCapture software plugin module. With a built-in Uninterruptible Power Supply and ample IO capabilities, it is designed for real-time data capture in the field. It enables live video streaming through its HDMI/SDI capture card or various network video streaming protocols, along with concurrent navigation data that can be annotated in real-time using a locally installed Squidle+ instance. The system operates with the SQCapture Software pipeline, which offers offline video capture tools and the ability to transmit data to any Squidle+ instance, including a locally installed offline-capable one. Using SQCapture and a GreybitsBOX in the field, users can (i) capture data on site to enhance the value of field observations for subsequent post-processing and analysis, and (ii) efficiently organise and prepare field-captured data for seamless upload and integration into a DS Repository for easy access in the centralised, online Squidle+ portal through a supported DS Plugin.
3.3.4 Interactive video metadata ingestion and validation: SQUIDJAM
SquidJam (Sangekar et al., 2023) is an interactive platform for streamlining metadata ingest from historical marine survey platform datasources (e.g., ROV video) through webpage-based visual graphing interfaces to identify data problems (e.g., missing sensor data, time synchronisation issues, etc.) and produce graphs and figures ready for print or web-based publication (e.g., CTD graphs, taxon-filtered day-night organism vertical distribution box-whisker plots, etc.).
3.4 Usage, uptake & impact (as at June 2025)
Since its inception, Squidle+ has demonstrated significant and rapid uptake, emerging as the largest centralised source of openly accessible, georeferenced marine images with associated annotations in the world. At the time of the recent BenthicNet global compilation of accessible, georeference underwater imagery (Lowe et al., 2024), Squidle+ accounted for over 9 million of the approximately 11 million openly available georeferenced underwater images that were available, highlighting its global significance. The repository has continued to grow and now contains over 10.2 million images from 22,107 deployments across 1,062 campaigns, sourced from 36 distinct, externally-hosted DS Repositories. This resource supports a growing user base of 2,416 registered individuals from 330 affiliations, who have collectively and rapidly produced over 5.85 million annotations. Figure 8 shows the increasing annotations over time.
Figure 8
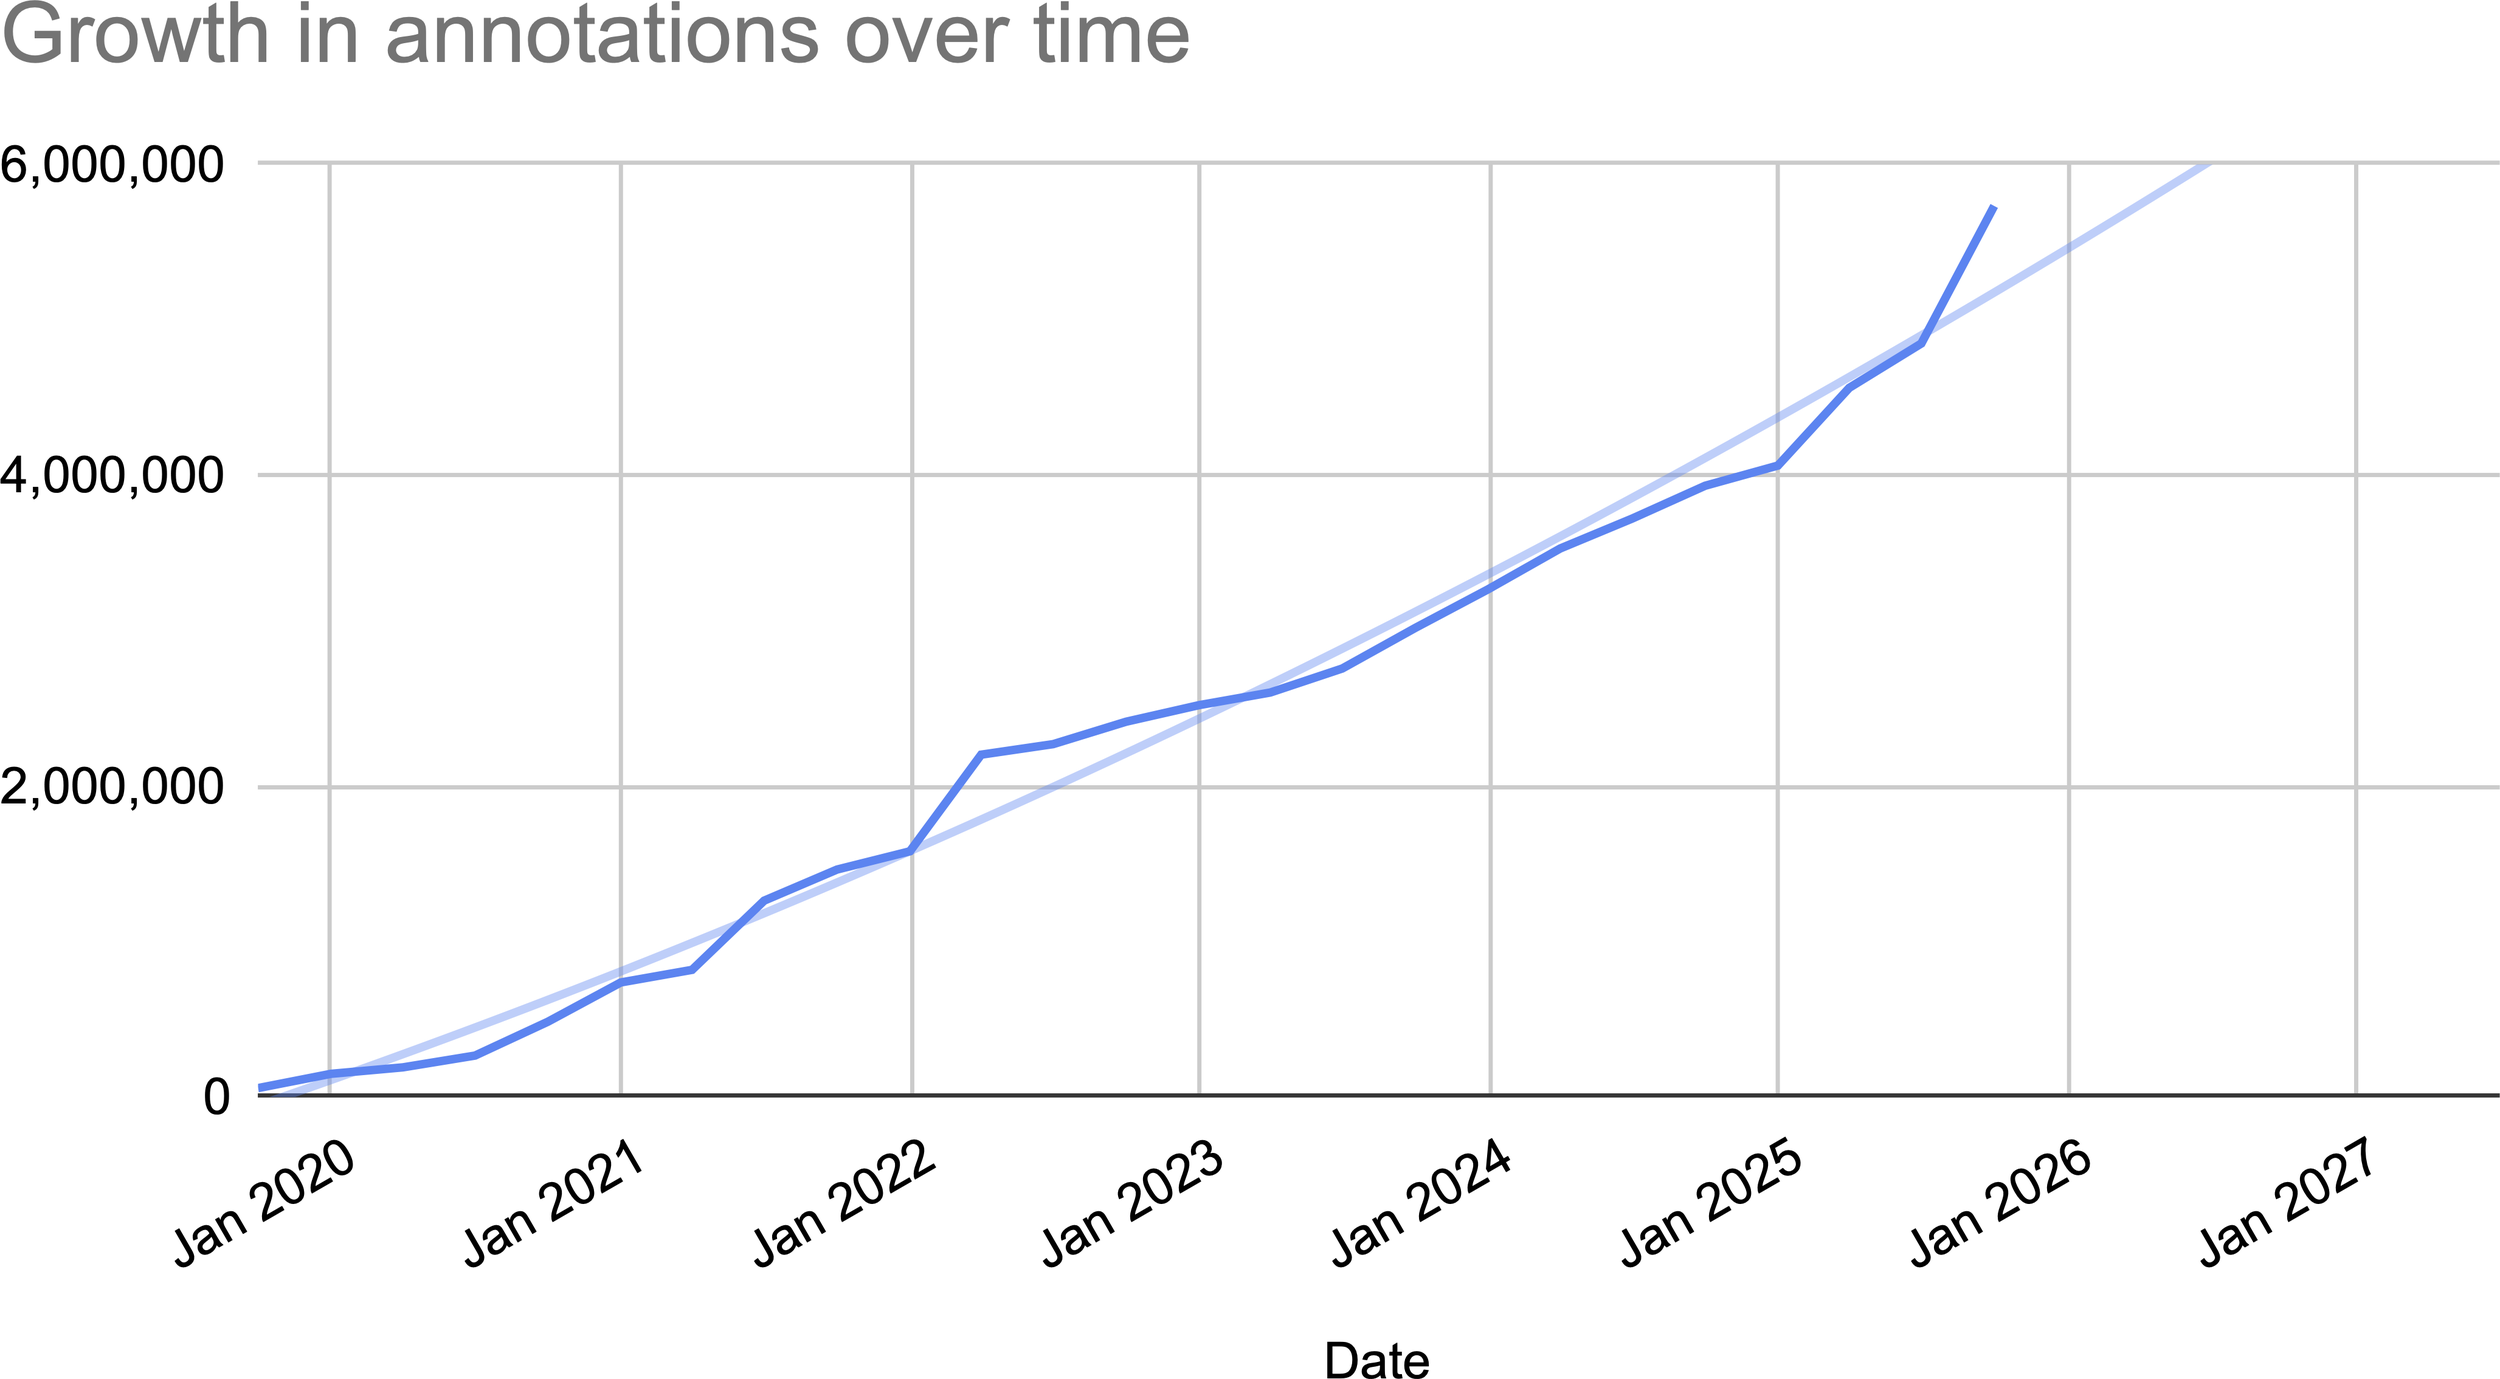
Cumulative annotations over time shows a steady increase in the number of annotations up till September 2025.
Initially scoped to support two imagery platforms, Squidle+ has expanded to include data from various national (e.g., NSW State Government, CSIRO, University of Tasmania) and global (e.g., University of Southampton, Schmidt Ocean Institute, University of Auckland, The Nature Conservancy, Norwegian University of Science and Technology) sources. This expansion is possible due to a flexible architecture that leverages federated repositories, enabling streamlined data import and discoverability. The platform’s standardised outputs, including OGC services and a comprehensive API, have also supported integration with key third-party applications like Seamap Australia, Reef Life Explorer, and the Australian Ocean Data Network (AODN). At the time of writing, data from Squidle+ has contributed to 50 journal articles, including publications in Nature (Edgar et al., 2023) and Nature Ecology & Evolution (Stuart-Smith et al., 2021), as well as 19 technical reports and 23 conference presentations. With this expanded capability and reach, Squidle+ is impacting marine science across multiple domains:
-
Environmental Baselines and Monitoring: Squidle+ datasets provide information on species composition, abundance, distribution, and condition across diverse marine ecosystems. This data has been instrumental in tracking continent-wide declines in shallow reef life due to ocean warming (Edgar et al., 2023), characterising bleaching in temperate sponge communities (Perkins et al., 2022), and documenting anthropogenic impacts on deep-sea ecosystems (Taviani et al., 2023). The platform is also used by environmental consultants to compile baselines for assessing impacts related to offshore renewable developments and has facilitated the efficient processing of imagery from significant surveys funded by the National Environmental Science Program (NESP) Marine and Coastal Hub in Australia (e.g., Barrett and Monk, 2021; Carroll et al., 2021; Langlois et al., 2021).
-
Environmental Management and Reporting: The platform’s flexible architecture supports the development of standardised indicators applicable at state, national, and international reporting levels, such as those defined by the Global Ocean Observing System and the (Australian) National Marine Science Committee. Datasets have been integrated into high-level government reports, including Australia’s SoE reporting (Trebilco et al., 2021), and underpin management effectiveness programs at both State (e.g., Young et al., 2022) and Federal levels (e.g., Hayes et al., 2021; Perkins et al., 2021; Barrett and Monk, 2021). Its endorsement as the recommended annotation tool in the Australian Marine Sampling Field Manuals for major imaging platforms has solidified its role as a national standard (Przeslawski et al., 2019).
-
Research and Postgraduate Support: Squidle+ has been integral to 32 funded research projects and has supported the training of the next generation of marine scientists, including 10 Honours, 5 Masters, and 14 PhD research projects.
-
Education: The Squidle+ software infrastructure serves as a versatile, hybrid teaching tool in eight university-level courses across six different research institutions, including the University of Sydney, Sydney Institute for Marine Science, University of New South Wales, Macquarie University, and the University of Tasmania, providing students with hands-on experience using real-world ecological data.
-
Citizen Science and Public Engagement: The platform’s user-friendly interface has empowered large-scale citizen science initiatives, such as Reef Life Survey (RLS). Currently RLS has >200 active volunteers, >19,500 surveys from over 60 countries. Squidle+ provided a centralised mechanism to access and annotate images from RLS’s diver-based surveys, which co-locate habitat images with fish and mobile invertebrate observations. Interactive QA/QC tools and integrated data sharing have enabled RLS to coordinate geographically dispersed experts with specialised regional knowledge, and to train volunteers to use Squidle+, helping to address a backlog of image processing. As a result, the program was able to manually annotate more images in the first three years using Squidle+ (76,000), than in the previous 15 years combined using their previous annotation tools. Beyond annotation, the platform’s semantic translation framework underpins public-facing dashboards such as the RLS Reef Life Explorer, which communicate simplified scientific outputs and enhance public engagement. Furthermore, the flexible templating system and API allow the interface to be “re-skinned” through alternative entry points and templates for rendering data. This architecture provides significant potential for developing streamlined, customised interfaces that engage participants in citizen science annotation programs through task-specific or simplified user experiences.
-
Advancing Machine Learning: The platform has become a key resource for the ML community, supporting at least 10 ML research projects by providing access to vast, expertly labelled training datasets. Squidle+ has enabled the serving of curated datasets for ML development, including the BENTHOZ-2015 Public Dataset (Bewley et al., 2015). For the recently released global BenthicNet dataset (Lowe et al., 2024), data from Squidle+ made up 80% of the available data, and comprised nearly 50% of the final subsampled imagery, highlighting its global significance. The platform’s unique architecture facilitates workflows connecting ML researchers to real-world problems, with its framework treating algorithms as “users” with access to high-quality training data. This has already contributed to advancements in automated annotation (Boone-Sifuentes et al., 2022; Jackett et al., 2023; Massot-Campos et al., 2023). The combination of SQAPI and SQBot provides a flexible framework for simplifying the integration and deployment of ML into Squidle+. The diverse range of ML researchers across several different institutions and projects that have been able to operationalise their models is a testament to the ease with which ML researchers can build useful tools that can assist marine scientists with time-saving processes that help to expedite the annotation of marine imagery. The in-built translation tools have been instrumental in simplifying the process enabling datasets across projects with different Label Schemes to be leveraged for building generalisable, larger training sets without the need for manual cleaning/harmonisation between projects. This cross-disciplinary collaborative environment is mutually beneficial. In addition to providing ML tools to marine scientists, it also connects the ML researchers to extensive training datasets and expert annotators for validation. The platform’s focus on transparency, with associated QA/QC flags allows researchers to assess data quality and provenance, ensuring it is fit-for-purpose in solving real-world problems and grounding their ML research. Some examples of deployed models that are now available to users include:
-
CCAIBots: a collection of classifiers and detectors of urchins and surrounding habitats (University of Auckland, 2024; Rawlinson et al., 2025). Figure 9a shows a screenshot of the output of the CCAI urchin detector integrated into Squidle+.
-
LeoBots: an ensemble of models trained to classify GOOS-level indicators (i.e., Hard Coral cover, Canopy-forming Macroalgae cover, Seagrass cover and Sponge cover) as well as Ecklonia radiata (See Figure 9b). Models were trained and evaluated using a selection of 1.7 million annotations from 150,000 images contained within Squidle+. Models achieved F1 scores ranging from 0.80 for seagrass classifier to 0.93 for canopy-forming macroalgae (Günzel et al. in review).
-
HDoigBots: a collection of detectors that are built to automatically find rare organisms based on data augmentation (Doig et al., 2024). Rare labelled instances that are copy-pasted into different scenes to generate more training examples or simulated datasets with rendered 3D models are superimposed onto the scene to generate training data. This collection includes an Urchin detector trained on limited examples, as well as a detector for the rare and endangered handfish of Tasmania (Figure 10b).
-
GBEBots: a collection of classifiers of some common indicator species like Ecklonia radiata. These classifiers have been used extensively as a teaching tool for marine science tutorials on image annotation, and for the validation of automated labelling algorithms.
-
MetaBots: a collection of segmentation models utilising the Segment Anything Model (SAM) (Kirillov et al., 2023). These bots have been used to convert point annotations into complex polygon labels to quickly delineate object boundaries. A user can place a point and optionally refine bounds with a bounding box, and once the dataset is shared with the bot, it will convert all unsegmented points into polygon annotations (see Figure 10a).
-
CSIROBots: a collection of models and bots that are used to classify benthic habitats, trained on towed camera video (Jackett et al., 2023). The ML pipeline is available through Squidle+ but is run as a service on in-house servers within CSIRO.
-
Data Interoperability and Third-Party Integration: A core strength of Squidle+ is its ability to standardise datasets across disparate sources and formats, thereby improving the utility of imagery and annotations. The unique semantic translation feature allows users to synthesise labels between projects by cross-walking between different vocabularies, a task that is traditionally complex and time-consuming. This capability not only enables robust syntheses at local, state, and federal levels but also bootstraps the training and application of ML tools, fundamentally enhancing the value and reusability of marine image data. Coupled with the comprehensive API and OGC mapping capabilities, Squidle+ has supported multiple third-party integrations, including:
Figure 9
Screenshots showing suggestions from ML algorithms integrated into the Squidle+ annotation interface (a) shows detected urchins from CCAIBot detector, which has automatically created bounding boxes and suggested labels for different urchin species; and (b) shows LeoBots classification algorithm. The points in the image are unlabelled, but have label suggestions from an ensemble of models. The popups show suggestions from the Seagrass, Ecklonia radiata and Hard Coral models.
Figure 10
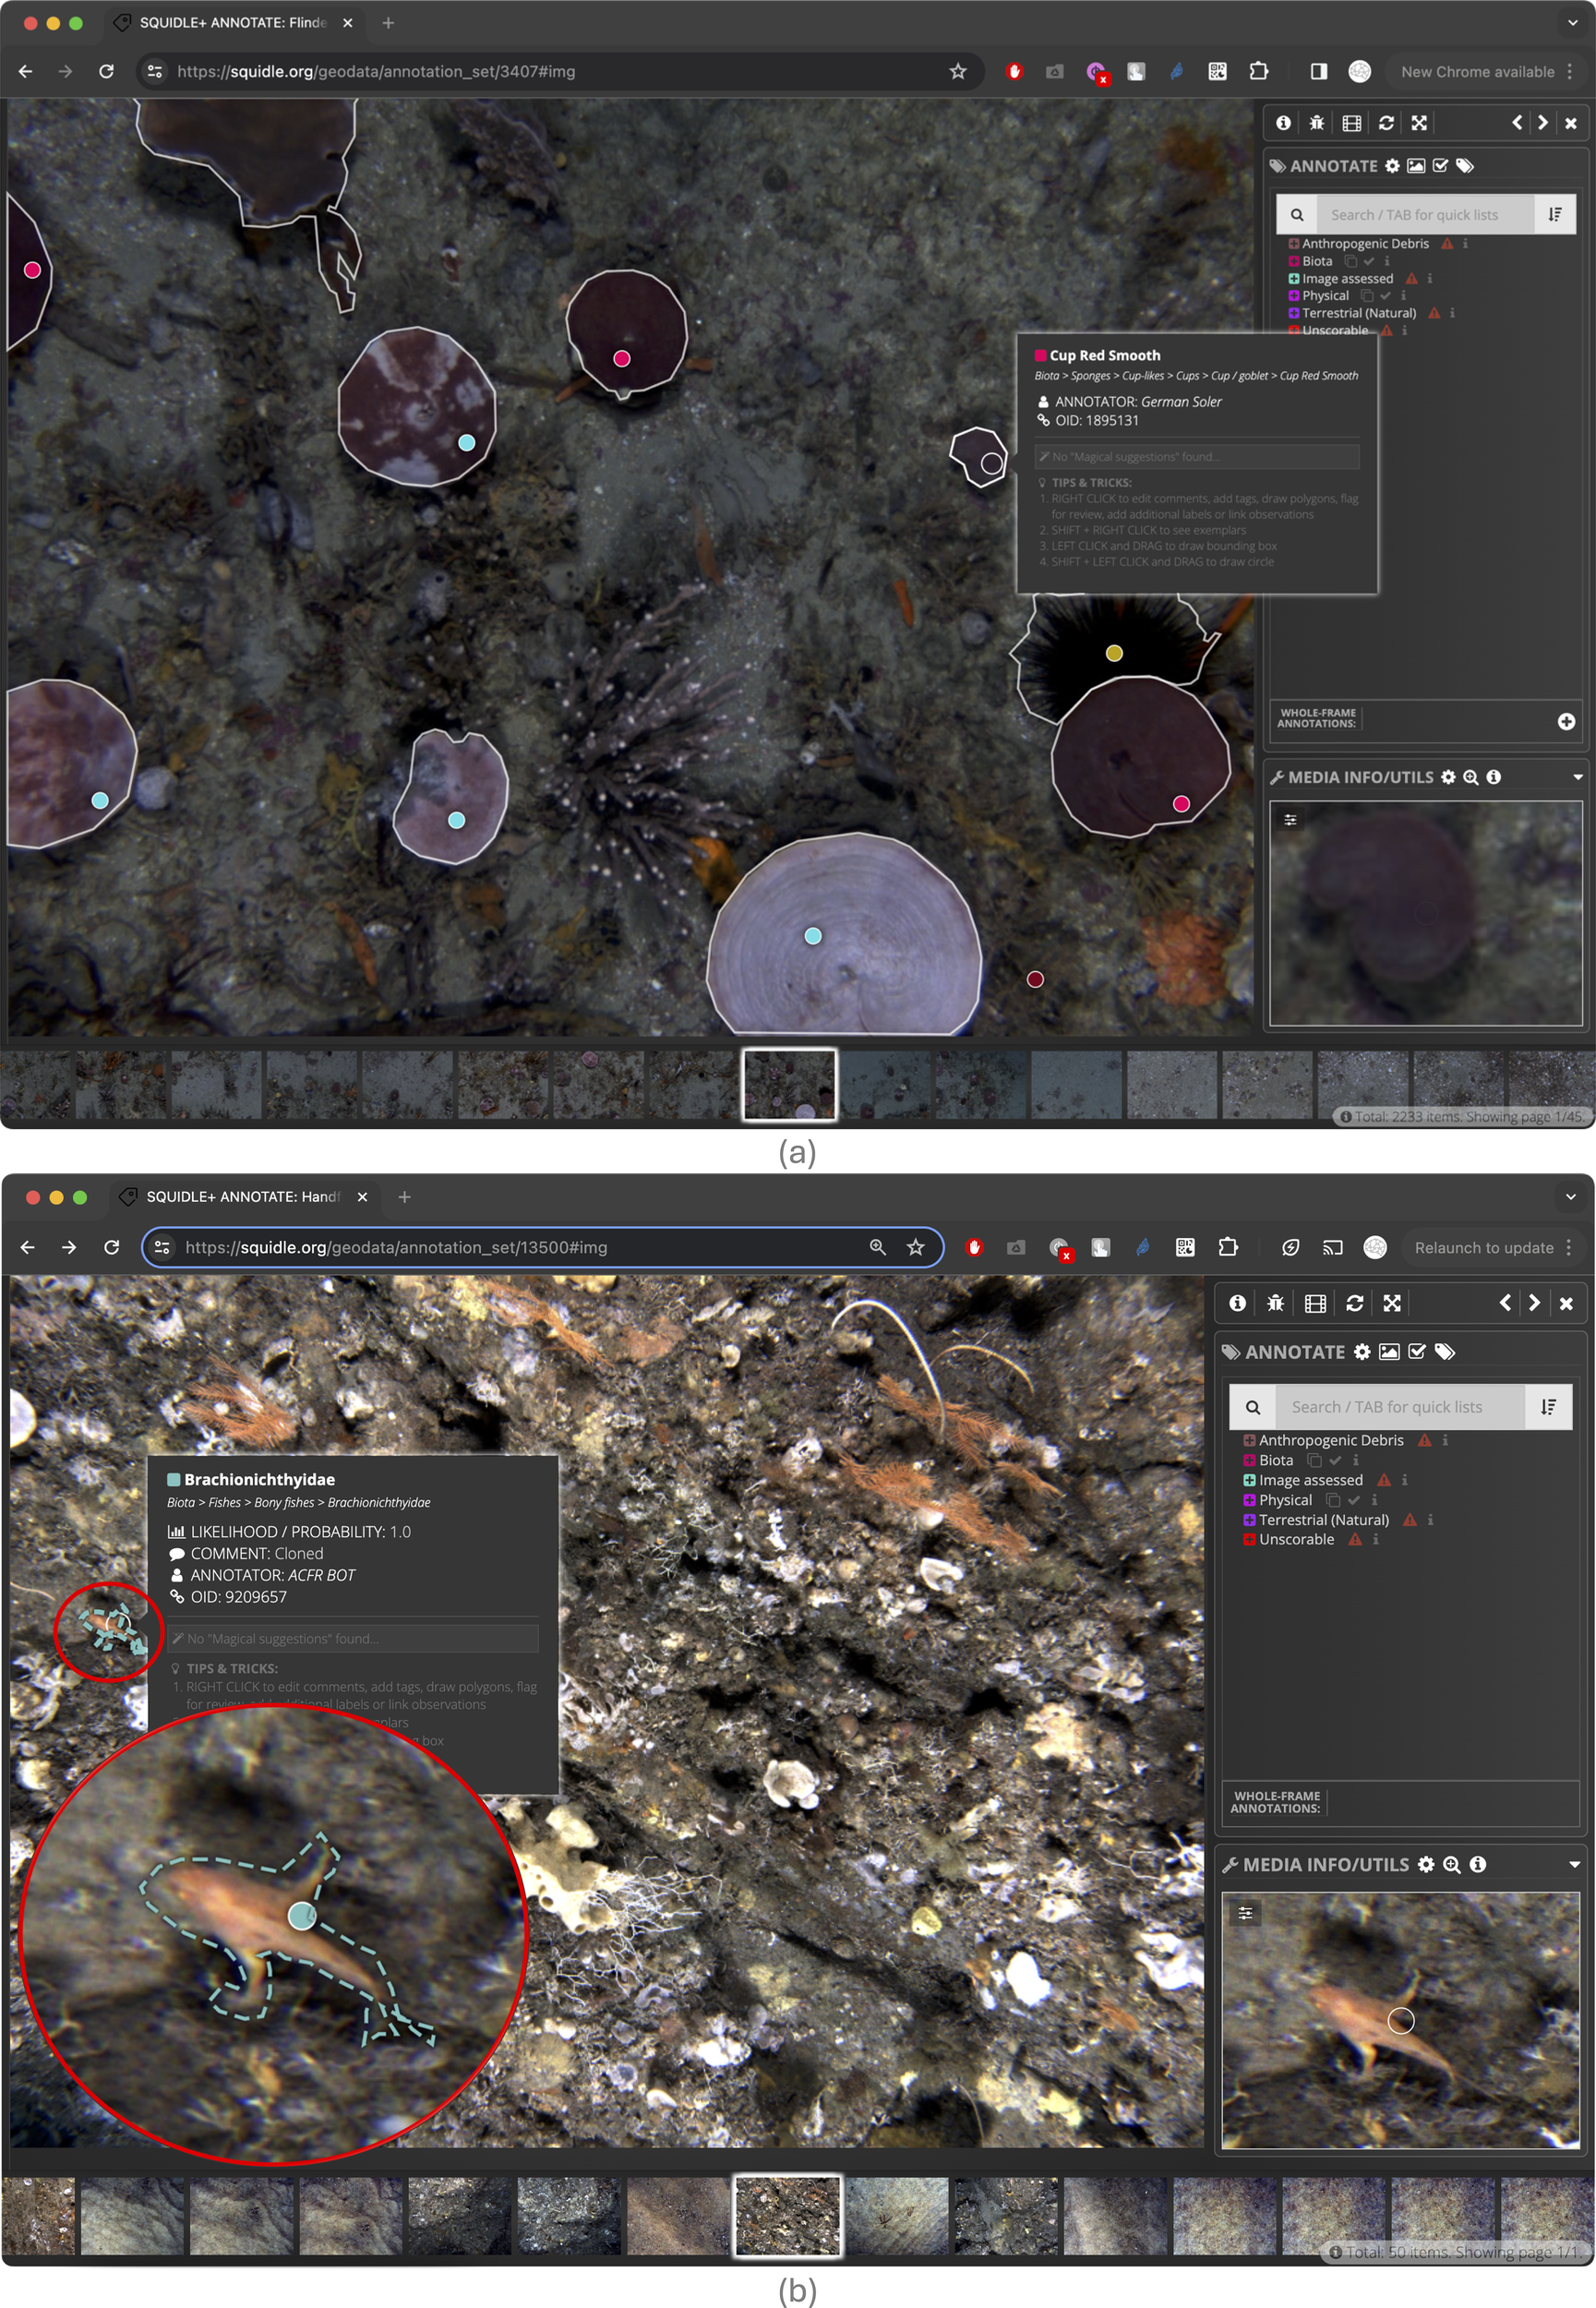
Screenshots of automated segmentation results from algorithms shown in the Squidle+ annotation interface. (a) Shows SAM segmentation algorithm results showing targeted points (with optional bounding boxes), which were automatically converted to tight segmentations around each object; and (b) shows automated detection of the rare and cryptic Handfish by the HDoigBot, which produces a bounding box, that has then been fed into SAM to create a tight polygon.
-
Seamap Australia: a marine decision support tool that integrates seafloor habitat maps with contextual data to facilitate the understanding and management of Australia’s marine resources. Squidle+ map layers and data products contribute to the State of Knowledge reporting, used by Parks Australia. Uses: OGC services (WMS, WFS), API integrations, templating engine, and geospatial query tools.
-
Reef Life Explorer: an interactive platform that examines the health of thousands of reefs worldwide. It displays changes in reef system indicators based on image annotations from Squidle+, using an easy-to-use UI. Using the Label translation outputs from Squidle+’s API, standardised data is exported for educational products, which presents spatial and temporal changes in indicators of reef health in an interactive map interface. Reef Life Explorer allows direct download of indicator data, such as habitat cover, deduced from Squidle+ outputs. Uses: API integrations, export tools with semantic translations to consolidate labels into higher-level indicators.
-
TNC Reef Builder: The Nature Conservancy (TNC) Reef Builder is a project committed to constructing 60 reefs, using UVC-style photo quadrat surveys annotated in Squidle+. The annotation exports are then fed back into Meld Hub, an internal platform of The Nature Conservancy (TNC). Uses: API integrations.
-
AODN Portal: The AODN Portal, which is a CoreTrustSeal certified data repository, provides access to Australian marine and climate science data from IMOS and other partners, including deployment images and annotations from Squidle+. The AODN is supported through IMOS, which is enabled by the National Collaborative Research Infrastructure Strategy (NCRIS). Uses: OGC services (WMS, WFS, WPS), API integrations, and geospatial query tools.
4 Discussion
Squidle+ significantly enhances the efficiency and effectiveness of marine imagery data management, annotation, and analysis by providing a unified, web-based ecosystem for a traditionally fragmented workflow. The platform’s rapid uptake and significant impact, evidenced by its large user base, extensive data holdings, and contributions to numerous scientific publications and reports, underscore its value to the marine science community. Squidle+ addresses several critical challenges in imagery-based research through a unique combination of features that collectively advance the field.
A primary challenge in marine image analysis has been the lack of centralised platforms that facilitate remote collaboration and an end-to-end pipeline for data delivery, discovery and analysis. While numerous desktop and web-based annotation tools exist, most are focused specifically on annotation workflows. Squidle+ distinguishes itself by creating a centralised environment that allows geographically dispersed scientists to access, explore, manage, collaboratively annotate and share datasets. This is managed through a suite of map-based exploration tools and a comprehensive user group framework with granular permissions, which supports advanced and transparent quality control workflows. This collaborative architecture is fundamental to improving the discovery, validation, and subsequent reuse of annotation data, addressing a key bottleneck in the field.
Another significant innovation is the platform’s decoupled architecture for ML integration. Many existing annotation tools that offer automation are often limited to a specific suite of internal ML pipelines. Squidle+ adopts a more flexible approach by treating ML algorithms as “users” within its system. This allows any ML researcher to develop, integrate, and operationalise their models via the system’s API, connecting them with end users who can benefit from the outputs and assist in validating model performance. This framework ensures the platform’s analytical capabilities can evolve with state-of-the-art ML research, creating a symbiotic relationship between marine scientists and ML developers. The successful deployment of various ML models for classification, detection, and segmentation demonstrates the viability of this approach.
Perhaps one of the most persistent barriers to data synthesis in marine science has been the variability in annotation vocabularies. Imposing a single standardised vocabulary is often impractical as it fails to meet the diverse needs of different research projects. Squidle+ addresses this directly through a robust vocabulary translation framework that is unique among current annotation tools. By supporting direct, hierarchical, and semantic mapping between different Label Schemes, the system allows users to work with their preferred vocabularies while enabling data export into a common, standardised format. This functionality is transformative, as it facilitates robust cross-project syntheses, supports large-scale ML model training, and allows for the aggregation of data for high-level reporting, such as State of the Environment assessments.
The platform also excels in its ability to ingest data from diverse, federated repositories while producing standardised outputs. Leveraging a flexible plugin architecture (Section 2.6), Squidle+ harvests metadata from various supported cloud storage systems. This architecture, combined with configurable data transformation operations, allows the platform to index diverse data formats, conforming to defined structures. This ensures that once ingested, it can be queried and exported consistently. This standardisation, combined with its OGC-compliant services and a comprehensive API, promotes exceptional interoperability. This has been demonstrated through successful integrations with third-party platforms like Seamap Australia and Reef Life Explorer, which utilise Squidle+ services for their own data visualisation and reporting tools. The core architecture is media-type agnostic, supporting images, videos, and mosaics, which provides the versatility to handle diverse scientific inquiries. Furthermore, by preserving rich metadata alongside annotations, Squidle+ facilitates compliance with established data standards like DarwinCore (Wieczorek et al., 2012) and iFDOs (Schoening et al., 2022).
Collectively, these features demonstrate a comprehensive implementation of the FAIR principles. The map-based exploration tools enhance Findability; the centralised database and web-based access improve Accessibility; the OGC services, API, and standardised outputs ensure Interoperability; and the vocabulary translation framework, along with the persistent links to original imagery, elevates Reusability beyond what is typically possible.
4.1 Future directions
The foundational design of Squidle+ is not inherently limited to the marine environment; its core functionalities are applicable to any field dealing with large volumes of georeferenced imagery. Future development will focus on expanding this capability to new domains and enhancing the platform’s utility for a broader user base. Many of the same data management and analysis challenges exist, for instance, in terrestrial ecology using aerial drone and satellite imagery for monitoring landscapes, agriculture, and coastal zones (Li et al., 2023; Borja et al., 2024). Future work could explore pilot projects in these areas to adapt and extend the platform’s tools for new data types and scientific questions.
The current Squidle+ user community is predominantly composed of university and government researchers who adhere to Open and FAIR data principles. However, the platform’s tools for streamlined data access, sharing, and annotation are also highly valuable for industry and environmental consulting sectors. We recognise that commercial sensitivities can be a barrier to open data practices. A similar and vital need for controlled data access exists for Traditional Owners managing cultural heritage and Sea Country, where imagery and associated knowledge may have significant cultural sensitivities. To address these parallel needs for both commercial and cultural data stewardship, we are currently scoping enhanced data access controls, including embargo functionalities. Crucially, under this model, while the imagery and detailed annotations would be private, the existence of the dataset (i.e., limited metadata, such as the location and time of the survey) will remain discoverable through the platform’s search and map interfaces. This ‘discoverable but private’ approach allows interested parties to identify relevant datasets and connect directly with the data custodians, be they commercial entities, researchers, or Traditional Owner groups, to formally request access. This framework would empower custodians to manage data sharing according to their specific commercial requirements or cultural protocols, fostering ethical and respectful partnerships. This would also address a key barrier to uptake outside the academic research community, thereby broadening the platform’s potential impact.
Continued advancement in Artificial Intelligence (AI) and ML remains a central priority. We will focus on improving the automation of image analysis, including classification, segmentation, and detection tasks, to further reduce the manual annotation burden on users. A key goal is to develop more intuitive, “human-in-the-loop” interfaces where users can easily review, correct, and retrain ML models directly within the platform. This will not only make the technology more accessible to non-expert users but also accelerate the creation of highly accurate, bespoke models for specific research needs. This continued investment in ML will ensure that Squidle+ remains at the forefront of automated image analysis.
Looking forward, Squidle+ is well-positioned to continue driving innovation in large-scale environmental monitoring. As ecosystems worldwide face increasing pressures from climate change and human activities, the ability to efficiently process and synthesise vast amounts of imagery data is more critical than ever. The insights facilitated by Squidle+ will be invaluable for informing timely and effective conservation and management strategies across multiple domains.
5 Conclusion
Squidle+ has successfully established itself as a critical infrastructure in marine science, transforming how researchers manage, annotate, and analyse imagery data. By providing a centralised, collaborative platform that prioritises interoperability, flexible ML integration, and robust vocabulary standardisation, it directly addresses long-standing bottlenecks in the data-to-knowledge pipeline. The system’s adherence to FAIR principles not only enhances the value of individual research projects but also unlocks the potential for large- scale data synthesis and reuse. The continued development of Squidle+, with a focus on expanding into new domains and improving user-friendly AI tools, promises to further solidify its role as an indispensable tool for data-driven environmental science.
Statements
Data availability statement
The datasets presented in this study can be found in online repositories. The name of the repository is "Squidle+" and it is available here: https://squidle.org.
Author contributions
AF: Conceptualization, Data curation, Formal analysis, Funding acquisition, Investigation, Methodology, Project administration, Resources, Software, Supervision, Validation, Visualization, Writing – original draft, Writing – review & editing. JM: Conceptualization, Data curation, Investigation, Methodology, Project administration, Validation, Writing – original draft, Writing – review & editing. OP: Conceptualization, Investigation, Methodology, Supervision, Validation, Visualization, Writing – original draft, Writing – review & editing, Funding acquisition. DL: Methodology, Resources, Writing – original draft, Writing – review & editing. EO: Data curation, Investigation, Methodology, Writing – original draft, Writing – review & editing. BT: Conceptualization, Methodology, Software, Writing – original draft, Writing – review & editing. AC: Data curation, Investigation, Writing – original draft, Writing – review & editing. RP: Conceptualization, Investigation, Methodology, Writing – original draft, Writing – review & editing. SW: Conceptualization, Funding acquisition, Investigation, Methodology, Project administration, Supervision, Writing – original draft, Writing – review & editing.
Funding
The author(s) declared that financial support was received for this work and/or its publication. Squidle+ underpins the Understanding of Marine Imagery Facility, which is supported by Australia’s Integrated Marine Observing System (IMOS) - IMOS is enabled by the National Collaborative Research Infrastructure Strategy (NCRIS). Additional funding support has been provided by Parks Australia, Climate Change AI, New South Wales Research Attraction and Acceleration Program, CSIRO, Geoscience Australia, New South Wales Department of Primary Industries (Fisheries) and The Nature Conservancy (Australia).
Acknowledgments
Additional individuals whose contributions enrich Squidle+ include the support and feedback from the Understanding of Marine Imagery Steering Committee and numerous imagery contributors and individual annotators. Members from the Reef Life Survey and Seamap Australia teams are also thanked for their ongoing support of the system.
Conflict of interest
Author AF was employed by Greybits Engineering. Author RP was employed by Research Connect Blue.
The remaining authors declare that the research was conducted in the absence of any commercial or financial relationships that could be construed as a potential conflict of interest.
The author(s) declared that they were an editorial board member of Frontiers, at the time of submission. This had no impact on the peer review process and the final decision.
Generative AI statement
The author(s) declare that no Generative AI was used in the creation of this manuscript.
Any alternative text (alt text) provided alongside figures in this article has been generated by Frontiers with the support of artificial intelligence and reasonable efforts have been made to ensure accuracy, including review by the authors wherever possible. If you identify any issues, please contact us.
Publisher’s note
All claims expressed in this article are solely those of the authors and do not necessarily represent those of their affiliated organizations, or those of the publisher, the editors and the reviewers. Any product that may be evaluated in this article, or claim that may be made by its manufacturer, is not guaranteed or endorsed by the publisher.
Supplementary material
The Supplementary Material for this article can be found online at: https://www.frontiersin.org/articles/10.3389/fmars.2025.1677103/full#supplementary-material
References
1
Ahyong S. Boyko C. B. Bailly N. Bernot J. P. Bieler R. Brandão S. N. et al . (2024). World Register of Marine Species (WoRMS). Available online at: https://www.marinespecies.org (Accessed July 2025).
2
Althaus F. Hill N. Ferrari R. Edwards L. Przeslawski R. Schonberg C. H. L. et al . (2015). A standardised vocabulary for identifying benthic biota and substrata from underwater imagery: The CATAMI classification scheme”. In. PloS One10.10, e0141039. doi: 10.1371/journal.pone.0141039
3
Australian Institute of Marine Science (AIMS) (2022). ReefCloud. Web page. Available online at: https://reefcloud.ai/ (Accessed July 2025).
4
(2020). SQUIDLE+ API reference. Web page. Available online at: https://squidle.org/api/help (Accessed July 2025).
5
(2023). PyPi: SQAPI - a python module for working with the SQUIDLE+ API Python Package Index. Available online at: https://pypi.org/project/sqapi/ (Accessed July 2025).
6
Barrett N. S. Monk J. (2021). Progress Towards a Nationally Integrated Benthic Biodiversity Monitoring Program for Australia’s Marine Realm. Report. Report to the National Environmental Science Programme, Marine Biodiversity Hub ( Tasmania, Australia: Institute for Marine and Antarctic Studies, University of Tasmania).
7
Beijbom O. Edmunds P. J. Roelfsema C. M. Smith J. E. Kline D. I. Neal B. P. et al . (2015). Towards automated annotation of benthic survey images: Variability of human experts and operational modes of automation. PloS One10.7, e0130312. doi: 10.1371/journal.pone.0130312
8
Bell J. J. Barnes D. K. A. (2003). The importance of competitor identity, morphology and ranking methodology to outcomes in interference competition between sponges. Mar. Biol.143, 415–426. doi: 10.1007/s00227-003-1081-0
9
Bewley M. Friedman A. Ferrari R. Hill N. Hovey R. Barrett N. S. et al . (2015). Australian sea-floor survey data, with images and expert annotations. Sci. Data2, 150057. doi: 10.1038/sdata.2015.57
10
Boone-Sifuentes T. Nazari A. Razzak I. Bouadjenek M. R. Robles-Kelly A. Ierodiaconou D. et al . (2022). “ Marine-tree: A large-scale marine organisms dataset for hierarchical image classification,” in Proceedings of the 31st ACM International Conference on Information & Knowledge Management. 3838–3842 ( New York, NY, United States: ACM). doi: 10.1145/3511808.3557551
11
Borja A. Berg T. Gundersen H. Hagen A. G. Hancke K. Korpinen S. et al . (2024). Innovative and practical tools for monitoring and assessing biodiversity status and impacts of multiple human pressures in marine systems. Environ. Monit. Assess.196, 694. doi: 10.1007/s10661-024-13009-w
12
Bosch N. E. Monk J. Goetze J. S. Wilson S. K. Babcock R. C. Barrett N. S. et al . (2022). Effects of human footprint and biophysical factors on the body-size structure of fished marine species. Conserv. Biol.36, e13807. doi: 10.1111/cobi.13807
13
Carroll A. G. Monk J. Barrett N. S. Nichol S. L. Dalton S. J. Dando N. et al . (2021). Elizabeth and Middleton Reefs, Lord Howe Marine Park, Post Survey Report. Report. Geoscience Australia. Available online at: https://figshare.utas.edu.au/articles/report/Elizabeth_and_Middleton_Reefs_Lord_Howe_Marine_Park_Post_Survey_Report/23199881 (Accessed July 2025).
14
Doig H. Pizarro O. Monk J. Williams S. B. (2024). Detecting endangered marine species in autonomous underwater vehicle imagery using point annotations and few-shot learning. arXiv. preprint. arXiv:2406.01932. arXiv.: 2406.01932. doi: 10.48550/arXiv.2406.01932
15
Edgar G. J. Stuart-Smith R. D. Heather F. J. Barrett N. S. Turak E. Sweatman H. et al . (2023). Continent-wide declines in shallow reef life over a decade of ocean warming. Nature615, 858–865. doi: 10.1038/s41586-023-05833-y
16
Friedman A. (2018). MarineDB: An online API-based platform for managing, exploring & annotating georeferenced images, video & large-scale mosaics. Bitbucket Repository. Available online at: https://bitbucket.org/ariell/marinedb (Accessed July 2025).
17
Friedman A. (2020). SQUIDLE+ API. Available online at: https://squidle.org/api/help (Accessed May 16, 2023).
18
Friedman A. (2023). PyPi: SQAPI - a python module for working with the SQUIDLE+ API. Available online at: https://pypi.org/project/sqapi/ (Accessed May 16, 2023).
19
Friedman A. Günzel L. Doig H. Jackett C. Rawlinson K. (2024). SQBOT - A repository to deploy machine learning algorithms on Squidle+. Bitbucket Repository. Available online at: https://bitbucket.org/ariell/sqbot (Accessed July 2025).
20
Goetze J. S. Wilson S. K. Radford B. Fisher R. Langlois T. J. Monk J. et al . (2021). Increased connectivity and depth improve the effectiveness of marine reserves. Global Change Biol.27, 3432–3447. doi: 10.1111/gcb.15635
21
Günzel L. Monk J. Jackett C. Friedman A. Bastiaansen A. Najafi A. et al . Harnessing the power of SQUIDLE+ to develop flexible machine learning models. Environ. Model. Softw. in review.
22
Hayes K. R. Dunstan P. K. Woolley S. N. C. Barrett N. S. Howe S. A. Samson C. R. et al . (2021). Designing a Targeted Monitoring Program to Support Evidence Based Management of Australian Marine Parks: A Pilot on the South-East Marine Parks Network. Report. Report to Parks Australia and the National Environmental Science Program, Marine Biodiversity Hub (Hobart, Australia: Parks Australia, University of Tasmania and CSIRO).
23
Hedge P. Souter D. Jordan A. Trebilco R. Ward T. van Ruth P. et al . (2022). Establishing and supporting a national marine baselines and monitoring program: Advice from the Marine Baselines and Monitoring Working Group. Report (Australia’s National Marine Science Committee). Available online at: https://www.marinescience.net.au/wp-content/uploads/2022/11/NMSC-Marine-Baselines-and-Monitoring-Working-Group-Advice-Final-Report.pdf (Accessed July 2025).
24
Jackett C. Althaus F. Maguire K. Farazi M. R. Scoulding B. Untiedt C. et al . (2023). A benthic substrate classification method for seabed images using deep learning: application to management of deep-sea coral reefs. J. Appl. Ecol.60, 1254–1273. doi: 10.1111/1365-2664.14408
25
Katija K. Orenstein E. Schlining B. Lundsten L. Barnard K. Sainz G. et al . (2022). FathomNet: A global image database for enabling artificial intelligence in the ocean. Sci. Rep.12, 1565. doi: 10.1038/s41598-022-19939-2
26
Kirillov A. Mintun E. Ravi N. Mao H. Rolland C. Gustafson L. et al . (2023). “ Segment anything,” in Proceedings of the IEEE/CVF International Conference on Computer Vision. 3892–3902 ( Paris, France: IEEE/CVF).
27
Langenkämper D. Zurowietz M. Schoening T. Nattkemper T. W. (2017). BIIGLE 2.0-browsing and annotating large marine image collections. Front. Mar. Sci.4. doi: 10.3389/fmars.2017.00083
28
Langlois T. J. Monk J. Giraldo-Ospina A. Gibbons B. Adams K. R. Barrett N. S. et al . (2021). South-West Corner Marine Park Post Survey Report. Report ( University of Western Australia). Available online at: https://figshare.utas.edu.au/articles/report/South-West_Corner_Marine_Park_Post_Survey_Report/23199935 (Accessed July 2025).
29
Li Y. Gundersen H. Poulsen R. N. Xie L. Ge Z. Hancke K. (2023). Quantifying seaweed and seagrass beach deposits using high-resolution UAV imagery. J. Environ. Manage.331, 117171. doi: 10.1016/j.jenvman.2022.117171
30
Lowe S. C. Misiuk B. Xu I. Abdulazizov S. Baroi A. R. Bastos A. C. et al . (2024). BenthicNet: A global compilation of seafloor images for deep learning applications. Sci. Data11, 671. doi: 10.1038/s41597-025-04491-1
31
Lucieer V. L. Flukes E. Walsh P. Monk J. (2024). Seamap Australia: State of Knowledge Report- South East. Available online at: https://seamapAustralia.org/region-reports/south-east/ (Accessed July 2025).
32
Marcon Y. Ratmeyer V. Kottmann R. Boetius A. (2015). “ A participative tool for sharing, annotating and archiving submarine video data,” in OCEANS 2015 - MTS/IEEE Washington ( Washington, US: IEEE), 1–7. doi: 10.23919/OCEANS.2015.7404630
33
Marsh L. Copley J. T. Huvenne V. A. I. Tyler P. A . (2013). Getting the bigger picture: Using precision Remotely Operated Vehicle (ROV) videography to acquire high-definition mosaic images of newly discovered hydrothermal vents in the Southern Ocean. Deep. Sea. Res. Part II.: Topical. Stud. Oceanogr.92, 124–135. doi: 10.1016/j.dsr2.2013.02.007
34
Massot-Campos M. Yamada T. Thornton B. (2023). “ Towards sensor agnostic artificial intelligence for underwater imagery,” in 2023 IEEE Underwater Technology (UT) IEEE ( Tokyo, Japan: IEEE), 1–6. doi: 10.1109/UT49729.2023.10103403
35
Miloslavich P. Bax N. J. Simmons S. E. Klein E. Appeltans W. Aburto-Oropeza O. et al . (2018). Essential ocean variables for global sustained observations of biodiversity and ecosystem changes. Global Change Biol.24, 2416–2433. doi: 10.1111/gcb.14108
36
Muller-Karger F. E. Miloslavich P. Bax N. J. Simmons S. E. Costello M. J. Sousa Pinto I. et al . (2018). Advancing marine biological observations and data requirements of the complementary essential ocean variables (EOVs) and essential biodiversity variables (EBVs) frameworks. Front. Mar. Sci.5. doi: 10.3389/fmars.2018.00211. ISSN: 2296-7745.
37
Perkins N. R. Monk J. Barrett N. S. (2021). Analysis of a time-series of benthic imagery from the South-east Marine Parks Network. Report. Report to Parks Australia (University of Tasmania: Institute of Marine and Antarctic Studies).
38
Perkins N. R. Monk J. Soler G. A. Gallagher P. Barrett N. S. (2022). Bleaching in sponges on temperate mesophotic reefs observed following marine heatwave events. Climate Change Ecol.3, 100046. doi: 10.1016/j.ecochg.2021.100046. ISSN: 2666-9005.
39
Przeslawski R. Falkner I. Foster S. D. Mancini S. Bainbridge S. Bax N. J. et al . (2018). Data discoverability and accessibility. Report 2018/14 ( Canberra, Australia: Geoscience Australia).
40
Przeslawski R. Foster S. D. Monk J. Barrett N. S. Bouchet P. J. Carroll A. G. et al . (2019). A suite of field manuals for marine sampling to monitor Australian waters. Front. Mar. Sci.6. doi: 10.3389/fmars.2019.00177
41
Rawlinson K. Spyksma A. J. P. Miller K. I. Friedman A. Grosvenor C. Heidari S. et al . (2025). Urchinbot: An open-source model for the rapid detection and classification of habitat-modifying sea urchin species. Mar. Environ. Res. doi: 10.1016/j.marenvres.2025.107662
42
Rees A. J. J. Yearsley G. K. Gowlett-Holmes K. Pogonoski J. (2024). Codes for Australian Aquatic Biota (CAAB). Available online at: https://www.marine.csiro.au/data/caab/ (Accessed July 2025).
43
Sangekar M. Friedman A. Hidaka M. Hosono T. Lindsay D. J. (2023). “ Squidjam: A video annotation ecosystem,” in 2023 IEEE Underwater Technology (UT) ( Tokyo, Japan: IEEE), 1–5. doi: 10.1109/UT49729.2023.10103435
44
Schlining B. M. Stout N. J. (2006). “ MBARI’s video annotation and reference system,” in OCEANS 2006 ( Boston, MA, USA: IEEE), 1–5. doi: 10.1109/OCEANS.2006.307049
45
Schoening T. Durden J. M. Faber C. Felden J. Heger K. Hoving H.J. T. et al . (2022). “ Making marine image data FAIR,” in Scientific Data, vol. 9, 414. doi: 10.1038/s41597-022-01491-3
46
Stuart-Smith R. D. Edgar G. J. Clausius E. Oh E. S. Barrett N. S. Emslie M. J. et al . (2022). Tracking widespread climate-driven change on temperate and tropical reefs”. In. Curr. Biol.32.19, 4128–4138.e4. doi: 10.1016/j.cub.2022.07.067
47
Stuart-Smith R. D. Mellin C. Bates A. E. Edgar G. J. (2021). Habitat loss and range shifts contribute to ecological generalization among reef fishes. Nat. Ecol. Evol.5, 656–662. doi: 10.1038/s41559-020-01342-7
48
Taviani M. Foglini F. Castellan G. Montagna P. McCulloch M. T. Trotter J. A. (2023). First assessment of anthropogenic impacts in submarine canyon systems off southwestern Australia. Sci. Total. Environ.857, 159243. doi: 10.1016/j.scitotenv.2022.159243. ISSN: 0048-9697.
49
Trebilco R. Fischer M. Hunter C. M. Hobday A. J. Thomas L. Evans K. (2021). Australia state of the environment 2021: marine. Report. Independent report to the Australian Government Minister for the Environment (Canberra: Department of Agriculture, Water and the Environment).
50
United Nations (2021). The Second World Ocean Assessment. Report (United Nations).
51
University of Auckland (2024). AI ‘UrchinBot’ will find sea urchins ravaging our coasts. Available online at: https://www.auckland.ac.nz/en/news/2024/07/03/ai–urchinbot–will-find-sea-urchins-ravaging-our-coasts.html (Accessed July 2025).
52
Wieczorek J. Bloom D. Guralnick R. Blum S. Döring M. Giovanni R. et al . (2012). Darwin Core: an evolving community-developed biodiversity data standard. PloS One7, e29715. doi: 10.1371/journal.pone.0029715
53
Wilkinson M. D. Dumontier M. Aalbersberg I. J. J. Appleton G. Axton M. Baak A. et al . (2016). The FAIR Guiding Principles for scientific data management and stewardship. Sci. Data3, 160018. doi: 10.1038/sdata.2016.18
54
Williams I. D. Couch C. S. Beijbom O. Oliver T. A. Vargas-Angel B. Schumacher B. D. et al . (2019). Leveraging automated image analysis tools to transform our capacity to assess status and trends of coral reefs. Front. Mar. Sci.6. doi: 10.3389/fmars.2019.00222
55
Young M. Porskamp P. Critchell K. Treml E. A. Ierodiaconou D. Pocklington J. et al . (2022). Statewide assessment of Victorian marine protected areas using existing data. Technical Report 156 (Melbourne, Victoria).
56
Zintzen V. Anderson M. J. Roberts C. D. Harvey E. S. Stewart A. L. (2017). Effects of latitude and depth on the beta diversity of New Zealand fish communities. Sci. Rep.7, 8081. doi: 10.1038/s41598-017-08427-7
Summary
Keywords
FAIR (findable accessible interoperable and reusable) principles, marine imagery data management, web-based image annotation, collaborative workflows, machine-learning integration, vocabulary translation framework, geospatial exploration (OGC-compliant), underwater image repository
Citation
Friedman A, Monk J, Pizarro O, Lindsay D, Oh E, Thornton B, Carroll A, Przeslawski R and Williams S (2026) Squidle+: a collaborative platform to manage, discover and annotate marine imagery. Front. Mar. Sci. 12:1677103. doi: 10.3389/fmars.2025.1677103
Received
31 July 2025
Revised
29 October 2025
Accepted
17 November 2025
Published
30 January 2026
Volume
12 - 2025
Edited by
Philipp Friedrich Fischer, Alfred Wegener Institute Helmholtz Centre for Polar and Marine Research (AWI), Germany
Reviewed by
Daniel Langenkämper, Bielefeld University, Germany
Tiffany C. Vance, U.S. Integrated Ocean Observing System, United States
Vicki Ferrini, Columbia University, United States
Updates
Copyright
© 2026 Friedman, Monk, Pizarro, Lindsay, Oh, Thornton, Carroll, Przeslawski and Williams.
This is an open-access article distributed under the terms of the Creative Commons Attribution License (CC BY). The use, distribution or reproduction in other forums is permitted, provided the original author(s) and the copyright owner(s) are credited and that the original publication in this journal is cited, in accordance with accepted academic practice. No use, distribution or reproduction is permitted which does not comply with these terms.
*Correspondence: Oscar Pizarro, oscar.pizarro@ntnu.no; Ariell Friedman, ariell@greybits.com.au
Disclaimer
All claims expressed in this article are solely those of the authors and do not necessarily represent those of their affiliated organizations, or those of the publisher, the editors and the reviewers. Any product that may be evaluated in this article or claim that may be made by its manufacturer is not guaranteed or endorsed by the publisher.