Abstract
This study investigated the summer subsurface marine heatwaves (SSMHWs) in the East/Japan Sea (EJS) using the Japan Coastal Ocean Predictability Experiment 2 ocean reanalysis datasets during 1993–2023. Climatologically, the cumulative (maximum) intensity area-averaged over the EJS ranges from 20°C days (2.5°C) at surface to its maximum of 36°C days (4°C) at approximately 70 m, confirming significant subsurface intensification of summer MHWs. Compared with the almost uniform spatial patterns at surface, the intensities of MHWs at subsurface layers show substantial spatial variations. The SSMHWs in the EJS are caused not by surface atmospheric forcings, but primarily by internal oceanic processes. During summer, the strong stratification in the EJS inhibits the vertical mixing and traps more heat fluxes at surface. As the main heat sources of the upper ocean, the Tsushima Warm Current (TWC) plays a crucial role in triggering SSMHWs in the EJS. Anomalous increased volume transport of TWC carries more warm water into the EJS, favoring the basin-scale intense SSMHWs. This warm water is redistributed by the East Korean Warm Current and mesoscale eddies, leading to regional features of SSMHWs in the EJS. Our results highlighted the roles of oceanic circulation in forming intense SSMHWs in the EJS.
1 Introduction
Marine heatwaves (MHWs) are extremely warm events that last from several days to months (Hobday et al., 2016; Li et al., 2024a, 2024b; Song et al., 2024). MHWs have occurred extensively in upper global oceans, with increasing frequency and longer duration during the past century (Oliver et al., 2018). MHWs have substantial impacts on the marine ecosystems, communities and economies (Hughes et al., 2018; Smale et al., 2019; Smith et al., 2023; Szuwalski et al., 2023). A MHW event is defined as the sea surface temperature (SST) exceeds the 90th percentile of the climatology temperature and lasts for more than five days in the region (Hobday et al., 2016). MHWs have been extensively studied at the sea surface due to the availability of high resolution, long period and large spatial coverage satellite SST dataset (Oliver et al., 2021). However, the subsurface MHWs are still not fully understood, because of the lack of continuous in situ temperature observations over the entire water column (Wyatt et al., 2023; Yao et al., 2020).
The East/Japan Sea (EJS) is a semienclosed sea located in the midlatitudes of the Northwest Pacific (Figure 1), one of the regions that experienced significant upper ocean warming during the past decades (Wang and Wu, 2022). Owning to the warming oceanic conditions, severe summer MHW events have occurred in the EJS in recent years (Chen et al., 2023; Choi et al., 2022; Pak et al., 2022; Wang et al., 2022; Yao et al., 2020). For example, record-breaking MHW events occurred during July to August 2021, which were at the maximum intensity since 1982. Choi et al. (2022) investigated the summer MHWs in the EJS during 1982–2018 and proposed that the summer MHWs are due to enhanced solar radiation into the ocean. Pak et al. (2022) showed that the extreme MHWs during 2021 summer were caused by anomalous high-pressure atmospheric circulation. These studies primarily focused on the MHWs at sea surface and concluded that anomalous atmospheric forcings related to teleconnection play crucial roles in forming summer surface MHWs in the EJS.
Figure 1
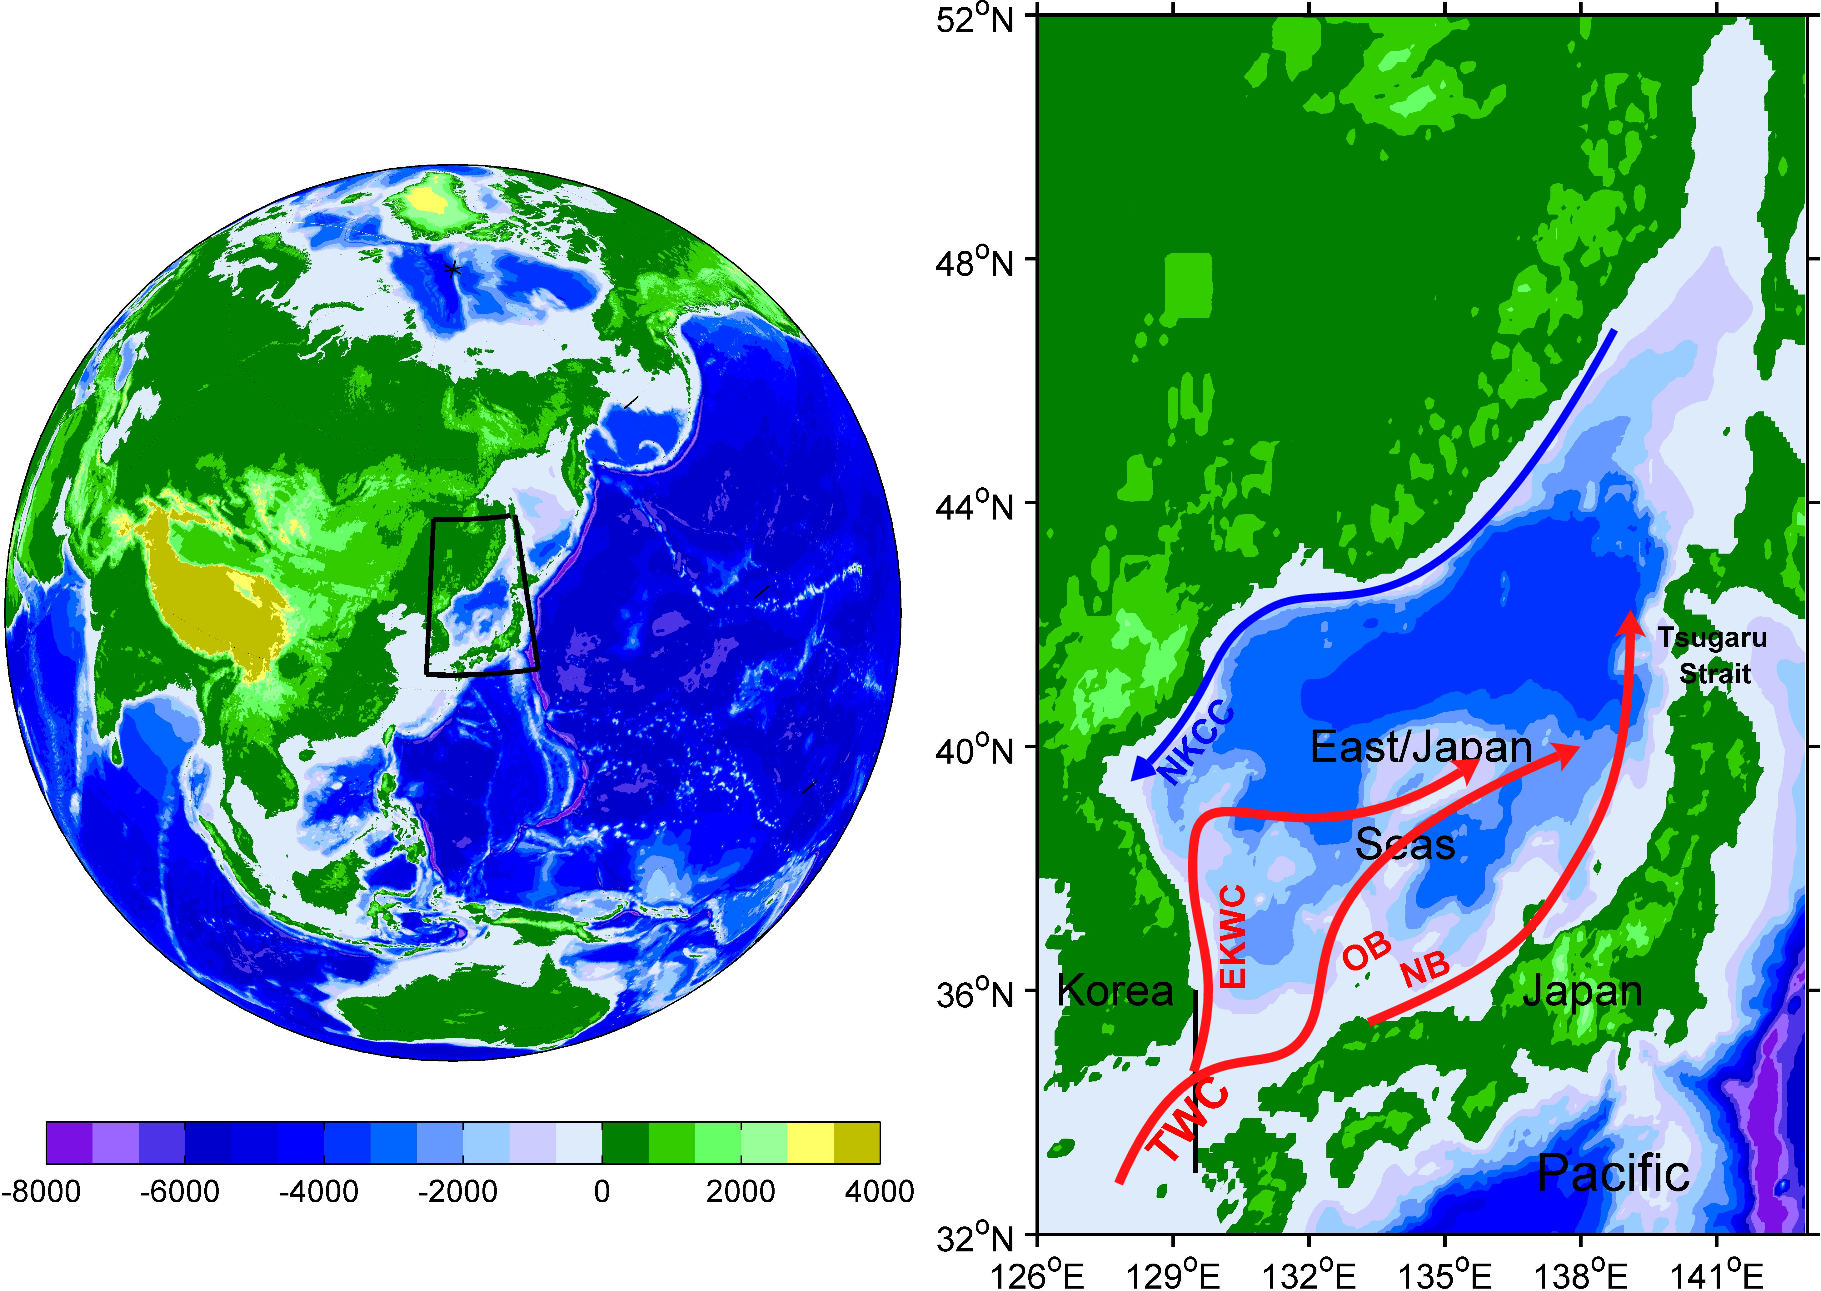
The topography (color, m) in the study area and summer surface current schematic in the East/Japan Sea. The red arrows indicate the Tsushima Warm Current (TWC) and its branches: the East Korean Warm Current (EKWC), offshore branch (OB) and nearshore branch (NB). The blue arrow represents the North Korea Coastal Current (NKCC). The black line represents a meridional section at 129.5°E to estimate the volume transport of TWC.
As a marginal sea surrounded by the East Asian continent, the EJS is strongly influenced by oceanic circulation systems. The Kuroshio Current (KC) is a western boundary current in the Northwest Pacific, flowing along the continental slope and carrying substantial tropical warm water to north. The Tsushima Warm Current (TWC) originating from the KC enters the EJS through the Tsushima Strait, is the main heat sources of the upper ocean in the EJS (the annual volume transport of TWC into the EJS is approximately 2.5 Sv (Sv=106 m3/s)) (Fukudome et al., 2010; Isobe, 2008; Takikawa et al., 2005; Teague et al., 2005). After entering the EJS, the TWC splits into several branches downstream of the Tsushima Strait: an East Korean Warm Current (EKWC) flows northward along the Korean coast of Korea, a nearshore branch (NB) flows along the western coast of Japan and an offshore branch (OB) between them (Figure 1). In addition, the EJS is characterized by abundant mesoscale eddies especially in the southern basin (Chang et al., 2004, 2017; Chelton et al., 2011). These branches of the TWC as well as mesoscale eddies thus play important roles in redistributing the warm water in the EJS. The volume transports of the KC and TWC show clear interannual variability, which is related to the Pacific Decadal Oscillation (PDO) (Andres et al., 2009; Gordon and Giulivi, 2004; Soeyanto et al., 2014). During negative PDO phases, the KC tends to weaken, leading to an increased volume transport of the TWC into the EJS. Under such conditions, the EJS receives more warm water that favors the formations of MHWs in the upper 200 m layers. Subsurface MHWs in the EJS were reported by a recent study of Saranya and Nam (2024), in which oceanic reanalysis datasets were used to characterize the vertical structure of MHWs in several representative subregions of the EJS. However, to date, the subsurface MHWs in the EJS are still poorly understood, and their characteristics and formation mechanisms need further investigation.
In this study, we primarily aimed at investigating the characteristics of summer subsurface MHWs in the EJS as well as their potential triggers. To achieve this goal, high-resolution oceanic reanalysis datasets were used to quantify the basin-scale features of the summer subsurface MHWs in the EJS. Then, processes responsible for their formations were illustrated. The rest of this paper was organized as follows. In Section 2, the materials and methods used in this study were described. In Section 3, we used the reanalysis datasets to quantify the characteristics of the summer MHWs with depth in the EJS and further investigated their formation mechanisms. The main results were discussed in Section 4, and a summary and discussion were provided in Section 5.
2 Materials
2.1 Data
To investigate the MHWs with depth in the EJS, we used the daily sea temperature and velocity data provided by the Japan Coastal Ocean Predictability Experiment 2 (JCOPE2) ocean reanalysis system (Miyazawa et al., 2008). The JCOPE2 reanalysis datasets are generated using a general ocean circulation model to which satellite-derived sea surface height anomalies, satellite-derived SST, and vertical profile data of temperature and salinity obtained from the Global Temperature-Salinity Profile Program are assimilated. The JCOPE2 reanalysis datasets have a horizontal resolution of 1/12°×1/12° and are available from 1993 to present. In this study, we used the JCOPE2 reanalysis datasets from 1993 to 2023 for analysis.
Based on the JCOPE2 velocity data, eddy kinetic energy (EKE) was calculated as , where and are the zonal and meridional perturbation currents that are referenced to the mean of 1993–2023. In addition, the volume transport of TWC across a meridional section at 129.5°E (Figure 1) was estimated using the JCOPE2 dataset. The volume transport was defined as , where is the eastward velocity, is the distance between two adjacent grid points along the section, is the vertical level of the JCOPE2 data, is the water depth.
The 0.25°×0.25°, daily satellite SST data from the National Oceanic and Atmospheric Administration Optimum Interpolation Sea Surface Temperature (OISST) High Resolution Dataset Version 2 were used due to its high resolution and comprehensive temporal coverage (Reynolds et al., 2007). The OISST V2 data are available from 1981 to present. The PDO index was obtained from the National Center for Environmental Information, NOAA (Zhang et al., 1997). We used the daily solar radiation data provided by the National Center for Environmental Prediction/National Center for Atmospheric Research Reanalysis (Kalnay et al., 1996).
2.2 Definition of MHWs
We defined MHWs as a discrete anomalously warm event in which the SST is above the 90th percentile threshold based on the climatological daily mean and persists for more than five days (Hobday et al., 2016). The duration represents the time period from the start to end dates of a MHW event, mean and maximum intensities indicate the mean and maximum temperature anomalies during a MHW event, respectively. Cumulative intensity denotes the sum of temperature anomalies during a MHW event, is an integration of duration and mean intensity. In this study, we used the daily JCOPE2 sea temperature during the summers (June–August) of 1993–2023 to estimate the MHWs at each grid point.
3 Results
3.1 Standard deviation of temperature anomaly in the EJS
Figure 2 shows the spatial patterns of standard deviation of temperature anomaly (SDTA) at surface, 50, 100, 150 and 200 m layers in the EJS during summer. One of the most prominent features is that the SDTA is much larger at subsurface than at surface. At surface, the SDTA is almost uniform with a value of approximately 1.5°C (Figure 2A). This indicates that large-scale atmospheric forcings play an important role in affecting the SSTA during summer. At 50 m layer, the SDTA reaches to approximately 2.5°C and shows evident spatial variations: relatively larger SDTA values occur in the southern basin (Figure 2B). At 100 m layer, the SDTA is much larger in the south (> 3°C) and is smaller in the north: leading to evident south-north gradient in the EJS (Figure 2C). From 150 to 200 m, the SDTA decreases slowly in the southern EJS while it decays sharply in the northern EJS (Figures 2D, E). Vertically, the SDTA area-averaged over the EJS is homogeneous at 0–10 m layers and then increases quickly from surface to subsurface layers (Figure 2F).
Figure 2
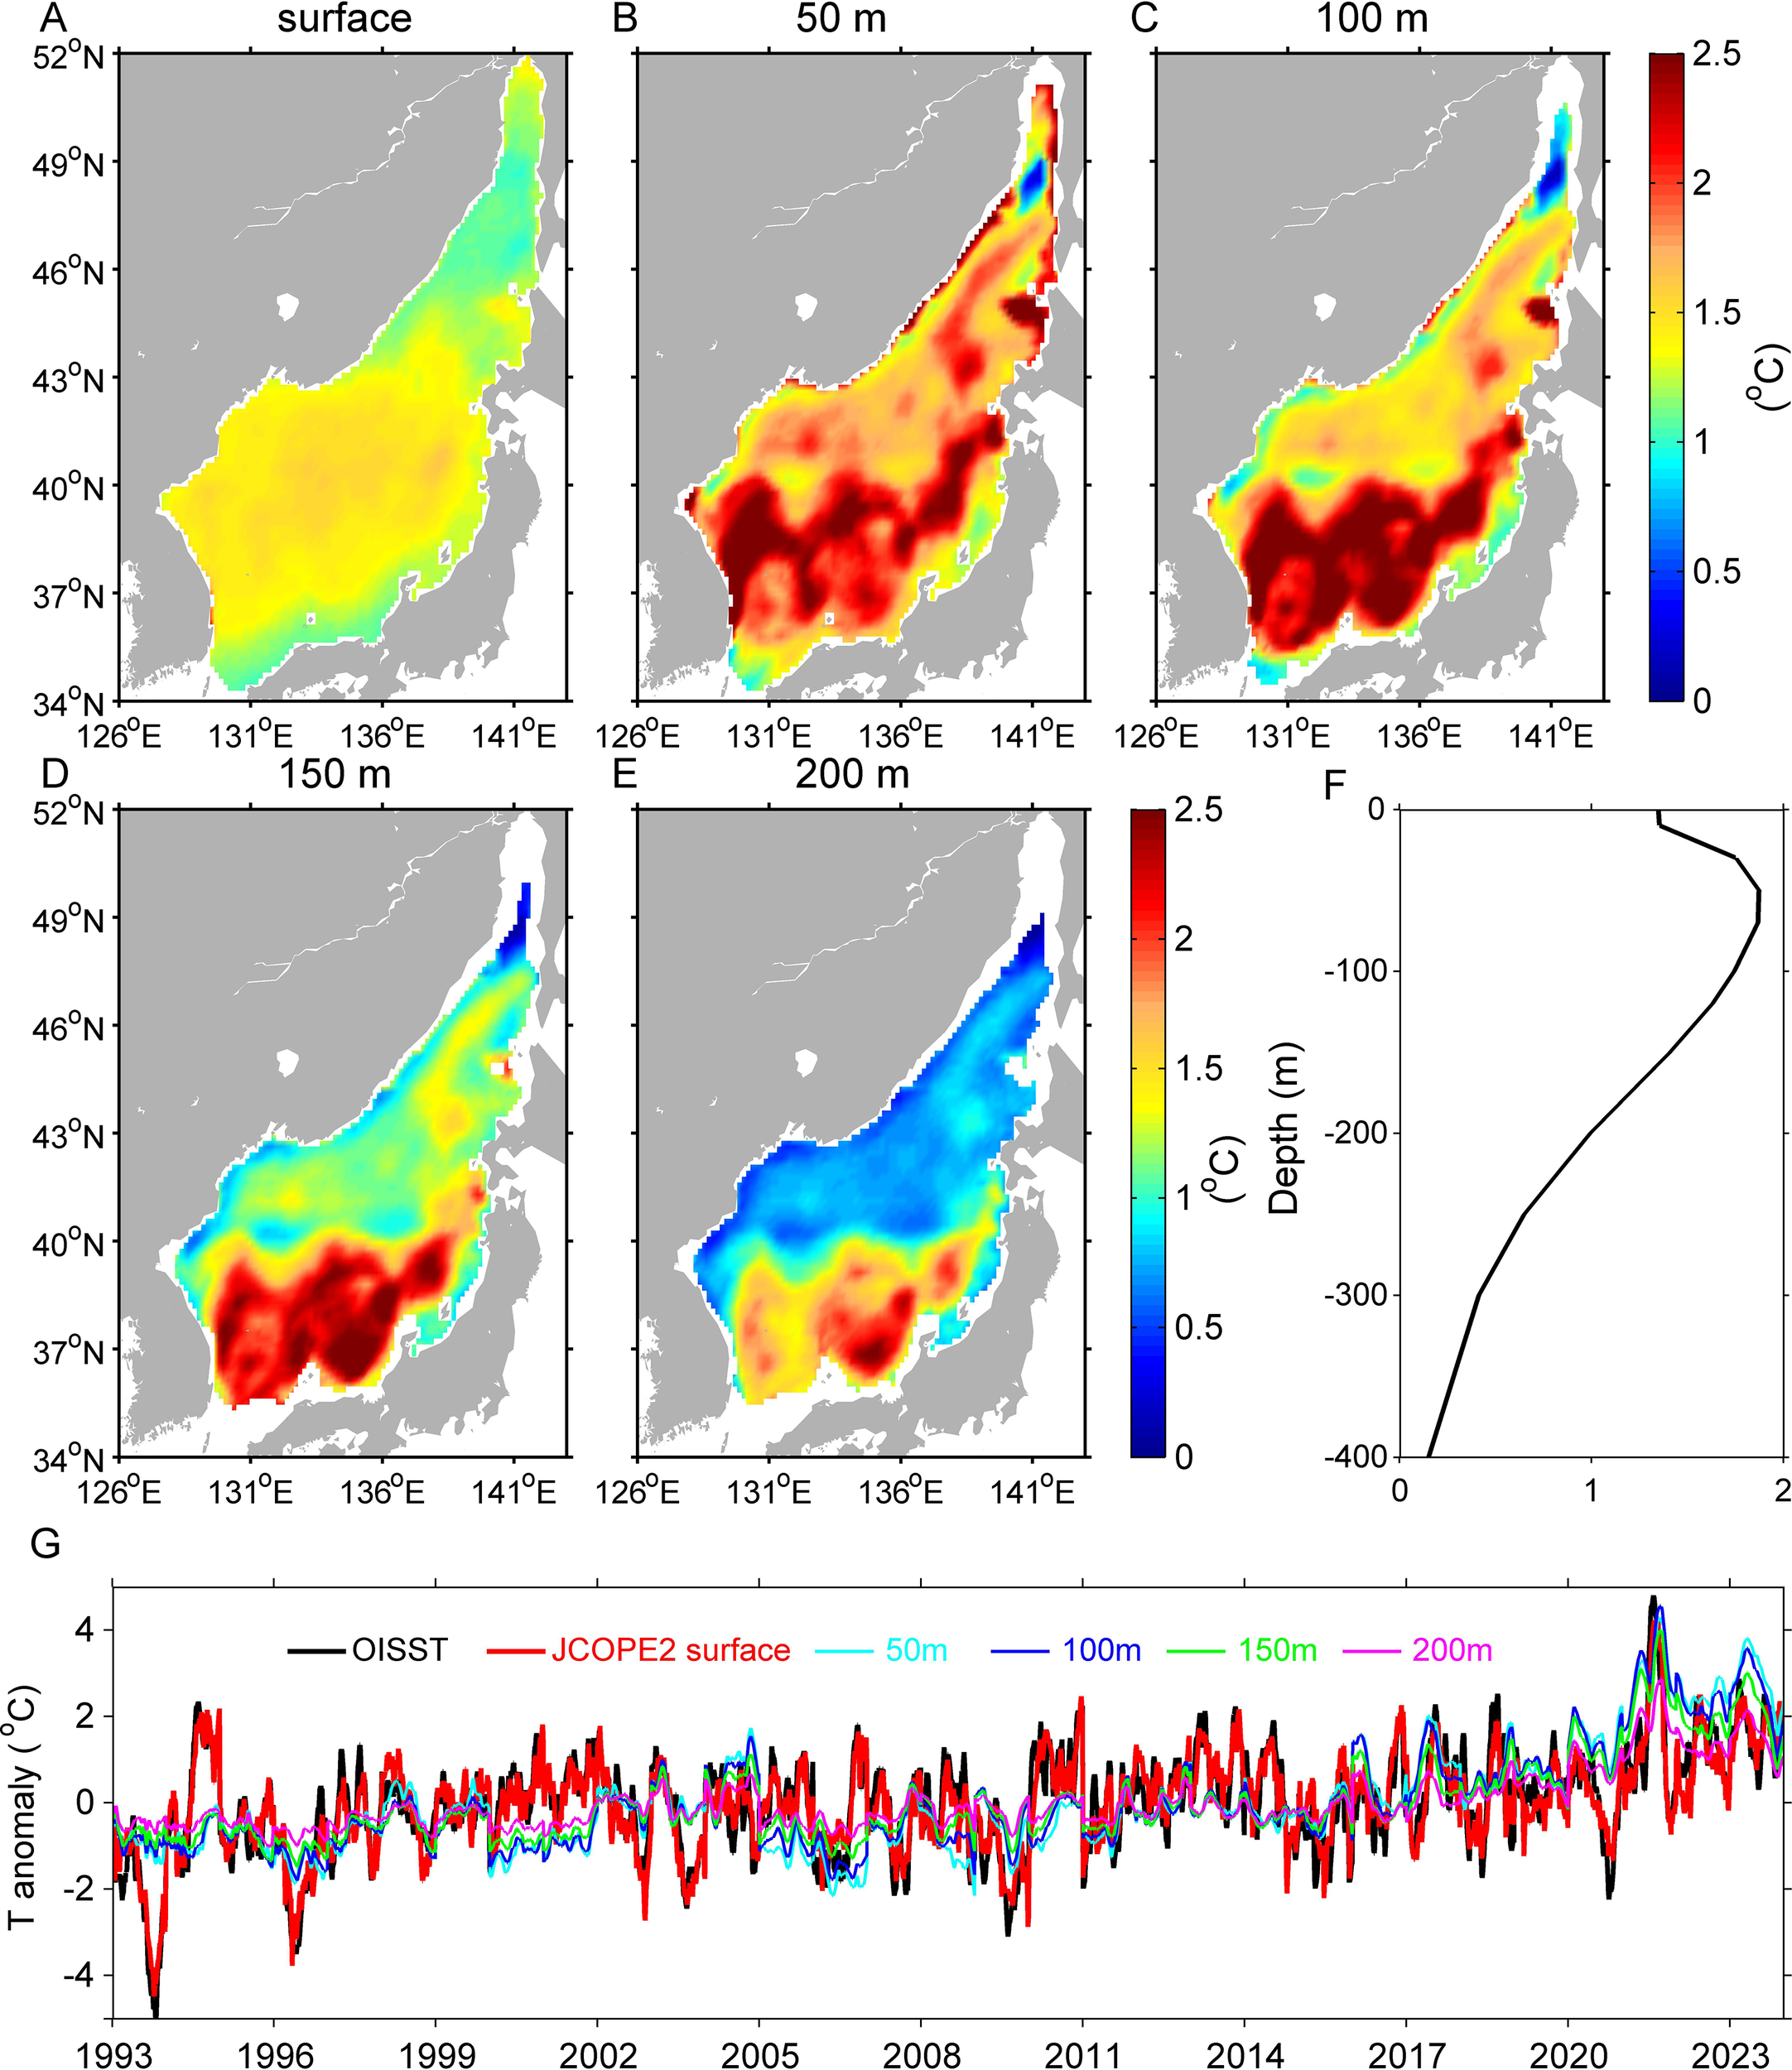
Spatial patterns of standard deviation of temperature anomaly (SDTA) at surface, 50, 100, 150 and 200 m layers (A–E), (F) vertical profile of SDTA area-averaged over the EJS during summer. (G) Daily time series of summer temperature anomaly area-averaged over the EJS at surface (red), 50 (cyan), 100 (blue), 150 (green) and 200 m (purple) layers based on the JCOPE2 datasets. The black line represents the daily SSTA of the OISST dataset to verify the accuracy of JCOPE2 datasets.
Figure 2G shows the time series of daily temperature anomaly area-averaged over the EJS based on the JCOPE2 reanalysis datasets. To verify the accuracy of the data, comparisons between SSTA of the JCOPE2 and OISST datasets were made. During summer, the daily SSTA area-averaged over the EJS shows very good agreements between the two datasets. The coefficient between the two datasets is 0.91 and the root mean square error is 0.24°C, respectively. Moreover, it is confirmed from both two datasets that the highest summer SSTA occurred in 2021. This reflects the severe surface MHW events in the EJS during 2021 summer (Chen et al., 2023; Pak et al., 2022). It is noted from the JCOPE2 data that the temperature anomalies show large differences in magnitude between surface and subsurface layers. This suggests that the features of the subsurface MHWs in the EJS may be different from those of the surface MHWs. Overall, the good consistency between the two datasets encourages us to use the three-dimensional JCOPE2 reanalysis datasets to further explore the vertical structure and temporal evolution of summer MHWs in the EJS.
3.2 Climatological state of oceanic conditions
Figures 3A, B show the summer mean of sea temperature, current and EKE at surface in the EJS based on the 31-years JCOPE2 reanalysis datasets. During summer, the SST in the EJS ranges from approximately 12 to 25°C, with warmer SST in the south and colder SST in the north (Figure 3A). The surface current shows that the TWC flows into the EJS and bifurcates into three branches: the EKWC, OB and NB. The EKWC flows northward along the eastern coast of Korea, separates from the coast at around 39°N, and then meanders eastward into the central basin. The NB flows along the western coast of Japan and merges with the separated EKWC west of the Tsugaru Strait (Figure 3B). The OB is between the EKWC and NB, and flows northward into the EJS. In the northern basin, the current is much weaker and we can see the North Korea Cold Current (NKCC) flowing southwestward along the coast of Russia and North Korea. The surface EKE clearly shows high values in the southern basin, especially in the eastern coast of Korea (Figure 3B). While, the EKE is much lower in the northern basin. This means that mesoscale eddy activities are much stronger in the southern EJS.
Figure 3
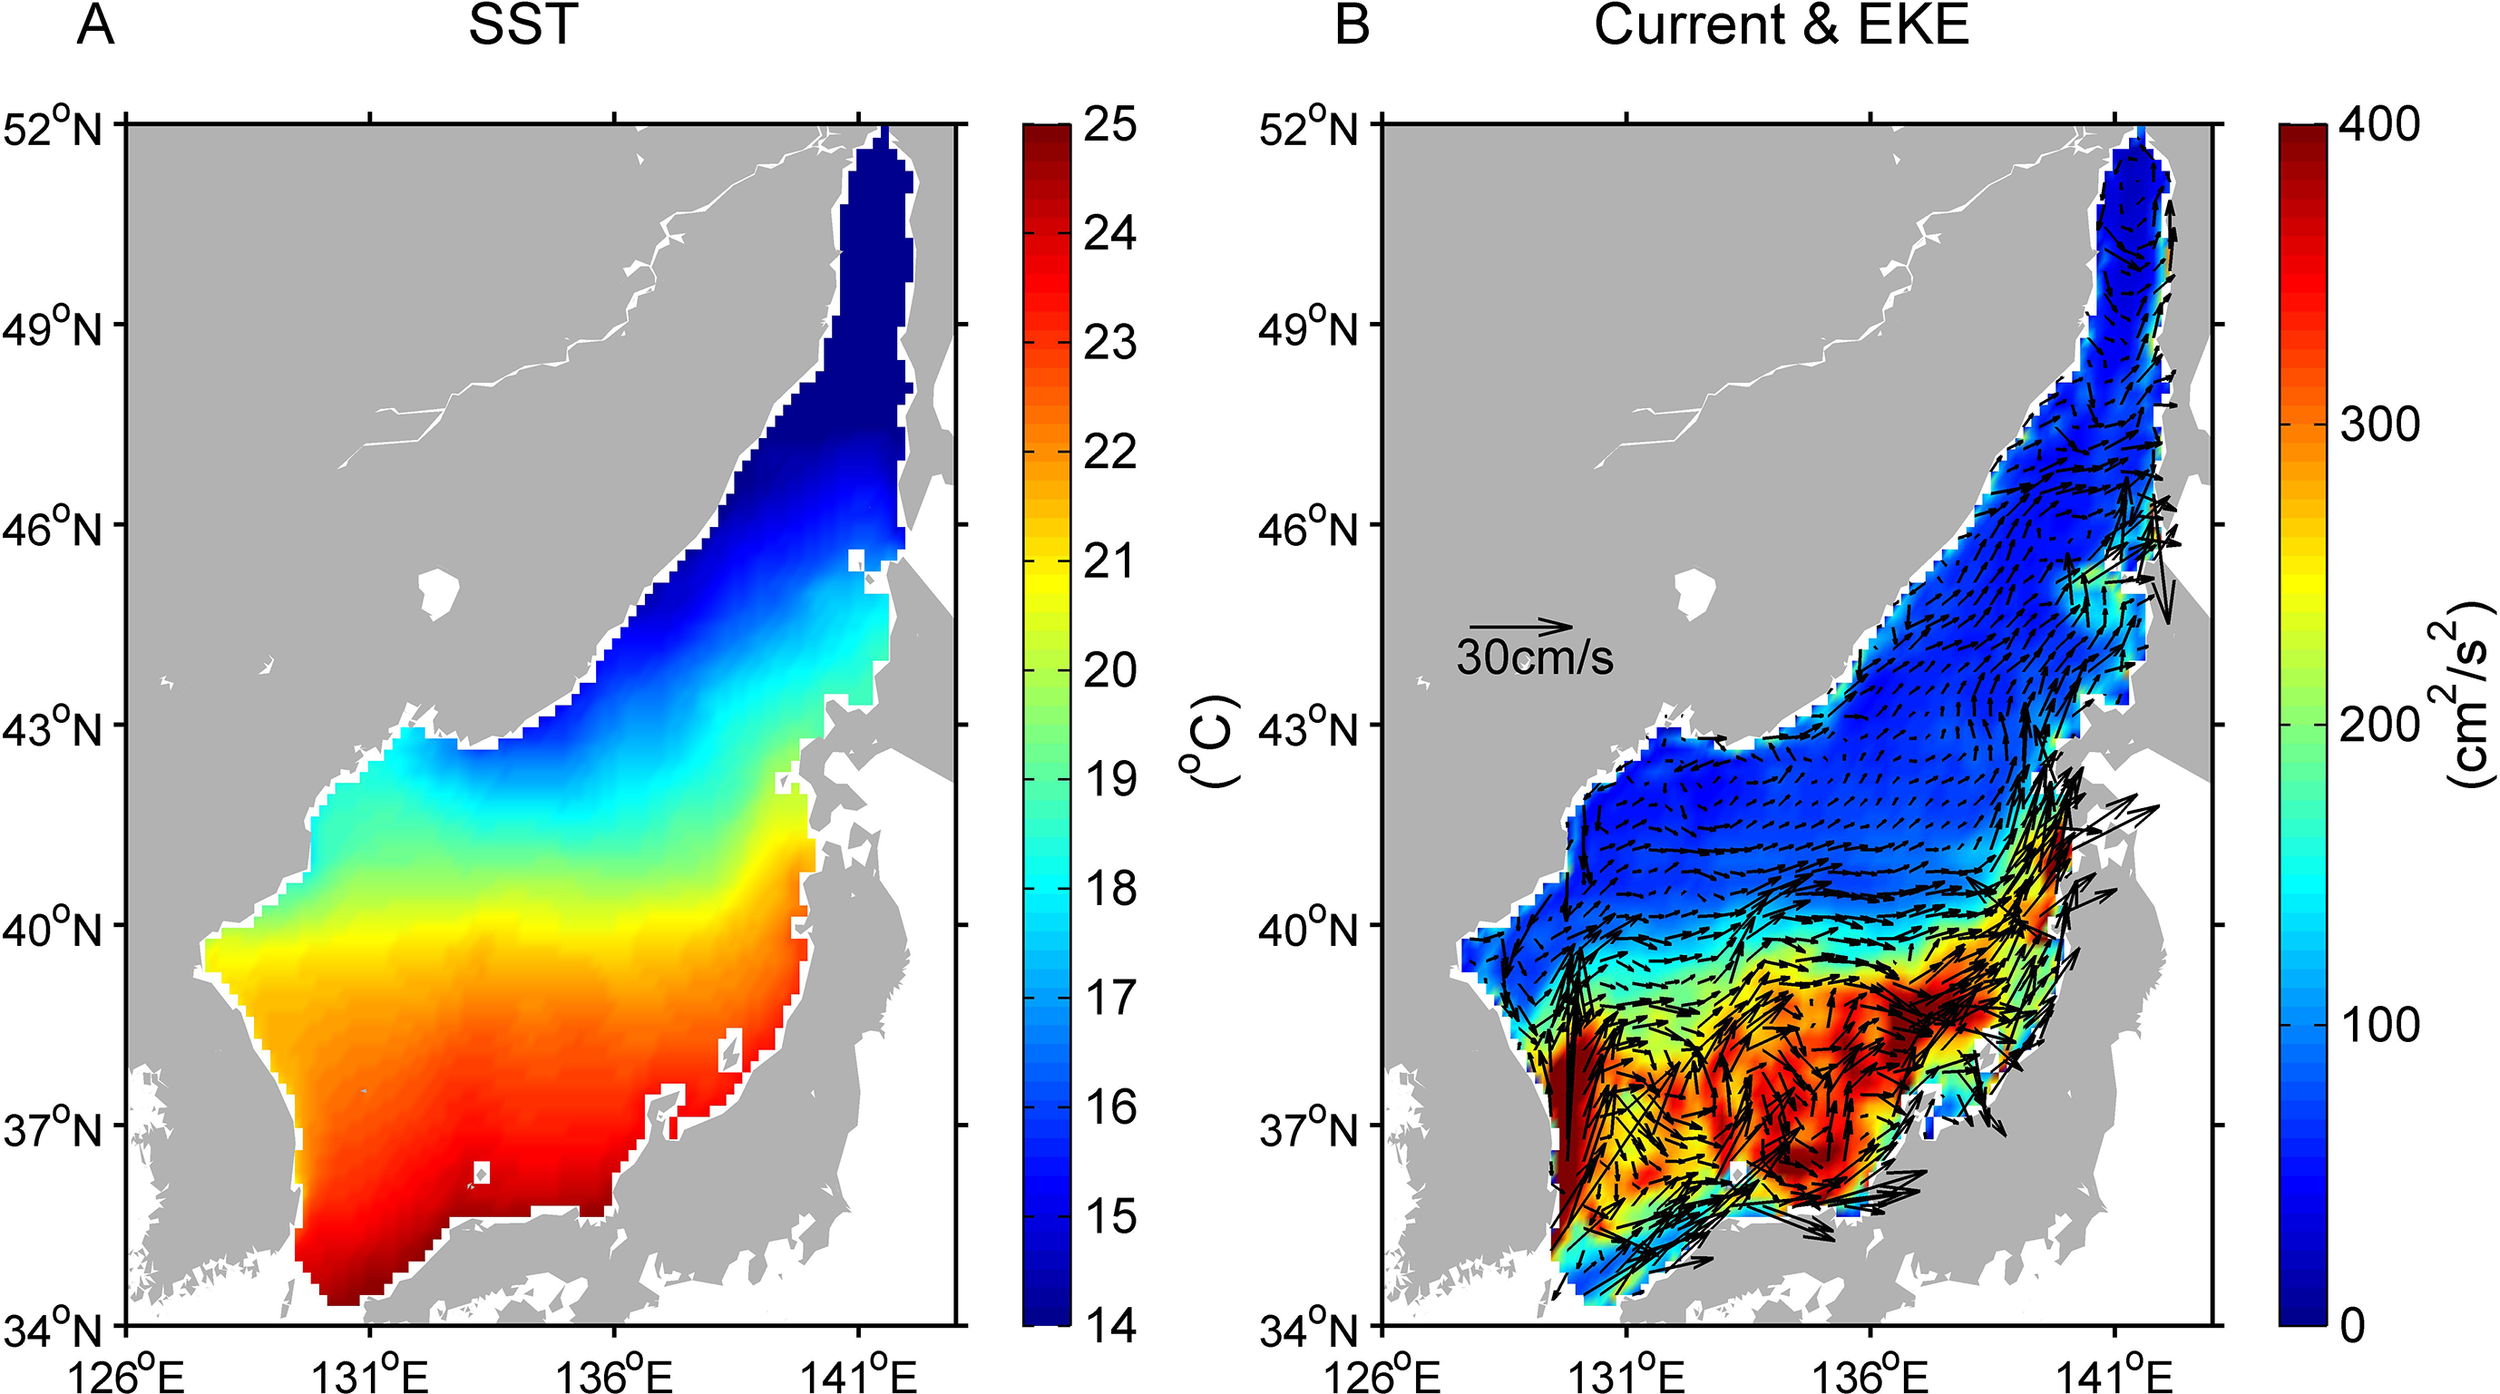
Summer mean of sea temperature (A), current (B, arrows) and EKE (B, color) at surface based on the 31-years JCOPE2 reanalysis datasets.
3.3 Characteristics of summer MHWs in the EJS
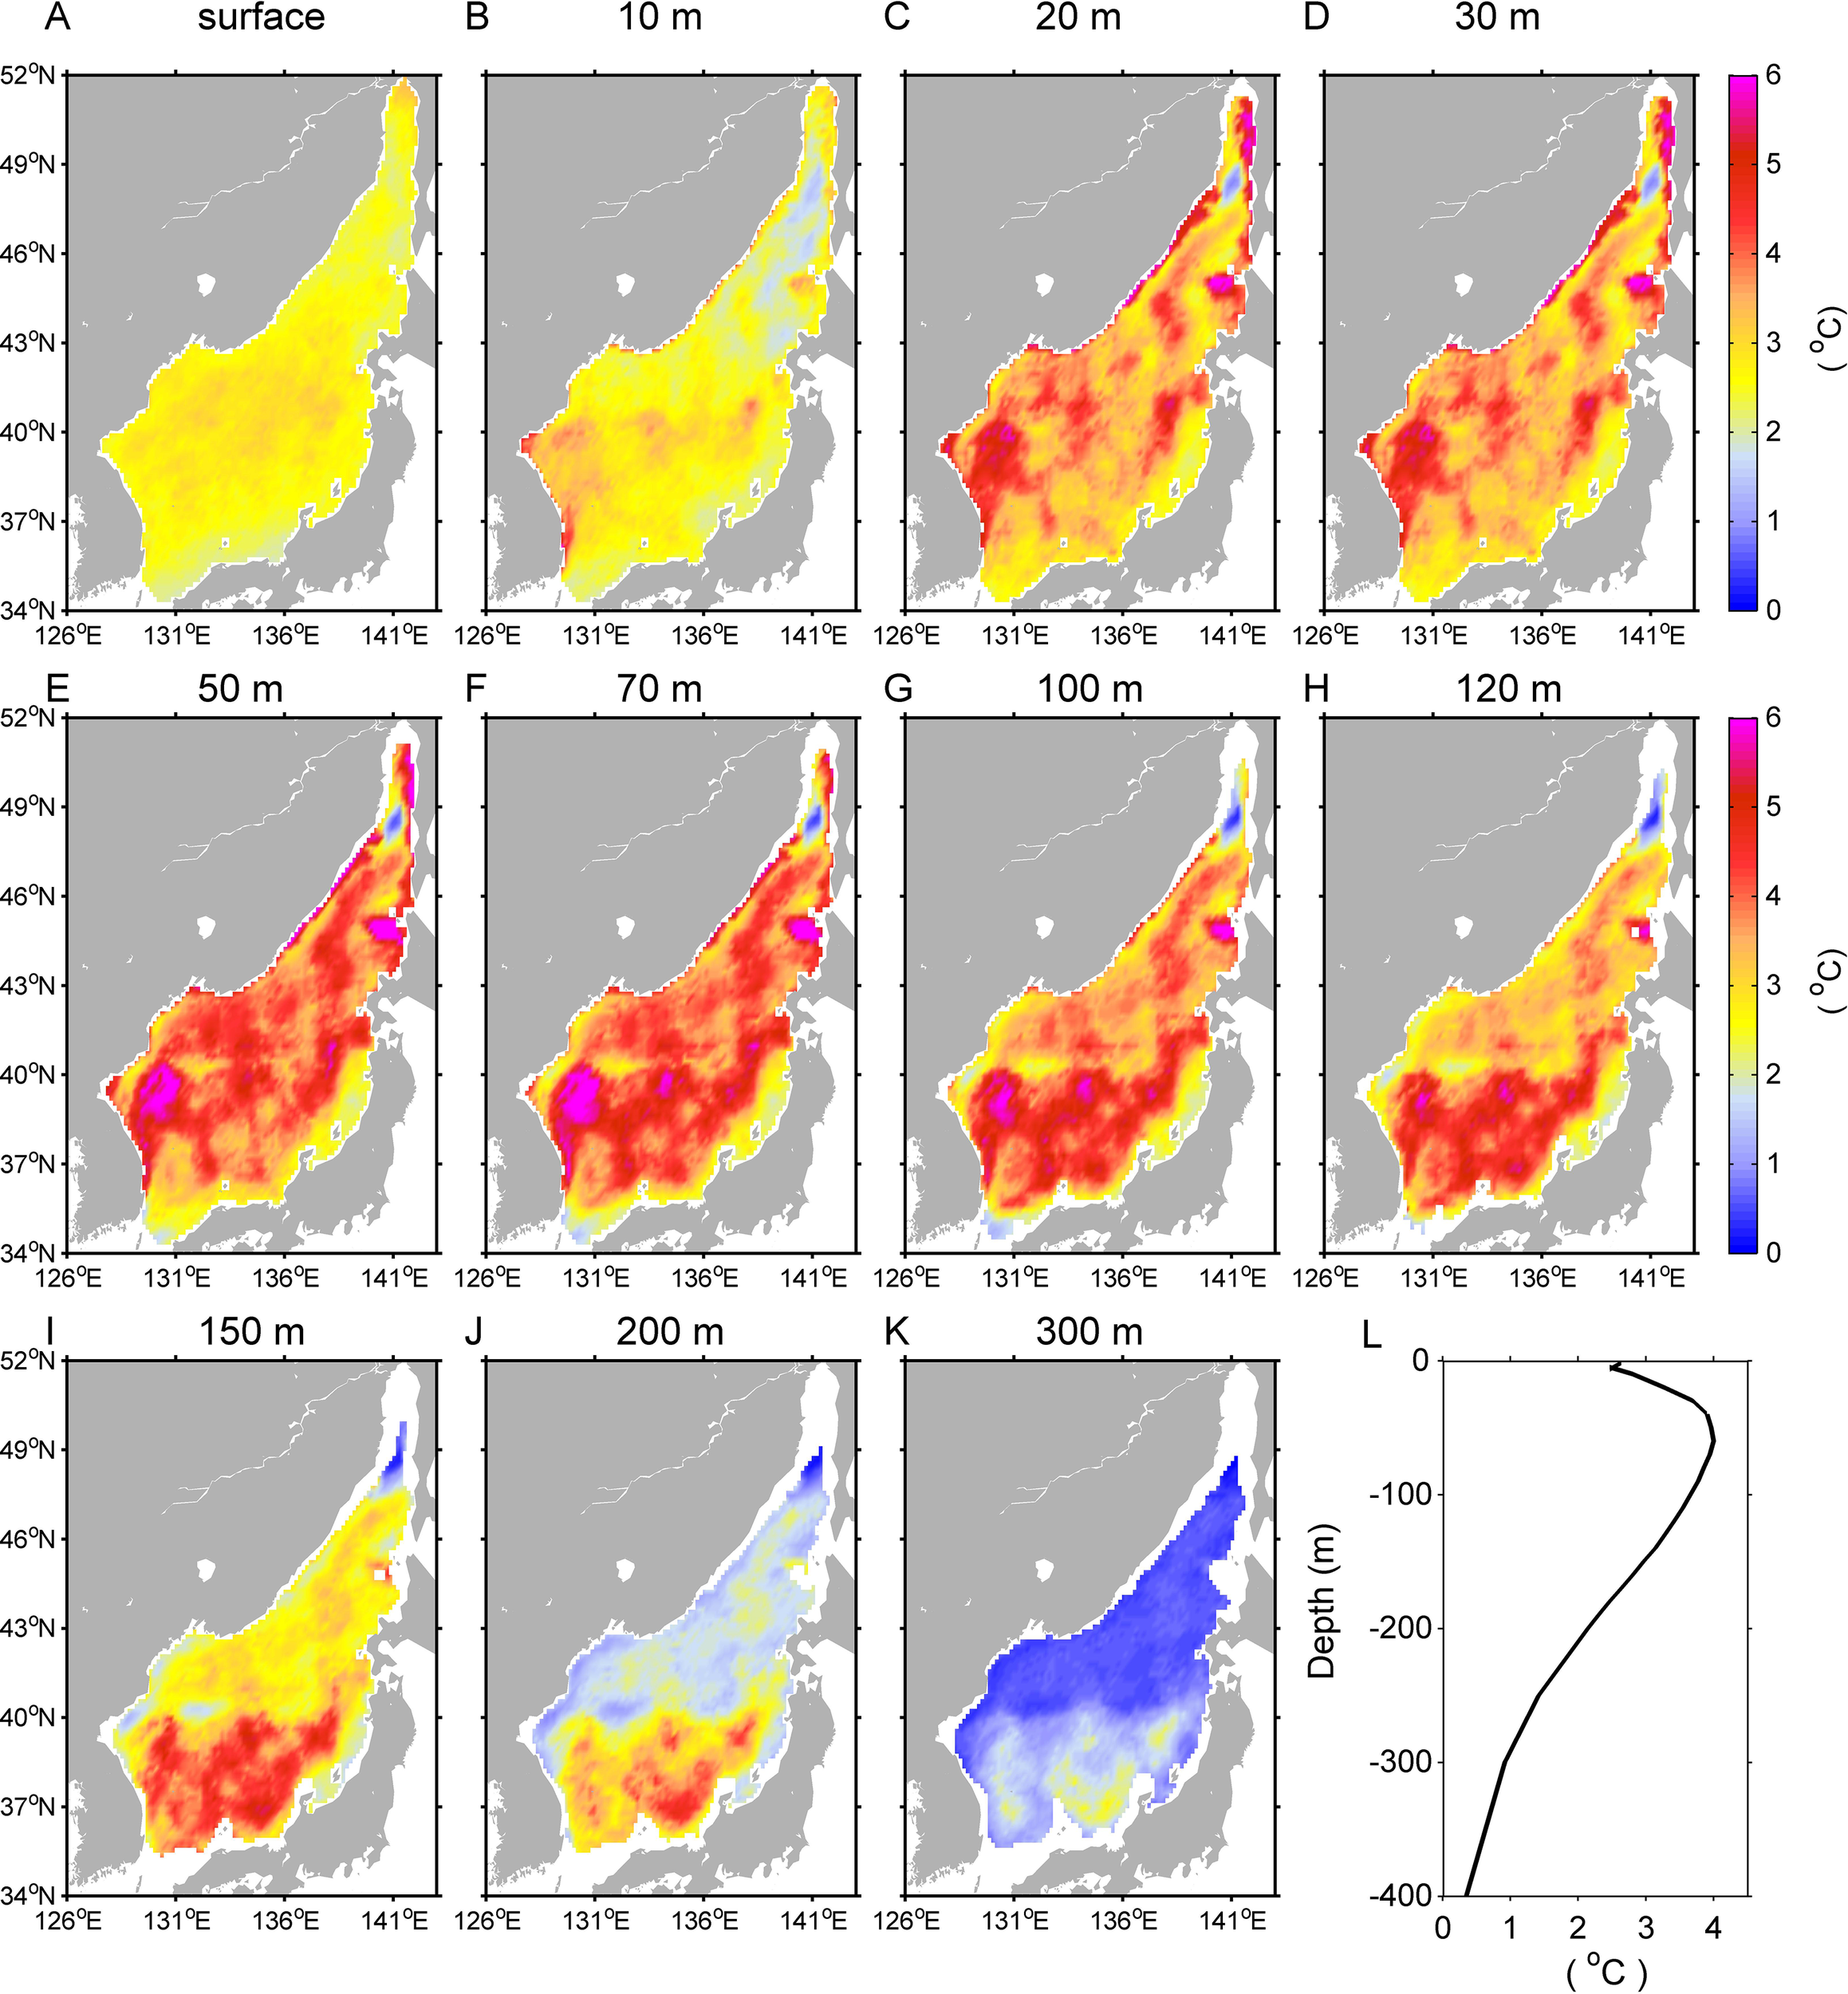
Summer MHWs in the EJS have been reported by several recent studies (Chen et al., 2023; Choi et al., 2022; Pak et al., 2022; Wang et al., 2022). However, these studies mainly focused on the MHWs at surface, and the subsurface MHWs in the EJS are scarcely studied (Saranya and Nam, 2024). In this study, we used the cumulative intensity for analysis because it represents comprehensive information of the duration and mean intensity of a MHW event. Figure 4 shows the summer mean cumulative intensity of MHWs with depth in the EJS based on the 31-years JCOPE2 reanalysis datasets. During summer, the cumulative intensity of MHWs shows substantial spatial variations at different depths. The most striking feature is that the cumulative intensity is much larger at subsurface than at surface. At surface, the cumulative intensity is almost uniform with a value of approximately 20°C days (Figure 4A). Vigorous cumulative intensity with a value of 30–70°C days is observed starting from 20 m depth, which firstly occurs in the western EJS and then extends over most of the EJS at depths of 20–200 m (Figures 4B–J). To 200 m depth, large cumulative intensity can still be found in the southern EJS, while the value is small in the northern EJS. To 300 m depth, the cumulative intensity is much smaller over almost the entire EJS, indicating the weakening of MHWs (Figure 4K). The vertical profile of cumulative intensity area-averaged over the EJS shows that the magnitude increases quickly from surface (20°C days) to its maximum at 70 m depth (36°C days), and then decays gradually downward (Figure 4L). It is also noted that the spatial patterns of subsurface MHWs in the southern EJS show mesoscale features, indicating that eddy activities play important roles in subsurface MHWs in this region.
Figure 4
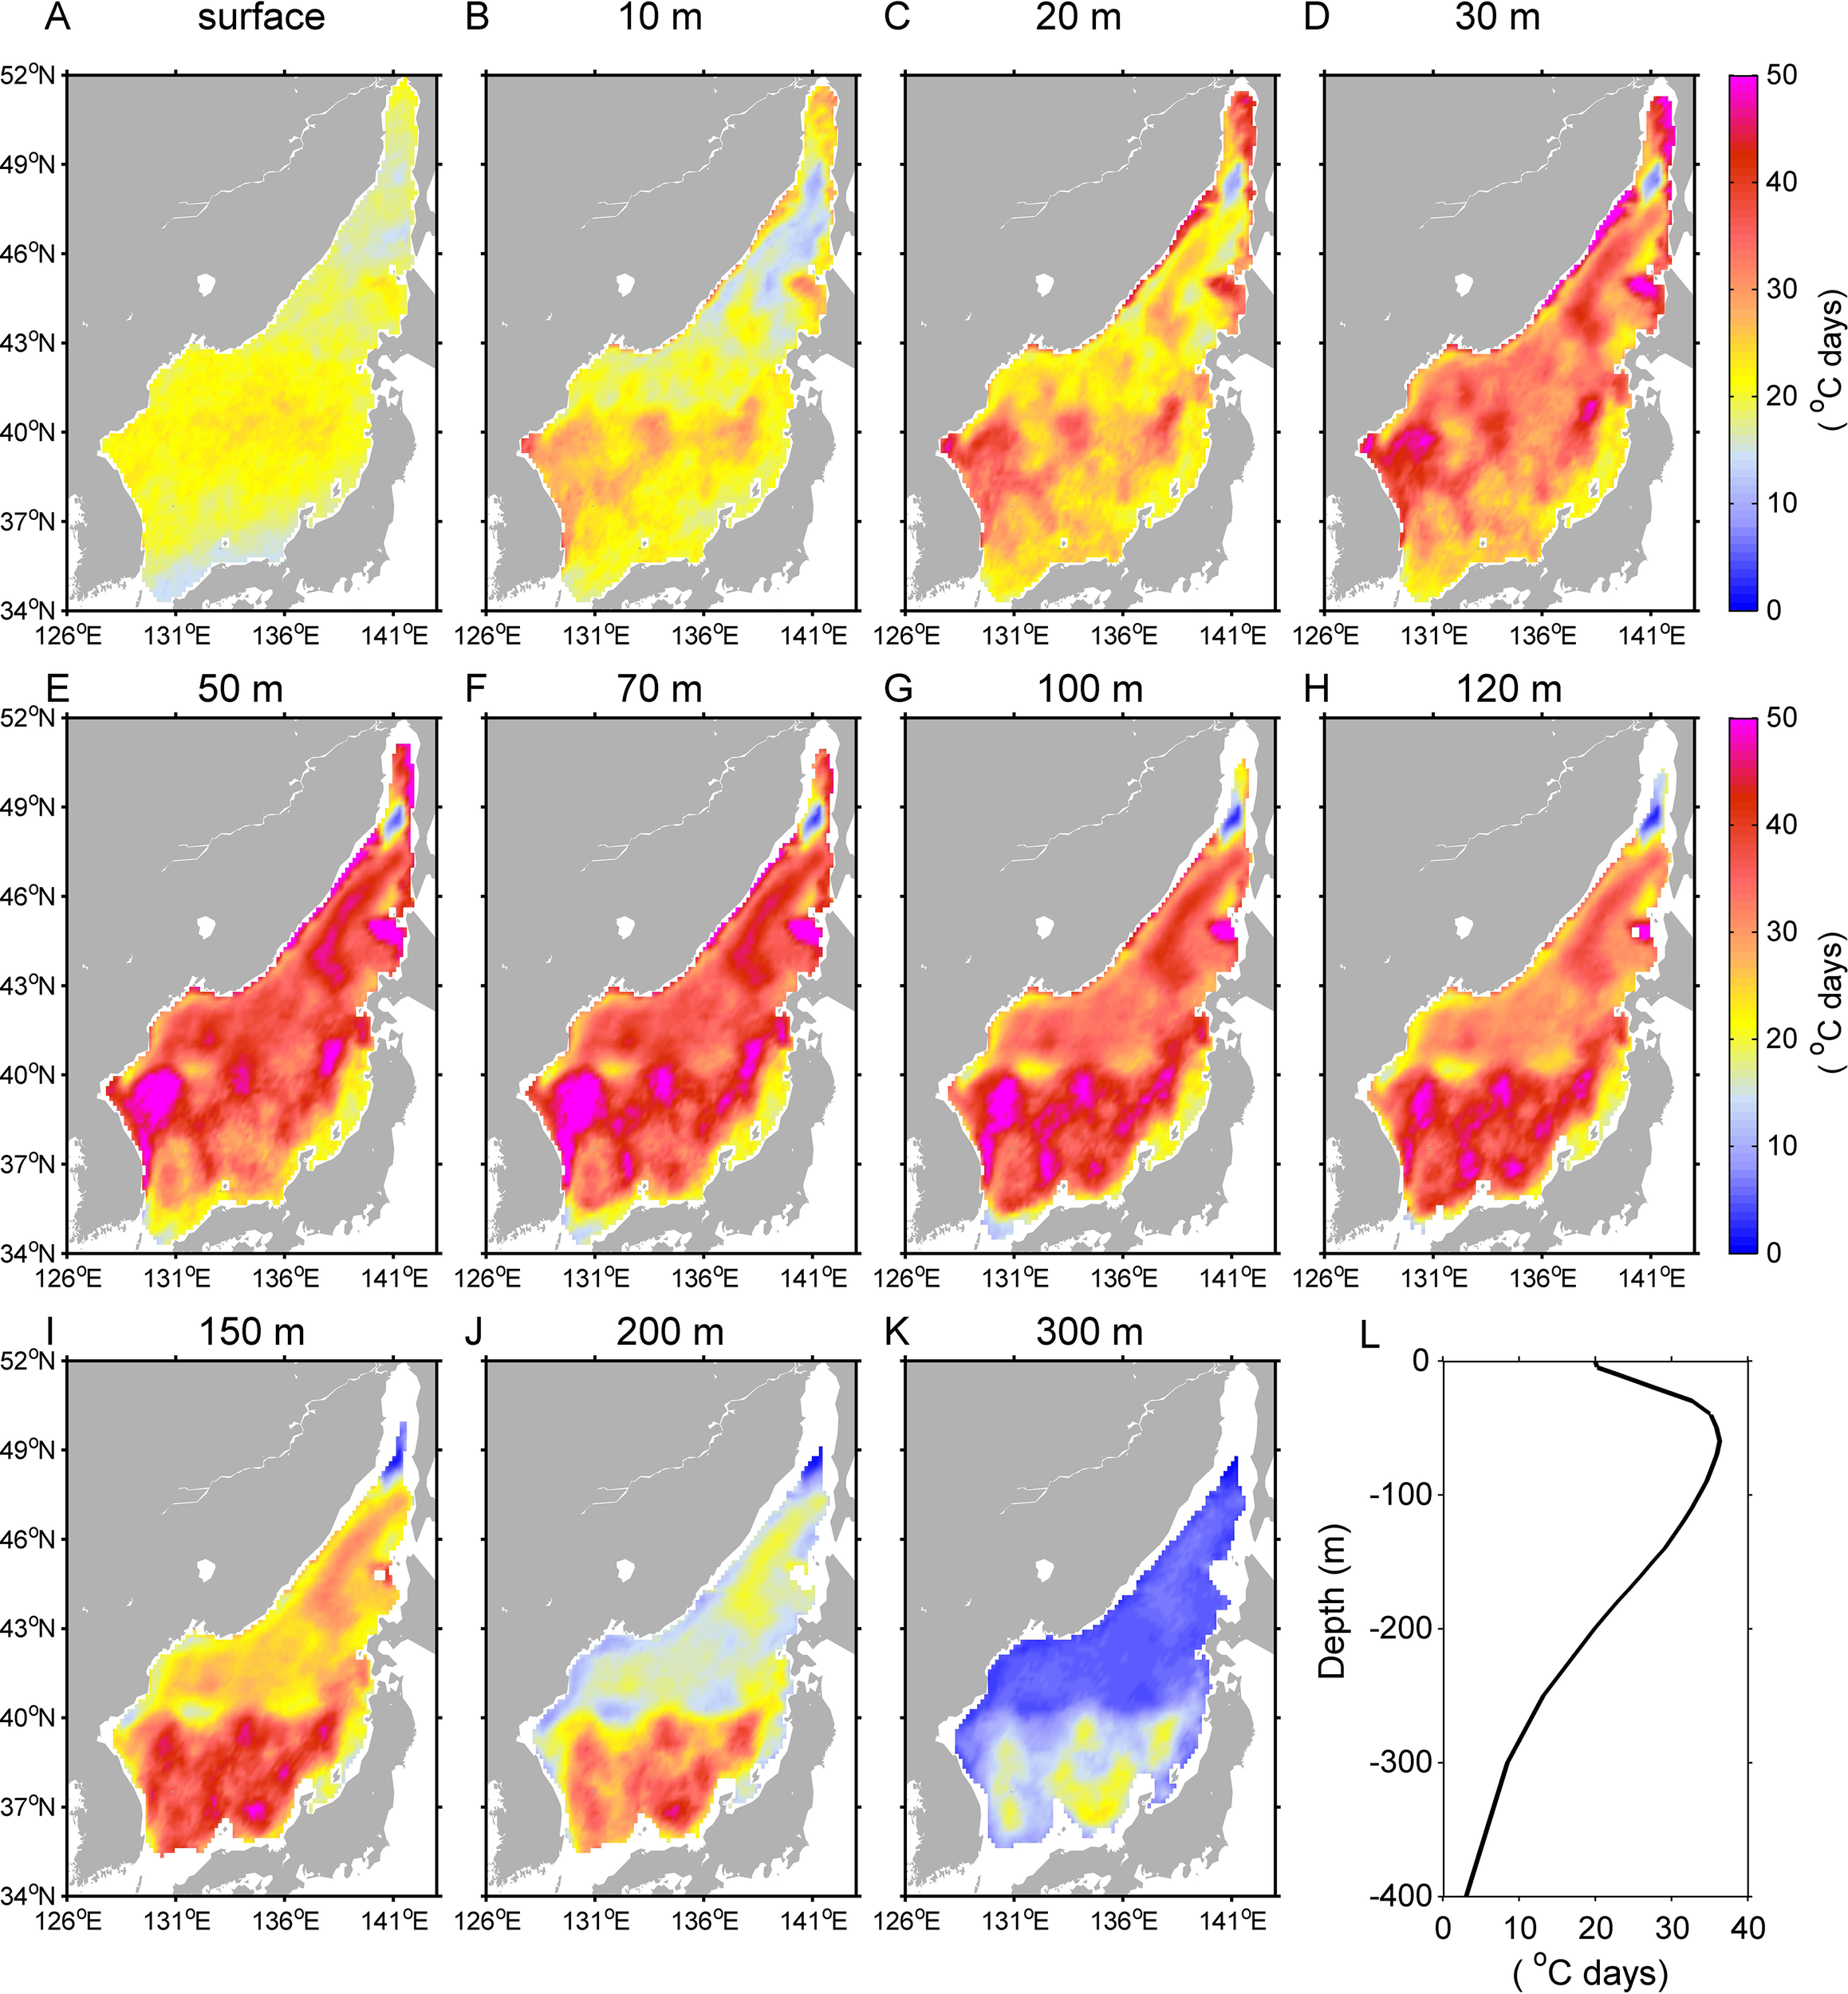
(A–K) Summer mean of cumulative intensity of MHWs with depth in the EJS based on the 31-years JCOPE2 reanalysis datasets. (L) Vertical profile of cumulative intensity of MHWs area-averaged over the EJS.
The maximum intensity of MHWs shows some common features with the cumulative intensity. First, the maximum intensity also features huge spatial variations at different depths (Figure 5): the maximum intensity is small at surface and large values are recognized at subsurface layers. Second, at each layer, the maximum intensity and cumulative intensity show similar spatial patterns: the maximum intensity is uniform at surface and shows mesoscale features at subsurface layers of the southern EJS. Overall, the cumulative and maximum intensities confirm significant subsurface intensification (~20–200 m) of summer MHWs in the EJS.
Figure 5
(A–K) Summer mean of maximum intensity of MHWs with depth in the EJS based on the 31-years JCOPE2 reanalysis datasets. (L) Vertical profile of maximum intensity of MHWs area-averaged over the EJS.
In order to examine the prevalences of summer MHWs at different depths, we estimated the area that occur MHW events and the associated area-averaged intensity in the EJS at each layer. Then, a ratio (ψ) was defined as the area that occur MHWs relative to total area of the EJS. Finally, an area-weighted mean intensity in a given day was defined as the ratio ψ multiplies the area-averaged intensity. Figure 6 shows the daily ratio ψ in the EJS at different depths during the summers of 1993–2023, which provides a basin-scale view of interannual variability of MHWs with depth. It clearly shows that prevalent MHWs occurred in the EJS during the summers of 1994, 1998, 2004, 2010, 2013 and 2016–2023. In particular, consecutive intense MHW events during 2020–2023 were very striking. The mean ratio ψ reached approximately 50% among these four years, indicating that over half areas of the EJS have occurred intense summer MHWs.
Figure 6
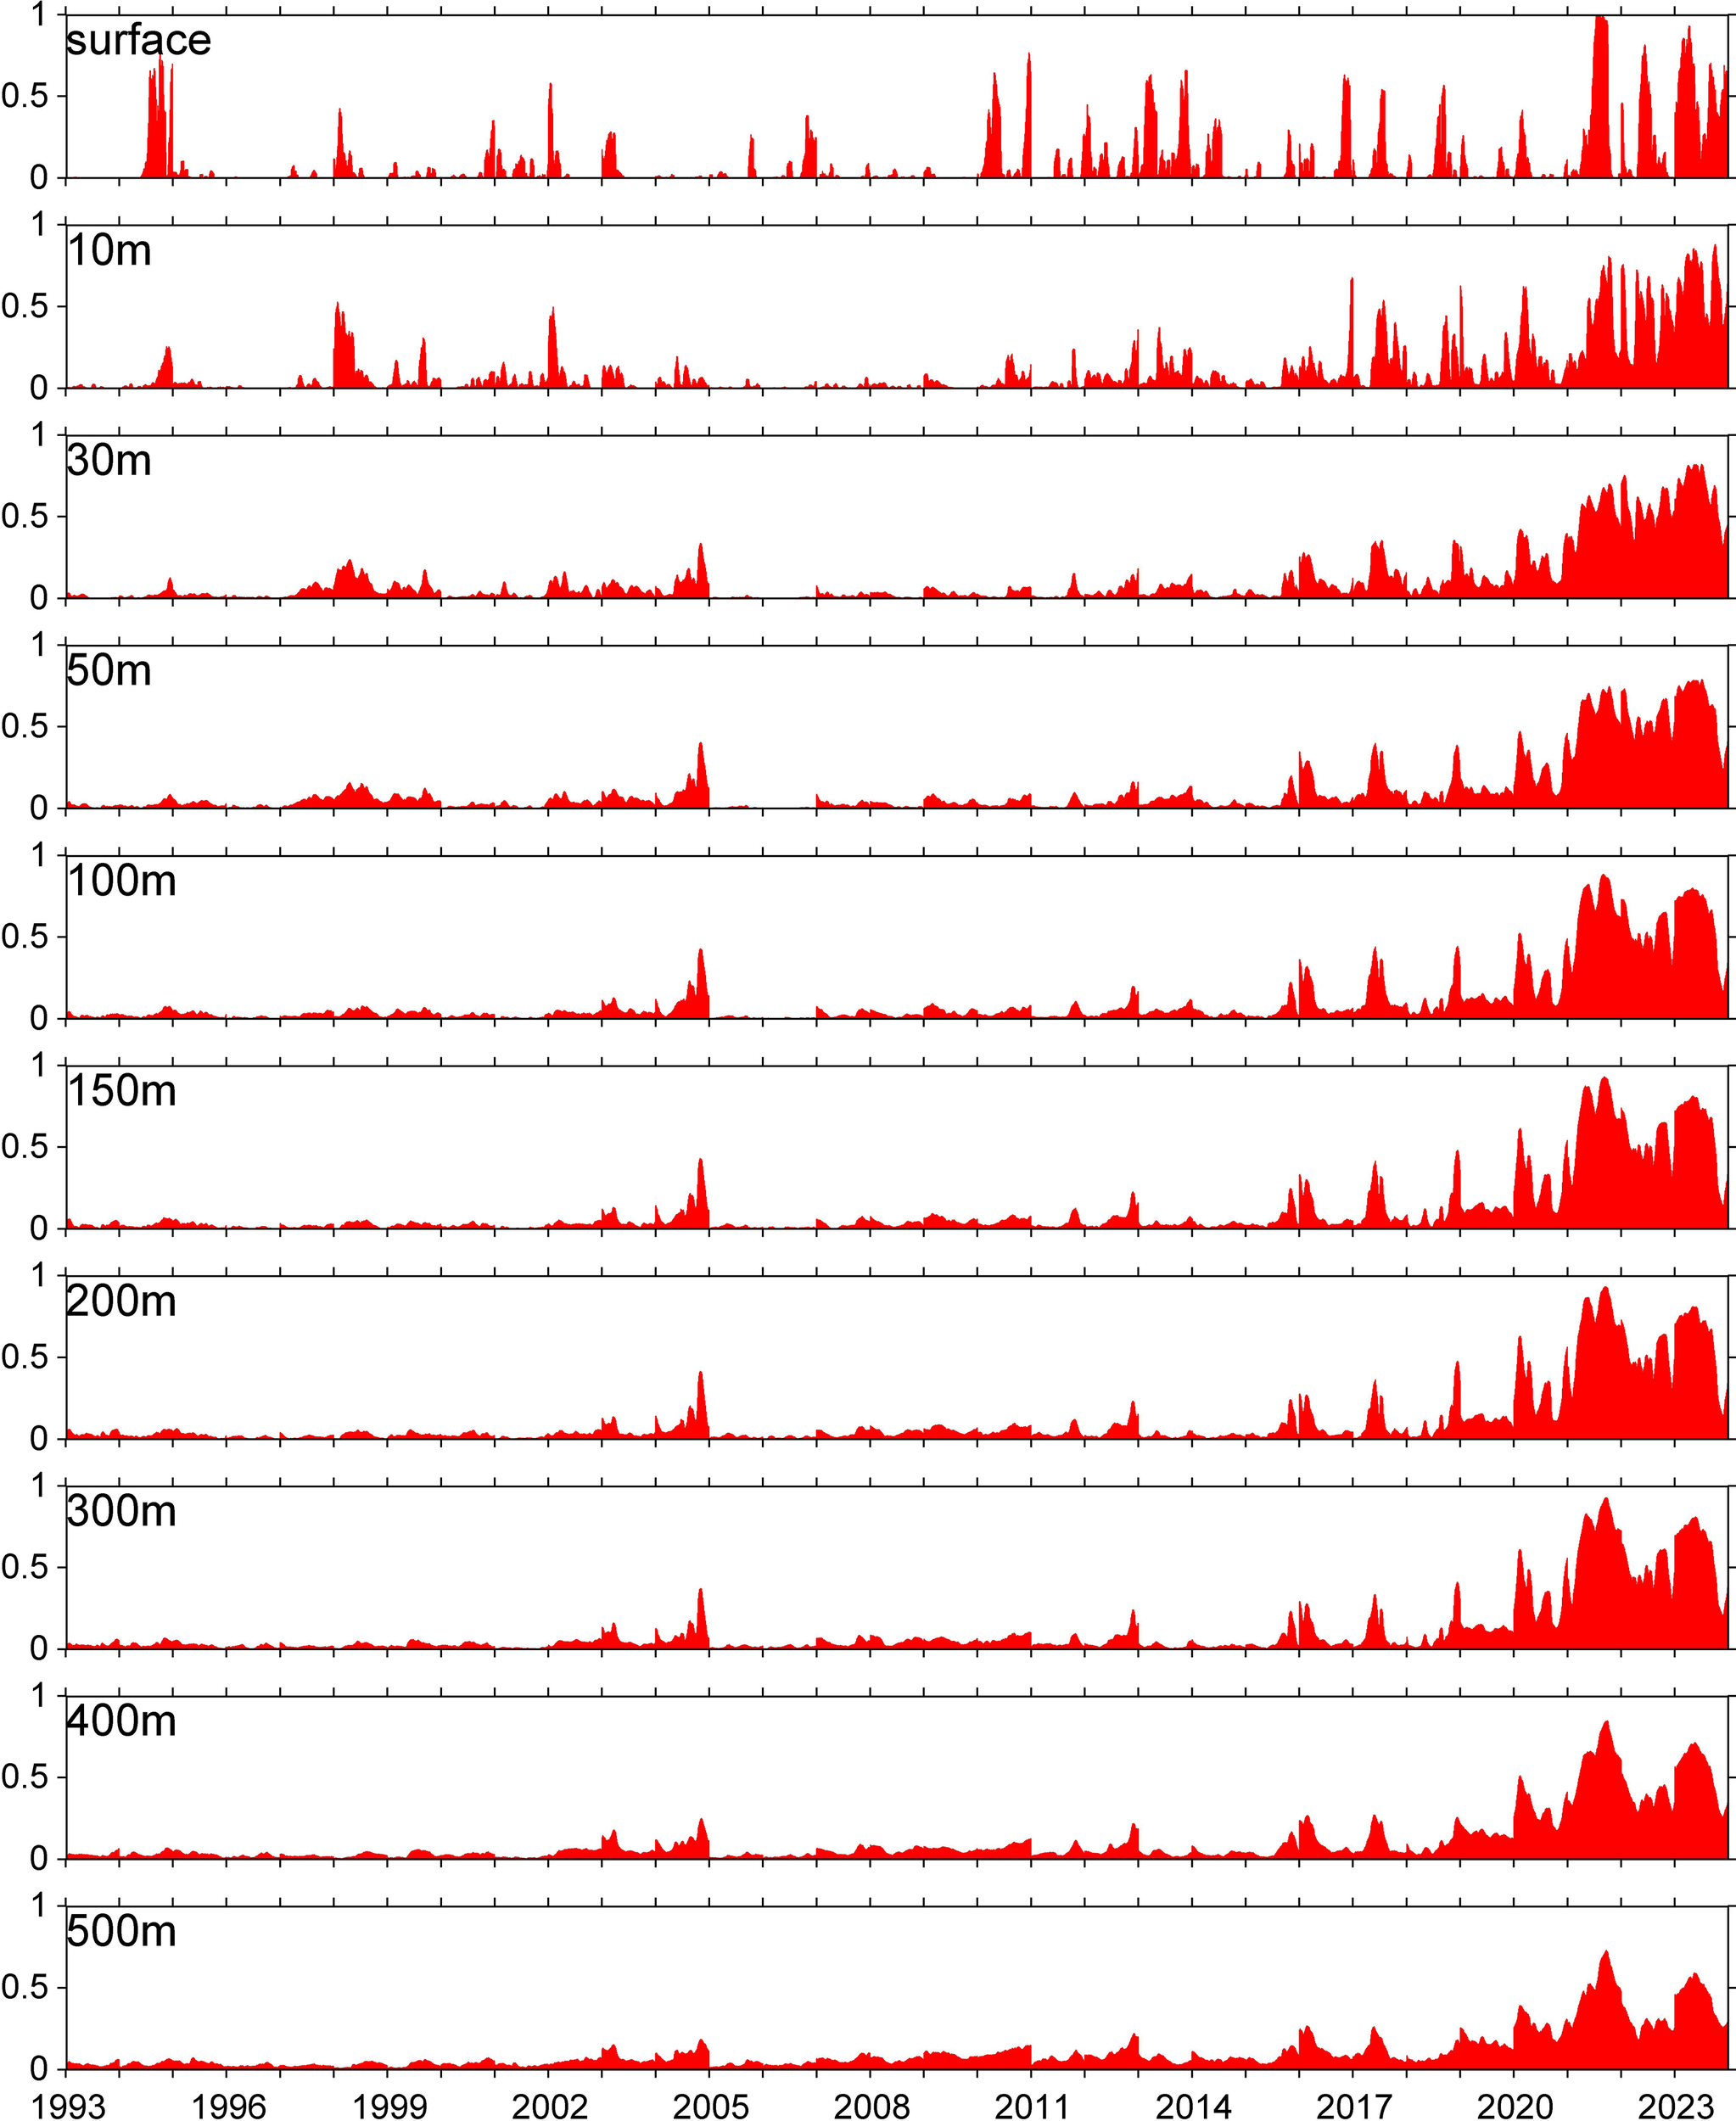
Daily ratio ψ in the EJS at different depths during the summers of 1993–2023. The ratio ψ was defined as the area that occurs MHWs relative to total area of the EJS.
MHWs can be classified into different categories based on the vertical structures: such as shallow MHWs (occurring in the upper several tens of meters) and subsurface MHWs (MHWs can extend from surface to several hundred meters with stronger signals at subsurface) (Elzahaby and Schaeffer, 2019; Schaeffer and Roughan, 2017; Yao and Wang, 2024). Figure 7 shows the daily area-weighted mean intensity in the EJS at different depths during the summers of 1993–2023. Shallow and subsurface types of summer MHWs in the EJS were identified. In details, the 1994, 1998, 2010 and 2013 MHWs occurred primarily at upper several tens of meters, with no evident signals at deeper depths, which were identified as shallow MHWs. The 2004 MHWs occurred at 30–200 m, while no evident MHW signals occurred at surface. In addition, the 2016–2023 MHWs showed evident signals from surface to approximately 300 m with stronger signals at deeper depths. Therefore, the 2004 and 2016–2023 events were classified as subsurface MHWs.
Figure 7
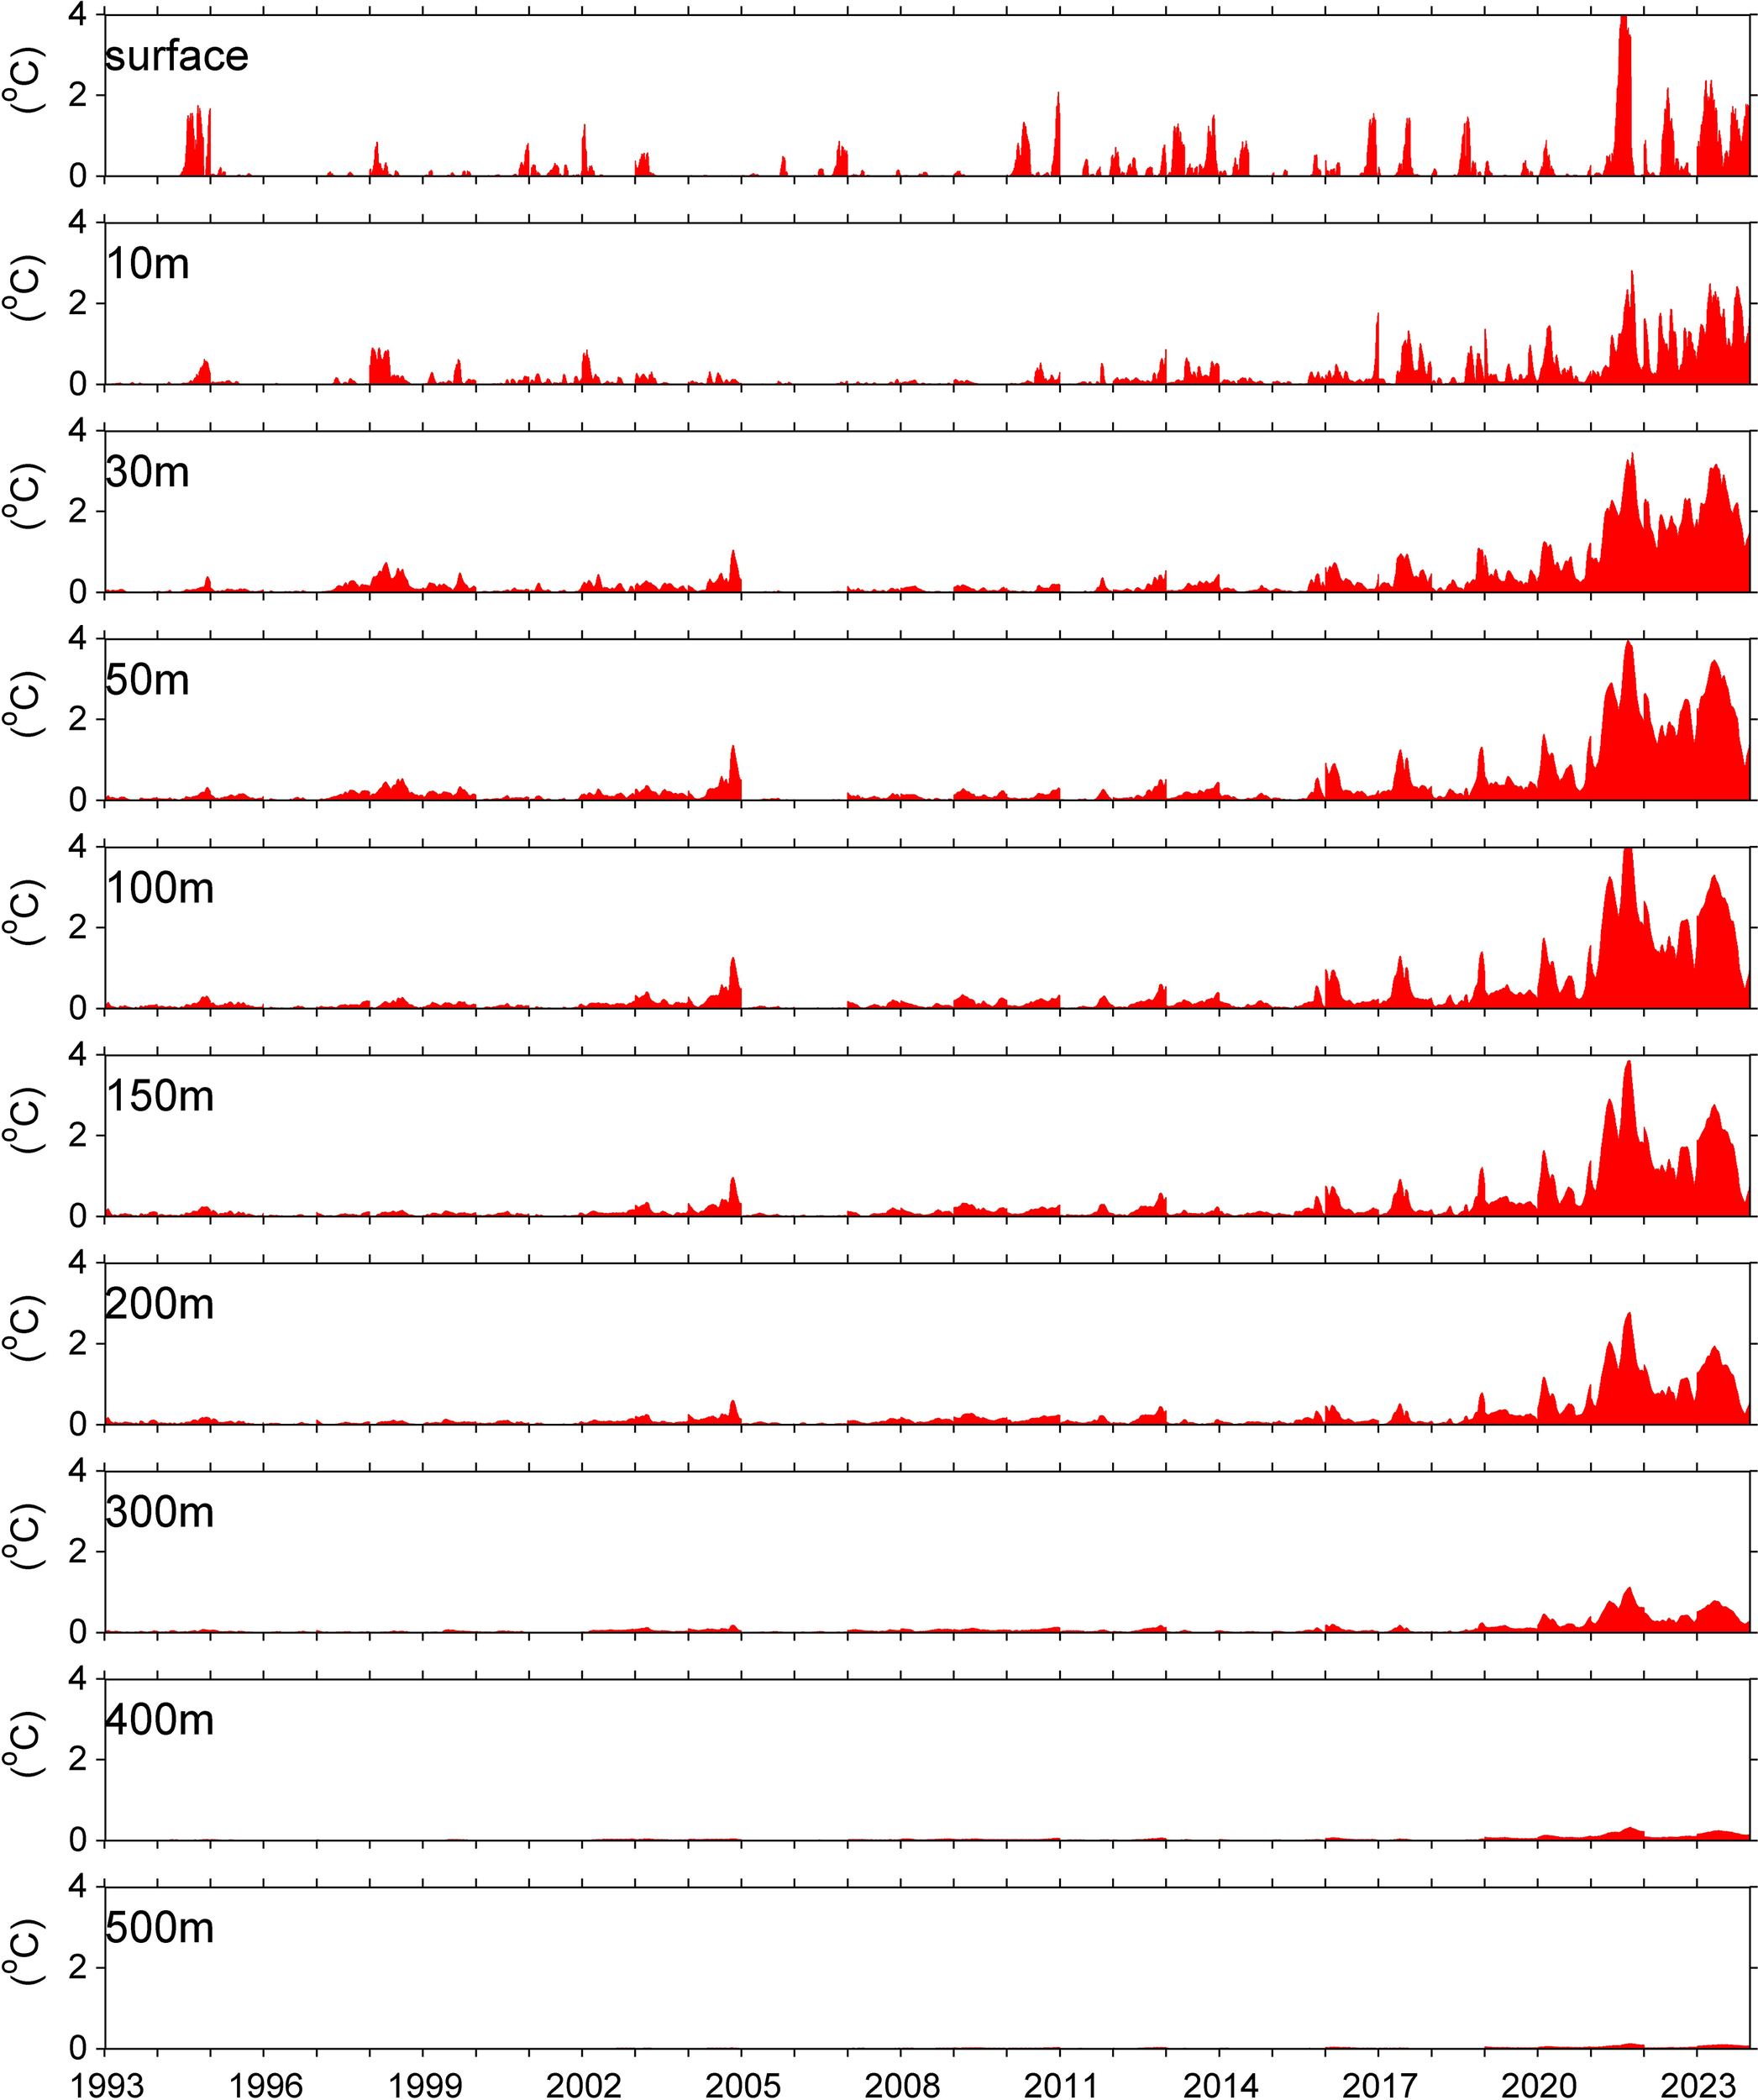
Daily area-weighted mean intensity of MHWs in the EJS at different depths during the summers of 1993–2023.
Figure 8 shows the time-depth plot of cumulative and maximum intensities of MHWs area-averaged over the EJS during the summers of 1993–2023. The cumulative intensity shows evident interannual variabilities: moderate MHWs occurred in 1994, 1998, 2004, 2010, 2013 and 2016–2019, intense MHWs occurred during 2020–2023. Among these MHW events, the 2021 event was the strongest, with the largest cumulative intensity occurred at 70 m depth (227°C days) which was twice of that at surface (102°C days). It can be indicated from the vertical structure that the 1994, 1998, 2010 and 2013 events were shallow MHWs, the 2004 and 2016–2023 events belonged to subsurface MHWs. These findings were in consistent with the classification of MHWs shown in Figure 7. The time-depth plot of maximum intensity of MHWs area-averaged over the EJS clearly shows that the maximum intensities primarily occurred between 20–200 m layers. In particular, the maximum intensity of the extreme 2021 MHW event reached to approximately 6°C.
Figure 8
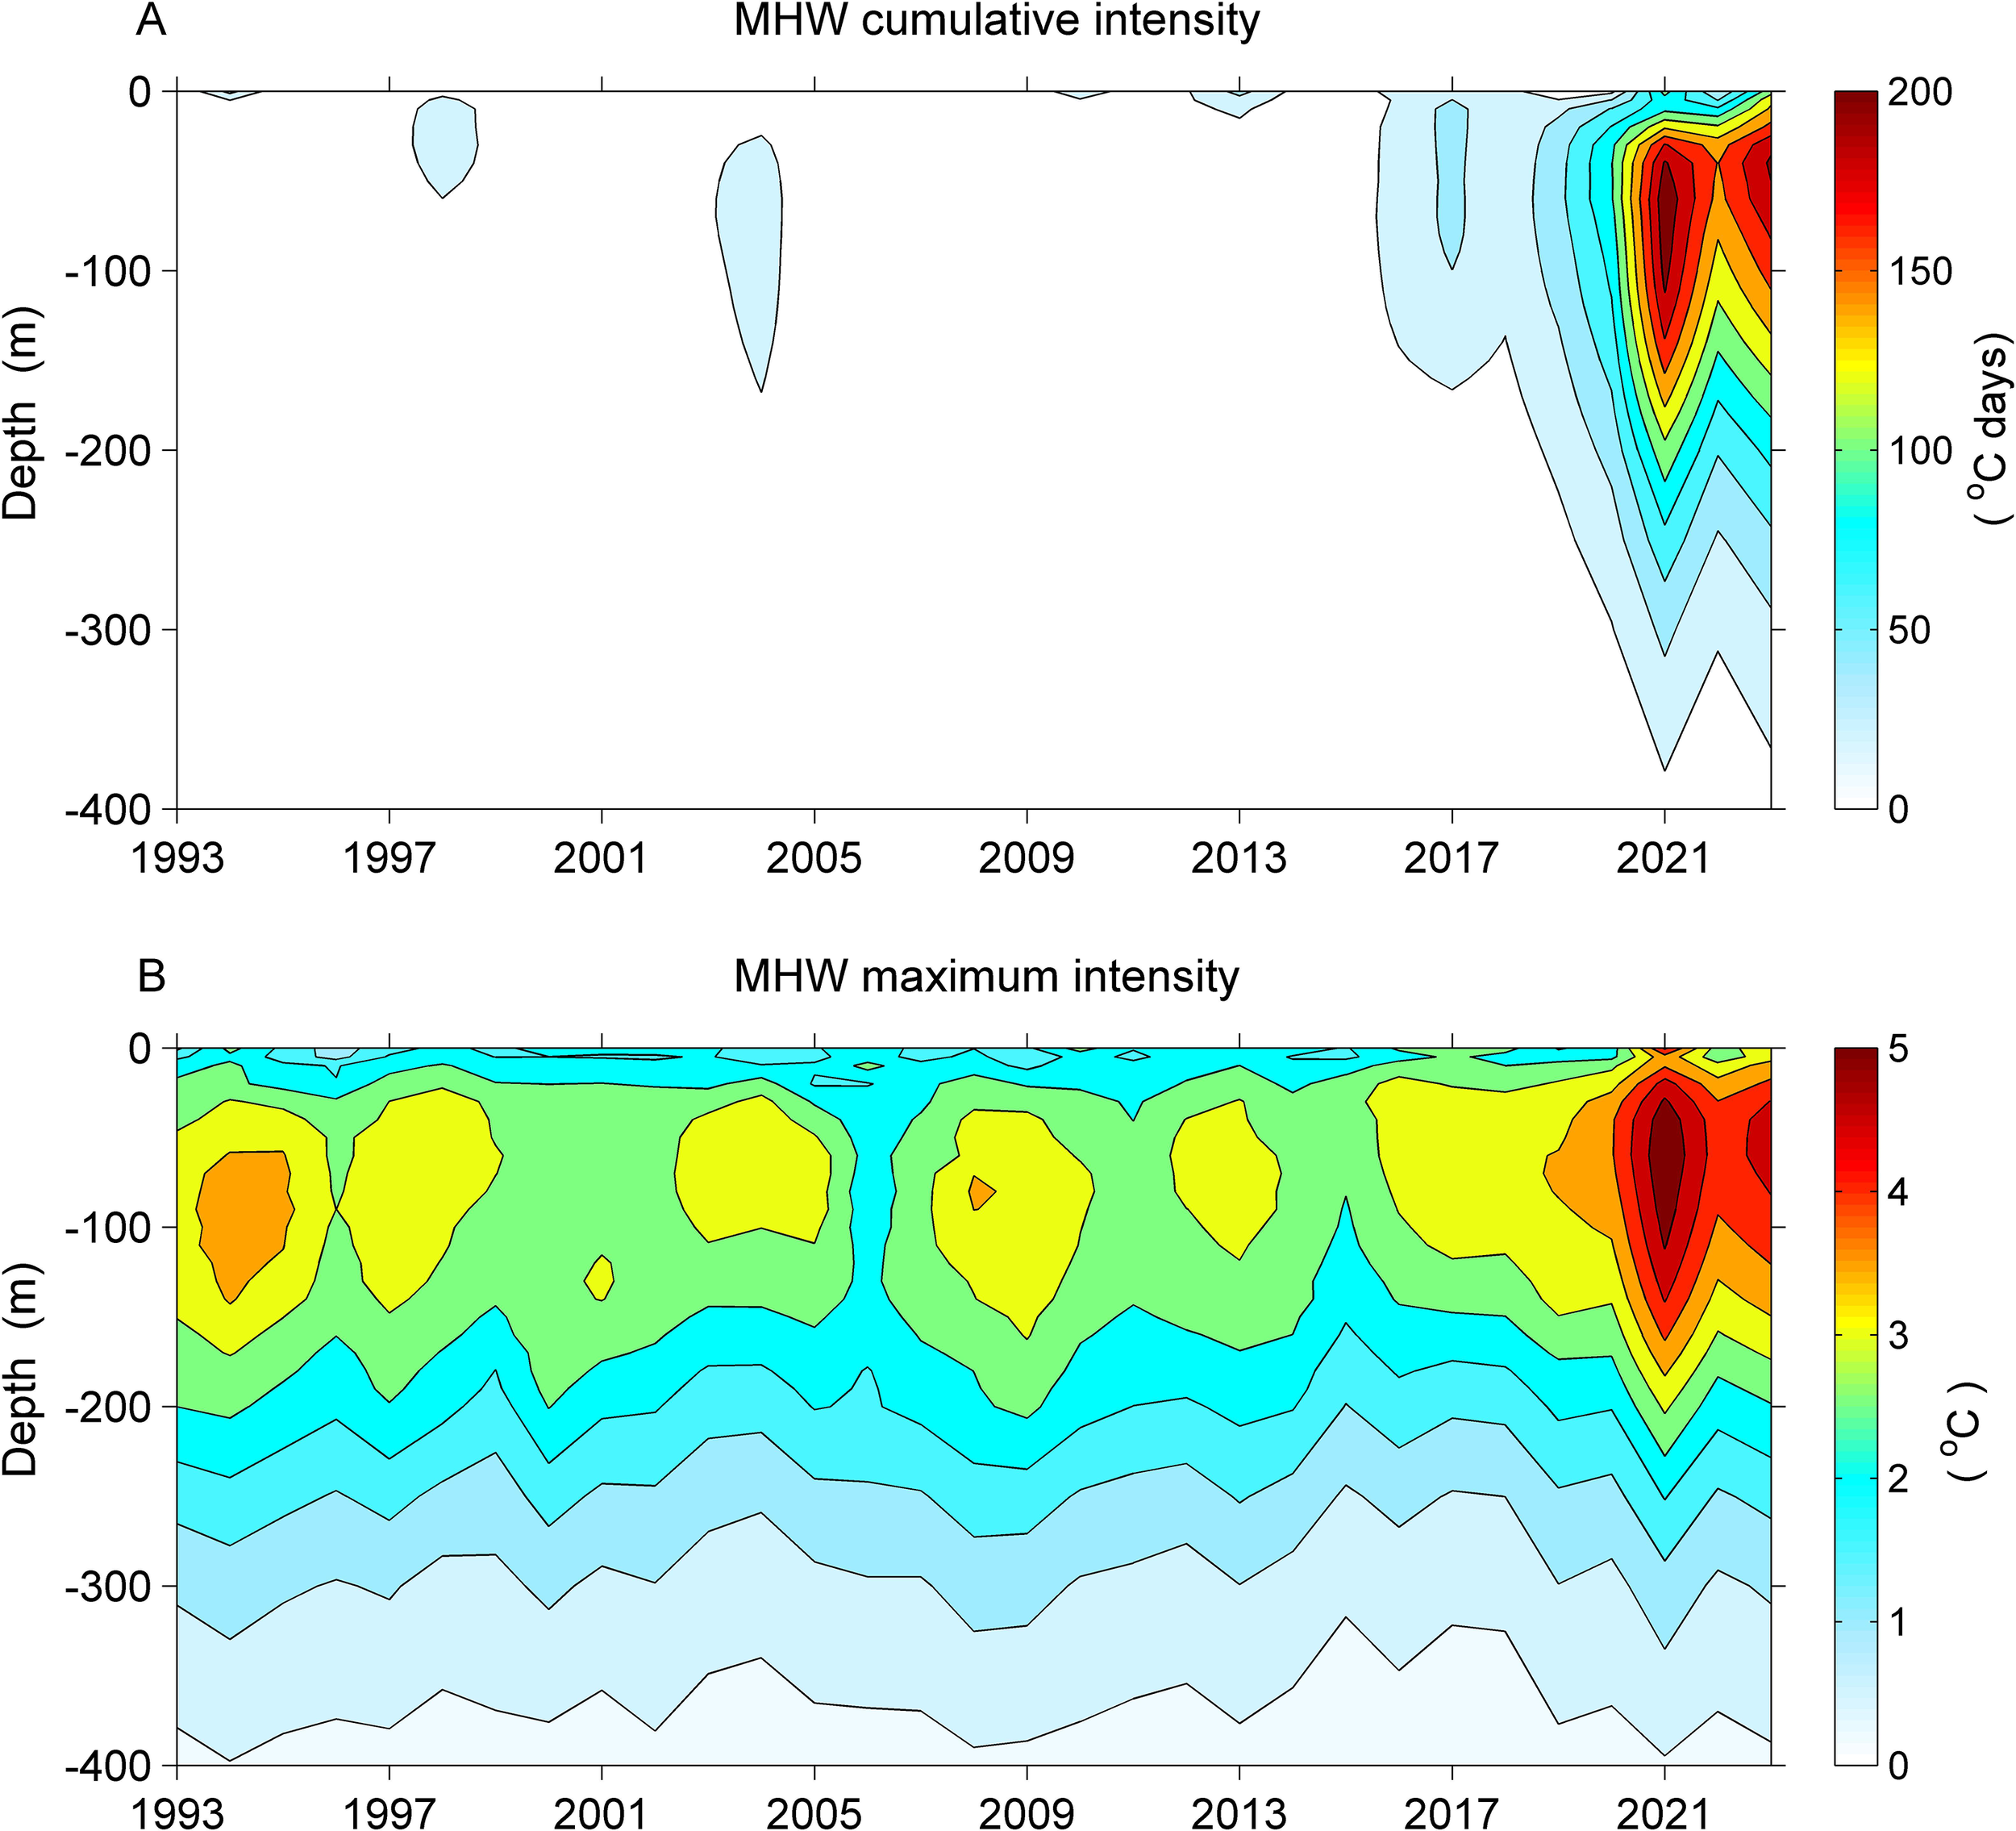
Time-depth plots of cumulative (A) and maximum (B) intensities of MHWs area-averaged over the EJS during the summers of 1993–2023.
3.4 Mechanisms of summer MHWs in the EJS
Above analysis has shown the characteristics of summer MHWs in the EJS. In this section, we further explored the formation mechanisms of these MHWs. As a semienclosed marginal sea in the Northwest Pacific, the EJS is significantly influenced by remote and local forcings. For example, atmospheric teleconnections cause enhanced solar radiation (due to lower cloud coverage) into the EJS and adjacent seas, which can explain the observed summer surface MHWs in this region (Chen et al., 2023; Choi et al., 2022; Pak et al., 2022; Wang et al., 2022). Based on the daily ratio ψ in the EJS at surface (Figure 6), widespread MHW days were selected when the ratio ψ is larger than 0.3 (324 days). Composite anomalies of SST and solar radiation among these 324 widespread MHW days were shown in Figure 9. The spatial patterns of anomalies of SST and solar radiation indicate that the anomalous enhanced solar radiation explained the warm SSTA in the EJS. This means that the summer surface MHWs in the EJS are primarily due to increased solar radiation into the ocean, which is consistent with the findings of several recent studies (Choi et al., 2022; Pak et al., 2022). During summer, however, the mixed layer in the EJS is shallow with a value of several to ten meters (de Boyer Montégut et al., 2004). The strong stratification inhibits the vertical mixing and keeps more heat fluxes at the sea surface. As shown in present study, intense subsurface MHWs occurred in the EJS at depths of 20–200 m (Figure 4). This means that the surface heat fluxes are unable to explain the observed subsurface MHWs at such deep depths. The sea temperature in the EJS is profoundly affected by local oceanic processes in this region. Firstly, the TWC originates from the KC in the East China Sea and is the main heat sources of the upper ocean in the EJS. Therefore, the anomalous increased volume transport of TWC into the EJS can lead to positive sea temperature anomalies over the whole basin (Wang and Wu, 2022). Second, mesoscale eddies prevail over the southern EJS, downwelling associated with anticyclonic eddies can cause positive sea temperature anomalies in this area. In the following, we examined the influences of these oceanic processes on the summer subsurface MHWs in the EJS as follows.
Figure 9
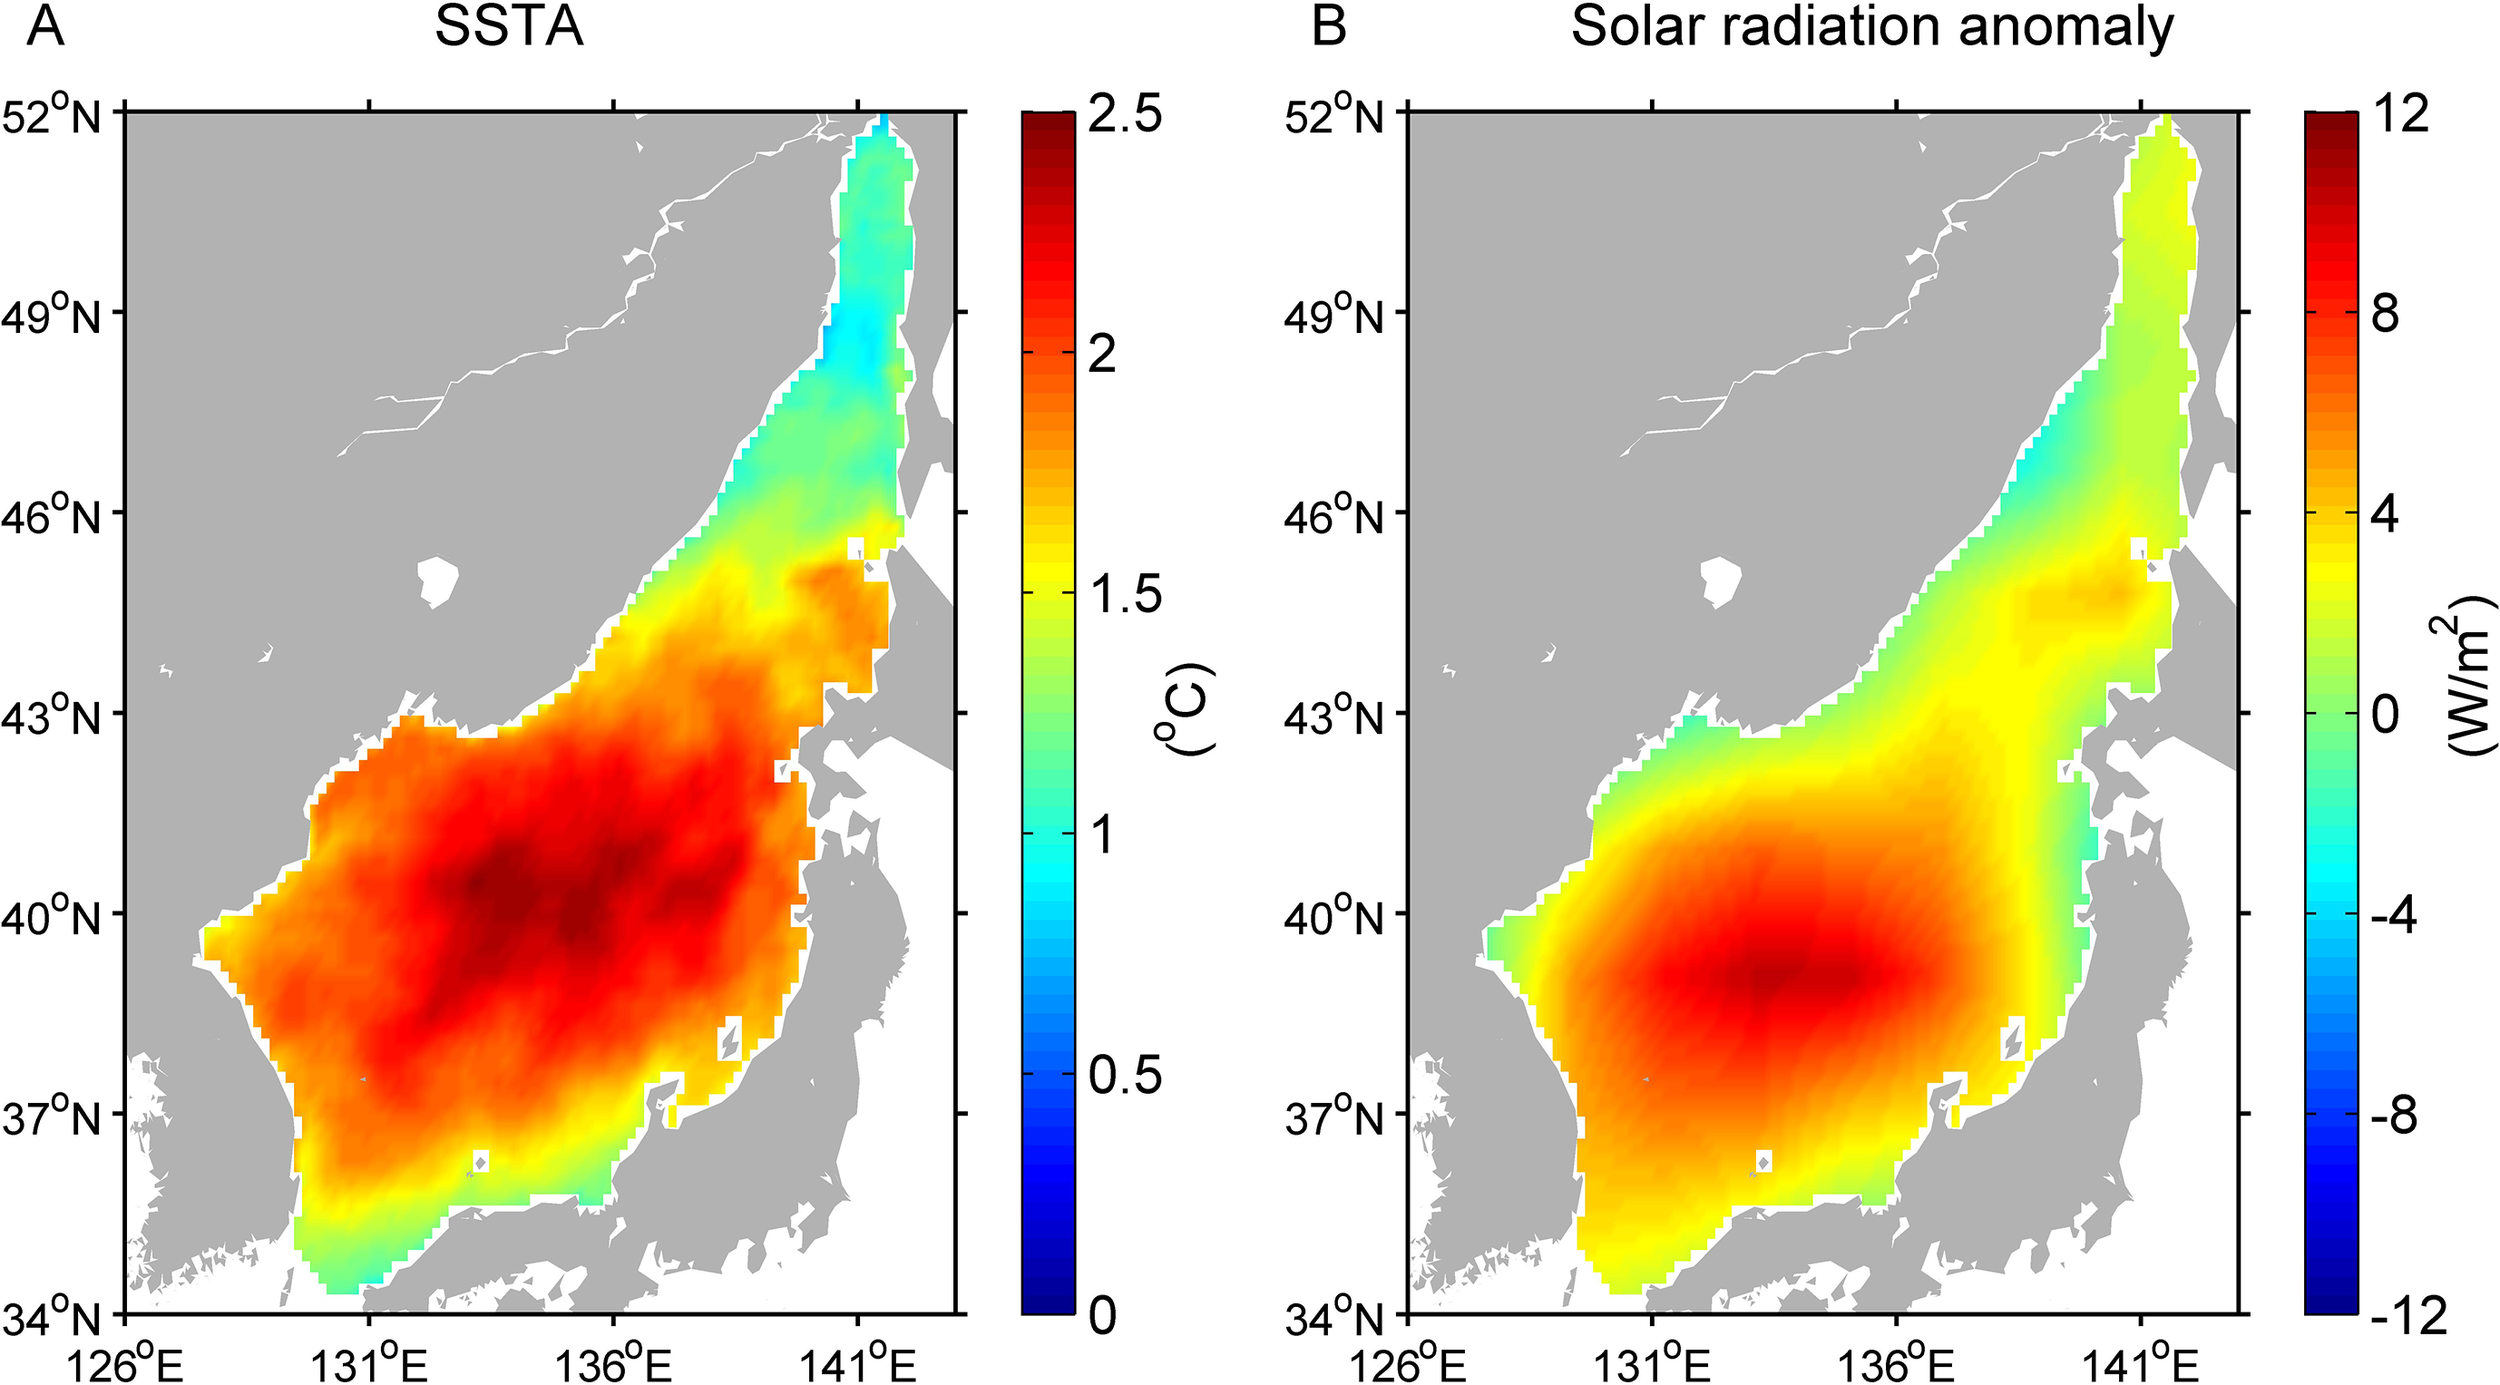
Composite anomalies of SST (A) and solar radiation (B) among these 324 widespread MHW days. Widespread MHW days were selected when more than 30% of the total EJS areas occur MHWs.
Based on the 31-years JCOPE2 reanalysis datasets, we estimated the volume transport of TWC during the summers of 1993–2023. The estimated summer mean volume transport of TWC into the EJS is 2.57 Sv, which is in good agreement with the results of previous studies (Fukudome et al., 2010; Isobe, 2008; Takikawa et al., 2005; Teague et al., 2005). Considering that the summer subsurface MHWs are the strongest at approximately 70 m, the sea temperature anomaly area-averaged over the EJS at this level was estimated. Figure 10 shows the anomalies of volume transport of TWC and sea temperature area-averaged over the EJS during the summers of 1993–2023. The correlation coefficient between the anomalies of volume transport of TWC and area-averaged sea temperature is 0.64. The positive correlation coefficient indicates that increased volume transport of TWC leads to warmer sea subsurface temperature, which favors the formations of subsurface MHWs in the EJS. In particular, large positive anomalies of volume transport of TWC occurred during the consecutive intense subsurface MHW events 2020–2023. Among these four years, the volume transport of TWC increased by 9.3%, 16.7%, 15.2% and 12.6% relative to the climatology state. These findings confirm that the anomalous strengthened TWC is a key trigger of summer subsurface MHWs in the EJS.
Figure 10
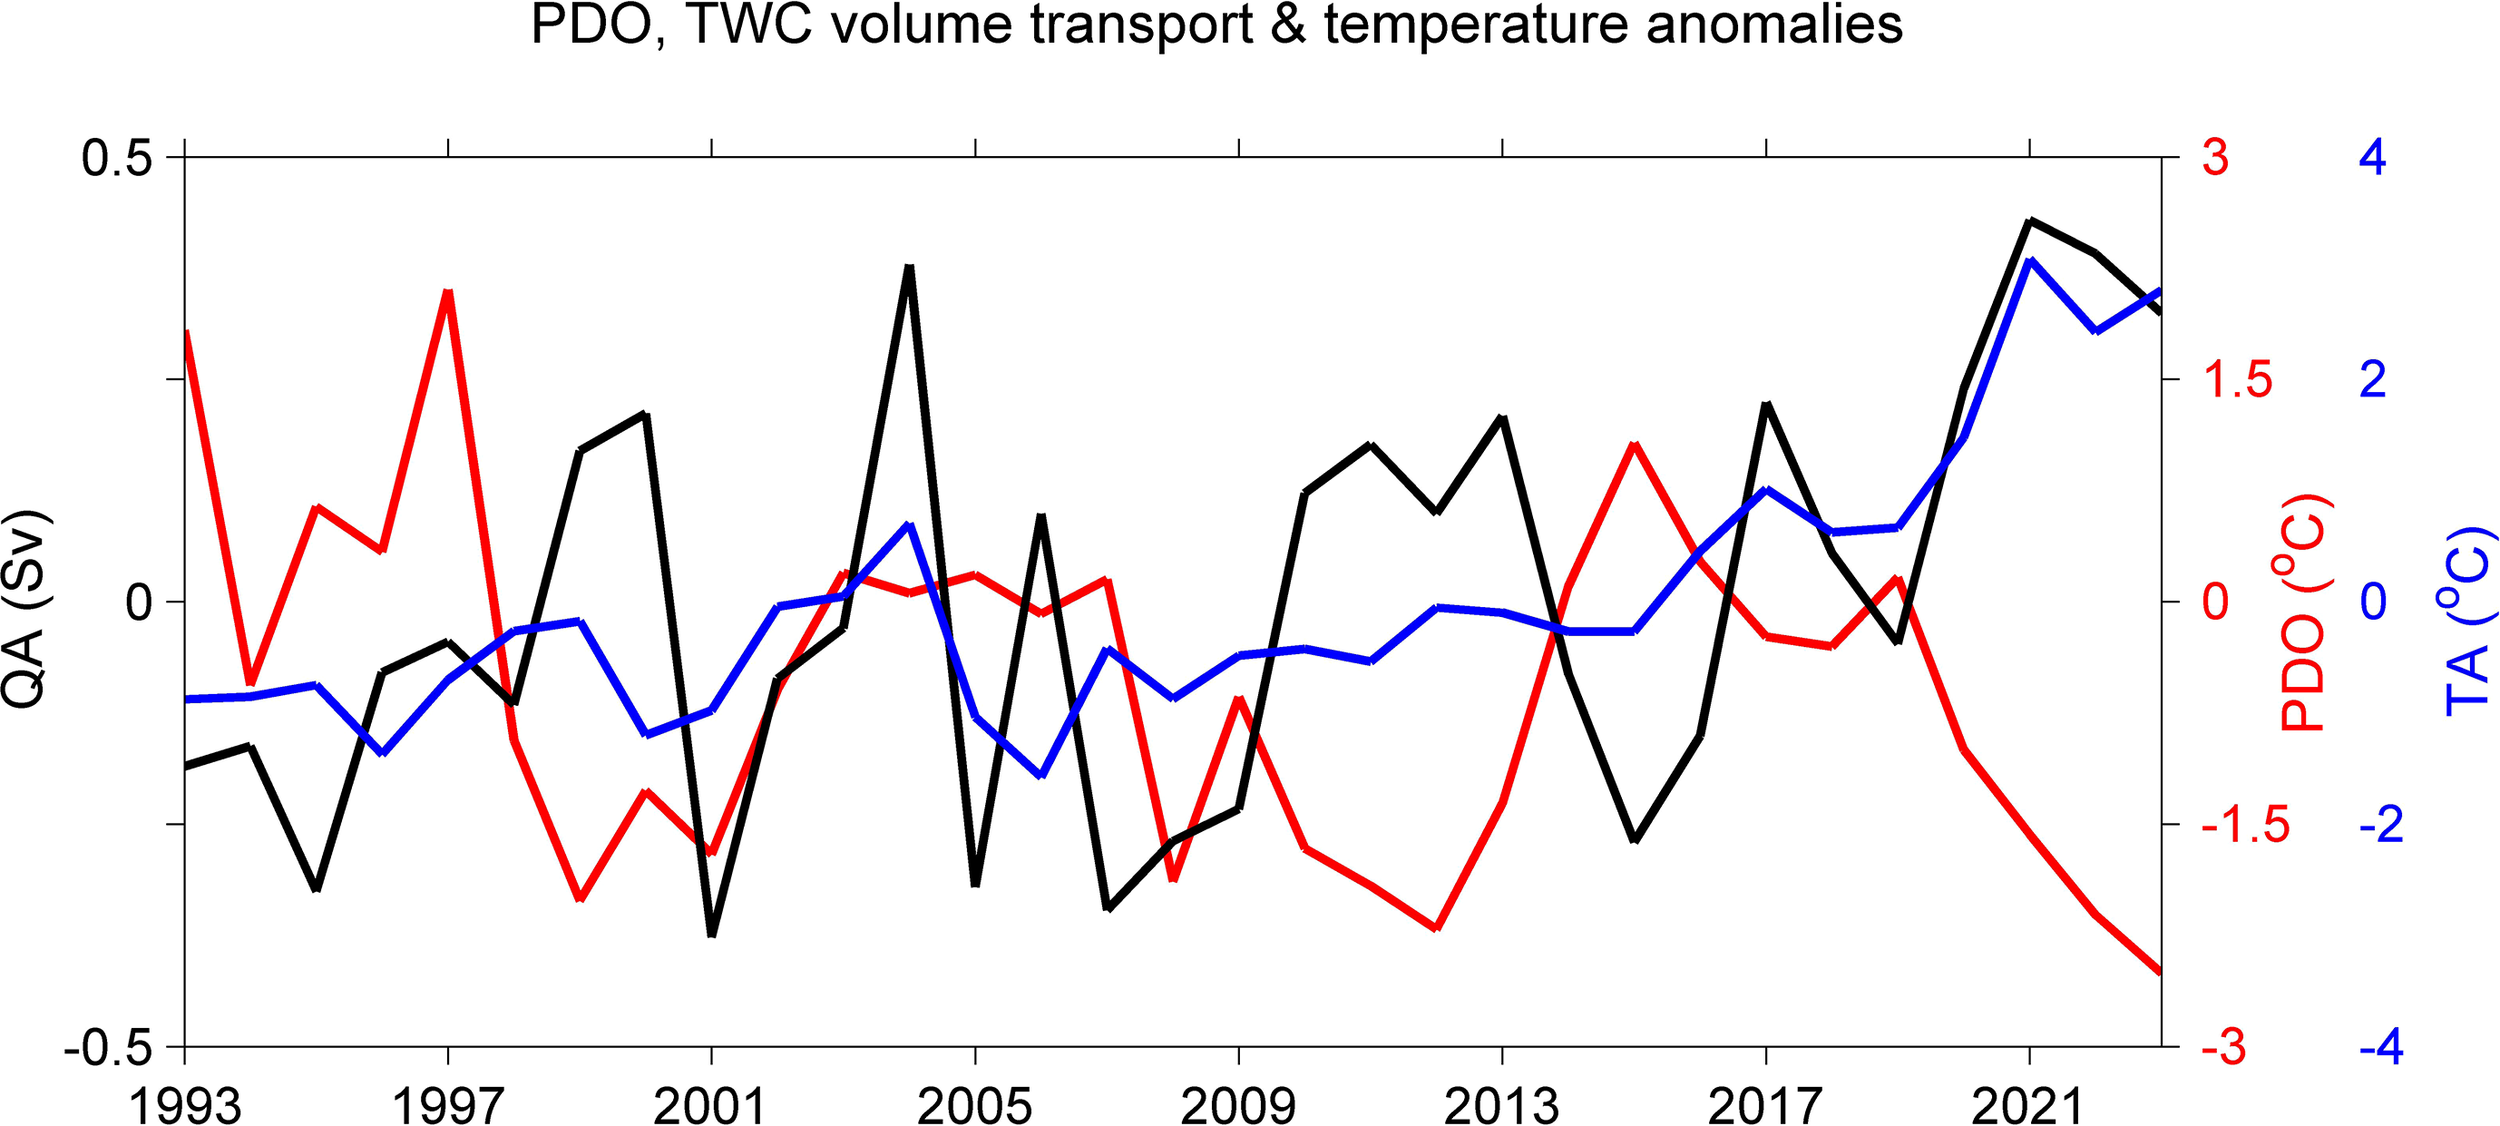
Time series of Pacific Decadal Oscillation (PDO) index (red), anomalies of volume transport of TWC (black) and 70 m sea temperature (blue) area-averaged over the EJS during the summers of 1993–2023.
The summer subsurface MHWs in the EJS also show regional features. For instance, the intensities of MHWs show evident mesoscale features in the southern EJS (Figures 4, 5). In the following, we used the consecutive intense subsurface MHWs 2020–2023 as an example to explain the regional characteristics of the subsurface MHWs. Figure 11 shows the anomalies of sea temperature, current, EKE at 70 m depth in the EJS during the summers of 2020–2023. Among the four years, the anomalies of sea temperature, current and EKE showed distinct features in the southern and northern EJS, respectively. In the southern EJS, the circulation was characterized by an organized EKWC and abundant mesoscale eddies (Figures 11A–D). Positive temperature anomalies occurred along the pathway of the EKWC as well as its separated branches (Figures 11E–H). This reflects the entrainments of warm water by the strengthened EKWC. In addition, positive (negative) temperature anomalies were accompanied with anticyclonic (cyclonic) eddies, which was also indicated from the spatial patterns of the EKE anomaly (Figures 11I–L). This indicates that downwelling (upwelling) associated with anticyclonic (cyclonic) eddies caused warmer (colder) temperature in this region. In the northern EJS, the current magnitudes were much weaker and the spatial patterns were some disorganized. The temperature anomalies were relatively uniform in the northern EJS although several bumps of warmer water were accompanied with anticyclonic eddies.
Figure 11
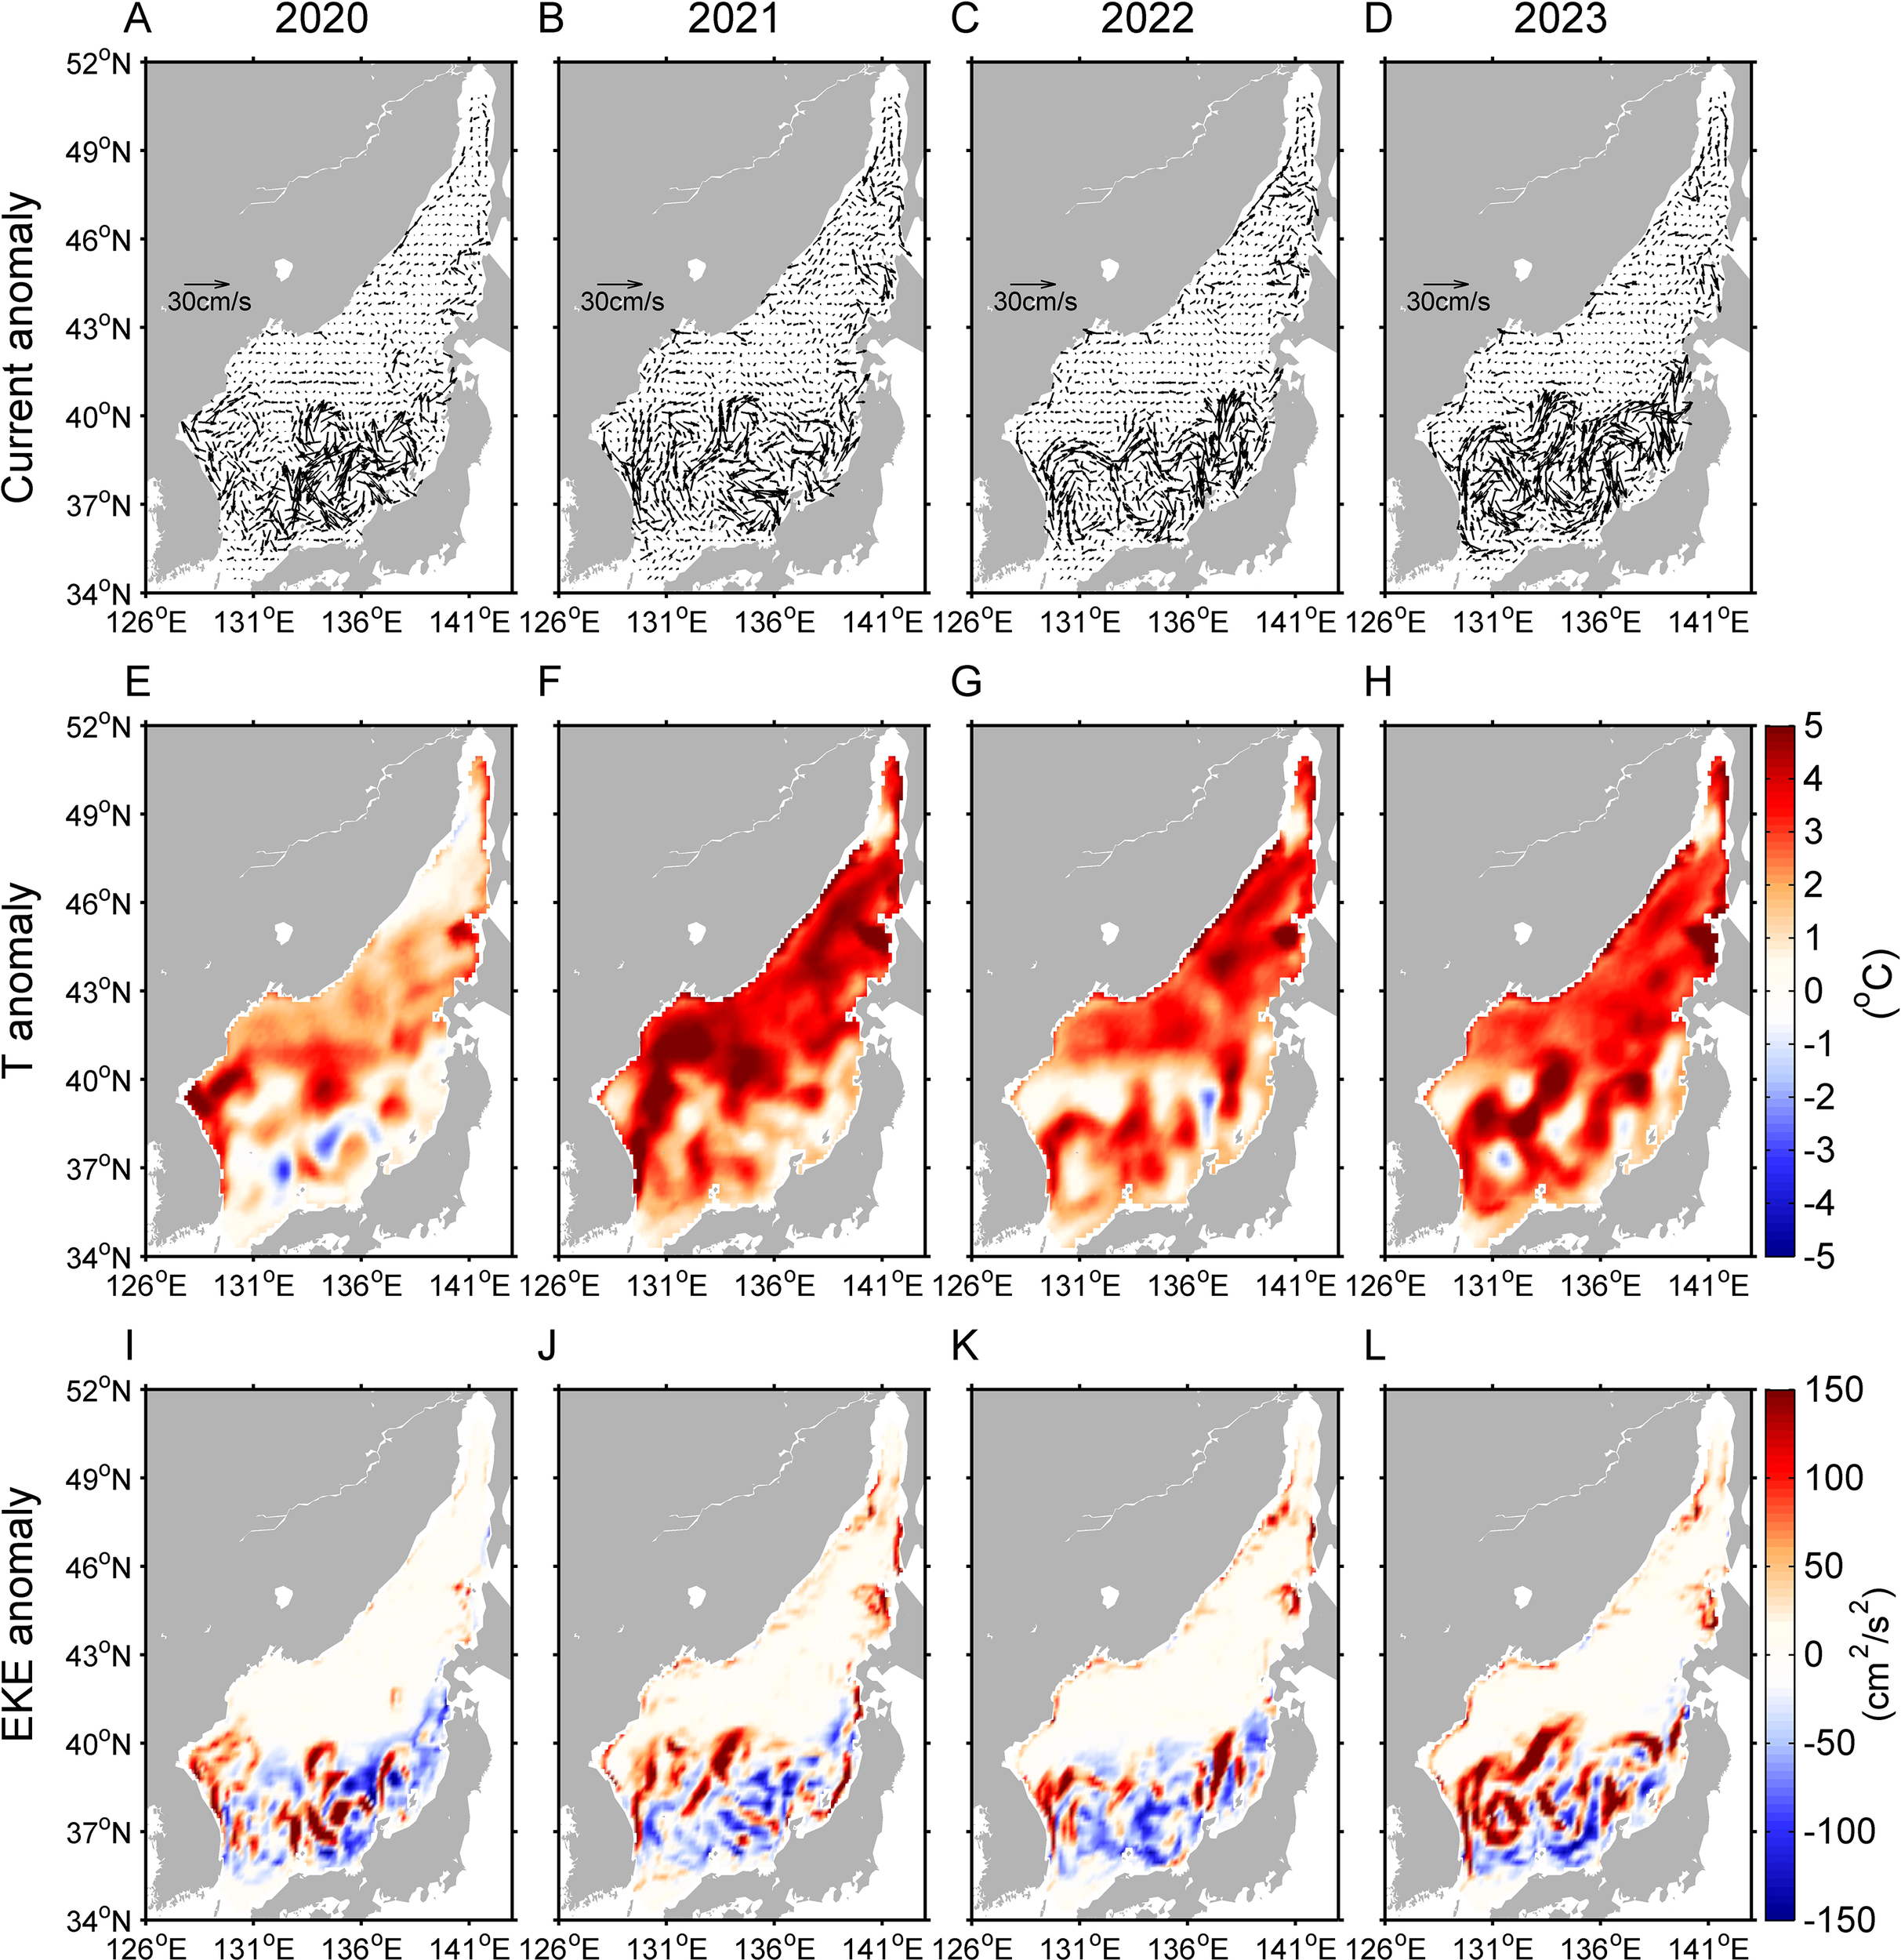
Anomalies of current (A–D), temperature (E–H), EKE (I–L) at 70 m depth in the EJS during the summers of 2020–2023. The temperature and velocity were obtained from the JCOPE2 reanalysis datasets during 1993–2023.
4 Discussion
Subsurface MHWs have received growing recognition due to the great impacts on marine ecosystems (He et al., 2024). Recently, several researchers investigated the vertical structure of MHWs, demonstrating the good ability of oceanic reanalysis datasets in revealing the characteristics of subsurface MHWs (Sun et al., 2023; Yao and Wang, 2024). In the present study, we used the JCOPE2 reanalysis datasets to investigate the summer subsurface MHWs in the EJS. The JCOPE2 system assimilates almost all available satellites, ARGO floats and ships data, so that the model well simulates the oceanic states associated with the KC and mesoscale eddy variability (Kido et al., 2022; Miyazawa et al., 2024; Zheng et al., 2023). The JCOPE2 SSTA averaged over the EJS shows good agreement with the OISST dataset (Figure 2G), encouraging us to use the JCOPE2 reanalysis datasets to characterize the vertical structure of MHWs in the EJS. We found that the MHW intensities in the EJS are much stronger at subsurface layers than at surface and that strong summer subsurface MHWs primarily concentrate on the 20–200 m layers. This is consistent with the findings in previous studies that subsurface-intensified MHWs occurred in upper 200 m of the EJS (Saranya and Nam, 2024; Zhang et al., 2023). The cumulative and maximum intensities show that the summer MHWs are almost spatially-uniform at surface, as suggested in several recent studies (Chen et al., 2023; Choi et al., 2022; Pak et al., 2022; Wang et al., 2022). Our results further confirm that the intensities of summer subsurface MHWs show large spatial variations especially in the southern basin (Figures 4, 5). The strongest subsurface MHWs occurred off the east coast of North Korea with the cumulative and maximum intensities exceeding 50°C days and 6°C, respectively. Temporally, the summer MHWs in the EJS show clear interannual variability: moderate MHW events occurred in 1994, 1998, 2004, 2010, 2013 and 2016–2019, and intense MHW events occurred during 2020–2023. To classify these MHW events into different categories, we estimated the spatial extent of MHWs with depth (Figure 6). Combining the mean intensity over the whole basin, we then derived the area-weight mean intensity over the EJS at different depths (Figure 7). According to the vertical structure of MHWs, the 1994, 1998, 2010 and 2013 events were identified as shallow MHWs, the 2004 and 2016–2023 events were recognized as subsurface MHWs.
The spatially-uniform patterns of surface MHW intensities suggest that large-scale atmospheric forcings play important roles in forming summer surface MHWs in the EJS. This was confirmed from the composite anomalies of SST and solar radiation during widespread surface MHW events (Figure 9). However, as shown in Figures 6-8, intense summer subsurface MHWs were observed at depths of 20–200 m. This suggests the anomalous enhanced solar radiation into the ocean cannot explain these subsurface MHWs due to the strong stratification in the EJS during summer. Our results show that local oceanic circulation is the key trigger of summer subsurface MHWs in the EJS. The subsurface temperature anomaly averaged over the EJS is positively correlated to the anomaly of volume transport of TWC with a coefficient of 0.64 (Figure 10). Accompanying with large positive anomalies of volume transport of TWC during 2004, 2017 and 2020–2023, evident subsurface MHW events were simultaneously recognized during these years. This indicates that enhanced TWC carried more warm water into the EJS, providing favorable conditions to form basin-wide subsurface MHWs (Wang and Wu, 2022). Our results demonstrate the speculation of Saranya and Nam (2024) that horizontal advection plays a significant role in the subsurface-intensified MHWs in upper 200 m of the EJS. Although no detailed works were conducted in the present study to examine the reason why the TWC enhanced among these years, we believed that this was related to the negative phases of PDO (Figure 9) as suggested by several previous studies (Andres et al., 2009; Gordon and Giulivi, 2004; Soeyanto et al., 2014). In the future, atmosphere-ocean coupled model is needed to further explore the PDO’s influences on the subsurface MHWs in the EJS. On the other hand, we found that the regional features of summer subsurface MHWs in the southern EJS were closely associated with local current and mesoscale eddies. During the consecutive intense subsurface MHW events 2020–2023, strengthened EKWC and anticyclonic cyclonic eddies were recognized in the southern EJS (Figure 11). The enhanced EKWC and anticyclonic eddies redistributed the warm water carried by the TWC, leading to the regional features of the summer subsurface MHWs in the southern EJS.
5 Summary and conclusion
Based on the high-resolution JCOPE2 reanalysis datasets during 1993–2023, this study analyzed the characteristics of summer MHWs with depth in the EJS, and then investigated the formation mechanisms of MHWs at subsurface. Climatologically, the cumulative and maximum intensities of summer MHWs show large spatial variations at different depths, with the cumulative (maximum) intensity area-averaged over the EJS ranging from 20°C days (2.5°C) at surface to its maximum of 36°C days (4°C) at approximately 70 m. The vertical structure of MHW intensities confirms significant subsurface intensification (20–200 m) of summer MHWs in the EJS. The cumulative and maximum intensities of MHWs show almost uniform spatial patterns at surface. At subsurface layers, however, the cumulative and maximum intensities of MHWs show substantial spatial variations especially in the southern EJS. Temporally, the summer MHWs in the EJS show clear interannual variability: widespread MHW events occurred in 1994, 1998, 2004, 2010, 2013 and 2016–2023. According to the area-weight mean intensity over the EJS at different depths, the 1994, 1998, 2010 and 2013 events were identified as shallow MHWs, and the 2004 and 2016–2023 events were classified as subsurface MHWs.
During summer, the strong stratification in the EJS inhibits the vertical mixing and traps more heat fluxes at the sea surface. Under such conditions, the surface heat fluxes cannot explain the observed intense summer subsurface MHWs in the EJS at depths of 20–200 m. Our results demonstrate that the intense summer subsurface MHWs are primarily caused by internal oceanic processes. As the main heat sources of the upper ocean in the EJS, the strengthened TWC plays a key role in triggering summer subsurface MHWs in the EJS. Anomalous increased volume transport of TWC carries more warm water into the EJS, providing favorable conditions to form basin-scale subsurface MHWs. After entering the EJS, this warm water is redistributed by the strengthened EKWC and mesoscale eddies, leading to the regional features of subsurface MHWs in the southern EJS. Our study provided an overall view of the characteristics of summer subsurface MHWs in the EJS and the key role of oceanic circulation in triggering these MHWs was highlighted.
Statements
Data availability statement
The original contributions presented in the study are included in the article/supplementary material. Further inquiries can be directed to the corresponding author.
Author contributions
ZL: Conceptualization, Visualization, Writing – original draft, Writing – review & editing. YC: Data curation, Formal analysis, Methodology, Writing – review & editing. GW: Data curation, Formal analysis, Methodology, Writing – review & editing. DL: Data curation, Formal analysis, Methodology, Writing – review & editing. GR: Data curation, Formal analysis, Methodology, Writing – review & editing. CX: Data curation, Formal analysis, Methodology, Writing – review & editing. YL: Formal analysis, Funding acquisition, Investigation, Methodology, Software, Writing – review & editing. X-HZ: Conceptualization, Supervision, Visualization, Writing – original draft, Writing – review & editing.
Funding
The author(s) declare financial support was received for the research and/or publication of this article. This work was supported by the Natural Science Foundation of Zhejiang Province (LQ24D060008), the Scientific Research Foundation of Zhejiang Tongji Vocational College of Science and Technology (G2024011), the National Natural Science Foundation of China (41920104006), the Scientific Research Fund of the Second Institute of Oceanography, MNR (Grant JZ2001), the Innovation Group Project of the Southern Marine Science and Engineering Guangdong Laboratory, Zhuhai (No. 311020004), the National Natural Science Foundation of China (42106035), the Scientific Research Fund of the Second Institute of Oceanography, MNR (Grant JG2306).
Conflict of interest
The authors declare that the research was conducted in the absence of any commercial or financial relationships that could be construed as a potential conflict of interest.
Generative AI statement
The author(s) declare that no Generative AI was used in the creation of this manuscript.
Any alternative text (alt text) provided alongside figures in this article has been generated by Frontiers with the support of artificial intelligence and reasonable efforts have been made to ensure accuracy, including review by the authors wherever possible. If you identify any issues, please contact us.
Publisher’s note
All claims expressed in this article are solely those of the authors and do not necessarily represent those of their affiliated organizations, or those of the publisher, the editors and the reviewers. Any product that may be evaluated in this article, or claim that may be made by its manufacturer, is not guaranteed or endorsed by the publisher.
References
1
Andres M. Park J. Wimbush M. Zhu X. Nakamura H. Kim K. et al . (2009). Manifestation of the pacific decadal oscillation in the kuroshio. Geophys. Res. Lett.36. doi: 10.1029/2009GL039216
2
Chang Y. Miyazawa Y. Oey L. Kodaira T. Huang S. (2017). The formation processes of phytoplankton growth and decline in mesoscale eddies in the western North Pacific Ocean. J. Geophys. Res. Oceans122, 4444–4455. doi: 10.1002/2017JC012722
3
Chang K. Teague W. Lyu S. Perkins H. Lee D. Watts D. et al . (2004). Circulation and currents in the southwestern East/Japan Sea: Overview and review. Prog. Oceanogr.61, 105–156. doi: 10.1016/j.pocean.2004.06.005
4
Chelton D. Schlax M. Samelson R. (2011). Global observations of nonlinear mesoscale eddies. Prog. Oceanogr.91, 167–216. doi: 10.1016/j.pocean.2011.01.002
5
Chen S. Yao Y. Feng Y. Zhang Y. Xia C. Sian K. et al . (2023). Characteristics and drivers of marine heatwaves in 2021 summer in east korea bay, Japan/east sea. Remote Sens.15, 713. doi: 10.3390/rs15030713
6
Choi W. Bang M. Joh Y. Ham Y. Kang N. Jang C. (2022). Characteristics and mechanisms of marine heatwaves in the east asian marginal seas: regional and seasonal differences. Remote Sens.14, 3522. doi: 10.3390/rs14153522
7
de Boyer Montégut C. Madec G. Fischer A. Lazar A. Iudicone D. (2004). Mixed layer depth over the global ocean: An examination of profile data and a profile-based climatology. J. Geophys. Res.109, C12003. doi: 10.1029/2004jc002378
8
Elzahaby Y. Schaeffer A. (2019). Observational insight into the subsurface anomalies of marine heatwaves. Front. Mar. Sci.6, 745. doi: 10.3389/fmars.2019.00745
9
Fukudome K. Yoon J. Ostrovskii A. Takikawa T. Han I. (2010). Seasonal volume transport variation in the Tsushima Warm Current through the Tsushima Straits from 10 years of ADCP observations. J. Oceanogr.66, 539–551. doi: 10.1007/s10872-010-0045-5
10
Gordon A. Giulivi C. (2004). Pacific decadal oscillation and sea level in the Japan/East Sea. Deep Sea Res. Part I.51, 653–663. doi: 10.1016/j.dsr.2004.02.005
11
He Q. Zhan W. Feng M. Gong Y. Cai S. Zhan H. (2024). Common occurrences of subsurface heatwaves and cold spells in ocean eddies. Nature634, 1111–1117. doi: 10.1038/s41586-024-08051-2
12
Hobday A. Alexander L. Perkins S. Smale D. Straub S. Oliver E. et al . (2016). A hierarchical approach to defining marine heatwaves. Prog. Oceanogr.141, 227–238. doi: 10.1016/j.pocean.2015.12.014
13
Hughes T. Kerry J. Baird A. Connolly S. Dietzel A. Eakin C. M. et al . (2018). Global warming transforms coral reef assemblages. Nature556, 492–496. doi: 10.1038/s41586-018-0041-2
14
Isobe A. (2008). Recent advances in ocean-circulation research on the Yellow Sea and East China Sea Shelves. J. Oceanogr.64, 569–584. doi: 10.1007/s10872-008-0048-7
15
Kalnay E. Kanamitsu M. Kistler R. Collins W. Deaven D. Gandin L. et al . (1996). The NCEP/NCAR 40–year reanalysis project. Bull. Am. Meteorol. Soc77, 437–471. doi: 10.1175/1520-0477(1996)077<0437:TNYRP>2.0.CO;2
16
Kido S. Nonaka M. Miyazawa Y. (2022). JCOPE-FGO: an eddy-resolving quasi-global ocean reanalysis product. Ocean Dyn.72, 599–619. doi: 10.1007/s10236-022-01521-z
17
Li Z. Wu G. Xu C. Zhao J. Wang M. Sheng J. et al . (2024a). The cause of an extreme sea surface warming in the midlatitude western North Pacific during 2012 summer. Front. Mar. Sci.11, 1471446. doi: 10.3389/fmars.2024.1471446
18
Li Z. Wu G. Xu C. Zhu X. Long Y. (2024b). Summer marine heatwaves in the tropical Indian Ocean associated with an unseasonable positive Indian Ocean Dipole event 2012. Front. Mar. Sci.11, 1425813. doi: 10.3389/fmars.2024.1425813
19
Miyazawa Y. Komatsu K. Setou T. (2008). Nowcast skill of the JCOPE2 ocean forecast system in the Kuroshio-Oyashio mixed water region (in Japanese with English abstract and figure captions). J. Mar. Meteorol. Soc. (Umi to Sora).84, 85–91.
20
Miyazawa Y. Yaremchuk M. Varlamov S. Miyama T. Chang Y. Hayashida H. (2024). An ensemble-based data assimilation system for forecasting variability of the Northwestern Pacific ocean. Ocean Dyn.1–23. doi: 10.1007/s10236-024-01614-x
21
Oliver E. Benthuysen J. Darmaraki S. Donat M. Hobday A. Holbrook N. J. et al . (2021). Marine heatwaves. Annu. Rev. Mar. Sci.13, 313–342. doi: 10.1146/annurev-marine-032720-095144
22
Oliver E. Donat M. Burrows M. Moore P. Smale D. Alexander L. et al . (2018). Longer and more frequent marine heatwaves over the past century. Nat. Commun.9, 1324. doi: 10.1038/s41467-018-03732-9
23
Pak G. Noh J. Park Y. Jin H. Park J. (2022). Governing factors of the record-breaking marine heatwave over the mid-latitude western North Pacific in the summer of 2021. Front. Mar. Sci.9, 946767. doi: 10.3389/fmars.2022.946767
24
Reynolds R. Smith T. Liu C. Chelton D. Casey K. Schlax M. (2007). Daily high-resolution-blended analyses for sea surface temperature. J. Clim.20, 5473–5496. doi: 10.1175/2007JCLI1824.1
25
Saranya J. Nam S. (2024). Subsurface evolution of three types of surface marine heatwaves over the East Sea (Japan Sea). Prog. Oceanogr.222, 103226. doi: 10.1016/j.pocean.2024.103226
26
Schaeffer A. Roughan M. (2017). Subsurface intensification of marine heatwaves off southeastern Australia: The role of stratification and local winds. Geophys. Res. Lett.44, 5025–5033. doi: 10.1002/2017GL073714
27
Smale D. Wernberg T. Oliver E. Thomsen M. Harvey B. Straub S. et al . (2019). Marine heatwaves threaten global biodiversity and the provision of ecosystem services. Nat. Clim. Change9, 306–312. doi: 10.1038/s41558-019-0412-1
28
Smith K. Burrows M. Hobday A. King N. Moore P. Sen Gupta A. et al . (2023). Biological impacts of marine heatwaves. Annu. Rev. Mar. Sci.15, 119–145. doi: 10.1146/annurev-marine-032122-121437
29
Soeyanto E. Guo X. Ono J. Miyazawa Y. (2014). Interannual variations of Kuroshio transport in the East China Sea and its relation to the Pacific Decadal Oscillation and mesoscale eddies. J. Geophys. Res. Oceans119, 3595–3616. doi: 10.1002/2013JC009529
30
Song Q. Wang C. Yao Y. Fan H. (2024). Unraveling the Indian monsoon’s role in fueling the unprecedented 2022 Marine Heatwave in the Western North Pacific. Clim. Atmos. Sci.7. doi: 10.1038/s41612-024-00645-x
31
Sun D. Li F. Jing Z. Hu S. Zhang B. (2023). Frequent marine heatwaves hidden below the surface of the global ocean. Nat. Geosci.16, 1099–1104. doi: 10.1038/s41561-023-01325-w
32
Szuwalski C. Aydin K. Fedewa E. Garber-Yonts B. Litzow M. (2023). The collapse of eastern Bering Sea snow crab. Science382, 306–310. doi: 10.1126/science.adf6035
33
Takikawa T. Yoon J. Cho K. (2005). The Tsushima Warm Current through Tsushima Straits estimated from ferryboat ADCP data. J. Phys. Oceanogr.35, 1154–1168. doi: 10.1175/JPO2742.1
34
Teague W. Hwang P. Jacobs G. Book J. Perkins H. (2005). Transport variability across the Korea/TsushimaStrait and the Tsushima Island wake. Deep-Sea Res. II52, 1784–1801. doi: 10.1016/j.dsr2.2003.07.021
35
Wang Y. Wu C. (2022). Rapid surface warming of the Pacific Asian marginal seas since the late 1990s. J. Geophys. Res. Ocean127, e2022JC018744. doi: 10.1029/2022JC018744
36
Wang D. Xu T. Fang G. Jiang S. Wang G. Wei Z. et al . (2022). Characteristics of marine heatwaves in the Japan/east sea. Remote Sens.14, 936. doi: 10.3390/rs14040936
37
Wyatt A. Leichter J. Washburn L. Kui L. Edmunds P. Burgess S. (2023). Hidden heatwaves and severe coral bleaching linked to mesoscale eddies and thermocline dynamics. Nat. Commun.14, 25. doi: 10.1038/s41467-022-35550-5
38
Yao Y. Wang C. (2024). Subsurface marine heatwaves in the South China Sea. J. Geophys. Res. Ocean129, e2024JC021356. doi: 10.1029/2024JC021356
39
Yao Y. Wang J. Yin J. Zou X. (2020). Marine heatwaves in China’s marginal seas and adjacent offshore waters: Past, Present, and Future. J. Geophys. Res. Ocean125, e2019JC015801. doi: 10.1029/2019JC015801
40
Zhang Y. Du Y. Feng M. Hobday A. (2023). Vertical structures of marine heatwaves. Nat. Commun.14, 6483. doi: 10.1038/s41467-023-42219-0
41
Zhang Y. Wallace J. Battisti D. (1997). ENSO-like interdecadal variability: 1900-93. J. Climate10, 1004–1014. doi: 10.1175/1520-0442(1997)010<1004:ELIV>2.0.CO;2
42
Zheng J. Guo X. Miyazawa Y. Yang H. Yang M. Mao X. et al . (2023). Diagnostic analysis of the response of volume transport through the tsushima strait to the eddy-induced variations in the kuroshio region. J. Phys. Oceanogr.53, 2597–2617. doi: 10.1175/JPO-D-22-0164.1
Summary
Keywords
subsurface marine heatwave, East/Japan Sea, Tsushima warm current, East Korea warm current, mesoscale eddy
Citation
Li Z, Cui Y, Wu G, Liu D, Ren G, Xu C, Long Y and Zhu X-H (2025) Characteristics and mechanisms of summer subsurface marine heatwaves in the East/Japan Sea. Front. Mar. Sci. 12:1680577. doi: 10.3389/fmars.2025.1680577
Received
06 August 2025
Accepted
20 October 2025
Published
30 October 2025
Volume
12 - 2025
Edited by
Fearghal O. Donncha, IBM Research, Ireland
Reviewed by
Miaohua Mao, Chinese Academy of Sciences (CAS), China; Zifeng Hu, Sun Yat-sen University, China; Xiaofan Lou, Guangzhou Railway Polytechnic, China
Updates
Copyright
© 2025 Li, Cui, Wu, Liu, Ren, Xu, Long and Zhu.
This is an open-access article distributed under the terms of the Creative Commons Attribution License (CC BY). The use, distribution or reproduction in other forums is permitted, provided the original author(s) and the copyright owner(s) are credited and that the original publication in this journal is cited, in accordance with accepted academic practice. No use, distribution or reproduction is permitted which does not comply with these terms.
*Correspondence: Xiao-Hua Zhu, xhzhu@sio.org.cn
Disclaimer
All claims expressed in this article are solely those of the authors and do not necessarily represent those of their affiliated organizations, or those of the publisher, the editors and the reviewers. Any product that may be evaluated in this article or claim that may be made by its manufacturer is not guaranteed or endorsed by the publisher.