 Alexander Savin
 Alexander Osadchiev
- 1Moscow Institute of Physics and Technology, Dolgoprudny, Russia
- 2Shirshov Institute of Oceanology, Russian Academy of Sciences, Moscow, Russia
River plumes formed by the Ob, Yenisei, and Lena rivers in the Eurasian Arctic are among the largest river plumes globally in terms of area. In this article, a detailed analysis of newly available satellite-derived surface salinity data retrieved for the Eurasian Arctic is presented. Two dominant spreading types of the Ob–Yenisei plume in the Kara Sea are identified. Under westerly–southwesterly winds, the plume remains coastally trapped along the southern coast of the sea, propagates eastward toward the Vilkitskiy Strait and into the Laptev Sea. Its area scales linearly with the combined Ob–Yenisei river discharge volume. Under easterly–northeasterly winds, the Ob–Yenisei plume expands toward the central and northern Kara Sea. Strong northeasterly winds can drive its advection into the northern part of Kara Sea, with plume areas up to 320 thousand km2. In the Eastern Arctic, the Lena plume exhibits two patterns governed by the presence or absence of wind–driven advection from the Laptev Sea to the East Siberian Sea via the Sannikov and Laptev Straits, controlled by winds over the southeastern Laptev Sea. Within the East Siberian Sea, the Lena plume behaves largely independently and is primarily wind–forced. Its area could exceed 800 thousand km2 and shows weak sensitivity to river discharge volume.
1 Introduction
The Arctic shelf seas are subject to substantial river runoff influence. Discharge from the three largest Arctic rivers, namely, the Ob, Yenisei, and Lena, forms extensive river plumes, constituting some of the largest freshened areas in the World Ocean (Aagaard and Carmack, 1989; Kang et al., 2013; Haine et al., 2015; Williams and Carmack, 2015; Osadchiev et al., 2021a, Osadchiev et al., 2021b).
The freshened surface layer (FSL) in the Kara Sea originates primarily from two main sources, namely, the Yenisei River and the Gulf of Ob, which receives inflow from the Ob, Pur, Taz, and Nadym rivers. The total annual runoff into the Kara Sea is approximately 1500 km3 (Figure 1a) (Gordeev et al., 1996; Pavlov et al., 1996). Area of the Ob–Yenisei plume reaches 200–250 thousand km2, comprising about one quarter of the Kara Sea surface area (Osadchiev et al., 2021a). The direction of plume spreading during the ice-free season could vary substantially from year to year. In previous studies, three main spreading patterns of the Ob–Yenisei plume were described, namely, the western, northern/central, and eastern spreading types (Rusanov and Vasil’ev, 1976; Moretskii, 1985; Kubryakov et al., 2016). Under the eastern pattern, the plume spreads eastward across the Kara Sea and could extend further into the Laptev Sea through the Vilkitskiy Strait. The western type is characterized by advection of the Ob–Yenisei plume into the southwestern part of the Kara Sea between the Yamal Peninsula and Novaya Zemlya. In the northern/central pattern, the plume predominantly moves northward from the Ob and Yenisei estuaries.
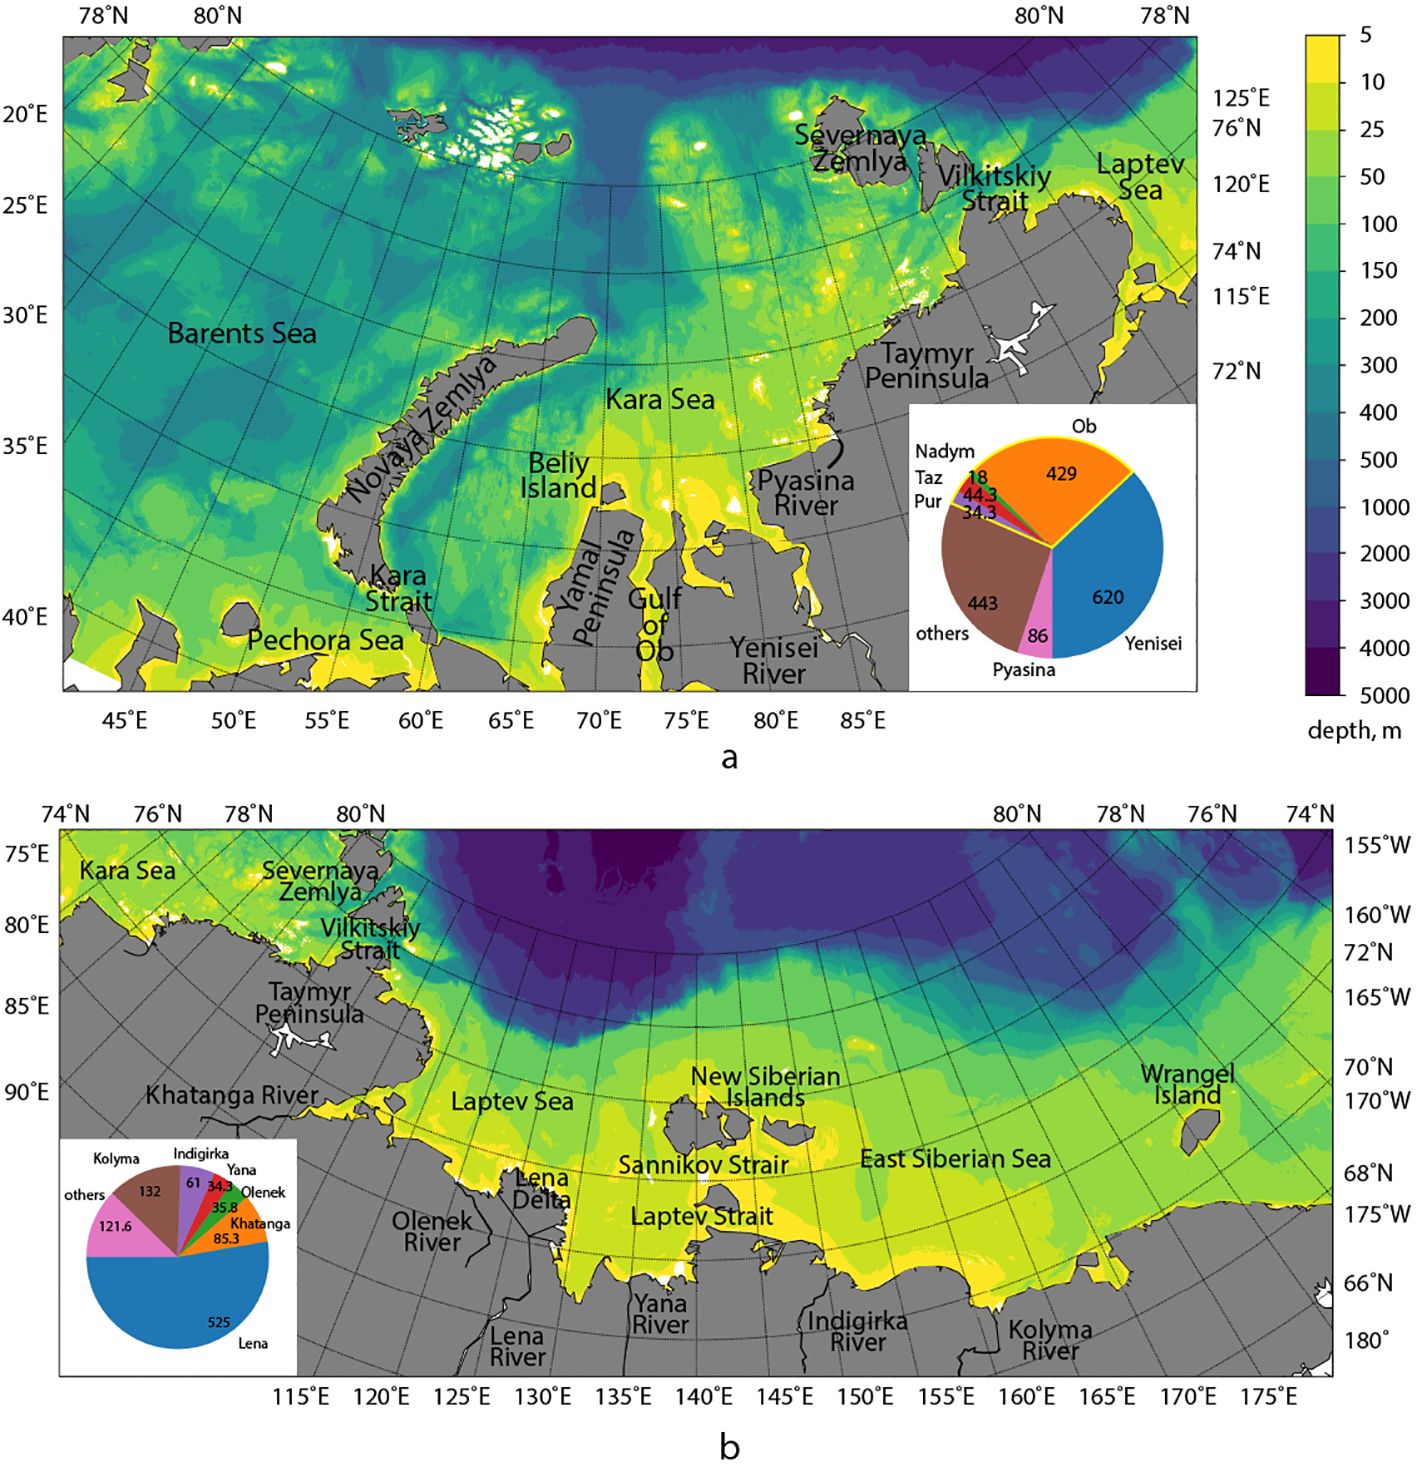
Figure 1. Bathymetry map of the Kara Sea (a), Laptev Sea and East Siberian Sea (b) (GEBCO Compilation Group, 2025). The histograms at the insets show average annual discharge values of the major rivers in km3 based on (Gordeev et al., 1996).
FSL in the Eastern Arctic is formed in the Laptev Sea and the East Siberian Sea mainly by discharge of the Lena River (mean annual runoff of about 600 km3), as well as the Khatanga, Olenyok, and Yana rivers in the Laptev Sea and the Indigirka and Kolyma rivers in the East Siberian Sea. The annual discharges of the Kolyma and Khatanga rivers (that are the largest after the Lena River) are approximately 100 km3 (Figure 1b) (Gordeev et al., 1996). The total annual runoff into the Laptev and East Siberian seas is approximately 1000 km3 (Figure 1b) (Gordeev et al., 1996; Pavlov et al., 1996). Area of the FSL in the Eastern Arctic is 250–500 thousand km2 (Osadchiev et al., 2021b), but at its maximal extent it could cover up to half of the Laptev and East Siberian Seas, i.e., 700–800 thousand km2 (Rogozhin et al., 2025). During the last decades, two main Lena plume spreading patterns were described (Dmitrenko et al., 2005, Dmitrenko et al., 2008; Janout et al., 2020; Osadchiev et al., 2021c). The eastern spreading type occurs under prevailing westerly winds that press the Lena plume to the southern parts of the Laptev and East Siberian seas, resulting in a small area of the plume. Under predominant easterly winds and northern spreading type, the Lena plume advects northward and occupies wide area in the central parts of the Laptev and East Siberian seas.
Structure and dynamics of large river plumes in the Arctic Ocean are mainly determined by river runoff volume and wind conditions (Harms and Karcher, 2005; Dmitrenko et al., 2005; Panteleev et al., 2007; Osadchiev et al., 2017; Mulligan and Perrie, 2019; Clark and Mannino, 2021; Rogozhin et al., 2023; Konik and Osadchiev, 2025). Formation and spreading of FSL in the Arctic Ocean are also significantly influenced by coastline features and ice conditions, particularly the presence and arrangement of ice fields (Osadchiev et al., 2017, Osadchiev et al., 2020a, Osadchiev et al., 2020c; Spivak et al., 2021; Osadchiev et al., 2024).
For the long time, the main method of studying river plumes in the Arctic Ocean was in situ measurements in the surface layer conducted during oceanographic expeditions. Although such measurements offer the highest accuracy, they have several drawbacks. First, the Arctic river plumes have large spatial extents (hundreds of kilometers) and high temporal variability. This fact makes it hardly possible to simultaneously cover the entire plume area by in situ observations. Secondly, the Arctic seas are characterized by difficult accessibility and harsh climate conditions. As a result, the amount of available in situ measurements is very limited. There are almost no measurements under ice coverage and very few measurements were taken in the early ice-free season or shortly before autumn ice formation.
In recent decades, remote sensing methods for sea surface monitoring have developed rapidly. In particular, satellite salinity data from the SMOS (Kerr et al., 2010), Aquarius (Le Vine et al., 2007), and SMAP (Entekhabi et al., 2010) missions are available since the early 2010s. These data enable coverage of wide areas and allow assessment of temporal variability of many large-scale processes in the surface ocean. However, the quality of satellite salinity data in the Arctic Ocean is significantly lower compared to equatorial and tropical regions. Nevertheless, certain studies based on satellite salinity observations provide opportunities to address spreading of FSL in the Arctic Ocean (Kubryakov et al., 2016; Fournier et al., 2019; Martínez et al., 2021; Zhuk and Kubryakov, 2021; Zhao et al., 2022).
To improve the accuracy of sea surface salinity (SSS) data, the regional numerical model for SSS in the Eurasian Arctic seas was recently developed (Savin et al., 2024). This model uses machine learning approaches to process SMAP measurement data. In situ observations collected during oceanographic expeditions in the Eurasian Arctic seas in 2015–2021 were used for model training and validation. The described model made it possible to obtain satellite-derived salinity data for the surface layer of the Eurasian Arctic seas with significantly higher accuracy than it was previously available. These satellite data are provided for each day of the ice-free season starting from 2015.
The current study focuses on variability and dynamics of FSL formed by large river plumes in the Kara, Laptev, and East Siberian seas. The work is based on the analysis of SSS data obtained using the regional model described above. Based on these data, spreading of the Ob–Yenisei and Lena plumes during every ice-free season from 2015 to 2024 was described in detail. Also, novel SSS data enabled identification of the main Ob–Yenisei and Lena plume spreading patterns that determine their interannual variability. The obtained results significantly refined previous knowledge about these processes. This study also investigates wind-driven dynamics of the Ob–Yenisei and Lena plumes and identifies fundamental differences between the wind-driven motion of the Ob–Yenisei plume in the Kara Sea, the Lena plume in the Laptev Sea, and the Lena plume in the East Siberian Sea. Finally, the response of the Ob–Yenisei and Lena plumes to wind variability on synoptic temporal scale is examined and discussed.
2 Data and methods
2.1 Sea surface salinity data
Analysis of spatial variability and dynamics of FSL in this study is carried out primarily using SSS data. For this purpose, satellite data acquired by the SMAP mission are used after additional processing developed for the Eurasian Arctic seas (Savin et al., 2024). The model is based on statistical correction of satellite data and their validation against in situ measurements collected during multiple oceanographic expeditions. SMAP data are available since 2015, therefore, the period considered in this study is from 2015 to 2024.
To analyze spatial distribution of SSS in the Eurasian Arctic, satellite data were interpolated onto a regular grid with a step of 0.5° in latitude and 0.125° in longitude. With this resolution, the grid becomes nearly square in the vicinity of 75° N, with a step size of about 15 km. It is important to note that regular grid interpolation is not a part of the statistical processing algorithm of SMAP SSS data. RMSE error between the interpolated data and in-situ measurements on all available data is 2.40 psu, which is comparable to the quality of the model before interpolation equal to 2.15 psu. For high salinity values (>24 psu), the error is 1.84 psu (1.71 psu before interpolation), 2.59 psu for medium (15–24 psu) salinity values (2.70 psu before interpolation) and 3.61 psu for low (<15 psu) salinity values (3.43 psu before interpolation).
The SSS data were additionally averaged over 3 days, as during this period the satellite orbit reliably covers the entire study region. Usage of 1 day or 3 days averaged data does not affect the analysis of spreading of the Ob-Yenisei and Lena plumes because both data sets demonstrate similar patterns in plume border changes. However, 3 days averaged SSS data provides stable spatial coverage of the Kara, Laptev and East Siberian seas, while 1 day averaged SSS data have large gaps between satellite orbits. Therefore, in this study we analyzed the 3 days averaged SSS data.
2.2 River discharge, wind forcing, sea surface temperature and altimetry, and sea ice data
To assess the influence of river discharge volume on spreading of river plumes, data from the Arctic Great Rivers Observatory (ArcticGRO) are used (The Arctic Great Rivers Observatory, 2025), namely, the Ob (hydrological station in Salekhard), Yenisei (Igarka), Lena (Kyusyur), Kolyma (Kolymskoye), Indigirka (Vorontsovo), Yana (Yubileynaya), and Olenek (Tyumati) rivers.
Wind forcing exerts the primary control on the surface layer motion. In the Kara Sea, wind strength and direction determine the circulation and seasonal spreading regimes of the Ob–Yenisei river plume. In the East Siberian Sea, wind conditions also govern the Lena plume dynamics in the Laptev Sea and its northward and eastward propagation. Typical monthly mean wind speeds are about 3–4 m/s, whereas extreme winds can reach more then 20–30 m/s. In this study, the large spatial scales of the Ob–Yenisei and Lena plumes are assumed to ignore extreme winds. Consequently, the analysis focuses on monthly mean winds during the ice-free season.
Wind data are taken from the ERA5 reanalysis provided by the European Centre for Medium-Range Weather Forecasts (ECMWF) and distributed by the Copernicus Climate Change Service (C3S) of the European Commission (Hersbach et al., 2020). Wind stress that affects the sea surface layer is described from wind speed (v) by the equation.
The Ekman theory of wind-driven currents provides the following equations for the zonal (U) and meridional (V) components of the total flow (Ekman, 1905):
To describe the motion of the plume boundaries in accordance with Equations 1, 2, the following values are used: air density ρa = 1.225 k gm−3, seawater density ρ0 = 1025 kg m−3, Coriolis frequency f = 1.41 · 10−4 sec−1, drag coefficient Cw = 1.3 · 10−3. The plume thickness is assumed to be 10 meters.
In addition to SSS data, sea surface temperature (SST) data are also used to detect river plume areas and characterize the motion of river plume boundaries. These data are obtained from SMAP satellite observations and mapped onto the same grid as SSS data.
Satellite altimetry data on absolute dynamic topography (ADT) is available since 1993. In this work, daily data from the European Union Copernicus Marine Service Information are used (doi 10.48670/moi-00148).
Finally, the spatial extent of the river plumes is analyzed in accordance to local ice conditions. Sea ice concentration data are taken from the University of Bremen (data.seaice.uni-bremen.de/databrowser/) and the Arctic and Antarctic Research Institute (aari.ru/data/) websites.
3 Results
3.1 The Ob–Yenisei plume in the Kara Sea
Multiple studies describe the western, central/northern, and eastern spreading types of the Ob–Yenisei plume in the Kara Sea. The novel high-accuracy satellite-derived SSS data made it possible to analyze the statistics of the Ob–Yenisei plume distribution in the Kara Sea. For each grid point, the ratio of the number of days when salinity at this grid point is less than 27 psu (which corresponds to salinity of the Ob–Yenisei plume) to the total number of days with available SSS data (i.e., ice-free conditions) was calculated. Therefore, each grid point is assigned a value from 0 to 1, reflecting how often the Ob–Yenisei plume (or in some cases freshening from recently melted sea ice) occupies this grid point. The results are shown in Figure 2.
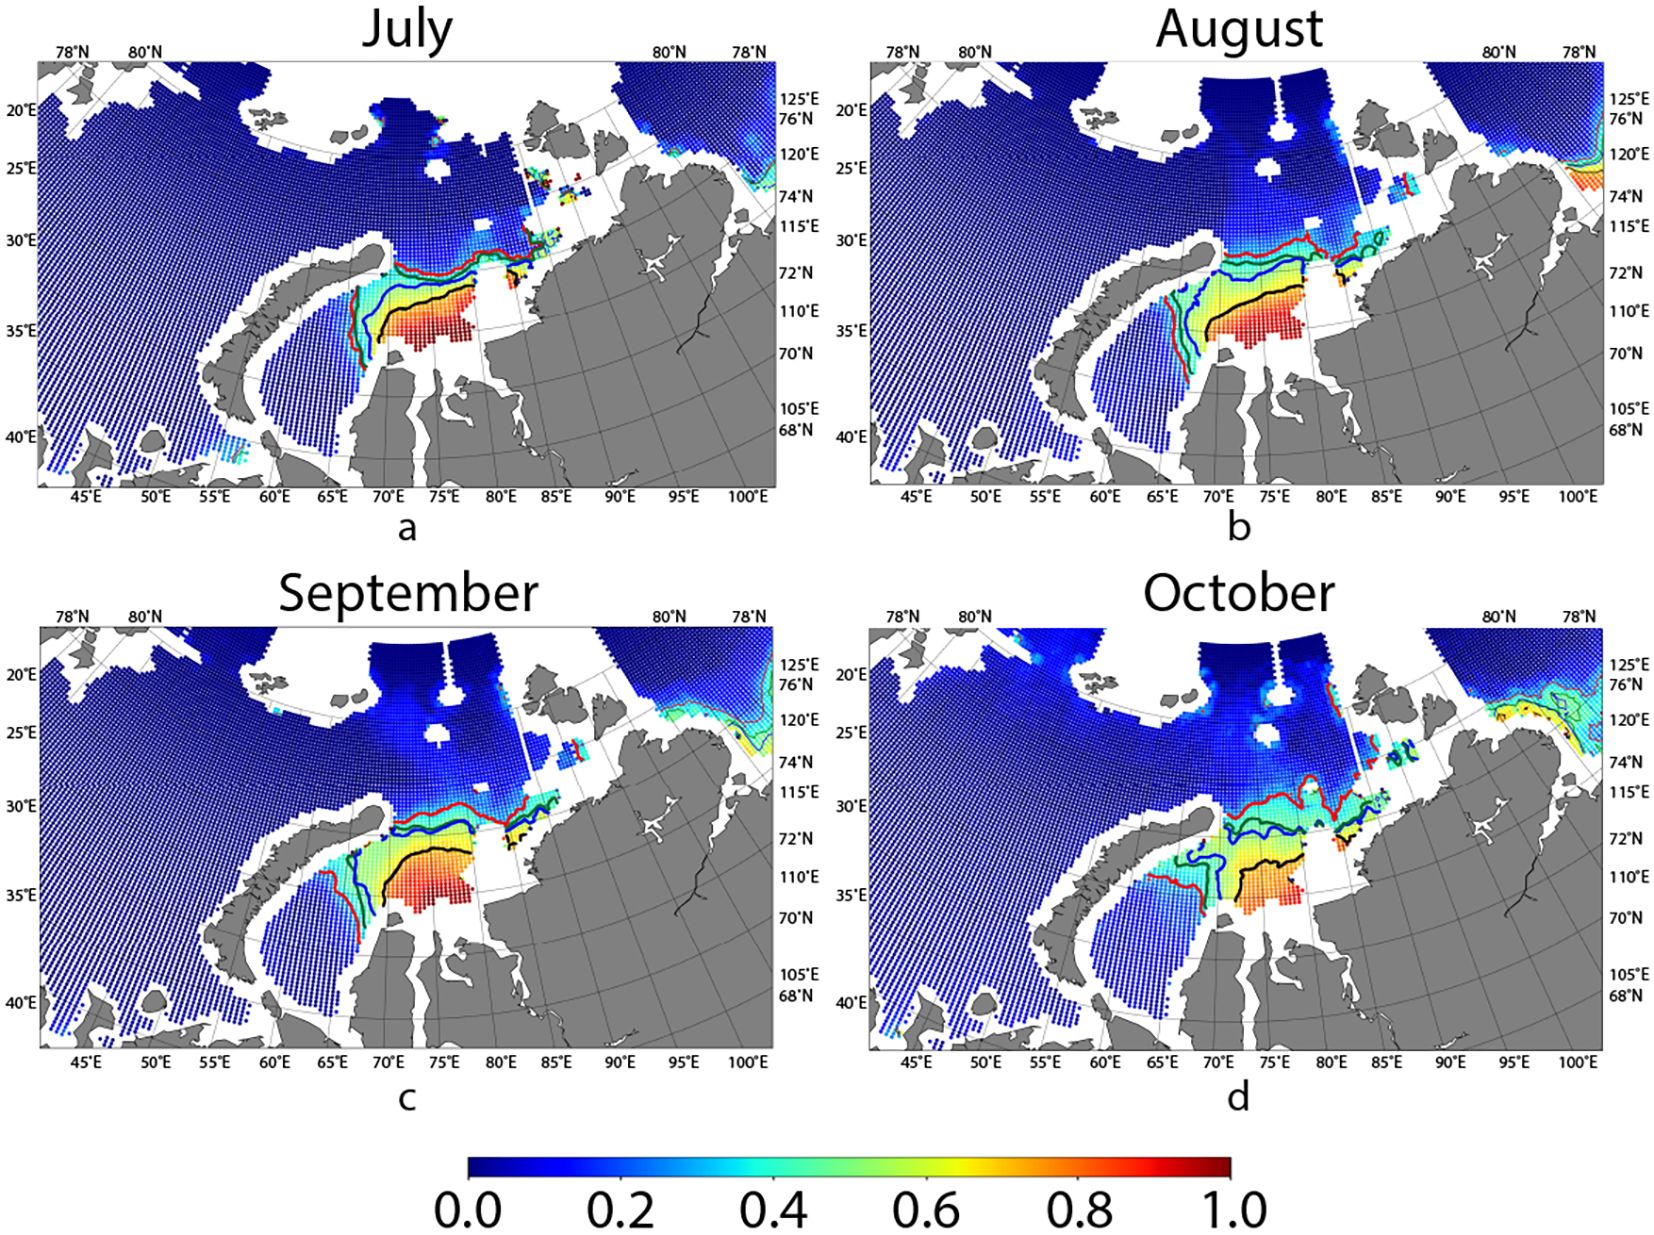
Figure 2. Probability of the Ob–Yenisei plume occurrence in the Kara Sea in in July (a), August (b), September (c), and October (d) based on SSS data from 2015 to 2024. The red, blue, and black isolines correspond to values 0.3, 0.5, and 0.7, respectively. The green isoline shows 10 years mean Ob–Yenisei plume border determined by averaged position of the isohaline of 27 psu.
The resulting map represents the Ob–Yenisei plume area in the Kara Sea averaged over 10 years. It indicates typical spreading area of the Ob–Yenisei plume in different months of the ice-free season and could be used to assess its seasonal variability. In July, the Ob–Yenisei plume is usually located in the central part of the Kara Sea, its averaged northern boundary is located to the south from 76°N. The averaged western boundary is situated to the west of the mouth of the Gulf of Ob at 67°−68°E (Figure 2a). Later the median plume spreading area (the blue isoline in Figure 2) gradually expands. By September, in the northwest direction it reaches the southern coast of Novaya Zemlya (Figure 2c). In September–October, the Ob–Yenisei plume could flow into the Laptev Sea through the Vilkitskiy Strait (Figures 2c,d). While blue isoline demonstrates median plume position, the green isoline indicates its mean position, namely, the averaged position of the isohaline of 27 psu during ice-free season in 2015-2024. The mean isoline covers a larger area than the median isoline, that could be explained by the influence of meltwater, which expands mean plume border and is especially prominent in July. The median isoline is more stable without outliers associated with meltwater, so the blue isoline is considered as the typical border of the Ob-Yenisei plume.
It is also important to consider the seasonal variability of the Ob–Yenisei plume boundary with a 30% occurrence frequency (the red isoline in Figure 2). This boundary actually reflects the possible spreading types of the Ob–Yenisei plume in individual years. In this work, the western spreading type of the Ob–Yenisei plume is defined as a situation when the western boundary of the plume generally coincides with the 0.3 isoline in Figure 2 for each month. The northern and eastern types of plume spreading are determined in this work in the analogous way. On the other hand, the 0.7 isoline demonstrates the area of the almost constant presence of the Ob-Yenisei plume. The plume occupies this area regardless of its spreading type.
The term “central spreading type” is not used in the present work when considering the Ob-Yenisei plume spreading. To describe spreading of the plume northward of 76° N, the term “northern spreading pattern” is the most appropriate. Based on the analyzed data, there are no cases when the northern boundary of the Ob–Yenisei plume is located southward of 74° N and no eastward or westward spreading occurs, i.e., when the entire plume is concentrated in the estuarine area. This kind of case could be referred to as “central spreading type”, but in fact, this spreading type does not occur.
Figure 3 shows the typical position of the Ob–Yenisei plume in the Kara Sea for each year considered in this study. The eastern spreading type corresponds to the plume position in 2016, 2018, 2020, and 2021. During the years with the eastern spreading type, the Ob–Yenisei plume is typically pressed against the coast of the Taymyr Peninsula and penetrates into the Laptev Sea through the Vilkitskiy Strait. The western and northern spreading types occur mainly simultaneously, e.g., in 2015, 2019, 2022, 2023, and 2024. The western spreading type without any northward propagation of the Ob–Yenisei plume was observed only in 2017. All spreading types of Ob–Yenisei plume in the Kara Sea during the considered years are discussed in more detail below.
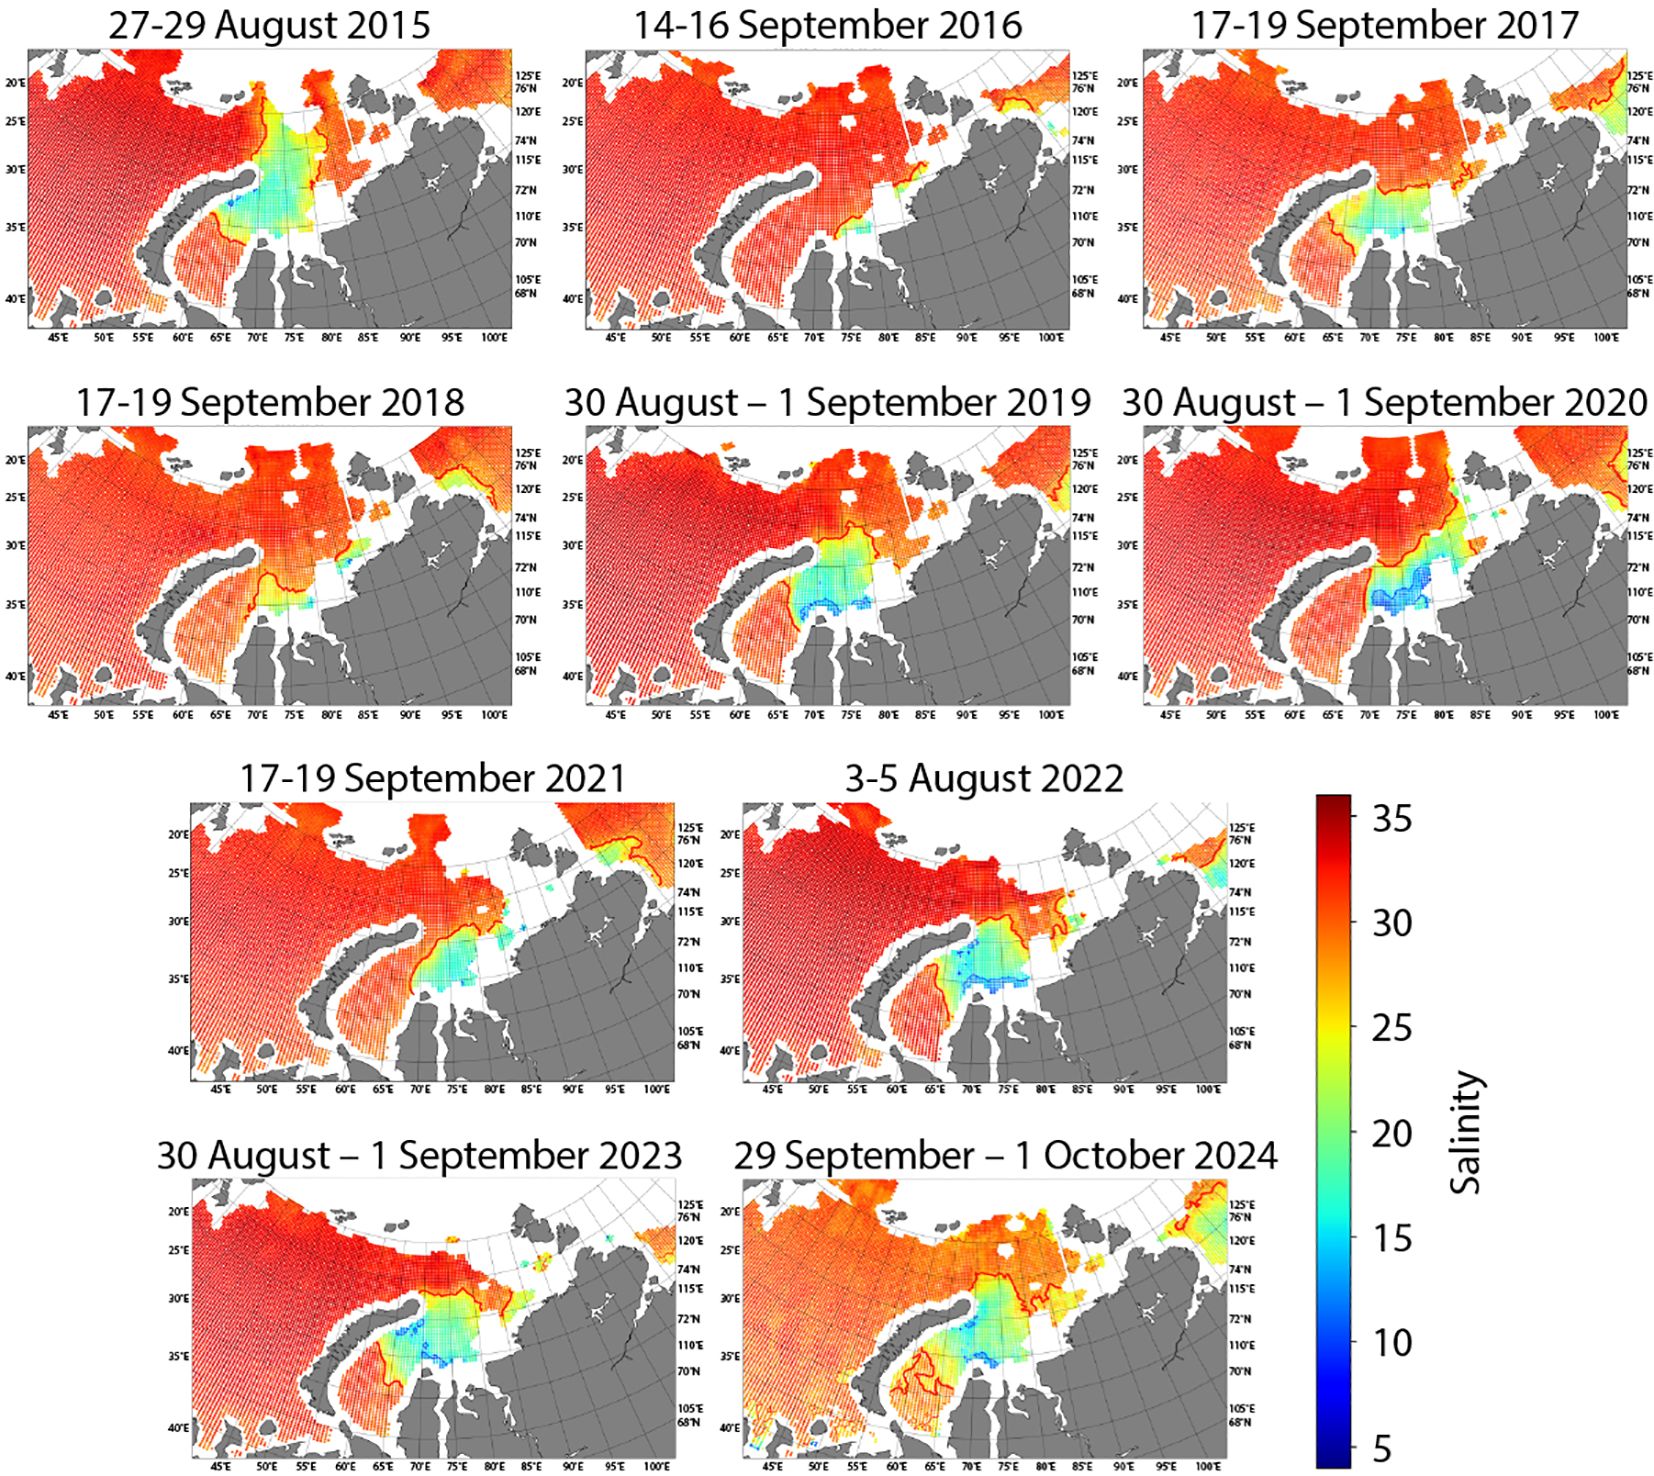
Figure 3. Surface salinity in the Kara Sea during indicative three-day periods in August–September demonstrating spreading type of the Ob–Yenisei plume for each individual year in 2015–2024. Blue and red isolines correspond to the 15 and 27 psu values, respectively.
3.1.1 Northern spreading of the Ob–Yenisei plume
The farthest northern spreading of the Ob–Yenisei plume was observed in 2015. In early July, a stable Ob–Yenisei plume was formed in the central part of the Kara Sea, which was well distinguishable by temperature (6–7°C) and salinity. By mid-July, the northern boundary of the plume reached 76.5° N, and its area by that time was almost 250 thousand km2 (Figure 4a). During July, strong northeasterly wind prevailed over the central part of the Kara Sea (73° − 78° N, 70° − 85° E) with a monthly mean speed of 5.1 m/s (meridional component -4.6 m/s, zonal component -2.1 m/s) that is non-typical for the summer–autumn period in the Kara Sea. Notably, for 17 days in July, the daily mean speed of the northeasterly and easterly wind exceeded 5 m/s, i.e., during more than a half of the month the monthly average was exceeded. In early August, the northern boundary of the plume reached 78.5°N (Figure 4b).
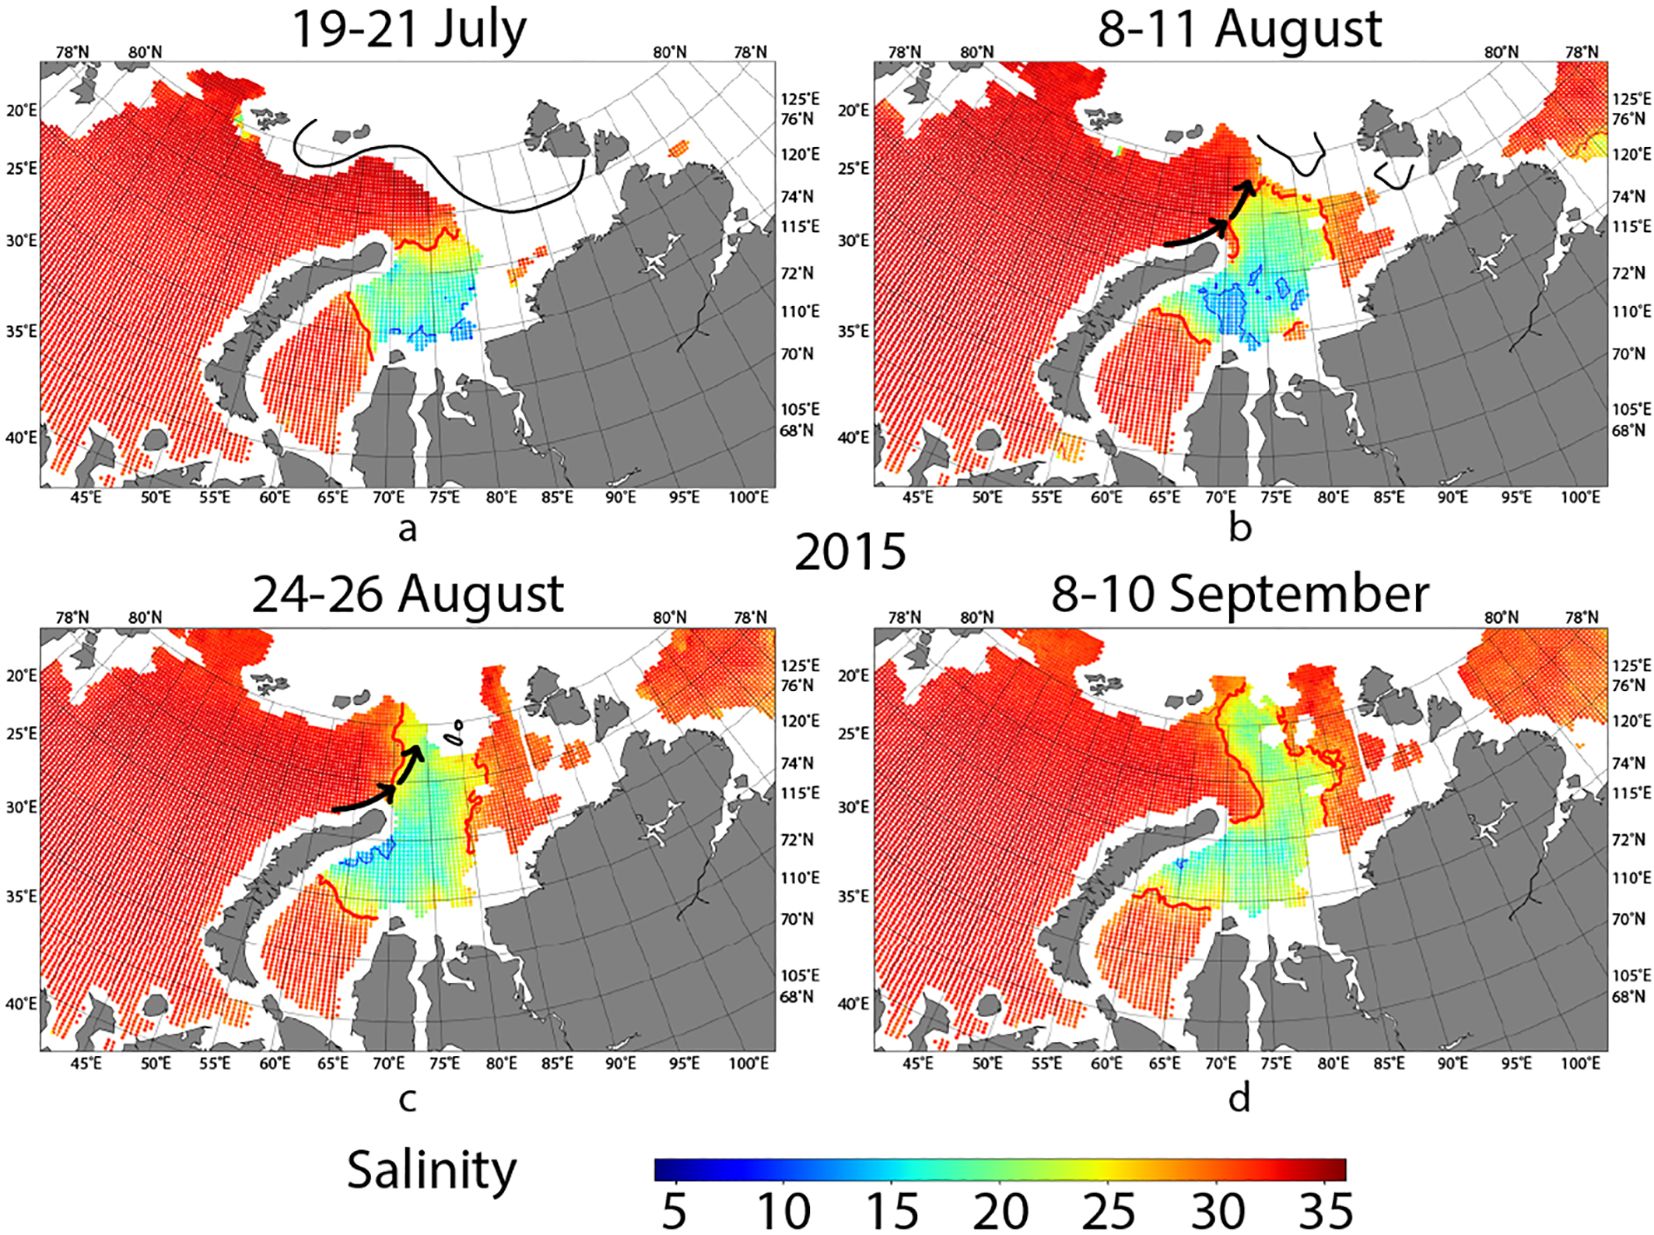
Figure 4. Northern spreading type of the Ob–Yenisei plume in the Kara Sea on 19–21 July (a), 8–11 August (b), 24–26 August (c), and 8–10 September (d) 2015. The black arrows in panels b–c indicate the West Novaya Zemlya Current and its continuation in the northern part of the Kara Sea. Blue and red isolines correspond to the 15 and 27 psu values, respectively. The black lines schematically demostrate location of the ice edge.
During the first ten days of August, northeasterly wind still prevailed in the central part of the Kara Sea. It was especially strong along the southern coast, leading to wind-induced upwelling in the Yenisei Gulf and near the northern coast of the Taymyr Peninsula (Figure 4b). The water temperature in the upwelling area was 4–5 °C, while the plume temperature was 10–11°C. The salinity in the upwelling area was 28–29 psu, compared to about 20 psu for the plume in the same area earlier. From mid-August, the wind speed began to subside, but northward movement of the Ob–Yenisei plume continued. In mid-August, it reached 79° N, where it mixed with low-saline waters formed by sea ice melting. The area of the plume increased to 320 thousand km2, which is more than 35% of the Kara Sea area (Figure 4c). Such an abnormally rapid 200 and far northern spreading of the Ob–Yenisei plume north of Novaya Zemlya to 79°N apparently results from the influence of the West Novaya Zemlya Current and its continuation (schematically indicated by black arrows in Figures 4b,c) (Osadchiev et al., 2022). This assumption is supported by wind conditions in 203 August, when a prevailing northerly wind occurred over the Kara Sea.
In the second half of August, the northern boundary of the Ob–Yenisei plume reached the region of sea ice melting in the northern part of the Kara Sea. The river plume mixed with meltwater, forming a joint FSL (Figure 4c). Meltwater could be distinguished from plume water by its lower temperature, although it quickly warmed and reached plume temperatures within about a week. From this time until mid-September, further northward spreading of the Ob–Yenisei plume in the northern part of the Kara Sea could not be detected due to presence of sea ice. The maximal northward extension of the plume was observed in late August, when its northern boundary reached 81° N (Figure 4c).
By mid-September, dissipation of the Ob–Yenisei plume in the northern Kara Sea began. The explicit outer boundary of the Ob–Yenisei plume disappeared according to SSS data, together with sharp cooling of the surface layer. This process is associated both with intensive mixing in the area due to the strong surface current (Osadchiev et al., 2022; Zabudkina et al., 2025) and autumn convection (Osadchiev et al., 2023a, Osadchiev et al., 2023b). Warm and low-saline plume remained only in the central part of the Kara Sea and southward of Novaya Zemlya. Until the end of the first decade of October, the Ob–Yenisei plume was still observed in the central (northward of the Ob and Yenisei estuaries up to 76.5°N) and southwestern parts of the Kara Sea according to salinity data. After that, active ice formation began and by 20 October the central part of the Kara Sea was covered with ice.
The Ob–Yenisei plume boundary reached the northern part of the Kara Sea (northward of 77° N) also in 2019, 2022, and 2024. At the end of August 2019, the plume boundary remained at 78° N, while in early August 2022 it remained at 77.5° N (Figure 3). Unfortunately, it was not possible to track the plume spreading in August–September 2022, as during that period the satellite radiometer failed, and no SSS data are available for one and a half months. However, wind conditions observed during that period did not provide any conditions for further northward advection of the Ob–Yenisei plume. In 2024, northward advection of the plume began in late September, when its boundary passed northward of Novaya Zemlya. Note that the northern spreading of the Ob–Yenisei plume in 2019, 2022, and 2024 was not as far as in 2015. In 2015, joint impact of several factors resulted in very far northward plume spreading including early ice melting in the central part of the Kara Sea, anomalously strong northeasterly winds, and late ice melting in the northern part of the Kara Sea that increased the total FSL volume.
3.1.2 Western spreading of the Ob–Yenisei plume
Western spreading type of the Ob–Yenisei plume was observed in the already discussed year of 2015. In this year, the southwestern part of the Kara Sea cleared from sea ice in the second decade of July. By that time warm and low-saline plume waters reached the southern coast of Novaya Zemlya, where they were mixed with cold meltwater. The western boundary of the Ob–Yenisei plume reached 65° E and remained stable. Southern part of the western plume boundary was almost stationary near the Beliy Island (locared at the mouth of the Gulf of Ob), while its northern part gradually advanced westward (Figures 4b–d). This process was facilitated by wind forcing in the southern part of the Kara Sea (in the region 73° − 76.5° N, 60° − 80° E). In July, the speed of the northeasterly wind was 4.9 m/s; in August, the wind shifted to northerly with speed of 2.8 m/s. Altimetry data show that rise in sea level formed along the southern coast of Novaya Zemlya, as a consequence of wind setup. After the Ob–Yenisei plume reached Novaya Zemlya, it started spreading both westward and eastward along the coast. On the eastern side, plume waters reached the central part of the Kara Sea and merged with the Ob–Yenisei plume in this area. On the western side, the movement of the plume along Novaya Zemlya formed the northern segment of the western boundary of the Ob–Yenisei plume. As a result, by early September, the western boundary of the Ob–Yenisei plume reached 60° E and extended almost strictly westward from the Beliy Island (Figure 4d).
Another example of the western spreading type of the Ob–Yenisei plume was observed in 2017 (Figure 5). In the second part of July, the plume reached 75° N. At that time, the western part of the Kara Sea was still covered by ice, and the western boundary of the Ob–Yenisei plume reached the sea ice edge (Figure 5a). As the ice melted, the western boundary of the plume visible at SSS data shifted westward. In early August, meltwater formed a narrow cold surface layer between the remaining ice and the Ob–Yenisei plume. This meltwater quickly (within 3–5 days) became indistinguishable at salinity data, but remained noticeably colder for a long time, until early September. At the end of August, the plume was pressed against the southern coast of the Kara Sea in the estuarine zone of the Ob and Yenisei rivers at about 74.5° N. A part of the plume remained isolated in the western Kara Sea, westward from the Beliy Island (Figure 5b).
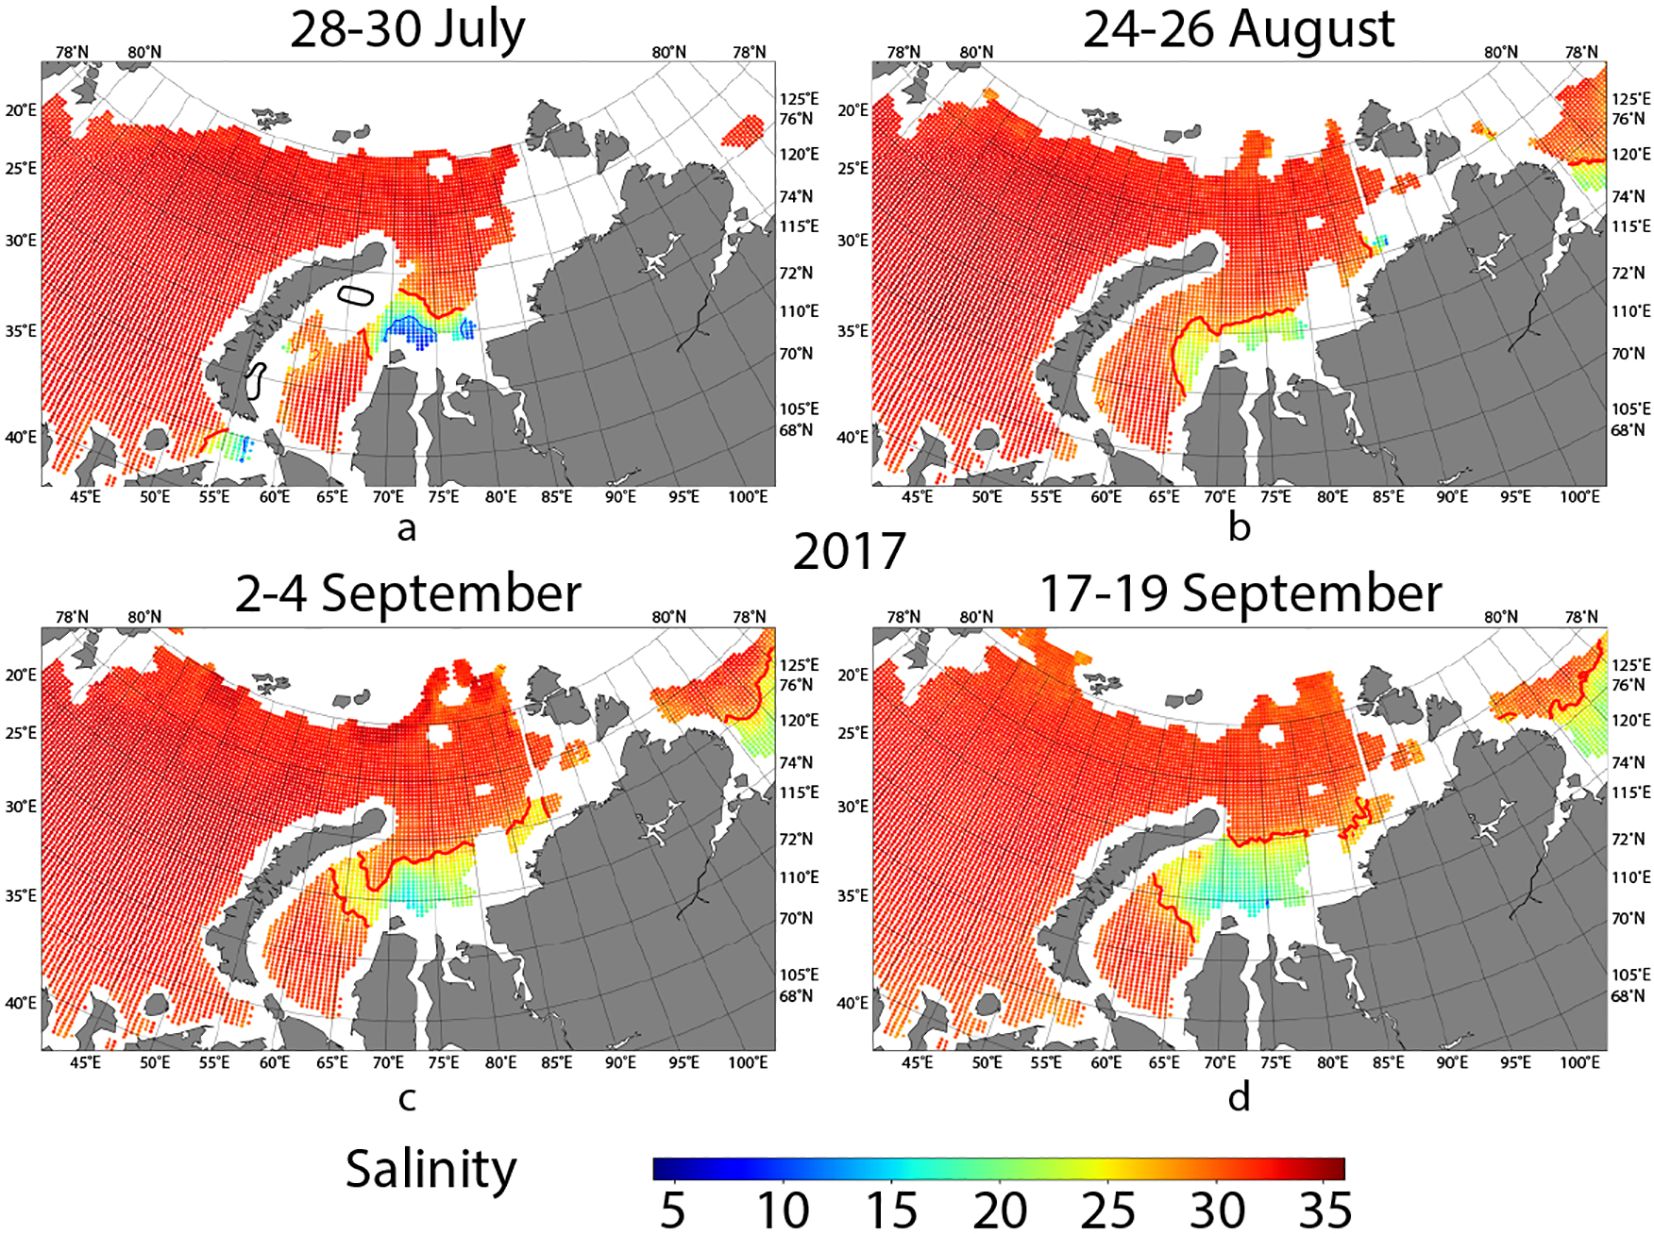
Figure 5. Western spreading type of the Ob–Yenisei plume in the Kara Sea on 28–30 July (a), 24–26 August (b), 2–4 September (c), and 17–19 September (d) 2017. Blue and red isolines correspond to values of 15 and 27 psu, respectively. The black lines schematically demostrate location of the ice edge.
In September, spreading of the Ob–Yenisei plume acquired a more pronounced western type (Figure 5c). This was facilitated by sharply increased wind speed. While in July and August northeasterly winds were mostly weak (1 m/s on average), in September wind direction changed to northeasterly and its speed significantly increased. The monthly average wind speed in September in the region 73° − 75.5° N, 65° − 85° E was 3.2 m/s. Under this wind forcing, both parts of the plume moved in northwestern direction. However, during two weeks they remained separated by a region of saline seawater between them (Figure 5c). In the second half of September, these two parts merged (Figure 5d), and the Ob–Yenisei plume remained in the central and western parts of the Kara Sea until late October, when active ice formation began. The maximal area of the plume was observed in the second half of September and exceeded 200 thousand km2.
3.1.3 Eastern spreading of the Ob–Yenisei plume
Tracking the eastward propagation of the Ob–Yenisei plume in the Kara Sea based on available data is rather challenging. This is due, first, to multiple islands in the eastern part of the Kara Sea, and, second, to the common presence of sea ice near the Vilkitskiy Strait. SSS data is not available near the coastline and in ice-covered areas. These regions remain uncovered by satellite measurements that could be directly used for analysis.
Nevertheless, in certain years, it is possible to observe steady propagation of the Ob–Yenisei plume toward the eastern part of the Kara Sea and its subsequent advection into the Laptev Sea. A typical example of this process was observed in 2018. Throughout July, northwesterly winds prevailed over the Kara Sea (in the region 73° − 76° N, 70° − 85° E) with an average monthly wind speed of 3.5 m/s. Shortly after the ice retreat, the plume occupied the central part of the Kara Sea. In the southwestern part of the sea, by mid-August the plume reached Novaya Zemlya because wind forcing became weak. In the eastern part of the Kara Sea it reached the ice-covered area near the Vilkitskiy Strait. In early September, the plume passed through the Vilkitskiy Strait and entered the Laptev Sea, where it was clearly identified at SSS data. In this region, the Ob–Yenisei plume was observed until mid-October, while in the Kara Sea it remained pressed to the coast of the Taymyr Peninsula.
In 2020, by mid-July, the northern boundary of the Ob–Yenisei plume reached 78° N. In July, northeasterly winds predominated at the central part of the Kara Sea (in the region 73° − 77° N, 70° − 90° E) with speed of 5 m/s. This wind resulted in spreading of the Ob–Yenisei plume to the central part of the Kara Sea. The Ob-Yenisei plume was present in the eastern part of the Kara Sea in July presumably because in June it advected eastward under sea ice as a geostrophic current. In August, wind direction changed to easterly and the plume moved northward, where formed a joint FSL with meltwater accumulated southwestward of Severnaya Zemlya. According to salinity data, these waters are indistinguishable, though their temperatures are notably different. At the end of August, plume temperature was 9–10°C, whereas meltwater temperature in the eastern part of the Kara Sea was significantly lower (6–7°C). The ice melting process ended in the first half of September, and by this time the temperatures of the plume and meltwater became equal at around 8°C. The boundary between them disappeared both in salinity and temperature satellite data. In late August, when this boundary was still visible, it could be estimated that the eastern edge of the plume reached 90° E. A slight advection of FSL into the Laptev Sea was observed only in early October. During that time the plume in the Kara Sea was pressed to the coast of the Taymyr Peninsula.
In 2021, as in 2020, the eastward spreading type of the Ob–Yenisei plume was observed. Similarly to the previous year, the plume rapidly reached the meltwater area in the eastern part of the Kara Sea. In 2021, the ice massif remained in the eastern part of the Kara Sea during the entire warm season. Advection of FSL from the Kara Sea to the Laptev Sea through the Vilkitskiy Strait was observed in salinity data strating from the middle of August (Figure 6b). By mid-September, the eastern part of the Ob–Yenisei plume reached the Khatanga plume (Figure 6d) in the Laptev Sea. The presence of FSL eastward of the Vilkitskiy Strait indicates advection of the Ob–Yenisei plume below the ice coverage, which remained in the eastern part of the Kara Sea and in the Vilkitskiy Strait. Interaction of warm plume with sea ice accelerated its melting, which increased the volume of the eastern part of the Ob–Yenisei plume, but resulted in a decrease in its temperature.
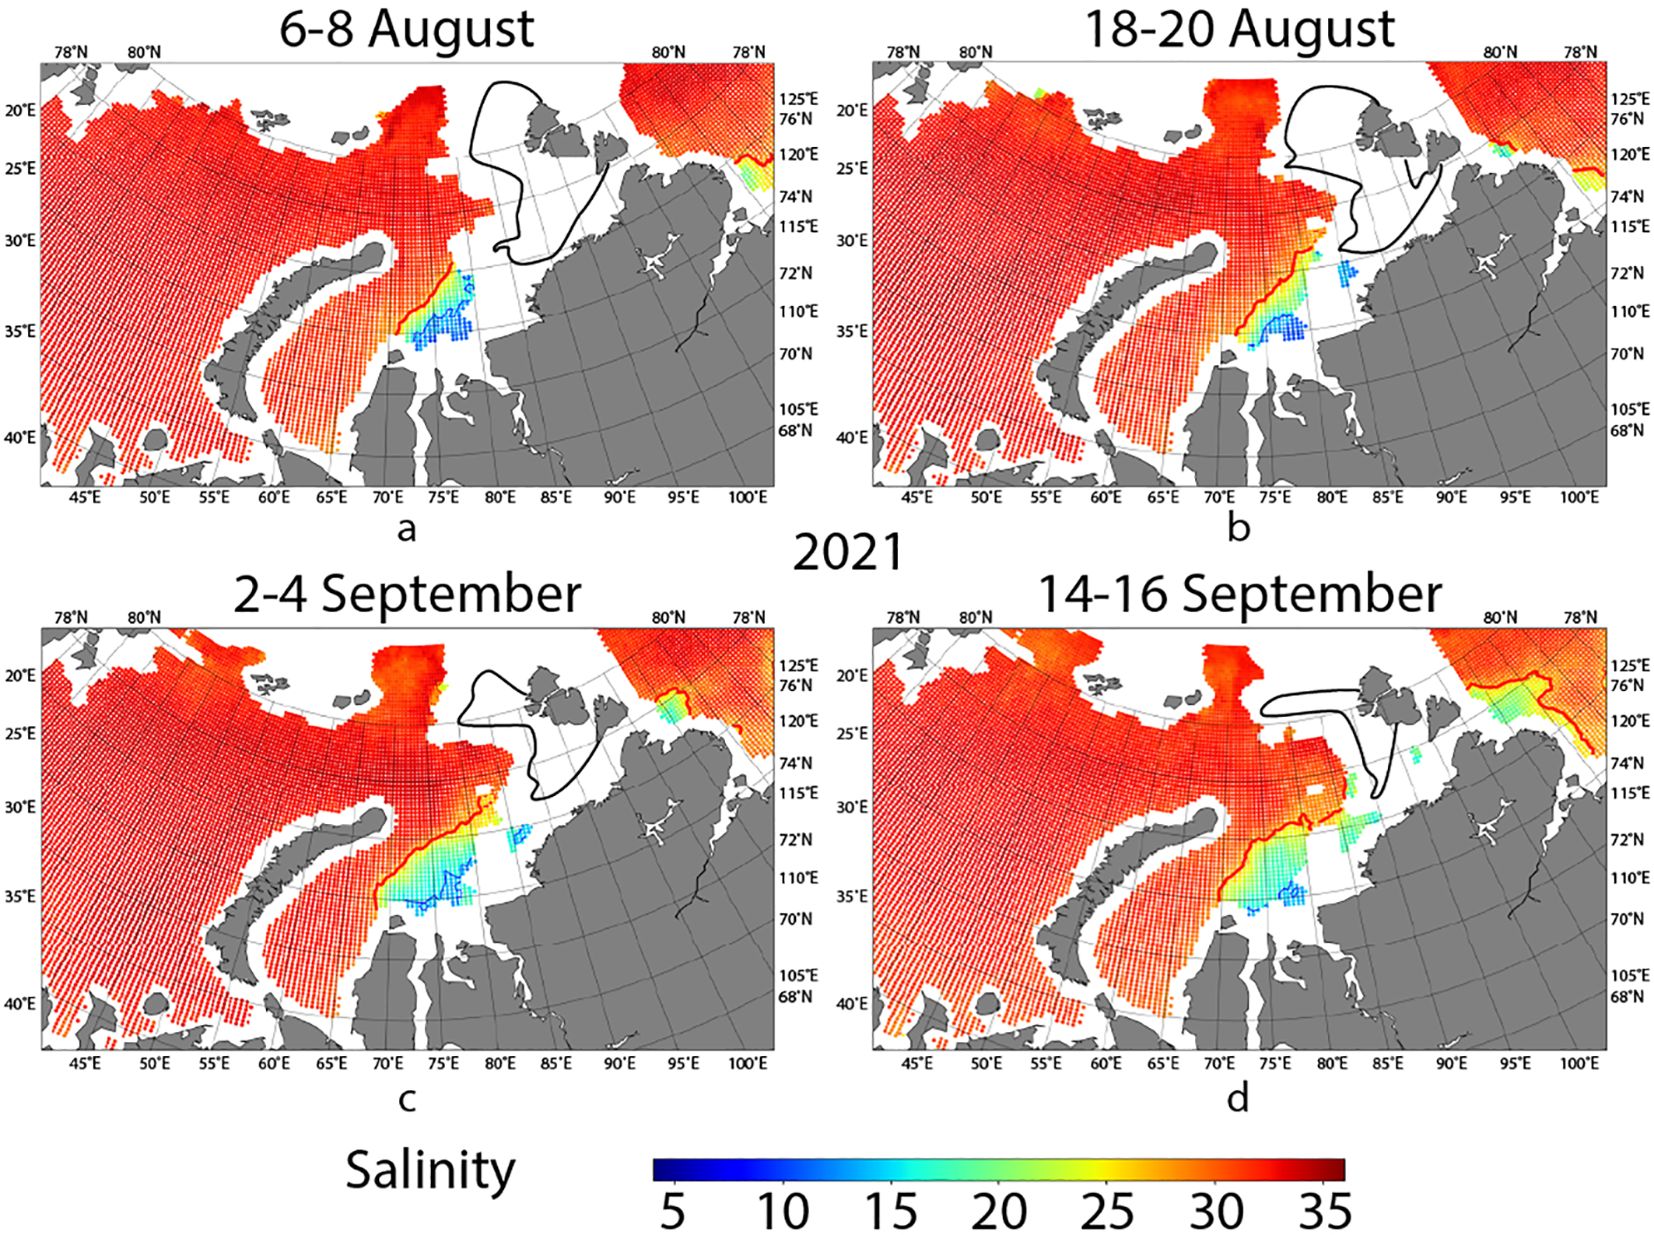
Figure 6. Eastward spreading type of the Ob–Yenisei plume in the Kara Sea and its advection into the Laptev Sea on 6–8 August (a), 18–20 August (b), 2–4 September (c), and 14–16 September (d) 2021. Blue and red isolines correspond to the 15 and 27 psu values, respectively. The black lines schematically demostrate location of the ice edge.
In 2016, intense ice melting in the Kara Sea started in early June in the southwestern part of the sea. The central part of the Kara Sea became ice-free only in July. By mid-July, the northern boundary of the Ob–Yenisei plume reached 75.5° N and remained at this latitude until mid-August. During that year, the Ob–Yenisei plume exhibit predominantly eastward spreading, therefore, it was difficult to determine location of its eastern boundary. However, it is estimated to be between 88° and 90° E. In late July, the area of the plume was estimated at 150 thousand km2. This moderate extent is attributed to nearly zero wind speed in July (in the 73° − 76° N, 70° − 88° E region) and the late ice clean-up of the central part of the Kara Sea.
In August 2016, the plume spreading type changed dramatically. While the average monthly southerly wind speed was 1.2 m/s in July, it increased to 5.1 m/s and changed to westerly in August. This change pressed the plume to the southern shore of the Kara Sea, shifting the northern boundary at 80° E down to 74.5° N, reducing its area to 75 thousand km2. In the end of August, the plume remained only in the estuarine region of the Ob and Yenisei rivers, its area decreased to 50 thousand km2. However, eastward advection of the Ob–Yenisei plume also continued and by mid-September it reached the Laptev Sea. The weakening of the zonal wind component, which pressed the plume to the coast of the Taymyr Peninsula in August, resulted in northward spreading of the plume from the estuarine region up to 74.5° N. Its area increased to 100 thousand km2 by mid-September.
The eastward spreading type of the Ob–Yenisei plume shows good agreement between river plume area visible at SSS data and elevated sea level visible at satellite altimetry data. A comparison of altimetry and in situ salinity measurements for the Kara Sea is discussed in detail in (Frey and Osadchiev, 2021). The authors conclude that plume detection using altimetry data is trustworthy only during periods of weak winds (less than 6 m/s). This approach is applicable for July 2016, when the Ob–Yenisei plume was pressed to the southern coast of the Kara Sea. During strong wind events (e.g., in August 2016), wind conditions near the southern shore of the Kara Sea and near Novaya Zemlya create a sea level rise that is not related to the Ob–Yenisei plume. Nevertheless, during eastward spreading type, the plume is pressed by wind to the southern shore of the Kara Sea. In this case, the southern and eastern parts of the Kara Sea experience sea level rise from wind set-up, so the plume boundary determined by salinity coincides with the area of increased sea level.
3.1.4 Summary of spreading types of the Ob–Yenisei plume
To summarize the information given above, there are two main spreading types of Ob–Yenisei plume in the Kara Sea. The first type is the northwestern type, when the plume reaches Novaya Zemlya and, flowing around its northern part, could spread further northward. In this case, the northern boundary of the plume reaches 77° −78° N with the western boundary at about 63° −65°E. Notably, within one summer–autumn season, advection of the plume may first occur westward and later northward, as occurred in 2023. The reverse situation is also possible, change from northern to western spreading was observed in 2017. The second type is the eastern spreading type, which occurs when the Ob–Yenisei plume is pressed to the Taymyr Peninsula coast and propagates eastward along the southern shore of the Kara Sea. This spreading type often features an interaction with melting sea ice in the eastern part of the Kara Sea and an advection of the plume into the Laptev Sea through the Vilkitskiy Strait.
In most cases, only one of the two spreading types of the Ob–Yenisei plume is realized in an individual year. The type is set at the beginning of the ice-free season and is likely related to the ice melting pattern in the central part of the Kara Sea. The exceptions are 2022 and 2024. In 2022, the northwestern spreading type was observed in July, but by late October the plume also reached the eastern part of the Kara Sea. Unfortunately, in August–September 2022 (which is the most indicative period for plume spreading) the satellite radiometer failed making it impossible to reliably determine the plume spreading pattern. In 2024, the opposite situation was observed. In July, the Ob–Yenisei plume occupied the eastern part of the Kara Sea, but it was not detected in the Laptev Sea. Instead, in August and September it extended to the western and northern parts of the Kara Sea forming a joint FLS with meltwater in these areas. Nevertheless, in 8 out of 10 years considered, the spreading type of the Ob-Yenisei plume remained the same during the entire warm season from ice clean-up in July till start of ice formation in October.
3.2 The Lena plume in the Eastern Arctic
Based on new surface salinity data, the average spreading area of the Lena River plume in the Laptev Sea and East Siberian Sea during 2015–2024 was calculated (Figure 7). The seasonal variability of the Lena plume extent in the Laptev Sea (the blue isoline in Figure 7) demonstrates northward shift of its mean northern boundary from 75° N in July (Figure 7a), to 76° N in August (Figure 7b), and 77° N in September–October (Figures 7c,d). The western part of the Lena plume often merges with the plumes of the Khatanga and Olenyok rivers, forming a joint FSL in the southwestern part of the Laptev Sea. In October, the Khatanga plume becomes significantly smaller, saline seawater area forms between it and the Lena plume, and the western boundary of the Lena plume is registered near 125° E. Median position of the Lena plume (that is almost the same as the mean plume position in the Eastern Arctic) in the East Siberian Sea is much more stable. The eastern plume boundary is located at 160° E, and shows little change from July to October. The possible spreading types of Lena plume in individual years, which correspond to 30% occurrence frequency (the red isoline), are consistent with previous studies. These studies identified two main types of Lena plume spreading, namely, the northern type and the eastern type. In the Laptev Sea, the difference between the 30% and 50% occurrence frequency lines is much smaller than that in the East Siberian Sea, especially in September and October.
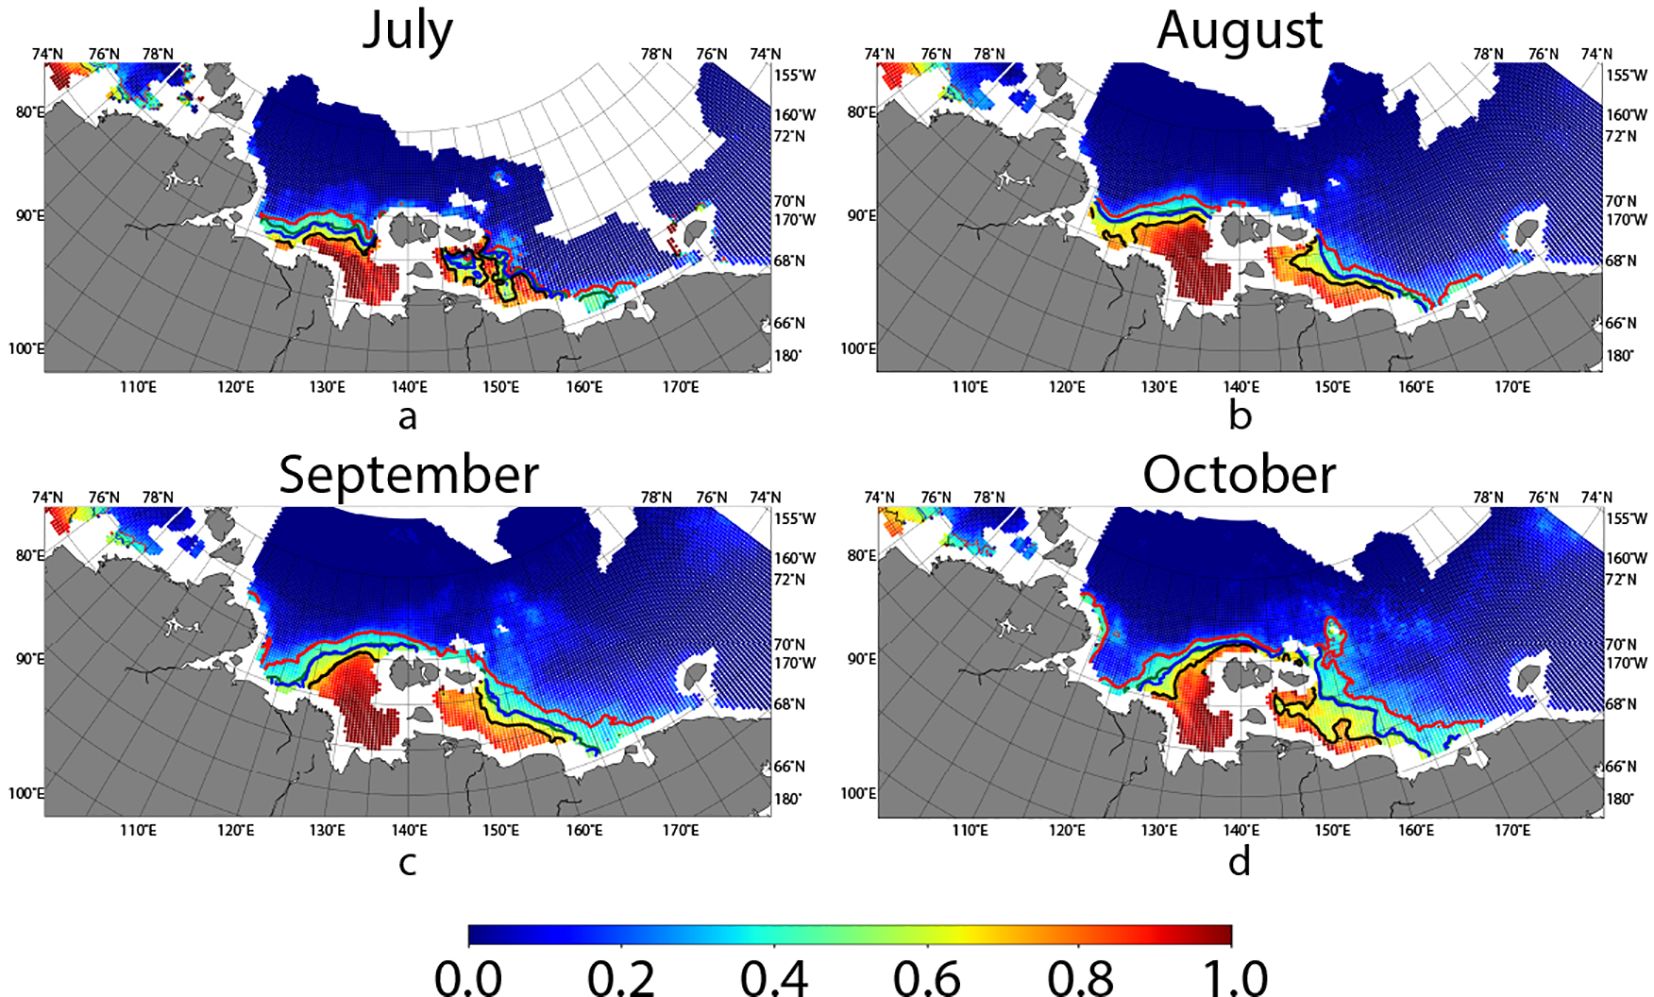
Figure 7. Probability of the Lena plume occurrence in the Eastern Arctic in July (a), August (b), September (c) and October (d) based on SSS data from 2015 to 2024. The red, blue, and black isolines correspond to values 0.3, 0.5, and 0.7, respectively. The green isoline shows 10 years mean Lena plume border determined by averaged position of the isohaline of 25 psu.
Figure 8 presents the most typical positions of the Lena plume in the Laptev and East Siberian seas for each of the years considered in this study. It is important to note that the boundary of the river plume in this region is defined by the 25 psu isohaline (the value chosen for the Kara Sea was 27 psu). This is due to the fact that the background surface salinity (i.e., outside the influence of river runoff) in the southwestern and northern parts of the Kara Sea is higher, as these areas are subject to significant inflow of saline Barents Sea waters. In contrast, the seas of the Eastern Arctic are covered by sea ice for the majority of the year. Prolonged summer–autumn ice melting forms a lower surface salinity layer outside the areas influenced by river runoff. It results in a lower threshold value (25 psu) to define the boundaries of the Lena plume.
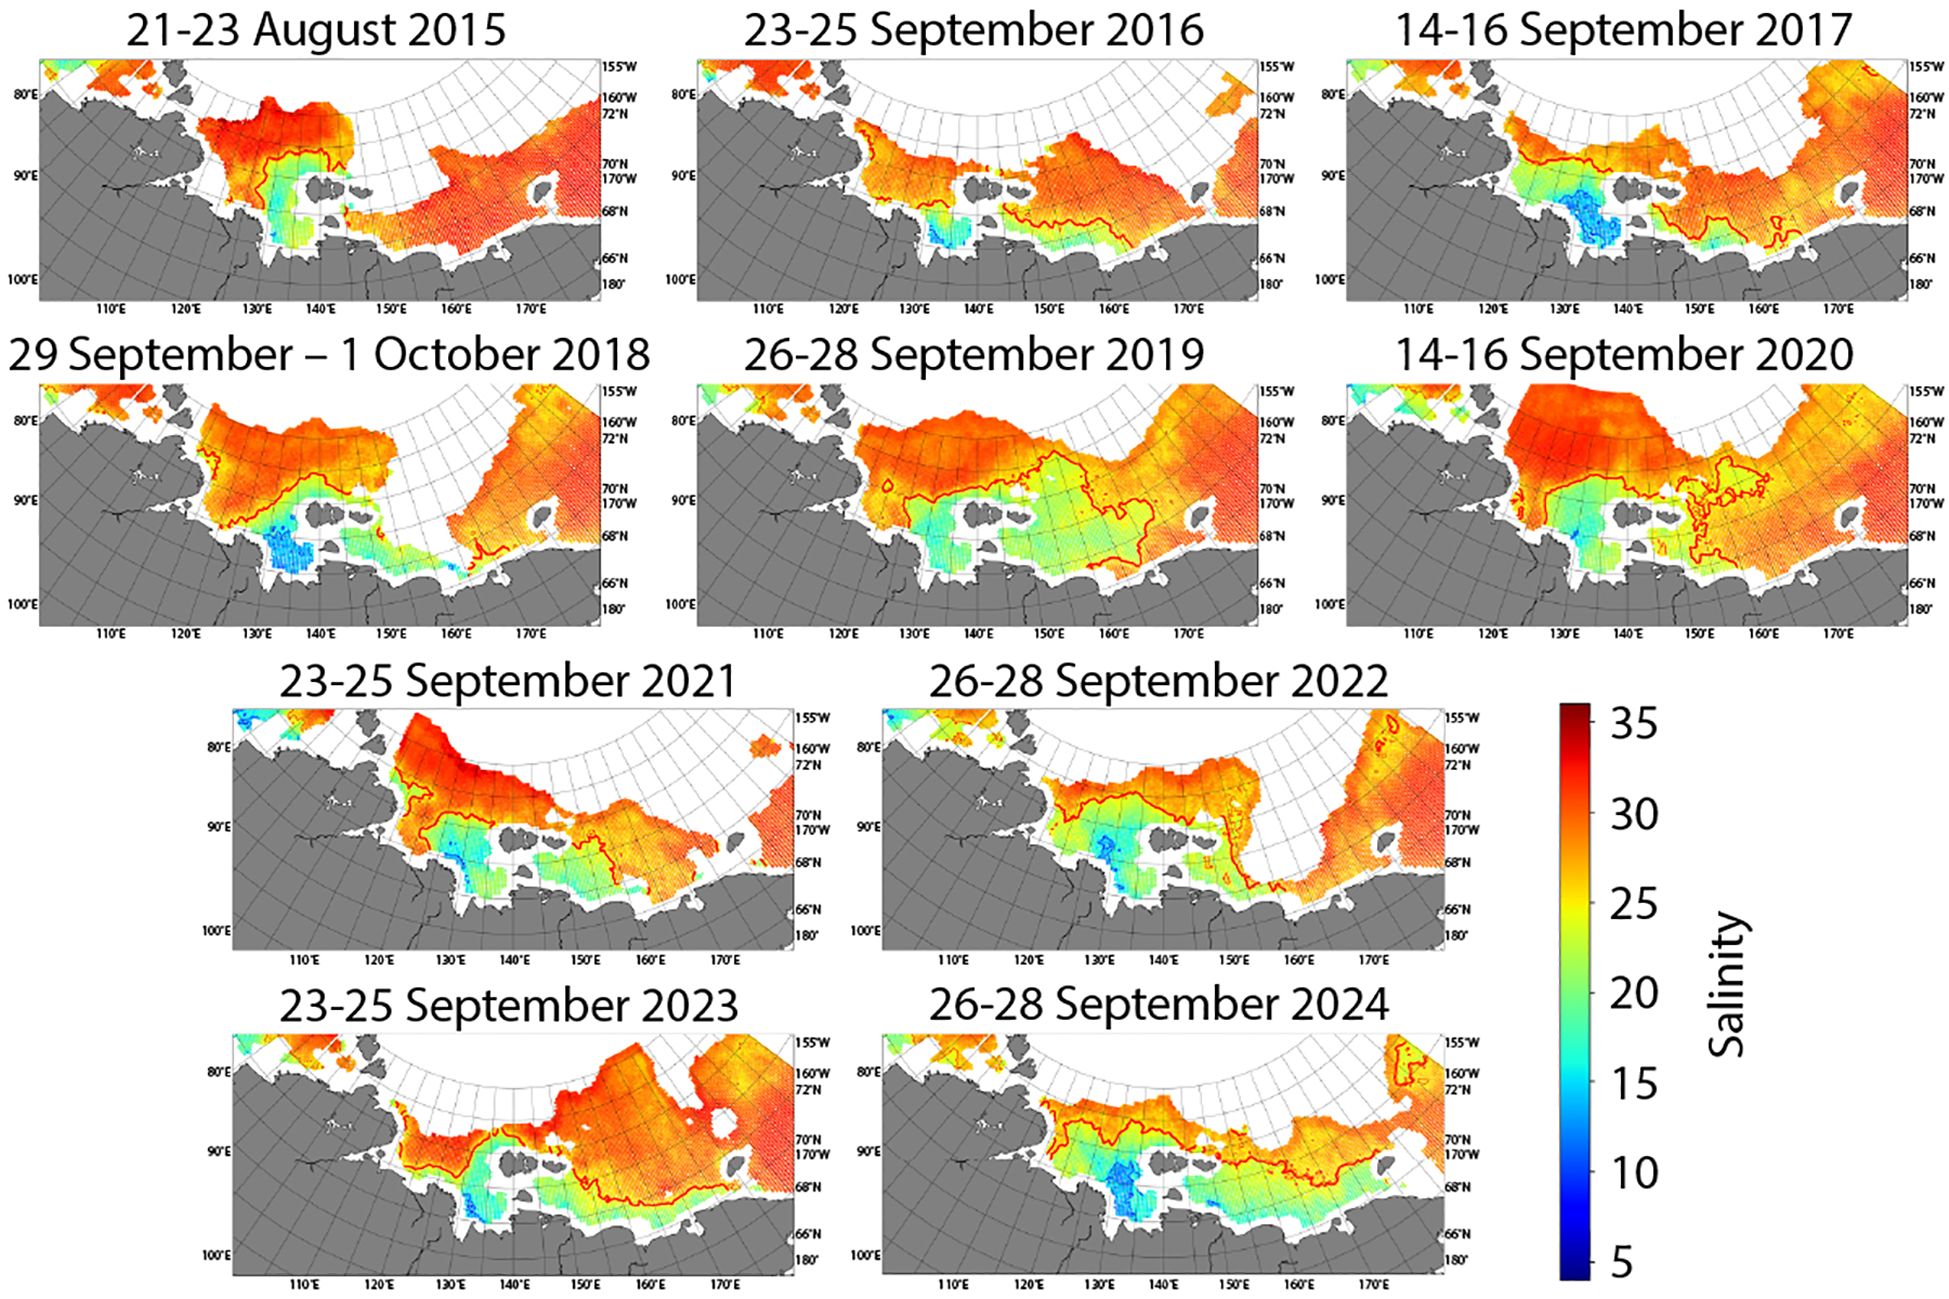
Figure 8. Surface salinity in the Eastern Arctic during indicative three-day periods in August–September demonstrating spreading type of the Lena plume for each individual year in 2015–2024. Blue and red isolines correspond to the 15 and 25 psu values, respectively.
Based on the distributions of surface salinity in the Eastern Arctic in August–September, as shown in Figure 8, the most typical Lena plume spreading types during the ice-free season from 2015 to 2024 could be identified. In 2016, 2018, 2019, 2021, 2023, and 2024, a distinctly pronounced eastward spreading of the Lena plume was observed. In contrast, in 2015, 2017, 2020, and 2022, advection of the Lena plume to the East Siberian Sea was significantly weaker. At the same time, spreading of the Lena plume in the Laptev Sea demonstrated very little interannual variability, except for 2016, which is discussed in more detail below. Therefore, the greatest variability in position of the Lena plume in the Eastern Arctic is associated with its eastward advection to the East Siberian Sea, rather than with its northward extension from the Lena Delta in the Laptev Sea. Typical examples of different spreading types of the Lena plume during ice-free season are considered below.
3.2.1 Spreading of the Lena plume in the Laptev Sea
The Lena plume in the Laptev Sea almost always is spreading northward, regardless of its advection to the east. In all years (except for 2016), the northern boundary of the plume reached 76°–77° N and was occasionally even farther north, beyond 78° N. By September–October, the Lena plume occupied the area northward of the New Siberian Islands. The only exception was in 2016 when the Lena plume remained arrested near the southern coast of the Laptev Sea during the entire ice-free season.
The most extensive northward spreading of the Lena plume was observed in 2015 (Figure 9). In that year, intense retreat of sea ice in the central part of the Laptev Sea started in the second half of July. In August, the area of the Laptev Sea near the Lena Delta was completely ice-free, and the Lena plume occupied the entire eastern part of the Laptev Sea. In July, southeasterly winds predominated over this part of the sea (in the region 72°–78° N, 123°–145° E), with a mean monthly wind speed of 3.7 m/s. These wind conditions favored northeastward spreading of the Lena plume in the Laptev Sea. In the beginning of August, its northern boundary reached 76.5° N and its eastern boundary remained in the Laptev Sea (Figure 9a). During August, the Lena plume advanced northward and in early September reached 78°–79° N (Figure 9c). In September, the plume advected to the East Siberian Sea through the Sannikov Strait and northward of the New Siberian Islands. Its northeastern boundary reached the ice edge and it was not possible to identify a distinct boundary between the plume and the meltwater region by both salinity and temperature satellite data.
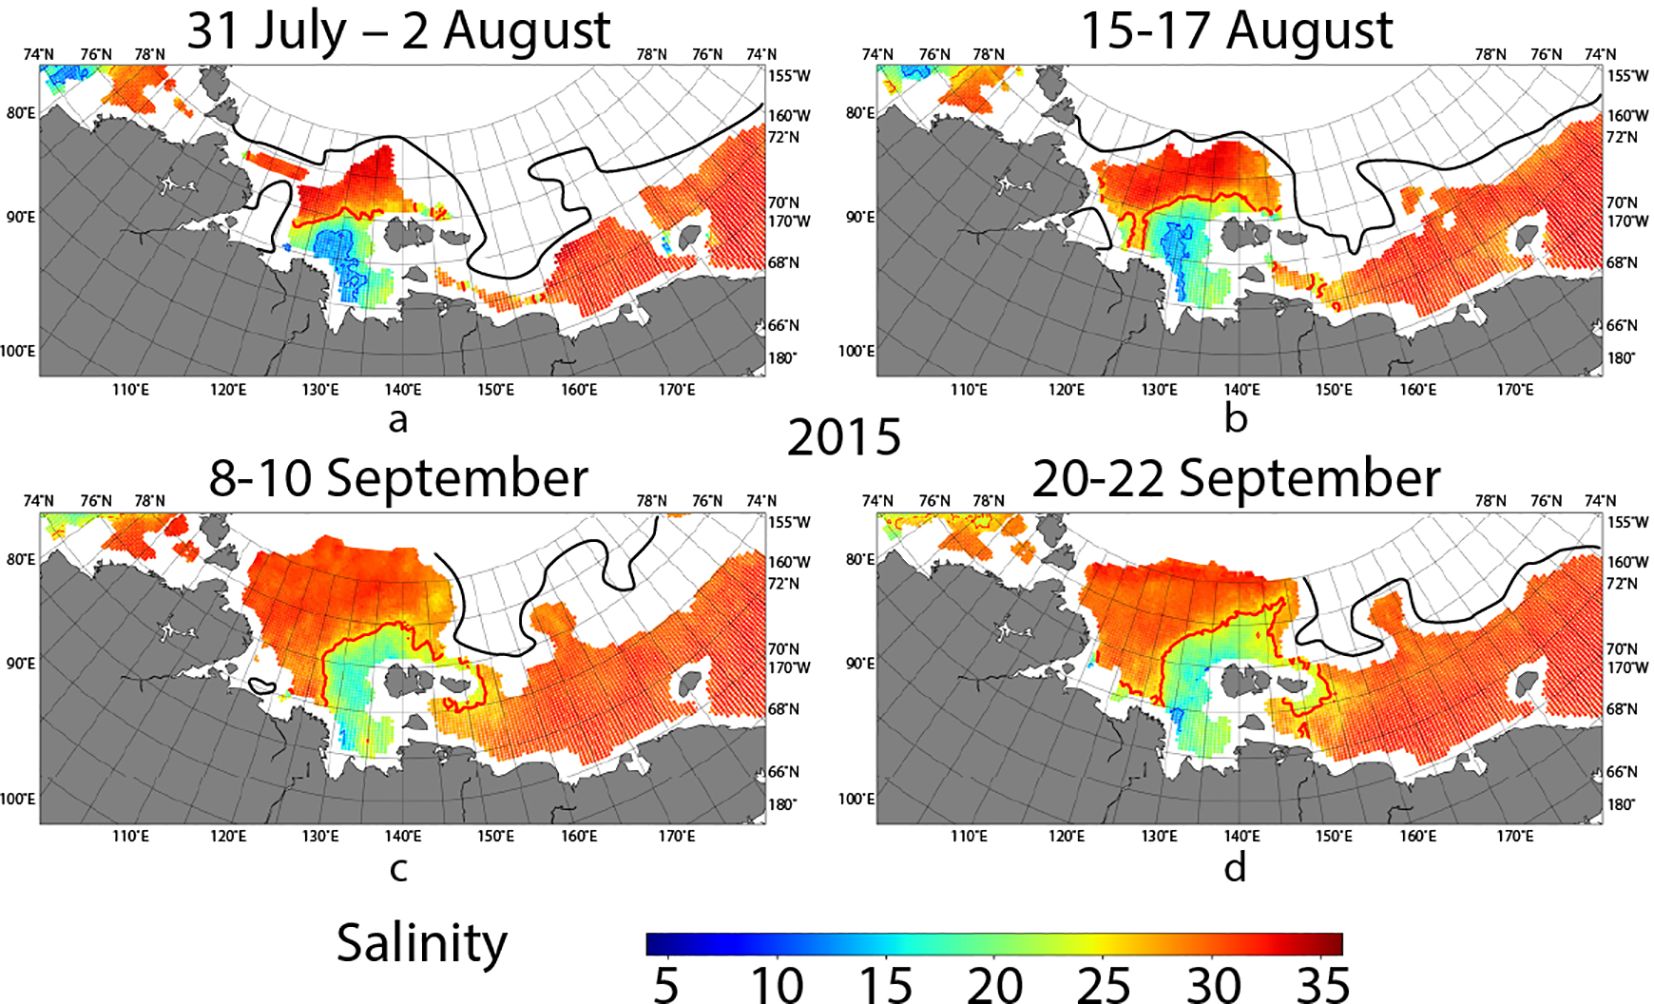
Figure 9. Western spreading type of the Lena plume in the Eastern Arctic on 31 July – 2 August (a), 15–17 August (b), 8–10 September (c), and 20–22 September (d) 2015. The blue and red isolines correspond to the 15 and 25 psu values, respectively. The black lines schematically demostrate location of the ice edge.
In the western part of the Laptev Sea, the Lena plume could merge with the Khatanga and Olenyok plumes. Usually, all three plumes could be distinguished by areas of decreased salinity in their river mouth areas, especially at the beginning of the ice-free season. In most cases, the Lena plume does not extend westward of 120°–125° E in July and August. At the end of ice-free season, the Lena, Khatanga, and Olenyok plumes could form a joint FSL in the western part of the Laptev Sea. FSL could either be pressed to the coast (as in 2016, 2018, and 2023) or occupy the majority of the western part of the Laptev Sea (as in 2017, 2022, and 2024) (Figure 8). The boundary between the Lena and Olenyok plumes becomes more distinct under the influence of northwesterly winds northward of the Lena Delta. Such winds cause upwelling between the Lena and Olenyok plumes, which occurred during several weeks in 2019 and 2021.
3.2.2 Spreading of the Lena plume in the East Siberian Sea
In the East Siberian Sea, the Lena plume forms a joint FSL with the Indigirka plume. In most cases, the Indigirka plume is distinguished in July by the reduced salinity in the river mouth area, but in the end of August it merges with the Lena plume. This joint plume extends eastward up to 155°–160° E. The Kolyma plume could only be identified in certain years (even in its river mouth area) when this region is free of ice.
Spreading of the Lena plume in 2016 differs greatly from all other years and requires separate consideration (Figure 10 top). In that year, sea ice in the central part of the Laptev Sea northward of the Lena Delta did not melt until mid-September. In addition, during July and August, westerly winds with speeds of 2.5 m/s prevailed in this region (72°–75° N, 128°–140° E). Such strong and stable wind forcing blocked the usual northward advection of the Lena plume, but contributed to its eastward advection to the East Siberian Sea till 167° E. In September, sea ice in the central part of the Laptev Sea melted, wind weakened to 1.5 m/s and shifted to northwesterly direction. The northern boundary of the plume in the Laptev Sea reached only 75° N.
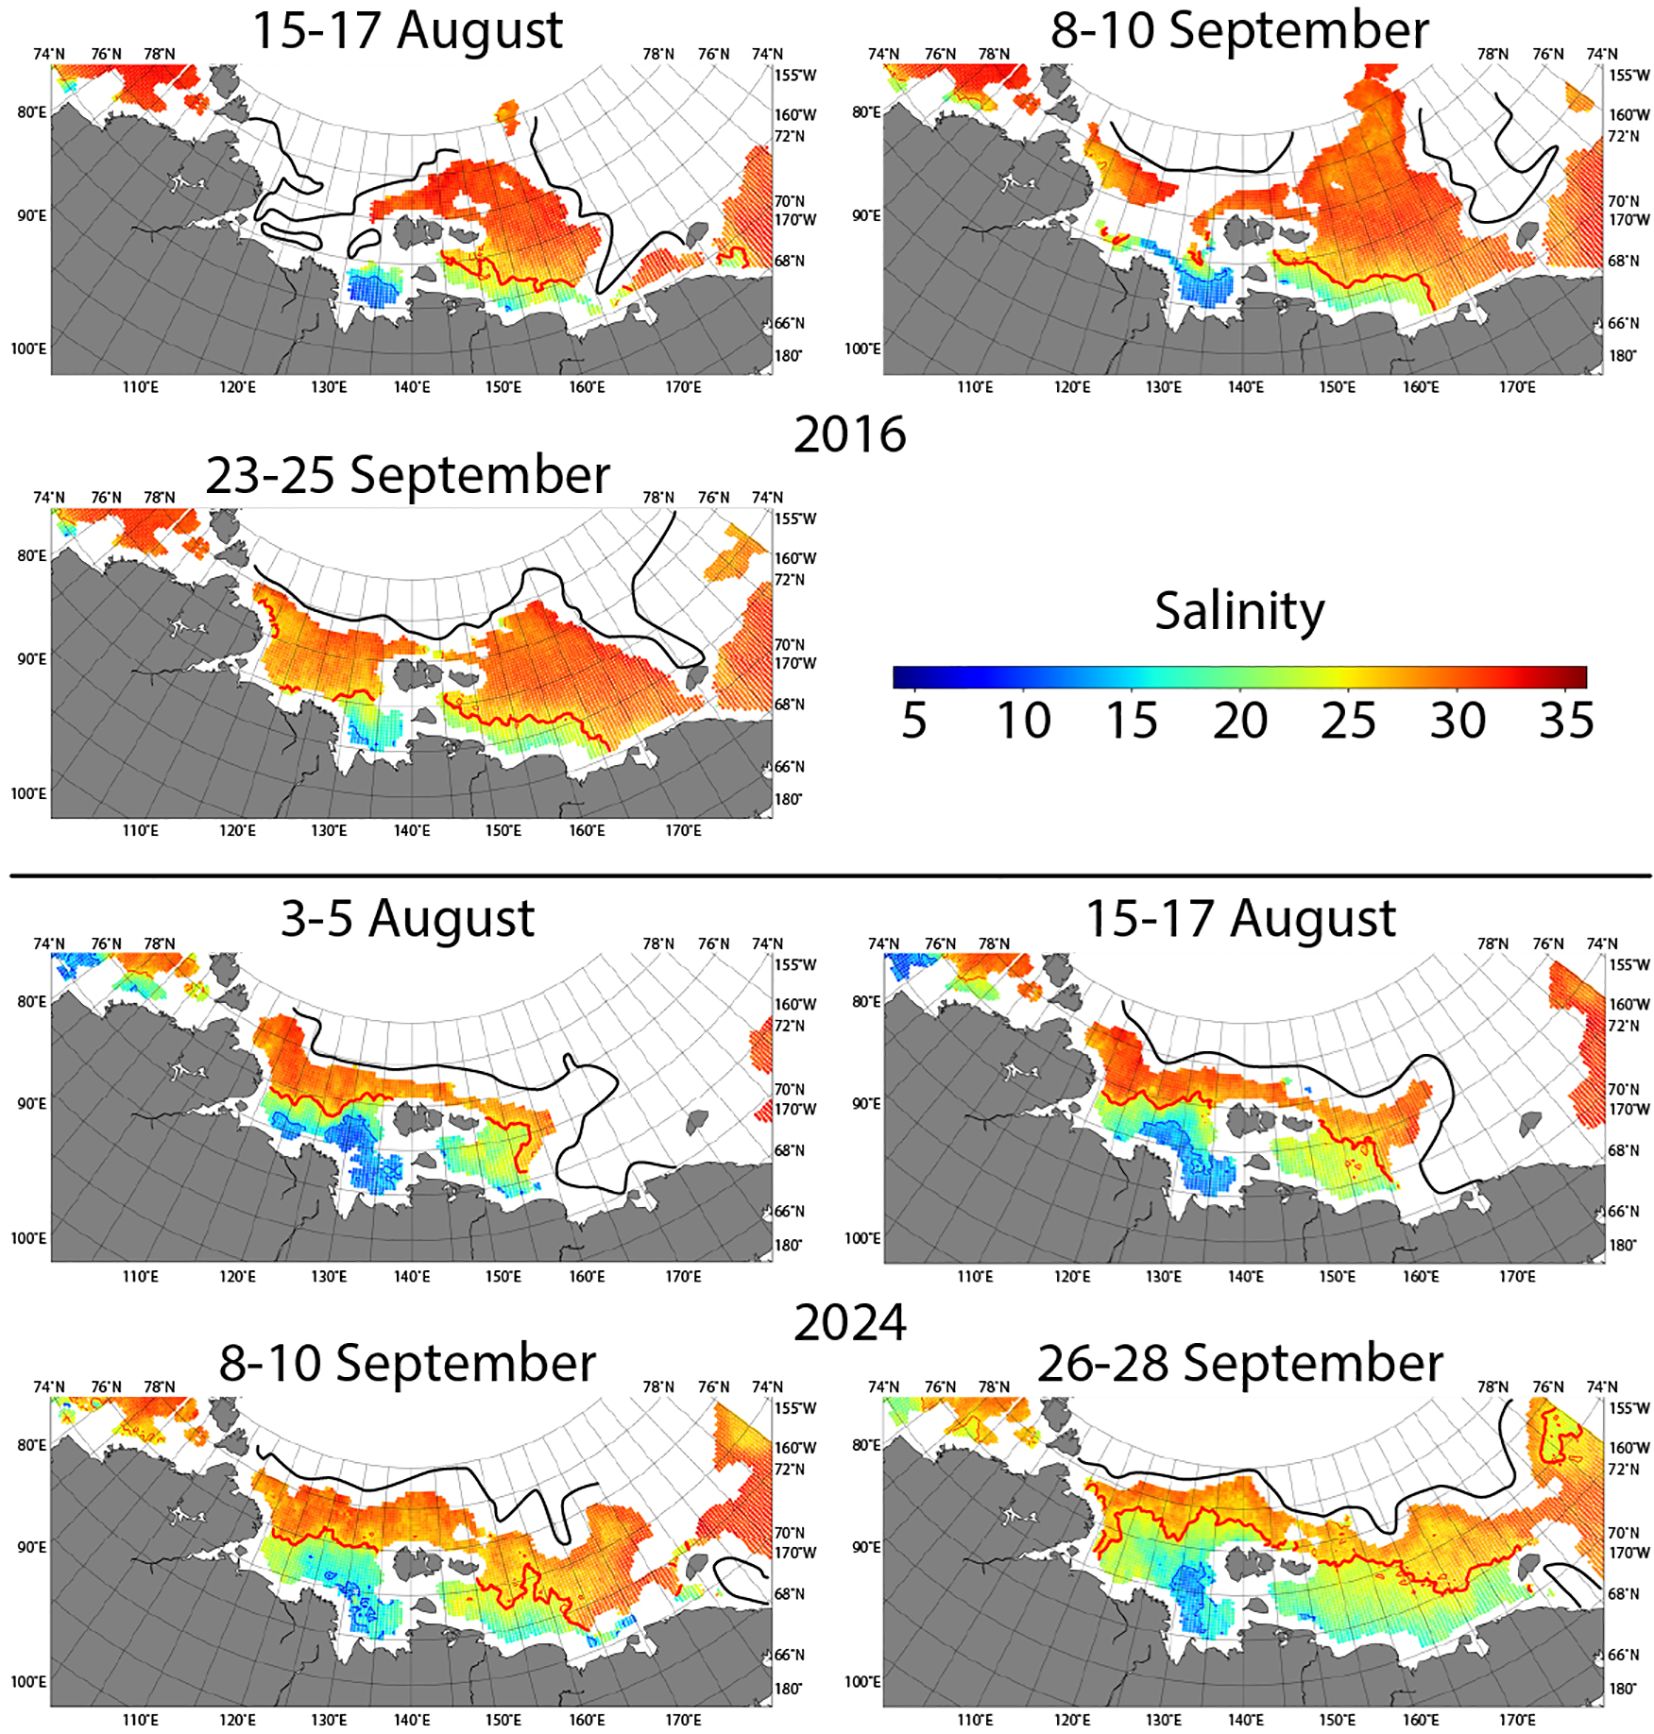
Figure 10. Eastern spreading of the Lena plume in the Eastern Arctic in 2016 (top) and central spreading of the Lena plume in the Eastern Arctic in 2024 (bottom). The blue and red isolines correspond to the 15 and 25 psu values, respectively. The black lines schematically demostrate location of the ice edge.
Separate consideration is also required for spreading of the Lena plume in the East Siberian Sea in 2019 and 2024. In these years, the eastern boundary of the plume reached Wrangel Island located near 180° E (Figure 10 bottom). In both years, unlike 2016, the Lena plume also was spreading far northward in the East Siberian Sea. In 2019, an anomalously distant spreading of the Lena plume to the northeast in the northern part of the East Siberian Sea was observed. Apparently, this process was facilitated by early ice clean-up of the East Siberian Sea. The area of the Lena plume in 2019 and 2024 reached 700–800 km2.
In September and October 2019 and 2020, advection of the northern part of the Lena plume in the East Siberian Sea was also observed in the direction of the Beaufort Sea (Figure 8). Similar situation may occurred in 2018, 2021, and 2024, but the position of the northern boundary of the Lena plume could not be determined due to presence of ice in the northeastern part of the East Siberian Sea. The question if the Lena plume is trapped by the Beaufort Gyre at least during certain years remains poorly studied and requires further investigation (Jeon et al., 2025). Nevertheless, the observed advection of the Lena plume in the East Siberian Sea toward the Beaufort Sea in 2019 and 2020 confirms the possibility of this process.
3.2.3 Summary of spreading types of the Lena plume
In summary, it could be concluded that there is no distinct northern spreading type of the Lena plume in the Laptev Sea. The plume almost always expands to 77°–78° N. Only during one of the ten considered years, its boundary expanded farther northward (78°–79° N in 2015), and during another year it was located much southern (75° N in 2016). Significant interannual variability of the Lena plume is observed in the East Siberian Sea, specifically in the distance of its eastward and northeastward advection. Among the considered years, the eastern spreading type of the Lena plume in the East Siberian Sea, i.e., eastward spreading along the Siberian coast, was observed in 2016, 2018, 2021, and 2023 (Figure 8). The western spreading type, when the Lena plume did not expand further than the western part of the East Siberian Sea, was observed in 2015, 2017, 2020, and 2022. The central spreading type, when the Lena plume occupied almost the entire area of the East Siberian Sea, was observed in 2019 and 2024.
3.3 The Ob–Yenisei and Lena plumes in SST data
The Ob–Yenisei plume in the Kara Sea often could be well distinguished in satellite SST data, because river plume waters in July and August are warmer than marine waters. Typically, from mid-June to mid-July (depending on the dates of ice melting), the Ob–Yenisei plume temperature is about 5–6 °C due to mixing with meltwater (Figure 11a). After the end of the ice melting period, the plume warms up to 10–13 °C in late July or early August (Figure 11b). During this period, the boundary of the plume is clearly visible in SST data.
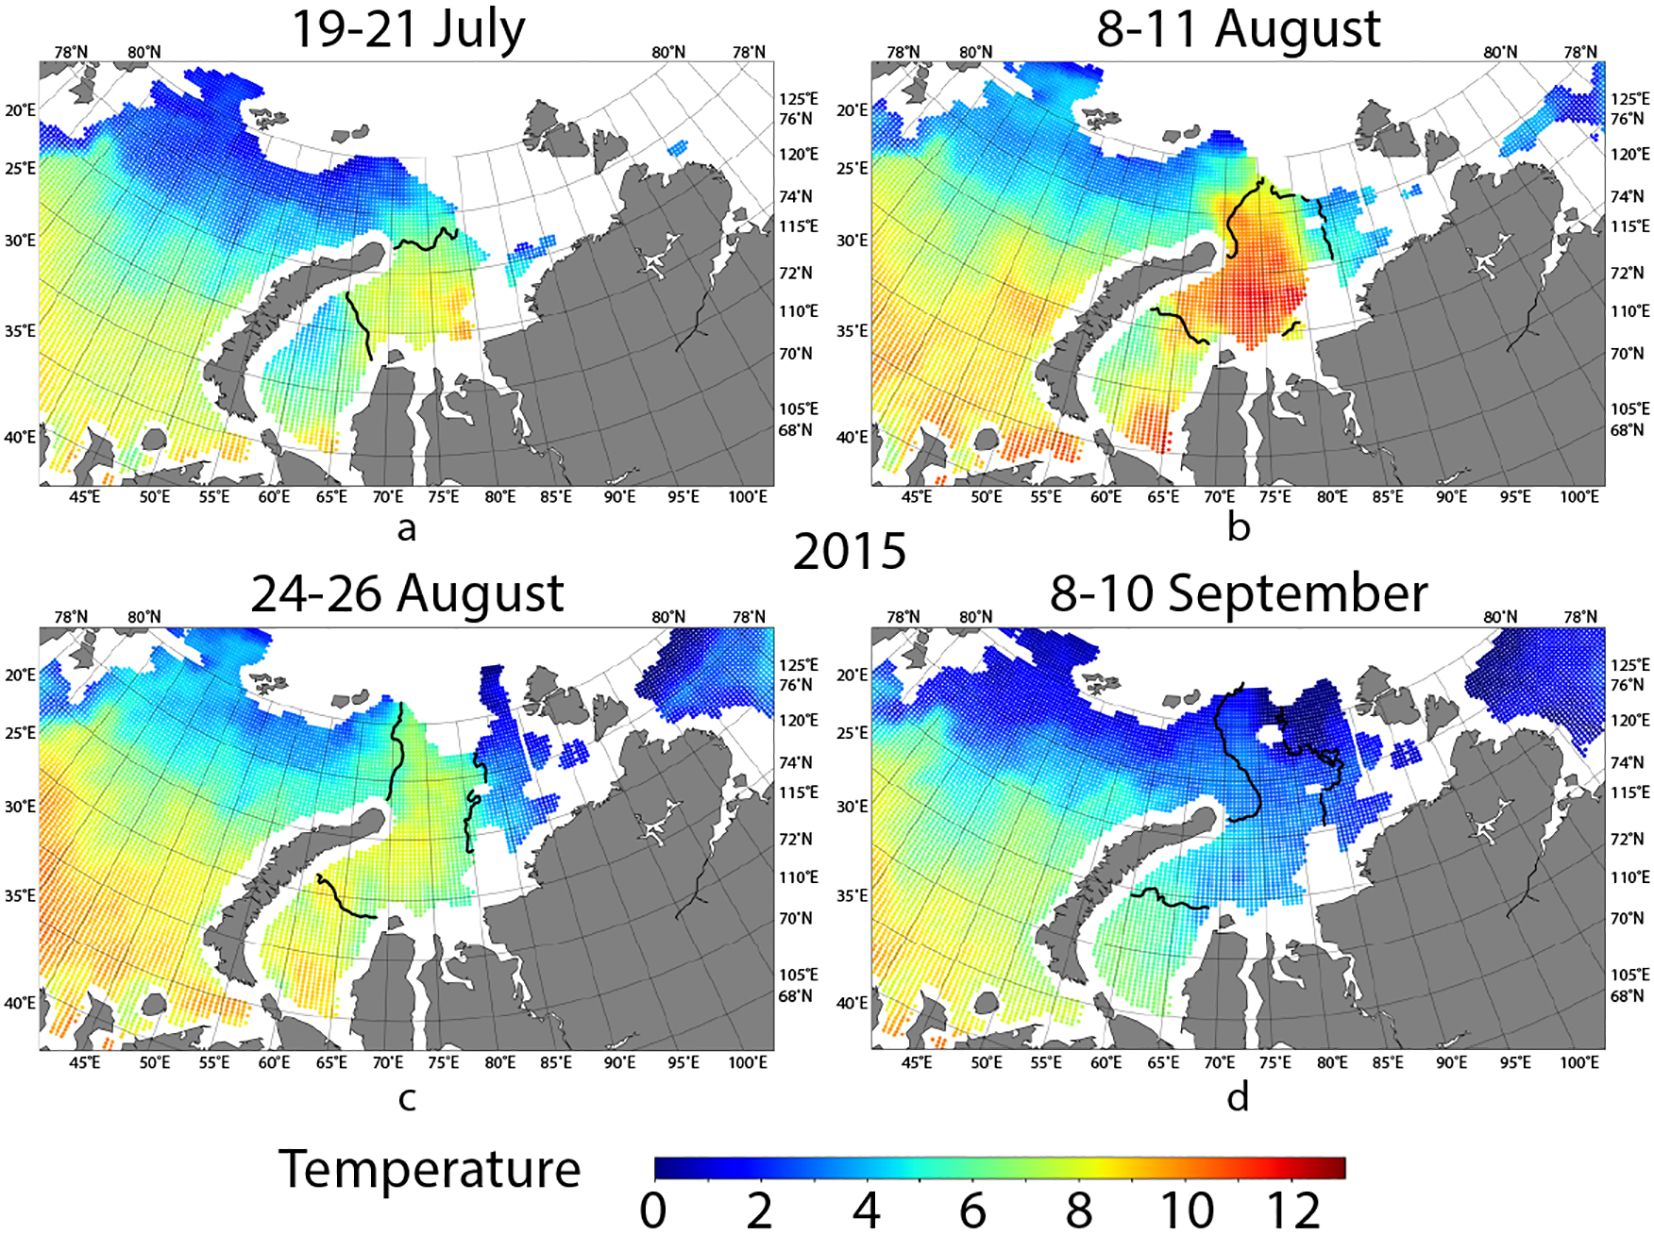
Figure 11. SST in the Kara Sea on July 19–21 (a), August 8–11 (b), August 24–26 (c), and September 8–10 (d) 2015. Black lines show the boundaries of the Ob–Yenisei plume according to SSS data (Figure 4).
Nevertheless, it is not possible to reliably identify the Ob–Yenisei plume boundary in the Kara Sea based only on SST data. This is due to the general cooling of the surface layer during the ice-free season. Usually, cooling occurs in August, when plume temperature drops from peak values of about 10–13°C (reached in July) back to 6–8°C (Figure 11c). Simultaneously, the southwestern part of the Kara Sea experiences general warming, making the temperature outside the plume similar to that within the plume. As a result, in August, the western boundary of the plume could not be detected by SST. At the same time, the northern and eastern boundaries of the Ob–Yenisei plume in August remain detectable by SST and, in general, coincide with the boundaries determined by SSS (Figure 4). Satellite temperature data in July and August also is helpful to distinguish the Ob–Yenisei plume from low-saline areas formed by meltwater. In September–October, general cooling of sea surface layer occurs and all plume boundaries become undetectable by SST (Figure 11d).
The boundaries of the Lena plume in the Eastern Arctic are much less clear in SST data as compared to the Ob–Yenisei plume. Increased SST (up to 10–12 °C) is observed within the Lena plume near the Lena Delta in areas of the lowest salinity (Figure 12). However, the boundaries of the Lena plume as defined by SST and SSS generally do not coincide. The northern part of the Lena plume in the Laptev Sea is usually indistinguishable from the surrounding seawater by SST data.
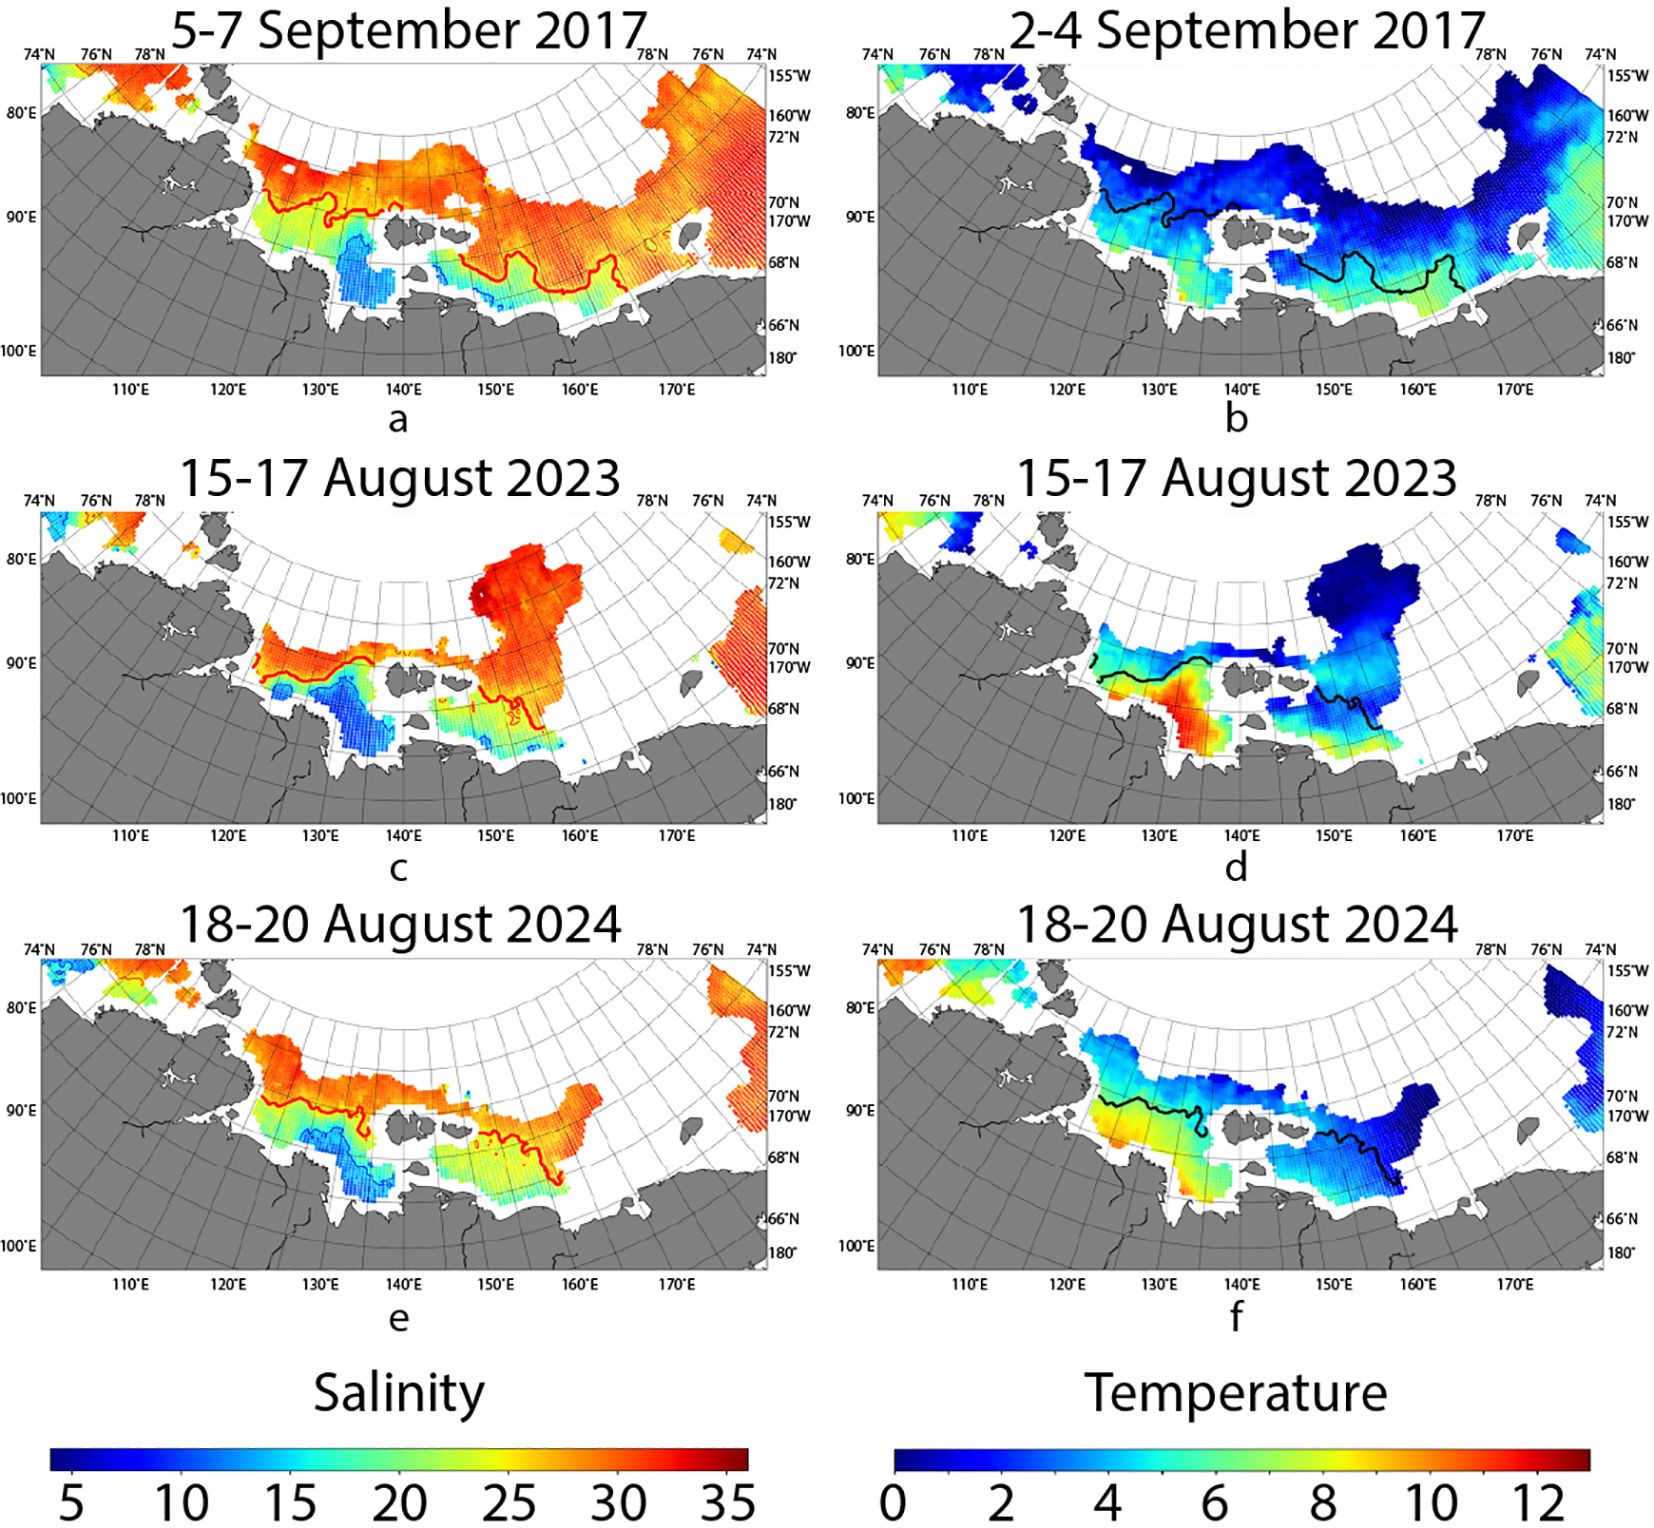
Figure 12. SSS (left) and SST (right) in the Laptev and East Siberian seas on 5–7 September 2017 (a, b), 15–17 August 2023 (c, d), and 18–20 August 2024 (e, f). The blue and red isolines on SSS panels correspond to the 15 and 25 psu values, respectively. Black lines show the boundaries of the Lena plume according to SSS data.
A rare case when the Lena plume boundary could be reliably identified by SST (only within the Laptev Sea) was observed in August 2023 (Figures 12c, d). In certain years, SST in August is useful to separate the Lena and Olenyok plumes. For example, in August 2023, inner parts of the both plumes are distinctly visible not only comparing to cold seawater (with temperatures as low as 4°C), but also comparing to the outer parts of FSL (8°C), as the temperature in both plumes near their deltas exceeded 10°C. Similar situation was registered in August 2024, when the Lena and Olenyok plumes were distinctly visible in SST, while they merged and became nearly indistinguishable in SSS (Figures 12e, f).
In some years, SST data for July and August also could be applied to identify the Indigirka and Kolyma plumes. In particular, they are well distinguishable in 2017. In that year, the Lena plume almost did not expand to the East Siberian Sea, so reduced salinities near the mouths of the Indigirka and Kolyma rivers were associated primarily with their river plumes. In early August 2017, the Indigirka and Kolyma plumes (with temperatures of 8–9°C) contrasted sharply with the cold surrounding waters, which still remained low temperatures of meltwater (Figures 12a, b). In early September, the Indigirka and Kolyma plumes were spreading far northward to 74° N and 73° N, respectively. Increased surface temperatures were observed near the Siberian coast within these plumes, but their boundaries in salinity and temperature data did not coincide. SST in the western part of the East Siberian Sea near the New Siberian Islands, where the Lena plume was present, was notably lower (2–4°C) than that outside the river plumes. This is likely due to intense mixing of the Lena plume while passing through the shallow Sannikov and Laptev Straits. Depths in these straits are less than 20 m, so the Lena plume occupies the entire water column and interacts with seafloor as it advects through the straits. Such low Lena plume temperatures in the East Siberian Sea, compared to its values in the Laptev Sea, are typical for all considered years.
In conclusion, identification of the Ob–Yenisei plume by SST data in the Kara Sea is sufficiently reliable at the beginning of the ice-free season (July and early August). Later in August, the western plume boundary disappears in SST data due to warming of the southwestern part of the Kara Sea. The eastern boundary of the Ob–Yenisei plume remains distinguishable for longer period, and disappears only in September as a result of general sea surface cooling. In the Eastern Arctic, in specific cases, SST is useful to distinguish the Khatanga, Olenyok, Indigirka, and Kolyma plumes when they merge with the Lena plume. However, SST could not be considered as a reliable source of information about the Lena plume boundary, especially in the East Siberian Sea.
4 Discussion
4.1 River plume areas and river discharge volumes
Based on sea surface salinity data, it became possible to estimate the typical spreading area of the Ob–Yenisei plume for each year considered in this study. Together with the plume area, the total river discharge from the Gulf of Ob and the Yenisei River during the freshet period (from early May to late August which is 60% of the total annual discharge) is considered according to ArcticGRO data.
The discharge patterns of the Ob and Yenisei rivers have different seasonal cycles. The Yenisei freshet peak occurs in May–July, after which the water discharge abruptly drops. The Ob River has two discharge peaks at the end of May and in August–September. Nevertheless, the second discharge peak does not contribute to the plume area. Current velocity estimates in the Gulf of Ob show that it takes 1–1.5 months for river discharge to get from Salekhard, where the hydrological station is located, to the Kara Sea. It means that discharge registered in August in Salekhard would reach the Kara Sea only in late September (Osadchiev et al., 2017, Osadchiev et al., 2020c). By that time, the distinct structure of the Ob–Yenisei plume is no longer observed according to satellite salinity data. Thus, the area of the Ob–Yenisei plume is calculated for an earlier period.
Figure 13a presents the dependence of the typical area of the Ob–Yenisei plume on river discharge volume during the freshet period. Years with the eastern spreading type are highlighted in red. For these years, a linear dependence of the plume area on discharge volume is observed. This is caused by the relatively minor variability in plume shape as it spreads eastward along the coast of the Taymyr Peninsula.
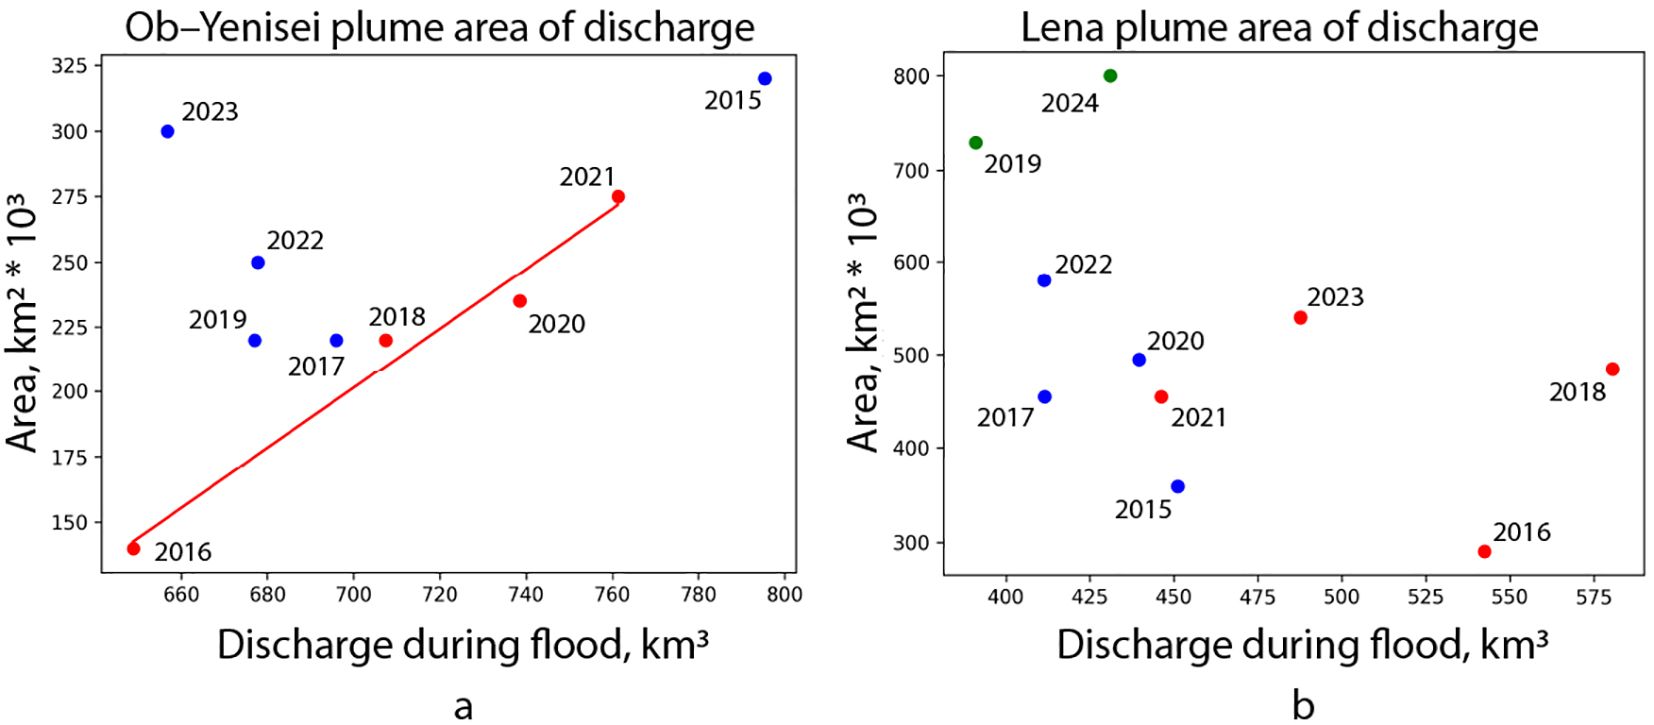
Figure 13. Dependence of area of the Ob–Yenisei plume (a) and the Lena plume (b) on river discharge volume. In panel (a) red dots indicate years with the eastern spreading type, blue dots indicate years with the northwestern spreading type. In panel (b) red dots indicate years with the eastern spreading type, blue dots indicate years with the western spreading type, green dots indicate years with the central spreading type.
No such dependence is observed in years with northwestern spreading types (blue dots in Figure 13a). During these years, the plume spreading is influenced not only by wind, but also by surface currents in the northern Kara Sea and changing of the plume shape during advection along the southern coast of Novaya Zemlya. As a result, the plume area does not show direct dependence on river discharge volume.
Similar dependence of the Lena plume area on river discharge volume was also analyzed (Figure 13b). The volume of Lena discharge significantly exceeds that of the other rivers in the Eastern Arctic. However, discharge from the Indigirka and Kolyma rivers was also included in the considered freshwater volume for years when the Lena plume reached the Indigirka and Kolyma river mouths. The Lena plume area typically ranges between 400–600 thousand km2. The exceptions are 2019 and 2024, when the Lena plume was spreading anomalously far northward and northeastward in the East Siberian Sea and reached an area of 700–800 thousand km2. The minimal area of the Lena plume were observed in 2015 (360 thousand km2), when it was not spreading eastward to the East Siberian Sea, and in 2016 (300 thousand km2), when it did not advect northward in the Laptev Sea.
For the Lena plume in the East Siberian Sea, there is also no linear dependence between discharge volume and plume area for all three spreading types. This probably results from the distribution of freshwater sources over large distances in the East Siberian Sea. In addition to the Lena River, there are other major rivers that contribute to FSL. In particular, the Yana River always forms a plume that merges with the Lena plume in the Laptev Sea. It is also the case of the Kolyma and Indigirka plumes, which often merge with the Lena plume in the East Siberian Sea. While these processes provide a minor contribution to the total freshwater volume as compared to the Lena River discharge, they could affect advection of the Lena plume (Osadchiev et al., 2020b). Furthermore, sea ice melting provides a substantial freshwater source for the Lena plume (up to 25% (Osadchiev et al., 2024)), which also distorts the area–discharge relation. Note that this is not the case for the Ob–Yenisei plume with small contribution of meltwater.
4.2 Wind-driven dynamics of river plumes
Idealized motion of a river plume under wind forcing could be described by the Ekman theory of surface layer dynamics (Ekman, 1905). According to the Equations 1, 2, advection of the plume occurs at certain angle to wind direction (to the right in the Northern Hemisphere). This theory predicts that meridional motion of the northern boundary of the Ob–Yenisei plume is governed by the zonal wind component. Northward movement toward the central Arctic Ocean occurs under a negative zonal wind component, while southward transport of the plume toward the Siberian coast occurs under a positive zonal wind component.
4.2.1 Wind-driven motion of the Ob–Yenisei plume
In the present study, the motion of the northern boundary of the Ob–Yenisei plume is examined using SSS data. Plume boundary dynamics are considered along the meridian of 80° E. It is assumed that northward and southward shifts of the plume boundary are controlled by meridional transport of the surface layer as given by Equation 2.
In Figure 14, the latitude at which the northern boundary of the Ob–Yenisei plume crosses 80° E is shown as a red dashed line. The solid red line indicates the preceding 3 day change in this latitude in [km], i.e., the difference between the current position and its value three days earlier. The solid black line represents the Ekman drift in the meridional direction calculated using the Equation 2 and assuming plume thickness H as 10 meters. To compare boundary movement with wind forcing, Ekman drift is also calculated over a 3 day period in [km] as .
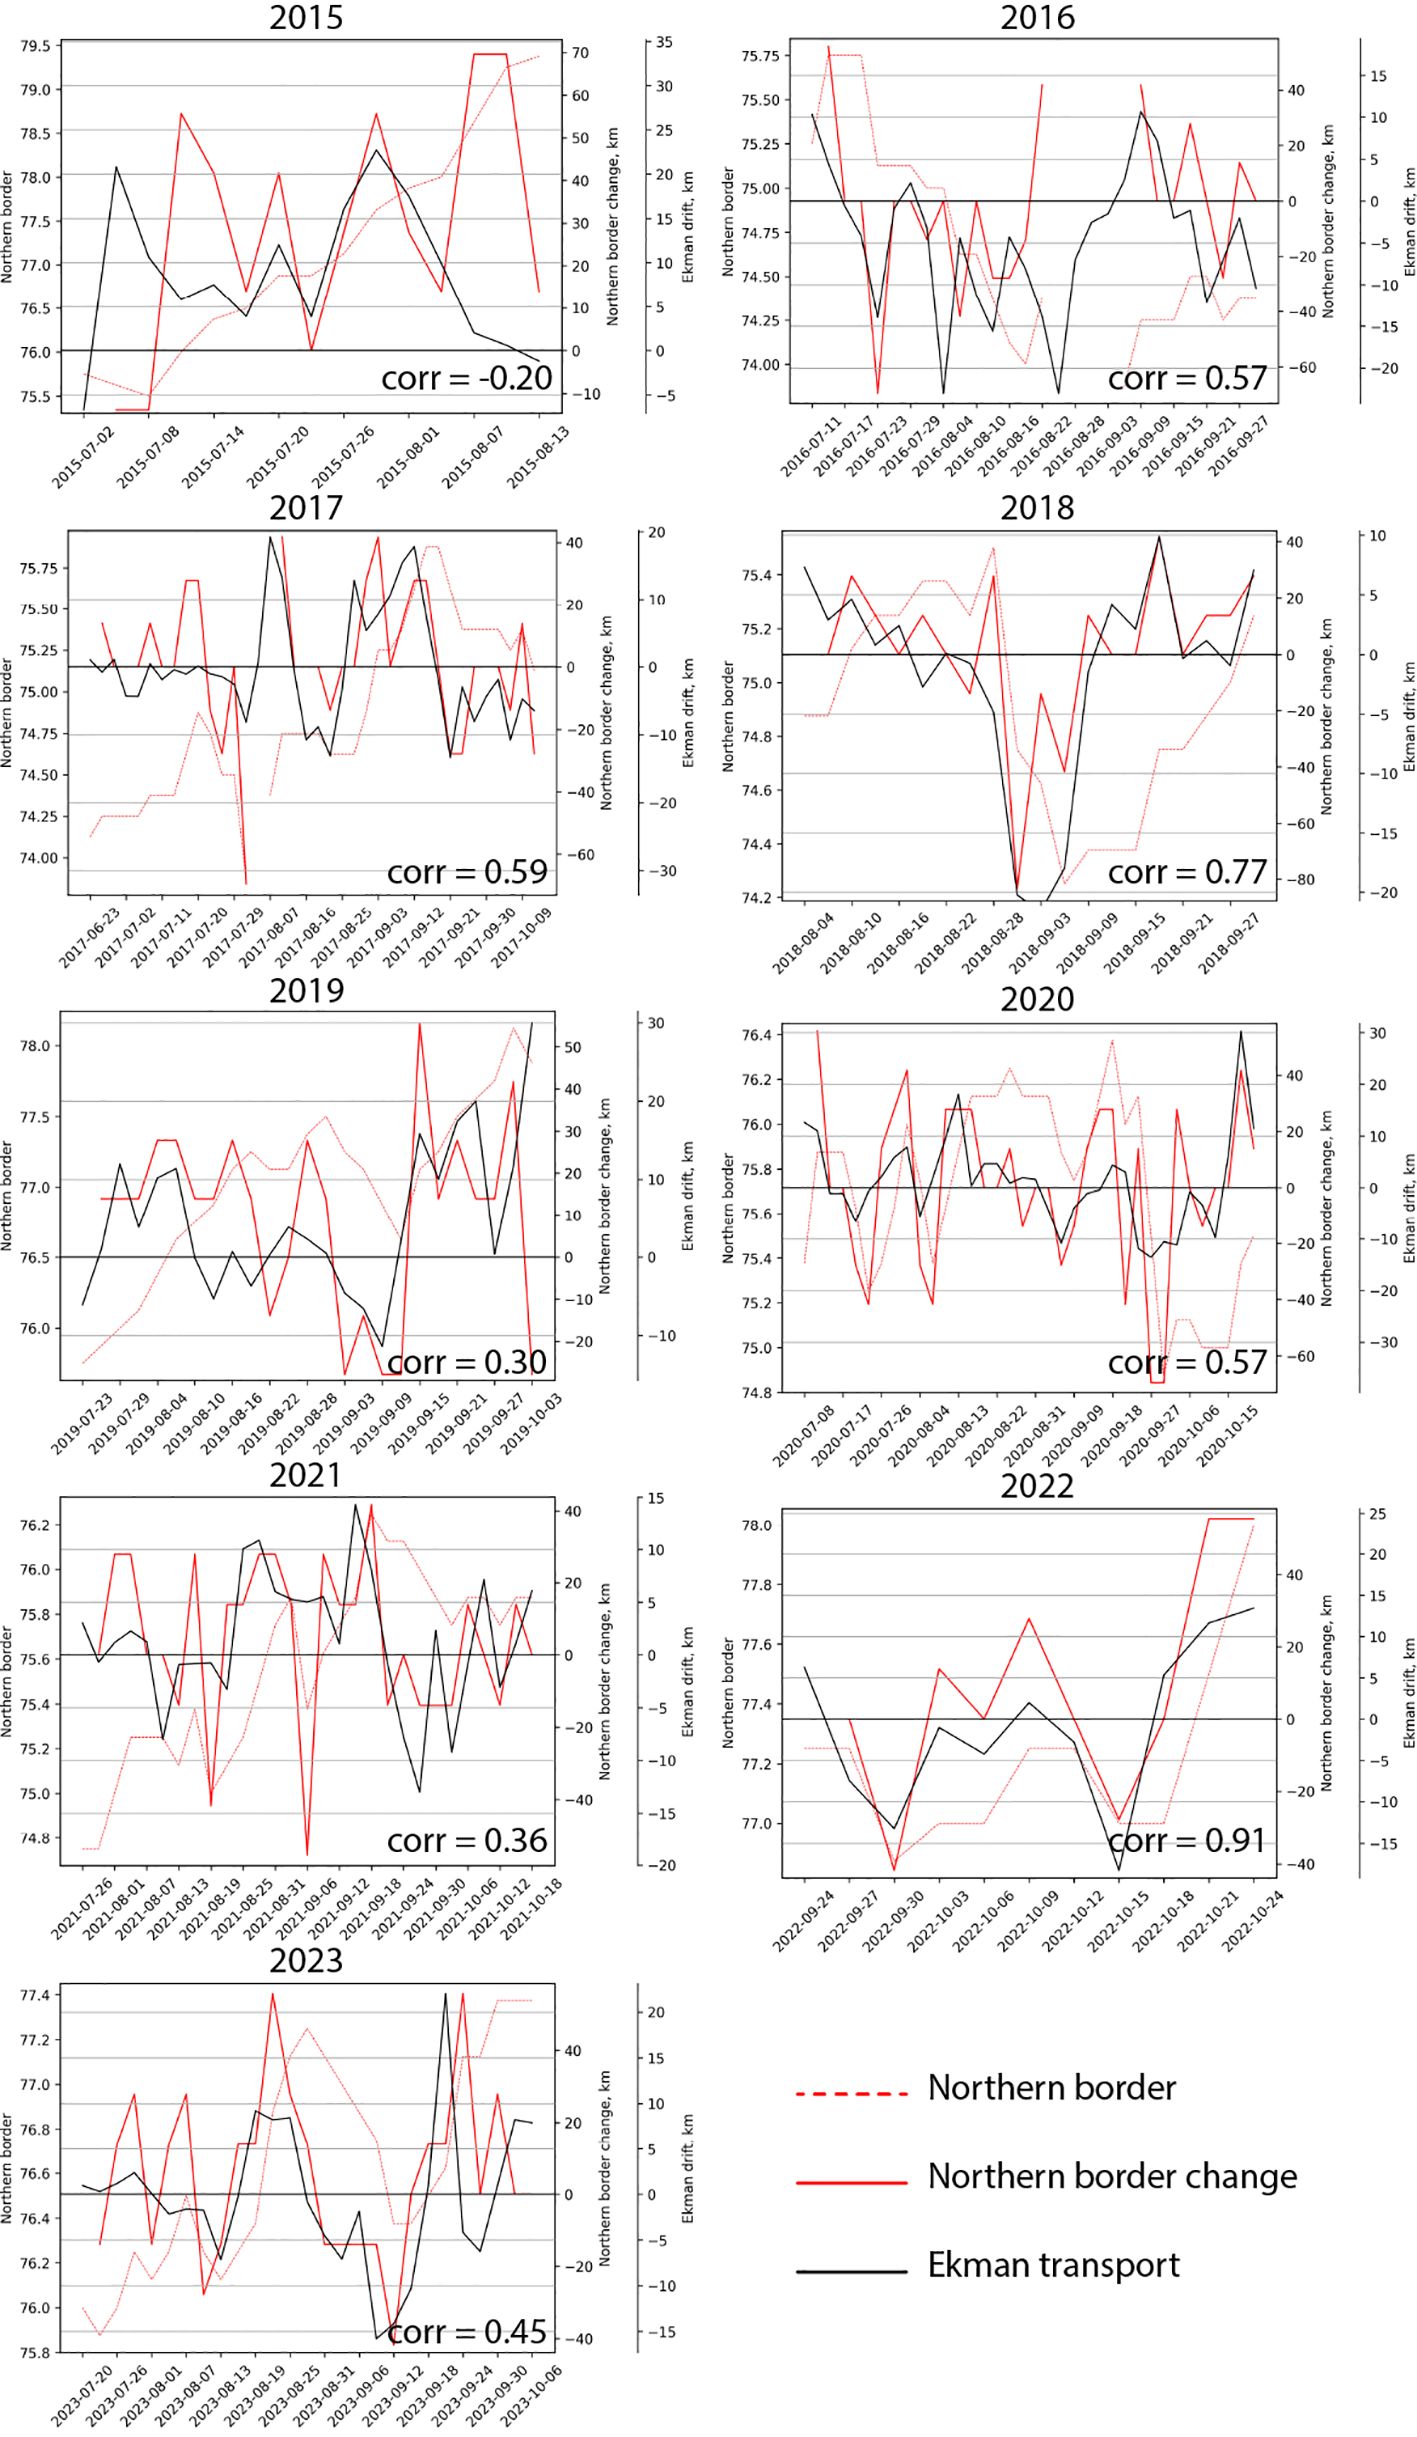
Figure 14. Location (value of latitude) of the northern border of the Ob–Yenisei plume along 80° E (red dashed line), change in this value during 3 previous days (red solid line), meridional Ekman drift in the area of the Ob–Yenisei plume (black solid line).
Wind velocity, used for calculation of Ekman drift, refers to the 3 day mean values of the zonal and meridional wind components averaged over the current position of the northern part of the Ob–Yenisei plume. These boundaries in most cases the area is bounded by 70° − 85° E and 73° − 78° N, but could vary by year and season for better plume area coverage. In 2016 northern boundary shifted to 76° N, in 2021 to 77° N. In 2017 area coverages region 68° − 83° E and 73° − 76° N, in 2018 region 68° − 85° E and 73° − 76° N. Wind velocity data are taken from the ERA5 reanalysis with spatial resolution of 0.25° and temporal resolution of 1 hour.
In the Northern Hemisphere, a negative zonal wind component causes northward motion, while a positive component leads to southward motion. For more convenient interpretation of Figure 14, the wind velocity, used for calculation of Ekman drift, is taken with the reversed sign, such that a positive zonal wind speed (and therefore positive Ekman drift meridional component) corresponds to northward plume movement. In this case the axes for plume boundary movement and Ekman drift become aligned. Figure 14 clearly demonstrates synchronous changes in the solid red and black lines. The red line displays the actual change in latitude of the northern boundary of the Ob–Yenisei plume, whereas the black line represents meridional plume boundary motion due to wind forcing following the Ekman theory. Both axes on Figure 14 are given in [km].
Figure 14 demonstrates a qualitative agreement between the Ekman drift in the meridional direction and changes in the position of the northern boundary of the Ob–Yenisei plume (solid lines). An increase in wind speed, i.e., Ekman drift increase, leads to northward shift of the northern boundary of the plume, while a decrease results in southward motion. The response of the plume movement to changes in wind speed could occur with a delay of several days. This is explained by the inertia of the Ob–Yenisei plume, which covers an area of hundreds of thousands of square kilometers. In some cases, the motion of the plume does not respond to wind changes. It was observed in August 2015 and September 2019. During these periods, the plume exhibited a distinct northern spreading type. The advection of the plume in the northern part of the Kara Sea was determined by the continuation of the West Novaya Zemlya Current. Therefore, when the plume propagated northward of Novaya Zemlya, the advection of its northern boundary no longer responded to wind conditions.
It is important to note the general patterns in the variation of the northern boundary of the Ob–Yenisei plume under wind forcing. For large positive wind values, the change in the boundary is also positive (i.e., the movement is northward), while for negative wind values, the shift is negative (the plume boundary moves south). Low wind speed values usually do not result in significant displacement of the boundary. Short-term changes in wind speed on timescales of several days also do not lead to pronounced change in position of the northern boundary of the plume.
The correlation between changes of the northern boundary of the Ob–Yenisei plume and surface layer transport according to the Ekman theory varies considerably across different years. The highest correlation (0.91) was recorded in 2022, high correlation (0.55–0.80) was also observed in 2016, 2017, 2018, and 2020. In these years, the Ob–Yenisei plume was not spreading far northward from the central part of the Kara Sea during the majority of the ice-free season. It was either pressed to the coast with subsequent eastward movement (2016, 2018, 2020), or propagated westward (2017). In years with the northern spreading type (2015, 2019, 2023), the correlation was the lowest (below 0.5).
In contrast to the qualitative relationship, the calculated Ekman drift consistently underestimates the actual displacement of the northern boundary of the Ob–Yenisei plume by a factor of about 3–4. This feature was reported in (Zatsepin et al., 2010), where it was explained by influence of sea ice, depth inhomogeneity of the plume, and underestimation of wind speed due to its averaging.
In this study, plume motion is described only during the ice-free period, so sea ice influence could not affect this process. Daily wind averaging indeed removes wind gusts, which could contribute to the observed difference, as well as could do the plume thickness variability. Nonetheless, the 3–4 fold underestimation persists for all years considered, i.e., for a wide range of wind conditions and plume propagation types. Therefore, the differences between the velocity of the Ob–Yenisei plume and the value of the Ekman transport have a more fundamental cause that remains stable across a broad spectrum of wind and ice conditions.
An alternative explanation for the observed effect is related to the smaller thickness of the Ob–Yenisei plume (10–20 m) compared to the thickness of the Ekman layer for the open sea without strong salinity stratification. Ekman layer depth is estimated from 20 to 60 meters for different seasons (Rio and Hernandez, 2003; Rio et al., 2011; Price et al., 1987). As a result, the thickness of the Ob–Yenisei plume is too small for fully developed Ekman spiral. The velocity of the partial flow M to a depth H according to the formulas.
makes up half of the full flow velocity when H is up to 40% of the Ekman layer thickness. In Equations 3, 4, , is the turbulent viscosity coefficient, is the characteristic Ekman layer thickness. Therefore, wind energy transferred from the atmosphere to the upper ocean layer is not fully expended on the motion of the river plume. The remainder part could be consumed by two processes. The first is that across the sharp density change at the vertical interface between the plume and subjacent seawater, mechanical energy is partially transformed into smaller scale internal waves and could dissipate as heat due to internal friction. The second process involves accumulation of energy in the lower layer of the river plume. As a result, speed of the Ob–Yenisei plume could be 2–4 times greater than the value of the Ekman transport calculated under the assumption of a purely drift flow for the full flux.
In addition to analyzing the dependence of meridional movement of the northern boundary of the Ob–Yenisei plume on meridional Ekman transport (i.e., zonal wind), the effect of both (meridional and zonal) components of the wind on the meridional movement of the plume boundary was evaluated. For this purpose, a multivariate regression model of the northern boundary movement in [km] was constructed as a function of two Ekman transport components: . During the optimization of the best fit between the observed and predicted boundary motion, the coefficients a and b were determined.
No significant increase in correlation was obtained between the linear combination of meridional and zonal transport and the actual boundary movement. In most cases, the coefficient a was an order of magnitude greater than the coefficient b. Therefore, it could be concluded that the meridional movement of the Ob–Yenisei plume in the Kara Sea is mainly determined by the zonal wind component.
4.2.2 Wind-driven motion of the Lena plume
Similar investigation was also carried out for the movement of the northern boundary of the Lena plume in the Laptev Sea. In this case, the motion of the plume boundary along 130° E was analyzed. Unlike the movement of the Ob–Yenisei plume in the Kara Sea, the relationship between the position of the Lena plume boundary in the Laptev Sea and wind conditions is significantly less pronounced. First, as noted in Section 3.2, the northward movement of the Lena plume occurs almost every year (except for 2016), and the northern boundary of the Lena plume reaches approximately the same latitudes. Despite differences in the nature and velocity of the Lena plume movement in the Laptev Sea during ice-free season, which could indeed be explained by wind conditions, the resulting position of its northern boundary turns out to be the same during all years. Secondly, the portion of the Lena plume that is spreading to the East Siberian Sea varies greatly from year to year. It complicates any possible dependence of the Lena plume movement in the Laptev Sea on wind forcing.
Given the above, greater interest lies not in the northward movement of the Lena plume in the Laptev Sea, but in the conditions of its advection to the East Siberian Sea and its further spreading there. To study this process, wind conditions over the eastern part of the Laptev Sea in the area of 130° − 140° E, 72° − 76° N in July–September were analyzed, as well as over the East Siberian Sea in August–September for years with the eastern or central spreading types of the Lena plume in the area of 150° − 175° E, 71° − 76° N (Table 1).
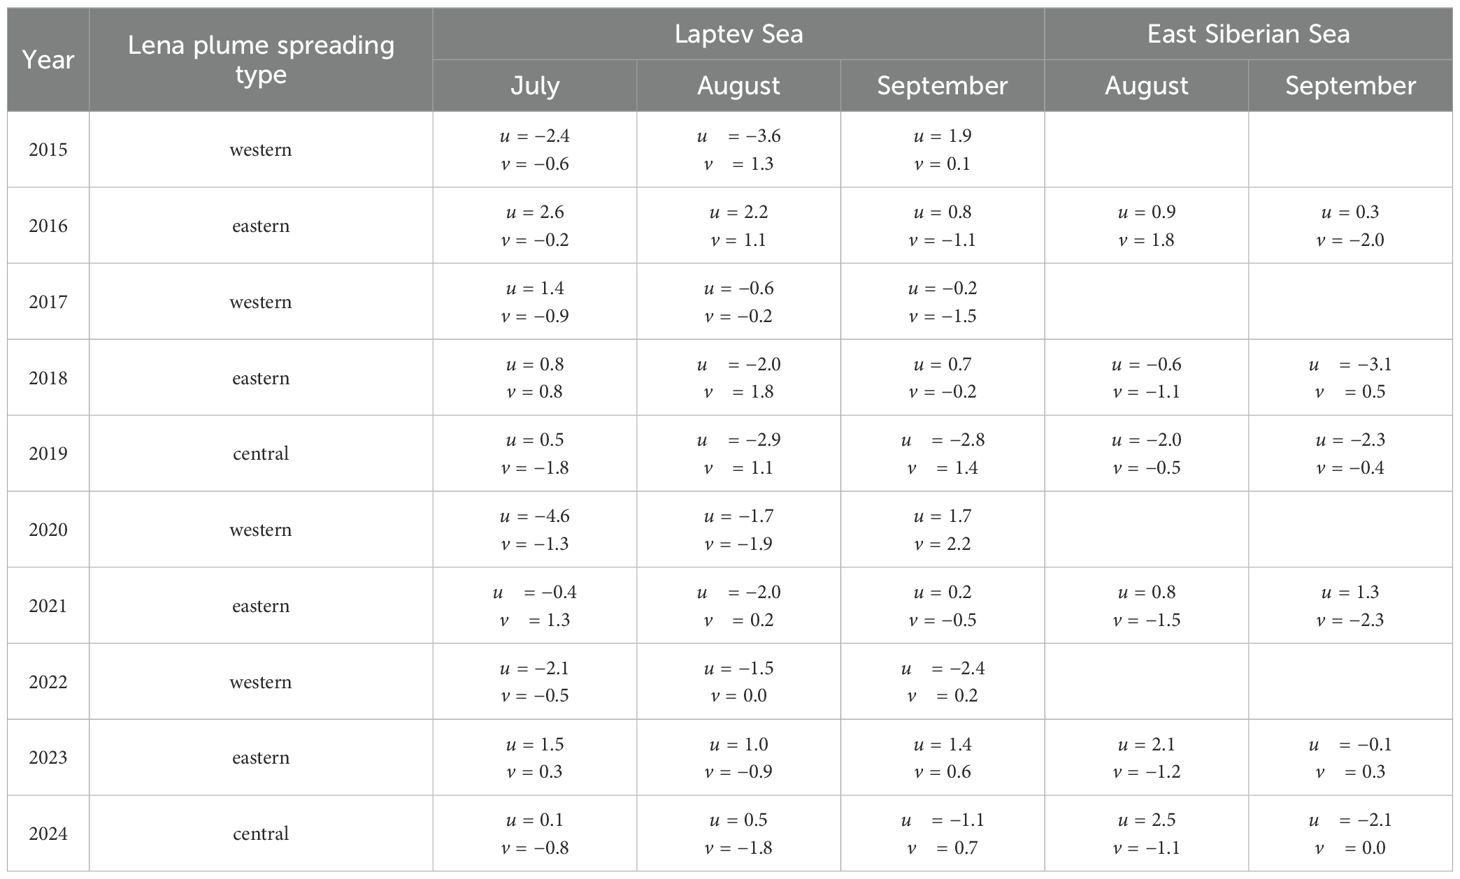
Table 1. Wind speed over the Laptev Sea in July–September (for all spreading types of the Lena plume) and over the East Siberian Sea in August–September (for eastern and central spreading types of the Lena plume) in 2015–2024.
Intense advection of the Lena plume to the East Siberian Sea was observed in years with the eastern and central spreading types (2016, 2018, 2019, 2021, 2023, and 2024). In contrast, much less advection occurred in years with the western spreading type (2015, 2017, 2020, and 2022), when the eastern boundary of the Lena plume reached only 160°–165° E and merged with the Indigirka plume, but did not reach the Kolyma River mouth. In these years, during July or July–August, i.e. the period when the eastern part of the Laptev Sea becomes occupied by the Lena plume and the sea is free of ice, a strong negative zonal wind component (i.e., prevailing easterly winds) was observed. On the one hand, this wind facilitated the northward movement of the Lena plume in the Laptev Sea. On the other hand, it impeded its eastward advection. An exception was registered in July 2017, which was characterized by late ice melting in the western part of the Laptev Sea. With a relatively weak zonal wind component in August and September, the meridional component was slightly negative (i.e., prevailing northerly wind). Such winds in August pressed the Lena plume to the southern shore of the Laptev Sea and prevented its eastward spreading.
In years with eastern and central spreading types, two distinct wind situations led to eastward advection of the Lena plume. In most cases (2016, 2018, 2019, 2023, 2024), eastward advection was caused by strong and prolonged positive zonal wind component, especially in July, when active ice melting occurs and open water areas determine the direction of initial spreading of the Lena plume. In other cases (August 2018, August–September 2019, July 2021), positive meridional wind component caused advection of the Lena plume eastward to the East Siberian Sea.
Further spreading of the Lena plume in the East Siberian Sea is governed by wind conditions in that sea. In most years, the Lena plume continued eastward spreading along the Siberian coast. However, under strong negative zonal wind components over the East Siberian Sea (e.g., August 2019, September 2024), it propagated into the northern part of the East Siberian Sea. It resulted in the largest recorded areas of the Lena plume (700–800 thousand km2). In 2018, wind conditions in September also resulted in far northward spreading of the plume, but persistent ice massif remained in the central and northern parts of the East Siberian Sea. Motion of the plume under the ice is possible and could have occurred. However, there are no means to confirm this event due to the lack of satellite salinity data near the ice edge.
The general scheme of the Ob–Yenisei and Lena plume motion under wind forcing is demonstrated in Figure 15. In the Kara Sea, the Ob–Yenisei plume moves according to the Ekman theory at a right angle to wind direction. Wind influence weakens as the Ob–Yenisei plume propagates to the northern part of the Kara Sea, where its motion is governed by the surface current.
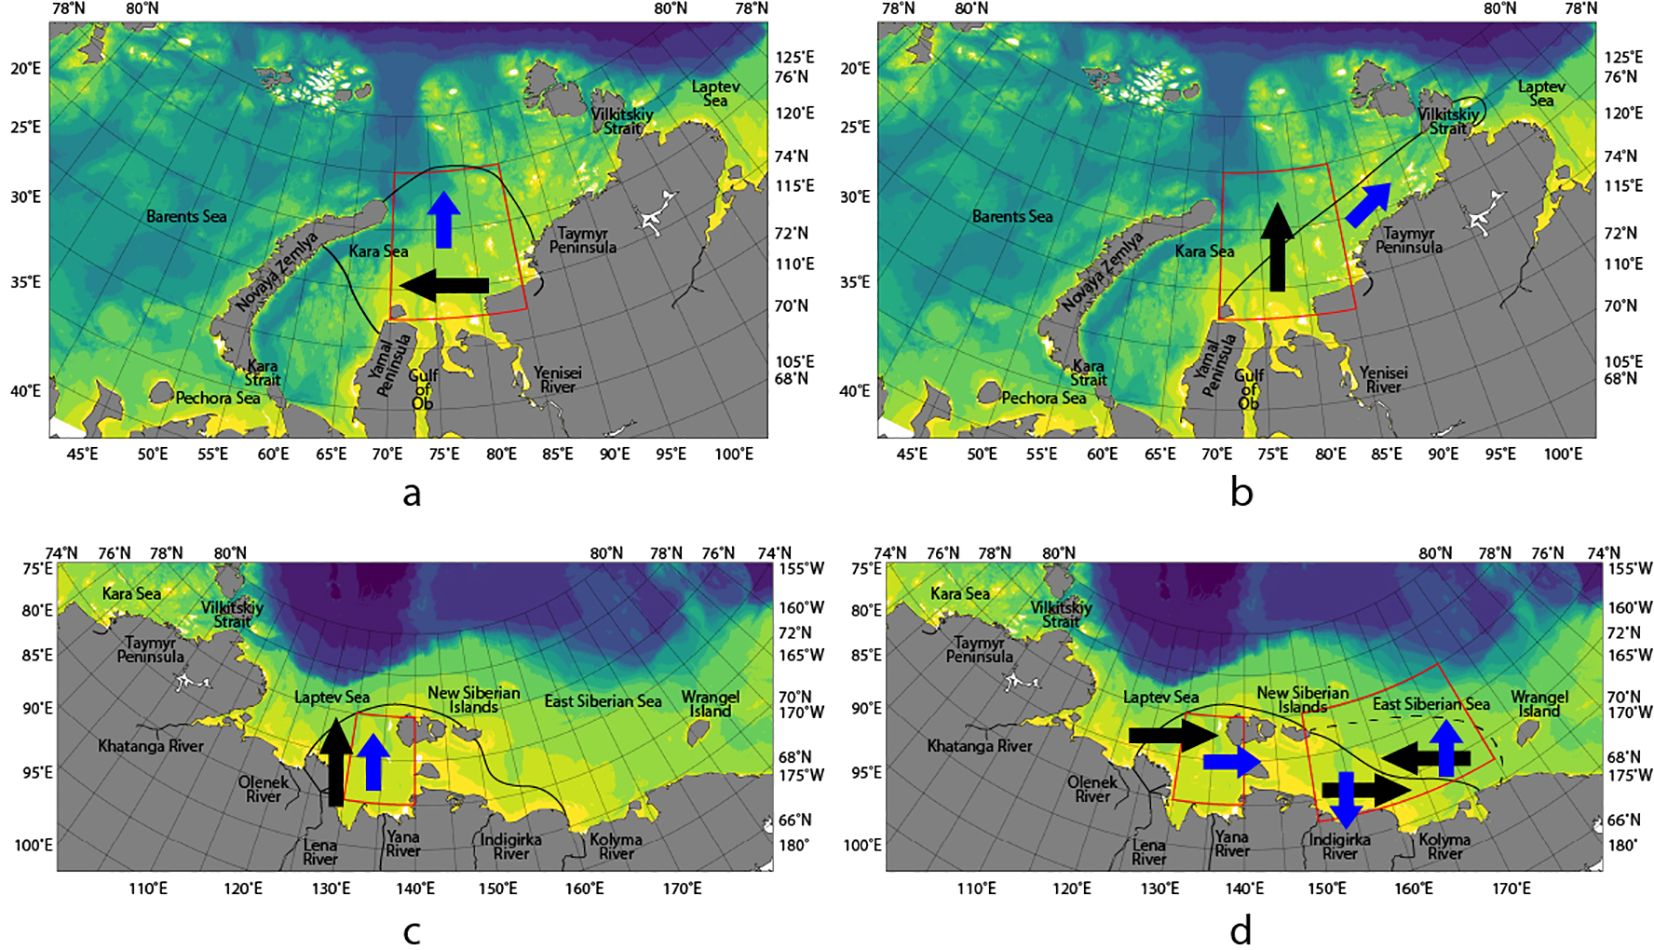
Figure 15. Scheme of the Ob–Yenisei plume spreading under wind forcing in the Kara Sea for the northwestern (a) and eastern (b) spreading types. Scheme of the Lena plume spreading under wind forcing in the Eastern Arctic for the western (c) and eastern or central (d) spreading types. Black arrows show wind direction, blue arrows indicate the Ekman drift direction of the surface layer. Black lines schematically indicate the plume boundaries. Red rectangles indicate areas of wind averaging.
Eastward spreading of the Lena plume to the East Siberian Sea occurs under strong westerly wind in July. Ice and wind conditions at the very beginning of the warm season have a decisive influence on the subsequent spreading type of the Lena plume. Apparently, both area and depth of the southeastern part of the Laptev Sea between the Lena Delta and the New Siberian Islands are too small for full development of surface layer motion according to the Ekman theory. As a result, the angle between wind direction and the direction of the plume movement is significantly less than 90°.
In case of the eastern and central spreading types, the part of the Lena plume that enters the East Siberian Sea moves independently from the part of the plume that remains in the Laptev Sea. It happens due to the presence of large New Siberian Islands and shallow straits between them, as well as the regional differences in wind conditions. In particular, the Lena plume advection in the East Siberian Sea occurs according to the Ekman theory. In most cases, the Lena plume in the East Siberian Sea retains its eastward propagation. Under strong easterly winds and in the absence of sea ice, the Lena plume is spreading northward, occupying large area, which is referred as the central spreading type.
5 Conclusion
The present work is devoted to detailed description of the Ob–Yenisei and Lena plumes spreading in the Eurasian Arctic. The variability of the boundaries of the Ob–Yenisei and Lena plumes is considered on synoptic, seasonal, and interannual time scales. The main tool for investigating motion of the freshened waters of river plumes is sea surface salinity data obtained from SMAP satellite observations and processed using a regional algorithm. These data represent a reliable source that allows daily monitoring of the position of the freshened surface layer in the Eurasian Arctic during the ice-free season since 2015.
In addition to satellite salinity data, satellite observations of sea surface temperature and absolute dynamic topography are also analyzed to describe the spreading of the Ob–Yenisei and Lena plumes. As demonstrated in this study, unlike satellite salinity, these datasets separately do not contain sufficient information to determine the boundaries of the Ob–Yenisei and Lena plumes as well their internal structure. The main problem in detecting the Ob–Yenisei and Lena plumes using satellite temperature data is intense cooling of sea surface that starts in August. Furthermore, detection of the Ob–Yenisei plume using satellite temperature is biased by inflows of warm water from the Barents Sea into the southwestern part of the Kara Sea. Detection of the Lena plume by temperature data is absolutely impossible due to rapid cooling of plume waters as they spread northward in the Laptev Sea and eastward to the East Siberian Sea via the Sannikov and Laptev straits. Satellite altimetry data could not be used to detect the Ob–Yenisei and Lena plumes due to significant influence of wind-induced changes of sea level near the coast in the shallow and semi-enclosed Kara, Laptev, and East Siberian seas.
Nevertheless, analysis of satellite temperature and altimetry data, in addition to the satellite salinity data, provides more detailed description of several processes in the surface layer of the studied areas. For example, sea surface temperature in the Kara Sea is useful to distinguish river plume waters from freshening caused by sea ice melting, especially at the beginning of ice-free season. In the Eastern Arctic, in some cases, sea surface temperature data make it possible to separate the Lena plume from plumes formed by smaller rivers, which together coalesce into a joint freshened surface layer. Finally, in case of eastward spreading of the Ob–Yenisei plume along the coast, altimetry data could significantly complement salinity data, which are unavailable near the coastline.
Spreading of the Ob–Yenisei plume in the Kara Sea is governed mainly by wind, in accordance with the Ekman theory. The zonal wind component plays the key role in this processes. Among the considered years (2015–2024), two main spreading patterns of the Ob–Yenisei plume are distinguished, namely, northwestern (driven by easterly winds), and eastern (driven by westerly and southwesterly winds). The northwestern spreading type was recorded in 2015, 2017, 2019, 2022, 2023, and 2024, while the eastern spreading type was observed in 2016, 2018, 2020, and 2021.
Under predominant westerly winds, the Ob–Yenisei plume is pressed against the western coast of the Taymyr Peninsula and spreads eastern as a coastal geostrophic current toward the Vilkitskiy Strait. In all considered years with the eastern spreading type (2016, 2018, 2020, 2021), the Ob–Yenisei plume advected to the Laptev Sea through the Vilkitskiy Strait. In these years, the plume could be detected in the Laptev Sea at the distance up to 300 km far from the Vilkitskiy Strait. During years with the eastern spreading type, the area of the Ob–Yenisei plume has a linear dependence on the total volume of the Ob and Yenisei river discharge. Therefore, under westerly winds the volume of river discharge determines the extent of the Ob–Yenisei plume propagation into the eastern part of the Kara Sea and further into the western part of the Laptev Sea.
Prevailing easterly and northeasterly winds cause northward and northwestward spreading of the Ob–Yenisei plume into the central part of the Kara Sea and to Novaya Zemlya. In most years with the northwestern spreading type (2017, 2019, 2022, 2023), the Ob–Yenisei plume advects westward and southwestward in the area between Novaya Zemlya and the Yamal Peninsula. In this case, the plume area is 200–250 thousand km2. In August 2015 and September 2024, the different spreading pattern was observed. Under the influence of strong northeasterly winds, the Ob–Yenisei plume advected to the northern part of the Kara Sea, namely, to the St. Anna Trough. In this area, the Ob–Yenisei plume expanded further northward along the eastern slope of the St. Anna Trough influenced by local surface circulation. It resulted in sharp increase in the plume area. In particular, area of the Ob–Yenisei plume in September 2015 reached 320 thousand km2.
In the Eastern Arctic, two main types of Lena plume spreading could be distinguished. They are determined by presence or absence of an intensive inflow of the Lena plume from the Laptev Sea to the East Siberian Sea through the Sannikov and Laptev Straits. Formation of this inflow is governed by wind conditions, specifically westerly winds over the southeastern part of the Laptev Sea. On the contrary, the prevailing easterly winds result in accumulation of the Lena plume predominantly within the Laptev Sea. In this case, inflow of the Lena plume to the East Siberian Sea becomes less pronounced, and the plume does not extend to the east from 160° E, which was observed in 2015, 2017, 2020, and 2022. This pattern of the Lena plume motion could be classified as the western spreading type. The area of the Lena plume in the case of the western spreading type is 460–580 thousand km2. A notable exception was the situation in 2015, when the Lena plume remained in the Laptev Sea and its area was less than 350 thousand km2.
Regardless of presence or absence of advection to the East Siberian Sea, the Lena plume covers the entire southeastern part of the Laptev Sea between the Lena Delta and the New Siberian Islands. In all the considered years, the northern boundary of the Lena plume gradually shifted northward during the ice-free season, reaching 76° − 78° N. Only in 2016, under the influence of strong westerly winds, the northern boundary of the Lena plume was located significantly farther south, at 75° N. Therefore, the motion of the Lena plume in the Laptev Sea does not correspond to the Ekman theory. Apparently, this is due to relatively small spatial scale and shallow depths in the southeastern Laptev Sea, which prevent the full development of the wind-induced Ekman transport.
During years with prevailing westerly winds in the Laptev Sea, intense spreading of the Lena plume to the East Siberian Sea occurs. In this case, the New Siberian Islands and the shallow Sannikov and Laptev Straits essentially isolate the dynamics of the Lena plume in the Laptev Sea from the dynamics of the Lena plume in the East Siberian Sea. Unlike the Laptev Sea, spreading of the Lena plume in the East Siberian Sea is determined by regional wind conditions in accordance with the Ekman theory. Westerly winds in the East Siberian Sea lead to eastward advection of the Lena plume along the Siberian coast up to the Wrangel Island. This situation was recorded in 2016, 2018, 2021, and 2023 and is considered as the eastern spreading type of the Lena plume. The total area of the Lena plume (including the Laptev Sea) in these years was equal to 450–550 thousand km2. The notable exception occurred in 2016, when the area of the Lena plume was much smaller (290 thousand km2) under strong easterly winds. In 2019 and 2024, strong easterly winds, on the contrary, resulted in advection of the Lena plume to the northern and northeastern parts of the East Siberian Sea, which could be regarded as the central spreading type of the Lena plume. In these cases, the maximal area of the Lena plume was the largest and amounted to 730–800 thousand km2.
Data availability statement
The original contributions presented in the study are included in the article/supplementary material. Further inquiries can be directed to the corresponding author.
Author contributions
AS: Data curation, Formal analysis, Investigation, Methodology, Resources, Validation, Visualization, Writing – original draft, Writing – review & editing. AO: Conceptualization, Data curation, Formal analysis, Funding acquisition, Methodology, Project administration, Resources, Supervision, Writing – original draft, Writing – review & editing.
Funding
The author(s) declare financial support was received for the research and/or publication of this article. This research was funded by the Moscow Institute of Physics and Technology under the Agreement No. 075-03-2025–662 dated January 17, 2025 (processing of satellite data); the state assignment of Shirshov Institute of Oceanology No. FMWE-2024-0015 (processing of atmospheric reanalysis data); the Russian Science Foundation, research project 23-17-00087 (study of variability of the Arctic river plumes), research project 25-47-01005 (study of wind-driven dynamics of the Arctic river plumes).
Conflict of interest
The authors declare that the research was conducted in the absence of any commercial or financial relationships that could be construed as a potential conflict of interest.
Generative AI statement
The author(s) declare that no Generative AI was used in the creation of this manuscript.
Any alternative text (alt text) provided alongside figures in this article has been generated by Frontiers with the support of artificial intelligence and reasonable efforts have been made to ensure accuracy, including review by the authors wherever possible. If you identify any issues, please contact us.
Publisher’s note
All claims expressed in this article are solely those of the authors and do not necessarily represent those of their affiliated organizations, or those of the publisher, the editors and the reviewers. Any product that may be evaluated in this article, or claim that may be made by its manufacturer, is not guaranteed or endorsed by the publisher.
References
Aagaard K. and Carmack E. C. (1989). The role of sea ice and other fresh water in the arctic circulation. J. Geophysical Research: Oceans 94, 14485–14498. doi: 10.1029/JC094iC10p14485
Clark J. B. and Mannino A. (2021). The impacts of freshwater input and surface wind velocity on the strength and extent of a large high latitude river plume. Front. Mar. Sci. 10. doi: 10.3389/fmars.2021.793217
Dmitrenko I., Kirillov S., Eicken H., and Markova N. (2005). Wind-driven summer surface hydrography of the eastern siberian shelf. Geophysical Res. Lett. 32, L14613. doi: 10.1029/2005GL023022
Dmitrenko I., Kirillov S., and Tremblay B. (2008). The long-term and interannual variability of summer fresh water storage over the eastern siberian shelf: Implication for climatic change. J. Geophysical Research: Oceans 113, C03007. doi: 10.1029/2007JC004304
Entekhabi D., Njoku E. G., O’neill P. E., Kellogg K. H., Crow W. T., Edelstein W. N., et al. (2010). The soil moisture active passive (smap) mission. Proc. IEEE 98, 704–716. doi: 10.1109/JPROC.2010.2043918
Fournier S., Lee T., Tang W., Steele M., and Olmedo E. (2019). Evaluation and intercomparison of smos, aquarius, and smap sea surface salinity products in the arctic ocean. Remote Sens. 11, 3043. doi: 10.3390/rs11243043
Frey D. and Osadchiev A. (2021). Large river plumes detection by satellite altimetry: Case study of the ob–yenisei plume. Remote Sens. 13, 5014. doi: 10.3390/rs13245014
GEBCO Compilation Group. (2025). GEBCO 2025 Grid. Available at: https://www.gebco.net/data-products/gridded-bathymetry-data. (Accessed May 28, 2025).
Gordeev V., Martin J. M., Sidorov I., and Sidorova M. (1996). A reassessment of the eurasian river input of water, sediment, major elements, and nutrients to the arctic ocean. Am. J. Sci. 296, 664–691. doi: 10.2475/ajs.296.6.664
Haine T. W., Curry B., Gerdes R., Hansen E., Karcher M., Lee C., et al. (2015). Arctic freshwater export: Status, mechanisms, and prospects. Global Planetary Change 125, 13–35. doi: 10.1016/j.gloplacha.2014.11.013
Harms I. and Karcher M. (2005). Kara sea freshwater dispersion and export in the late 1990s. J. Geophysical Research: Oceans 110.
Hersbach H., Bell B., Berrisford P., Hirahara S., Horányi A., Muñoz-Sabater J., et al. (2020). The era5 global reanalysis. Q. J. R. Meteorological Soc. 146, 1999–2049. doi: 10.1002/qj.3803
Janout M., Hölemann J., Laukert G., Smirnov A., Krumpen T., Bauch D., et al. (2020). On the variability of stratification in the freshwater-influenced laptev sea region. Front. Mar. Sci. 7. doi: 10.3389/fmars.2020.543489
Jeon M. H., Jung J., Son J., Cho K.-H., and Yang E. J. (2025). Interannual variability in terrestrial dissolved organic matter advection to the eastern east siberian sea under contrasting beaufort gyre conditions. Sci. Rep. 15, 23084. doi: 10.1038/s41598-025-07732-w
Kang Y., Pan D., Bai Y., He X., Chen X., Chen C.-T. A., et al. (2013). Areas of the global major river plumes. Acta Oceanologica Sin. 32, 79–88. doi: 10.1007/s13131-013-0269-5
Kerr Y. H., Waldteufel P., Wigneron J.-P., Delwart S., Cabot F., Boutin J., et al. (2010). The smos mission: New tool for monitoring key elements ofthe global water cycle. Proc. IEEE 98, 666–687. doi: 10.1109/JPROC.2010.2043032
Konik A. and Osadchiev A. (2025). Dynamics of the iokanga river plume according to sar and optical satellite data. J. Mar. Syst. 250, 104093. doi: 10.1016/j.jmarsys.2025.104093
Kubryakov A., Stanichny S., and Zatsepin A. (2016). River plume dynamics in the kara sea from altimetry-based lagrangian model, satellite salinity and chlorophyll data. Remote Sens. Environ. 176, 177–187. doi: 10.1016/j.rse.2016.01.020
Le Vine D. M., Lagerloef G. S., Colomb F. R., Yueh S. H., and Pellerano F. A. (2007). Aquarius: An instrument to monitor sea surface salinity from space. IEEE Trans. Geosci. Remote Sens. 45, 2040–2050. doi: 10.1109/TGRS.2007.898092
Martínez J., Gabarró C., Turiel A., González-Gambau V., Umbert M., Hoareau N., et al. (2021). Improved bec smos arctic sea surface salinity product v3. 1. Earth System Sci. Data Discussions 2021, 1–28. doi: 10.5194/essd-14-307-2022
Moretskii V. (1985). Distribution and dynamics of desalinated waters of the kara sea. Tr. Arkt. Antarkt. Nauchno Issled. Inst 389, 33–35.
Mulligan R. and Perrie W. (2019). Circulation and structure of the mackenzie river plume in the coastal arctic ocean. Continental Shelf Res. 177, 59–68. doi: 10.1016/j.csr.2019.03.006
Osadchiev A., Frey D., Shchuka S., Tilinina N., Morozov E., and Zavialov P. (2021a). Structure of the freshened surface layer in the kara sea during ice-free periods. J. Geophysical Research: Oceans 126, e2020JC016486. doi: 10.1029/2020JC016486
Osadchiev A., Frey D., Spivak E., Shchuka S., Tilinina N., and Semiletov I. (2021b). Structure and inter-annual variability of the freshened surface layer in the laptev and east-siberian seas during ice-free periods. Front. Mar. Sci. 8. doi: 10.3389/fmars.2021.735011
Osadchiev A., Izhitskiy A., Zavialov P. O., Kremenetskiy V., Polukhin A., Pelevin V., et al. (2017). Structure of the buoyant plume formed by ob and yenisei river discharge in the southern part of the kara sea during summer and autumn. J. Geophysical Research: Oceans 122, 5916–5935. doi: 10.1002/2016JC012603
Osadchiev A., Konovalova O., and Gordey A. (2021c). Water exchange between the gulf of ob and the kara sea during ice-free seasons: the roles of river discharge and wind forcing. Front. Mar. Sci. 8. doi: 10.3389/fmars.2021.741143
Osadchiev A., Kuskova E., and Ivanov V. (2024). The roles of river discharge and sea ice melting in formation of freshened surface layers in the kara, laptev, and east siberian seas. Front. Mar. Sci. 11. doi: 10.3389/fmars.2024.1348450
Osadchiev A., Medvedev I., Shchuka S., Kulikov E., Spivak E., Pisareva M., et al. (2020a). Influence of estuarine tidal mixing on structure and spatial scales of large river plumes. Ocean Sci. 16, 1–18. doi: 10.5194/os-16-781-2020
Osadchiev A., Pisareva M., Spivak E., Shchuka S., and Semiletov I. (2020b). Freshwater transport between the kara, laptev, and east-siberian seas. Sci. Rep. 10, 13041. doi: 10.1038/s41598-020-70096-w
Osadchiev A., Sedakov R., Frey D., Gordey A., Rogozhin V., Zabudkina Z., et al. (2023a). Intense zonal freshwater transport in the eurasian arctic during ice-covered season revealed by in situ measurements. Sci. Rep. 13, 16508. doi: 10.1038/s41598-023-43524-w
Osadchiev A., Silvestrova K., and Myslenkov S. (2020c). Wind-driven coastal upwelling near large river deltas in the laptev and east-siberian seas. Remote Sens. 12, 844. doi: 10.3390/rs12050844
Osadchiev A., Viting K., Frey D., Demeshko D., Dzhamalova A., Nurlibaeva A., et al. (2022). Structure and circulation of atlantic water masses in the st. anna trough in the kara sea. Front. Mar. Sci. 9. doi: 10.3389/fmars.2022.915674
Osadchiev A., Zabudkina Z., Rogozhin V., Frey D., Gordey A., Spivak E., et al. (2023b). Structure of the ob-yenisei plume in the kara sea shortly before autumn ice formation. Front. Mar. Sci. 10. doi: 10.3389/fmars.2023.1129331
Panteleev G., Proshutinsky A., Kulakov M., Nechaev D. A., and Maslowski W. (2007). Investigation of the summer kara sea circulation employing a variational data assimilation technique. J. Geophysical Research: Oceans 112. doi: 10.1029/2006JC003728
Pavlov V., Timokhov L., Baskakov G., Kulakov M. Y., and Kurazhov V. (1996). Hydrometeorological regime of the Kara, Laptev, and East-Siberian seas. Tech. Rep.
Price J. F., Weller R. A., and Schudlich R. R. (1987). Wind-driven ocean currents and ekman transport. Science 238, 1534–1538. doi: 10.1126/science.238.4833.1534
Rio M., Guinehut S., and Larnicol G. (2011). New cnes-cls09 global mean dynamic topography computed from the combination of grace data, altimetry, and in situ measurements. J. Geophysical Research: Oceans 116. doi: 10.1029/2010JC006505
Rio M.-H. and Hernandez F. (2003). High-frequency response of wind-driven currents measured by drifting buoys and altimetry over the world ocean. J. Geophysical Research: Oceans 108. doi: 10.1029/2002JC001655
Rogozhin V., Osadchiev A., and Konovalova O. (2023). Structure and variability of the pechora plume in the southeastern part of the barents sea. Front. Mar. Sci. 10. doi: 10.3389/fmars.2023.1052044
Rogozhin V., Osadchiev A., Savin A., Rogozhina E., Georgiev A., and Konovalova O. (2025). Sea ice decline in the eastern arctic results in expansion of the freshened surface layer. Front. Mar. Sci. 12. doi: 10.3389/fmars.2025.1558240
Rusanov V. and Vasil’ev A. (1976). Distribution of river waters in the kara sea according to hydrochemical analysis. Tr. Arkt. Antarkt. Nauchno-Issled. Inst 323, 188–196.
Savin A., Krinitskiy M., and Osadchiev A. (2024). Improved sea surface salinity data for the arctic ocean derived from smap satellite data using machine learning approaches. Front. Mar. Sci. 11. doi: 10.3389/fmars.2024.1358882
Spivak E., Osadchiev A., and Semiletov I. (2021). Structure and variability of the lena river plume in the south-eastern part of the laptev sea. Oceanology 61, 839–849. doi: 10.1134/S000143702106014X
The Arctic Great Rivers Observatory. (2025). Discharge Dataset. Available at: https://arcticgreatrivers.org/data/ (Accessed March 27, 2025).
Williams W. J. and Carmack E. C. (2015). The ‘interior’ shelves of the arctic ocean: Physical oceanographic setting, climatology and effects of sea-ice retreat on cross-shelf exchange. Prog. Oceanography 139, 24–41. doi: 10.1016/j.pocean.2015.07.008
Zabudkina Z., Osadchiev A., Ivanov V., Makhotin M., and Merkulov V. (2025). Interannual variability of the barents sea branch water in the northeastern part of the barents sea and the st. anna trough. Front. Mar. Sci. 12. doi: 10.3389/fmars.2025.1569186
Zatsepin A., Zavialov P., Kremenetskiy V., Poyarkov S., and Soloviev D. (2010). The upper desalinated layer in the kara sea. Oceanology 50, 657–667. doi: 10.1134/S0001437010050036
Zhao J., Wang Y., Liu W., Bi H., Cokelet E. D., Mordy C. W., et al. (2022). Sea surface salinity variability in the bering sea in 2015–2020. Remote Sens. 14, 758. doi: 10.3390/rs14030758
Keywords: river plume, Arctic Ocean, Ob, Yenisei, Lena, wind forcing, sea surface salinity, SMAP
Citation: Savin A and Osadchiev A (2025) Ob–Yenisei and Lena plumes: wind–driven dynamics and variability. Front. Mar. Sci. 12:1681563. doi: 10.3389/fmars.2025.1681563
Received: 07 August 2025; Accepted: 30 October 2025;
Published: 20 November 2025.
Edited by:
Igor Dmitrenko, University of Manitoba, CanadaReviewed by:
Xinyi Kang, Chinese Academy of Sciences (CAS), ChinaEvgeny Lemeshko, Marine Hydrophysical Institute, Russia
Copyright © 2025 Savin and Osadchiev. This is an open-access article distributed under the terms of the Creative Commons Attribution License (CC BY). The use, distribution or reproduction in other forums is permitted, provided the original author(s) and the copyright owner(s) are credited and that the original publication in this journal is cited, in accordance with accepted academic practice. No use, distribution or reproduction is permitted which does not comply with these terms.
*Correspondence: Alexander Savin, c2F2aW4uYXNAcGh5c3RlY2guZWR1