Abstract
Coastal wetlands play a crucial role in the global carbon cycle and climate regulation by serving as significant reservoirs of ecosystem carbon stock. However, their carbon sequestration capacity is strongly influenced by vegetation types, as well as the seasonal dynamics and vertical distribution of soil organic carbon. In this study, four wetland ecosystem types in the Minjiang Estuary—Kandelia candel, Phragmites australis, Cyperus malaccensis, and the unvegetated Tidal flat (control)—were investigated to assess the characteristics of ecosystem carbon stocks. The results showed that total ecosystem carbon stock was highest in K. candel—dominated vegetation (161.00 t C ha-1), followed by C. malaccensis (155.29 t C ha-1), and P. australis (128.44 t C ha-1), while the Tidal flat exhibited the lowest carbon value (49.08 t C ha-1). Vegetated wetlands stored 2.6-3.3 times more carbon than unvegetated Tidal flats, underscoring vegetation’s key role in carbon accumulation. Across all sites, soils contained the vast majority (92.23%-95.05%) of ecosystem carbon, while vegetation accounted for only (4.94%-7.77%). Distinct seasonal patterns were observed that carbon stock in the K. candel ecosystem showed spring maxima and autumn minima, whereas the herbaceous wetlands (P. australis and C. malaccensis) peaked in autumn. In contrast, carbon stock in the Tidal flat peaked significantly during summer. Vertical distributions of soil organic carbon (SOC) stock exhibited distinct site-specific patterns. The K. candel wetlands exhibited SOC stock peak in the 20–40 cm soil layer across seasons, while the P. australis and C. malaccensis wetlands generally decreased SOC with depth increasing except for in autumn. In the Tidal flat, SOC stock increased with soil depth in spring and autumn but peaked at 20–40 cm in summer and winter. Correlations analysis indicated that soil moisture and temperature significantly promoted carbon accumulation, whereas high bulk density and low pH constrained carbon storage, particularly in K. candel and P. australis wetlands. These findings provide critical insights into the carbon stock dynamics and seasonal variability of different coastal vegetation types, offering a scientific basis for the conservation of coastal wetland ecosystems and the development of carbon enhancement strategies in China.
1 Introduction
Since the Industrial Revolution, global carbon emissions have increased by approximately 90%, leading to an approximately 40% rise in atmospheric CO2 (Ciais et al., 2014; Chen et al., 2023). Between 2002 and 2021, global mean surface temperature increased by 1.01°C above pre-industrial levels, with China warming faster than the global average (Chen, 2022). In response, Nature-based Solutions (NbS) have gained attention as strategies for mitigating climate change and provide co-benefits of strengthening community resilience and enhancing biodiversity conservation (Buma et al., 2024). Among them, coastal wetlands are regarded as prime “blue carbon” ecosystems, whose substantial carbon storage arises not only from their high primary productivity and the oxygen-deficient conditions created by waterlogged soils that suppress organic matter decomposition, but also from their capacity for long-term carbon burial that can persist for millennia (Tang et al., 2018; Brevik and Homburg, 2004; Dong et al., 2020; Hopkinson et al., 2018). Despite comprising only 0.2% of the global ocean area, these ecosystems store 3 to 5 times more carbon than tropical rainforests, with sediments accounting for up to 50% of global marine carbon burial [e.g., (Le Quéré et al., 2015; Macreadie et al., 2021; Temmink et al., 2022)].
Carbon storage in coastal wetlands is primarily regulated by vegetation type. For instance, mangrove forests in Hainan, China, store up to 328 t C ha-1, which is considerably higher than that of salt marshes (255 t C ha-1) and seagrass beds (108 t C ha-1). Seasonal variability also plays a key role, as higher soil organic carbon contents are observed in autumn compared with spring or summer, and vegetated habitats such as those dominated by Phragmites australis (Common Reed) or Tamarix chinensis (Chinese tamarisk) generally have greater total organic carbon levels than unvegetated zones (Luo et al., 2014), likewise, peak macrophyte carbon occurs post-summer (Lolu et al., 2019). These observations suggest that single-season assessments may underestimate the dynamic carbon storage potential of coastal wetlands.
Against this background, the Minjiang Estuary wetland in Fujian Province provides an ideal site to explore these processes. As one of the most important ecological conservation areas in southeastern China, it functions as a biodiversity hotspot, offering habitats, food resources, and vital ecosystem services to the local population (Li et al., 2015; Chen et al., 2025). The dominant native vegetation includes the mangrove Kandelia candel (Narrow-leaved Kandelia) and the herbaceous species P. australis and Cyperus malaccensis. Due to the estuary’s latitude (~26°N) and lower temperatures (minimum average temperature: ~10°C), other mangrove species such as Bruguiera gymnorhiza (Oriental mangrove), Avicennia marina (Grey mangrove), and Sonneratia apetala (Mangrove apple) cannot survive in this environment (Wang et al., 2015; Inoue et al., 2022; Almahasheer et al., 2016; Ren et al., 2009). K. candel, the northernmost-distributed mangrove species in China, dominates southeastern coastal estuaries owing to its strong tolerance to low temperatures and fluctuating salinity. This species can endure extreme cold events with temperatures below 10°C for up to a week (Hsieh et al., 2015), enabling its distribution to extend northward to Ximen Island, Yueqing, Zhejiang Province (28°25′N)-the highest latitude of natural mangroves in China.
Consequently, K. candel becomes the dominant mangrove species in the Minjiang Estuary, where winter temperatures remain relatively low (Zhang and Liao, 2022). However, since the invasion of Spartina alterniflora in 1979, its subsequent invasion has led to a significant decline in the distribution and biomass of native vegetations (Lin, 2008; Zheng et al., 2019). The invasion has also altered soil nutrient dynamics, particularly by increasing N:P ratios, and has reshaped microbial communities and benthic fauna. In addition, it increases surface roughness, restricts hydrological exchange, and promotes mudflat accretion, which together exacerbate soil waterlogging and modify redox conditions, making the habitat less suitable for native species (Pezeshki et al., 1989; Shang et al., 2022; Zheng et al., 2023). In response, local authorities have implemented integrated control measures and restoration programs targeting native vegetation (Li et al., 2023). Nevertheless, even with large-scale restoration of native vegetation, the net effect on ecosystem carbon balance remains unclear. These dynamics highlight the necessity of evaluating how vegetation type and seasonal processes jointly regulate carbon storage and fluxes in this estuary.
Several studies have examined carbon cycling in the Minjiang Estuary. For instance, Tan et al. (2023) reported that converting natural wetlands (including mangroves and salt marshes) into aquaculture ponds led to about 90% reduction in ecosystem organic carbon, despite a slight increase in soil inorganic carbon. Wang et al. (2018) demonstrated that invasive S. alterniflora and P. australis can increase labile organic carbon concentrations at 0–10 cm soil layer and light-fraction organic carbon contents at 30–60 cm depth compared to native C. malaccensis vegetation, and that P. australis wetlands tend to accumulate more iron-bound organic carbon (Fe-OC), thereby enhancing total soil carbon stocks (Liu et al., 2024b). Most research in the Minjiang Estuary has focused on the effects of land-use changes on carbon dynamics, the invasion of S. alterniflora and its impacts on the native vegetation, greenhouse gas emissions [e.g., (Tan et al., 2017)], and biogeochemical cycles [e.g., (Hu et al., 2022)]. Despite these advances, comprehensive ecosystem-level assessments of carbon stocks across different vegetation types and seasons in the Minjiang Estuary remain scarce. This research gap significantly constrains our ability to achieve a comprehensive understanding of the “blue carbon sink” distribution within the Minjiang Estuary wetland. Consequently, a systematic investigation into the carbon stock capacity and seasonal variation of different vegetation types in coastal wetlands is urgently needed to provide a robust scientific basis for optimizing management strategies to enhance carbon sequestration in China’s coastal regions.
To address this knowledge gap, the present study investigates the seasonal and spatial variations in carbon stocks across three representative vegetation types in the Minjiang Estuary, including K.candel, P. australis, and C. malaccensis, with the Tidal flats included as a non-vegetated control. We proposed three hypotheses: (i)The carbon stock of the vegetation layer is expected to exhibit seasonal variation among different wetland vegetation types, driven by differences in growth cycles and the allocation of carbon among plant organs, with a peak generally occurring in autumn; (ii) The soil carbon stock is hypothesized to show seasonal variation related to the physicochemical properties and vertical heterogeneity of soils across wetland types, while being further influenced by vegetation-derived biomass inputs that typically result in higher soil carbon stocks in autumn; (iii) Wetland ecosystems with vegetation cover are expected to have higher total carbon stocks than unvegetated Tidal flats, and the timing of peak carbon stocks may varies among vegetation types. These findings aim to reveal the temporal and spatial characteristics of ecosystem-level carbon stocks among vegetation-specific estuarine wetlands, providing a scientific foundation for coastal wetland protection and carbon sequestration management strategies in China’s coastal regions.
2 Materials and methods
2.1 Study area
The study was conducted in three native vegetation types dominated by mangrove species (K. candel), and herbaceous salt marsh plants (P. australis and C. malaccensis) that are located within the Minjiang River Estuary Wetland National Nature Reserve (119°36′27.8″-119°41′15.1″E, 26°01′7.8″-26°03′39.3″N; Figures 1A, B), which covers a total area of 3,120 ha. The region experiences a subtropical monsoon climate, characterized by a mean annual temperature of 19.6°C and average annual precipitation of 1,346 mm (Wang et al., 2015). Precipitation occurs on approximately 153 days per year, predominantly between March and September, with a mean annual evaporation of 1,518 mm. The area experiences a semidiurnal tidal pattern, with two flood tides and two ebb tides daily and water level fluctuations ranging from 0.1 m to 1.2 m. On average, the study area is submerged for about 7–8 hours per day during high tide, while nearly the entire surface is exposed during low tide (Tan et al., 2017). The dominant soil types include coastal acid saline soils and sandy acidic aeolian soils (Gao et al., 2017). Due to its latitude location, the mangrove wetlands of the Minjiang Estuary are primarily composed of K. candel, owing to the it’s cold tolerance. Herbaceous wetlands are dominated by P. australis, C. malaccensis, and Scirpus mariqueter, forming a typical ecotone ecosystem at the land-sea interface (Tan et al., 2017).
Figure 1
Location of the study site in Minjiang Estuary (B), Changle County, Fuzhou City, Fujian province, China (A). Figure 1(C, D) present the sampling point locations and vegetation coverage conditions of four types of wetland habitats.
2.2 Sample collection
2.2.1 Plot setup
Field experiments were conducted in the southeastern section of the Wolong Tidal Flat Boardwalk Section A within the Minjiang Estuary Wetland. In early March 2023, a preliminary vegetation survey identified four wetland sites based on actual vegetation distribution, structural characteristics, and accessibility. These sites represented four different vegetation types: K. candel, P. australis, and C. malaccensis, and an unvegetated Tidal flat as the control. All selected vegetated plots were uniform and dominated by a single species. For K. candel forests, trees were relatively low-statured with multiple basal branches. The tree density was approximately 5,000 trees ha-1, with an average basal diameter of 9.25 cm, average tree height of 197.67 cm, and mean main trunk height of 22.61 cm. In P. australis and C. malaccensis wetlands, the ground coverage exceeded 90%, with dense, evenly distributed stems. The unvegetated Tidal flat exhibited bare sediment surfaces with minimal organic matter. Representative photographs of each vegetation type under field conditions are provided in Figures 1C, D, illustrating the structural characteristics described above.
To minimize edge effects, all sites were spaced at least 10 m apart (Zedler and Kercher, 2005) and contained only one dominant vegetation type. Within each vegetable type, three 10 m × 10 m plots were randomly established, resulting in a total of 12 plots. For P. australis and C. malaccensis wetlands, aboveground and belowground vegetation were both sampled within 0.5 m × 0.5 m sampling points in each plot. For all four vegetation types, soil samples were also collected within a total of 36 0.5 m × 0.5 m sampling points established in each plot. Sampling was conducted in April, July, October and late December 2023, representing spring, summer, autumn and winter, respectively. These months were selected as approximate midpoints of the conventional meteorological seasons-spring (March~May), summer (June~August), autumn (September~November), and winter (December-February)-to ensure that measured environmental conditions were representative of each season and minimally affected by short-term transitional variability. This approach is consistent with prior seasonal field surveys in estuarine and coastal systems [e.g., (Fabrizio et al., 2021; Xie et al., 2023)].
2.2.2 Vegetation sampling
In each sampling season, all K. candel trees within the three plots were measured and tagged for identification. Tree height (cm), basal diameter (cm), and trunk height (cm) were recorded using a digital caliper (Model: DVC S1, DELIXI Electric Co., Ltd., China) and a diameter tape (Model: TF5019, Stanley Black & Decker Inc., USA). Based on basal diameter classes with 1 cm intervals, a total of 12 representative trees were selected, with four trees sampled from each plot. As the study area is a designated nature reserve where K. candel and other plant resources are under protection, a non-destructive sampling method was employed by using standard samples to minimize ecological disturbance. Trunk samples were collected using an increment borer (Model: Haglöf Increment Borer, Haglöf Sweden AB, Sweden) (Risti et al., 2024). For branches and leaves, the number of branches per tree was counted and the diameter at each branching point was measured to calculate the mean diameter. Branches matching this mean thickness were then cut, and the branches and leaves were separated and collected for analysis (Jin et al., 2012). Root samples were collected by excavating the entire root system (including both coarse and fine roots) within a 90° sector area with a 1 m radius at the tree base using shovels (Zhou et al., 2019).
For P. australis and C. malaccensis wetlands, three 0.5 m × 0.5 m sampling points were randomly established within each plot, with each sampling points at least 3 m apart to ensure uniform vegetation coverage. All aboveground biomass within each plot was harvested at ground level. A trench was then excavated along the plot boundary using a spade to collect the entire root system within the plot area. The collected vegetation samples were then thoroughly cleaned, bagged, and transported to the laboratory for the determination of biomass (t ha-1) and organic carbon content (mg g-1).
2.2.3 Soil sampling and environmental measurements
In each sampling season, soil samples were collected from the plots of the four vegetation types using the plum blossom point method (Carter and Gregorich, 2007). Sampling was conducted in a stratified manner from 0 to 80 cm soil depth, divided into four layers at 20-cm intervals (0–20 cm, 20–40 cm, 40–60 cm, 60–80 cm). Prior to sampling, all surface litter and plants debris were carefully removed. Three replicate samples were collected from each plot using a custom-made soil auger, which was inserted vertically and withdrawn slowly to maintain the integrity of the soil core. A total of 72 soil cores (5 cm diameter, 80 cm long) were collected per season across all vegetation types (4 vegetation types × 3 plots × 3 replicates). Soil temperature (°C) was measured in situ at the soil surface during each sampling season using a handheld thermometer probe (model: HX-ZX-4T, Huaxi Xinrui, China). The collected soil cores were divided into two sets. One set (36 cores) was used to determine bulk density (g cm-3) by collecting undisturbed samples with the ring core, which were sealed immediately to prevent moisture loss. The remaining 36 cores were separated by soil layer, placed in resealable bags, and transported to the laboratory. In the laboratory, soil pH and gravimetric soil moisture were determined for each depth interval and season, while soil organic carbon concentration (mg g-1) was analyzed following standard procedures. These environmental variables, including surface soil temperature, layered soil moisture, bulk density, and pH, provide essential baseline information for carbon stock analysis. Their summary statistics by vegetation type and depth are presented in Table 1.
Table 1
| Vegetation type | Season | pH | Soil moisture(%) | Soil bulk density (g cm-3) | Soil temperature (°C) | |||||||||
|---|---|---|---|---|---|---|---|---|---|---|---|---|---|---|
| 0–20 cm | 20–40 cm | 40–60 cm | 60–80 cm | 0–20 cm | 20–40 cm | 40–60 cm | 60–80 cm | 0–20 cm | 20–40 cm | 40–60 cm | 60–80 cm | 0–20 cm | ||
| Tidal flat | Spring | 6.5 ± 0.9Aa | 6.5 ± 0.1ABa | 6.4 ± 0.2Ba | 6.3 ± 0.1Aa | 8.0 ± 1.0Cd | 11.6 ± 1.Bc | 15.4 ± 2.8Bb | 21.3 ± 1.Ba | 1.5 ± 0.3Aa | 1.5 ± 0.1Aa | 1.3 ± 0.1Aa | 1.2 ± 0.1Aa | 26.0 ± 1.8Cb |
| Summer | 6.3 ± 0.1Aa | 5.8 ± 0.6Ba | 5.9 ± 0.2 Ba | 5.7 ± 0.3Ba | 21.0 ± 1.6Ab | 25.0 ± 4.6Ab | 26.5 ± 2.5Aab | 30.5 ± 0.9Aa | 1.1 ± 0.0Ba | 1.0 ± 0.1 Bab | 1.0 ± 0.1Bab | 0.9 ± 0.1Bb | 33.6 ± 0.5Aa | |
| Autumn | 6.9 ± 0.1Aa | 6.3 ± 0.8ABab | 5.9 ± 0.4Bab | 5.7 ± 0.4Bb | 17.7 ± 2.0Bab | 13.9 ± 1.2Bb | 17.8 ± 3.0Bab | 20.5 ± 1.8Ba | 1.4 ± 0.1Aab | 1.4 ± 0.1Aa | 1.3 ± 0.1Aab | 1.2 ± 0.1Ab | 29.8 ± 0.5Ba | |
| Winter | 7.4 ± 1.2Aa | 7.2 ± 0.8Aa | 7.5 ± 0.4Aa | 6.4 ± 0.2Aa | 2.6 ± 0.3Db | 3.1 ± 0.5Cb | 4.2 ± 1.4Dab | 4.9 ± 1.0Da | 1.5 ± 0.1Aa | 1.5 ± 0.1Aa | 1.4 ± 0.1Aab | 1.3 ± 0.1Ab | 18.2 ± 0.2Da | |
| Kandelia candel | Spring | 6.3 ± 1.0Aa | 6.0 ± 0.2Bab | 5.8 ± 0.3Bb | 6.0 ± 0.1Bab | 15.0 ± 1.7Ca | 15.8 ± 1.4Ca | 16.4 ± 1.8Ba | 17.9 ± 0.5Ba | 1.3 ± 0.1Aa | 1.2 ± 0.1Aa | 1.2 ± 0.1 Aa | 1.1 ± 0.1Aa | 25.8 ± 2.2Bb |
| Summer | 6.4 ± 0.3Aa | 6.2 ± 0.0ABa | 6.1 ± 0.1Ba | 6.1 ± 0.2Ba | 29.7 ± 1.9Aa | 30.7 ± 2.1Aa | 29.7 ± 0.7Aa | 32.1 ± 0.2Aa | 1.0 ± 0.0Ba | 1.0 ± 0.0Ba | 1.0 ± 0.0ABa | 1.0 ± 0.0ABa | 28.6 ± 0.4Ab | |
| Autumn | 6.7 ± 0.5Aa | 6.4 ± 0.1Aa | 6.4 ± 0.1Aa | 6.5 ± 0.2Aa | 24.3 ± 4.0Ba | 25.4 ± 1.2Ba | 30.3 ± 4.3Aa | 31.0 ± 4.8Aa | 0.9 ± 0.1Ba | 0.9 ± 0.0Bab | 0.8 ± 0.1Bbc | 0.7 ± 0.1Cc | 23.6 ± 0.9Cd | |
| Winter | 6.2 ± 0.1Aa | 6.1 ± 0.1Ba | 6.1 ± 0.0ABa | 6.1 ± 0.0Ba | 25.3 ± 1.3ABb | 28.4 ± 3.4ABab | 31.1 ± 4.0Aab | 33.5 ± 4.5Aa | 1.0 ± 0.1Ba | 0.9 ± 0.2Ba | 0.9 ± 0.2Ba | 0.8 ± 0.2Ba | 17.0 ± 0.1Db | |
| Phragmites australis | Spring | 6.8 ± 0.6Aa | 6.6 ± 0.1ABab | 6.4 ± 0.3ABb | 6.5 ± 0.1Aab | 16.0 ± 1.1Bb | 17.5 ± 2.1Bab | 18.3 ± 0.9Bab | 19.8 ± 1.6Ba | 1.2 ± 0.1Aa | 1.1 ± 0.1ABab | 1.1 ± 0.1ABab | 1.0 ± 0.1ABb | 28.3 ± 2.8Aa |
| Summer | 6.6 ± 0.1Aa | 6.5 ± 0.2BCab | 6.4 ± 0.4ABab | 6.2 ± 0.1Bb | 27.6 ± 2.7Aa | 29.2 ± 3.2Aa | 31.8 ± 1.6Aa | 32.1 ± 2.7Aa | 0.9 ± 0.1Aa | 0.9 ± 0.1Ba | 0.9 ± 0.1Ba | 0.8 ± 0.1Ba | 28.7 ± 1.1Ab | |
| Autumn | 6.8 ± 0.2Aab | 6.9 ± 0.2Aa | 6.7 ± 0.1Aab | 6.6 ± 0.1Ab | 22.5 ± 5.2Aa | 19.9 ± 0.4Ba | 22.3 ± 3.6Ba | 24.4 ± 3.8Aa | 1.2 ± 0.2Aa | 1.2 ± 0.1Aa | 1.2 ± 0.1Aa | 1.1 ± 0.1Aa | 24.1 ± 0.6Bc | |
| Winter | 6.3 ± 0.1Ba | 6.3 ± 0.1Cab | 6.2 ± 0.1Bab | 6.1 ± 0.1Bb | 23.7 ± 1.7Ac | 27.0 ± 2.1Abc | 29.4 ± 2.3Aab | 31.4 ± 1.8Aa | 1.1 ± 0.1Aa | 1.0 ± 0.1ABab | 0.9 ± 0.1Bab | 0.9 ± 0.1Bb | 17.0 ± 0.1Cb | |
| Cyperus malaccensis | Spring | 6.9 ± 0.1Aa | 6.6 ± 0.2Ab | 6.6 ± 0.1Ab | 6.5 ± 0.1Ab | 15.2 ± 3.0Bb | 17.8 ± 2.3Cab | 19.9 ± 2.6Bab | 21.4 ± 2.4Ba | 1.2 ± 0.1Aa | 1.1 ± 0.1Aa | 1.0 ± 0.1Aa | 1.0 ± 0.1Aa | 26.6 ± 2.0Bb |
| Summer | 6.7 ± 0.2Aa | 6.7 ± 0.1Aa | 6.6 ± 0.3Aa | 6.4 ± 0.2Aa | 22.9 ± 2.0Ab | 29.1 ± 2.6Aa | 30.0 ± 2.0Aa | 30.9 ± 1.5Aa | 1.0 ± 0.1Aa | 0.9 ± 0.1Aa | 0.9 ± 0.0Aa | 0.9 ± 0.2Aa | 27.4 ± 0.4Ac | |
| Autumn | 6.6 ± 0.2Aa | 6.6 ± 0.2Aa | 6.7 ± 0.2Aa | 6.7 ± 0.2Aa | 21.8 ± 2.2Ab | 25.7 ± 5.0ABab | 28.6 ± 4.5Aab | 31.9 ± 2.3Aa | 1.1 ± 0.1Aa | 1.1 ± 0.1Aa | 1.0 ± 0.1Aa | 0.9 ± 0.1Aa | 25.2 ± 0.1Cb | |
| Winter | 5.9 ± 0.5 Bb | 6.3 ± 0.1Bab | 6.3 ± 0.1Aab | 6.4 ± 0.1Aa | 17.0 ± 0.6Ba | 19.5 ± 2.1BCa | 20.6 ± 3.3Ba | 21.6 ± 2.5Ba | 1.2 ± 0.1Aa | 1.1 ± 0.1Aab | 1.0 ± 0.2Aab | 0.9 ± 0.1Ab | 16.8 ± 0.4Dc | |
Seasonal dynamics of soil pH, moisture content, bulk density, and temperature in wetlands with different vegetation types in the Minjiang Estuary wetland.
For soil pH, moisture and bulk density, differences among seasons within the same soil layer are indicated by uppercase letters (P < 0.05), while differences among soil layers within the same season are indicated by lowercase letters (P < 0.05). For soil temperature, differences among seasons are indicated by uppercase letters (P < 0.05), and differences among vegetation types are indicated by lowercase letters (P < 0.05).
2.3 Determination of soil properties
2.3.1 Determination of carbon concentration in vegetation organs and soils
Three subsamples of each organ type were used for carbon analysis, totaling 324 vegetation samples (K. candel: 3 plots × 4 organs × 3 replicates × 4 seasons; P. australis: 3 plots × 3 organs × 3 replicates × 4 seasons; C. malaccensis: 3 plots × 2 organs × 3 replicates × 4 seasons). For soil, 576 subsamples were analyzed (4 vegetation types × 3 plots × 4 soil layers × 4 seasons × 3 replicates). All subsamples were oven-dried to constant weight (48 h), ground to pass a 0.149 mm sieve, and treated with 0.5 mol L-1 HCl to remove inorganic carbon. Dried plant (0.75 g) and soil (0.25 g) samples were analyzed for organic carbon using a carbon-nitrogen analyzer (Model: Vario MAX CN, Elementar Analysensysteme GmbH, Langenselbold, Germany).
2.3.2 Determination of soil pH
Soil pH was measured by weighing 3.00 g of air-dried, sieved soil into a 10 mL centrifuge tube, to which 7.5 mL of deionized water was added (soil-to-water ratio of 1:2.5, w/v). The suspension was thoroughly shaken, allowed to settle, and the pH was determined using a pH meter (Model: OHAUS, USA).
2.3.3 Determination of soil bulk density and soil moisture
Soil bulk density was determined using the ring core method (Walter et al., 2016). Soil sample rings were dried in an oven at 105°C to constant weight. Bulk density (g cm-3) was calculated as the dry soil mass (total mass minus sample ring mass) divided by the sample ring volume (100 cm³). Soil moisture content (%) was determined on subsamples from the same soil cores using the gravimetric method, i.e., fresh samples were weighed, oven-dried at 105°C to constant weight, and re-weighed; Values were expressed as gravimetric moisture.
2.4 Estimation of biomass and carbon stocks
2.4.1 Calculation of vegetation biomass
The plant samples were thoroughly cleaned to remove residual plant and animal residues, and surface soil. They were then pre-dried in an oven at 105°C for 2 hours and dried at 85°C until a constant weight was achieved (48 hours). Each organ was weighed, and the dry weight (g) was recorded. The sum of the dry weights of all organs constituted the total biomass of the entire K. candel. Trunk biomass was estimated by calculating trunk volume and multiplying it by trunk wood density, assuming the trunk to be cylindrical in shape. Trunk volume (cm3) was calculated using the formula: volume (cm3) = π × (diameter (cm))2 × height (cm).
Trunk density (g cm-3) was determined as the ratio of the dry weight of a non-destructively sampled trunk segment to its measured volume (Risti et al., 2024). The dry weight of the trunk sample was obtained by drying it at 85°C until constant weight. Its volume was measured using the water displacement method: a beaker with a known volume of water was placed on an electronic balance, and the trunk segment was fully submerged using a needle to prevent floating or overflow. The change in water weight was recorded, and since the density of water is 1 g cm-3, this mass change directly equaled the volume displaced. The branch biomass of K. candel was estimated as the product of the number of branches recorded using the branching classification theory (Jin et al., 2012) and the dry weight of representative branches, which were cut, oven-dried, and weighed to determine the average branch diameter for the entire tree. Similarly, the leaf biomass was calculated as the product of the number of branches obtained using the same classification theory (Jin et al., 2012).
Leaf biomass was calculated by multiplying the number of branches (from the same branching classification) by the total dry weight of all leaves collected from the representative branches. Belowground root biomass was estimated using the standard root excavation method (Zhou et al., 2019). The dry weight of the excavated root sample was divided by the proportion of the root circumference excavated (typically one-fourth) to approximate the total root biomass for each plant.
For the herbaceous plants P. australis and C. malaccensis, the total biomass of P. australis was determined as the sum of the dry weights of all roots, stems, and leaves collected within the sampling plots after oven drying and weighing. The total biomass of C. malaccensis was calculated as the sum of the dry weights of all roots and stems collected within the sampling plots after oven drying and weighing.
2.4.2 Calculation of carbon stock
Vegetation carbon stock was estimated by summing the carbon stocks of different plant organs within each ecosystem. The carbon stock of each organ was calculated as the product of its biomass and its organic carbon content, converted to a carbon fraction according to Equation 1:
where Cv is the vegetation carbon stock (t C ha-1); n is the number of plant organs considered (four for K. candel, three for P. australis, and two for C. malaccensis); Bo represents the biomass of each organ (t ha-1); and CFo denotes the carbon fraction of each organ. Soil organic carbon stock was calculated by summing the organic carbon stocks of different soil layers within each ecosystem. The carbon stock of each layer was computed as the product of soil bulk density and carbon concentration, as shown in Equation 2:
where Cs is the soil carbon stock (t C ha-1); Dl is the bulk density of the lth soil layer (g cm-3); El is the thickness of the lth soil layer (cm); and Cl is the carbon concentration of the lth soil layer (mg g-1).
The total ecosystem carbon stock was calculated as the sum of vegetation and soil carbon stocks using Equation 3:
where Ct represents the total ecosystem carbon stock (t C ha-1); Cv is the vegetation carbon stock (t C ha-1); and Cs is the soil carbon stock (t C ha-1).
2.5 Statistical analysis
All data were processed using Microsoft Office Excel 2021. One-way analysis of variance (one-way ANOVA) was applied to test the differences in carbon-related parameters among different plant organs within the same season, as well as among different seasons for the same organ, and among different soil layers within the same season, and among different seasons for the same soil layer. A three-way ANOVA was used to examine the effects of vegetation type, season, organ, and their interactions on vegetation and soil layer parameters. Correlation analysis was conducted to evaluate the relationships between carbon stocks and environmental factors across different vegetation types and carbon stock layers. All graphical visualizations were created using Origin 2021. Results are presented as mean ± standard deviation.
3 Results
3.1 Carbon stocks in wetland vegetation types in the Minjiang Estuary wetland
As illustrated in Table 2, vegetation type, season, and plant organ significantly influenced vegetation biomass, organic carbon content, and carbon stock (P < 0.05), whereas seasonal variation alone did not significantly affect vegetation biomass. In addition, all two-way interactions between vegetation type, season, and organ, as well as the three-way interaction among the three factors, had significant effects on vegetation layer parameters (P < 0.05).
Table 2
| Factor | Biomass | Organic carbon content | Carbon stock |
|---|---|---|---|
| Vegetation type | 71.92** | 16.75** | 57.74** |
| Season | 2.71 | 733.03** | 35.67** |
| Organ | 5.91* | 27.23** | 3.75* |
| Vegetation type × Season | 9.52** | 37.79** | 10.16** |
| Vegetation type × Organ | 31.81** | 22.26** | 19.28** |
| Season × Organ | 3.99** | 2.75* | 2.35* |
| Vegetation type × Season × Organ | 2.44* | 46.51** | 5.12** |
Three-way ANOVA results (F-values) for the effects of vegetation type (df = 3), season (df = 3) and organ (df = 3), and their interaction on vegetation layer biomass, organic carbon content, and carbon stock in the Minjiang Estuary Wetland.
*, P < 0.05; **, P < 0.01.
As illustrated in Figure 2, the mean annual biomass ranked as C. malaccensis (24.30 t ha-1) > P. australis (21.17 t ha-1) > K. candel (15.14 t ha-1). Seasonal variations differed markedly: biomass in K. candel wetlands increased steadily throughout the year, whereas P. australis wetlands experienced a gradual decline over the seasons. In contrast, C. malaccensis wetlands displayed a unimodal pattern, peaking in autumn, indicating a strong seasonal growth response. Significant vertical differences were also observed among wetland types. K. candel consistently allocated more biomass aboveground than belowground, with branches particularly dominating over roots, highlighting aboveground structural investment. In P. australis wetlands, root biomass exceeded aboveground biomass only in spring, while aboveground biomass dominated in other seasons. C. malaccensis wetlands showed greater root biomass than stem biomass in most seasons, except for autumn when stem growth was particularly pronounced, reflecting seasonal shifts in biomass allocation strategies.
Figure 2
Responses of vegetation organs to seasonal dynamics of K. candel, P. australis and C. malaccensis in wetland of Minjiang Estuary. (A–C) show the sum vegetation biomass of different plant organs. Bars indicate mean values and error bars represent standard deviation (n = 3). Different capital letters indicate significant differences among different seasons in the same organ, and different lowercase letters indicate significant differences in different organs in the same season (P < 0.05).
As illustrated in Figure 3, mean organic C content ranked as K. candel (519.95 mg g-1) > P. australis (479.10 mg g-1) > C. malaccensis (456.42 mg g-1). Seasonally, all three vegetation types followed the same pattern, with organic C peaking in autumn and declining toward summer, indicating strong seasonal influences on carbon accumulation (P < 0.05). Among plant organs, K. candel leaves consistently contained higher organic C content than stems and roots, reflecting preferential aboveground carbon allocation. (Figure 3A). In contrast, P. australis leaves recorded the lowest C content value in winter at 390.05 mg g-1 (P < 0.05, Figure 3B), reflecting variations in carbon content across different organs and seasons. Such seasonal variations also highlight clear organ-specific patterns of carbon allocation. In K. candel, leaves consistently contained more organic C content than stems and roots, reflecting preferential aboveground carbon allocation. P. australis displayed the lowest leaf carbon during winter, highlighting organ and season-specific variations. Both K. candel and P. australis generally exhibited higher organic C content in aboveground organs compared to belowground roots, whereas C. malaccensis showed a more balanced carbon distribution between aboveground and belowground parts throughout the year.
Figure 3
Responses of vegetation organs to seasonal dynamics of K. candel, P. australis and C. malaccensis in wetland of Minjiang Estuary. (A–C) show mean organic carbon content of different plant organs. Bars indicate mean values and error bars represent standard deviation (n = 3). Different capital letters indicate significant differences among different seasons in the same organ, and different lowercase letters indicate significant differences in different organs in the same season (P < 0.05).
As illustrated in Figure 4, mean vegetation C stock ranked as C. malaccensis (11.59 t C ha-1) > P. australis (9.94 t C ha-1) > K. candel (7.95 t C ha-1). All three vegetation types showed significantly higher carbon stocks in autumn compared to other seasons, reflecting strong seasonal accumulation patterns. Organ-specific analysis revealed that, for all vegetation types, aboveground carbon stocks generally exceeded belowground stocks. In K. candel, the branches consistently contributed the largest share of carbon stock (39.18%-41.02%) throughout all seasons. In P. australis, root carbon stock peaked in spring (4.79 t C ha-1) (Figure 4B), while stem and leaf carbon stocks reached their maximum in autumn at 10.00 and 2.66 t C ha-1, respectively (P < 0.05). In contrast, C. malaccensis displayed a seasonal redistribution of carbon: stem carbon exceeded root carbon in autumn, whereas roots accounted for the majority of total vegetation carbon in other seasons (56.03%-74.79%), reflecting flexible biomass allocation strategies in response to seasonal growth dynamics.
Figure 4
Responses of vegetation organs to seasonal dynamics of K. candel, P. australis and C. malaccensis in wetland of Minjiang Estuary. (A–C) show the sum vegetation carbon stock of different plant organs. Bars indicate mean values and error bars represent standard deviation (n = 3). Different capital letters indicate significant differences among different seasons in the same organ, and different lowercase letters indicate significant differences in different organs in the same season (P < 0.05).
3.2 Soil carbon stocks in wetland vegetation types the Minjiang Estuary wetland
As illustrated in Table 3, vegetation type, season, and soil layer had highly significant effects on bulk density, soil organic carbon concentration, and soil organic carbon stock (P < 0.01), except that soil layer alone had no significant influence on total soil C. The interaction between vegetation type and season had a highly significant effect on soil bulk density (P < 0.01). Moreover, all two-way interactions among vegetation type, season, and soil layer, as well as the three-way interaction among the three factors, significantly influenced total soil C and SOC (P < 0.05).
Table 3
| Factor | Soil organic carbon concentration | Soil organic carbon stock |
|---|---|---|
| Vegetation type | 409.38** | 228.64** |
| Season | 46.92** | 25.64** |
| Soil layer | 1.15 | 10.66** |
| Vegetation type × Season | 70.32** | 56.23** |
| Vegetation types × Soil layer | 2.90* | 4.14** |
| Season × Soil layer | 3.33* | 2.03* |
| Vegetation type × Season × Soil layer | 2.08* | 1.82* |
Three-way ANOVA results (F-values) for the effects of vegetation type (df = 3), season (df = 3) and soil layer (df = 3), and their interaction on soil organic carbon concentration and soil organic carbon stock, respectively, in the Minjiang Estuary Wetland.
*, P < 0.05; **, P < 0.01.
As illustrated in Figure 5, the soil organic carbon concentration across the four vegetation types ranked as K. candel (19.64 mg g-1) > C. malaccensis (17.78 mg g-1) > P. australis (14.40 mg g-1) > Tidal flat (5.62 mg g-1). Seasonal dynamics differed among vegetation types. In K. candel wetlands, SOC in the topsoil (0–20 cm) peaked in spring, while in C. malaccensis and the deeper layers of P. australis wetlands, SOC reached its maximum in autumn, reflecting seasonal accumulation patterns that varied with vegetation type and soil depth. In the unvegetated Tidal flat, SOC was highest in summer, indicating the strong influence of environmental factors in the absence of vegetation. Vertically, SOC concentration in K. candel wetland was highest in the 20–40 cm layer (Figure 5B), whereas in the herbaceous wetlands (P. australis and C. malaccensis), the highest SOC concentration occurred in the surface layer (0–20 cm). By contrast, in the unvegetated Tidal flat, SOC increased with depth, with the deepest layer containing the most carbon, reflecting distinct carbon accumulation patterns in the absence of plant cover.
Figure 5
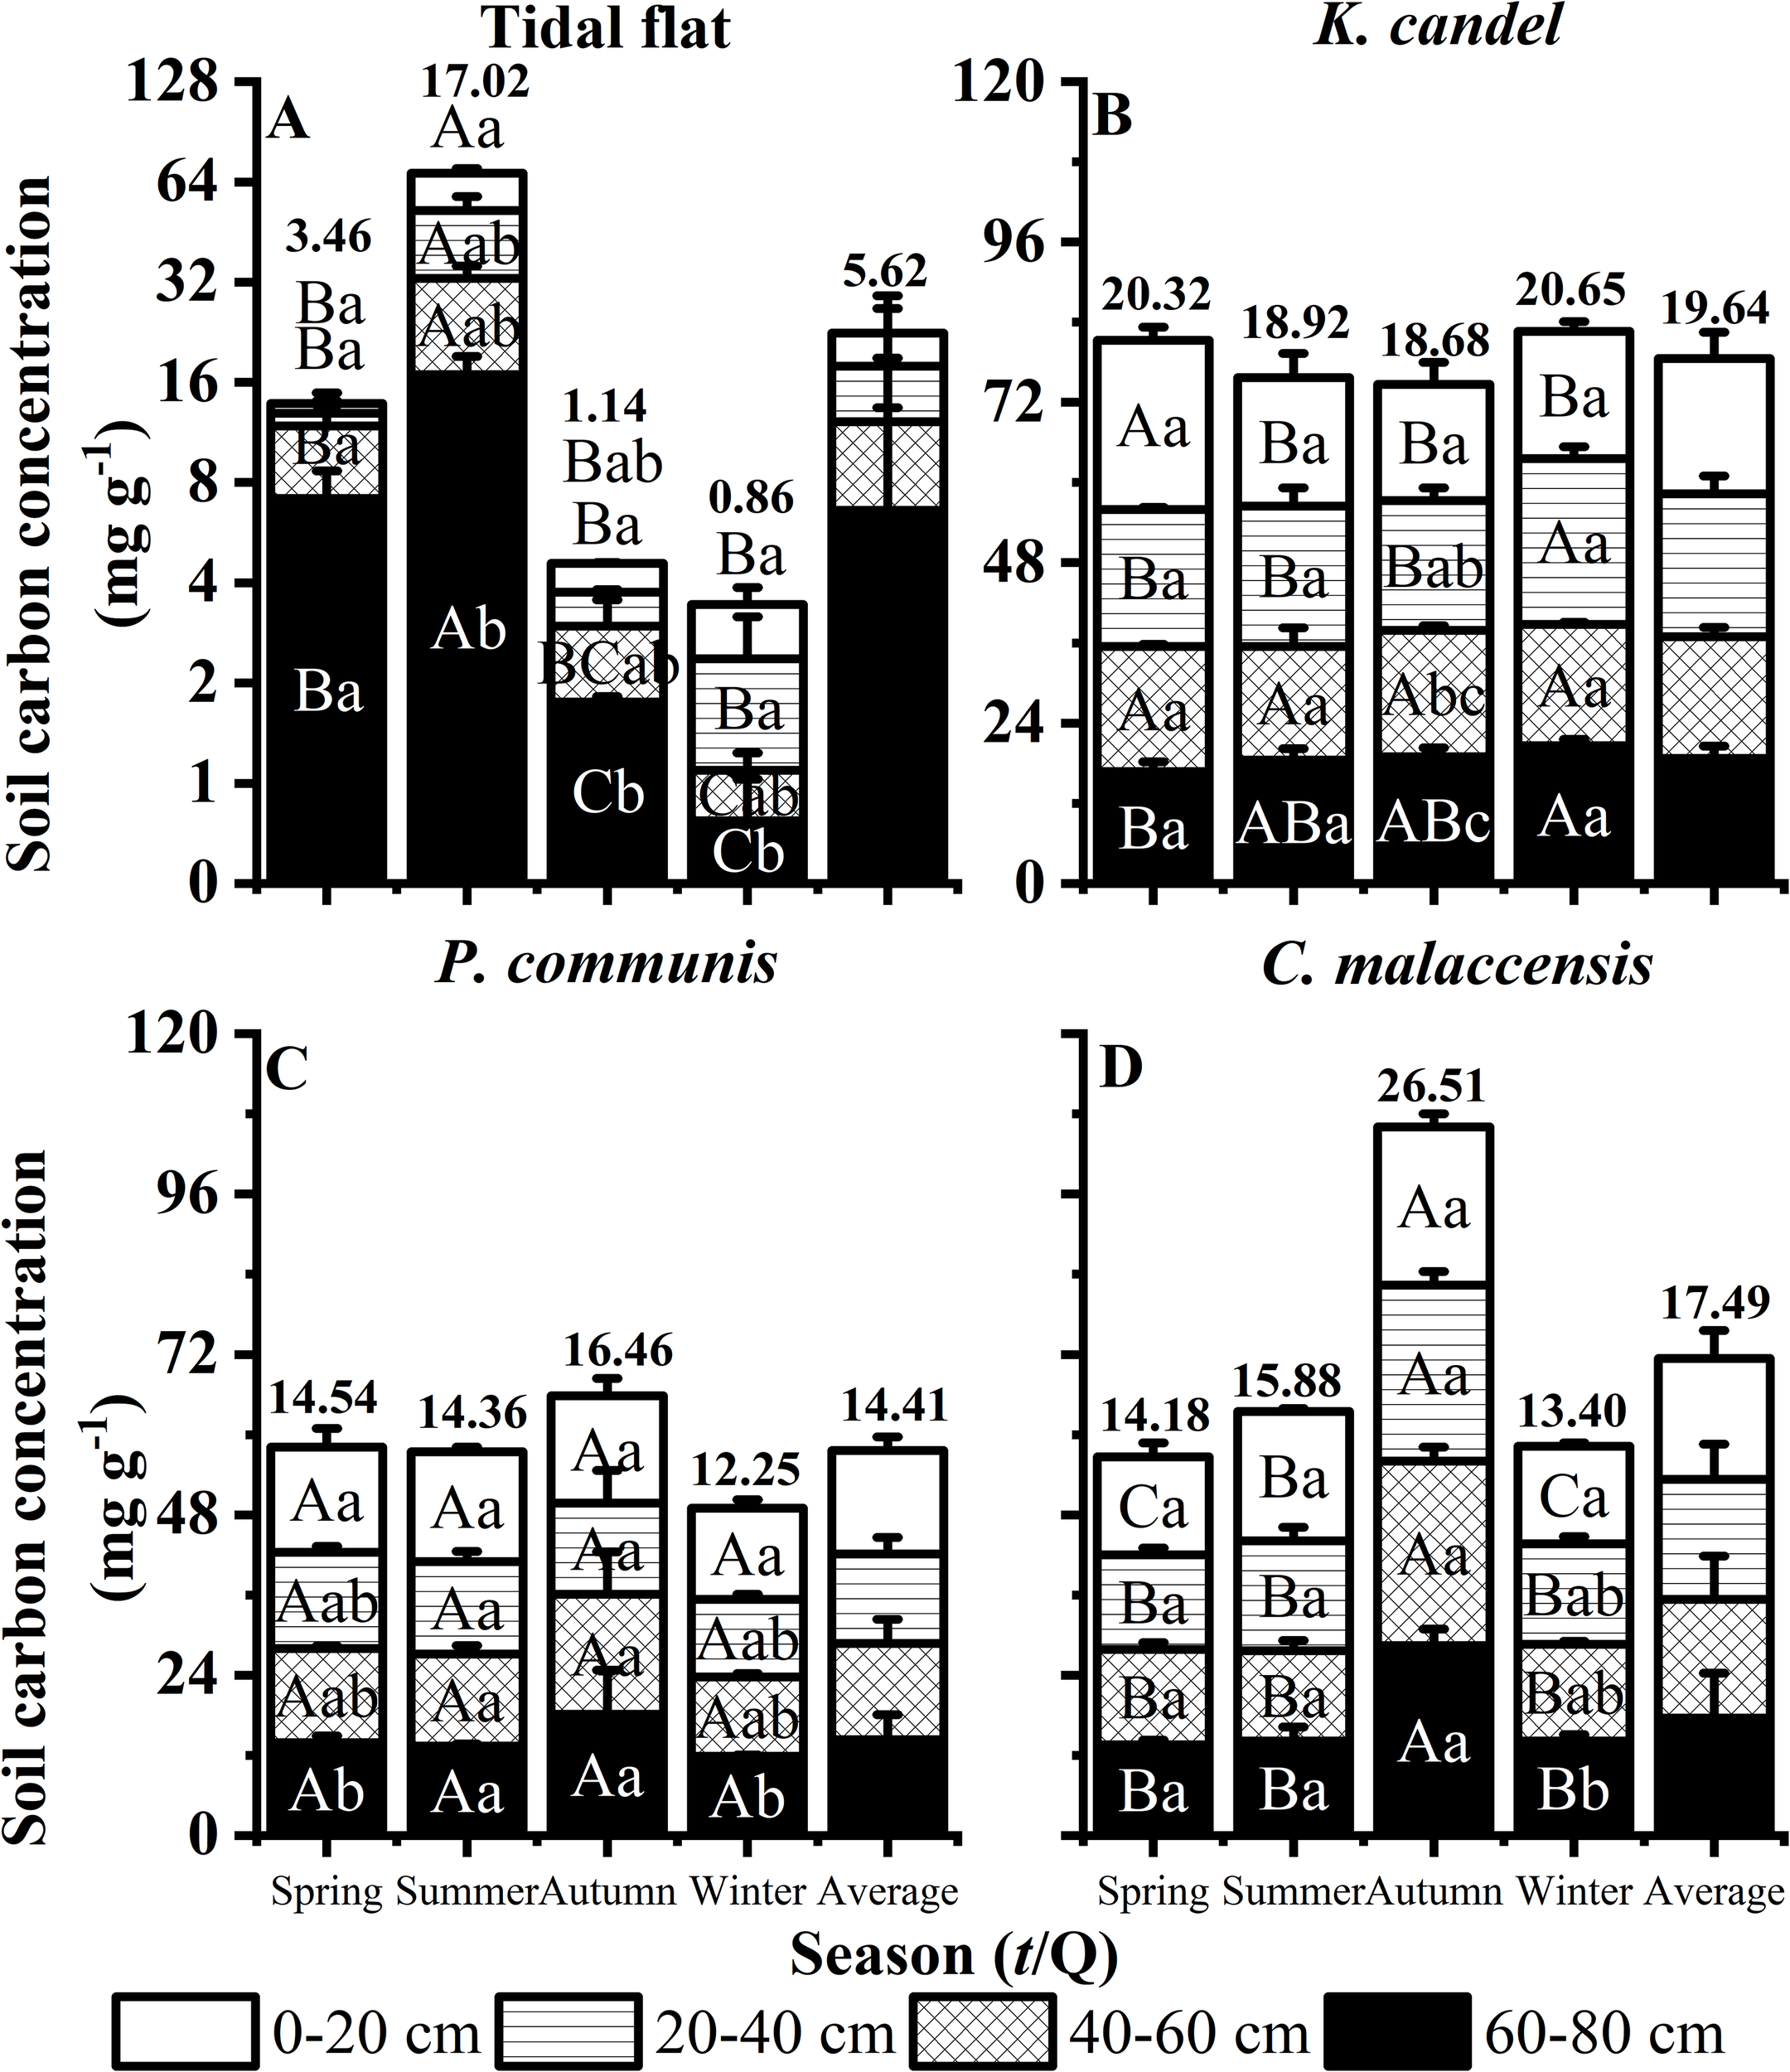
Responses of soil layers to seasonal dynamics of the Tidal flat, K. candel, P. australis and C. malaccensis in the wetland ecosystem of the Minjiang Estuary. (A–D) show the mean soil carbon concentration of different soil layers. Bars show mean values and error bars indicate standard deviation (n = 3). Different uppercase letters indicate significant differences among different seasons in the same soil layer, and different lowercase letters indicate significant differences among soil layers within the same season (P < 0.05). Panels (A) display data with the y-axis transformed using a log2 scale to reduce skewness and improve visualization of values that differ by orders of magnitude, while the order panels display data on a normal continuous scale.
As illustrated in Figure 6, soil organic carbon (SOC) stock across the four wetland vegetation types ranked as K. candel (153.05 t C ha-1) > C. malaccensis (143.59 t C ha-1) > P. australis (118.49 t C ha-1) > Tidal flat (49.08 t C ha-1). This pattern indicates the strong carbon sequestration capacity of woody vegetation compared with herbaceous and bare surfaces. Seasonally, soil carbon stocks in all layers of P. australis and C. malaccensis wetlands accumulated significantly in autumn, suggesting enhanced litter input and slower decomposition during cooler and wetter conditions. In contrast, the Tidal flat reached its highest SOC stock in summer, likely reflecting short-term organic matter deposition driven by tidal dynamics rather than vegetation input. Vertically, SOC stock in K. candel wetlands was relatively enriched in the middle soil layer (20–40 cm), while in herbaceous wetlands, carbon decreased gradually with depth, consistent with surface-root biomass distribution. For the Tidal flat, SOC tended to increase in deeper layers during spring and autumn, indicating downward movement and burial of organic material in unvegetated sediments.
Figure 6
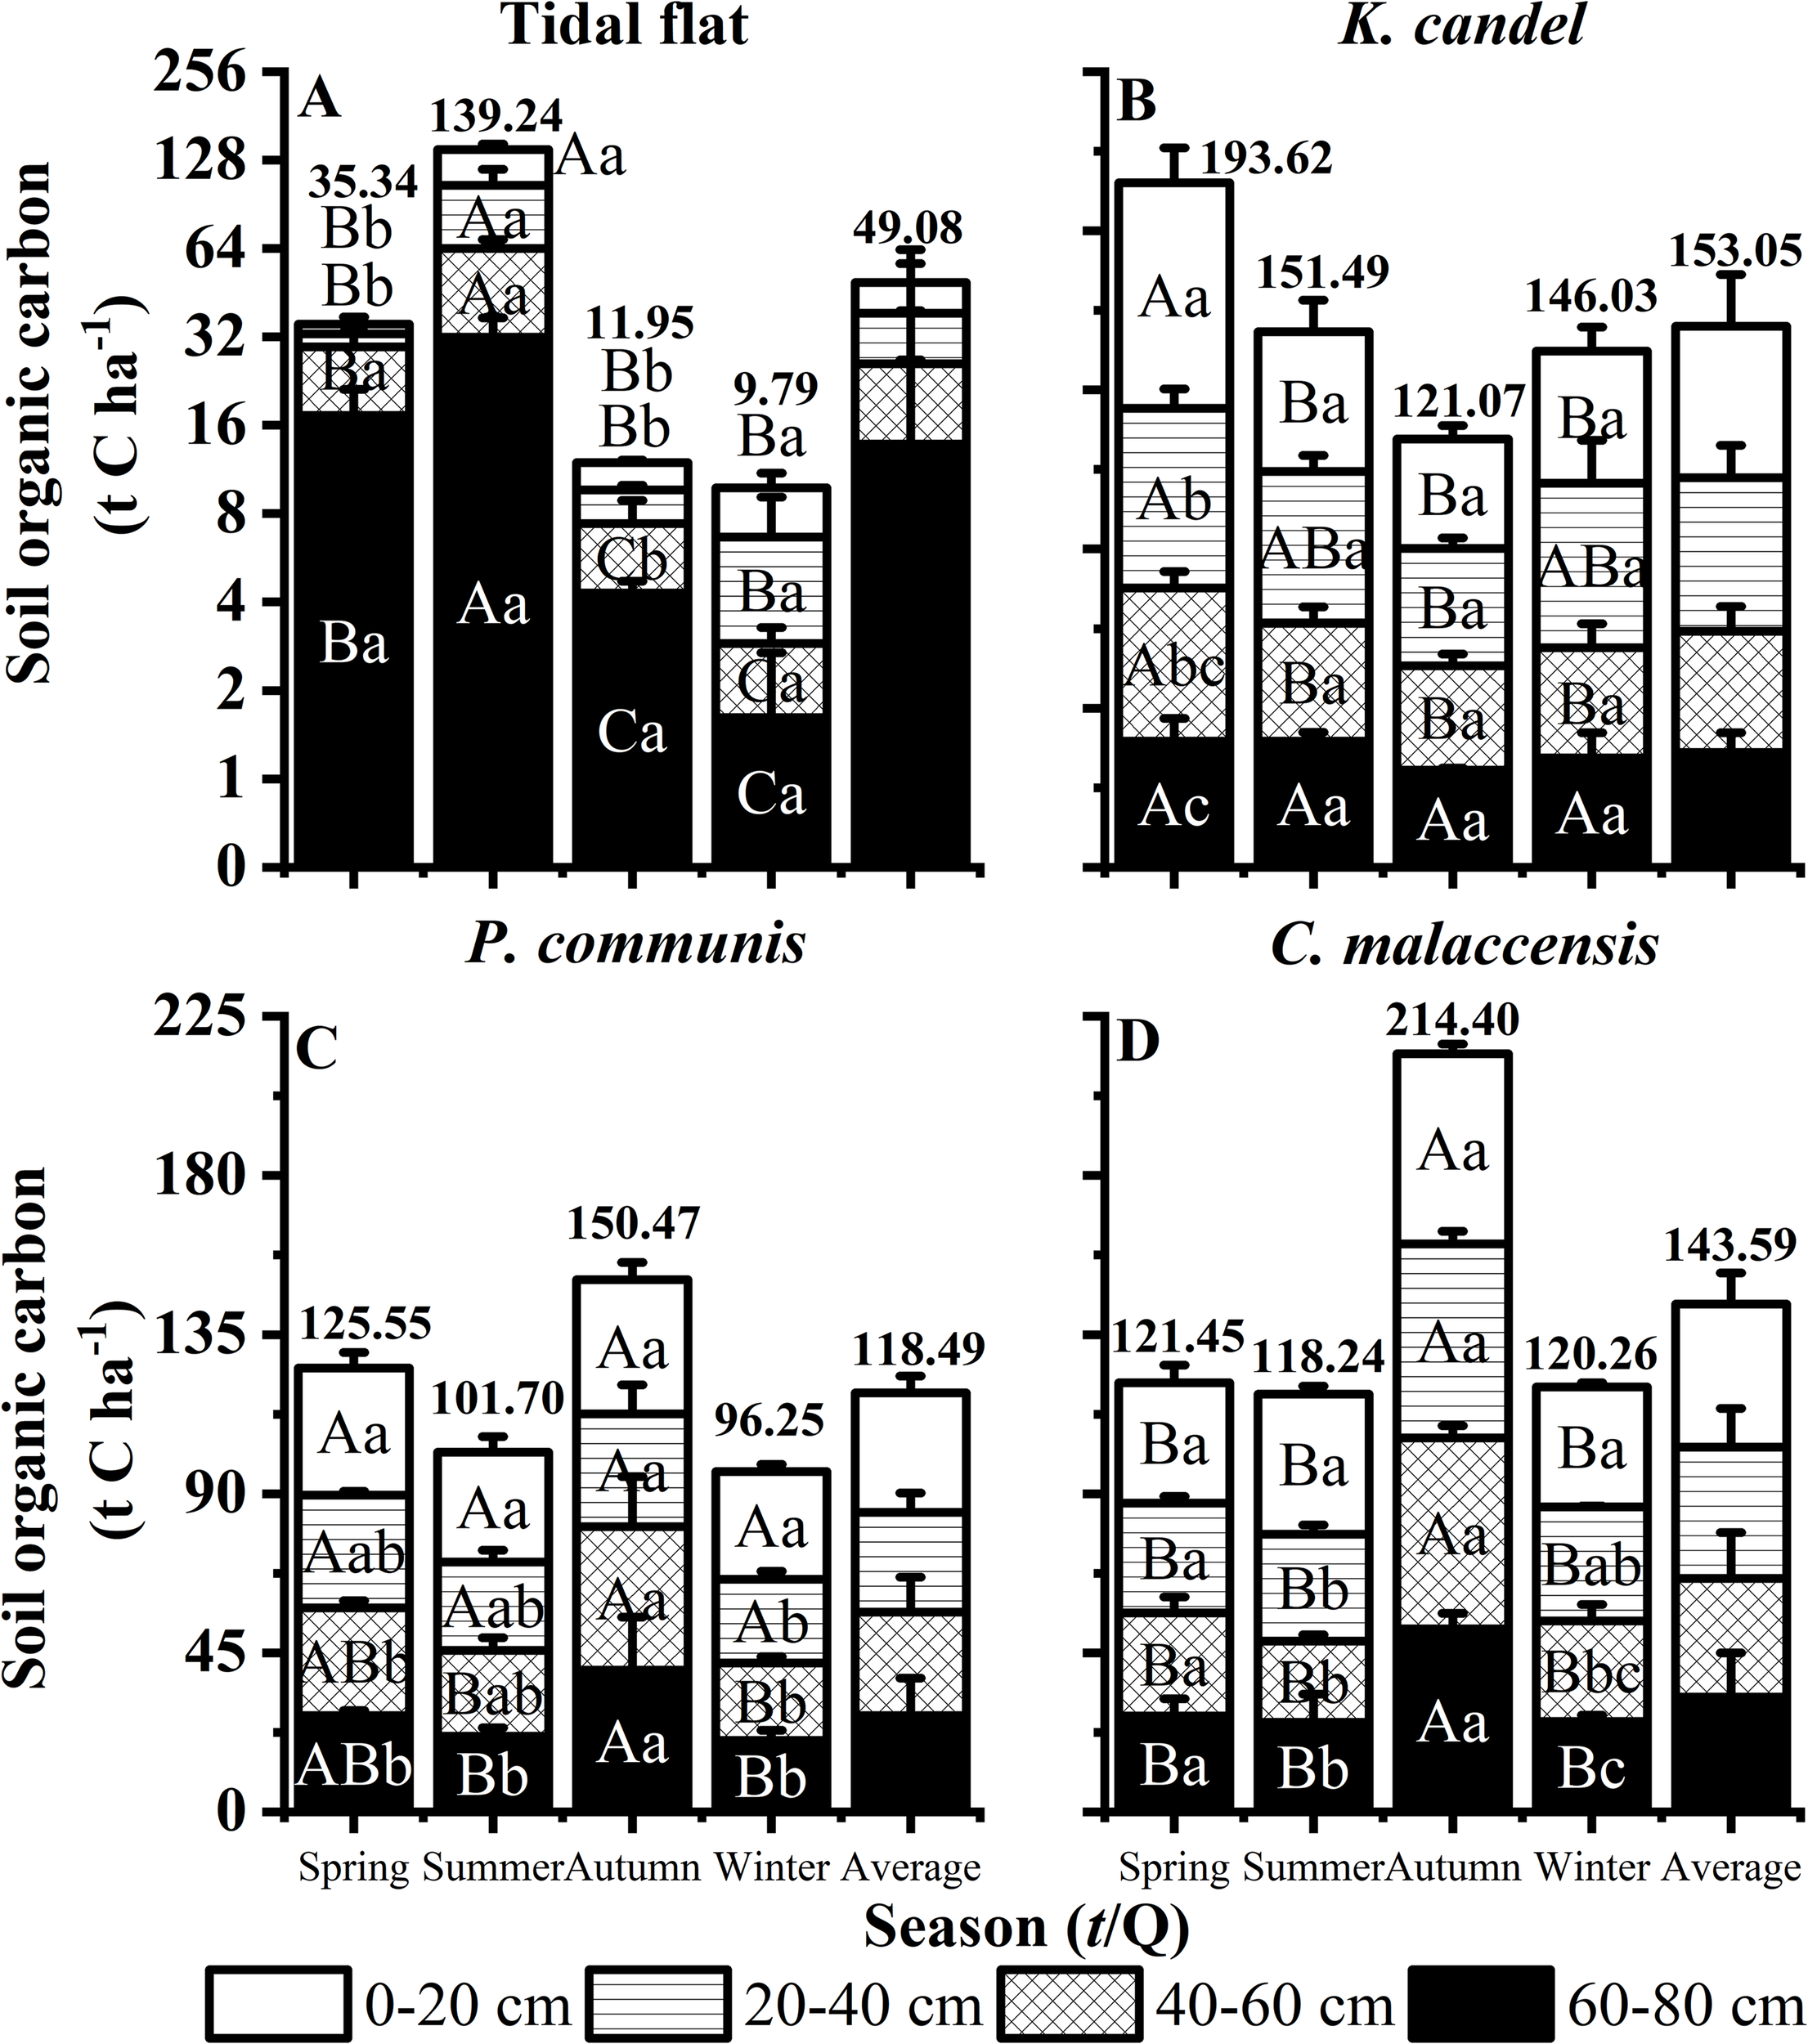
Responses of soil layers to seasonal dynamics of the Tidal flat, K. candel, P. australis and C. malaccensis in the wetland ecosystem of the Minjiang Estuary. (A–D) show the sum soil organic carbon of different soil layers. Bars show mean values and error bars indicate standard deviation (n = 3). Different uppercase letters indicate significant differences among different seasons in the same soil layer, and different lowercase letters indicate significant differences among soil layers within the same season (P < 0.05). Panels (A) display data with the y-axis transformed using a log2 scale to reduce skewness and improve visualization of values that differ by orders of magnitude, while the order panels display data on a normal continuous scale.
3.3 Ecosystem-level carbon stocks in vegetated and unvegetated wetlands in the Minjiang Estuary wetland
As depicted in Figure 7, the mean carbon stock of the four vegetation cover types in the Minjiang Estuary Wetland ecosystem followed the order: K. candel (161.00 t C ha-1) > C. malaccensis (155.18 t C ha-1) > P. australis (128.44 t C ha-1) > Tidal flat (49.08 t C ha-1). The composition of carbon stock in the three vegetated wetlands remained consistent, with SOC stock accounting for the overwhelming majority (92.23%-95.06%), which underscores the critical role of soil in carbon accumulation. Seasonally, carbon stock in the K. candel wetland showed a slight decline followed by an increase in total carbon stock toward winter, while the Tidal flat exhibited the opposite pattern, with a summer maximum likely resulting driven by the pronounced seasonal changes in soil physicochemical properties under strong tidal influence. In contrast, C. malaccensis reached its highest ecosystem carbon stock in autumn, reflecting peak vegetation growth and litter input during that season. Across vegetation types, herbaceous wetlands (P. australis and C. malaccensis) maintained significantly higher vegetation carbon stocks than the mangrove K. candel (P < 0.05), primarily due to their higher aboveground biomass productivity. Nevertheless, K. candel and C. malaccensis wetlands consistently possessed substantially higher soil carbon stocks than the P. australis and Tidal flat sites, highlighting the superior carbon stock potential of woody vegetation systems in the Minjiang Estuary Wetland.
Figure 7
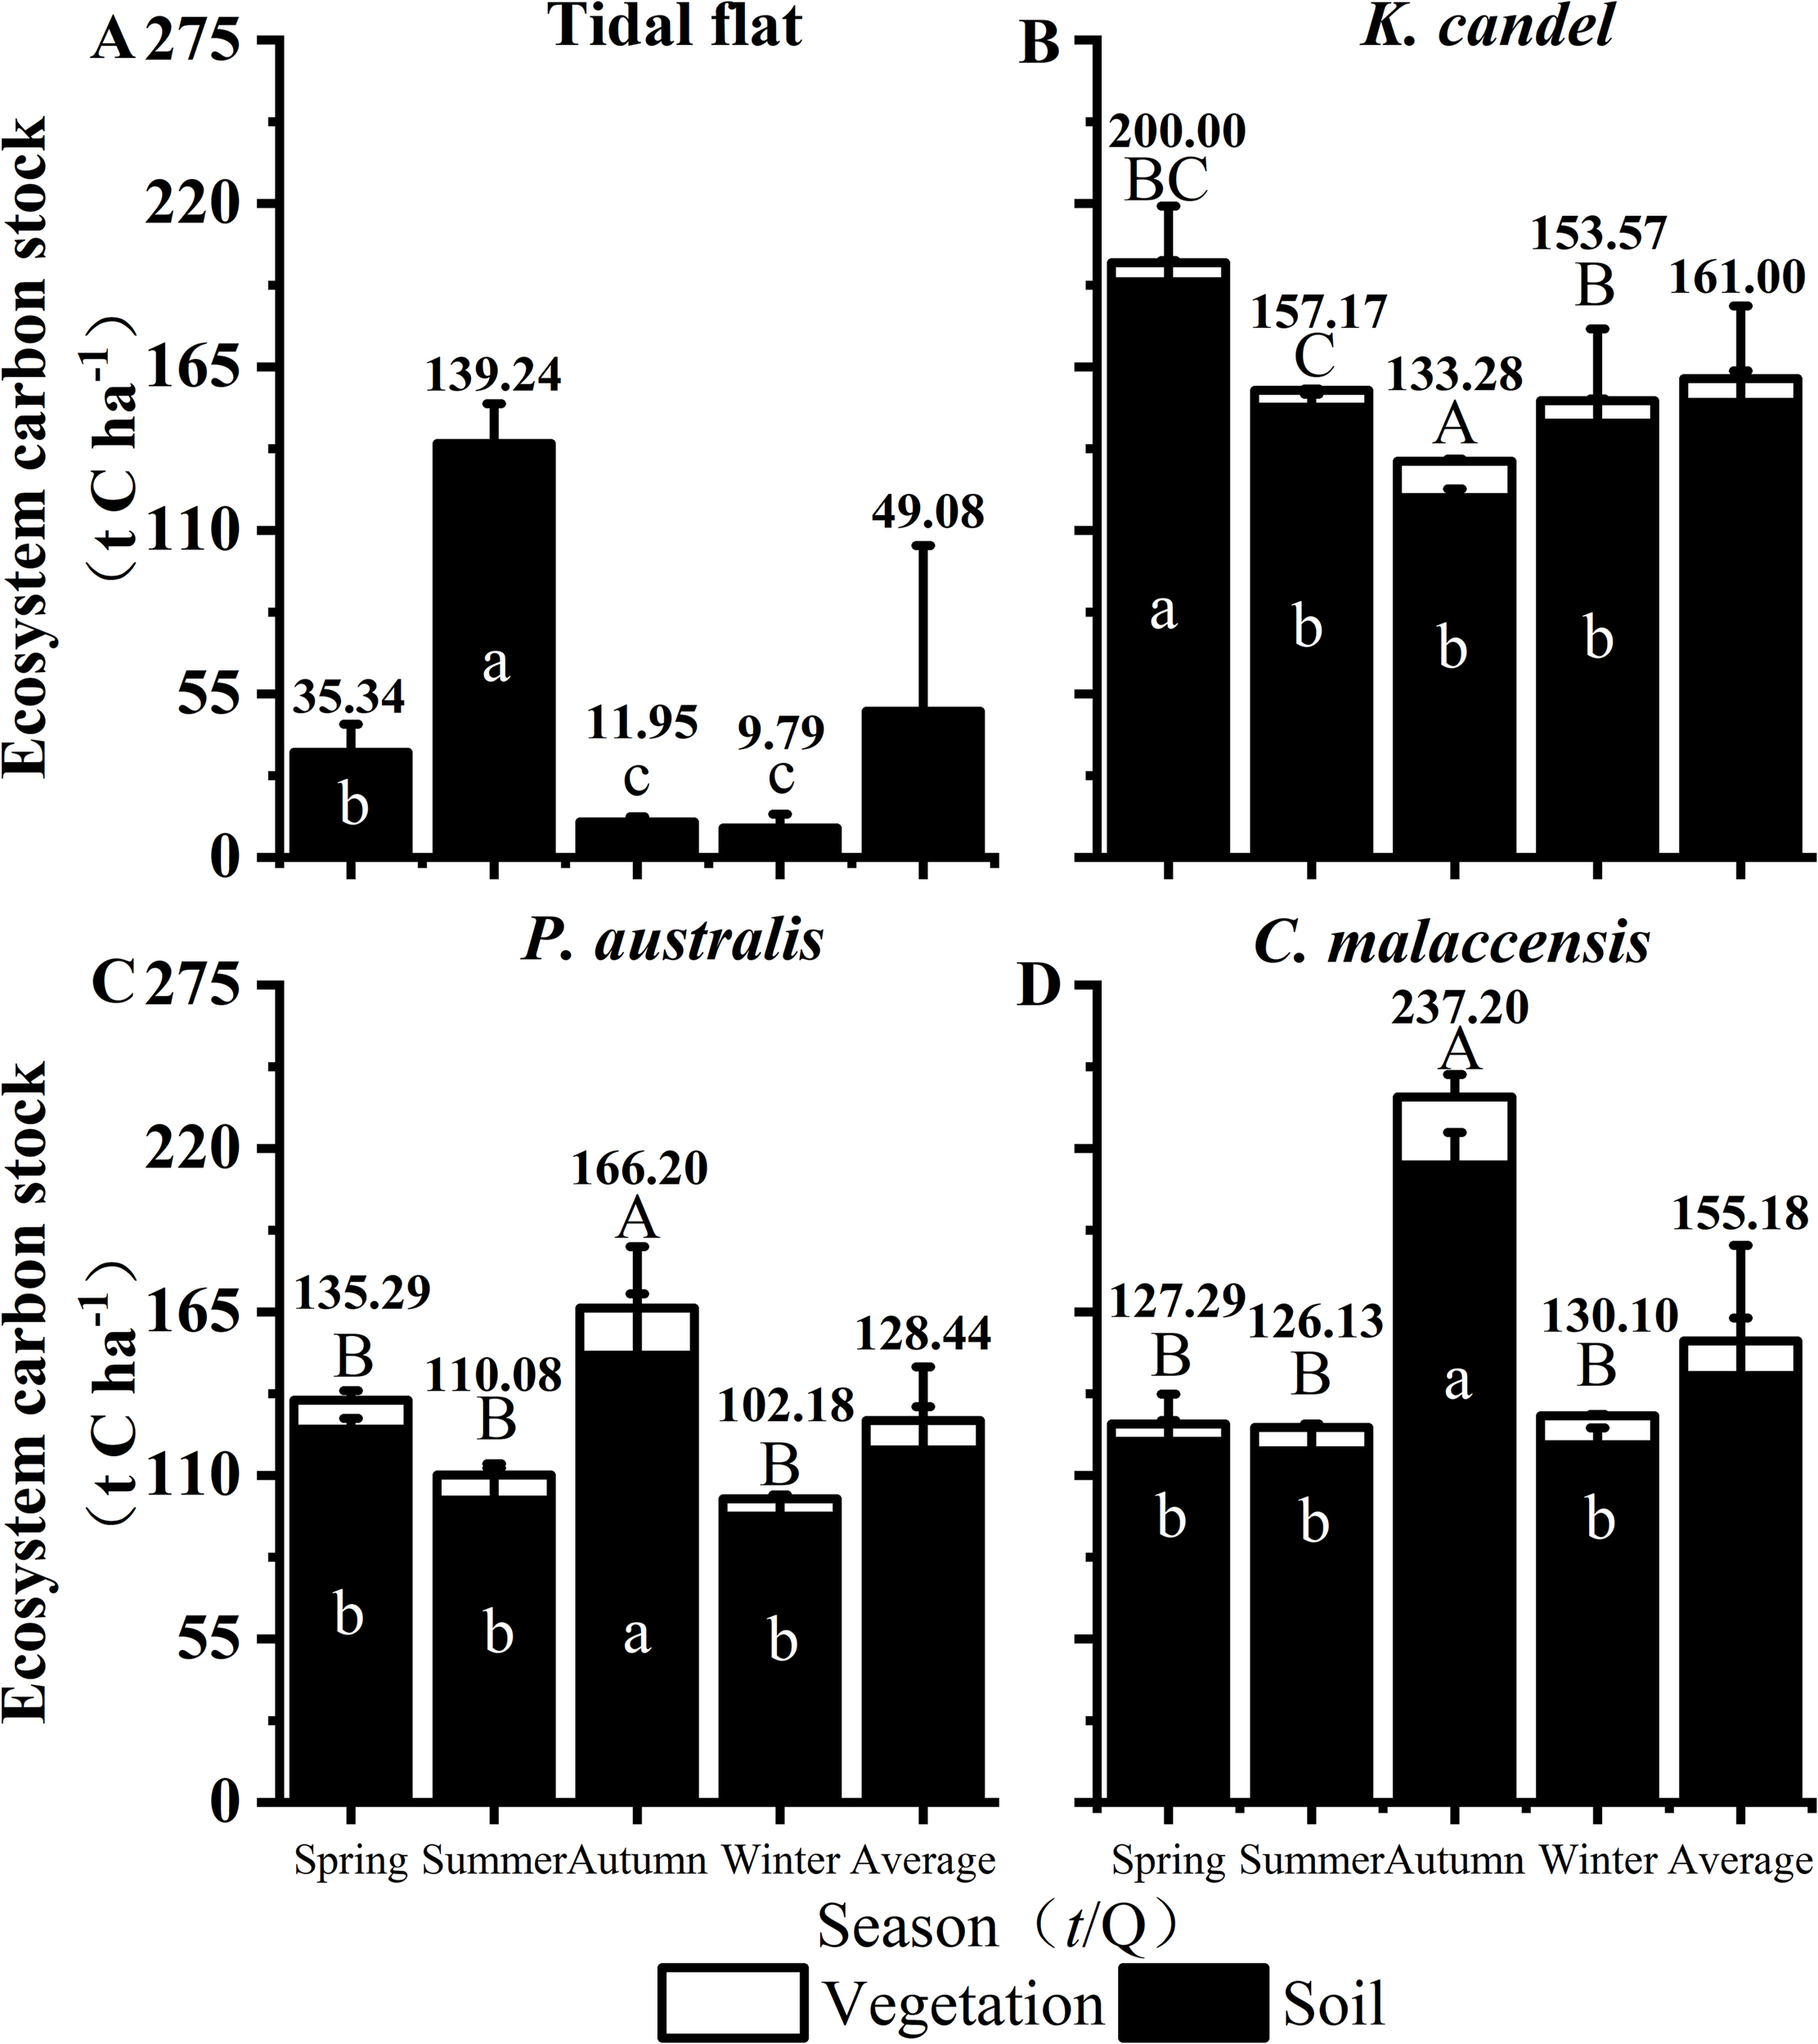
Response of ecosystem carbon stock of the Tidal flat, K. candel, P. australis and C. malaccensis in the wetland ecosystem of the Minjiang Estuary wetland. Bars show mean values and error bars represent standard deviation (n = 3). The values show the total ecosystem carbon stock for each vegetation type. Different capital letters indicate that the carbon stock of vegetation layer is significantly different among different seasons in the same vegetation type, and different lowercase letters indicate that the carbon stock of soil layer is significantly different among different seasons in the same vegetation type (P < 0.05).
3.4 Relationship between soil environmental factors and carbon stocks in different vegetation types of the Minjiang estuary wetland
Significant correlations were observed between carbon stocks at different ecosystem levels and soil environmental factors across wetland vegetation types (Table 4). Regarding soil pH, both soil and total ecosystem carbon stocks in the unvegetated Tidal flat exhibited highly significant negative correlations (P < 0.01), whereas all carbon stock levels in the P. australis wetland showed highly significant positive correlations with pH (P < 0.01). In the K. candel wetland, vegetation carbon stocks were significantly and positively correlated with pH, while total ecosystem carbon stocks exhibited a significant negative correlation. Soil moisture showed highly significant negative correlations with the soil and total ecosystem carbon stocks in K. candel wetlands and with all carbon stock levels in P. australis wetlands, but highly significant positive correlations with the soil and total ecosystem carbon stocks in the Tidal flat and with the vegetation carbon stock in C. malaccensis wetlands (P < 0.01).
Table 4
| Vegetation type | Carbon stock layers | pH | Soil moisture (%) | Soil bulk density (g cm-3) | Soil temperature (°C) |
|---|---|---|---|---|---|
| Tidal flat | Soil | -0.44** | 0.70** | -0.74** | 0.62** |
| Total Ecosystem | -0.45** | 0.77** | -0.76** | 0.74** | |
| K. candel | Vegetation | 0.58** | 0.16 | -0.52** | -0.27 |
| Soil | -019 | -0.59** | 0.83** | 0.43 | |
| Total Ecosystem | -0.43** | -0.68** | 0.88** | 0.38 | |
| P. australis | Vegetation | 0.53** | -0.38** | 0.57** | 0.35 |
| Soil | 0.57** | -0.51** | 0.57** | 0.34 | |
| Total Ecosystem | 0.65** | -0.50** | 0.57** | 0.38 | |
| C. malaccensis | Vegetation | 0.17 | 0.46** | -0.10 | 0.16 |
| Soil | 0.15 | 0.17 | 0.35* | 0.51 | |
| Total Ecosystem | 0.15 | 0.36* | 0.12 | 0.26 |
Correlation analysis between carbon stocks at different ecosystem layers and soil environmental factors across wetland types.
*, P < 0.05; **, P < 0.01.
Soil bulk density displayed highly significant negative correlations with certain carbon stock levels in the Tidal flat and K. candel wetlands, while showing significant (P < 0.05) or highly significant positive correlations with all carbon stock levels in P. australis wetlands and with the soil carbon stock in C. malaccensis wetlands. Soil temperature was significantly and positively correlated only with the soil and total ecosystem carbon stocks in the Tidal flat. Overall, the unvegetated Tidal flat was more sensitive to environmental fluctuations due to the lack of vegetation buffering, C. malaccensis wetlands exhibited greater resistance to environmental variation, and the relatively acidic and compact soil conditions in K. candel and P. australis wetlands may have suppressed carbon accumulation.
4 Discussion
4.1 Seasonal vegetation-layer carbon stocks in wetland vegetation types and growth cycles
Our results confirmed Hypothesis (i), which proposed that vegetation carbon stocks vary significantly across seasons among different wetland vegetation types. This variation is primarily driven by differences in plant growth rhythms and carbon allocation patterns among plant organs. Overall, herbaceous species exhibited greater vegetation carbon stocks than K. candel with the order of C. malaccensis > P. australis > K.candel (Figure 4). This hierarchy reflects the rapid growth and turnover strategies of herbaceous species, which enhance aboveground carbon sequestration. For instance, C. malaccensis exhibited peak stem biomass in autumn at 31.96 t ha-1 (Figure 2A), enhancing carbon sequestration through elevated photosynthetic productivity, while P. australis optimized carbon sequestration by improving photosynthetic efficiency in aboveground organs (stems and leaves) (Wersal et al., 2013). In contrast, K. candel exhibited a relatively lower vegetation carbon stock (7.95 t C ha-1), which was below the typical range reported for mangrove forests (12–15 t C ha-1; KhanETAL2007).This discrepancy may be attributed to the unstable hydrological conditions caused by frequent tidal inundation in the Minjiang Estuary. As shown in Table 1 and Table 4, soil pH values in the K. candel wetland were slightly lower than those in the herbaceous wetlands, and the vegetation carbon stock of K. candel showed a highly significant positive correlation with pH. The relatively acidic soil conditions likely constrained canopy vertical growth, in contrast to the more stable hydrological environment of the Manko Wetland in Okinawa (Khan et al., 2009).
Furthermore, the seasonal dynamics of vegetation carbon stocks also strongly supported Hypothesis (i). Across different vegetation cover types, the vegetation carbon stock showed a consistent seasonal “increase-then-decline” pattern, with clear peaks in autumn: C. malaccensis, followed by P. australis, and K. candel. This seasonal variation was strongly driven by organ-specific differences in organic carbon content. For example, the branch and leaf carbon contents of K. candel and the stem carbon content of C. malaccensis all peaked in autumn, reaching 786.95, 856.07, and 683.93 mg g-1 respectively (Figure 3). The elevated branch and leaf carbon contents in K. candel may result from nutrient resorption and carbon enrichment prior to leaf senescence (Khan et al., 2007), whereas the elevated stem carbon content in C. malaccensis likely results from the accumulation of non-structural carbohydrates (e.g., starch) in parenchyma cells as a strategy for overwintering (Wersal et al., 2013). Overall, the pronounced seasonal differences in carbon stock among vegetation types suggest that carbon accumulation patterns in wetland vegetation are closely regulated by species-specific growth rhythms and carbon allocation strategies. The widespread autumn peaks in vegetation carbon stocks reflect a strong coupling between the peak of plant growth and carbon fixation efficiency.
4.2 Seasonal and vertical variations in soil carbon stocks in wetland vegetation types
Our results (Figure 6) revealed pronounced seasonal variations in soil organic carbon (SOC) stocks among wetland vegetation types. Herbaceous wetlands dominated by P. australis and C. malaccensis showed substantial SOC accumulation in autumn, whereas the unvegetated tidal flat peaked in summer and the K. candel wetland in spring. These findings support Hypothesis (ii), suggesting that seasonal fluctuations in soil carbon stocks are primarily regulated by the physicochemical characteristics of different wetland types. In the unvegetated Tidal flat, soil pH and bulk density were lowest in summer, coinciding with the highest soil moisture and temperature (Table 1). Correlation analysis (Table 4) showed strong negative relationships between SOC and both pH and bulk density, and positive correlations with moisture and temperature. Elevated temperature and moisture combined with tidal sediment inputs likely enhanced carbon accumulation, while lower pH suppressed organic matter mineralization, favoring SOC retention (Guo et al., 2024). Reduced bulk density, reflecting greater porosity, further promotes the physical protection of surface organic matter (Dong et al., 2022). These results align with the understanding that hydrology, soil properties, and temperature jointly regulate SOC dynamics in coastal wetlands (Xia et al., 2022). Similar summer SOC peaks in bare tidal flats have been observed elsewhere; For example, Shao et al. (2015) reported that SOC in unvegetated Tidal flats of Hangzhou Bay peaked in summer due to tidal deposition. In vegetated wetlands, seasonal trends in soil pH and moisture generally followed a “rise-then-decline” pattern, while bulk density varied among vegetation types-K. candel wetland bulk density showed a “decrease then increase” pattern, reaching its minimum in autumn. The two herbaceous wetlands had their lowest bulk densities in summer. According to Table 4, SOC stocks in all three vegetated wetlands were significantly negatively correlated with bulk density (Dong et al., 2022). Lower bulk density is typically associated with greater porosity and better conditions for carbon retention near the soil surface (Ahn and Jones, 2013; Wang and Jiao, 2016). In K. candel wetland, despite minimum bulk density in autumn, SOC was lowest in that season- possibly reflecting reduced organic carbon input or increased tidal disturbance during that period, though seasonal density dynamics (e.g. swelling and shrinking) have been documented in other landscapes (Mora and Lázaro, 2014).
This study supports Hypothesis (ii), indicating that soil carbon stocks decline with depth. In herbaceous wetlands dominated by P. australis and C. malaccensis, SOC decreased sharply with depth, reflecting limited belowground inputs and slower carbon turnover in deeper horizons (Ji et al., 2020). In contrast, the unvegetated Tidal flat exhibited a subsurface SOC maximum (6.60 mg g-1 at 60–80 cm; Figure 5A), likely due to long-term sediment deposition and stabilization of mineral-associated carbon, consistent with Yancheng coastal wetlands (Quan and Yan, 2010). The lack of vegetation limits surface inputs, yet dense soil structure, high bulk density (1.28 g cm-3; Table 1), and low winter temperatures suppressing microbial activity collectively favor deep carbon preservation (Xu et al., 2014; Perillo et al., 2019). Periodic inundation may further influence soil texture through hydraulic sorting, thereby regulating the relationship between bulk density and SOC (Amendola et al., 2018).Compared with these systems, the K. candel wetland showed a distinctive carbon enrichment at 20–40 cm depth (28.33%), indicating enhanced mid-depth carbon stabilization compared with herbaceous and unvegetated wetlands. Contrasting with Risti et al. (2024), who observed surface-dominated SOC (0–10 cm) in K. candel wetlands on Payung Island, but agrees with broader evidence that mangrove wetlands often exhibit deeper carbon storage profiles (0–30 cm) than freshwater or salt marsh systems (Blum, 2020). Such deeper distribution likely arises from extensive aerial root systems and high belowground biomass that promote vertical carbon migration and stabilization (Zhang et al., 2023). Moreover, the K. candel wetland exhibited the lowest bulk density at 0.97 g cm-3 while maintaining the highest soil organic carbon content at 19.64 mg g-1 (Table 1, Figure 5B), suggesting that high primary productivity, litter inputs, and root exudates facilitate aggregate formation and physically protect organic carbon (Li et al., 2009; Wang and Jiao, 2016).
These observations provide empirical support for horizon-specific management strategies, such as targeted biochar amendments or other soil amendments in the 20–40 cm layer, to further stabilize mineral-associated carbon and enhance mid-depth carbon sequestration in mangrove wetlands (Liu et al., 2024a; Pei et al., 2025). Seasonal microbial activity interacting with soil structure may further reinforce this stabilization (Yang et al., 2025), highlighting the potential of “20-40 cm layer regulation” as a practical management approach.
4.3 Ecosystem-level carbon stocks between vegetated and unvegetated wetlands
The results support hypothesis (iii), indicating that vegetated wetlands exhibited significantly higher ecosystem carbon stocks than unvegetated Tidal flat, with distinct seasonal peaks among different vegetation types. Specifically, K. candel, C. malaccensis, and P. australis wetlands had significantly greater than those of Tidal flat (P < 0.05), consistent with the findings of Yoo et al. (2022) and Zhang et al. (2017). Vegetation cover enhances wetland carbon sequestration through root inputs, litter decomposition, and photosynthetic carbon fixation. Among them, woody wetlands (K. candel) promote soil carbon stabilization via extensive root systems and lignified litter, resulting in greater carbon accumulation in deeper layers (Sjögersten et al., 2021). In contrast, herbaceous wetlands, despite higher aboveground vegetation carbon stocks, exhibited relatively lower soil carbon, likely owing to shallower rooting systems and more labile litter. Overall, soil carbon dominated the ecosystem carbon pool, following the order K. candel > C. malaccensis > P. australis > Tidal flat, in agreement with Ji et al. (2020) and Zhang et al. (2023), who emphasized that deep rooting and abundant litter inputs are key drivers of soil carbon accumulation in woody wetlands. The low carbon stock observed in Tidal flat was mainly attributed to limited organic matter inputs and tidal erosion (Xu et al., 2014).
Seasonal patterns further highlighted the differences among vegetation types. Herbaceous wetlands (P. australis and C. malaccensis) exhibited an “increase-decrease” pattern, with carbon stocks peaking in autumn, primarily due to elevated litter inputs during plant senescence (Byun et al., 2019; Li et al., 2009). In contrast, K. candel wetlands reached their peak in spring, likely because lower temperatures suppressed microbial decomposition and reduced carbon loss (Wang et al., 2022). Subsequent tidal inputs and enhanced photosynthetic activity during summer-autumn contributed to carbon replenishment. For unvegetated Tidal flat, where soil carbon constitutes the entire ecosystem carbon pool, the peak occurred in summer, possibly associated with seasonal variations in soil physicochemical conditions (Xia et al., 2022, n.d.; Dong et al., 2022; Guo et al., 2024).
These seasonal and vegetation-specific patterns provide mechanistic support for establishing a “mixed mangrove-cold-tolerant herbaceous” community, which could maintain carbon stocks year-round by exploiting ecological niche complementarity-woody species contributing to deep carbon stabilization and herbaceous species providing aboveground and seasonal carbon inputs (Steinmuller et al., 2022). Integrating this approach with seasonal management and mid-depth soil amendments could activate multi-scale synergies among vegetation, soil, and microorganisms, enhancing both resilience and carbon sequestration efficiency in the Minjiang Estuary wetland ecosystem.
5 Conclusions
This study elucidates the seasonal dynamics and spatial distribution characteristics of carbon stocks across different vegetated Wetland types in the Minjiang Estuary. Ecosystem-level carbon stock for K. candel, P. australis, C. malaccensis, and the unvegetated Tidal flat were 161.00, 128.44, 155.29, and 49.08 t C ha-1, respectively, with vegetation significantly enhancing total carbon stocks (P < 0.05) and soil organic carbon contributing the majority (92.23%-95.05%). Seasonally, K. candel wetlands peaked in spring, those of herbaceous wetlands (P. australis and C. malaccensis) reached their maximum in autumn, while the carbon stock of the Tidal flat peaked in summer. Vertically, the highest soil carbon stocks for both K. candel and the Tidal flat wetlands peaked in the 20–40 cm layer (except for the Tidal flat in spring and autumn), while SOC generally decreased with depth in herbaceous wetlands (except for autumn). Correlation analysis suggested that the unvegetated Tidal flat was more sensitive to environmental fluctuations, whereas C. malaccensis wetlands exhibited greater stability. Relatively acidic soils and compact in K. candel and P. australis wetlands may have constrained carbon accumulation. These findings provide important practical guidance for the carbon sink management of coastal wetlands. Based on the ecological niche complementarity between the lowest carbon stock of K. candel mangroves in autumn and the highest carbon stock of herbaceous wetlands during the same period, we recommend establishing a mixed “mangrove and cold-tolerant herbaceous” community system. Implementing seasonal precision management with autumn root protection for mangroves and summer-enhanced microbial carbon sequestration in Tidal flats. Additionally, applying horizon-specific regulation techniques (e.g., biochar amendments) to optimize mineral-organic complexes in the 20–40 cm sediment layer. These integrated approaches will activate multi-scale synergies integrating vegetation, soil, and microorganisms, ultimately enhancing the resilience and sequestration efficiency of coastal wetland carbon sinks.
Statements
Data availability statement
The raw data supporting the conclusions of this article will be made available by the authors, without undue reservation.
Ethics statement
The manuscript presents research on animals that do not require ethical approval for their study.
Author contributions
YC: Investigation, Writing – original draft, Data curation, Formal Analysis. MZ: Data curation, Methodology, Writing – review & editing, Writing – original draft. JG: Writing – original draft, Data curation, Investigation, Visualization. QL: Visualization, Validation, Writing – review & editing, Software. YZ: Writing – review & editing, Validation, Visualization, Software. ZL: Writing – review & editing, Validation, Software, Visualization. A-DS: Supervision, Writing – review & editing. SL: Project administration, Supervision, Writing – review & editing, Resources. LZ: Writing – review & editing, Project administration, Supervision, Funding acquisition.
Funding
The author(s) declare that financial support was received for the research and/or publication of this article. This work was supported by Fujian Provincial Forestry Science and Technology Project (Grant No. 2025FKJ22), Fuzhou Science and Technology Program Project (Grant No. 2022-S-004); The project was supported by the Fund of Key Laboratory of Marine Ecological Conservation and Restoration, Ministry of Natural Resources/Fujian Provincial Key Laboratory of Marine Ecological Conservation and Restoration (Grant No. EPR2024010).
Conflict of interest
The authors declare that the research was conducted in the absence of any commercial or financial relationships that could be construed as a potential conflict of interest.
Generative AI statement
The author(s) declare that Generative AI was used in the creation of this manuscript. During the preparation of this work, the author used ChatGPT (OpenAI) to improve the readability and language of the manuscript. After using this tool, the author reviewed and edited the content as needed and takes full responsibility for the content of the published article.
Any alternative text (alt text) provided alongside figures in this article has been generated by Frontiers with the support of artificial intelligence and reasonable efforts have been made to ensure accuracy, including review by the authors wherever possible. If you identify any issues, please contact us.
Publisher’s note
All claims expressed in this article are solely those of the authors and do not necessarily represent those of their affiliated organizations, or those of the publisher, the editors and the reviewers. Any product that may be evaluated in this article, or claim that may be made by its manufacturer, is not guaranteed or endorsed by the publisher.
References
1
Ahn C. Stacy J. (2013). Assessing organic matter and organic carbon contents in soils of created mitigation wetlands in Virginia. Environ. Eng. Res18, 151–156. doi: 10.4491/eer.2013.18.3.151
2
Almahasheer H. Duarte C. M. Irigoien X. (2016). Phenology and Growth dynamics of Avicennia marina in the Central Red Sea. Sci. Rep.6, 37785. doi: 10.1038/srep37785
3
Amendola D. Mutema M. Rosolen V. Chaplot V. (2018). Soil hydromorphy and soil carbon: A global data analysis. Geoderma324, 9–17. doi: 10.1016/j.geoderma.2018.03.005
4
Blum J. (2020). Spatial and volumetric distribution of organic carbon in urban tidal marsh sediments (USA: Rutgers, The State University of New Jersey).
5
Brevik E. C. Homburg J. A. (2004). A 5000 year record of carbon sequestration from a coastal lagoon and wetland complex, Southern California, USA. Catena (Amst)57, 221–232. doi: 10.1016/j.catena.2003.12.001
6
Buma B. Gordon D. R. Kleisner K. M. Bartuska A. Bidlack A. DeFries R. et al . (2024). Expert review of the science underlying nature-based climate solutions. Nat. Clim. Ch14, 402–406. doi: 10.1038/s41558-024-01960-0
7
Byun C. Lee S. H. Kang H. (2019). Estimation of carbon storage in coastal wetlands and comparison of different management schemes in South Korea. J. Ecol. Environ.43, 8. doi: 10.1186/s41610-019-0106-7
8
Carter M. R. Gregorich E. G. (2007). Soil Sampling and Methods of Analysis. 2nd ed (Boca Raton: CRC Press).
9
Chen G. N. (2022). China is a sensitive area to global climate change. Ecol. Econ10, 9–12.
10
Chen Y. Li Z. Zhang Y. Qi L. Zhou L. (2025). The assessment of the ecological service value of the Minjiang estuary wetland. Fj Agric. Sci. Technol.56, 29–34. doi: 10.13651/j.cnki.fjnykj.2025.02.006
11
Chen Y. H. Zhang S. G. Zhao Z. (2023). Estimation of organic carbon density and carbon stock in salt marsh wetland of Yueqing Bay. Mar. Environ. Sci.1, 38–45. doi: 10.13634/j.cnki.mes.2023.01.021
12
Ciais P. Sabine C. Bala G. Bopp L. Brovkin V. Canadell J. et al . (2014). “ Carbon and Other Biogeochemical Cycles,” in Climate Change 2013: The Physical Science Basis.Contribution of Working Group I to the Fifth Assessment Report of the Intergovernmental Panel on Climate Change Change (Cambridge, United Kingdom and New York, NY, USA: Cambridge University Press), 465–570.
13
Dong H. Qian L. Yan J. Wang L. (2020). Evaluation of the carbon accumulation capability and carbon storage of different types of wetlands in the Nanhui tidal flat of the Yangtze River estuary. Environ. Monit. Assess.192, 585. doi: 10.1007/s10661-020-08547-0
14
Dong J. Wang L. Quan Q. Liu J. (2022). Factors controlling soil organic carbon content in wetlands at multiple scales and assessment of the universality of estimation equations: A mega-data study. Sci. Tot Environ.827, 154380. doi: 10.1016/j.scitotenv.2022.154380
15
Fabrizio M. Tuckey T. Bever A. MacWilliams M. (2021). The extent of seasonally suitable habitats may limit forage fish production in a temperate estuary. Front. Mar. Sci.8. doi: 10.3389/fmars.2021.706666
16
Gao D. Li X. Lin X. Wu D. Jin B. Huang Y. et al . (2017). Soil dissimilatory nitrate reduction processes in the Spartina alterniflora invasion chronosequences of a coastal wetland of southeastern China: Dynamics and environmental implications. Plant Soil421, 383–399. doi: 10.1007/s11104-017-3464-x
17
Guo C. Loh P. Hu J. Chen Z. Wang J. (2024). Factors influencing mangrove carbon storage and its response to environmental stress. Front. Mar. Sci.11. doi: 10.3389/fmars.2024.1410183
18
Hopkinson C. S. Wolanski E. Cahoon D. R. Perillo G. M. E. Brinson M. M. (2018). “ Coastal wetlands: A synthesis,” in Coastal Wetlands: An Integrated Ecosystem Approach (Amsterdam, Netherlands: Elsevier), 1–75. doi: 10.1016/B978-0-444-63893-9.00001-0
19
Hsieh H. L. Lin H. J. Shih S. S. Chen C. P. (2015). Ecosystem functions connecting contributions from ecosystem services to human wellbeing in a mangrove system in Northern Taiwan. Int. J. Environ. Res. Public Health12, 6542–6560. doi: 10.3390/ijerph120606542
20
Hu M. Sardans J. Le Y. Yan R. Zhong Y. Peñuelas J. (2022). Effects of wetland types on dynamics and couplings of labile phosphorus, iron and sulfur in coastal wetlands during growing season. Sci. Tot Environ.830, 154460. doi: 10.1016/j.scitotenv.2022.154460
21
Inoue T. Akaji Y. Noguchi K. (2022). Distinct responses of growth and respiration to growth temperatures in two mangrove species. Ann. Bot.129, 15–28. doi: 10.1093/aob/mcab117
22
Ji H. Han J. Xue J. Hatten J. A. Wang M. Guo Y. et al . (2020). Soil organic carbon pool and chemical composition under different types of land use in wetland: Implication for carbon sequestration in wetlands. Sci. Tot Environ.716, 136996. doi: 10.1016/j.scitotenv.2020.136996
23
Jin C. Wang J. W. Zheng J. Chen J. Q. Lu X. (2012). An assessment method of Kandelia obovata population biomass. Acta Ecol. Sin.32, 3414–3422. doi: 10.5846/stxb201105160634
24
Khan M. N. I. Suwa R. Hagihara A. (2007). Carbon and nitrogen pools in a mangrove stand of Kandelia obovata (S., L.) Yong: Vertical distribution in the soil-vegetation system. Wetl Ecol. Manag15, 141–153. doi: 10.1007/s11273-006-9020-8
25
Khan M. N. I. Suwa R. Hagihara A. (2009). Biomass and aboveground net primary production in a subtropical mangrove stand of Kandelia obovata (S., L.) Yong at Manko Wetland, Okinawa, Japan. Wetl Ecol. Manag17, 585–599. doi: 10.1007/s11273-009-9136-8
26
Le Quéré C. Moriarty R. Andrew R. M. Canadell J. G. Sitch S. Korsbakken J. I. et al . (2015). Global carbon budget 2015. Earth Syst. Sci. Data7, 349–396. doi: 10.5194/essd-7-349-2015
27
Li B. Liu C. Q. Wang J. X. (2009). Study on the carbon storage and sequestration function of reed, a typical vegetation in baiyangdian wetland. J. Agro-Environ Sci.28, 2603–2607.
28
Li B. L. Lan Y. P. Chen J. Y. (2023). Legal empowerment in wetland ecological protection. Fuzhou Daily2, 1–2. doi: 10.28240/n.cnki.nfzra.2023.001847
29
Li T. Li X. Zhong H. Yang C. Sun G. Luo W. (2015). Distribution of trace metals and the benthic foraminiferal assemblage as a characterization of the environment in the north Minjiang River Estuary (Fujian, China). Mar. pollut. Bull.90, 227–241. doi: 10.1016/j.marpolbul.2014.10.047
30
Lin L. Y. (2008). The contrast of CH4 emission from the Spartina alterniflora wetland and the barren wetland in Minjiang Estuary area (Fuzhou, China: Fujian Normal University).
31
Liu X. Wang C. Guo P. Fang Y. Shen L. Hu S. et al . (2024a). Effects of reclamation of paddy fields on soil iron-bound organic carbon in Minjiang River estuarine wetland. Mar. Geol. Quat. Geol44, 44–54. doi: 10.16562/j.cnki.0256-1492.2023031701
32
Liu X. Wang W. Pendall E. Fang Y. (2024b). Iron-bound organic carbon declined after estuarine wetland reclamation into paddy fields. Sci. Tot Environ.956, 1777369. doi: 10.1016/j.scitotenv.2024.177369
33
Lolu A. J. Ahluwalia A. S. Sidhu M. C. Reshi Z. A. (2019). Carbon sequestration potential of macrophytes and seasonal carbon input assessment into the hokersar wetland, kashmir. Wetlands39, 453–472. doi: 10.1007/s13157-018-1092-8
34
Luo X. Wang L. Dun M. Yang J. Wang Z. (2014). The accumulation and seasonal dynamic of the soil organic carbon in wetland of the yellow river estuary, China. J. Chem.2014, 408923. doi: 10.1155/2014/408923
35
Macreadie P. I. Costa M. D. P. Atwood T. B. Friess D. A. Kelleway J. J. Kennedy H. et al . (2021). Blue carbon as a natural climate solution. Nat. Rev. Earth Environ.2, 826–839. doi: 10.1038/s43017-021-00224-1
36
Mora J. L. Lázaro R. (2014). Seasonal changes in bulk density under semiarid patchy vegetation: The soil beats. Geoderma235-236, 30–38. doi: 10.1016/j.geoderma.2014.06.022
37
Pei J. Liang Y. Xue L. Zamanian K. Sun S. Li W. et al . (2025). Five years of biochar amendment combined with reduced fertilization and irrigation improved the soil organic carbon composition and structure in a solonchak. Sci. Rep.15, 21823. doi: 10.1038/s41598-025-06859-0
38
Perillo G. Wolanski E. Cahoon D. R. Hopkinson C. S. (2019). “ Front matter,” in Coastal Wetlands (Amsterdam, Netherlands: Elsevier). doi: 10.1016/b978-0-444-63893-9.01001-7
39
Pezeshki S. R. Delaune R. D. Patrick W. H. (1989). Effect of fluctuating rhizosphere redox potential on carbon assimilation of Spartina Mternitlora. Oecologia1, 132–135. doi: 10.1007/BF00789942
40
Quan G. X. Yan J. L. (2010). Characteristics of particle- and mineral-bound soil organic carbon in different eco-zones of Yancheng tidal flat wetland. Earth Environ.38, 214–218. doi: 10.14050/j.cnki.1672-9250.2010.02.022
41
Ren H. Lu H. Shen W. Huang C. Guo Q. Li Z. et al . (2009). Sonneratia apetala Buch.Ham in the mangrove ecosystems of China: An invasive species or restoration species? Ecol. Eng.35, 1243–1248. doi: 10.1016/j.ecoleng.2009.05.008
42
Risti S. Sarno S. Andarini R. N. (2024). Analysis of total biomass, carbon stock and carbon dioxide uptake in Kandelia candel stands on Payung Island, Banyuasin Ii Sub-District, Banyuasin Regency, South Sumatra. J. Earth Kdm2, 1–13. doi: 10.61511/jek.v2i1.2024.942
43
Shang S. Hu S. Liu X. Zang Y. Chen J. Gao N. et al . (2022). Effects of Spartina alterniflora invasion on the community structure and diversity of wetland soil bacteria in the Yellow River Delta. Ecol. Evol.12, e8905. doi: 10.1002/ece3.8905
44
Shao X. Yang W. Wu M. (2015). Seasonal dynamics of soil labile organic carbon and enzyme activities in relation to vegetation types in Hangzhou Bay tidal flat wetland. PloS One10, e0142677. doi: 10.1371/journal.pone.0142677
45
Sjögersten S. De La Barreda-Bautista B. Brown C. Boyd D. Lopez-Rosas H. Hernández E. et al . (2021). Coastal wetland ecosystems deliver large carbon stocks in tropical Mexico. Geoderma403, 115173. doi: 10.1016/j.geoderma.2021.115173
46
Steinmuller H. E. Breithaupt J. L. Engelbert K. M. Assavapanuvat P. Bianchi T. S. (2022). Coastal wetland soil carbon storage at mangrove range limits in apalachicola bay, FL: observations and expectations. Fron For. Glob. Ch5, 825910. doi: 10.3389/ffgc.2022.852910
47
Tan L. S. Ge Z. M. Li S. H. Zhou K. Lai D. Y. F. Temmerman S. et al . (2023). Impacts of land-use change on carbon dynamics in China’s coastal wetlands. Sci. Tot Environ.890, 164206. doi: 10.1016/j.scitotenv.2023.164206
48
Tan L. S. Yang P. He L. L. Huang J. F. Hu Z. Q. Tong C. (2017). Diurnal variations of porewater dissolved CH4 and CO2concentrations in a brackish marsh dominated by Cyperus malaccensis and Phragmites australis during neap and spring tides in the Minjiang River Estuary. Environ. Sci.38, 52–59. doi: 10.13227/j.hjkx.201606056
49
Tang J. W. Ye S. F. Chen X. C. Yang H. L. Sun X. H. Wang F. M. et al . (2018). Scientific concept, research method and ecological restoration application of coastal blue carbon. Sci. China Earth Sci.48, 661–670. doi: 10.1007/s11430-017-9181-x
50
Temmink R. J. M. Lamers L. P. M. Angelini C. Bouma T. J. Fritz C. Van De Koppel J. et al . (2022). Recovering wetland biogeomorphic feedbacks to restore the world’s biotic carbon hotspots. Science376, eabn1479. doi: 10.1126/science.abn1479
51
Walter K. Don A. Tiemeyer B. Freibauer A. (2016). Determining soil bulk density for carbon stock calculations: A systematic method comparison. Soil Sci. Soc Am. J.80, 579–591. doi: 10.2136/sssaj2015.11.0407
52
Wang Y. H. Jiao L. (2016). Spatial distribution of soil organic carbon and carbon stocks in Ebinur Lake Wetland. Acta Ecol Sin.36, 5893–5901. doi: 10.5846/stxb201503240557
53
Wang B. Mu C. Lu H. Li N. Zhang Y. Ma L. (2022). Ecosystem carbon storage and sink/source of temperate forested wetlands in Xiaoxing’anling, northeast China. J. For. Res.33, 839–849. doi: 10.1007/s11676-021-01366-0
54
Wang W. Sardans J. Wang C. Asensio D. Bartrons M. Peñuelas J. (2018). Species-specific impacts of invasive plant success on vertical profiles of soil carbon accumulation and nutrient retention in the minjiang river tidal estuarine wetlands of China. Soil Syst.2, 1–23. doi: 10.3390/soils2010005
55
Wang W. Q. Wang C. Sardans J. Zeng C. S. Tong C. Peñuelas J. (2015). Plant invasive success associated with higher N-use efficiency and stoichiometric shifts in the soil-plant system in the Minjiang River tidal estuarine wetlands of China. Wetl Ecol. Manag23, 865–880. doi: 10.1007/s11273-015-9425-3
56
Wersal R. M. Madsen J. D. Cheshier J. C. (2013). Seasonal biomass and starch allocation of common reed (Phragmites australis) (Haplotype I) in southern alabama, USA. Inv Plant Sci. Manag6, 140–146. doi: 10.1614/ipsm-d-12-00061.1
57
Xia S. Song Z. Van Zwieten L. Wang H. (2022). Storage, patterns and influencing factors for soil organic carbon in coastal wetlands of China. Global Change Biol.28, 6065–6085. doi: 10.1111/gcb.16325
58
Xie M. Qian L. Dong H. Mei W. Fu X. Hu Y. et al . (2023). The high organic carbon accumulation in estuarine wetlands necessarily does not represent a high CO2 sequestration capacity. Environ. Int.172, 107762. doi: 10.1016/j.envint.2023.107762
59
Xu X. W. H. Zhao Y. F. Zou X. Q. Yang W. Cao L. G. Cheng H. (2014). Characteristics of organic carbon in surface sediments of the Yancheng coastal wetland. J. Natural Resour.29, 1957–1967. doi: 10.11849/zrzyxb.2014.11.013
60
Yang F. Li R. Wang M. Zhang L. Wang W. (2025). Restoration patterns and influencing factors for the vegetation structure and carbon storage in mangroves converted from abandoned ponds. Glob. Ecol. Conserv.58, e03430. doi: 10.1016/j.gecco.2025.e03430
61
Yoo J. Kim J. Kim J. Lim J. Kang H. (2022). Soil carbon storage and its economic values of inland wetlands in Korea. Ecol. Eng.182, 106731. doi: 10.1016/j.ecoleng.2022.106731
62
Zedler J. B. Kercher S. (2005). Wetland resources: Status, trends, ecosystem services, and restorability. Annu. Rev. Environ. Resour30, 39–74. doi: 10.1146/annurev.energy.30.050504.144248
63
Zhang T. Chen H. Cao H. Ge Z. Zhang L. (2017). Combined influence of sedimentation and vegetation on the soil carbon stocks of a coastal wetland in the Changjiang estuary. Chin. J. Oceanol Limnol35, 833–843. doi: 10.1007/s00343-017-6054-0
64
Zhang Y. Liao B. W. (2022). Status and development of mangrove wetland ecological restoration technology in China. China Sci. Fdn3, 412–419. doi: 10.16262/j.cnki.1000-8217.2022.03.007
65
Zhang Z. Wang Y. Wang Y. Deng X. Hao G. Wang F. et al . (2023). Distribution patterns and influencing factors of soil carbon storage in mangrove wetland at the Pear River Estuary. Acta Sci Circumstantiae43, 297–306. doi: 10.13671/j.hjkxxb.2022.0405
66
Zheng X. Javed Z. Liu B. Zhong S. Cheng Z. Rehman A. et al . (2023). Impact of spartina alterniflora invasion in coastal wetlands of China: boon or bane? Biology12, 1057. doi: 10.3390/biology12081057
67
Zheng J. Li J. Lan Y. Liu S. Zhou L. Luo Y. et al . (2019). Effects of Spartina alterniflora invasion on Kandelia candel rhizospheric bacterial community as determined by high-throughput sequencing analysis. J. Soil Sed19, 332–344. doi: 10.1007/s11368-018-2002-7
68
Zhou L. Li S. Liu B. Wu P. Heal K. V. Ma X. (2019). Tissue-specific carbon concentration, carbon stock, and distribution in Cunninghamia lanceolata (Lamb.) Hook plantations at various developmental stages in subtropical China. Ann. For. Sci.76, 70. doi: 10.1007/s13595-019-0851-x
Summary
Keywords
ecosystem carbon stock, seasonal dynamics, vertical distribution, vegetation types, coastal wetland, Minjiang estuary
Citation
Chen Y, Zhang M, Guo J, Liu Q, Zhang Y, Li Z, Shalom A-DD, Li S and Zhou L (2025) Seasonal dynamics and vertical distribution of ecosystem-level carbon stocks in different vegetation types of the Minjiang estuary wetland. Front. Mar. Sci. 12:1682162. doi: 10.3389/fmars.2025.1682162
Received
08 August 2025
Accepted
31 October 2025
Published
21 November 2025
Volume
12 - 2025
Edited by
Geórgenes Hilário Cavalcante, Federal University of Alagoas, Brazil
Reviewed by
Mao Guo, Southern Marine Science and Engineering Guangdong Laboratory-Zhanjiang, China
Shuaipu Zhang, Guilin University of Technology, China
Updates
Copyright
© 2025 Chen, Zhang, Guo, Liu, Zhang, Li, Shalom, Li and Zhou.
This is an open-access article distributed under the terms of the Creative Commons Attribution License (CC BY). The use, distribution or reproduction in other forums is permitted, provided the original author(s) and the copyright owner(s) are credited and that the original publication in this journal is cited, in accordance with accepted academic practice. No use, distribution or reproduction is permitted which does not comply with these terms.
*Correspondence: Lili Zhou, fjzhoulili@126.com
Disclaimer
All claims expressed in this article are solely those of the authors and do not necessarily represent those of their affiliated organizations, or those of the publisher, the editors and the reviewers. Any product that may be evaluated in this article or claim that may be made by its manufacturer is not guaranteed or endorsed by the publisher.