Abstract
The Qingjiang Estuary mangrove forest, located at the northernmost edge of China's mangrove belt, plays a vital role in maintaining regional ecological balance. This study aimed to investigate the sources and seasonal dynamics of nitrogen and organic matter across different vegetation zones within the estuary. Sediment samples were collected during summer (June) and autumn (November) and analyzed for total nitrogen (TN), ammonium nitrogen (NH4+-N), nitrate nitrogen (NO3--N), total organic carbon (TOC), and C/N ratios. Stable isotopes (δ13C and δ15N) were used to quantitatively trace nitrogen sources. Principal component analysis (PCA) was employed to assess the influence of sediment physicochemical properties on nitrogen distribution, and Bayesian mixing model analysis was conducted to identify organic matter sources. Spatially, nitrogen and carbon concentrations decreased from west to east across the estuary. Distinct seasonal differences were observed in nitrogen forms and concentrations: TN and NO3--N levels significantly increased in autumn, while NH4+-N remained relatively stable. PCA results revealed that the first principal component (PC1, explaining 37.6% of variance) was dominated by TN, NO3--N, and water content, while the second component (PC2, explaining 18% of variance) was primarily associated with TOC, C/N ratios, and pH. Bayesian mixing model analysis indicated that organic matter primarily originated from terrestrial sources, including C3 and C4 plants, with minor contributions from aquaculture and marine plankton. Average contribution rates were: other terrestrial sources (24.6%) > C3 plants (23.83%) > C4 plants (23.75%) > aquaculture (16.7%) > plankton and marine sources (11.12%). Seasonal shifts in sedimentary environments strongly influenced nitrogen accumulation patterns. These findings provide important insights into nitrogen dynamics and source identification in mangrove ecosystems, contributing to the development of ecosystem management and conservation strategies for this region.
1 Introduction
In estuarine wetlands, nitrogen dynamics are closely linked to both natural processes and anthropogenic disturbances. In recent decades, human activities such as aquaculture, agricultural runoff, and domestic sewage discharge have significantly altered nitrogen inputs to coastal ecosystems (Nie et al., 2018; Du et al., 2025; Bernhard and Bollmann, 2010). These inputs have triggered harmful algal blooms and caused low-oxygen conditions in many coastal regions (Liu et al., 2021). Meanwhile, the invasion of Spartina alterniflora into native plants, further complicating biogeochemical cycles (Nie et al., 2018; Zhang et al., 2024; Damashek and Francis, 2018). These changes not only affect nitrogen transformation pathways and retention capacity but also complicate the accurate identification of nitrogen sources (Ishfaq et al., 2025). Given that nitrogen availability directly regulates primary productivity, eutrophication potential, and wetland ecosystem functioning, precisely tracing nitrogen sources is critical for understanding nutrient limitations and informing effective management and restoration strategies in mangrove-estuarine systems.
Internationally, stable isotopes (δ¹³C and δ15N), elemental ratios (C/N), and multi-source Bayesian mixing models have been widely applied to trace the sources of organic matter and nitrogen in mangrove forests, salt marshes, and estuarine sediments (Wiegner et al., 2016; Zhao et al., 2022; Aljahdali and Alhassan, 2025). These approaches have provided valuable insights into the contributions of terrestrial inputs, plant residues, planktonic sources, and anthropogenic activities to sediment nutrient composition. Previous research in the Qingjiang Estuary has mainly focused on mangrove ecosystem assessments (Li et al., 2024), ecological restoration efforts, microplastic pollution (Yang et al., 2024), and heavy metal distribution and sources (Yang et al., 2017; Yao et al., 2021), shedding light on some ecological responses to pollution pressures. However, as the northernmost mangrove estuary in China, the Qingjiang Estuary remains under-explored, especially regarding the spatial and seasonal dynamics of nitrogen in sediments. Systematic investigations into nitrogen sources, distribution patterns, and their controlling mechanisms across different vegetation communities are still lacking. In particular, the seasonal variability of nitrogen forms and their coupling with sedimentary environmental factors remain poorly understood. Addressing these issues is essential for capturing the nitrogen cycling processes in this subtropical mangrove ecosystems.
This study takes the Qingjiang Estuary mangrove zone as a case zone, aiming to (1) reveal the seasonal variations of nitrogen content and distribution across mangrove, Spartina alterniflora, and mixed vegetation zones (Spartina alterniflora-mangrove mixed zone) in the estuary; (2) identify the key sedimentary environmental drivers regulating nitrogen dynamics; and (3) quantify nitrogen sources using a Bayesian mixing model combined with stable isotope and elemental ratio analyses. This study systematically compares nitrogen patterns across various vegetation types and two seasons, thereby expanding our current understanding of nitrogen source tracing in the mangrove estuaries. In this study, field sampling was conducted in June and November, representing typical summer and autumn conditions in the subtropical monsoon climate of the Qingjiang Estuary. This two-season design captures the key seasonal contrasts in hydrodynamic and biogeochemical conditions that regulate nitrogen cycling. However, we acknowledge that the dataset does not cover transitional or winter periods, and therefore the findings are limited to summer-autumn seasonal variations rather than the full annual cycle.
2 Materials and methods
2.1 Description of the study area
The Qingjiang estuary, situated on the southwestern side of Yueqing Bay (Wenzhou City, Zhejiang Province, see Figure 1), is characterized by its long and narrow east-west orientation. This area experiences a subtropical humid monsoon climate and is widely covered by silty tidal flats along the estuary, with sedimentation processes predominantly governed by silt accumulation (Wu et al., 2025). Yueqing Bay is classified as a macro-tidal bay, with an average tidal range exceeding 4 m and a maximum tidal range over 7 m (Tian et al., 2023). The tidal dynamics within the bay exhibit a negative tidal skewness, indicating a dominance of ebb tides (Tong et al., 2020). China’s northernmost mangrove belt has developed in the Qingjiang estuary, supported by its unique environmental conditions. The mangrove ecosystem is crucial for maintaining regional ecological functions and supporting biodiversity. It is also significant for its persistence and resilience in a relatively high-latitude, colder climate, making it an ecologically important and valuable site for studying temperate mangrove dynamics and their environmental responses.
Figure 1
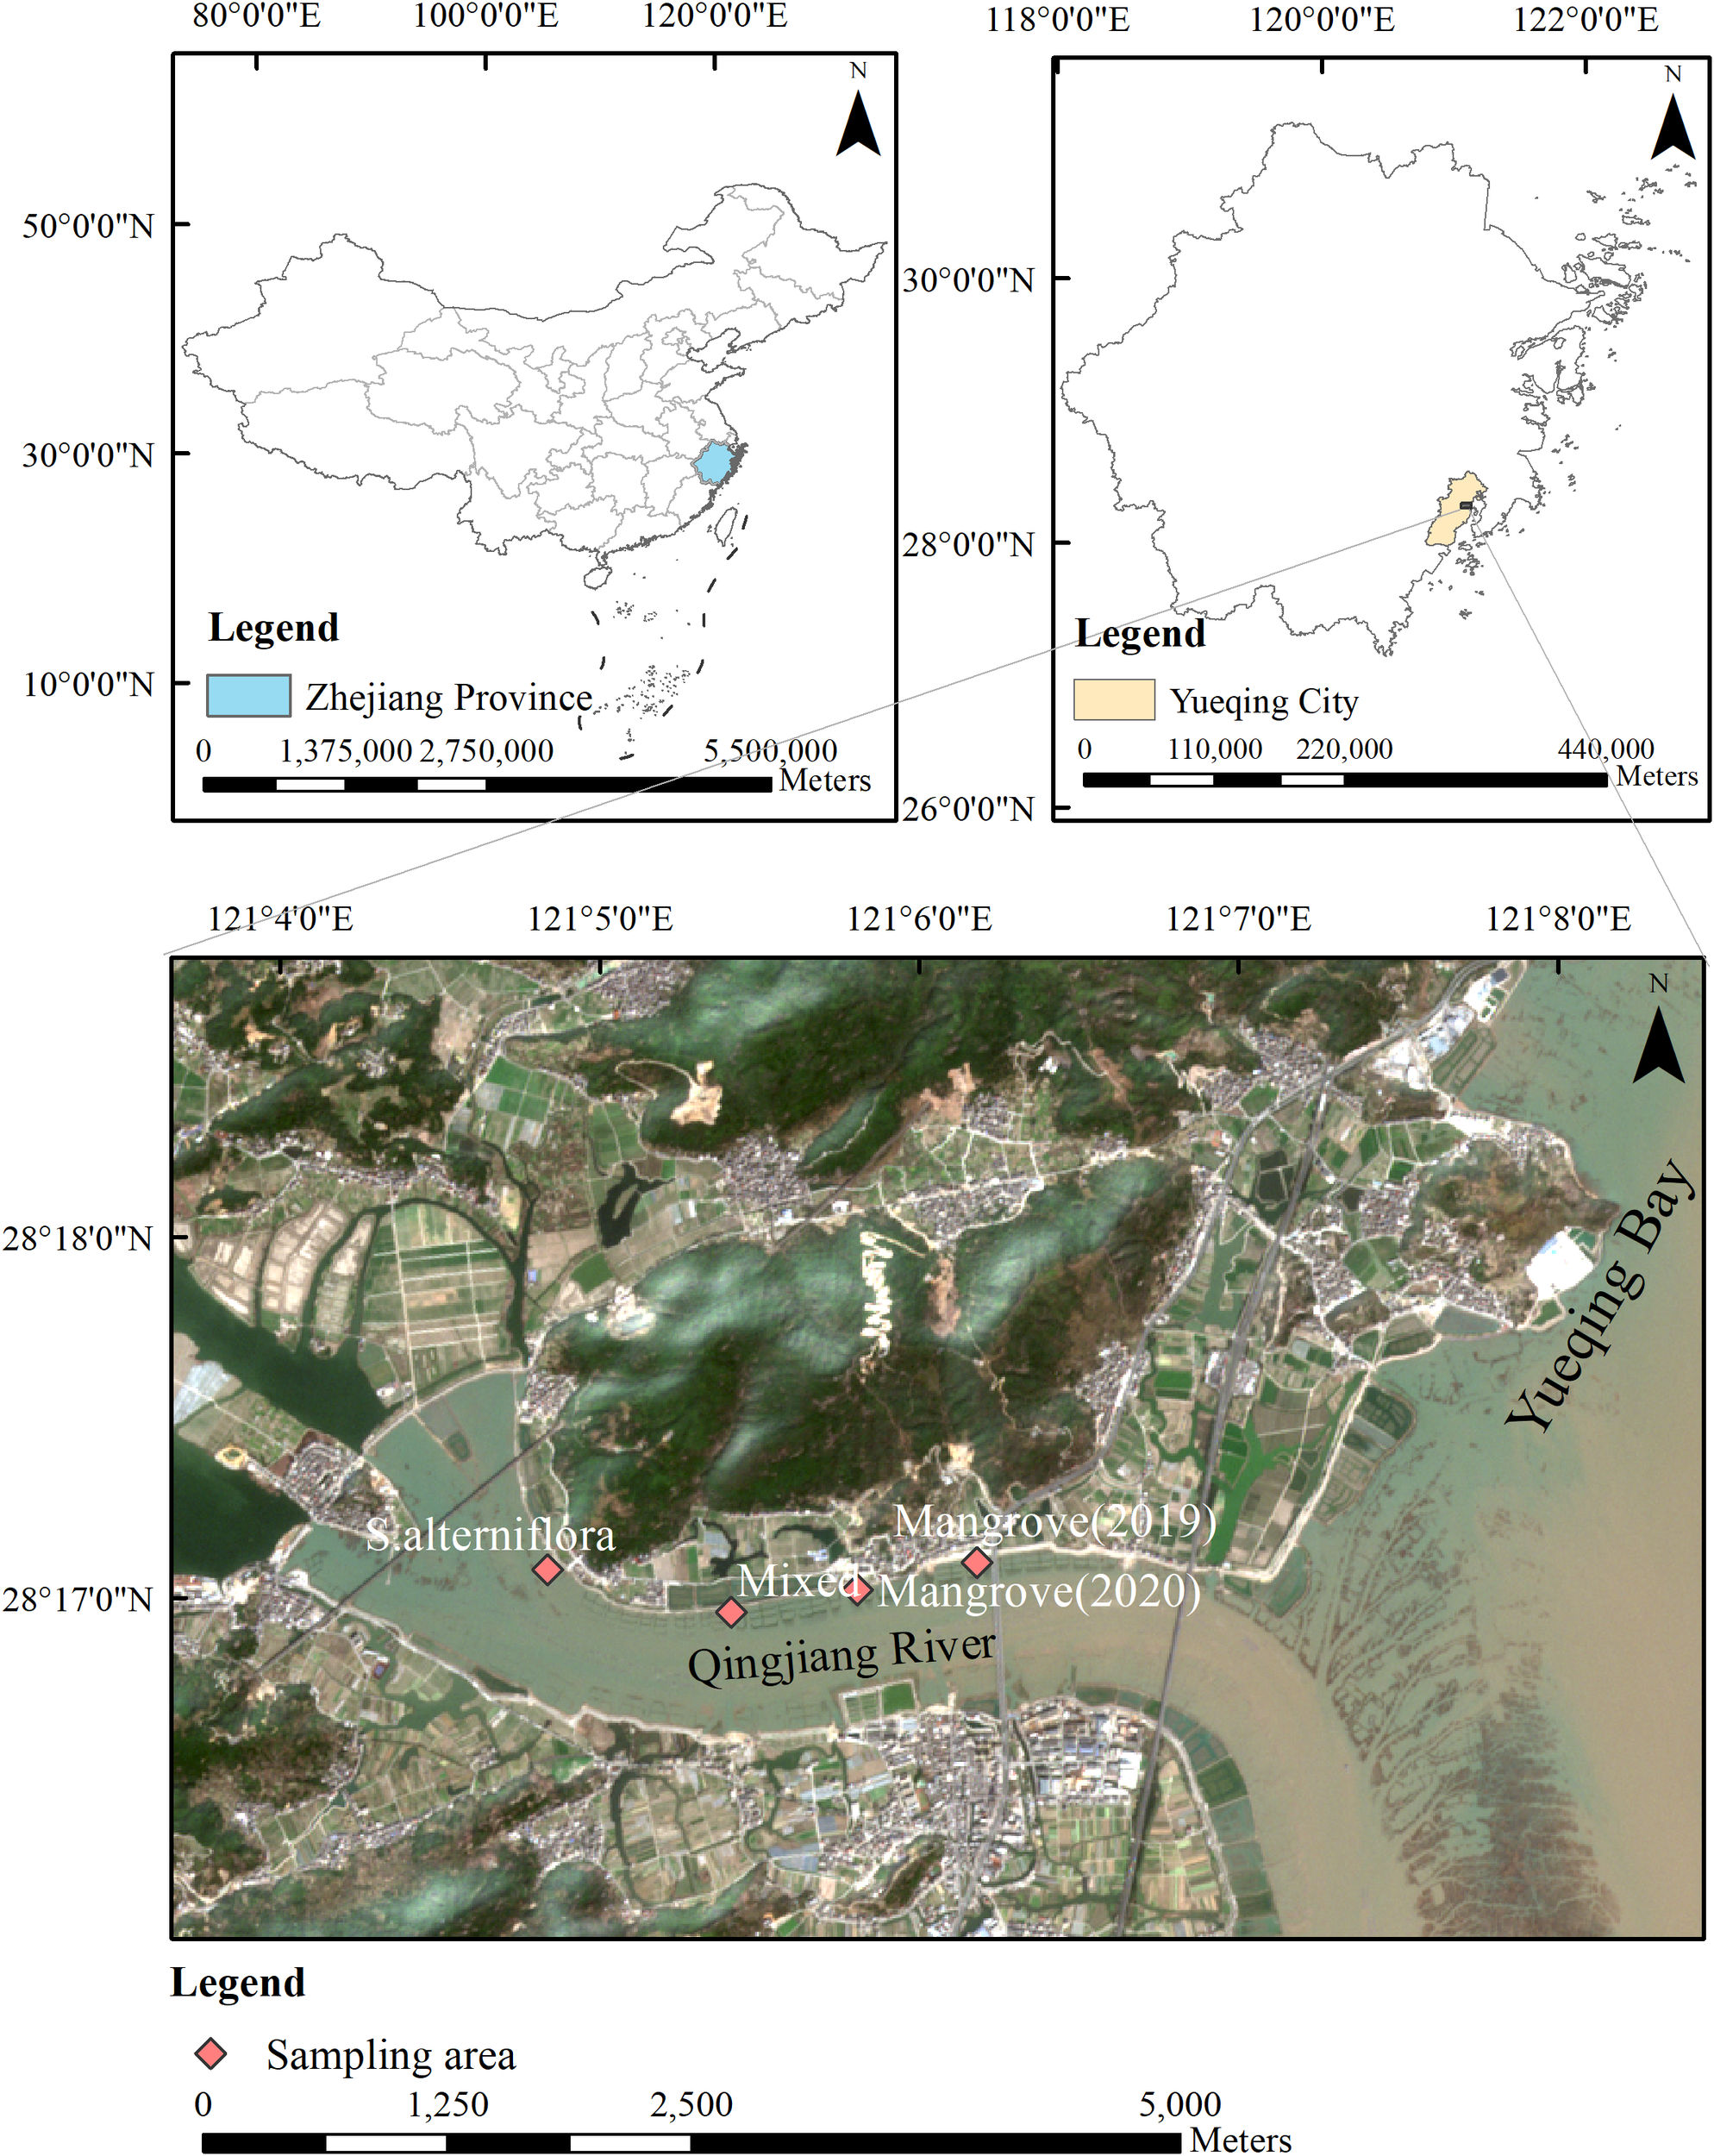
Geographical overview of the Qingjiang River Estuary, Zhejiang Province, China. The upper left panel shows the location of Zhejiang Province within China, the upper right panel shows Yueqing City within Zhejiang Province, and the main panel displays a high-resolution satellite image of the study area. Red diamonds indicate sampling points for physical and chemical indicators across four vegetation zones: S.alterniflora, Mixed areas, Mangrove (2020), and Mangrove (2019). Scale bars are provided for each map level.
2.2 Sample collecting and analysis
Sediment sampling was conducted in the Qingjiang Estuary mangrove area (28°14′–28°20 ′N, 121°4′–121°8′ E) during two field surveys in June and November 2023. Four typical vegetation zones were selected: Spartina alterniflora zone, Spartina alterniflora-mangrove mixed zone, mangrove zone planted in 2020, and mangrove zone planted in 2019 (Figure 1). Eight sediment samples were collected within each vegetation zone for the measurements of nitrogen and related sedimentary factors. At each sampling point, sediment cores were collected using a PVC corer to a depth of 0–30 cm. The sediments were divided into three layers: 0–10 cm, 10–20 cm, and 20–30 cm. Then, the sediments from these three layers were homogenized in the field to obtain a composite sample representing each site. In total, 32 sediment samples were collected each season. All sediment samples were immediately placed in polyethylene bags, sealed, and stored in portable ice boxes at approximately 4 °C during transportation to the laboratory. Samples were stored at –20 °C until further analysis to prevent organic matter degradation.
Physical-chemical analyses of the sediment samples. Total organic carbon (TOC) and total organic nitrogen (TON) were determined by the elemental analyzer (Flash 2000 CHNS/O, Thermo Fisher). Total nitrogen (TN) was measured using the semi-micro Kjeldahl method. Nitrate nitrogen (NO3--N) and ammonium nitrogen (NH4+-N) were extracted with 2 mol/L KCl solution and analyzed using ultraviolet spectrophotometry and indophenol blue colorimetry, respectively. Sediment pH was measured using the potentiometric method following the Chinese standard HJ 962-2018 “Determination of pH value in soil - Potentiometric method” with a pH meter (FE28-Standard). Sediment water content was determined using the gravimetric method according to Chinese standard HJ 613-2011 (Section 7.2) “Determination of dry matter and water content in soil - Gravimetric method.” Samples were dried in a forced-air drying oven (DHG-9240A) and weighed using an electronic balance (LT2002E).
Organic carbon and nitrogen isotope measurements. Two sediment samples were selected each vegetation zone, resulting in a total of eight samples for the stable isotope measurements. Eight sampling points were established across four distinct ecological zones along the Qingjiang estuary: two points in the Spartina alterniflora zone (1, 2), two in the mixed zone (3, 4), two in the mangrove zone planted in 2020 (5, 6), and two in the mangrove zone planted in 2019 (7, 8). The determination of δ13C and δ15N was conducted using elemental analysis-stable isotope ratio mass spectrometry (EA-IRMS) (Ding, 2002; Stock et al., 2018). The tested samples were converted into CO2 and N2 under high-temperature oxidation conditions, separated via gas chromatography, and their isotopic ratios were measured using a mass spectrometer. For δ13C analysis, samples were encapsulated in tin cups and introduced into a combustion tube (filled with chromium oxide and copper oxide) via an automatic sampler, where they were completely oxidized to CO2 at 1020 °C. The generated CO2 was dehydrated using magnesium perchlorate, separated by gas chromatography, and finally analyzed for δ13C values using a Delta V Plus mass spectrometer. For δ15N analysis, samples were oxidized to NOx in the combustion tube and then converted to N2 via a reduction tube (filled with high-purity reduced copper at 650 °C). The purified N2 was isolated and measured for δ15N values using the mass spectrometer.
The δ13CTOC values were referenced to the PDB international standard and calculated using the following formula (Equation 1):
where R (13C/12CVPDB) is the carbon isotope abundance ratio of the international standard Vienna Pee Dee Belemnite (VPDB).
The δ15NTON values were referenced to the atmospheric N2 and calculated using the following formula (Equation 2):
where R (15N/14Nair) represents the nitrogen isotope abundance ratio of atmospheric N2.
To ensure the reliability and reproducibility of the analytical results, quality control and quality assurance procedures were rigorously followed throughout the study. All glassware and sampling tools were pre-cleaned with acid and rinsed with deionized water to prevent cross-contamination. Each batch of samples included procedural blanks, analytical duplicates, and certified reference materials to verify accuracy. The relative standard deviation (RSD) of replicate measurements was kept below 5% for all major parameters. Stable isotope analyses were conducted with internal standards, and the analytical precision was better than ±0.2‰ for both δ¹³C and δ15N.
2.3 Source quantification using Bayesian mixing model
In R software, the Bayesian framework MixSIAR (version 4.5.0) was utilized to estimate the relative proportions of organic matter derived from various sources within sediment samples, following Equations 3–6. This computational approach incorporates multiple sources of variability and uncertainty through the following mathematical relationship. Carbon and nitrogen isotopic signatures (δ13C and δ15N) for each potential source were derived from published literature and served as model inputs. The model output provides probability distributions, with the median value (50th percentile) indicating the most likely proportional contribution of each organic matter source to the sediment composition (Parnell et al., 2013; Stock et al., 2018; Aljahdali and Alhassan, 2025).
Yij represents the isotopic value of element j measured in sample i; Fk denotes the fractional contribution of source k (the parameter estimated by the Bayesian framework); Skj indicates the characteristic isotopic signature of element j for source k; Dkj represents the discrimination factor for element j associated with source k; and ϵij accounts for residual uncertainty, capturing unexplained variability between individual samples. It should be noted that the isotope mixing model method adopted in this study is mainly used for quantitative identification of organic nitrogen sources, rather than a direct explanation of the nitrogen conversion mechanism. This method can effectively distinguish the contribution of organic nitrogen from different sources in an estuary system with abundant organic nitrogen input (Andrisoa et al., 2024; Li et al., 2023), providing a quantitative basis for understanding the nitrogen cycle pattern, but there are certain limitations in the mechanism interpretation of the nitrogen biogeochemical transformation process.
2.4 Statistical analysis
Statistical analyses were performed to evaluate spatial and seasonal variations of sediment nutrients and to explore their environmental drivers. Differences in NH4+-N and NO3--N contents among vegetation types and sampling seasons were assessed using one-way analysis of variance (ANOVA) with Tukey’s post hoc test, and pairwise comparisons within the same vegetation type were conducted with independent-sample t-tests. All univariate analyses were conducted in SPSS 25.0. To quantify associations among nutrient indicators (NH4+-N, NO3--N, TOC, TN), Pearson correlation analysis was performed using the “stats” package in R v4.4.3 (R Core Team, 2024).
Multivariate analyses were further applied to reveal patterns in nutrient dynamics across different vegetation zones. Principal component analysis (PCA) was carried out with the “FactoMineR” and “factoextra” packages in R (Lê et al., 2008) to identify the dominant factors explaining variance. Hierarchical cluster analysis, based on Bray–Curtis dissimilarities, was performed using the “vegan” package in R (Oksanen et al., 2017) to group sampling sites according to nutrient profiles. In addition, redundancy analysis (RDA) was used to evaluate the influence of environmental drivers on nutrient distributions, with model selection following the adjusted R² criterion (Legendre and Anderson, 1999).
All data visualization (boxplots and correlation matrices) was conducted in OriginPro 2021, R (version 4.4.3). All analyses were conducted in R (version 4.4.3), MATLAB R2022b, SPSS 25.0, and Microsoft Excel 2021.
3 Results and discussion
3.1 Characteristics of NO3–N and NH4+-N in mangrove sediments
The concentrations and forms of nitrogen in the estuarine mangrove sediments varied significantly across regions and seasons, displayed in Table 1. In June, ammonium nitrogen (NH4+-N) concentrations ranged from 10.00 to 12.88 mg/kg, while nitrate nitrogen (NO3--N) concentrations were relatively low, ranging from 1.74 to 3.55 mg/kg. By November, NH4+-N concentrations remained relatively stable, ranging from 9.19 to 12.98 mg/kg. In contrast, NO3--N concentrations increased substantially, reaching 8.44 to 14.76 mg/kg. In the S.alterniflora zone, NO3--N concentration rose to 11.95 mg/kg in November, showing a remarkable seasonal increase. The concentrations of NO3--N in the mixed zone and the mangrove plant zone increased by 4.55-fold and 3.85-fold, respectively, from June to November, though they remained lower than those in the S.alterniflora zone. The mangrove plant zone (2019) recorded the highest NO3--N concentration in November, reaching 14.76 mg/kg—over four times higher than its June value.
Table 1
| Area | June | November | ||
|---|---|---|---|---|
| NH4+-N(mg/kg) | NO3--N(mg/kg) | NH4+-N(mg/kg) | NO3--N(mg/kg) | |
| S.alterniflora | 10.34 ± 1.81* | 2.76 ± 1.53* | 10.56 ± 4.69* | 11.95 ± 1.60* |
| Mixed | 11.62 ± 1.49* | 1.77 ± 0.79* | 10.38 ± 1.73* | 9.84 ± 2.58 |
| Mangrove(2020) | 10.00 ± 1.94* | 1.74 ± 0.63* | 9.19 ± 2.56* | 8.44 ± 2.54 |
| Mangrove(2019) | 12.88 ± 2.03* | 3.54 ± 1.24 | 12.98 ± 2.59* | 14.76 ± 1.66* |
Characteristics of NO3--N and NH4+-N content in sediments in June and November (mean ± SD, n = 8).
Values are expressed as mean ± standard deviation (SD). The significant differences (*) among vegetation types were determined by one-way ANOVA followed by Tukey’s HSD post hoc test (p < 0.05).
Despite the widespread increase in nitrate nitrogen during autumn, the mixed zone and the mangrove plant zone (2020) consistently remained dominated by ammonium nitrogen, indicating that nitrogen cycling in these areas is still primarily controlled by reductive sedimentary conditions (Wang et al., 2023). Overall, the average NO3--N concentration in November was approximately 4.72 times higher than that in June, highlighting the critical role of seasonal variation in regulating nitrate accumulation in estuarine sediments. A comparison between June and November revealed significant summer-autumn differences in nitrogen forms, with NO3--N showing pronounced seasonal increases while NH4+-N remained relatively stable, underscoring the distinct seasonal drivers regulating sediment nitrogen dynamics.
3.2 Concentration of TN, TOC, and C/N ratios in mangrove sediments
In the study area, the total organic carbon (TOC) concentrations in sediments ranged from 6200 to 65200 mg/kg in June and from 8600 to 19900 mg/kg in November. Spatially, TOC concentrations were significantly higher in the mixed vegetation zone in June (Figure 2A). The mangrove zone also exhibited higher TOC levels than the S.alterniflora zone, indicating the influence of vegetation type on organic carbon accumulation. By November, TOC concentrations had declined in both the mangrove and mixed zones, suggesting reduced organic carbon storage. In contrast, TOC levels in the S.alterniflora zone remained stable, likely reflecting the limited capacity of this zone to retain organic matter from seasonal runoff inputs, with both summer and autumn inputs rapidly decomposing (Han et al., 2020).
Figure 2
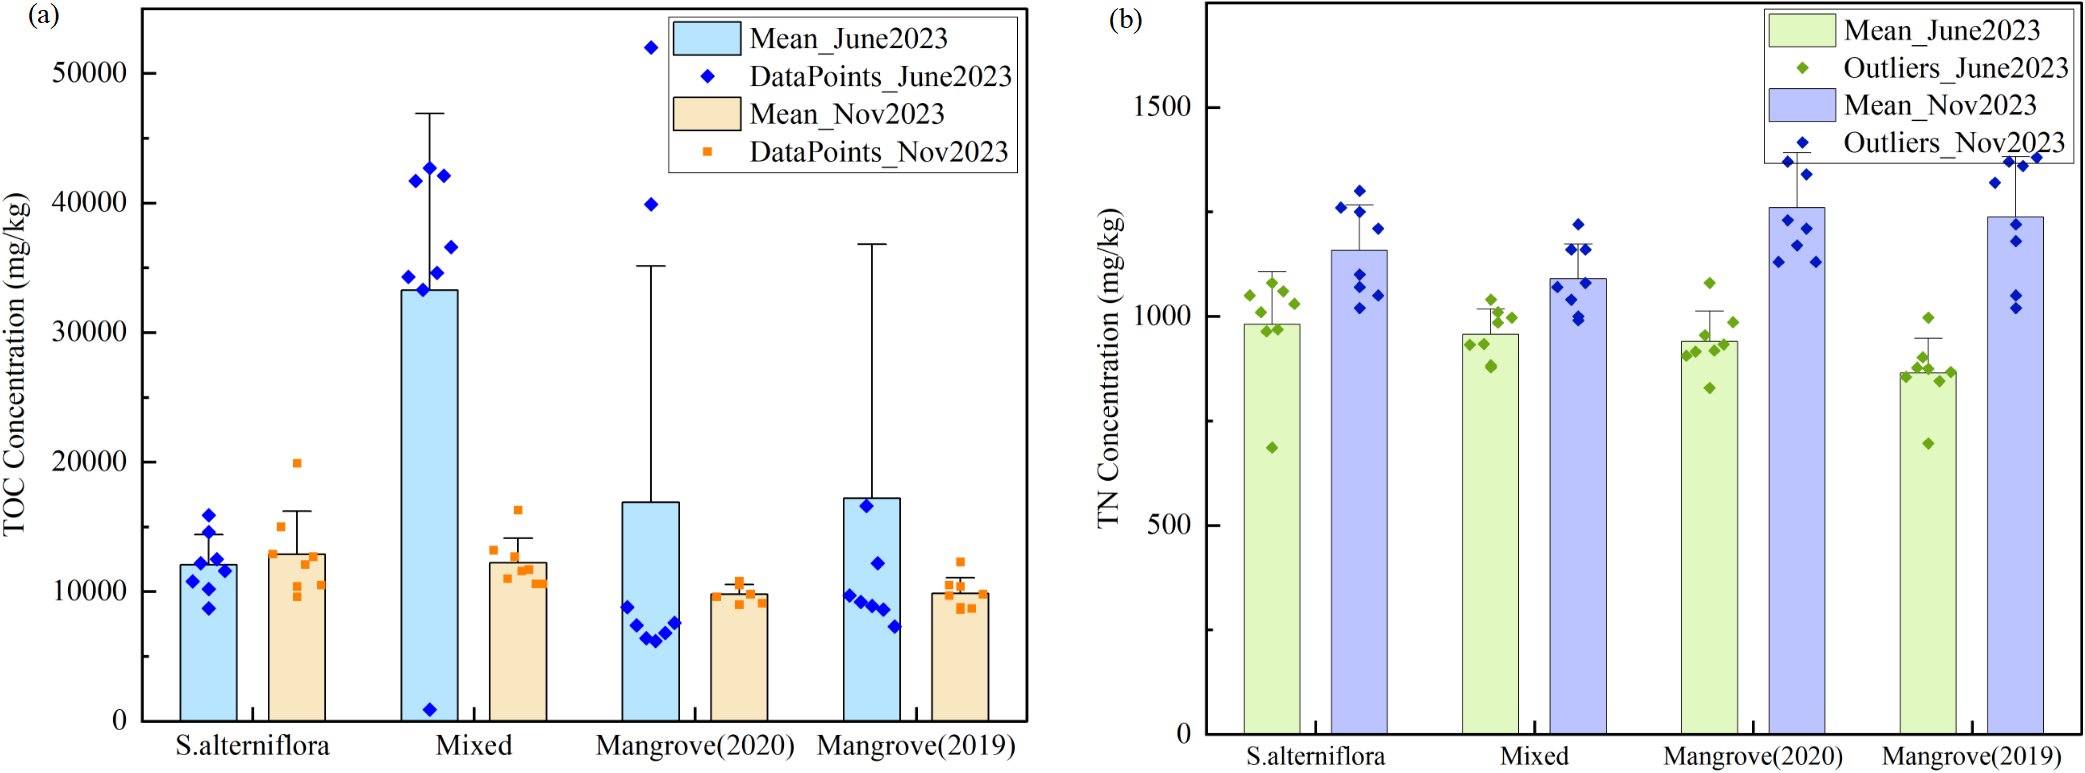
Boxplot of TOC and TN concentrations across different sampling areas. (A) TOC concentrations, (B) TN concentrations. Data are shown for four vegetation types: S.alterniflora, Mixed areas, Mangrove (2020), and Mangrove (2019) across two sampling periods (June 2023 and November 2023). Box plots show median, quartiles, and outliers. Individual data points are overlaid to show data distribution. Error bars represent standard deviation.
The total nitrogen (TN) content in sediments exhibited distinct seasonal fluctuations. In June, TN concentrations varied between 686 and 1080 mg/kg, with an average of 936 mg/kg. By November, TN levels had risen significantly, ranging from 991 to 1500 mg/kg, with an average of 1186 mg/kg. Spatial variations were noted across different vegetation zones (Figure 2B). During June, the S.alterniflora zone displayed the highest TN concentrations (at 981 mg/kg, whereas the mangrove area had the lowest. By November, the mangrove zone experienced a substantial increase in TN concentrations, surpassing 1230 mg/kg, which was higher than in both the S.alterniflora and mixed zones. In estuarine environments, the input of organic matter is typically higher during the summer, which increases oxygen consumption. This higher organic load provides substrates for heterotrophic bacteria, which compete with nitrify bacteria for dissolved oxygen. Since nitrify bacteria grow more slowly and have a lower affinity for oxygen, their activity is suppressed under high organic load conditions, thereby reducing nitrification efficiency (Sadowski et al., 2015). Spatially, TN concentrations in June decreased from west to east, indicating a distinct gradient of nitrogen input. This pattern was likely influenced by higher water content and anaerobic conditions, which enhance denitrification and nitrogen loss. By November, the spatial distribution shifted to a vegetation-controlled pattern, with TN levels ranked as mangrove zone > S.alterniflora zone > mixed zone, highlighting the significant role of vegetation type in regulating nitrogen accumulation. Additionally, during summer, vigorous plant growth likely intensified plant uptake of inorganic nitrogen, further reducing sediment nitrogen concentrations, especially in the S.alterniflora and mixed zones. These seasonal dynamics emphasize the strong influence of hydrodynamic conditions and vegetation on nitrogen distribution in the estuary (Yin et al., 2019; Zhang et al., 2024).
The carbon-to-nitrogen (C/N) ratio of sediments in June ranged from 7.91 to 67.05, with an average of 23.91, indicating mixed sources of organic matter. Significant differences in C/N ratios were observed among vegetation types, shown in Table 2. The mixed zone exhibited the highest values, ranging from 37.49 to 59.24, suggesting a substantial input of terrestrial plant debris with high C/N characteristics (Huang et al., 2023; Wang et al., 2021). In contrast, the mangrove plant zone in 2020 displayed considerable fluctuations in C/N ratios, reflecting complex organic matter sources. The mangrove plant zone in 2019 and the S.alterniflora zone showed more stable C/N ratios, typically ranging from 10.59 to 23.02, indicating relatively consistent and homogeneous organic inputs. By November, sediment C/N ratios generally decreased, ranging from 6.72 to 16.45, with an average of 9.56. This pattern suggests an increased relative contribution of aquatic organic matter, such as phytoplankton (Barkow et al., 2021; Han et al., 2020), which typically has low C/N ratios. The average C/N ratios in the S.alterniflora and mixed zones were both 11.08, slightly higher than those in the mangrove zone. A comparison between June and November revealed significant summer–autumn differences in TN, TOC, and C/N ratios, reflecting shifts in external inputs, organic matter sources, and sedimentary nitrogen cycling processes.
Table 2
| Sites | S. alterniflora | Mixed | Mangrove(2020) | Mangrove(2019) | ||||
|---|---|---|---|---|---|---|---|---|
| June | November | June | November | June | November | June | November | |
| 1 | 11.02 | 8.32 | 50.57 | 10.74 | 66.08 | 6.72 | 10.41 | 7.46 |
| 2 | 14.09 | 15.31 | 48.16 | 10.95 | 8.72 | 7.44 | 11.90 | 7.13 |
| 3 | 10.47 | 9.60 | 1.12 | 11.25 | 7.82 | 8.54 | 86.92 | 7.59 |
| 4 | 15.13 | 12.40 | 38.81 | 11.00 | 8.50 | 9.06 | 11.44 | 7.61 |
| 5 | 11.89 | 11.55 | 49.26 | 9.91 | 9.42 | 7.15 | 16.84 | 7.13 |
| 6 | 12.89 | 12.06 | 41.68 | 16.45 | 8.21 | 7.20 | 22.65 | 8.43 |
| 7 | 18.01 | 9.41 | 48.35 | 9.14 | 10.41 | 8.50 | 13.05 | 11.71 |
| 8 | 24.83 | 10.00 | 45.57 | 10.82 | 51.37 | 8.05 | 12.24 | 7.42 |
| Mean ± SD | 14.79 ± 4.08 | 11.08 ± 2.08 | 46.06 ± 15.32 | 11.28 ± 2.88 | 21.32 ± 21.92 | 7.83 ± 0.77 | 23.18 ± 24.38 | 8.06 ± 1.43 |
C/N ratios across different sampling points.
Values in bold were excluded as outliers, mean values were calculated from valid data only.
3.3 Distribution of δ13C and δ15N in mangrove sediments
The stable carbon (δ¹³C) and nitrogen (δ¹ 5N) isotopic compositions of the sediment samples were analyzed, and the results are presented in Figure 3. The δ¹³C values ranged from −23.56‰ to −23.00‰, while the δ¹5N values varied between 4.08‰ and 4.66‰. The relatively low δ¹5N values (<5‰) across all sampling points suggest a limited influence from anthropogenic nitrogen sources. The spatial consistency in isotopic signatures across the estuary indicates relatively stable sources of organic matter and nitrogen inputs in the studied sedimentary environment.
Figure 3
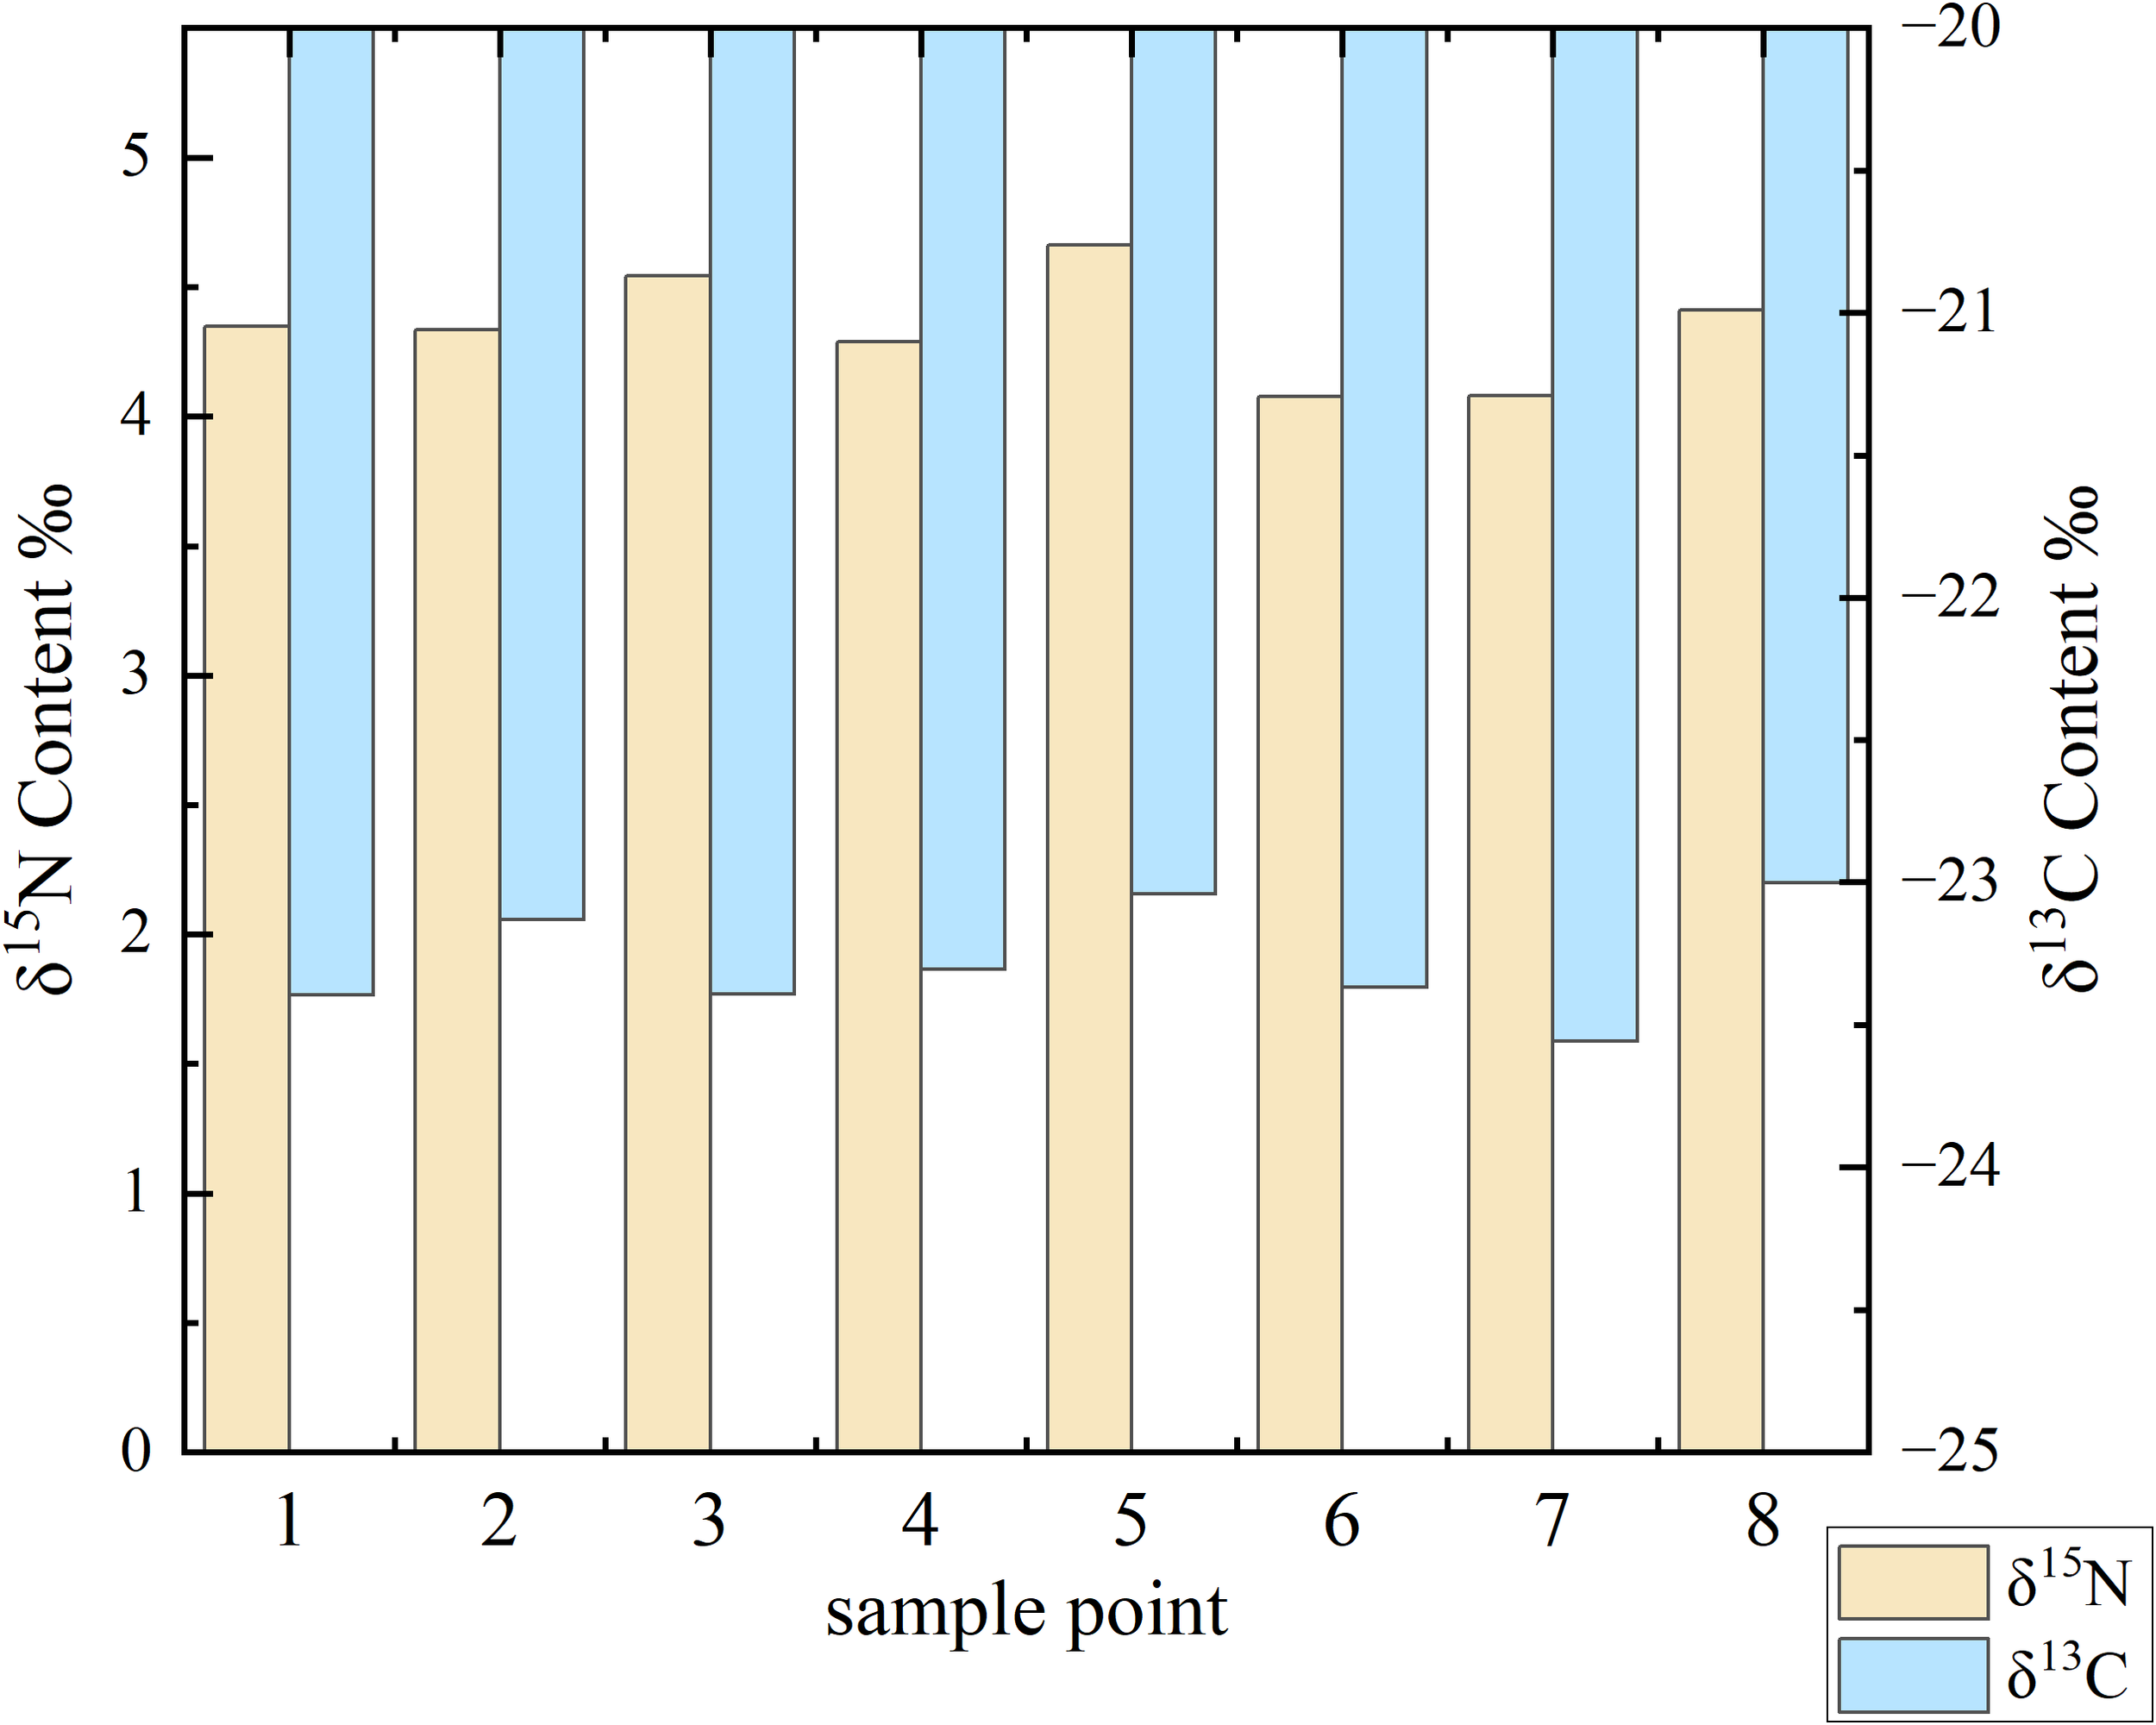
Distribution of δ¹³C and δ¹5N in Qingjiang estuary samples. Bar chart showing isotopic signatures at eight sampling points across the study area: Spartina alterniflora zone (points 1-2), mixed zone (points 3-4), mangrove zone planted in 2020 (points 5-6), and mangrove zone planted in 2019 (points 7-8). Yellow bars represent δ¹5N values (left y-axis), and blue bars represent δ¹³C values (right y-axis). The variation in isotopic composition reflects different organic matter sources and biogeochemical processes across the sampling locations.
Table 3 displays the contents of organic carbon and organic nitrogen in the sediments of the Qingjiang Estuary. The δ¹³C values were generally lower than those typically observed in aquaculture zones, indicating that the primary sources of organic matter were terrestrial C3 plants (characteristic δ¹³C range: −32.00‰ to −24‰). A correlation analysis between δ¹³C and δ¹5N revealed a moderate positive relationship (R² = 0.38), suggesting a linkage between carbon sources and nitrogen dynamics. δ¹³C serves as an indicator of organic matter origin, distinguishing inputs from C3 plants, C4 plants, marine algae, and anthropogenic sources. The δ¹5N values in the study area were significantly lower than those associated with fish feed (8.00‰–13.00‰), implying a predominant contribution from soil organic nitrogen or nitrogen-fixing vegetation, though slightly elevated values may still indicate minor anthropogenic nitrogen inputs.
Table 3
| Source | δ¹³C(‰) | δ¹5N(‰) | C/N | Data reference |
|---|---|---|---|---|
| Kandelia candel (C3 plants) | -32.0~-24.0 | 0.0~11.0 | >20.0 | (Tian et al., 2020) |
| S.alterniflora (C4 plants) | -15.8~-13.5 | 0.3~6.8 | 15.0~20.0 | (Wu et al., 2025) |
| Plankton and marine sources | -23.0~-16.0 | 6.0~12.0 | 4.0~10.0 | (Wang Y. L. et al., 2021) |
| Aquaculture industry | -28.8~-21.4 | 8.0 ~ 13.1 | 4.3 ~7.2 | (Wang et al., 2021) |
| Other land source | -27.0~-25.0 | 2.0~8.0 | 30.0~50.0 | (Zhang et al., 2024) |
Contents of organic carbon and organic nitrogen in Qingjiang Estuary sediments.
3.4 Nitrogen characteristic in response to sedimentary environmental factors
Based on the correlation matrix (Figure 4), TN shows significant positive correlations with both NH4+-N and NO3--N. The correlation coefficient between TN and NH4+-N is approximately 0.75, indicating a strong positive correlation, while TN and NO3--N show a moderate correlation (R≈0.5, light red). This indicates that the spatial distribution of TN is predominantly influenced by ammonium nitrogen, with nitrate nitrogen serving as a secondary factor, aligning with the aforementioned patterns of nitrogen distribution. From a seasonal standpoint, this correlation matrix is derived from a comprehensive data analysis conducted during June (summer) and November (autumn). Summer high temperatures not only promote organic matter decomposition leading to increased NH4+-N concentrations, but also enhanced hydrodynamic conditions increase oxygen input (Barkow et al., 2021; Iriarte et al., 2015), providing sufficient dissolved oxygen for nitrification. However, high organic matter loading in estuarine areas increases oxygen consumption, competing with nitrification for oxygen, potentially causing denitrification in locally anoxic zones (Iriarte et al., 2015). The combined effects of reduced temperatures and weakened hydrodynamics during autumn significantly impact dissolved oxygen levels, influencing nitrification intensity and altering the balance of transformation between NH4+-N and NO3--N. The weak positive correlation between NH4+-N and NO3--N (R≈0.3) observed across both seasons reflects these complex nitrogen transformation processes, which are governed by redox conditions and hydrodynamic factors.
Figure 4
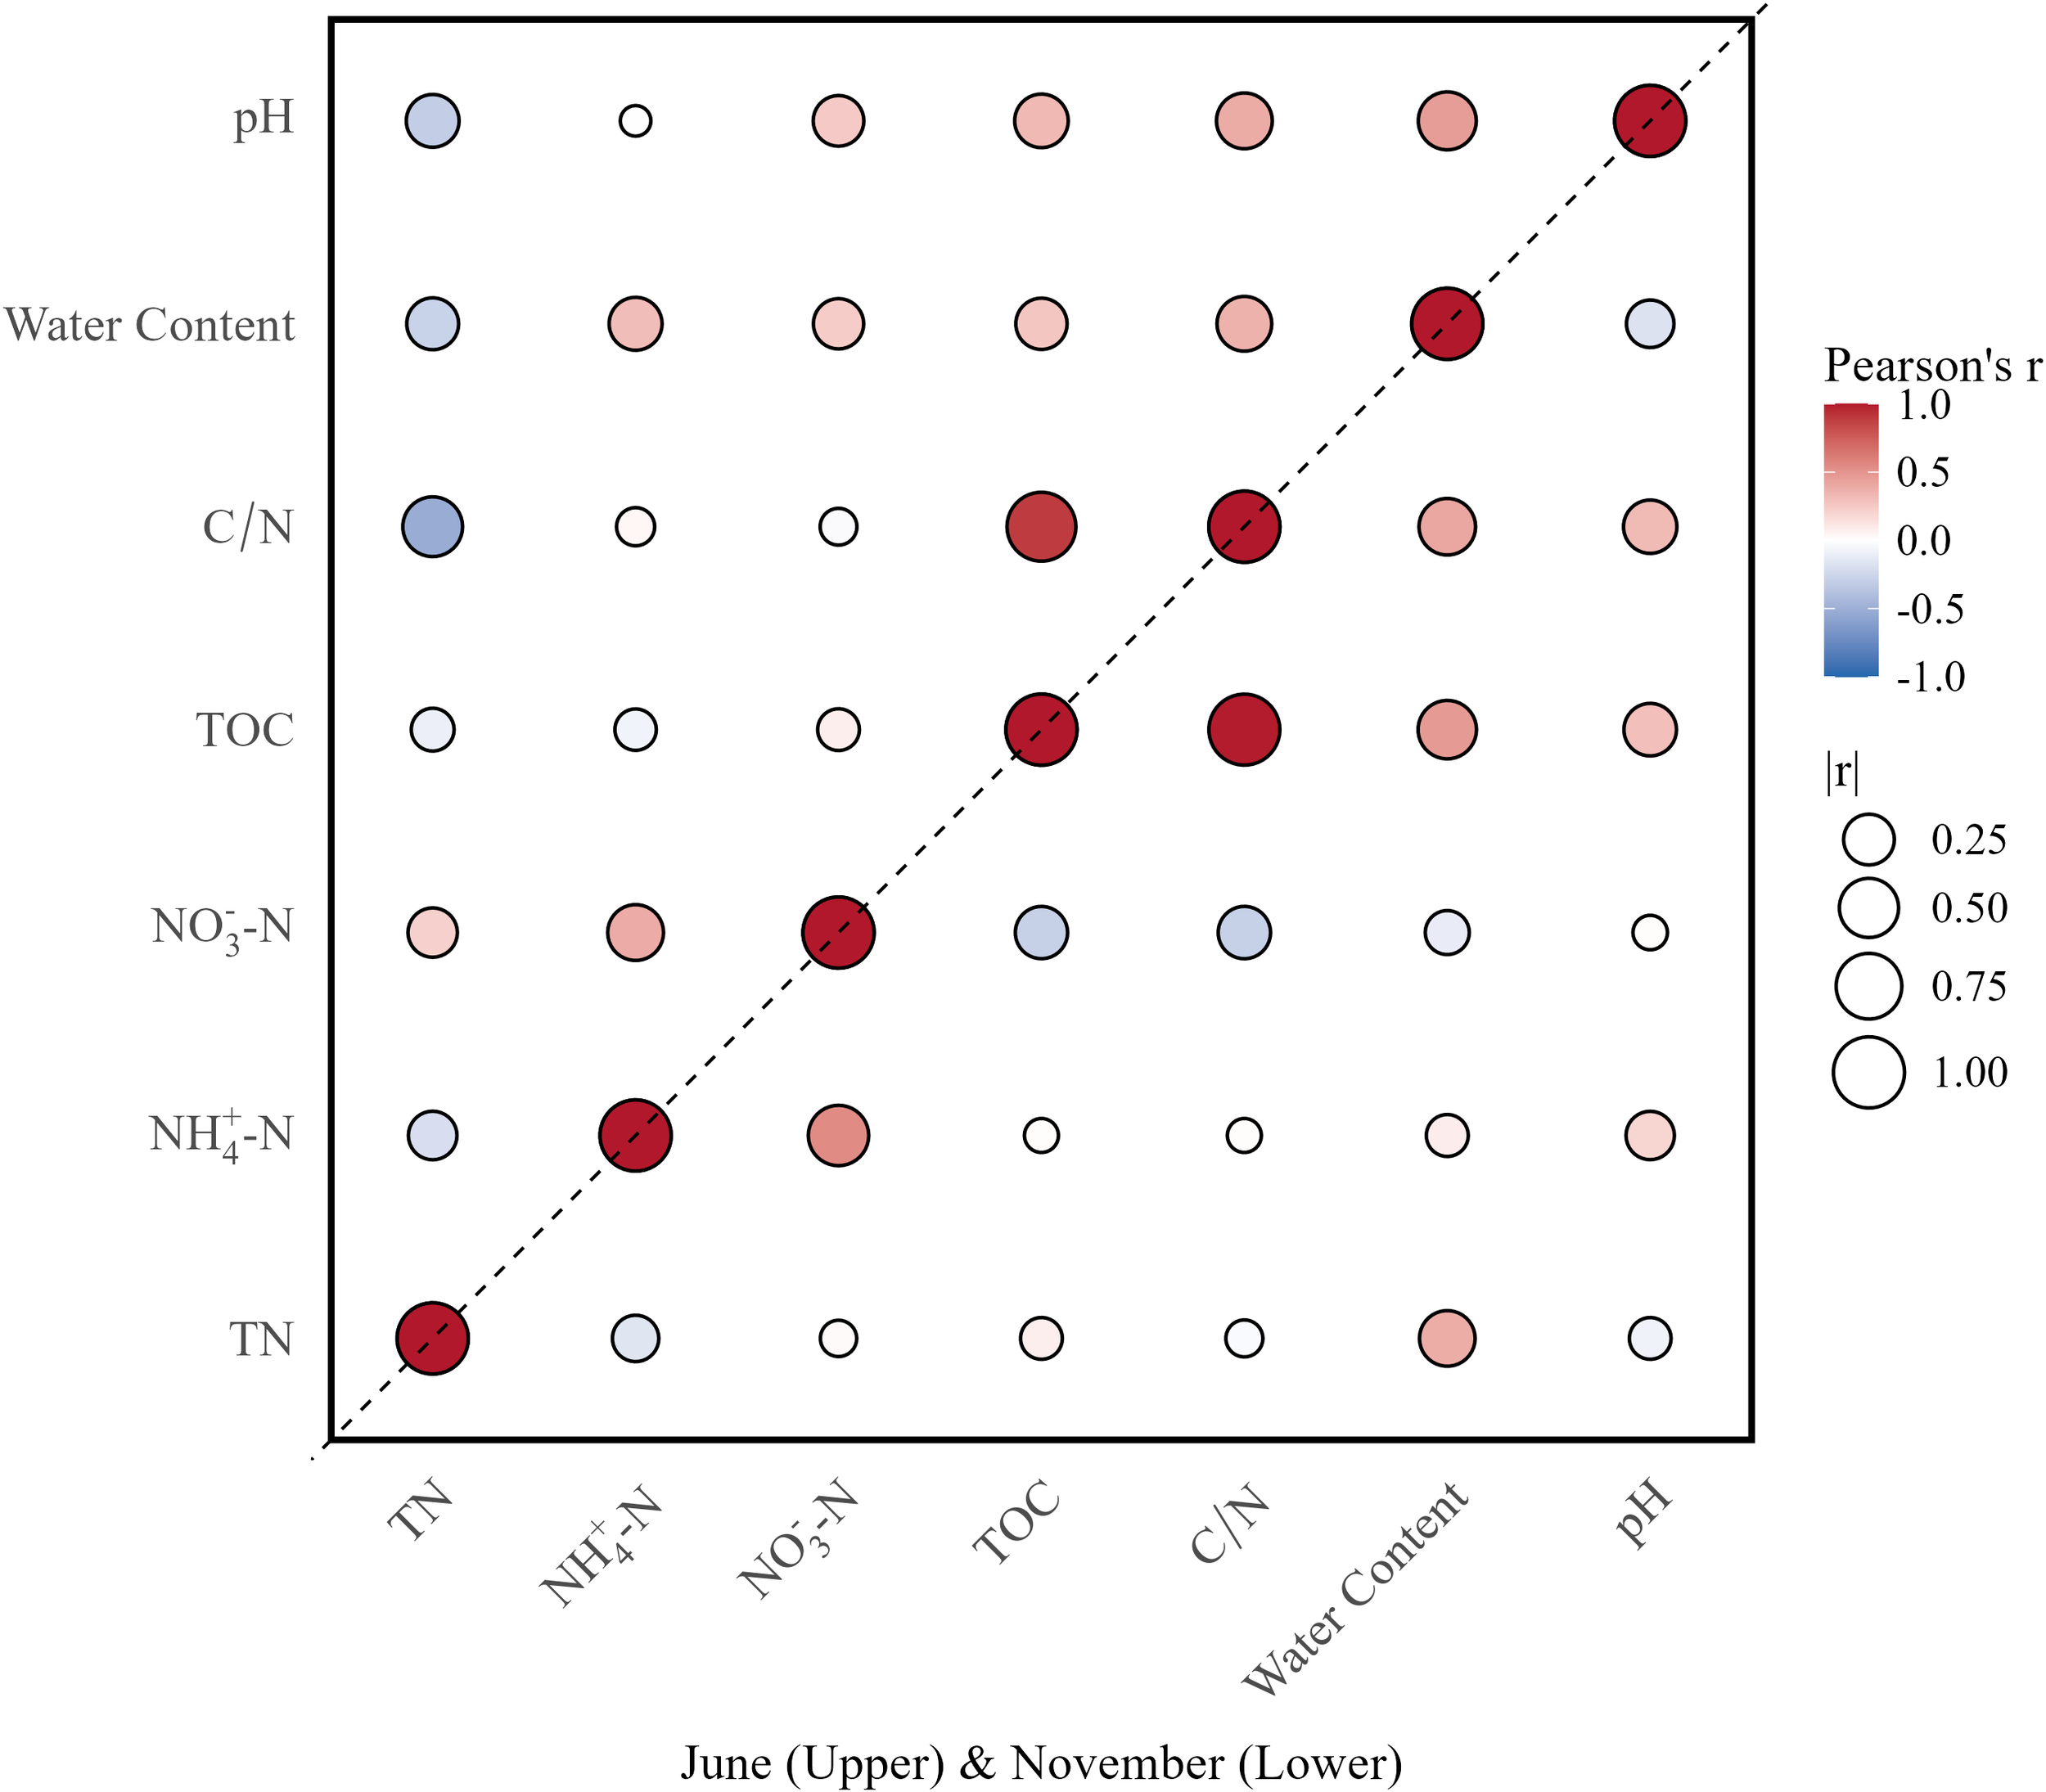
Half-matrix double season correlation plot showing autumn-summer seasonal relationships between environmental variables. The upper triangle represents June data and the lower triangle represents November data. Circle size indicates correlation strength (|r|), and color represents correlation direction (red for positive, blue for negative). Variables include total nitrogen (TN), ammonium (NH4-N), nitrate (NO3-N), total organic carbon (TOC), carbon-nitrogen ratio (C/N), water content, and pH.
Principal component analysis (PCA) was conducted based on environmental factors, including TN, NH4+-N, NO3--N, TOC, C/N, water content, and pH (Figure 5). The PCA revealed a clear seasonal separation of samples along the PC1 and PC2 axes, indicating that seasonal shifts in sedimentary environmental factors significantly influence nitrogen concentrations. The first two principal components together explained approximately 55.6% of the total variance (Figure 5). Although seasonal variations were evident, the overall sedimentary environment retained a degree of stability across seasons. PC1 was primarily associated with variations in TN, nitrate nitrogen, and water content, suggesting that these nitrogen components are likely driven by hydrodynamic conditions and seasonal changes in sediment moisture. PC2 mainly reflected variations in TOC, C/N, and pH, which are closely linked to seasonal organic matter inputs and decomposition processes.
Figure 5
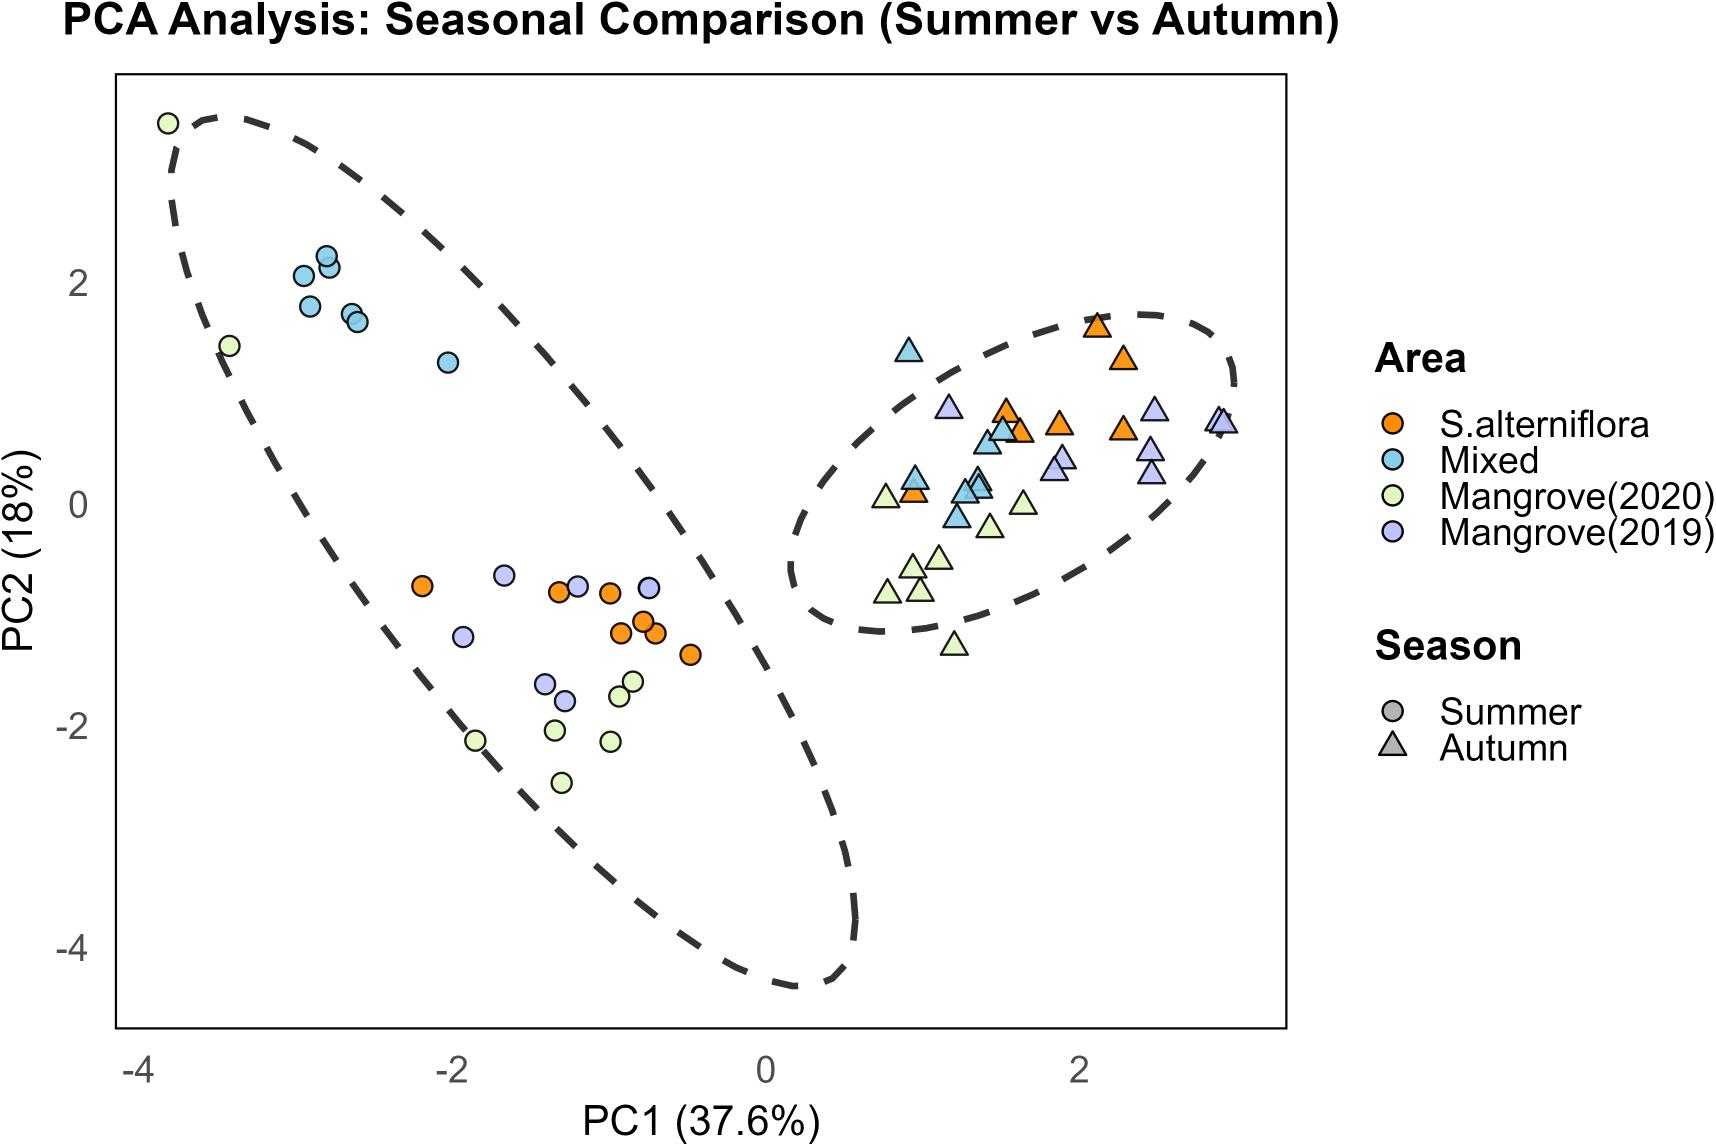
Summer-autumn differences in environmental factors: PCA results. Principal component analysis biplot showing the distribution of samples across four vegetation areas and two seasons. PC1 explains 37.6% and PC2 explains 18% of the total variance. Circles represent summer samples and triangles represent winter samples. Different colors distinguish vegetation types. Dashed ellipses indicate 95% confidence intervals for each group.
The Summer-Autumn dynamics of sediment nitrogen are driven by the interplay of redox conditions, biogeochemical processes, and plant interactions (Wang et al., 2024; Zhang et al., 2023). In autumn, reduced sediment water content enhances oxygen diffusion into the subsurface, promoting nitrification and raising TN and NO3--N concentrations, whereas NH4+-N remains relatively stable. Cooler temperatures and reduced organic inputs suppress heterotrophic denitrification, thereby facilitating nitrate storage. In contrast, the higher moisture levels in summer promote the formation of anaerobic sediment zones, which enhance denitrification and ammonification processes known to contribute to nitrogen loss in estuarine environments (Benelli et al., 2024). Active summer growth of Spartina alterniflora intensifies root uptake of inorganic nitrogen—including NH4+—while rhizospheric microbes (nitrifiers, denitrifiers, sulfur-oxidizers) rapidly cycle nitrogen under fluctuating redox conditions, as shown in tracer studies (Rolando et al., 2022; Zhang et al., 2022) Additionally, high levels of organic matter in the summer fuel heterotrophic consumption of oxygen, suppressing nitrifiers and favoring dissimilatory nitrate reduction to ammonium in sulfur-rich sediments (Wang C. et al., 2024).
These mechanisms collectively underscore that variations in sediment nitrogen are primarily controlled by seasonal shifts in water content, oxygen availability, plant uptake, and microbial community responses. During autumn, aerobic conditions and limited biotic consumption preserve nitrate, while in summer, the anaerobic wet environment and vigorous plant–microbe activity actively diminish sediment nitrogen. The observed spatiotemporal patterns across vegetation zones—from the buffered stability of mangroves to the seasonal variability of S.alterniflora—reflect how ecosystem structure modulates these environmental drivers to regulate nitrogen cycling.
3.5 Qualitative analysis of nitrogen source using C/N
The total nitrogen (TN) concentration in the Qingjiang Estuary exhibits a distinct decreasing trend from the river mouth towards the sea (Figure 2A). Terrestrial nitrogen inputs are concentrated near the river mouth and gradually become diluted or transformed further offshore. Table 2 outlines the spatial and seasonal variations of C/N ratios across various habitats—Spartina alterniflora, mixed vegetation, and mangrove zones—during summer (June) and autumn (November) in both 2019 and 2020. The data indicate significant seasonal differences in C/N ratios that are closely related to vegetation type and the sources of sedimentary organic matter.
Specifically, the mixed vegetation exhibits markedly elevated C/N ratios in summer (mean 46.06) compared to autumn (mean 11.28), suggesting an enhanced input of terrestrial high-C/N plant detritus during the fast growth season. This pattern likely reflects increased vegetation productivity and litter accumulation coupled with relatively reduced mineralization rates in summer (Shi et al., 2025; Yang et al., 2016). The lower autumn C/N ratios may result from intensified organic matter mineralization and nitrogen release, increasing the proportion of low-C/N organic components in sediments. In contrast, the mangrove habitat consistently maintains lower and less variable C/N ratios throughout seasons and years, with mean values ranging approximately from 7.8 to 23.2. This stability appears to indicate a more consistent source of sedimentary organic matter, likely originating from mangrove litter and associated decomposition processes, suggesting a relatively balanced organic matter cycle with reduced seasonal fluctuations (Manju et al., 2016; Resmi et al., 2016). The S.alterniflora habitat exhibits intermediate C/N ratios, with summer values (mean 14.79) slightly surpassing those in autumn (mean 11.08). This seasonal pattern is similar to that of the mixed zone, albeit with a lower magnitude, suggesting moderate seasonal dynamics in the input and degradation of organic matter. These variations are likely affected by differences in vegetation density, photosynthetic productivity, and localized hydrodynamic conditions.
Overall, the seasonal variability of C/N ratios highlights the heterogeneous nature of organic matter input and transformation within the sediments of the Qingjiang Estuary. Terrestrial high-C/N organic matter input increases during the summer, while mineralization processes are more prevalent in the autumn. The mixed and S.alterniflora zones show more pronounced seasonal responses, whereas the mangrove zone maintains a relatively stable organic matter composition throughout the year.
3.6 Quantitative source apportionment of nitrogen and related environmental drivers
3.6.1 Drivers of δ13C and δ15N in the mangrove sediments
δ¹³C and δ¹5N are effective tracers for identifying organic matter sources and nitrogen transformation processes. When combined with TOC, TN concentrations, and C/N ratios, these indicators can comprehensively reveal the carbon-nitrogen coupling relationships across different vegetation zones. The relationship between TOC and TN varied among the three habitats (Figure 6A). In the mixed vegetation zone, TOC and TN exhibited a strong positive correlation (R = 0.80), indicating a tightly coupled carbon and nitrogen cycling process. The regression intercept was small (less than 0.15%), suggesting that nitrogen in the sediments was predominantly present in organic forms (Zhang et al., 2025). However, a strong negative correlation was observed in the S.alterniflora zone (R = -0.41), indicating that total nitrogen concentrations tended to decrease as TOC increased. The negative slope suggests weak carbon fixation capacity in this zone (Ye et al., 2024), likely due to the lower root activity and limited productivity of S.alterniflora, which reduces the retention of external organic matter and nitrogen. The generally low TOC levels further suggest limited organic matter input and rapid decomposition, constraining nitrogen accumulation in sediments. In the mangrove zone, the TOC and TN exhibited a weaker linear relationship (R = 0.56). The complex root system, coupled with high plant-sediment interactions, creates a dynamic environment that may regulates nitrogen cycling in more intricate ways. Although mangrove sediments are crucial for nutrient biogeochemical cycling, their capacity to improve nitrogen retention is more complex. They potentially manage nitrogen movement and release through root zone processes, including oxidation-reduction reactions that could facilitate nitrification and denitrification (Dai et al., 2021). This intricacy results in a more dispersed distribution of data points compared to other zones where carbon and nitrogen cycles are more closely linked.
Figure 6
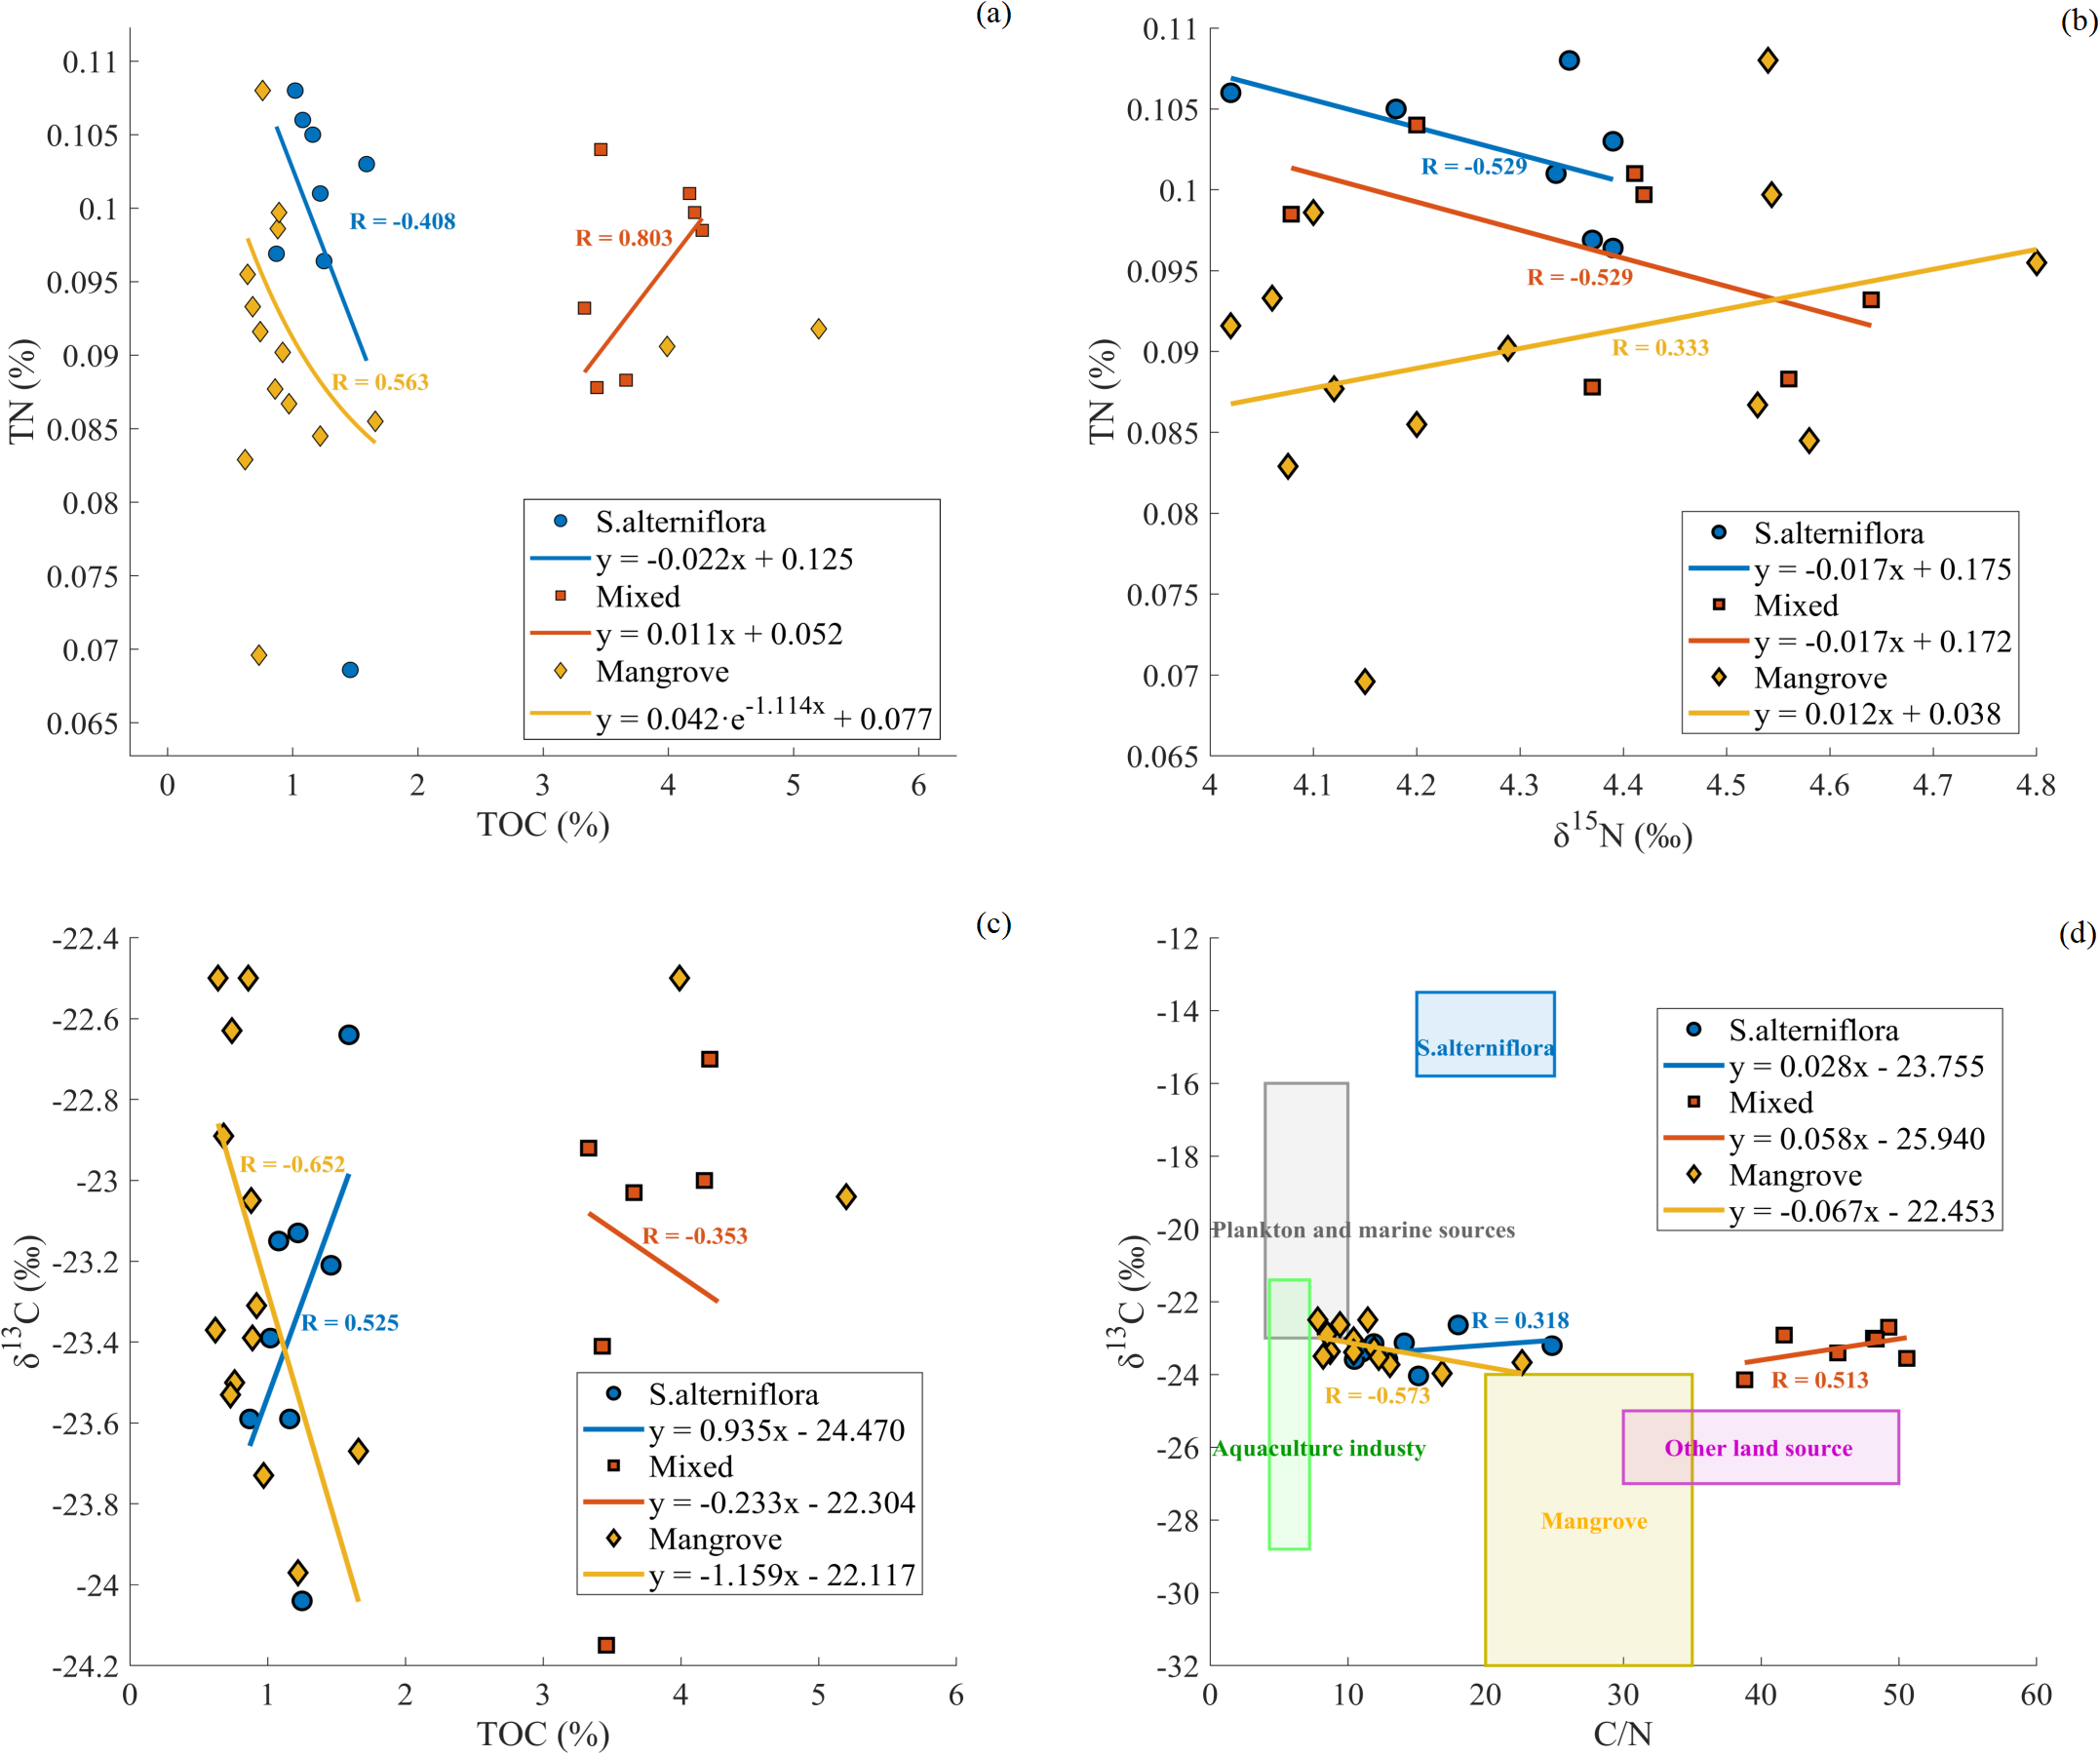
Correlation analysis of TN, TOC, δ¹³C, δ¹5N and C/N at the Qingjiang River Estuary. (A) TN vs TOC, (B) TN vs δ¹5N, (C) δ¹³C vs TOC, (D) δ¹³C vs C/N. Different symbols represent different vegetation areas: circles for S.alterniflora, squares for Mixed areas, and diamonds for Mangrove areas. Solid lines represent significant correlations (p < 0.05). The colored boxes in panel (D) indicate different organic matter sources.
The relationship between δ¹5N and TN revealed spatial heterogeneity in nitrogen cycling processes (Figure 6B). In both the S.alterniflora and mixed zones, δ¹5N exhibited a negative correlation with TN, indicating that substantial organic matter input diluted the nitrogen pool, resulting in sediments with higher δ¹5N signatures. The predominantly reductive conditions in these zones likely facilitated denitrification, while the substantial influx of plant-derived organic nitrogen diminished the δ¹5N enrichment effect (Cheng et al., 2016). Within the mangrove zone, δ¹5N values varied between 4.0‰ and 4.8‰ and exhibited weak correlations with TN, as revealed by our isotopic measurements. This complexity appears to result from: (1) multiple nitrogen sources, including wastewater, agricultural runoff, and tidal exchange, as indicated by the isotopic signatures, and (2)the spatial heterogeneity observed in our sampling data, which suggests intensified nitrogen transformation processes (Hong et al., 2024; Teixeira et al., 2024). The observed decrease in TN concentrations in the mangrove sediments reflects not only reduced nitrogen inputs but also the ecological regulatory capacity of mangroves in enhancing nitrogen migration and release through biogeochemical processes (Dai et al., 2021).
C/N ratios and δ¹³C values are widely used indicators for tracing the sources of organic matter in estuarine sediments. The δ¹³C-TOC relationship exhibits distinct patterns across vegetation zones (Figure 6C). In the mixed zone, δ¹³C values (ranging from -22‰ to -24‰ reflect combined inputs from S.alterniflora (C4 plant) and mangroves (C3 plants), yet they remain distinguishable from those of single-vegetation zones, likely due to differences in TOC concentrations. As TOC increases, δ¹³C values tend to stabilize around -23‰ in both the mixed and mangrove zones, suggesting stronger organic matter degradation in these areas. This degradation may lead to δ¹³C enrichment and shifts in C/N ratios. In the S.alterniflora and mangrove zones, δ¹³C values (ranging from -22‰ to -25‰ and low C/N ratios (10–25) indicate mixed organic matter sources, including inputs from C4 plants, C3 plants, marine organisms, and terrestrial debris.
The relationship between C/N ratios and δ¹³C further illustrated the complexity of organic matter sources across zones (Figure 6D). In the mixed zone, the high TOC levels and low C/N ratios indicate abundant and diverse organic inputs, which are characteristic of an ecological transition zone where organic matter is less degraded and better preserved. In contrast, in both the S.alterniflora and mangrove zones, lower TOC concentrations and higher C/N ratios suggest that organic matter is more rapidly decomposed (Shi et al., 2025; Yang et al., 2016), limiting nitrogen and carbon accumulation in these regions. The δ¹³C values in these zones reflect a mixture of sources, including terrestrial and marine inputs, with less degradation of organic matter compared to the mixed zone.
By analyzing the variations in stable isotope-nutrient correlations and their coupling relationships across different vegetation zones, this study underscores the spatial heterogeneity of carbon and nitrogen cycling within estuarine sediments. The established relationships and C/N ratios effectively delineate the extent of carbon-nitrogen coupling and the origins of nitrogen, offering a scientific foundation for comprehending how mangrove ecosystems react to external nutrient influxes.
3.6.2 Quantitative identification of nitrogen sources using the MixSIAR model
Upon conducting isotopic analysis of the sediment samples previously described, it was determined that terrigenous inputs were the primary sources of organic matter. To estimate the relative contributions of various potential sources, we applied the MixSIAR model in R, which integrates δ¹³C and δ¹5N values within a Bayesian mixing framework. The δ¹³C and δ¹5N ranges of these samples were analyzed. Five end-member sources were defined based on previous literature and field knowledge (Tian et al., 2020; Wang et al., 2021; Wang Y. L. et al., 2021; Wu et al., 2025; Zhang et al., 2024): Kandelia candel (C3 plants): –28.77‰ (δ¹³C), 5.50‰ (δ¹5N); Spartina alterniflora (C4 plants): –14.65‰ (δ¹³C), 3.58‰ (δ¹5N); Plankton and marine sources: –19.50‰ (δ¹³C), 9.00‰ (δ¹5N); Aquaculture industry: –26.50‰ (δ¹³C), 10.33‰ (δ¹5N); Other land sources: –26.0‰ (δ¹³C), 5.0‰ (δ¹5N).
The results indicated that Kandelia candel (C3 plants) contributed 22.8% to 25.3%, S.alterniflora (C4 plants) contributed 22.5% to 25.8%, Plankton and marine sources contributed 10.2% to 11.8%, the Aquaculture industry contributed 15.9% to 17.6%, and Other Land Sources contributed 24.1% to 25.2%. The δ¹³C and δ¹5N values of each sediment sample exhibited minimal fluctuations, and the contribution rates of organic matter from each source remained relatively constant, as depicted in Figure 7. The average contribution rates of each organic matter source revealed that Other Land Sources (24.6%) >were the greatest, followed by Kandelia candel (C3 plants) (23.83%), S.alterniflora (C4 plants) (23.75%), the Aquaculture industry (16.7%), >and Plankton and marine sources (11.12%). These findings elucidated the multi-source characteristics of sediment organic matter in the mangrove area. The sediment organic matter in the mangrove forest area of the Qingjiang Estuary predominantly originates from terrestrial plants (encompassing C3 and C4 plants) and other terrestrial sources.
Figure 7
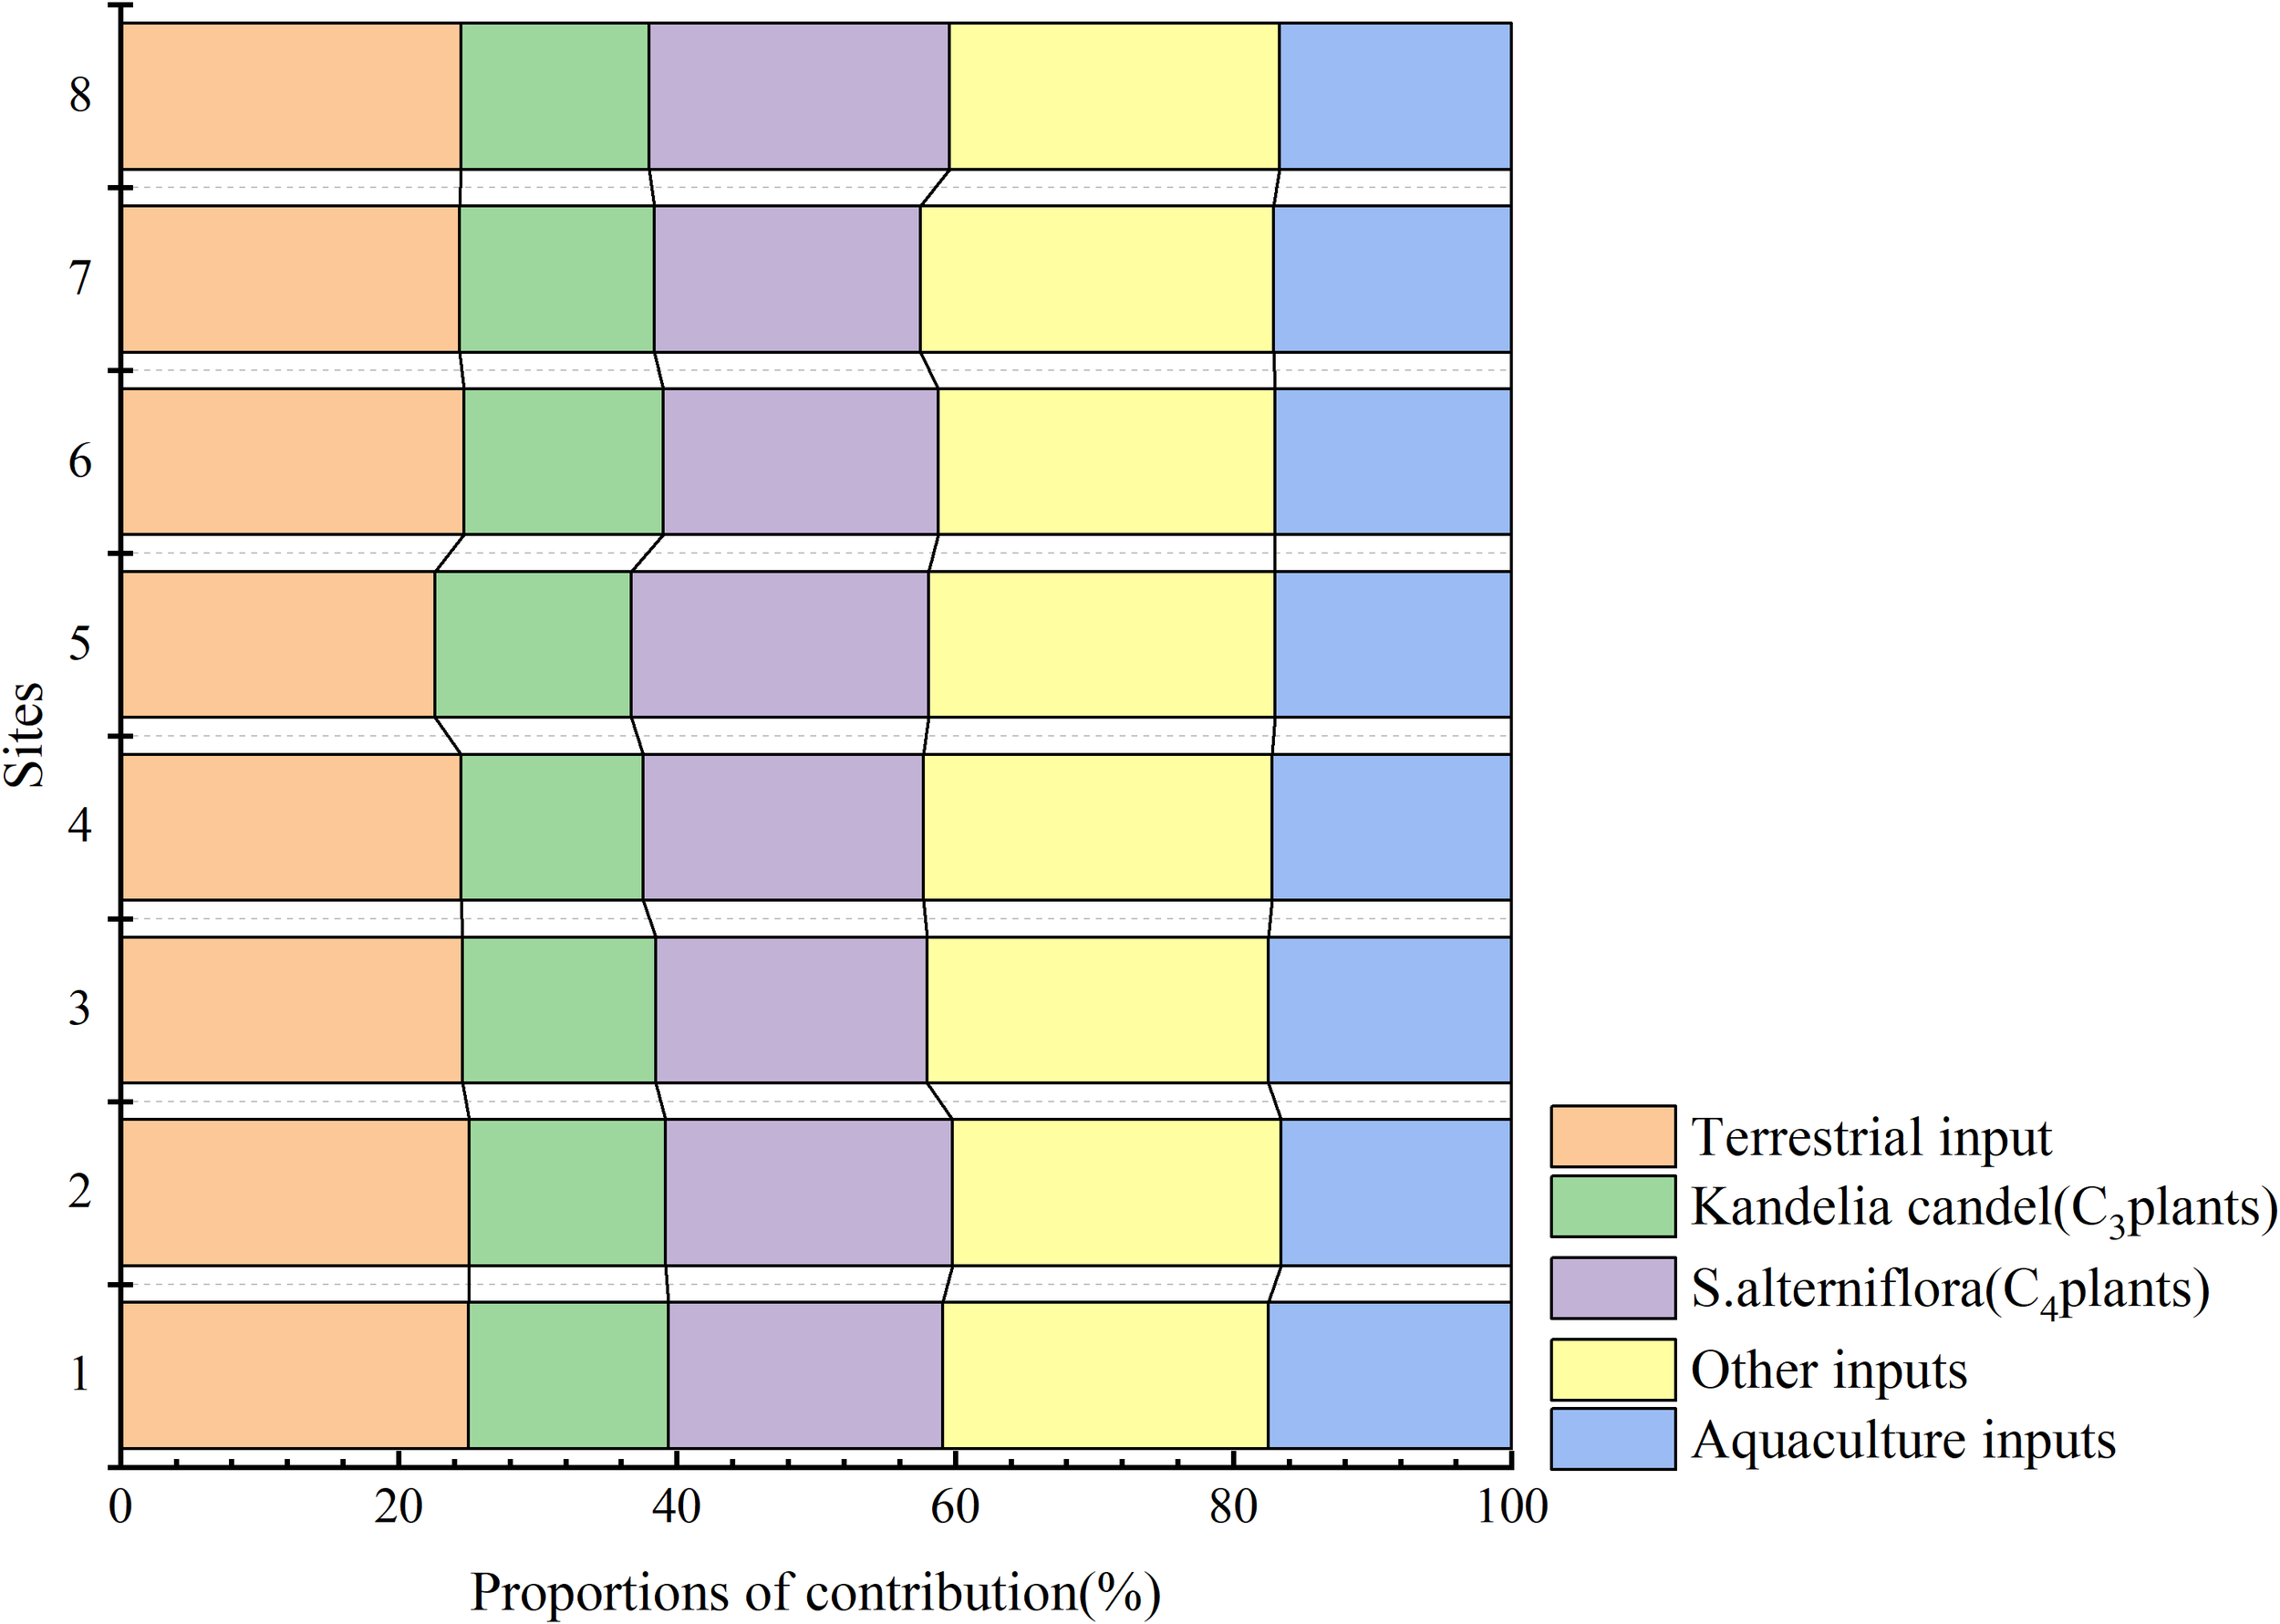
Distribution of contribution rates of five potential sources to sediment organic matter. Stacked bar chart showing the relative contributions (%) of different organic matter sources across eight sampling sites. Sources include terrestrial input (orange), Kandelia candel C3 plants (green), S.alterniflora C4 plants (purple), other inputs (yellow), and aquaculture inputs (blue). Results were calculated using isotope mixing models.
The complex root systems of mangrove forests effectively intercept a large amount of organic matter, and their litter contributes even more organic matter to the surface sediments. The hydrodynamic forces in the mangrove forest area are weak, allowing fine particulate matter to settle easily, and making it easier to capture and preserve terrigenous organic matter 22.3(Dai et al., 2021; Huang et al., 2024). For example, clay and silt-grade sediments adsorb organic matter more efficiently than sandy sediments (Han et al., 2020). The contribution rate of marine phytoplankton was the lowest, indicating that the dense pillar roots and tabular roots of mangroves formed a natural barrier, which effectively intercepted terrestrial organic matter and hindered the input of marine plankton debris (Mosquera et al., 2023). Tidal reciprocating currents make it difficult for most of the suspended solids to remain in mangrove sedimentary areas for a long time (Dias et al., 2016).
4 Conclusions
This study revealed significant spatial and temporal variations in sedimentary carbon and nitrogen forms in the different vegetation communities of the Qingjiang Estuary. At a spatial scale, total organic carbon (TOC) concentrations in sediments were significantly higher in the Spartina alterniflora-mangrove mixed zone compared to the single-species S.alterniflora and mangrove plant zones. The broader TOC range in the mixed zone suggests more diverse organic matter sources, while lower TOC levels in the other zones indicate that vegetation type plays an important regulatory role in sediment organic matter accumulation. At a temporal scale, seasonal analysis of nitrogen forms (TN, NO3--N, and NH4+-N) revealed distinct significant variations in summer and autumn. TN and NO3--N were closely linked to changes in sediment water content based on the PCA results, highlighting the critical role of summer-autumn seasonal hydrodynamic conditions and sediment moisture in regulating nitrogen transformations. Stable isotope analyses (δ¹³C and δ¹5N) confirmed that terrestrial sources were the dominant contributors to sedimentary organic matter. In particular, mangrove sediments were primarily derived from terrestrial plants (C3 and C4 species) and riverine inputs. The extensive mangrove root systems also facilitated the trapping and retention of organic matter. Anthropogenic nitrogen inputs, mainly from aquaculture activities, contributed approximately 16.7% to the total nitrogen sources, highlighting the ongoing influence of human activities in the estuary. These results will advance our current understanding of nitrogen source processes in China’s northernmost mangrove estuary and provide valuable scientific references for nutrient management, pollution control, and wetland restoration in temperate coastal ecosystems. Future studies should extend sampling to spring and winter to establish a more complete annual cycle and strengthen the generalization of seasonal dynamics.
Statements
Data availability statement
The raw data supporting the conclusions of this article will be made available by the authors, without undue reservation.
Author contributions
QT: Writing – original draft, Formal Analysis. YZ: Writing – original draft, Data curation. SS: Writing – original draft, Methodology. YL: Writing – original draft, Data curation. LN: Writing – original draft, Resources, Supervision, Writing – review & editing.
Funding
The author(s) declare that financial support was received for the research and/or publication of this article. This research was supported by the Science and Technology Program of Zhejiang Provincial Water Resources Department (RC2436), Zhejiang Provincial “Pioneer” and “Lead Goose” R&D Breakthrough Project (2024C02002), Zhejiang Provincial Natural Science Foundation Project (LGEY25E090012), and National Natural Science Foundation of China (51709289).
Conflict of interest
YL was employed by Zhejiang Guangchuan Consulting Co., Ltd.
The remaining authors declare that the research was conducted in the absence of any commercial or financial relationships that could be construed as a potential conflict of interest.
Generative AI statement
The author(s) declare that no Generative AI was used in the creation of this manuscript.
Any alternative text (alt text) provided alongside figures in this article has been generated by Frontiers with the support of artificial intelligence and reasonable efforts have been made to ensure accuracy, including review by the authors wherever possible. If you identify any issues, please contact us.
Publisher’s note
All claims expressed in this article are solely those of the authors and do not necessarily represent those of their affiliated organizations, or those of the publisher, the editors and the reviewers. Any product that may be evaluated in this article, or claim that may be made by its manufacturer, is not guaranteed or endorsed by the publisher.
References
1
Aljahdali M. O. Alhassan A. B. (2025). Marine food web trophic interaction of trace elements and stab le isotopes of carbon and nitrogen in Rabigh lagoon, Red Sea, Saudi Arabia. Sci. Total Environ.975, 179245. doi: 10.1016/j.scitotenv.2025.179245
2
Andrisoa A. Stieglitz T. C. Masimana M. Sambo B. Raimbault P. Mahafina J. (2024). Carbon and nitrogen sources in tropical coastal lagoon food webs under variable hydrological conditions. Estuarine Coast. Shelf Sci.309, 108975. doi: 10.1016/j.ecss.2024.108975
3
Barkow I. S. Oswald S. E. Lensing H. J. Munz M. (2021). Seasonal dynamics modifies fate of oxygen, nitrate, and organic micropollutants during bank filtration—Temperature-dependent reactive transport modeling of field data. Environ. Sci. pollut. Res.28, 9682–9700. doi: 10.1007/s11356-020-11002-9
4
Benelli S. Bartoli M. Magri M. Brzana R. Kendzierska H. Styrcz-Olesiak K. et al . (2024). Spatial and seasonal pattern of microbial nitrate reduction in coastal sediments in the Vistula River plume area, Gulf of Gdańsk. Front. Mar. Sci.11. doi: 10.3389/fmars.2024.1333707
5
Bernhard A. E. Bollmann A. (2010). Estuarine nitrifiers: New players, patterns and processes. Estuarine Coast. Shelf Sci.88, 1–11. doi: 10.1016/j.ecss.2010.01.023
6
Cheng J. H. Dou Z. Y. Sun Q. Y. (2016). Distribution characteristics of nitrifiers and denitrifiers in the river sediments of Tongling City. Huan Jing Ke Xue37, 1362–1370. doi: 10.13227/j.hjkx.2016.04.022
7
Dai Z. J. Zhou X. Y. Wang J. Hu B. Q. (2021). Review and prospect of mangrove tidal flat sedimentary dynamics. J. Trop. Oceanography40, 69–75. doi: 10.11978/YG2020007
8
Damashek J. Francis C. A. (2018). Microbial nitrogen cycling in estuaries: from genes to ecosystem processes. Estuaries Coasts41, 626–660. doi: 10.1007/s12237-017-0306-2
9
Dias F. J. D. S. Castro B. M. Lacerda L. D. Miranda L. B. Marins R. V. (2016). Physical characteristics and discharges of suspended particulate matter at the continent-ocean interface in an estuary located in a semiarid region in northeastern Brazil. Estuarine Coast. Shelf Sci.180, 258–274. doi: 10.1016/j.ecss.2016.08.006
10
Ding T. P. (2002). Present status and prospect of analytical techniques and reference materials for stab le isotopes. Rock Mineral Anal.4, 291–300. doi: cnki:sun:ykcs.0.2002-04-011
11
Du J. Zhang Y. Wang X. Lou Y. Zhang F. Xing Q. et al . (2025). Carbon and nitrogen characteristics and sediment organic matter sources tracing across vegetation zones of liaohe estuarine saltmarsh, Northeast China. Mar. pollut. Bull.220, 118422. doi: 10.1016/j.marpolbul.2025.118422
12
Han Y. Q. Xia J. Tan J. Q. Abarike G. A. Song Z. G. (2020). Distribution and controlling factors of organic carbon in surface sediments of the coastal region surrounding Leizhou Peninsula. Mar. Sci.44, 93–103. doi: 10.11759/hykx20191012002
13
Hong Y. He Z. Liu R. Xiang W. Lei P. Fang X. (2024). Artificial cultivation of aquatic plants promotes nitrogen transformation and the abundance of key functional genes in agricultural drainage ditch sediments in the yellow river irrigation area in China. Land13, 1557. doi: 10.3390/land13101557
14
Huang X. Feng J. Yang Q. Chen L. Zhang J. Yang B. et al (2023). High site elevation enhanced nitrogen fixation and the stability of diazotrophic community in planted Sonneratia apetala mangrove sediments. Appl. Soil Ecol.193, 105130. doi: 10.1016/j.apsoil.2023.105130.
15
Huang Y. Song B. Zhang Q. Park Y. Wilson S. J. Tobias C. R. et al (2024). Seawater intrusion effects on nitrogen cycling in the regulated Nakdong River Estuary, South Korea. Front. Mar. Sci.11. doi: 10.3389/fmars.2024.1369421.
16
Iriarte A. Villate F. Uriarte I. Alberdi L. Intxausti L. (2015). Dissolved oxygen in a temperate estuary: the influence of hydro-climatic factors and eutrophication at seasonal and inter-annual time scales. Estuaries Coasts38, 993–1005. doi: 10.1007/s12237-014-9870-x
17
Ishfaq M. Tam N. F. Y. Lang T. Hussain M. Zhou H. (2025). Nitrogen-phosphorus conservation and trade-offs in mangroves. Plant Soil. 512, 241–260. doi: 10.1007/s11104-024-07130-7
18
Lê S. Josse J. Husson F. (2008). FactoMineR: An R Package for Multivariate Analysis. J. Stat. Softw.25, 1–18. doi: 10.18637/jss.v025.i01.
19
Legendre P. Anderson M. J. (1999). Distance-based redundancy analysis: Testing multispecies responses in multifactorial ecological experiments. Ecol. Monogr.69, 1–24. doi: 10.1890/0012-9615(1999)069[0001:DBRATM]2.0.CO;2.
20
Li C. Wang F. Yang P. Wang F. C. Hu Y. Z. Zhao Y. L. et al . (2024). Mangrove wetlands distribution status identification, changing trend analyzation and carbon storage assessment of China. China Geology7, 1–11. doi: 10.31035/cg2023049
21
Li D. Yan J. Lu Z. Chu T. Li J. Chu T. (2023). Use of δ13C and δ15N as indicators to evaluate the influence of sewage on organic matter in the zhangjiang mangrove–estuary ecosystem, southeastern China. Water15, 3660. doi: 10.3390/w15203660
22
Liu X. Stock C. A. Dunne J. P. Lee M. Shevliakova E. Malyshev S. et al . (2021). Simulated global coastal ecosystem responses to a half-century increase in river nitrogen loads. Geophysical Res. Lett.48, e2021GL094367. doi: 10.1029/2021GL094367
23
Manju M. N. Resmi P. Ratheesh Kumar C. S. Gireeshkumar T. R. Chandramohanakumar N. Joseph M. M. (2016). Biochemical and sta ble carbon isotope records of mangrove derived organic matter in the sediment cores. Environ. Earth Sci.75, 565. doi: 10.1007/s12665-016-5245-x
24
Mosquera E. Blanco-Libreros J. F. Riascos J. M. (2023). Are urban mangroves emerging hotspots of non-indigenous species? A study on the dynamics of macrobenthic fouling communities in fringing red mangrove prop roots. Biol. Invasions25, 787–800. doi: 10.1007/s10530-022-02944-x
25
Nie J. Feng H. Witherell B. B. Alebus M. Mahajan M. D. Zhang W. et al . (2018). Causes, assessment, and treatment of nutrient (N and P) pollution in rivers, estuaries, and coastal waters. Curr. pollut. Rep.4, 154–161. doi: 10.1007/s40726-018-0083-y
26
Oksanen J. Blanchet F.G. Friendly M. Kindt R. Legendre P. McGlinn D. et al . (2017). vegan: Community Ecology Package. R package version 2.4-3. Available online at: https://CRAN.R-project.org/package=vegan.
27
Parnell A. C. Phillips D. L. Bearhop S. Semmens B. X. Ward E. J. Moore J. W. et al . (2013). Bayesian sta ble isotope mixing models. Environmetrics24, 387–399. doi: 10.1002/env.2221
28
R Core Team . (2024). R: A Language and Environment for Statistical Computing. (Vienna: R Foundation for Statistical Computing). Available online at: https://www.R-project.org/.
29
Resmi P. Gireeshkumar T. R. Ratheesh Kumar C. S. Chandramohanakumar N. (2016). Source characterization of Sedimentary organic matter in mangrove ecosystems of northern Kerala, India: Inferences from bulk characterization and hydrocarbon biomarkers. Regional Stud. Mar. Sci.7, 43–54. doi: 10.1016/j.rsma.2016.05.006
30
Rolando J. L. Kolton M. Song T. Kostka J. E. (2022) The core root microbiome of Spartina alterniflora is predominated by sulfur-oxidizing and sulfate-reducing bacteria in Georgia salt marshes, USAMicrobiome10, 37. doi: 10.1186/s40168-021-01187-7
31
Sadowski M. S. Regmi P. M. Wett B. Murthy S. Bott C. B. (2015). Comparison of aeration strategies for optimization of nitrogen removal in an A/B process: DO, ABAC, and avN control. WEFTEC2015 (19), 4905–4916. doi: 10.2175/193864715819541492
32
Shi P. Tan Z. Fu Y. Xu M. N. Zhao R. Shang L. et al . (2025). Nitrogen utilization dynamics in a tropical estuary: Interplay of temperature and phytoplankton communities. Mar. Environ. Res.205, 107018. doi: 10.1016/j.marenvres.2025.107018
33
Stock B. C. Jackson A. L. Ward E. J. Parnell A. C. Phillips D. L. Semmens B. X. (2018). Analyzing mixing systems using a new generation of Bayesian tracer mixing models. PeerJ6, e5096. doi: 10.7717/peerj.5096
34
Teixeira P. P. C. Vidal A. Teixeira A. P. M. Souza I. F. Hurtarte L. C. C. Silva D. H. S. et al . (2024). Decoding the rhizodeposit-derived carbon’s journey into soil organic matter. Geoderma443, 116811. doi: 10.1016/j.geoderma.2024.116811
35
Tian F. Y. He X. Q. Zhu B. Z. Gong F. Zhu Q. K. (2023). Remote sensing study of tidal flat area change in Yueqing Bay in recent 30 years considering tidal level correction. J. Mar. Sci.41, 68–81. doi: 10.3969-j.issn.1001-909X.2023.01.006
36
Tian Y. Yan C. Wang Q. Ma W. Yang D. Liu J. et al . (2020). Glomalin-related soil protein enriched in δ13C and δ15N excels at storing blue carbon in mangrove wetlands. Sci. Total Environ.732, 138327. doi: 10.1016/j.scitotenv.2020.138327
37
Tong C. An F. W. Zhang J. B. Qu K. C. Meng Y. Q. (2020). Analysis of tidal wave deformation and asymmetry inside and outside Yueqing Bay. Ocean Eng.38, 113–123. doi: 10.16483/j.issn.1005-9865.2020.03.012
38
Wang C. He T. Zhang M. Zheng C. Yang L. Yang L. (2024). Review of the mechanisms involved in dissimilatory nitrate reduction to ammonium and the efficacies of these mechanisms in the environment. Environ. pollut.345, 123480. doi: 10.1016/j.envpol.2024.123480
39
Wang F. Lu Z. Tobias C. R. Wang Y. Xiao K. Yu Q. et al . (2023). Salt marsh expansion into estuarine mangrove mudflats reduces nitrogen removal capacity. Catena232, 107459. doi: 10.1016/j.catena.2023.107459
40
Wang Y. L. Wang N. Li H. Jiang F. Chen L. J. Chang B. K. (2021). Distribution characteristics and sedimentary environment analysis of sediments in the northern sea area of eastern coastal new city in Weihai City. Shandong Land Resour.40, 37–42. doi: 10.1016/j.quaint.2021.03.034
41
Wang M. L. Xiong X. He C. Zhao Q. Y. Liu (2021). Sources of sedimentary organic matter from the cage fish farm in Lake Poyang, China. J. Lake Sci.33, 158–167. doi: 10.18307/2021.0108
42
Wiegner T. N. Mokiao-Lee A. U. Johnson E. E. (2016). Identifying nitrogen sources to thermal tide pools in Kapoho, Hawai’i, U.S.A, using a multi-stab le isotope approachMar. pollut. Bull.103, 63–71. doi: 10.1016/j.marpolbul.2015.12.046
43
Wu X. Zhao X. Gu W. F. Zhu K. H. Ge Z. M. (2025). Comparative study on soil carbon sinks of artificial Kandelia obovata mangrove and Spartina alterniflora salt marsh in the southern Zhejiang coastal zone. J. Trop. Oceanography44, 172–181. doi: 10.11978/2024052
44
Yang W. An S. Zhao H. Xu L. Qiao Y. Cheng X. (2016). ). Impacts of Spartina alterniflora invasion on soil organic carbon and nitrogen pools sizes, stability, and turnover in a coastal salt marsh of eastern China. Ecol. Eng.86, 174–182. doi: 10.1016/j.ecoleng.2015.11.010
45
Yang Q. Ma L. Qiu K. Feng Z. Wang Y. Zhong Z. et al . (2024). Characterization and risk assessment of microplastics in laver from the Yueqing Bay. Mar. Environ. Res.193, 106258. doi: 10.1016/j.marenvres.2023.106258
46
Yang X. Wu P. Yin A. Zhang H. Zhang M. Gao C. (2017). Distribution and source analysis of heavy metals in soils and sediments of Yueqing Bay basin, East China Sea. Mar. pollut. Bull.115, 489–497. doi: 10.1016/j.marpolbul.2016.11.046
47
Yao W. Hu C. Yang X. Shui B. (2021). Spatial variations and potential risks of heavy metals in sediments of Yueqing Bay, China. Mar. pollut. Bull.173, 112983. doi: 10.1016/j.marpolbul.2021.112983
48
Ye Q. Hou C. Wang Q. Gao C. Stefanik K. Li F. et al . (2024). Stocks and Sources of Soil Carbon and Nitrogen in Non-Native Kandelia obovata Afforestation and Spartina alterniflora Invasion: A Case Study on Northern Margin Mangroves in the Subtropical Coastal Wetlands of China. Water16, 866. doi: 10.3390/w16060866
49
Yin X. Chen L. Tang D. Zhang Y. Liu G. Hua Y. et al . (2019). Seasonal and vertical variations in the characteristics of the nitrogen-related functional genes in sediments from urban eutrophic lakes. Appl. Soil Ecol.143, 80–88. doi: 10.1016/j.apsoil.2019.05.027
50
Zhang L. Bai J. Zhai Y. Zhang K. Wang Y. Tang R. et al . (2024). Seasonal changes in N-cycling functional genes in sediments and their influencing factors in a typical eutrophic shallow lake, China. Front. Microbiol.15. doi: 10.3389/fmicb.2024.1363775
51
Zhang P. Li X. Yue F. J. Zhang Y. Wang Y. Wu D. et al . (2025). Anthropogenic nitrogen inputs favor increased nitrogen and organic carbon levels in Qinghai–Tibetan Plateau lakes: Evidence from sedimentary records. Water Res.277, 123330. doi: 10.1016/j.watres.2025.123330
52
Zhang Y. F. Li T. Zhang L. Hu Q. Liu Z. Y. Zhu J. Q. et al . (2023). Simulation the impact of terrestrial input on phytoplankton communities in Changhu Lake in summer. J. Hydroecology1 (2), 167–189. doi: 10.15928/j.1674-3075.202306050153
53
Zhang Z. Nie S. Sang Y. Mo S. Li J. Kashif M. et al . (2022). Effects of spartina alterniflora invasion on nitrogen fixation and phosphorus solubilization in a subtropical marine mangrove ecosystem. Microbiol. Spectr.10, e00682–e00621. doi: 10.1128/spectrum.00682-21
54
Zhao Z. Zhang M. Chen Y. Ti C. Tian J. He X. et al . (2022). Traceability of nitrate polluted hotspots in plain river networks of the Yangtze River delta by nitrogen and oxygen isotopes coupling bayesian model. Environ. pollut.315, 120438. doi: 10.1016/j.envpol.2022.120438
Summary
Keywords
Qingjiang Estuary, mangrove sediments, nitrogen dynamics, source analysis, stable isotopes
Citation
Tan Q, Zhong Y, Sun S, Luo Y and Niu L (2025) Characteristic and source quantification of nitrogen in sediments of a subtropical mangrove estuary. Front. Mar. Sci. 12:1684073. doi: 10.3389/fmars.2025.1684073
Received
12 August 2025
Accepted
13 October 2025
Published
03 November 2025
Volume
12 - 2025
Edited by
Kejun Yang, Sichuan University, China
Reviewed by
Yue Li, East China Normal University, China; Li Xu, Fourth Institute of Oceanography, Ministry of Natural Resources, China
Updates
Copyright
© 2025 Tan, Zhong, Sun, Luo and Niu.
This is an open-access article distributed under the terms of the Creative Commons Attribution License (CC BY). The use, distribution or reproduction in other forums is permitted, provided the original author(s) and the copyright owner(s) are credited and that the original publication in this journal is cited, in accordance with accepted academic practice. No use, distribution or reproduction is permitted which does not comply with these terms.
*Correspondence: Lixia Niu, niulixia@mail.sysu.edu.cn
Disclaimer
All claims expressed in this article are solely those of the authors and do not necessarily represent those of their affiliated organizations, or those of the publisher, the editors and the reviewers. Any product that may be evaluated in this article or claim that may be made by its manufacturer is not guaranteed or endorsed by the publisher.