 Khaled Mohammed-Geba1
 Ahmed Mohamed Elamin2Arwa Hassan2
 Essmat Mohammed2
 Alaa-Eldin Salah-Eldin2
 Eric J. Schott3
 Asmaa Galal-Khallaf1*
- 1Molecular Biology and Biotechnology Laboratory, Zoology Department, Faculty of Science, Menoufia University, Menoufia, Egypt
- 2Zoology Department, Faculty of Science, Aswan University, Aswan, Egypt
- 3Institute of Marine and Environmental Technology (IMET), University of Maryland Center for Environmental Science (UMCES), Baltimore, MD, United States
Introduction: Mangroves play a vital role in stabilizing coastlines, supporting biodiversity, and delivering essential ecosystem services.
Methods: To assess animal biodiversity in Avicennia marina (grey mangrove) habitats along Egypt’s Red Sea governorate’s coast, seawater samples were collected for environmental DNA (eDNA) analysis from six key mangrove sites: 17 km and 40 km south of Safaga City, El-Sharm El-Bahary, Wadi El-Gemal, El-Qolaan, and Hamata. For comparison, eDNA was also obtained from two non-mangrove sites in the same region. The eDNA was analyzed via COI gene metabarcoding, and diversity metrics were used to compare habitats.
Results: Thirteen fish species were identified as exclusive to mangroves, alongside diverse arthropods, poriferans, and cnidarians. Moolgarda sp. (mullets) and Psettodes erumei (Indian halibut) were the most abundant fish species detected. Relative read abundances differed significantly between mangrove and non-mangrove sites, with some species exhibiting dual habitat use (e.g., transitioning between coral and mangrove systems). Diversity and evenness indices showed that biodiversity in mangrove habitats, especially Wadi El-Gemal location, overtook that in non-mangrove locations. Notably, DNA from two marine alien species could be identified, i.e., Anthopleura fuscoviridis (Cnidaria) in a mangrove site, and Callinectes sapidus (Decapoda) in non-mangrove sites. The presence of C. sapidus could be verified by conventional PCR.
Discussion: This study underscores the high biodiversity supported by Red Sea mangroves, emphasizing their ecological and economic value. These findings can inform sustainable management strategies to protect these critical ecosystems for future generations.
1 Introduction
The mangrove biome is a specialized coastal ecosystem found in tropical and subtropical intertidal zones, consisting of salt-tolerant trees and shrubs that thrive in saline, waterlogged soils. Globally, mangroves cover about 138,000 km² across over 120 countries, with the Indo-Pacific region hosting approximately 75% of this coverage (Giri, 2021; Spalding et al., 2010). Despite their limited geographic extent, located mainly between latitudes 30°N and 30°S, mangroves provide critical ecological services, including carbon sequestration, shoreline stabilization, biodiversity support, and climate change mitigation (Hamilton and Friess, 2018; Spalding et al., 2014; Dasgupta et al., 2019).
Mangroves possess unique adaptations such as aerial roots for oxygen intake and salt-excreting mechanisms, enabling them to dominate saline and intertidal environments. Submerged portions of mangroves support diverse flora and fauna, including suspension feeders that improve water quality by filtering particulates and trapping sediments (Spalding et al., 2010; Debrot et al., 2020; Das et al., 2022). Their submerged root systems serve as nursery habitat for fish, shrimp, crabs, mollusks, and other marine life forms, providing shelter and thereby enhancing biodiversity (Osland et al., 2018). Additionally, mangroves link terrestrial and marine ecosystems, facilitating nutrient cycling and supporting adjacent habitats like coral reefs and seagrass beds (Barbier, 2023). Red Sea mangroves enhance the health of nearby habitats by filtering sediments and nutrients, reducing turbidity, and serving as nurseries for commercially important species (Anton et al., 2020; Afefe, 2021; Sewilam et al., 2025).
Supporting and provisioning services provided by mangroves also sustain the livelihoods of people across the globe through fisheries, timber, and non-timber forest products (Debrot et al., 2020; Das et al., 2022). In the Red Sea, mangroves, mainly Avicennia marina and Rhizophora mucronata, thrive under extreme salinity, high temperatures, and minimal freshwater input (Khalil, 2015; Moustafa et al., 2023). Though limited in area, the Red Sea mangrove habitat is ecologically vital, supporting biodiversity and local economies in Egypt, Sudan, Eritrea, Saudi Arabia, and Yemen (Cziesielski et al., 2021; Blanco-Sacristán et al., 2022).
Despite its importance to human welfare, the biodiversity of the mangrove biome remains underexplored. This is due to the limitations of traditional biomonitoring methods such as seines and trawls, which are costly, labor-intensive, and environmentally intrusive or impossible within the thicket of mangrove branches and roots. Environmental DNA (eDNA) analysis has emerged as a promising strategy to identify the species of fish, invertebrates, and microbes in aquatic environments. eDNA investigations are based on extraction and sequencing of genetic material from environmental samples and comparing those sequences to databases of voucher DNA sequences, enabling species identification without direct observation or sampling (Ruppert et al., 2019).
Metabarcoding of eDNA involves the simultaneous detection of multiple species by sequencing conserved genomic regions and comparing them to reference databases (Grammatiki et al., 2025). This molecular approach offers several advantages: it enables large-scale, standardized biodiversity assessments, detects rare or cryptic species, and facilitates early identification of non-indigenous species (Valentini et al., 2016; Knudsen et al., 2022). As biodiversity loss accelerates and the number of scientists with morphological taxonomic expertise declines, eDNA-based monitoring provides a scalable, efficient solution for long-term ecological assessments. In spite of all the advantages that eDNA-based metabarcoding offers, only a few studies have applied it to assess biodiversity in natural habitats of the Red Sea. For example, fish-specific metabarcoding of Saudi Arabian coral eDNA could detect a range of conspicuous, cryptic, and commercially important species (DiBattista et al., 2017). Furthermore, Gulf of Aqaba waters’ eDNA metabarcoding revealed the presence of high levels of non-indigenous species, that is, approximately 36% of the identified species (Fernández et al., 2022). To the best of the authors’ knowledge, no previous studies applied eDNA metabarcoding to assess biodiversity within mangrove habitats in the Red Sea. Even in the Indian Ocean, only a few studies were carried out to identify biodiversity in these fundamental marine habitats. Of these, Zainal Abidin et al. (2022) identified nearly 178 fish species in the Peninsular Malaysia mangrove habitats. Balatero et al. (2025) applied it for the detection of native and invasive species in mangroves of the Philippines, with the final aim of fish stock assessments and conservation.
Therefore, the current study was designed to address the significant knowledge gap regarding the biodiversity of animal communities inhabiting the sparse grey mangrove (Avicennia marina) assemblages in the Red Sea, Egypt. As the most abundant mangrove species in the region, A. marina provides many critical ecosystem services. To achieve the study’s objectives, we used eDNA metabarcoding to create a census of the animal biodiversity within mangrove habitat and compared it to reference sites without.
2 Materials and methods
2.1 Sampling locations and procedures
In November 2023, a sampling expedition was conducted along 260 km of the Red Sea Governorate shoreline in Egypt. The survey included the following sites where grey mangrove (Avicennia marina) assemblages are present: (1) 17 km south of Safaga City (26°37′12″N 34°00′42″E, length of the sampling transect: 749 m), (2) 40 km south of Safaga City (26°23′52″N, 34°07′10″E, length of the sampling transect: 903 m), (3) El Sharm El-Bahary, 28 km south of Quseer City (25°52′02″N, 34°24′51″E, length of the sampling transect: 424 m), (4) Wadi El-Gemal (24°40′28″N, 35°05′17″E, length of the sampling transect: 564 m), (5) El-Qulaan (24°21′27.0″N, 35°18′18.0″E, length of the sampling transect: 1 Km), and (6) Hamata (24°20′01″N 35°20′08″E, length of the sampling transect: 3.744 Km), approximately 160 km to the north of Shalateen City (Figure 1). Additionally, two negative (non-mangrove) coastal sites were included in the sampling. The northern site was located near Safaga City Port (26°46′33″N, 33°57′22″E), and the southern site was situated south of Marsa Alam City (24°21′27.0″N, 35°18′18.0″E) (Figure 1). Real photos for sampling sites are shown in Figure 2.
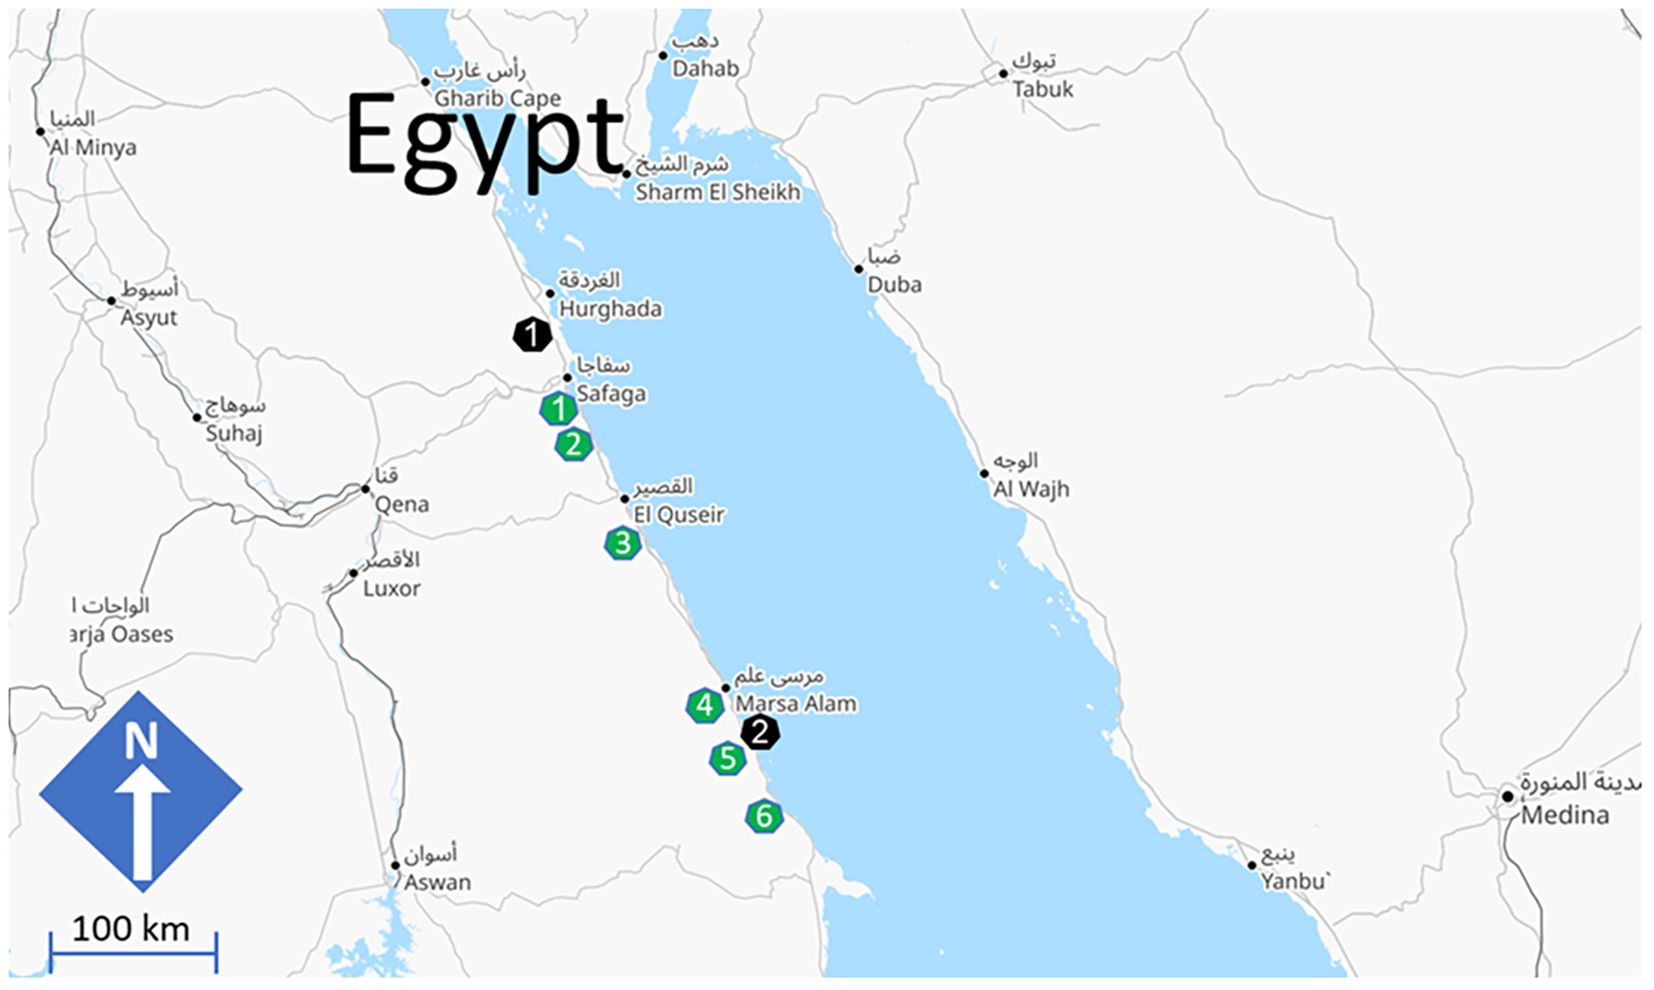
Figure 1. Mangrove (green heptagons) sites surveyed in the current study: (1) 17 km to the South of Safaga City (26°37’12”N 34°00’42”E), (2) 40 km to the South of Safaga City (26°23’52”N 34°07’10”E), (3) El Sharm El-Bahary, 28 Km South to Quseer City (25°52’02”N 34°24’51”E), (4) Wadi El-Gemal (24°40’28”N 35°05’17”E), (5) El-Qulaan (24°21’27.0”N 35°18’18.0”E), and (6) Hamata (24°20’01”N 35°20’08”E). Negative sites that are devoid of mangroves and were used in the current study (black heptagons): (1) Near Safaga City port (26°46’33”N 33°57’22”E) and (2) South of Marsa Alam City (24°57’46”N 34°54’47”E). Map credits Openstreetmap: https://www.openstreetmap.org/#map=7/25.661/36.414&layers=T.
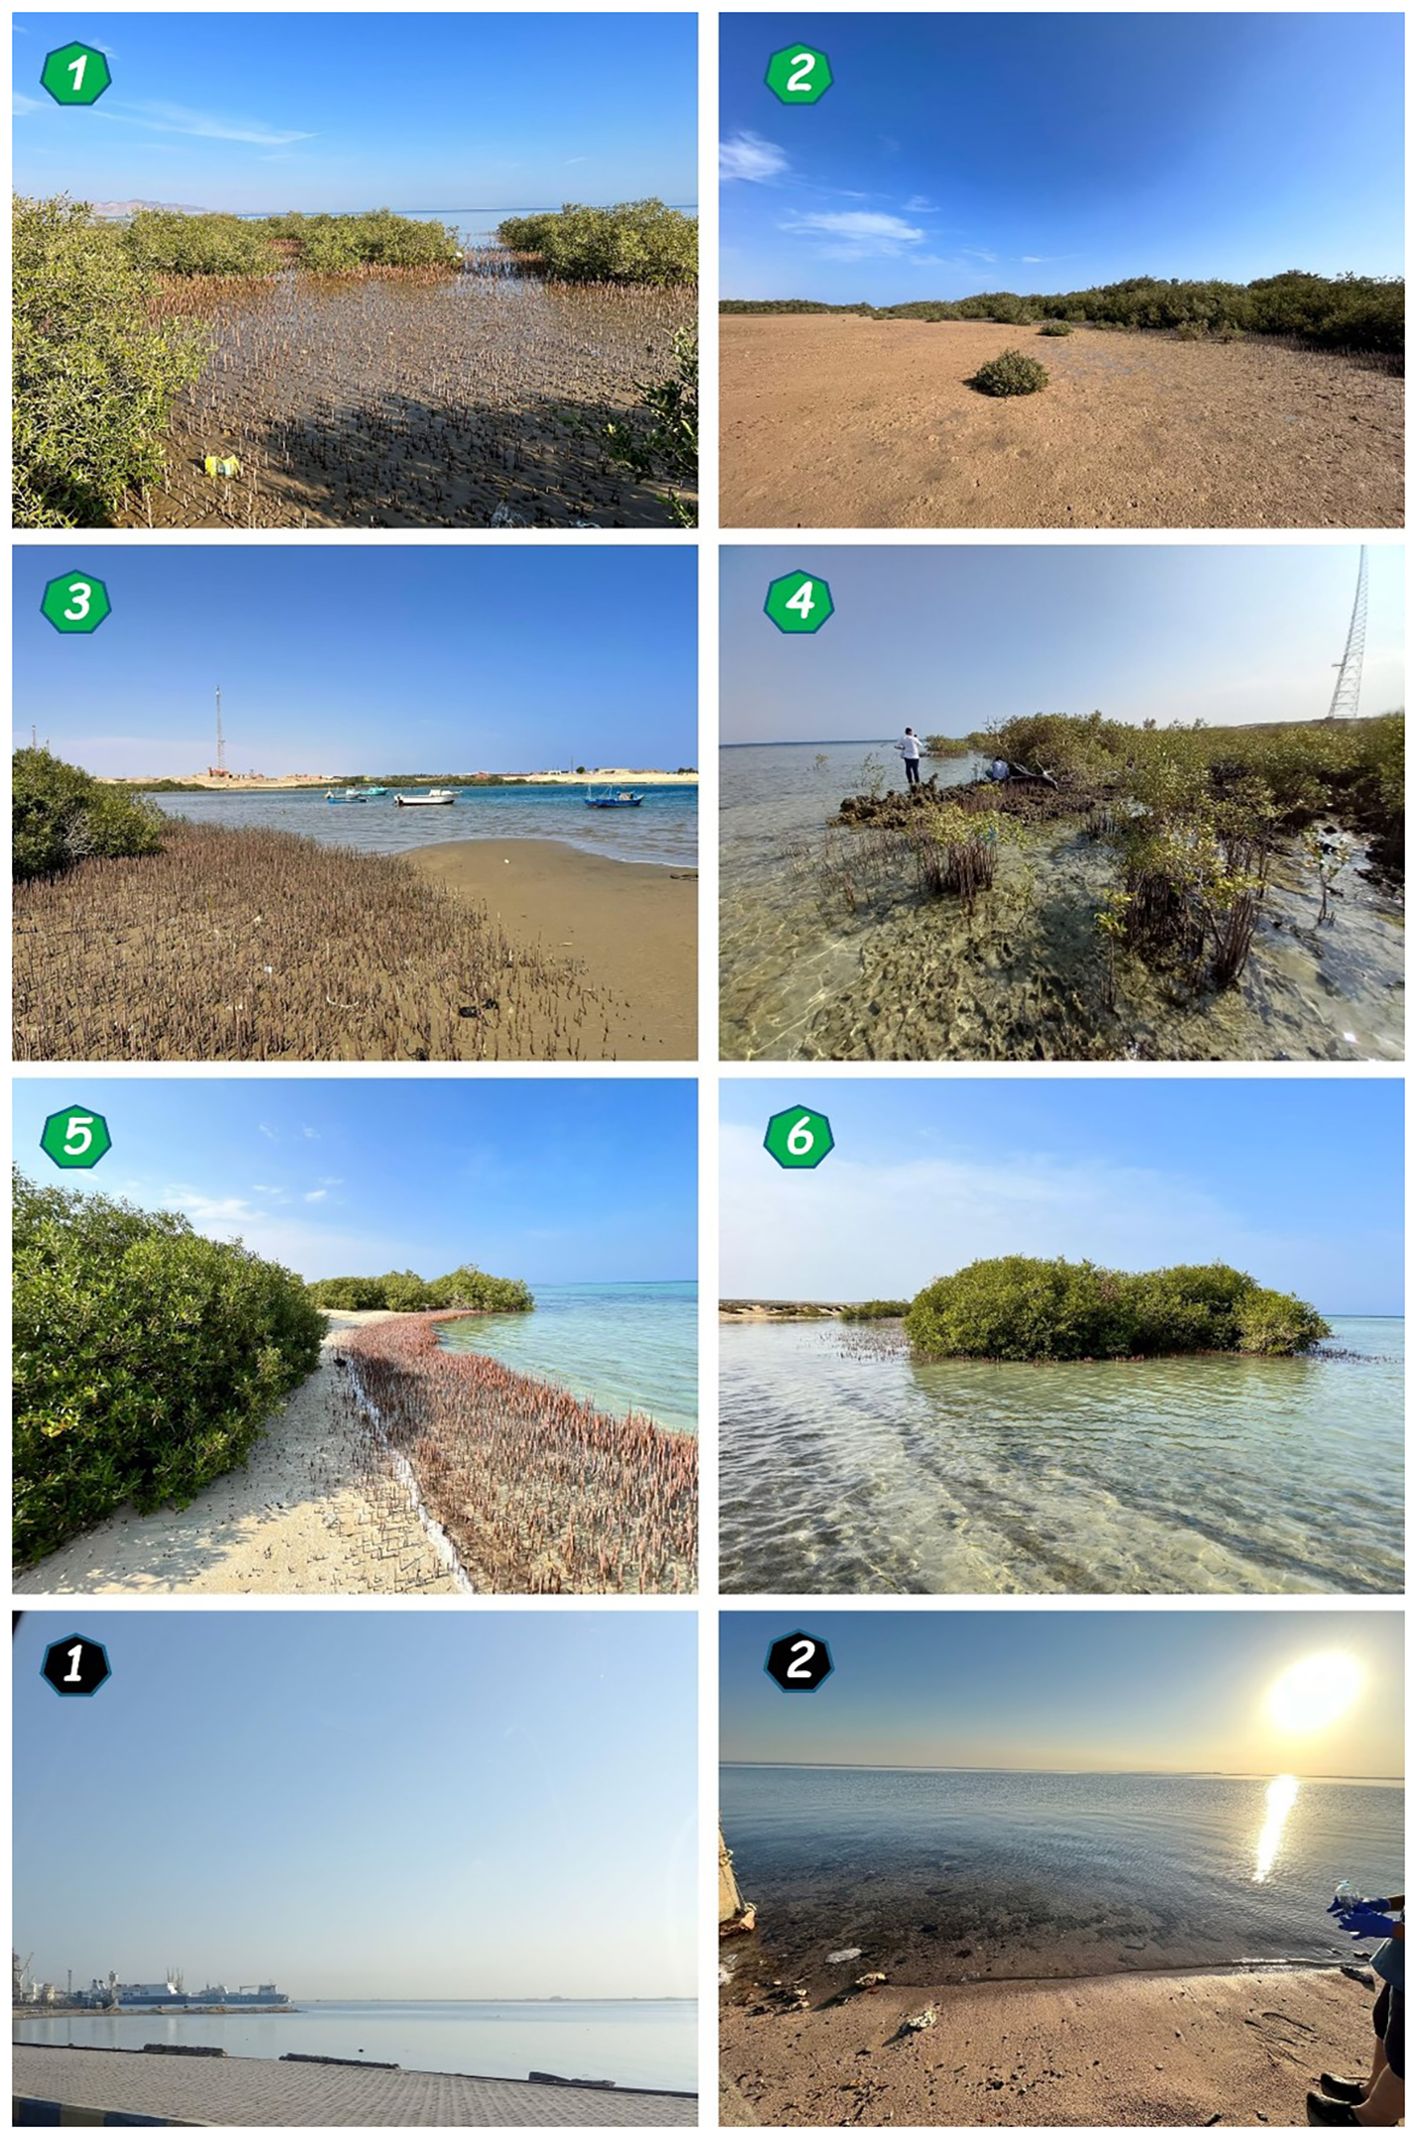
Figure 2. Photos from mangrove sites surveyed in the current study. The key to numbers and shapes (green heptagons: mangrove locations, black heptagons: non-mangrove locations) is the same as detailed in Figure 1.
At each site, 500 ml water samples were collected in triplicate, covering the start, mid, and end points of the sampling transect in every site, using single-use plastic containers, following the methodology described by Borrell et al. (2017). Samples were stored in a 30 L ice-filled cooler until the end of the sampling expedition. Additionally, three bottles filled with mineral water were rinsed at different sampling locations and used as negative controls. All bottles, including the negative controls, were transported to the central laboratory at the Hurghada City potable water station. There, the samples were filtered through 0.45 µm cellulose nitrate membrane filters (11406-47-CAN, Sartorius, Goettingen, Germany) and immediately preserved on the same day in 15 ml Falcon tubes filled with absolute ethanol. The preserved samples were then transferred to the Molecular Biology and Biotechnology Laboratory in the Zoology Department, Faculty of Science, Menoufia University, for molecular analysis.
2.2 Molecular analyses:
eDNA was extracted from the membrane filters in a laminar airflow chamber using the QIAamp DNA Blood Mini Kit (Cat. No. 61104). Negative control membranes were included in the extraction to test for contamination during sampling or extraction. Purified DNA replicates from each sampling point were pooled, and each pool was quantified via spectrophotometric UV absorbance at 260 nm. Purity was assessed using the A260/A280 ratio. Samples with A260/A280 >1.8 were adjusted to a concentration of 100 ng/µl. For polymerase chain reaction (PCR) amplification of the COI gene, 2 µl of DNA from each sample was used, along with 1× COSMO PCR RED Master Mix (Willowfort, UK; Cat. No. ND-1289-50), 0.4 µM of each primer, deionized PCR-grade water, and 200 ng µl−1 of bovine serum albumin (BSA). The primers used were those of Leray et al. (2013): mlCOIintF (5′-GGWACWGGWTGAACWGTWTAYCCYCC-3′) and 5′-TAIACYTCIGGRTGICCRAARAAYCA-3′, appended to one of the following indices for the forward primer (GTT, CAT, TCC, or AGG) and one for the reverse primer (TGG, TCA, TAC, or GTA). Additionally, the forward primer contained the overhang 5′-TCGTCGGCAGCGTCAGATGTGTATAAGAGACAG-3′, while the reverse primer had the overhang with sequence 5′-GTCTCGTGGGCTCGGAGATGTGTATAAGAGACAG-3′ (from the 16S Metagenomic Sequencing Library Preparation for Illumina MiSeq System, Part #15044223 Rev. B).
PCRs were performed in 25 µl reaction volume for each, under the following conditions: initial denaturation at 95°C for 10 min; 42 cycles of 95°C for 10 s, 46°C for 30 s, and 72°C for 1 min; and a final extension at 72°C for 10 min. PCR products were electrophoresed on a 1% agarose gel stained with ethidium bromide (0.5 µg µl−1) and visualized under UV transillumination (Biometra Transilluminator Ti1, Germany). PCRs for all sites were then pooled and submitted for library preparation at the BAS Lab of the Institute of Marine and Environmental Technology (IMET, Baltimore, MD, USA). PCR cleanup, library quantification, and MiSeq loading followed the 16S Metagenomic Sequencing Library Preparation protocol (Part #15044223 Rev. B). Amplicons were purified using AMPure XP magnetic beads to remove free primers and primer dimers. Pooled, cleaned libraries were processed with the MiSeq Reagent Kit v3 (600 cycles; Illumina Cat. No. MS-102-3003) and loaded onto the MiSeq flow cell for sequencing.
2.3 Bioinformatic analyses
Illumina sequencing reads were processed using the command-line tool VSEARCH v2.15.0 (Rognes et al., 2016). Forward and reverse reads (R1, R2) were merged with a minimum merge length of 300 bp, allowing for staggered strand merging. Reads were demultiplexed based on the dual-indexing system incorporated into their primers for different sampling locations. Quality filtering was performed to trim primer sequences, retaining only sequences with an expected error (ee value) per base ≤ 2 (McCartin et al., 2024; Vargovčík et al., 2024) and a maximum length of 400 bp. File headers were modified to explicitly reference their respective sampling locations. All quality-filtered, header-modified sequence files were concatenated into a single collective file. This file was dereplicated, and chimeric sequences were removed. The remaining sequences were clustered into centroids at 98% sequence identity. An amplified sequence variant (ASV) table was generated for mangrove and non-mangrove sites by comparing the centroids file with the concatenated, quality-filtered sequences.
Taxonomic assignment of ASVs was performed by comparing them against a GenBank-derived eukaryotic COI sequence database, retrieved using Entrez Direct e-search utilities (https://www.ncbi.nlm.nih.gov/books/NBK179288/). Taxonomy was resolved to different taxonomic levels using the BOLD Systems v4 Taxonomy Browser (https://boldsystems.org/data/taxonomy-page/) with the following identity cutoffs (Macher et al., 2024): ≥97% for species, ≥95% for genera, ≥90% for families, ≥85% for orders, ≥80% for classes, and ≥75% for phyla.
2.4 Phylogenetic analysis
To further confirm taxonomic identities, COI sequences that showed > 98% identity to the identified ASVs were downloaded from GenBank. These usually ranged between one and three records. All sequences were aligned using CLUSTALW as implemented in MEGA 7 software (Kumar et al., 2016). The best-fit nucleotide substitution model was determined using the same software and subsequently applied to construct a neighbor-joining phylogenetic tree with 1,000 bootstrap replicates. The tree was exported in Nexus format and visualized using the Interactive Tree of Life (iToL) web tool (Letunic and Bork, 2019).
2.5 Diversity analysis
ASVs from different taxa were analyzed using PAST 4 software (Hammer and Harper, 2001) to generate rarefaction curves for each site, calculate alpha diversity metrics, and assess statistically significant differences between mangrove and non-mangrove sites through permutational ANOVA (PERMANOVA) comparisons.
2.6 Confirming an alien species’ presence
The COI sequence of one of the world’s most invasive species, Callinectes sapidus, was detected among our ASVs and selected for amplification using a species-specific PCR assay. All ASVs corresponding to this species were aligned using CLUSTALW in MEGA 7. A representative sequence was then used in Primer3Plus (https://www.bioinformatics.nl/cgi-bin/primer3plus/primer3plus.cgi/) to design a primer pair: 5′-TTCTCTCTCCACTTAGCTGG-3′ forward primer and 5′-GACGCCTCCTCCATCTGG -3′ reverse. The primers were adjusted to have an annealing temperature between 55°C and 60°C. The specificity of the designed primers was validated using the Primer-BLAST tool (https://www.ncbi.nlm.nih.gov/tools/primer-blast/). The final primer sequences were synthesized by Macrogen, Inc. (Seoul, South Korea).
Simultaneously, a tissue sample of the target species was obtained from a commercial source. All procedures related to this research were approved by the research ethics committee at the Faculty of Science, Aswan University, with the code ASWU/05/SC/ZO/25-07/R2. Crab DNA was extracted using the same protocol described in Section 2.3 and stored at −20°C to serve as a positive control in subsequent PCR amplifications. The PCRs were carried out in a total volume of 25 μl, containing 2 μl of either the previously extracted eDNA or the DNA extracted from the target species, 12.5 μl of COSMO PCR RED Master Mix (Willowfort, UK; Cat. No. ND-1289-50), 0.4 μM of each primer, and 200 ng μl−1 of BSA. A negative control containing only field blank-extracted eDNA was included in each run. To enhance the PCR amplicon signal, a second PCR was performed using the amplicons from the first PCR as the DNA templates.
PCR amplifications were carried out in a TC512 thermal cycler (Techne, UK) with the following cycling conditions: an initial denaturation at 95°C for 10 min; 40 cycles of 95°C for 30 s, 57°C for 30 s, and 72°C for 1 min; and a final extension at 72°C for 10 min. Amplification products from the first and second PCRs were resolved on a 1% agarose gel stained with ethidium bromide (0.5 µg μl−1). All samples, along with a 1 kb DNA ladder (Thermo Fisher Scientific; Cat. No. SM0314, USA), were electrophoresed at a constant voltage of 100 V for 20 min. The gel was visualized under UV light transillumination and photographed.
3 Results
Sequencing of the two pools resulted in a total of 207,331 reads, of which 178,865 (~86%) had successfully merged forward and reverse reads. The mean read length was 372 bp. A quality control step, of removing primer sequences and keeping only sequences with ee of 2 resulted in keeping ~99% of sequences for mangrove locations from 1 to 4, but this percentage decreased to 79% and 74% of good quality sequences in locations 5 and 6, respectively, as well as 80% and 79% for the 2 non-mangroves (i.e., mangrove-free locations) (Table 1).
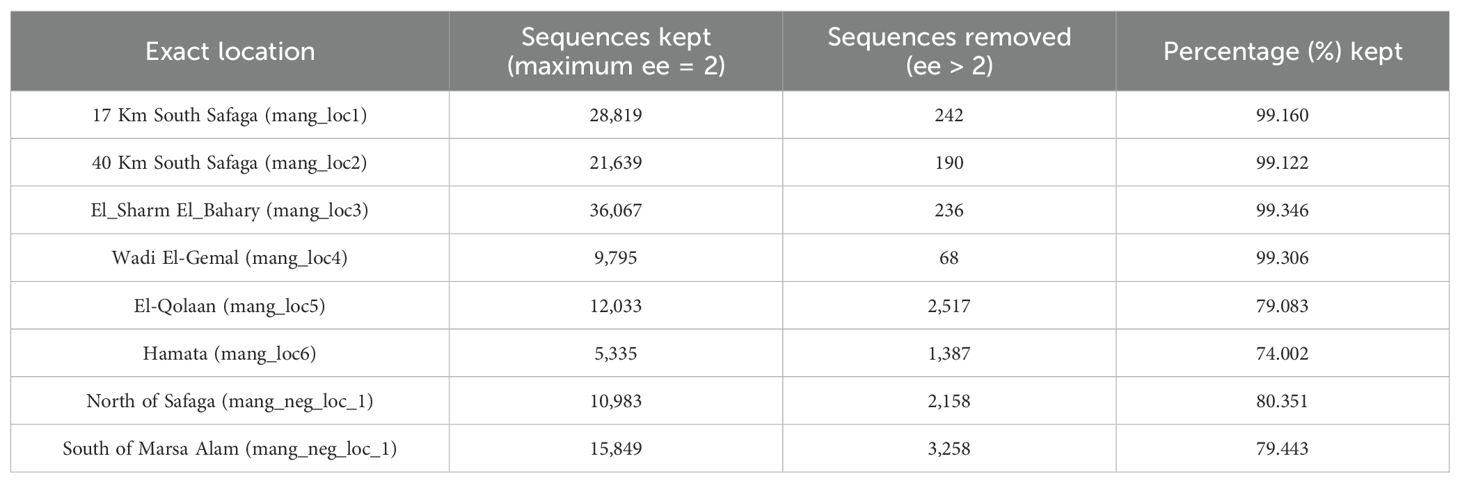
Table 1. Number of retained sequence reads from mangrove and non-mangrove sites after primer trimming, keeping only sequences with ee = 2.
Concatenating and dereplicating all good-quality reads resulted in 148,263 sequences. Removal of chimeric sequences reduced this number to 143,961, with only 4,231 sequences discarded as chimeric sequences. These non-chimeric sequences clustered into 13,809 clusters, in addition to 7,810 others that were singletons.
Of the resulting clusters, 5,606 could be assigned to certain taxonomic levels, that is, species, genus, family, order, class, or phylum. Of these, 5,056 were identified to the genus level (ID ≥ 95%) (Table 2). Meanwhile, 8,753 clusters could not be assigned to a known taxon under the criteria used. All obtained sequences were submitted to NCBI’s Sequence Read Archive repository under the references BioProject ID PRJNA1281181 and BioSample SAMN49549056-SAMN49549063.
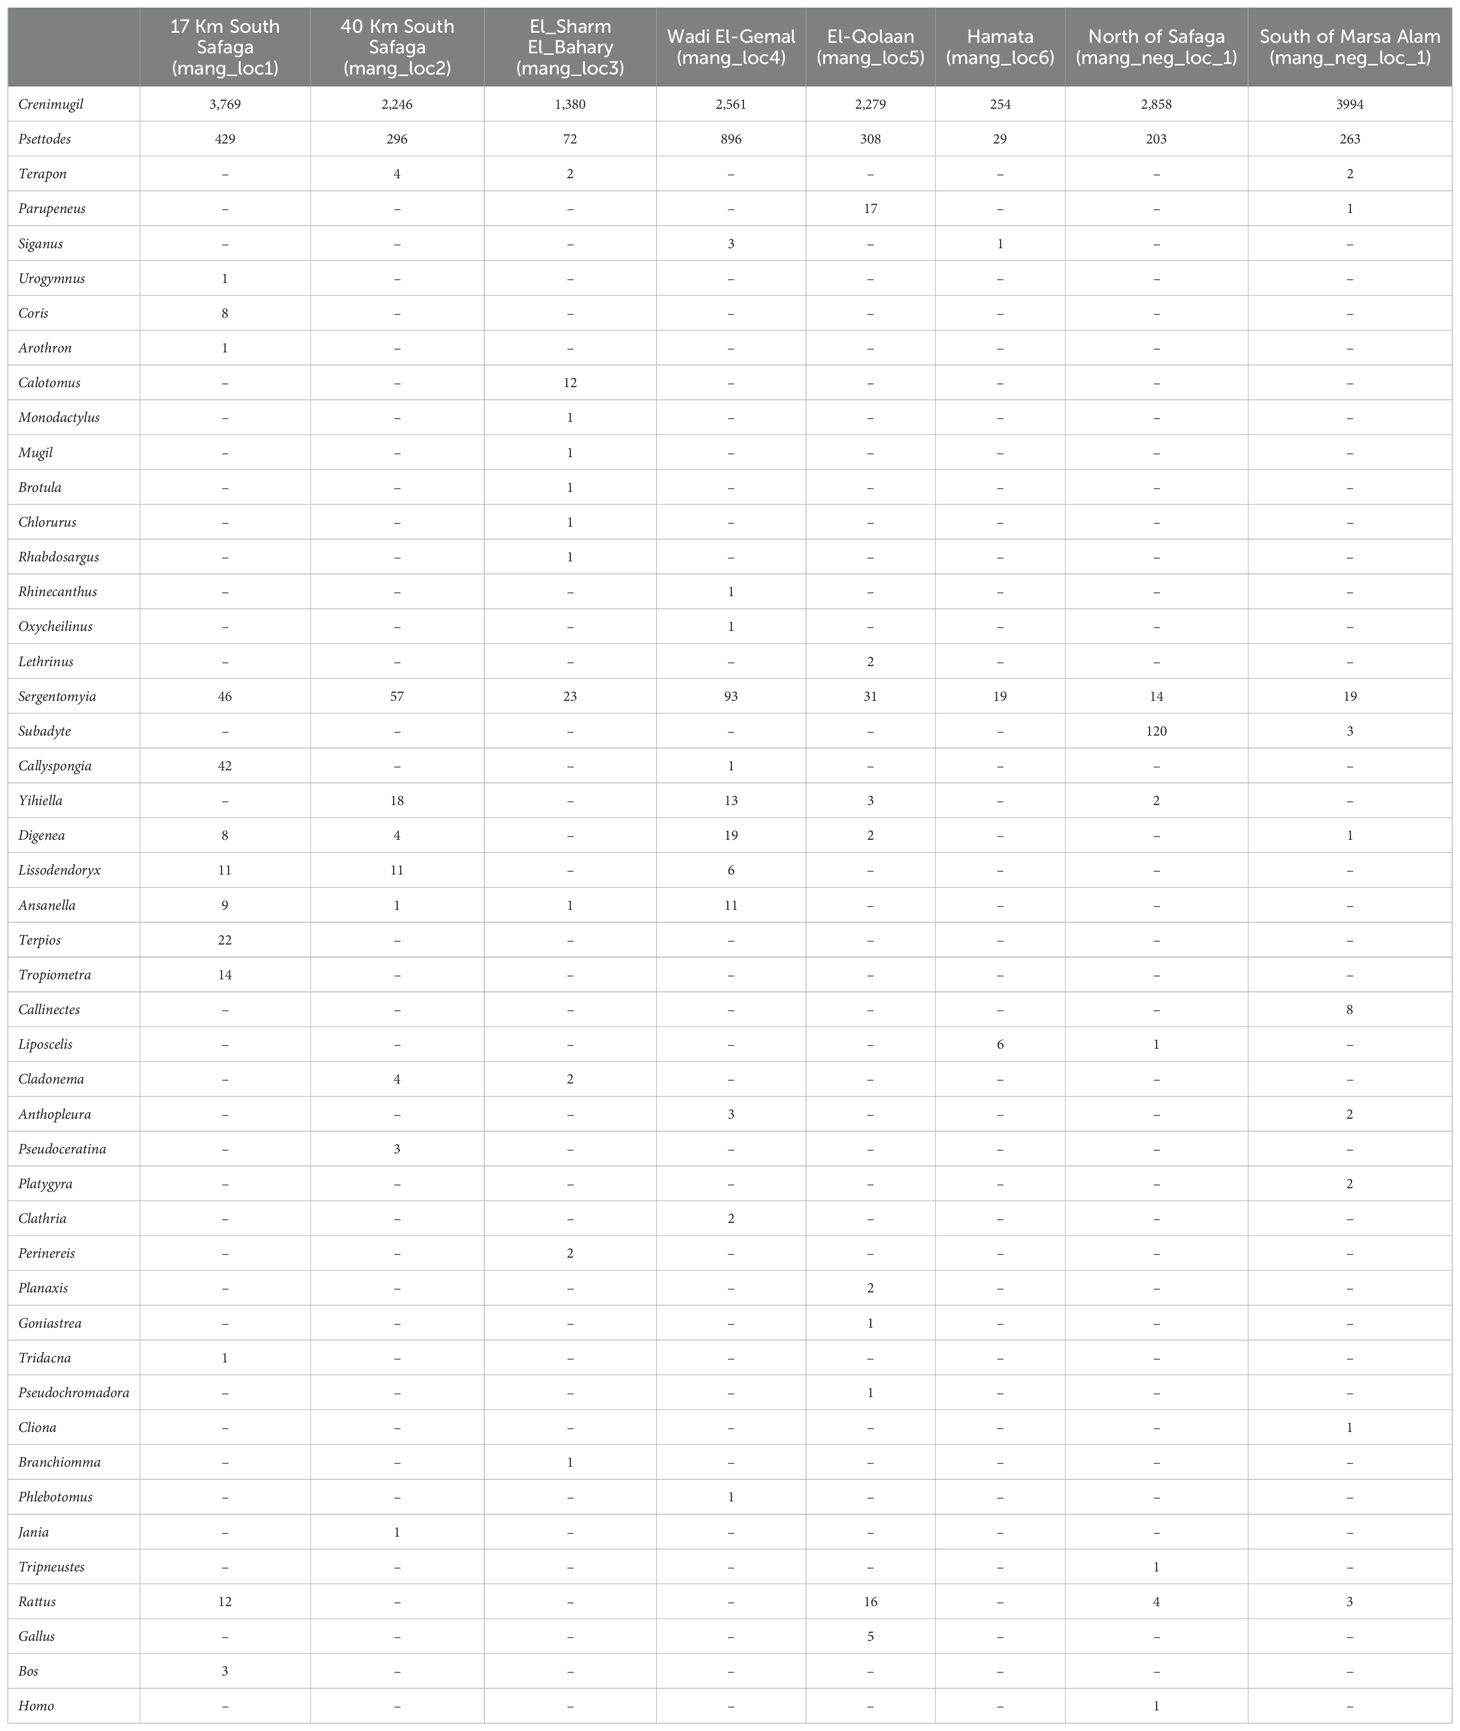
Table 2. Distribution of different amplicon sequence variants (asvs) identified in the current study to the genus level (Cytochrome Oxidase Subunit I barcode ID ≥ 95%) in the six mangrove sampling locations and the two negative, non-mangrove ones.
Sequences corresponding to fishes dominated other organism DNA in all sites. Fish sequences comprised between 91% and 98% in mangrove sites and 96% and 99% in non-mangrove locations. Arthropod sequences were the second most abundant, with percentages between 1.04% and 8.1% in mangroves, but 0.7% and 0.44% in non-mangrove areas. Porifera (sponges) came in the third rank, ranging between 0% and 1.7% in mangrove sites versus 0% and 0.02% in non-mangrove sites. Cnidarians came in the fourth rank, with percentages of abundance ranging between 0% and 0.13% in mangrove sites and 0% and 0.09% in non-mangrove sites. Reads of other animal phyla were also identified, yet in much lesser percentages, including annelids, mollusks, and echinoderms (Figure 3).
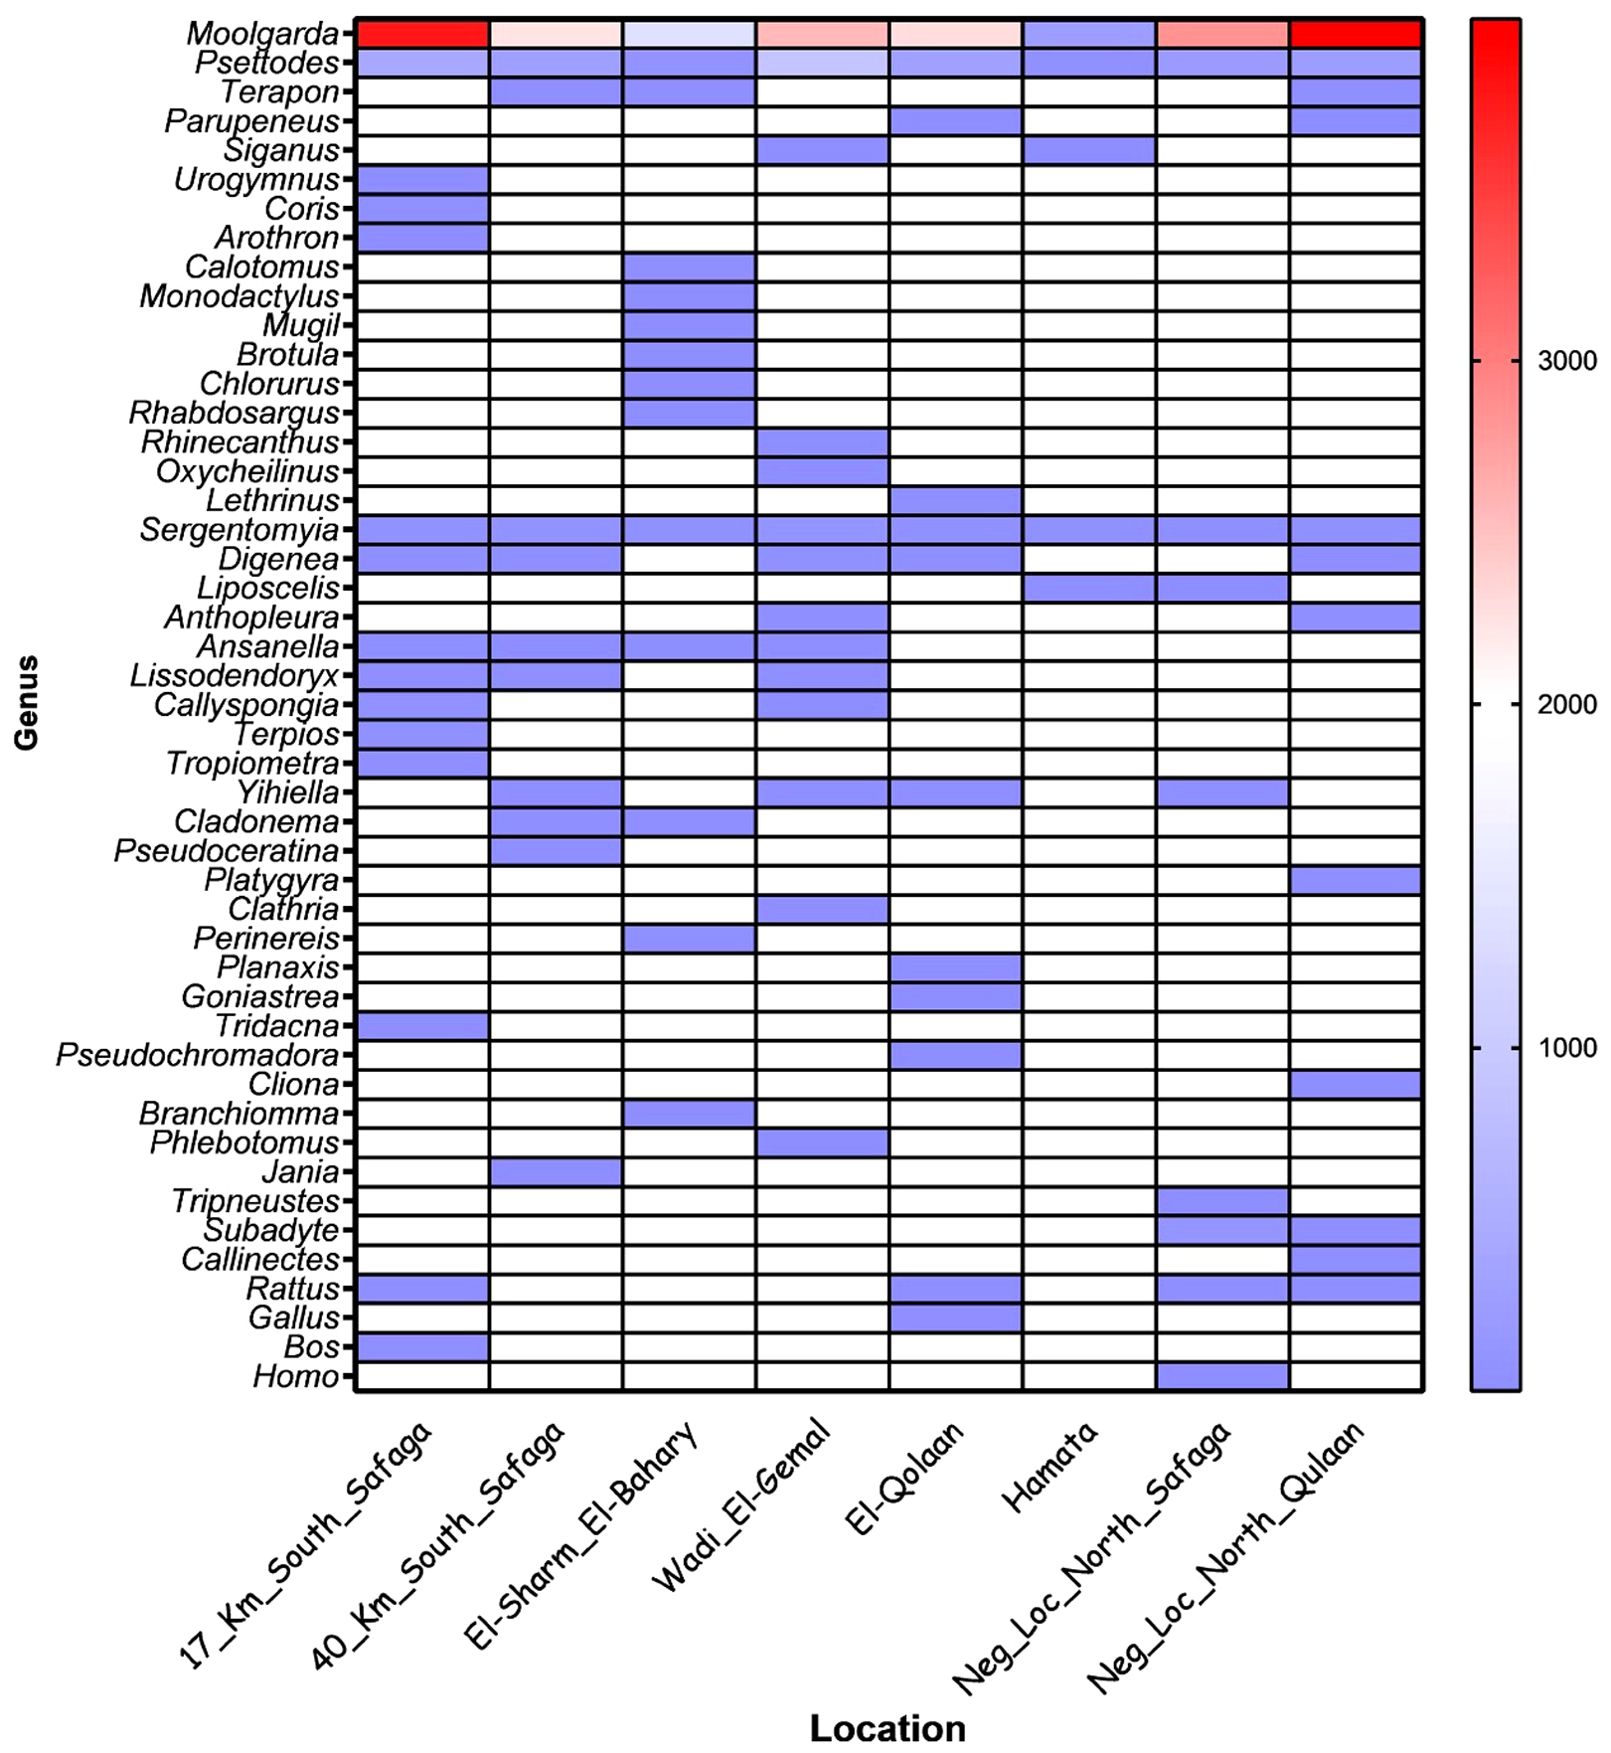
Figure 3. Heat map for different taxa in the six mangrove sampling locations and the two negative, non-mangrove ones. The color bar to the right indicates the raw read counts per amplified sequence variant (ASV) for each genus at the locations indicated on the “Y” axis.
The genera that were exclusively present in mangrove sites were Urogymnus, Arothron, Rhinecanthus, Coris, Oxycheilinus, Lethrinus, Monodactylus, Mugil, Brotula, Calotomus, Chlorurus, Siganus, and Rhabdosargus. For sponges, the genera Callyspongia, Lissodendoryx, Clathria, Pseudoceratina, and Terpios were only present in mangrove sites. Two cnidarian genera, that is, Goniastrea and Cladonema, were only present in mangrove locations (Figure 3). The eDNA of two fish genera was very abundant in all mangrove sites: that of Moolgarda (mullet) and Psettodes (Indian halibut) (Figures 3, 4).
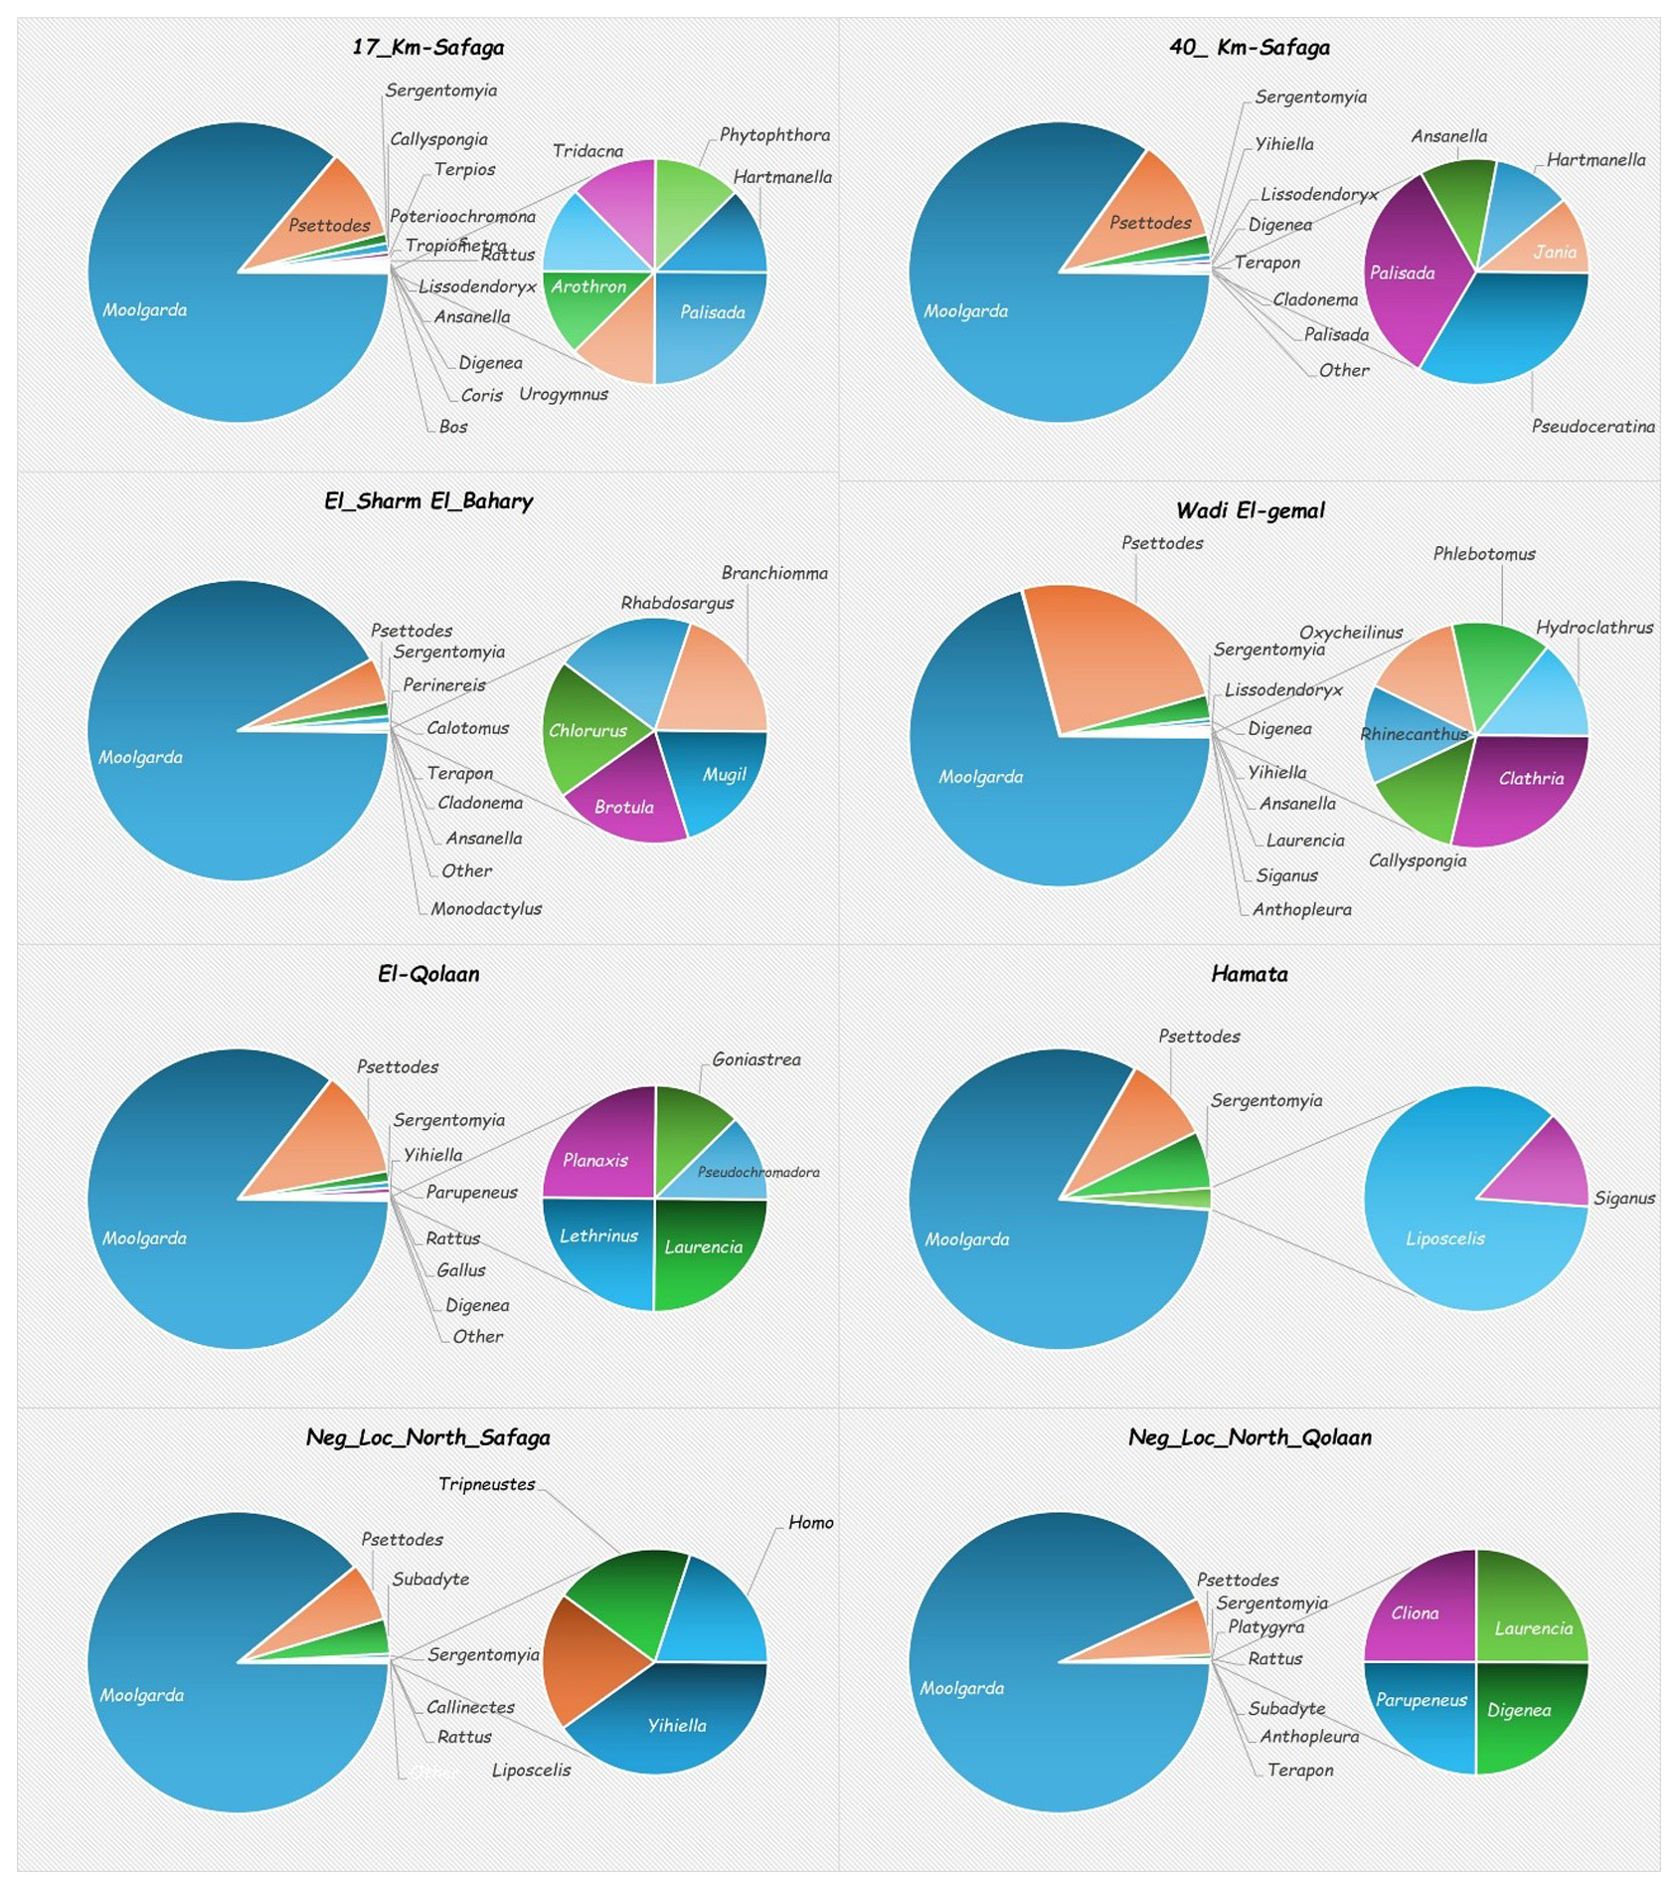
Figure 4. Taxon abundance in the six mangrove sampling locations and the two non-mangrove sites.
For five of the six mangrove sites, the percentages of different taxa identified were greater than at either of the non-mangrove sites. The exception was Hamata, where only five taxa were identified, as compared to 12 and 10 taxa at the north and south reference sites (Figure 5). There were two genera that were detected in all mangrove and non-mangrove sites: Moolgarda and Psettodes. Interestingly, for Moolgarda, the ASVs that could be assigned to the species level were M. seheli (28 in mangrove vs. 48 in non-mangrove sites) and M. crenilabis (one read each in mangrove and non-mangrove sites). The reads for M. seheli shared >98% sequence identity to those with GenBank accession numbers: OR923992.1, OR923778.1, OR924015.1, OR923755.1, OR923941.1, and OR923978.1 from the Red Sea (Sudan) and the Gulf of Aden (Yemen). Also, the sequences of M. crenilabis shared >98.6% sequence identity with OR924069.1 and OR924047.1 from Sudan. Strikingly, 12,456 reads in mangrove sites and 6,813 reads in non-mangrove sites shared >98.4% sequence identity with an Iranian Moolgarda sp. (acc. No. OR923864.1, OR923909.1, OR923941.1, OR923791.1, and OR924003.1).
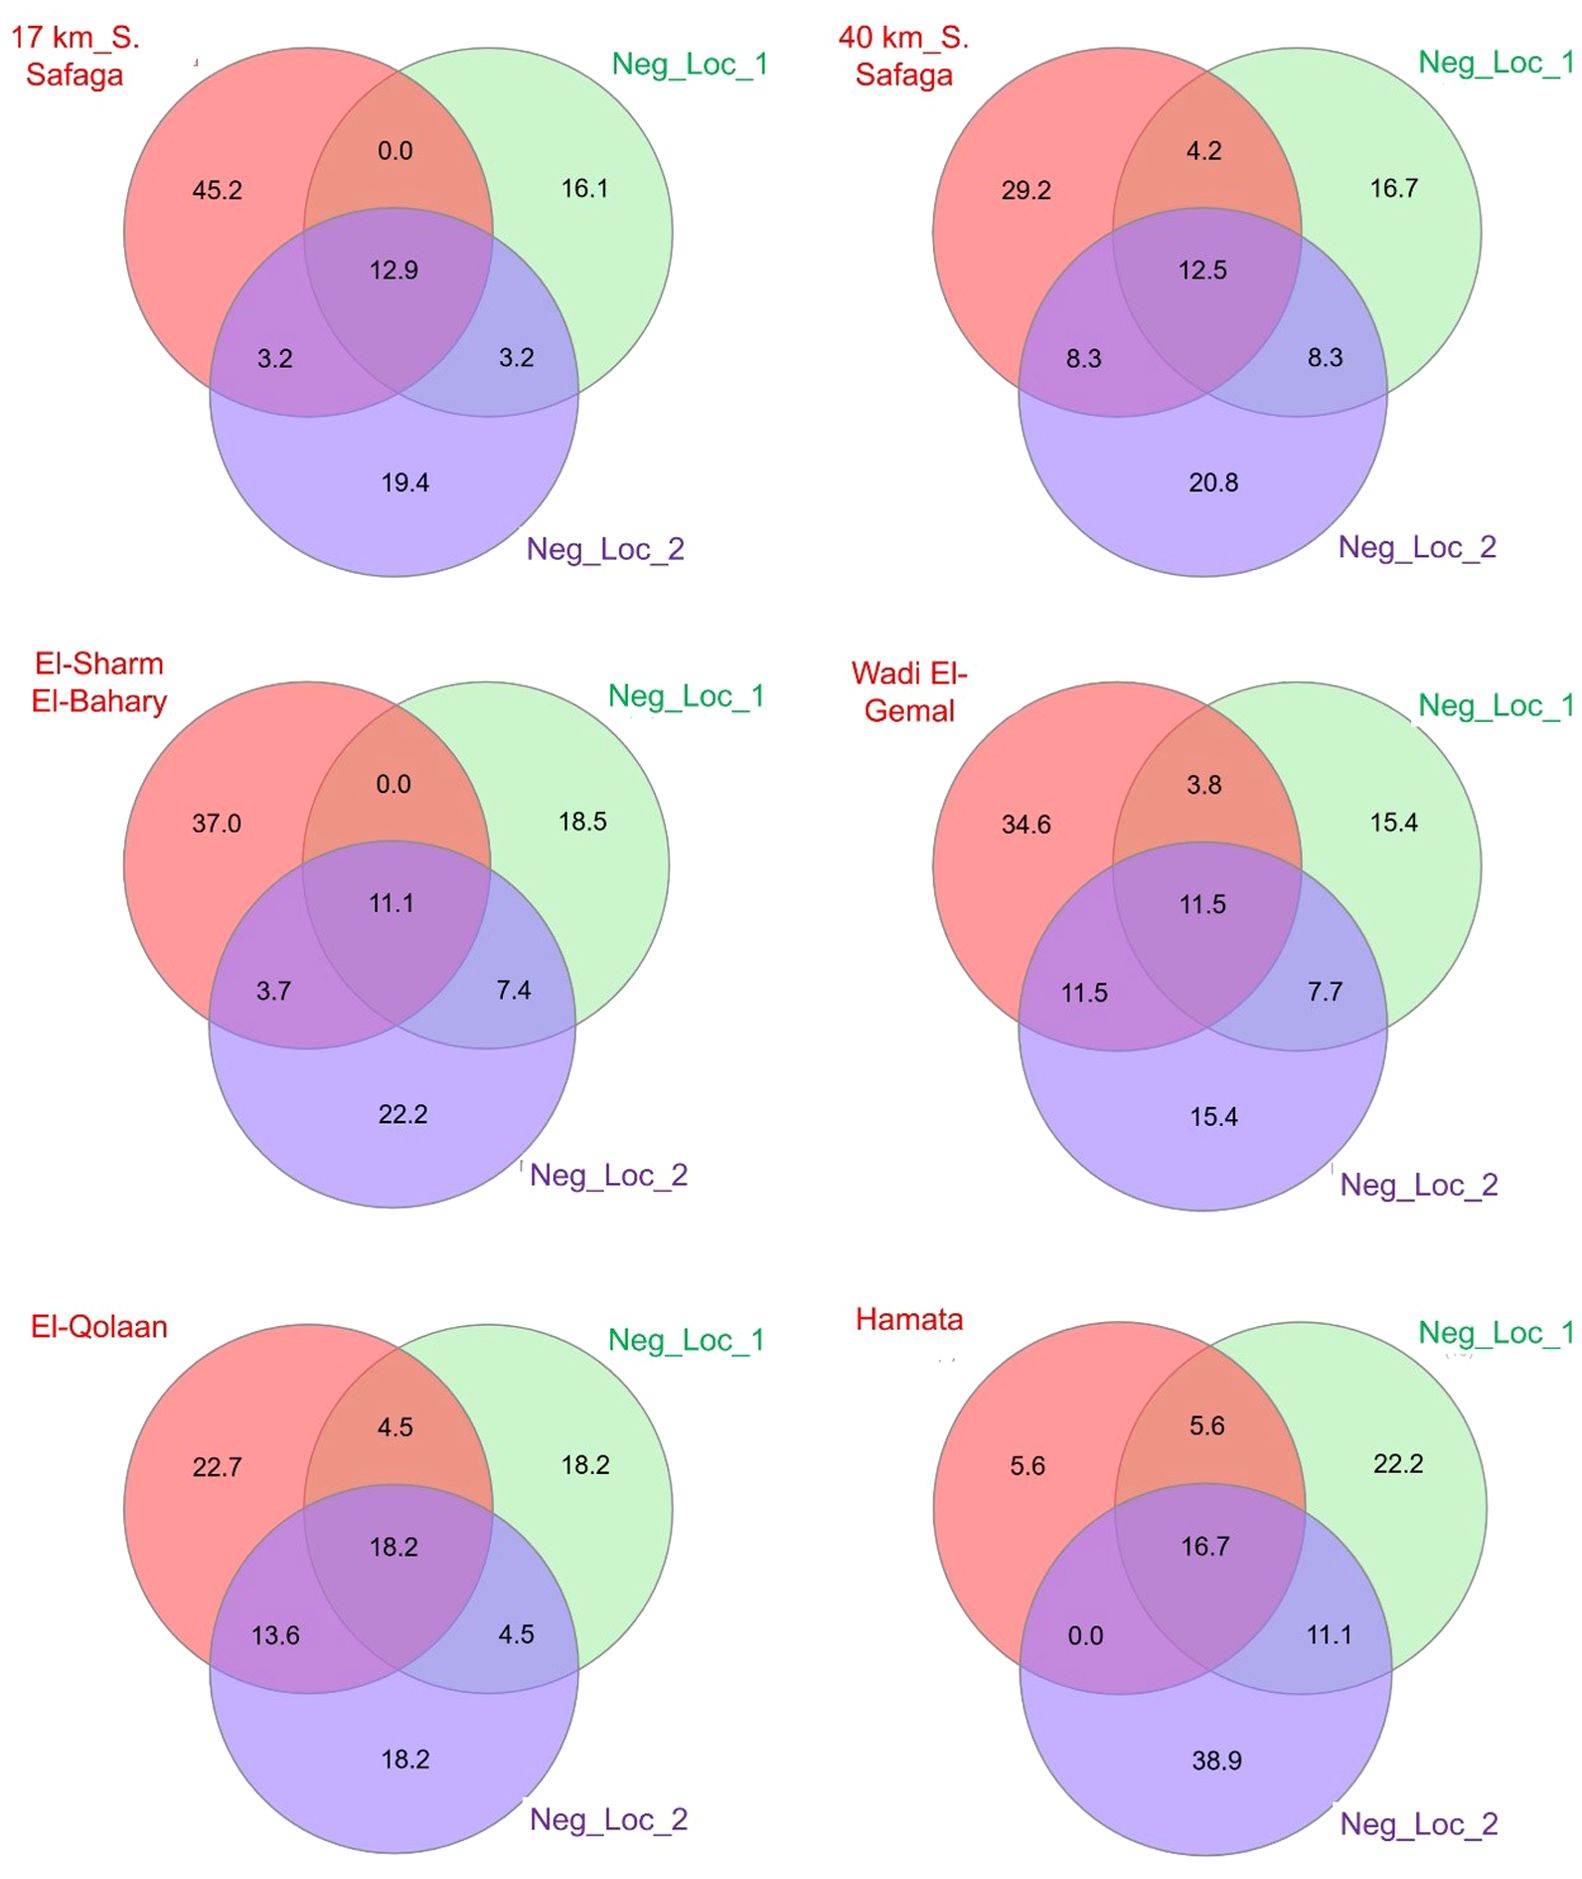
Figure 5. Venn diagrams illustrating both shared and unique taxa identified in each of the six mangrove sites (pink circles) as compared to the two non-mangrove locations (green and purple circles) in the Red Sea governorate, Egypt. Numbers within circles refer to percentages of taxa represented within each triad. Location details are described in Figure 2. Venn diagrams were generated using InteractiveVenn web tool (Heberle et al., 2015).
Bayesian inference further confirmed the precise relation between sequence clusters identified in the current study, native or alien, and their GenBank references, with bootstrap values equal to or exceeding 50% in all cases (Figure 6).
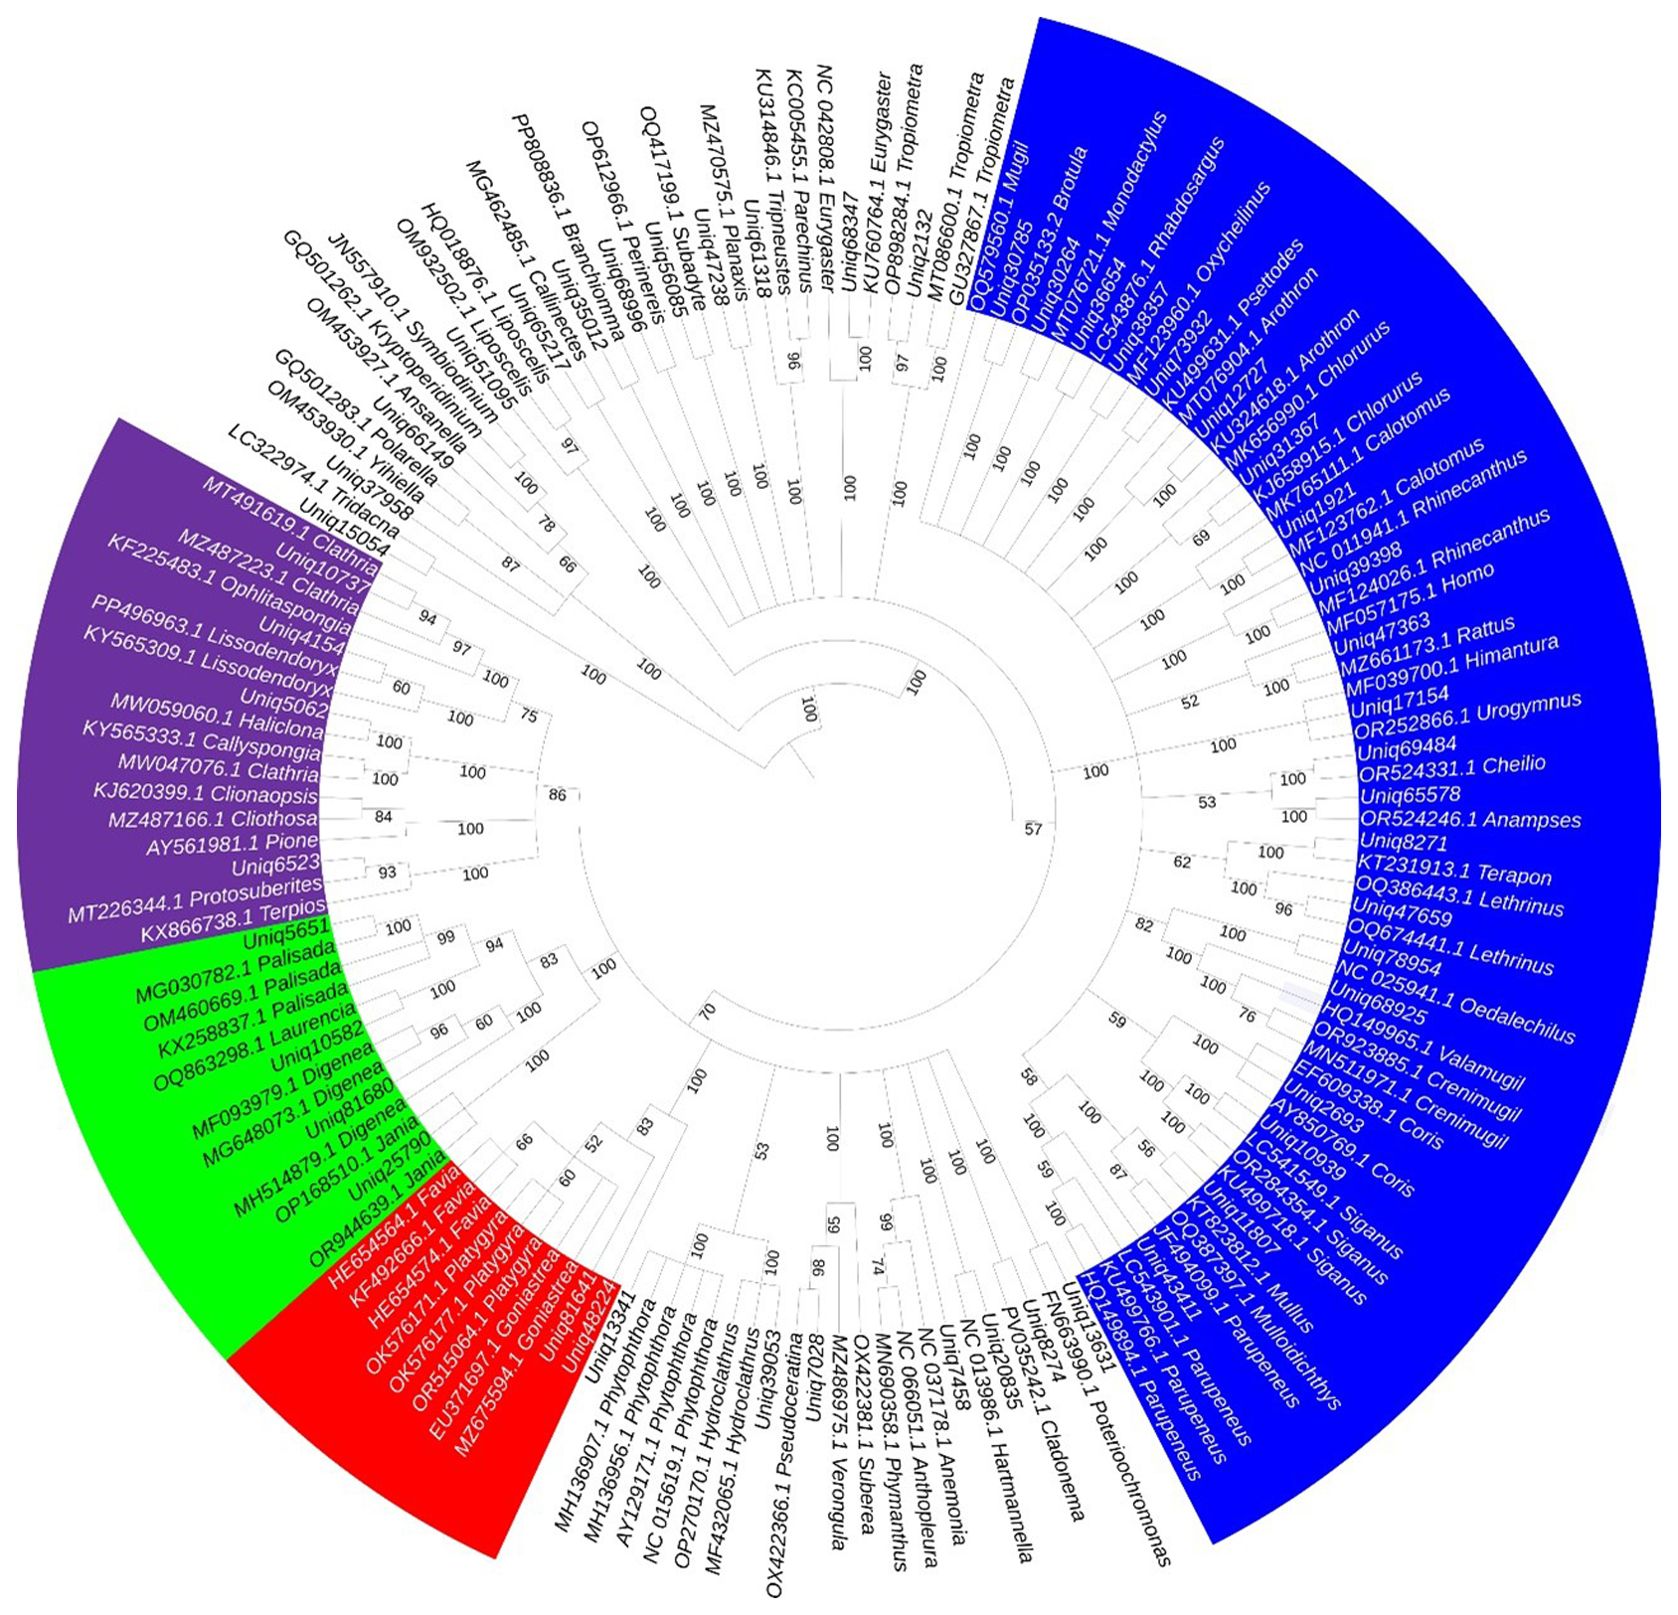
Figure 6. Neighbor-joining phylogenetic tree for eDNA sequences derived from various marine organisms identified in the current study with their GenBank accession numbers, including fish (blue), sponges (violet), cnidarians (red), plants (green), and other less abundant taxa (white). The tree is based on 1,000 bootstrap replicates and Kimura 2-parameter substitution model and visualized using iToL v7 (https://itol.embl.de/).
Rarefaction curves showed that all sampled locations attained a plateau, despite the uneven sequencing depths (Figure 7). Shannon Index values were 0.30 for the southernmost mangrove-free negative site, followed by 0.38 for the El-Sharm El-Bahary loose mangrove site, 0.44 for the northernmost mangrove-free negative location, 0.54 for El-Qulaan, 0.58 for the 17-km-South-Safaga location, 0.58 for the 40 km South-Safaga location, 0.64 for Hamata, and 0.79 for Wadi El-Gemal (Table 3). Simpson diversity index values followed almost the same pattern (Table 3). The Margalef richness index revealed a certain degree of difference with both the Shannon and Simpson diversity indices. It was the highest at four mangrove sites, that is, 17 km south of Safaga, El-Sharm El-Bahary, Wadi El-Gemal, and Hamata, each showing greater species richness than either of the two non-mangrove control sites. In contrast, the lowest Margalef values were observed in El-Qolaan and the non-mangrove site north of Safaga. When plotting Margalef richness against either Shannon or Simpson diversity indices, Wadi El-Gemal emerged as the site with the highest combination of species richness and evenness, while the non-mangrove site north of Hamata exhibited the lowest overall diversity (Figure 8). Moreover, after normalizing the number of sequences for each species to the total sequence number per site and grouping all mangrove sites together and all non-mangrove sites together, the Bray-Curtis distance matrix between these two groups showed a clear significant difference (p = 0.03).
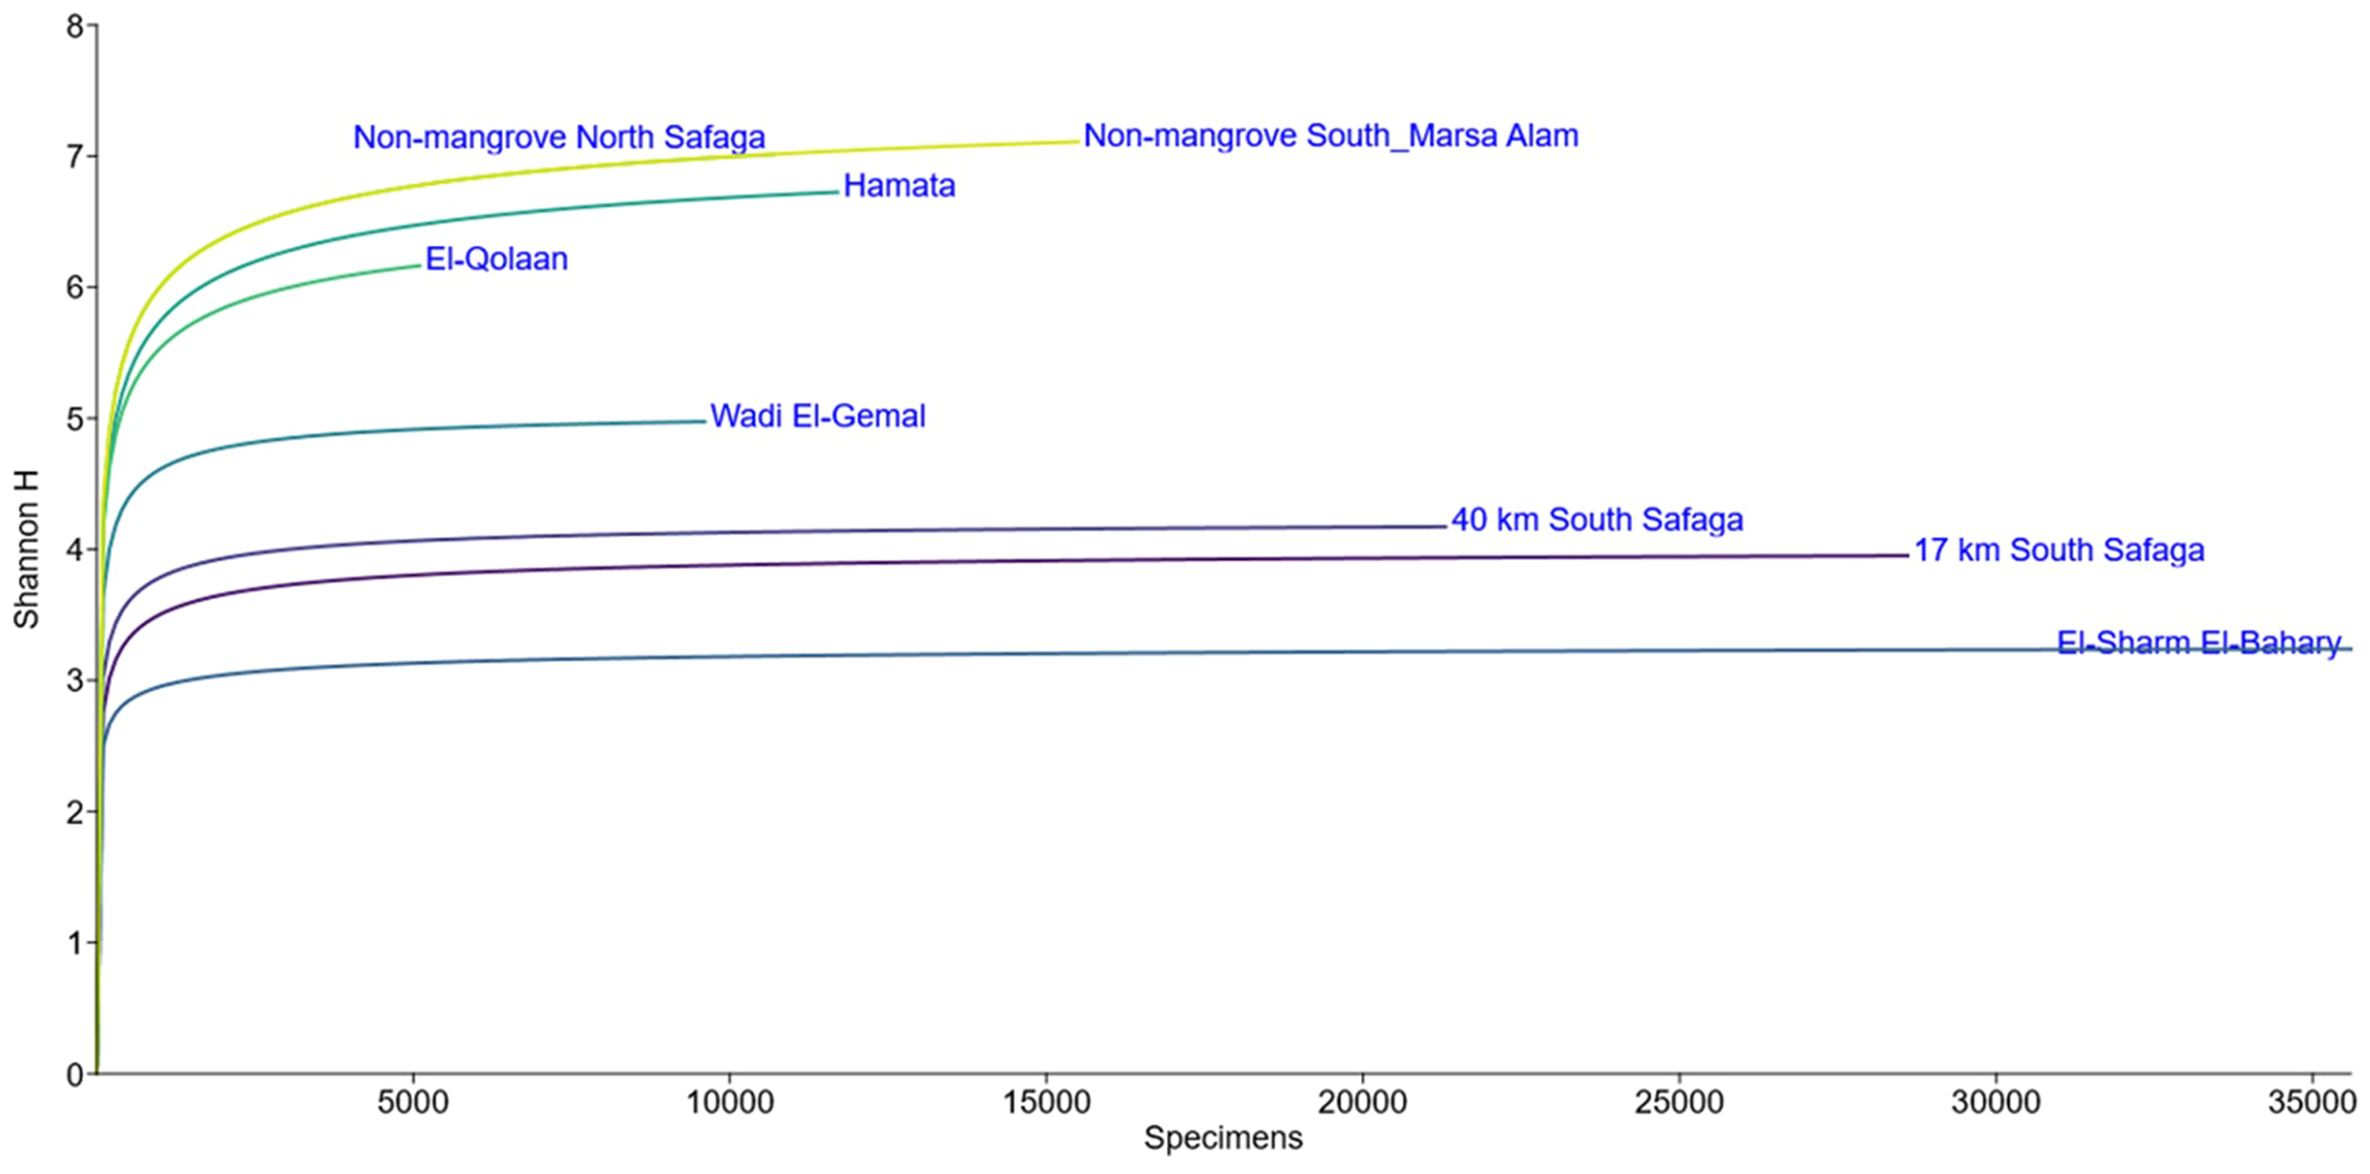
Figure 7. Rarefaction curves plotted for all ASVs identified in each of the mangrove and non-mangrove sampling sites. Y-axis values refer to the total number of sequences obtained in each sampling site.
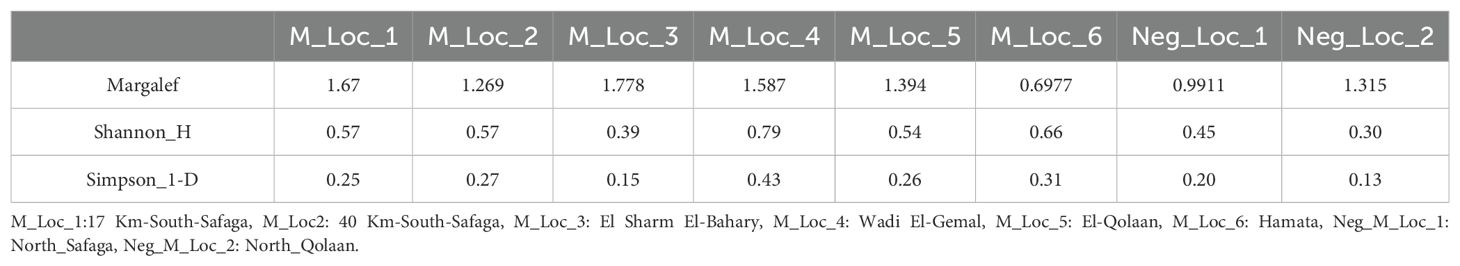
Table 3. Margalef, Shannon, and Simpson diversity indices.
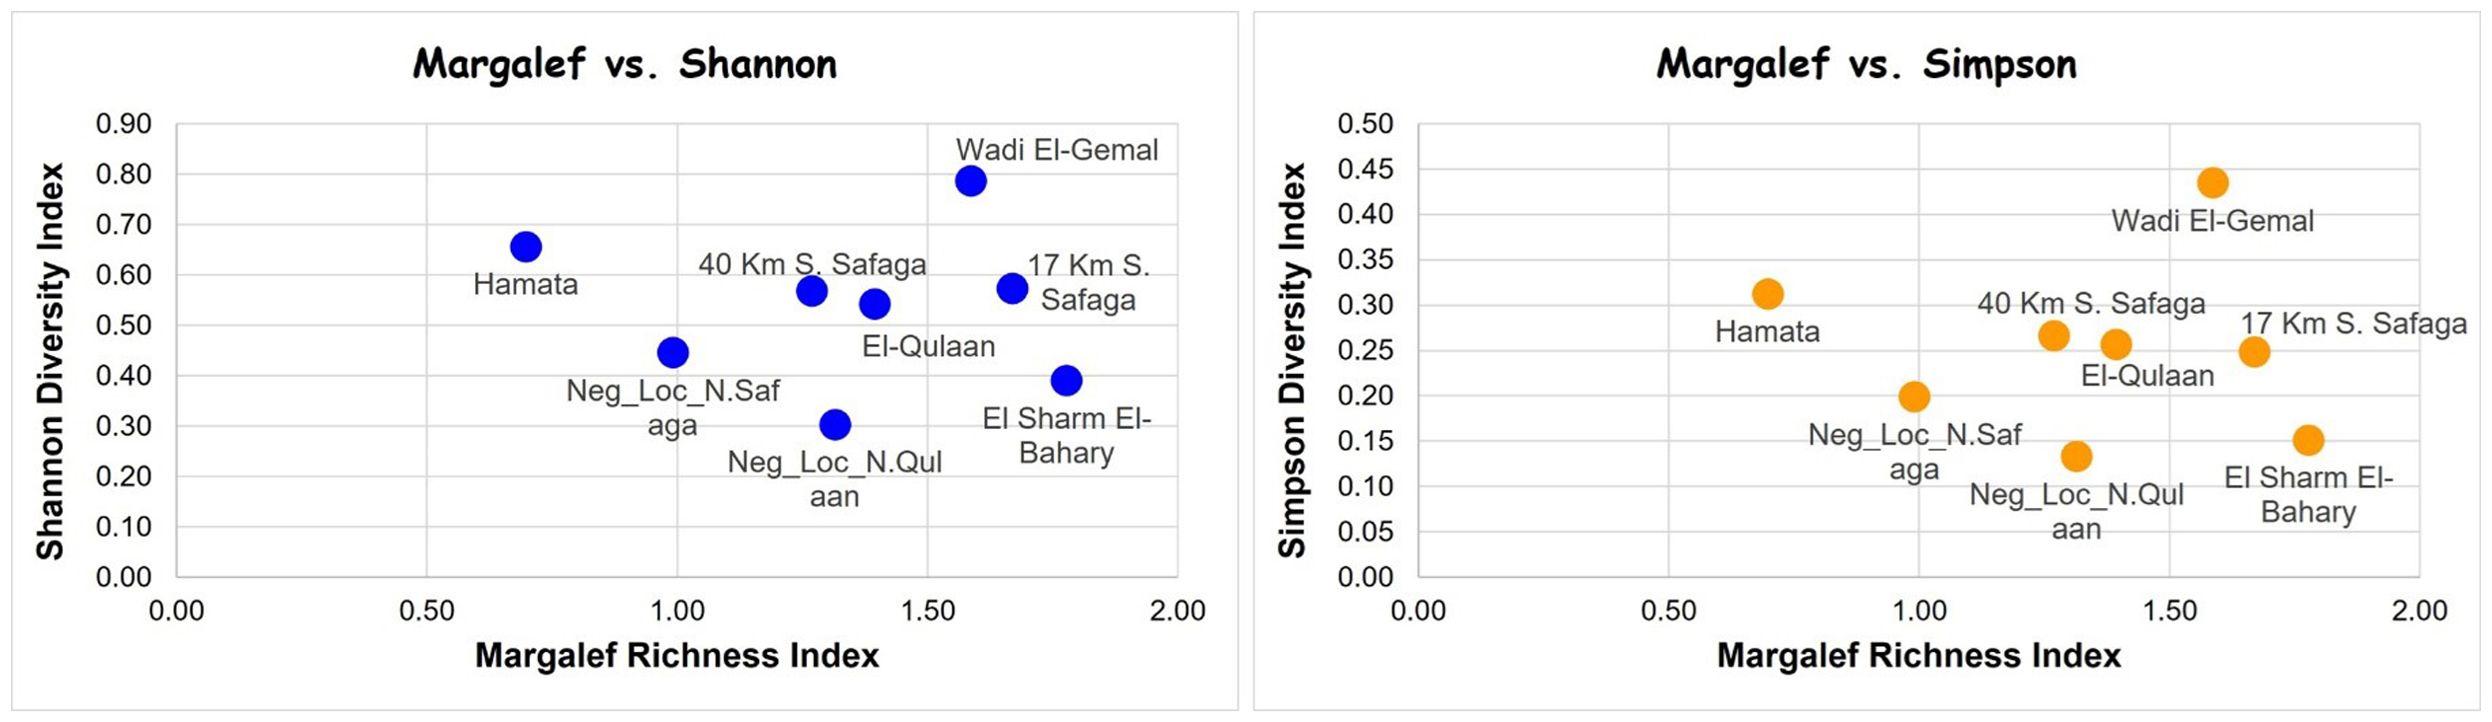
Figure 8. Margalef richness index plotted against Shannon diversity index (left) and Simpson diversity index (right) for all mangrove and non-mangrove sies in the current study. S, south; N, north; Neg_Loc, negative location (i.e., non-mangrove).
The sand fly Sergentomyia was the most abundant and common invertebrate species among all sites. Sponge sequences dominated the aquatic invertebrates identified in mangrove sites, with most of the sponge sequences belonging to the genus Callyspongia. However, these sequences were observed only at the northernmost sampling site, that is, 17 km south of Safaga. Yet, the second most abundant free-living invertebrate species was Lissodendoryx, and it was present in 3 of the sampling sites. The sponge genus Terpios was the third in the order of abundant aquatic, free-living invertebrates in mangrove sites, having the same distribution as Callyspongia. Several of the invertebrates were observed in the northernmost mangrove sampling site. However, the northernmost non-mangrove sampling site encompassed very few invertebrate species, which were the sandfly Sergentomyia, the annelid worm Subadyte, the dinoflagellate Yihiella, the bark lice Liposcelis, and the sea urchin Tripneustes. Also, the southernmost non-mangrove location, that is, north of Hamata, encompassed few invertebrate genera, which were Sergentomyia, Subadyte, the Platyhelminth Digenea, the stony coral Platygyra, and the sponge Cliona, besides two non-native species, that is, the sea anemone Anthopleura, and the American blue crab Callinectes. Callinectes is an invasive species of concern, so it was chosen for further investigation and confirmation.
The primer pair designed to detect C. sapidus, when used to investigate DNA pools from various locations, amplified the expected 250 bp fragment only in DNA of Location 2 of non-mangrove sites, the one close to Marsa Alam City in Egypt (Figure 9). Owing to the faint PCR amplicon signal, a second PCR was carried out, using the amplicons from the 1st PCR as DNA templates. It resulted in the amplification of C. sapidus COI fragment only in the same site, that is, the non-mangrove site 2 near to Marsa Alam (Figure 9). Smaller amplification products (~100 bp) visible in other samples are consistent with nonspecific primer products.
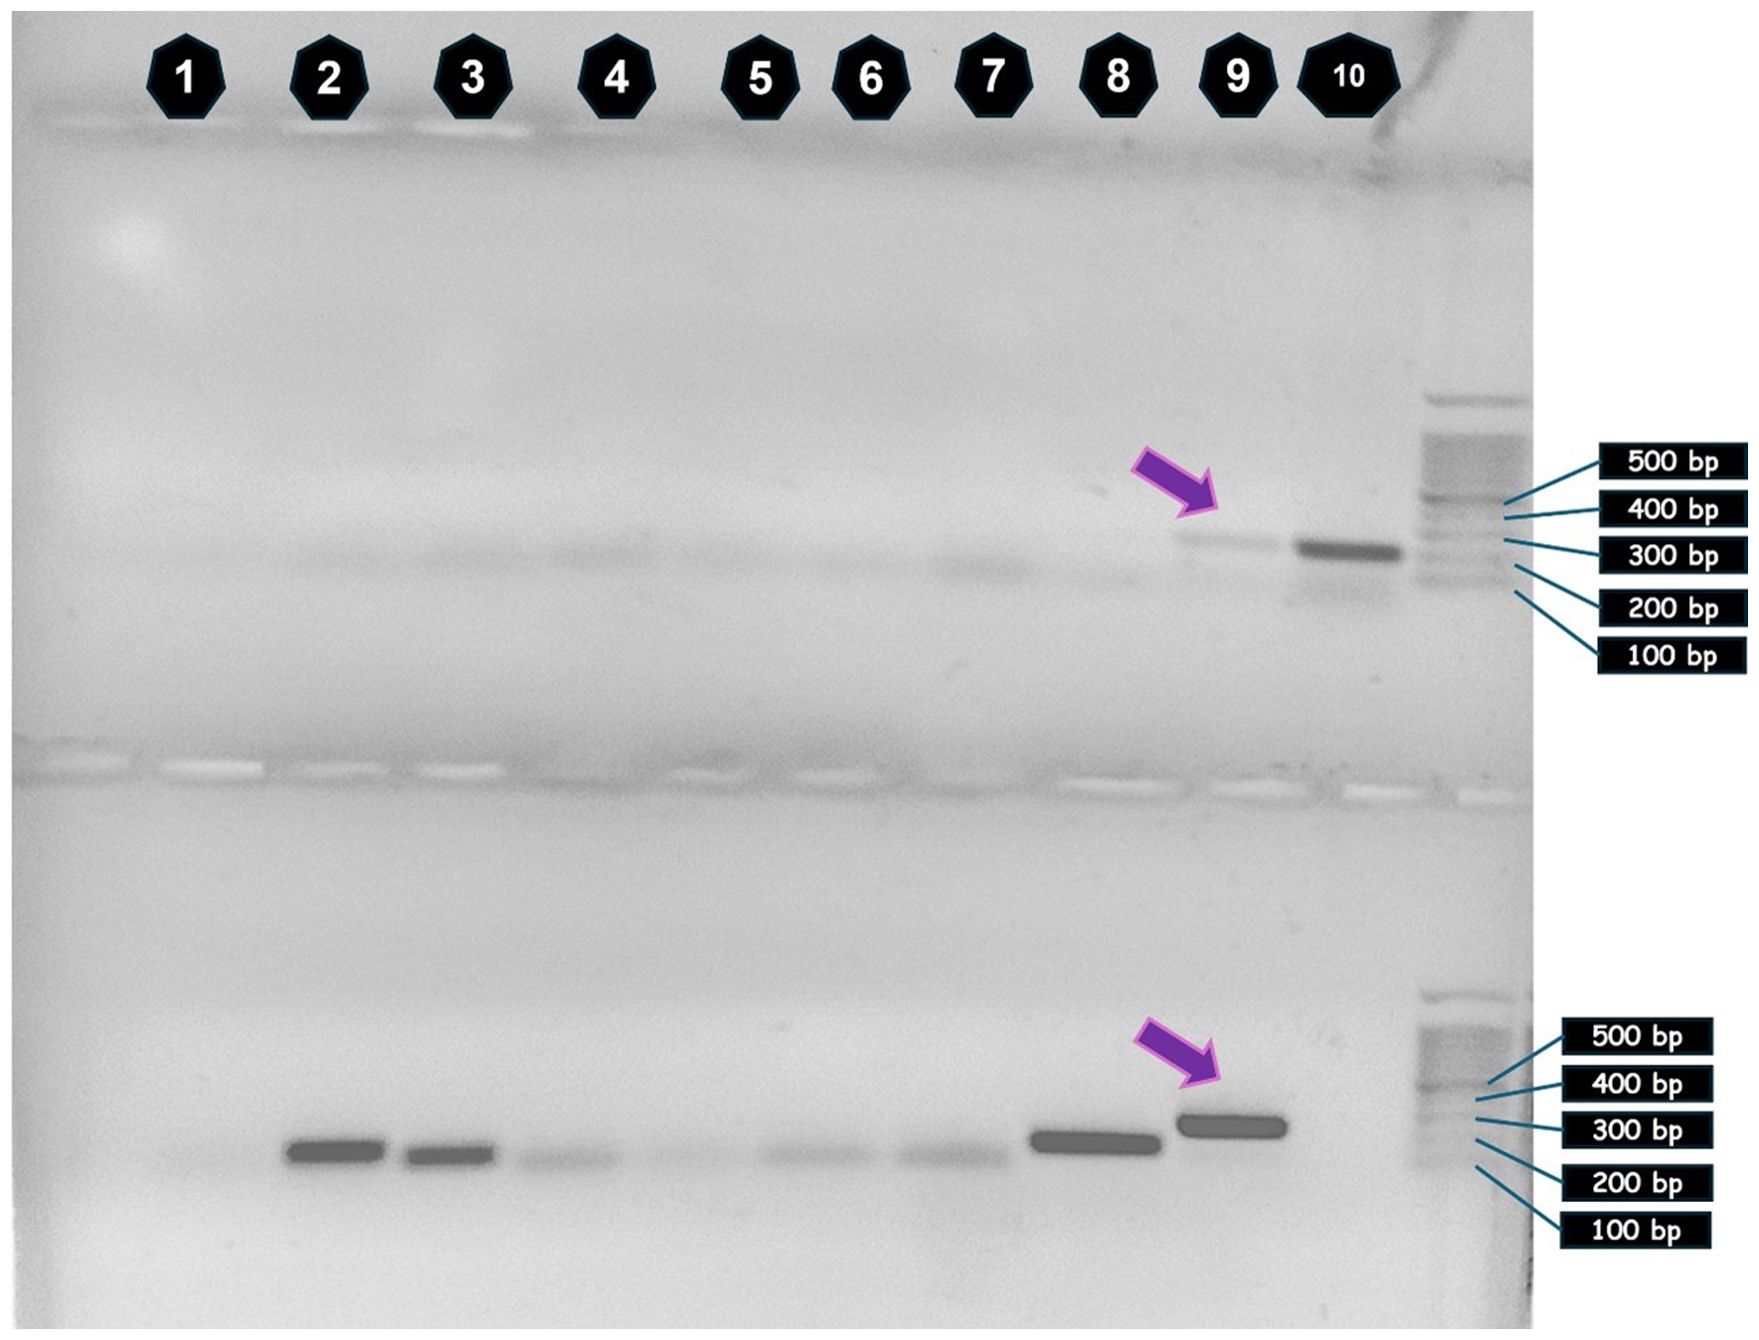
Figure 9. Callinectes sapidus (C. sapidus) cytochrome oxidase subunit 1 (COI) amplicons, electrophoresed in a 1% agarose gel. Top: Primary PCR reactions. COI gene amplified from eDNA of all locations: (1) field blank, (2) 17 km South Safaga, (3) 40 km South Safaga, (4) El_Sharm El_Bahary, (5), Wadi El-Gemal, (6) El-Qolaan, (7) Hamata, (8) North of Safaga [mangrove negative location (1), and (9)] North of Hamata [mangrove negative location (2)]. Lane 10 represents C. sapidus positive genomic DNA control (top row only). Bottom: Re-amplification of primary amplification products. Purple arrows point to 250 bp COI amplicon from the environmental DNA (eDNA), next to the C. sapidus genomic DNA control. DNA ladder band sizes are shown in base pairs (bp) at the right side of the figure.
4 Discussion
Structured habitats like those created by coastal mangroves are known to host a lot of biodiversity that provides innate value and provides various ecosystem services. Creating a thorough census of biodiversity of these habitats is costly and laborious because methods such as trawls and seines are not possible. Therefore, eDNA is a powerful addition to the other methods for discovering what marine life uses mangrove habitats.
To the best of our knowledge, the study described here is one of the few to apply eDNA metabarcoding to assess biodiversity in mangrove habitats and the first to adopt this approach in Egypt and the Red Sea. Prior studies have used similar next-generation sequencing (NGS) approaches to assess eukaryotic species diversity in different natural and artificial systems in the Red Sea, for example, Garcia-Vazquez et al. (2021) and Aylagas et al. (2024). Thus, despite the great potential of eDNA-based high-throughput molecular methods for biodiversity assessment, more extensive research is needed to evaluate the Red Sea’s sensitive habitats.
Of the 13,809 distinct sequence clusters we identified, just 5,606 could be assigned to a genus by database comparisons (ID ≥95%), and 8,753 remained unassigned under the criteria used. The high proportion of unassigned clusters is consistent with the still-lagging knowledge about biodiversity within mangrove systems in the Red Sea. Many species identified had low read counts. This aligns with the known challenges of eDNA-based biodiversity tracking in mangrove habitats, such as high salinity (~40 ppt), temperature (over 30˚C), turbidity, and organic content (Wee et al., 2023). Some studies have highlighted the role of high salinity in accelerating eDNA degradation in marine waters (Alenzi, 2024). Additionally, mangrove habitats contain high levels of humic acid, fulvic acid, tannic acid, and hematin, all of which may interfere with PCR amplification (Wee et al., 2023).
Most of the eDNA recovered in this study originated from fish. This aligns with findings from other marine ecosystems, such as coral reefs, seagrass beds, and mangroves (Cahyani et al., 2024; Chiquillo et al., 2024; Clay et al., 2025). Fish eDNA often predominates because of their high mobility and shedding of genetic material into the water column (Wee et al., 2023). A high abundance of Moolgarda seheli and Psettodes erumei eDNA was detected across all sampling sites in the Red Sea. The presence of Moolgarda among mangrove roots has been documented (El Dawi, 2000). This is also consistent with studies reporting spawning activity of Moolgarda in the Indian Ocean and Arabian Sea during October (Moorthy et al., 2002; Al-Nahdi et al., 2008). However, few studies have investigated the reproduction of this genus in the Red Sea. Similarly, data on the reproduction of the Indian halibut (Psettodes erumei) are scarce. In the Persian Gulf and the Sea of Oman, P. erumei exhibits a spawning peak in October (Ghanbarzadeh et al., 2021). It has also been observed forming small populations in mangroves in other Indian Ocean ecosystems, such as in Pagbilao, the Philippines (Pinto, 1987). The lack of data on the interactions between these species and mangroves underscores the need for further research, especially considering their importance to Red Sea fisheries (Abdalwahhab et al., 2020).
In the current study, the Wadi El-Gemal location coincided with having the highest value of the assessed three diversity indices (Margalef, Shannon, and Simpson) among all other mangrove and non-mangrove locations. This agreed with the nature of Wadi El-Gemal as an officially protected area since 2003, owing to its very diverse marine and terrestrial landscape. In the marine part of this national park, both mangrove and coral reef ecosystems exist, with corals encompassing a great diversity of fish species (Abu El-Regal, 2014). Moreover, the assessed diversity indices agreed in most cases that mangroves encompass higher species diversity than non-mangrove sites, despite some differences among the patterns of the Margalef index on the one hand and the Shannon and Simpson indices on the other. These differences can be expected, since Margalef is specific for species richness assessment, whereas the Shannon and Simpson diversity indices assess both species richness and evenness (Hamli et al., 2023). A few studies compared the efficiency of these three indices in diversity assessment in mangrove habitats, where few species exist but with clumped individuals (Mulya et al., 2021). Of these studies, Mulya et al. (2021) identified that the Margalef index outperforms the Shannon and Simpson indices in assessing the diversity of species with equal numbers, but it loses its sensitivity when species numbers vary.
Bogorodsky et al. (2024) reviewed the taxonomy of several species belonging to the genus Moolgarda in the Red Sea and recommended prioritizing the use of the genus name Moolgarda over Crenimugil and Valamugil. Furthermore, they identified three phylogenetic lineages in the region: M. seheli, M. crenilabis, and M. tade (buchanani). Our results confirmed the presence of two of these lineages at the species level (>97% COI sequence identity). However, most Moolgarda reads obtained in our study belonged to a species that could not be definitively identified. Comparison with the GenBank database yielded mixed matches, aligning with both the third lineage (M. tade) and M. seheli. Interestingly, reads of these most abundant variants were more frequent in mangrove habitats than in non-mangrove locations, unlike M. seheli and M. crenilabis, which showed no such preference. This pattern suggests that the unidentified mugilid variant may favor mangrove habitats. Given the Red Sea’s high mugilid diversity, the taxonomic discrepancies noted by Bogorodsky et al. (2024), and the scarcity of taxonomic studies on these species in Egypt, we strongly advocate for more comprehensive morphogenetic screening of mugilids in Egyptian waters.
Fish in mangrove habitats may be permanent residents or opportunistic visitors (Wee et al., 2023). Specifically, many coral-associated fish species migrate regularly to adjacent mangrove creeks, using them as nursery grounds due to abundant food resources and reduced predator capability to move and seek prey (Mumby, 2006). These ontogenetic migrations between coral and mangrove habitats can double the biomass of certain species, provided that mangroves are sufficiently abundant (Mumby, 2006). Reef-associated taxa that display such movements include the ones identified in this eDNA study: mangrove whipray (Urogymnus), emperors (Lethrinus), moonfish (Monodactylus), mullets (Moolgarda and Mugil), wrasses (Coris and Oxycheilinus), parrotfishes (Calotomus and Chlorurus), pufferfish (Arothron), triggerfish (Rhinecanthus), and rabbitfish (Siganus). At least one of their life stages is dependent on vegetated habitats, such as seagrass beds or mangroves (e.g., Smith and Heemstra, 1986; Myers, 1991; Lieske and Myers, 1994).
Two taxa identified to species level, that is, Chlorurus sordidus and Lethrinus mahsena, are listed on the IUCN Red List as Vulnerable and Endangered, respectively. To guide protection or management of species of concern, it will be important to conduct further surveys to ascertain what life stage of these fish is being detected by eDNA. The same is true for follow-up studies for abundant and commercially important species for Red Sea fisheries, which have critical ecological and economic roles.
Globally, sponge diversity has been disproportionately studied in coral reefs compared to other habitats like mangroves and seagrass beds (e.g., Castellanos-Pérez et al., 2020; Ghallab et al., 2024). We documented DNA of multiple sponge species in mangrove habitats. The three genera are siliceous sponges that are known to be benthic inhabitants of shallow-to-moderately deep reef environments and tolerant to slightly turbid or sediment-rich waters. All three genera belong to Demospongiae, the most diverse class within the phylum Porifera. Their absence from non-mangrove sites aligns with their ecology as root-dwelling species. The genera Callyspongia, Lissodendoryx, Clathria, and Terpios detected here are recognized globally as mangrove root epibionts. Lissodendoryx has been recorded as an epibiont on Rhizophora mangle roots in the southern Gulf of Mexico, where estuarine conditions support year-round high productivity (Castellanos-Pérez et al., 2020). Callyspongia and Clathria are associated with mangroves (e.g., A. marina) in the Indian Ocean coastal waters of Kenya, Mozambique, and Madagascar (Barnes and Bell, 2002). To our knowledge, no prior study has documented these sponges in Red Sea mangroves.
Additionally, this study detected two species not native to the Red Sea and not previously recorded there. These were the sea anemone Anthopleura fuscoviridis (native to the Indian Ocean) and the American blue crab Callinectes sapidus (native to the western Atlantic Ocean). The detection of C. sapidus COI barcodes by metagenomic amplicon sequencing were sparse within the eDNA extract collected from the southernmost non-mangrove site. We hypothesize that this low concentration of the American blue crab’s DNA was responsible for the attenuated signal (faint band) observed in the initial species-specific PCR, despite the amplicon being of the specific size that was also detected in the positive control, that is, C. sapidus tissue DNA sample. Re-amplification of this primary PCR product generated a specific, significantly more intense band at the same expected molecular weight, a result unique to the eDNA sample originating from near-Marsa Alam, that is, the southernmost non-mangrove location. C. sapidus has invaded multiple regions, including the Mediterranean Sea (Chaouti et al., 2022), with records in Egyptian Mediterranean waters since the 1960s (Banoub, 1963). Given the typically low eDNA shedding rates in crustaceans, with higher shedding during larval and ovigerous stages (Crane et al., 2021; Simpson et al., 2023), the detected sequences likely originated from these life stages. During visits to fish markets on the Red Sea that receive landings from the area where C. sapidus eDNA was found; neither species was observed for sale. We propose that the C. sapidus eDNA signals may be evidence of any of the following: (1) an early stage invasion, (2) contamination from ballast water or tourism-related activities (e.g., recreational vessels), or (3) accidental contamination during lab processing. Further surveys to specifically detect A. fuscoviridis or C. sapidus DNA may be helpful in predicting if these species are moving into the region. The implications of a C. sapidus invasion would be significant.
In conclusion, our eDNA-based metabarcoding assessment of Red Sea mangrove habitats demonstrated the advantages of this approach as a comprehensive, efficient augmentation to conventional biodiversity monitoring methodologies. This method not only reduces time and effort compared to traditional sampling but also enables early detection of potential invasive species. Our study confirmed that Red Sea mangroves support rich marine biodiversity, particularly among fish species. However, the current lack of morphogenetic identification and limited DNA barcoding studies in this region underscores the need for expanded genetic screening to accurately elucidate local diversity. Future work should investigate temporal distribution patterns of organisms within these habitats. Conservation and targeted expansion of mangrove ecosystems offer multiple benefits, including safeguarding the Red Sea’s ecological balance, protecting threatened species, supporting sustainable fisheries, and preserving organisms with potential biomedical and environmental values.
Data availability statement
All obtained sequences were submitted to NCBI’s Sequence Read Archive repository under the references BioProject ID PRJNA1281181 and BioSample SAMN49549056-SAMN49549063.
Ethics statement
The animal study was approved by Research Ethics Committee at the Faculty of Science, Aswan University. The study was conducted in accordance with the local legislation and institutional requirements.
Author contributions
KM: Conceptualization, Formal analysis, Methodology, Project administration, Resources, Software, Supervision, Validation, Visualization, Writing – original draft, Writing – review & editing. AM: Funding acquisition, Investigation, Methodology, Resources, Visualization, Writing – original draft, Conceptualization, Data curation. AH: Conceptualization, Data curation, Formal analysis, Funding acquisition, Methodology, Resources, Supervision, Visualization, Writing – original draft, Writing – review & editing. EM: Conceptualization, Data curation, Formal analysis, Funding acquisition, Methodology, Resources, Writing – original draft, Writing – review & editing. AS: Conceptualization, Formal analysis, Funding acquisition, Investigation, Project administration, Resources, Supervision, Visualization, Writing – review & editing. ES: Conceptualization, Formal analysis, Funding acquisition, Project administration, Resources, Software, Validation, Writing – original draft, Writing – review & editing. AG: Conceptualization, Data curation, Formal analysis, Funding acquisition, Investigation, Methodology, Project administration, Resources, Software, Validation, Visualization, Writing – original draft, Writing – review & editing.
Funding
The author(s) declare that no financial support was received for the research and/or publication of this article.
Acknowledgments
The authors would like to appreciate their deep thanks to Dr. Islam El-Sadek from the marine protectorates sector in the ministry of environmental affairs of Egypt for his role in selecting target mangrove locations. Also, we would like to thank Dr. Mohammed Ismail from potable water station of Hurghada City for his help in filtering waters for eDNA harvesting. Furthermore, we do appreciate the role of Ms. Nada Ahmed Zalabia, the environmental specialist, for the fruitful discussions and information about mangrove habitats. We appreciate the role of Dr. Sabeena Nazar from BAS lab at the Institute of Marine and Environmental Technology (IMET), University of Maryland Center for Environmental Science, (UMCES) for her precious aids during sequencing of the PCR amplicons. Finally, we would like to thank Dr. Tsvetan Bachvaroff (IMET-UMCES, USA) for his precious helps and very fruitful information about bioinformatic analyses of metagenomic amplicon sequencing.
Conflict of interest
The authors declare that the research was conducted in the absence of any commercial or financial relationships that could be construed as a potential conflict of interest.
Generative AI statement
The author(s) declare that no Generative AI was used in the creation of this manuscript.
Any alternative text (alt text) provided alongside figures in this article has been generated by Frontiers with the support of artificial intelligence and reasonable efforts have been made to ensure accuracy, including review by the authors wherever possible. If you identify any issues, please contact us.
Publisher’s note
All claims expressed in this article are solely those of the authors and do not necessarily represent those of their affiliated organizations, or those of the publisher, the editors and the reviewers. Any product that may be evaluated in this article, or claim that may be made by its manufacturer, is not guaranteed or endorsed by the publisher.
References
Abdalwahhab O., Galal-Khallaf A., Saber S. A. E. L., Osman A. G., and Mohammed-Geba K. (2020). A case study for application of DNA barcoding in identifying species and genetic diversity of fish from the Suez city market, Egypt. Aquat. Living Resour. 33, 11. doi: 10.1051/alr/2020012
Abu El-Regal M. (2014). Impact of the valley flooding upon the abundance and diversity of the reef fishes in Wadi El-Gemal protected area, Red Sea, Egypt. Egyptian J. Aquat. Biol. Fisheries 18, 83–95. doi: 10.21608/ejabf.2014.2195
Afefe A. (2021). Linking territorial and coastal planning: Conservation status and management of mangrove ecosystem at the Egyptian-African Red Sea coast. Aswan Univ. J. Environ. Stud. 2, 91–114. doi: 10.21608/aujes.2021.65951.1013
Alenzi A. M. (2024). Evaluation of fish biodiversity in estuaries through environmental DNA metabarcoding: A comprehensive review. Fishes 9, 422. doi: 10.3390/fishes9110422
Al-Nahdi A., Al-Marzouqi A., Al-Shajibi S., and Al-Hosni A. (2008). Length-weight relationships, maturity, and reproductive season of the fringelip mullet Crenimugil crenilabis (Forsskål 1775) from the Arabian sea coast of Oman. J. Agric. Mar. Sci. [JAMS] 13, 23–32. doi: 10.24200/jams.vol13iss0pp23-32
Anton A., Almahasheer H., Delgado A., Garcias-Bonet N., Carrillo-de-Albornoz P., Marbà N., et al. (2020). Stunted mangrove trees in the oligotrophic central Red Sea relate to nitrogen limitation. Front. Mar. Sci. 7, 597. doi: 10.3389/fmars.2020.00597
Aylagas E., Shchepanik H., Pearman J. K., Parisi B., Curdia J., Berumen M. L., et al. (2024). Disentangling eukaryotic biodiversity patterns from man-made environments (port and marina) and nearby coral reefs in the Red Sea: A focus on the surveillance of non-indigenous species. Environ. DNA 6, e583. doi: 10.1002/edn3.583
Balatero T. P., Molina Z., Dalayap R., Dechavez R., Manubag J. J., Sumaya N. H., et al. (2025). eDNA metabarcoding in mangrove ecosystems for fish conservation and stock assessment of Sardinops sagax melanostictus in the Philippines. Biodiversitas J. Biol. Diversity 26, 345–355. doi: 10.13057/biodiv/d260134
Banoub M. W. (1963). Survey of the blue-crab Callinectus sapidus (Rath.), in Lake Edku in 1960. Notes and Memoirs No. 69 Alex. Inst. Hydrobiology Egypt 69, 1–17.
Barnes D. K. and Bell J. J. (2002). Coastal sponge communities of the West Indian Ocean: taxonomic affinities, richness and diversity. Afr. J. Ecol. 40, 337–349. doi: 10.1046/j.1365-2028.2002.00387.x
Blanco-Sacristán J., Duarte C., Mccabe M., Daffonchio D., Johansen K., and Hoteit I. (2022). Mangrove distribution and afforestation potential in the Red Sea. Sci. total Environ. 843, 157098. doi: 10.1016/j.scitotenv.2022.157098
Bogorodsky S. V., Thieme P., Senou H., Mahmoud Z. N., Alpermann T. J., and Durand J. D. (2024). Contributions to the Taxonomy of the Mugilid Genus Moolgarda Whitley (Teleostei: Mugilidae), with Redescriptions of M. crenilabis, M. seheli and M. tade from the Red Sea. Diversity 16, 325. doi: 10.3390/d16060325
Borrell Y. J., Miralles L., Do Huu H., Mohammed-Geba K., and Garcia-Vazquez E. (2017). DNA in a bottle—Rapid metabarcoding survey for early alerts of invasive species in ports. PloS One 12, e0183347. doi: 10.1371/journal.pone.0183347
Cahyani N. K. D., Jumari J., Hariyati R., Rahadian R., Rahim A., Zega E. S., et al. (2024). Utilizing environmental DNA to identify eukaryotic diversity in mangrove sediments at demak, central java, Indonesia. ILMU KELAUTAN: Indonesian J. Mar. Sci. 29, 543–556. doi: 10.14710/ik.ijms.29.4.543-556
Castellanos-Pérez P. D. J., Vázquez-Maldonado L. E., Ávila E., Cruz-Barraza J. A., and Canales-Delgadillo J. C. (2020). Diversity of mangrove root-dwelling sponges in a tropical coastal ecosystem in the southern Gulf of Mexico region. Helgoland Mar. Res. 74, 13. doi: 10.1186/s10152-020-00545-6
Chaouti A., Belattmania Z., Nadri A., Serrao E., Encarnacao J., Teodosio M., et al. (2022). The invasive Atlantic blue crab Callinectes sapidus Rathbun 1896 expands its distributional range southward to Atlantic African shores: first records along the Atlantic coast of Morocco. BioInvasions Records 11, 227–237. doi: 10.3391/bir.2022.11.1.23
Chiquillo K. L., Wong J. M., and Eirin-Lopez J. M. (2024). Ecological forensic testing: Using multiple primers for eDNA detection of marine vertebrates in an estuarine lagoon subject to anthropogenic influences. Gene 928, 148720. doi: 10.1016/j.gene.2024.148720
Clay C. G., Gösser F., Glue M., Long M., Rog S. M., Sinovas P., et al. (2025). Exploring species and functional diversity of fishes in Cambodian coastal habitats using eDNA metabarcoding. Coral Reefs 44, 221–241. doi: 10.1007/s00338-024-02599-1
Crane L. C., Goldstein J. S., Thomas D. W., Rexroth K. S., and Watts A. W. (2021). Effects of life stage on eDNA detection of the invasive European green crab (Carcinus maenas) in estuarine systems. Ecol. Indic. 124, 107412. doi: 10.1016/j.ecolind.2021.107412
Cziesielski M. J., Duarte C. M., Aalismail N., Al-Hafedh Y., Anton A., Baalkhuyur F., et al. (2021). Investing in blue natural capital to secure a future for the Red Sea ecosystems. Front. Mar. Sci. 7, 603722. doi: 10.3389/fmars.2020.603722
Das S. C., Das S., and Tah J. (2022). “Mangrove forests and people’s livelihoods,” in Mangroves: Biodiversity, Livelihoods and Conservation (Springer Nature Singapore, Singapore), 153–173.
Dasgupta S., Islam M. S., Huq M., Huque Khan Z., and Hasib M. R. (2019). Quantifying the protective capacity of mangroves from storm surges in coastal Bangladesh. PloS One 14, e0214079. doi: 10.1371/journal.pone.0214079
Debrot A. O., Veldhuizen A., Van Den Burg S. W., Klapwijk C. J., Islam M. N., Alam M. I., et al. (2020). Non-timber forest product livelihood-focused interventions in support of mangrove restoration: A call to action. Forests 11, 1224. doi: 10.3390/f11111224
DiBattista J., Coker D., Sinclair-Taylor T., Stat M., Berumen M., and Bunce M. (2017). Assessing the utility of eDNA as a tool to survey reef-fish communities in the Red Sea. Coral Reefs 36, 1245–1252. doi: 10.1007/s00338-017-1618-1
El Dawi E. S. F. A. (2000). Diversity, habitats and seasonal distribution of fish in three protectorates of southern Sinai on the Red Sea, Egypt. Qatar Univ. Sci. J. 20, 111–124.
Fernández S., Ardura A., Georges O., Martinez J. L., Suarez-Menendez M., Planes S., et al. (2022). Non-native species in the north Gulf of Aqaba (Red Sea) revealed from environmental DNA. Front. Mar. Sci. 9, 940889. doi: 10.3389/fmars.2022.940889
Garcia-Vazquez E., Georges O., Fernandez S., and Ardura A. (2021). eDNA metabarcoding of small plankton samples to detect fish larvae and their preys from Atlantic and Pacific waters. Sci. Rep. 11, 7224. doi: 10.1038/s41598-021-86731-z
Ghallab A., Hussein H. N., Madkour H., Osman A., and Mahdy A. (2024). “Status of coral reefs along the Egyptian Red Sea coast,” in Coral Reefs and Associated Marine Fauna around the Arabian Peninsula (Boca Raton FL, USA: CRC Press), 32–46.
Ghanbarzadeh M., Kamrani E., Ranjbar M. S., Salarpouri A., and Walters C. (2021). Reproductive biology of Indian halibut, Psettodes erumei from the northern Persian Gulf and Oman Sea (Teleoststei: Psettodidae). Iranian J. Ichthyology 8, 1–13. doi: 10.22034/iji.v8i1.434
Giri C. (2021). Recent advancement in mangrove forests mapping and monitoring of the world using earth observation satellite data. Remote Sensing 13, 563.
Grammatiki K., de Jonge N. F., Nielsen J. L., Gómez S. C. G., Avramidi E., Lymperaki M., et al. (2025). eDNA metabarcoding of marine invertebrate communities at RO desalination plant outfalls in Cyprus. Mar. pollut. Bulletin, 214. doi: 10.1016/j.marpolbul.2025.117609
Hamilton S. E. and Friess D. A. (2018). Global carbon stocks and potential emissions due to mangrove deforestation from 2000 to 2012. Nat. Climate Change 8, 240–244. doi: 10.1038/s41558-018-0090-4
Hamli H., Idris M. H., Gerusu G. J., Ng J. F., and Kamal A. H. M. (2023). Macro-infaunal diversity and assemblage in the mangrove habitat of Lawas, Sarawak, Malaysia. Regional Stud. Mar. Sci. 60, 102889. doi: 10.1016/j.rsma.2023.102889
Hammer Ø. and Harper D. A. (2001). Past: paleontological statistics software package for educaton and data anlysis. Palaeontologia electronica 4, 1.
Heberle H., Meirelles G. V., da Silva F. R., Telles G. P., and Minghim R. (2015). InteractiVenn: a web-based tool for the analysis of sets through Venn diagrams. BMC Bioinf. 16, 169. doi: 10.1186/s12859-015-0611-3
Khalil A. S. (2015). “Mangroves of the red sea,” in The Red Sea: The formation, morphology, oceanography and environment of a young ocean basin (Berlin Heidelberg: Springer-Verlag) 585–597.
Knudsen S. W., Hesselsøe M., Thaulow J., Agersnap S., Hansen B. K., Jacobsen M. W., et al. (2022). Monitoring of environmental DNA from nonindigenous species of algae, dinoflagellates and animals in the North East Atlantic. Sci. Total Environ. 821, 153093. doi: 10.1016/j.scitotenv.2022.153093
Kumar S., Stecher G., and Tamura K. (2016). MEGA7: molecular evolutionary genetics analysis version 7.0 for bigger datasets. Mol. Biol. Evol. 33, 1870–1874.
Leray M., Yang J. Y., Meyer C. P., Mills S. C., Agudelo N., Ranwez V., et al. (2013). A new versatile primer set targeting a short fragment of the mitochondrial COI region for metabarcoding metazoan diversity: application for characterizing coral reef fish gut contents. Front. Zool. 10, 34. doi: 10.1186/1742-9994-10-34
Letunic I. and Bork P. (2019). Interactive Tree Of Life (iTOL) v4: recent updates and new developments. Nucleic Acids Res. 47, W256–W259. doi: 10.1093/nar/gkz239
Lieske E. and Myers R. (1994). “Collins pocket guide,” in Coral reef fishes. Indo-Pacific & Caribbean including the Red Sea (NY, USA: Haper Collins Publishers), 400 p.
Macher J. N., Martínez A., Çakir S., Cholley P. E., Christoforou E., Curini Galletti M., et al. (2024). Enhancing metabarcoding efficiency and ecological insights through integrated taxonomy and DNA reference barcoding: A case study on beach meiofauna. Mol. Ecol. Resour. 24, e13997. doi: 10.1111/1755-0998.13997
McCartin L., Saso E., Vohsen S. A., Pittoors N., Demetriades P., McFadden C. S., et al. (2024). Nuclear eDNA metabarcoding primers for anthozoan coral biodiversity assessment. PeerJ 12, e18607. doi: 10.7717/peerj.18607
Moorthy K. V., Reddy H. R. V., and Annappaswamy T. S. (2002). Reproductive biology of the blue spot mullet Valamugil seheli (forskal) from Mangalore region, southwest coast of India. J. Indian Fisheries Assoc. 29, 117–121. doi: 10.4236/oalib.1101621
Moustafa A. A., Abdelfath A., Arnous M. O., Afifi A. M., Guerriero G., and Green D. R. (2023). Monitoring temporal changes in coastal mangroves to understand the impacts of climate change: Red Sea, Egypt. J. Coast. Conserv. 27, 37. doi: 10.1007/s11852-023-00970-y
Mulya H., Santosa Y., and Hilwan I. (2021). Comparison of four species diversity indices in mangrove community. Biodiversitas J. Biol. Diversity 22, 3648–3655. doi: 10.13057/biodiv/d220906
Mumby P. J. (2006). Connectivity of reef fish between mangroves and coral reefs: algorithms for the design of marine reserves at seascape scales. Biol. Conserv. 128, 215–222. doi: 10.1016/j.biocon.2005.09.042
Osland M. J., Feher L. C., López-Portillo J., Day R. H., Suman D. O., Menéndez J. M. G., et al. (2018). Mangrove forests in a rapidly changing world: Global change impacts and conservation opportunities along the Gulf of Mexico coast. Estuarine Coast. Shelf Sci. 214, 120–140. doi: 10.1016/j.ecss.2018.09.006
Pinto L. (1987). Environmental factors influencing the occurrence of juvenile fish in the mangroves of Pagbilao, Philippines. Hydrobiologia 150, 283–301. doi: 10.1007/BF00008709
Rognes T., Flouri T., Nichols B., Quince C., and Mahé F. (2016). VSEARCH: a versatile open source tool for metagenomics. PeerJ 4, e2584. doi: 10.7717/peerj.2584
Ruppert K. M., Kline R. J., and Rahman M. S. (2019). Past, present, and future perspectives of environmental DNA (eDNA) metabarcoding: A systematic review in methods, monitoring, and applications of global eDNA. Global Ecol. Conserv. 17, e00547. doi: 10.1016/j.gecco.2019.e00547
Sewilam H., Hassan B. T., and Khalil B. S. (2025). Spatiotemporal distribution of mangrove along the Egyptian Red Sea coast and analysis of hydrological impact on growth patterns. Int. J. Environ. Sci. Technol. 22, 725–742. doi: 10.1007/s13762-024-05670-0
Simpson T. J., Wellington C. M., Lukehurst S. S., Huerlimann R., Veilleux H., Snow M., et al. (2023). Development of a real-time PCR (qPCR) method for the identification of the invasive paddle crab Charybdis japonica (Crustacea, Portunidae). PeerJ 11, e15522. doi: 10.7717/peerj.15522
Smith M. M. and Heemstra P. C. (1986). “Tetraodontidae,” in Smiths' sea fishes. Eds. Smith M. M. and Heemstra P. C. (Springer-Verlag, Berlin), 894–903.
Spalding M., McIvor A., Tonneijck F. H., Tol S., and van Eijk P. (2014). Mangroves for coastal defence. Guidelines for coastal managers & policy makers. Wetlands Int. Nat. conservancy 42, 1–42. doi: 10.4324/9781849776608
Valentini A., Taberlet P., Miaud C., Civade R., Herder J., Thomsen P. F., et al. (2016). Next-generation monitoring of aquatic biodiversity using environmental DNA metabarcoding. Mol. Ecol. 25, 929–942. doi: 10.1111/mec.13428
Vargovčík O., Čiamporová-Zaťovičová Z., Beracko P., Kopáček J., Macko P., Tuhrinová K., et al. (2024). Environmental gradients and optimal fixation time revealed with DNA metabarcoding of benthic sample fixative. Sci. Rep. 14, 18396. doi: 10.1038/s41598-024-68939-x
Wee A. K., Salmo Iii S. G., Sivakumar K., Then A. Y., Basyuni M., Fall J., et al. (2023). Prospects and challenges of environmental DNA (eDNA) metabarcoding in mangrove restoration in Southeast Asia. Front. Mar. Sci. 10, 1033258. doi: 10.3389/fmars.2023.1033258
Keywords: eDNA metabarcoding, mangroves, metagenomics, invasive species, Red Sea, biodiversity
Citation: Mohammed-Geba K, Elamin AM, Hassan A, Mohammed E, Salah-Eldin A-E, Schott EJ and Galal-Khallaf A (2025) Environmental DNA-based metabarcoding reveals a high animal biodiversity level within Red Sea mangrove beds. Front. Mar. Sci. 12:1686361. doi: 10.3389/fmars.2025.1686361
Received: 15 August 2025; Accepted: 28 October 2025;
Published: 19 November 2025.
Edited by:
Jian-Wen Qiu, Hong Kong Baptist University, Hong Kong SAR, ChinaCopyright © 2025 Mohammed-Geba, Elamin, Hassan, Mohammed, Salah-Eldin, Schott and Galal-Khallaf. This is an open-access article distributed under the terms of the Creative Commons Attribution License (CC BY). The use, distribution or reproduction in other forums is permitted, provided the original author(s) and the copyright owner(s) are credited and that the original publication in this journal is cited, in accordance with accepted academic practice. No use, distribution or reproduction is permitted which does not comply with these terms.
*Correspondence: Asmaa Galal-Khallaf, YXNfa2hfMjJAeWFob28uY29t