Abstract
This research analyses the carbon emissions associated with a shared transport method within the dry port-seaport network, focusing on the realm of green transportation. Utilizing theoretical analysis and numerical examples, the study contrasts carbon emission levels across three distinct scenarios: shared transport, non-shared transport, and direct road transport. Numerical investigations are conducted to assess the environmental value sensitivity. Results indicate that when the total distance traveled by shippers exceeds that of shared transport, the milk-run transport approach can markedly decrease carbon emissions. Furthermore, transitioning from unimodal road transport to intermodal transport has the potential to yield significant carbon emission savings. This study offers a validated policy objective for fostering a more sustainable transportation system by promoting a modal shift from direct to shared transport.
1 Introduction
The predominant sources of carbon emissions can be attributed to the electricity, industrial, and transportation sectors, with the latter being responsible for a significant portion of global emissions. According to the International Energy Agency (IEA) (Ferrer and Thome, 2023; Temizceri and Kara, 2024), transportation accounted for 23.3% of global carbon emissions in 2024, highlighting the urgent need for mitigating its impact on climate change (Solaymani and Botero, 2025). The freight transportation segment, particularly heavy-duty trucking and maritime logistics, constitutes a major contributor within this sector, underscoring the critical importance of developing innovative strategies for decarbonization (Chen et al., 2024).
This imperative for decarbonization extends across the entire maritime logistics chain, from internal terminal operations, such as stowage planning to minimize inefficient shifts and energy use, to the external hinterland transport networks. In line with the growing global emphasis on green and sustainable transport practices, this research delves into the potential of a shared transport service, known as the milk-run model, offered by dry ports to shippers in the hinterland, to reduce carbon emissions (Zhou et al., 2025a). A dry port, also known as an inland port, functions as an extension of a seaport in the inland region, offering the essential functional characteristics of a seaport while serving as a crucial hub and node for intermodal transport (Rekabi and Sazvar, 2025; Rekabi et al., 2025). These facilities provide road and rail transport options for shippers involved in both outbound and inbound shipments from the hinterland (Chen et al., 2023; Khaslavskaya et al., 2024). Unlike logistics parks or container terminals in inland areas, dry ports boast regulatory agencies such as customs, inspection, and quarantine authorities. Designated as special customs supervision areas, they offer ‘one-stop customs clearance’ services and other value-added offerings, making them attractive destinations for cargo flows.
The conceptual foundation of milk-run transportation is deeply rooted in the traditional milk delivery systems historically prevalent in Western nations (Jeshvaghani et al., 2023; Kovač et al., 2023). This system was characterized by a milkman traversing a predetermined route with a horse-drawn dray (or later, a vehicle) to perform dual tasks: delivering bottled milk to households and simultaneously collecting empty bottles for reuse (Rosenberg et al., 2021). This operational paradigm, renowned for its efficiency and cyclic regularity, has been extensively adopted and refined across various industrial sectors, with global automobile manufacturers representing a particularly prominent case. The implementation of the milk-run logistics model within these sophisticated supply chains has consistently demonstrated significant efficacy in achieving two core objectives: the reduction of inventory holding costs and the acceleration of goods transportation to end customers.
Consequently, the primary objective of this research is to conduct a rigorous investigation into the impact of shared transport modalities on carbon emission mitigation. Furthermore, this study seeks to elucidate the subsequent implications and identify actionable best practices that dry port operators and policy-makers can implement to foster the development of a more environmentally sustainable system for hinterland transport operations. Through a comprehensive analysis of the environmental footprint associated with shared transport, this research aims to pinpoint critical avenues for operational enhancement and to delineate a set of definitive, actionable strategies specifically aimed at curbing carbon emissions within the logistics sector. Moreover, the findings of this study carry practical implications beyond the academic sphere. In the context of intensifying global commitments to carbon neutrality, the results provide timely guidance for policymakers and industry stakeholders seeking to balance economic growth with environmental stewardship. By aligning with international decarbonization agendas, this research underlines the pivotal role of hinterland logistics in shaping the sustainability trajectory of global supply chains.
The structure of the paper is organized as follows: Section 2 provides a synthesis of the extant literature. Section 3 delves into the problem formulation and model development. Section 4 is dedicated to the discussion of findings and their implications. Section 5 furnishes a numerical illustration along with sensitivity analyses. Finally, Section 6 concludes the study with a summary of the key insights and recommendations.
2 Literature review
2.1 Dry port
In recent scholarship, there has been a pronounced surge in academic inquiry focused on alleviating the environmental footprint of dry ports, reflected in a burgeoning body of literature on the subject annually (Khaslavskaya et al., 2024; Jiang et al., 2025; Wang et al., 2025; Xiao et al., 2025). Qiu et al., delve into the complex decision-making process within a dry port system, specifically focusing on the interplay between a single dry port and its multiple, heterogeneous shippers (Qiu and Xu, 2019). They address the critical challenge of optimizing rail shuttle services by considering key factors such as pricing strategies and train scheduling. To model this intricate port-shipper interaction where each entity has its own objectives (the dry port seeks profit maximization, while shippers aim for cost minimization), they developed a novel bilevel programming model. This approach effectively captures the hierarchical decision-making structure, providing a robust framework for determining optimal service prices and frequencies that balance the interests of both parties.
The environmental imperative for adopting dry ports is powerfully demonstrated by several empirical studies. Lättilä et al., reveal that the strategic implementation of dry ports facilitates a significant modal shift, transferring cargo from road-based to rail-based transportation (Lattila et al., 2013). This shift not only alleviates severe congestion around seaport terminals and their adjacent urban areas but also yields substantial reductions in carbon emissions, with their analysis indicating a potential decrease ranging from 32% to 45%. Corroborating this finding on a larger scale, Li et al., conducted a comprehensive analysis of data from 51 major seaport cities in China (Li et al., 2019). Their research concludes that an optimized utilization of the seaport-dry port network, which promotes a more balanced use of regional ports and efficient hinterland connections, could markedly diminish the overall carbon output of the container logistics system.
Further refining the understanding of environmental benefits, Qiu et al., investigated the carbon footprint of shared transport services, such as consolidated rail shuttles, within dry port systems (Qiu et al., 2015). Their research demonstrates that these shared, high-capacity services typically result in a significant decrease in carbon emissions per container unit compared to individual trucking. Focusing on a European context, Carboni et al., provided a granular, real-world assessment through an examination of Italian case studies. Their documented outcomes showed a notable 17% reduction in key air pollutants, equating to an annual decline of approximately 8,000 tons of carbon emissions, achieved by establishing a direct rail connection between a seaport and a close-range dry port (Carboni and Orsini, 2020).
The strategic planning of these networks under broader initiatives is explored by Xie et al (Xie et al., 2021),. They explored the optimization of the logistics network between dry ports and seaports within the framework of China’s Belt and Road Initiative, utilizing Shandong Province as a detailed case study. Their findings suggest a positive correlation between strategic infrastructure investment and environmental efficiency, implying that as transportation infrastructure expenditures rise to create better rail and intermodal connections, the costs and externalities associated with carbon emissions decrease. Finally, the role of policy instruments is highlighted by Dai (Dai et al., 2018). They integrated carbon tax policies and carbon emission trading schemes into their model of a port-hinterland container transport system. Their simulations demonstrate that at specific carbon tax rates or under defined carbon emission quota thresholds, there is a marked abatement in the carbon emissions across the entire network, providing a clear economic incentive for stakeholders to adopt greener practices and technologies.
2.2 Milk-run transportation
The milk-run transportation paradigm represents an operational strategy adopted by manufacturers to maximize the utility of a dedicated vehicle fleet, which, at predetermined intervals, traverses a carefully planned route to procure goods from a multitude of suppliers. This approach obviates the necessity for full vehicle loads prior to dispatch, thereby enhancing transportation efficiency and diminishing inventory volumes (Jeshvaghani et al., 2023). It is particularly well-suited to scenarios characterized by small-lot, high-frequency transportation demands, and is widely employed in Just-in-Time (JIT) systems and among discrete manufacturing sectors, such as the electronics and automotive industries, for the conveyance of components. Scholarly investigation into milk-run transportation primarily focuses on route optimization, inventory management models, and distributional tactics (Klenk and Galka, 2019).
Within the context of dry port-seaport systems, the milk-run model offers distinct advantages for carbon reduction (Brar and Saini, 2011). Its core mechanism lies in consolidating fragmented cargo flows from multiple shippers into full truckloads, which significantly reduces the total number of vehicle trips and minimizes associated empty return journeys. Furthermore, by employing pre-optimized collection routes, this approach minimizes the total travel distance when compared to numerous individual direct trips (Zhou et al., 2025b). Another crucial advantage is its role in facilitating modal shift: by aggregating cargo at the dry port, the milk-run system generates sufficient shipment volume to leverage more carbon-efficient rail transport for the long-haul segment to the seaport (Mathers et al., 2014).
As an integral component of the evolution towards sustainable transportation practices, dry ports can augment their service proficiency by incorporating milk-run transportation services. By harnessing the potential of shared transport services (Ülkü, 2012). The proposed method promotes a shift in transportation modes, especially within inland industrial agglomeration zones where there is a prevalent need for small-scale, regular transportation. Utilizing milk-run transport methodologies, goods can be transported efficiently from consignors to dry ports, where, following centralized assembly and processing, they can be conveyed to seaports via railway infrastructure (Qiu and Huang, 2016).
In practice, however, the implementation of milk-run transport systems is not without challenges. Factors such as the geographic distribution of suppliers, variability in shipment sizes, and the need for precise scheduling all contribute to the complexity of real-world operations. Addressing these barriers requires the integration of advanced digital technologies, including real-time tracking and demand forecasting, to ensure that the theoretical advantages of milk-run logistics can be fully realized in practice.
2.3 Research gaps and bottlenecks
Despite the growing interest in decarbonizing dry port-seaport systems, several significant bottlenecks hinder both research and practical implementation. Firstly, data acquisition poses a major challenge (Kühlwein and Friedrich, 2000). Obtaining accurate, continuous, and detailed data on freight flows and associated emissions is difficult due to commercial confidentiality and systemic barriers among different stakeholders. Emerging technologies like blockchain have been proposed to enhance data transparency and trust in supply chains, yet their implementation in multi-party freight coordination remains a challenge (Zhuo et al., 2025). Secondly, the implementation of coordinated models like milk-run transportation requires intricate multi-party collaboration. Achieving seamless coordination and aligning the interests of shippers, dry port operators, rail service providers, and seaport authorities remains a complex practical hurdle. Thirdly, the balance between cost and environmental benefit is a persistent issue (Ekins and Zenghelis, 2021). The high initial investment required for low-carbon technologies and optimized operational models often conflicts with the pursuit of short-term economic gains, making it challenging to justify their adoption. Finally, many existing analytical models are built upon idealized assumptions, such as static demand and the absence of unforeseen disruptions (Zhuge et al., 2023). This limitation restricts their applicability in real-world scenarios characterized by dynamism and uncertainty.
Lam et al., noted in their synthesis of the literature that, in contrast to other nations or regions, the scholarly exploration of dry port-associated transportation modes within China is comparatively sparse (Lam and Gu, 2013). Similar studies can also be found in (Dalivand and Torabi, 2024; Irawan et al., 2024; Chen et al., 2025). Particularly, the modal choice preferences of shippers located in the industrial clusters of China’s inland cities have not been adequately scrutinized by academics. This investigation concentrates on the selection of transportation modes within the paradigm of green logistics, conducting a targeted examination of the implications of adopting a shared transport model, incorporating milk-run transport, within the dry port-seaport transportation network for the manufacturing sector. The primary objective is to assess its influence on carbon emission levels.
3 Problem description and modeling
To streamline the analysis, we posit that a dry port A is accessible to a seaport B via both road and rail infrastructure, with a designated distance of separating the dry port from the seaport. This dry port is capable of fulfilling the logistics demands of nearby shippers, presupposing the existence of Ishippers within this specified radius. The distance from shipper i to the dry port A is denoted as di,A, and the distance from shipper i to the seaport is di,B. Furthermore, there exists a distance lij between shipperiand shipper j. This study aims to assess the carbon emission reduction potential of shared transport through dry port-seaport network (scenario S1) by comparing it against two alternative scenarios: multimodal transport with non-sharing transport through dry port-seaport network (scenario S2) and direct road transport (scenario S3).
The model is grounded in a set of assumptions, which are adapted from the frameworks proposed by Kovač et al (Kovač et al., 2023),, and aligned with the Guidelines for Measuring and Managing CO2 Emission from Freight Transport Operations published by the ECTA (European Chemical Transport Association and European Chemical Industry Council, 2011). The following two prerequisites are adopted: (1) the shipper sustains a consistent production rate within the specified time period, remaining invariant throughout; (2) cargo can be efficiently transported to dry ports and storage temporarily via trucking. Given the economies of scale, the storage costs at these dry ports are notably lower than the expenses incurred by consignors utilizing their own warehouse facilities; (3) Rail transport is the modal choice for the movement of goods from dry port to seaport, whereas road transport is utilized for the delivery of shipments from shippers to dry port and seaport; (4) The milk-run route is established in advance, with the sequence of visiting shippers is determined by the pickup orders. The notations to be used are listed as shown in Table 1.
Table 1
| Parameters | Definitions |
| DA,B | The distance between dry port and seaport |
| di,A | The distance between shipper i and dry portA |
| di,B | The distance between shipper i and dry portB |
| lij | The distance between shipper i and shipper j |
| T | milk-run cycle time |
| qi | The quantity of cargoes of shipper i per time |
| Qi | The total quantity of shipment during the cycle time of shipper i |
| Wk | The average distance traveled when the vehicle is loaded druing the kth pick up |
| Mk | The quantity of trucks during the kth pick up |
| Dk | The total distance of kth pick up |
| f | The average congestion factor |
| λ | The average kilometers of one litre gas |
| u 1 | The emissions factor of truck |
| u 2 | The Shipping emissions factor of truck |
| u 3 | The emission factor of train |
| E | The carbon emission |
Variables used in the model.
3.1 Scenario 1: shared transport through dry port-seaport network
In this scenario, the dry port adopts an optimized milk-run transportation system for the expedient conveyance of cargo from shippers to the dry port by truck, followed by rail transport to the seaports. Notably, the primary sources of carbon emissions in this process are attributed to the milk-run and the rail transportation.
Stage 1: Calculating the amount of carbon emission of milk-run transportation.
We adopt the expression from previous studies and carbon emission from trucks during the kth pick up can be denoted as Equation 1 (Ferrer and Thome, 2023; Temizceri and Kara, 2024):
Where u1 denotes the emissions factor of truck, Mk is the quantity of trucks during the kth pick up. λ denotes the average kilometers of one litre gas. The symbol u2 is the Shipping emissions factor. Wk is the average distance traveled when the vehicle is loaded. f is the average congestion factor for a particular line-haul lane, and . The value of f can be dynamic and estimated using advanced traffic flow prediction models that leverage sensing data and denoising schemes, moving beyond static assumptions (Chen et al., 2020).
Adhere to a pre-arranged pickup schedule in accordance with the shipper’s specified shipping frequency requirements, the total distance of kth pick up Dk can be expressed as follows:
Where is the distance between the dry port and the first shipper, and dom is the distance between the dry port and the last shipper.
Assume the quantity of cargoes of shipperiper time is qi, and the cycle time per milk-run is T0, then the total quantity of shipment during the cycle time is , while the total quantity of kth shipment is , whereas , and T is the milk-run period.
During the kth pick up, the trip distance of truck is given by the following shown in Equation 3:
where dom is the distance between the dry port and the last shipper.
The total carbon emission in the cycle time is given by the Equation 4:
Stage 2: Calculating the amount of carbon emission of trains.
During the entire cycle, the carbon emission of trains transporting cargoes from dry port to seaport are estimated as follows:
This formula calculates the total emissions by multiplying the rail transport emission factor u3 by the total ton-kilometers traveled, which is the product of the total mass of cargo transported from all shippers and the distance DA,B between the dry port and seaport. This linear model is a widely adopted and practical approach for estimating emissions in intermodal freight studies, owing to its clarity and the relative availability of required data.
This methodological approach is grounded in the standardized frameworks for emissions accounting, notably as established by The Greenhouse Gas Protocol developed by the World Resources Institute and the World Business Council for Sustainable Development, which provides the foundational principles for calculating Scope 3 emissions from transportation (Accounting, A.C, 2004). Furthermore, its application in the context of intermodal freight and logistics is supported by contemporary academic research (Ferrer and Thome, 2023; Temizceri and Kara, 2024).
Stage 3: Computing the total emission of scenario 1.
The cargoes are consolidated from the shippers to the dry port and transported to seaport through train transportation, and the total emission can be expressed as Equation 6:
3.2 Scenario 2: non-sharing transport through dry port-seaport network
Under this assumption, shippers convey cargoes directly to the dry port by truck, followed by its immediate rail transfer to the seaport.
Stage 1: calculating the amount of carbon emission of trucks
The single travel distance of truck is . During the cycle time T, the carbon emission of shipperi in the kth transportation can be expressed as Equation 7:
Where Mi,k is the number of trucks during the kth transportation of shipperi. Note that the symbol is larger than .
For simplicity, we let , and without loss of generality, , .
In the cycle time T, the total carbon emission of trucks transported the cargoes to the dry port .
Stage 2: calculating the amount of carbon emission of trains
As mentioned in the previous section, the carbon emissions of trains transporting cargoes from dry port to seaport are , Where is the emission factor of train.
Stage 3: computing the total emission of scenario 2
The total carbon emissions of trucks and trains transported the cargoes from shipper to seaport are:
3.3 Scenario 3: direct road transport from shippers to seaports
Assuming the shippers directly transport the cargoes to seaport via trucks, the carbon emission of trucks could be estimated as follows:
Where Mi is the quantity of trucks transported the cargoes of shipper i.
4 Discussion
4.1 Comparison of carbon emissions between S1 and S2
Compare the carbon emission difference between model S1 and model S2, the difference is labeled as Equation 10, which can be further identified with Equation 11.
for simplicity, it could be obtained in Equation 12:
Proposition 1: if , then the carbon emissions of S1 is lower than S2.
Proof. Since n≥1n≥1, following the Equation 2, we have , meanwhile, it follows from the assumption mentioned before that , and hence we have . Thus, we can obtain is larger than zero. More specifically, the results indicate that the carbon emissions of S1 is lower than S2, and the proposition is proved. Moreover, the proposition 1 suggests that if individual shippers, self-transporting their goods, traverse a greater distance than that of the milk-run system, the milk-run approach confers a strategic benefit.
4.2 Comparison of carbon emissions between S2 and S3
Compare the carbon emission difference between model S2 and model S3, the difference is , it follows the Equations 8, 9, which we can obtain the Equation 13 as follows:
Let , where , note that , , .
Proposition 2 if , the carbon emissions of S2 is lower than S3.
Proof. Following the Equation 1, we have obtain the Equation 14:
If is larger than , and then we obtain the following Equation 15
Hence , which implies that the carbon emissions of S2 is lower than S3, and the proposition is proved.
Conventional wisdom holds that multimodal transport offers environmental benefits over direct road transport, and Proposition 2 validates this assumption by asserting that only when the transport distance surpasses a specific threshold do these advantages manifest; below this level, direct road transport may in fact be more conducive to emission reduction.
5 Numerical example and sensitivity analyses
The New Western Land-Sea Corridor, situated in the western Chinese interior, links the Silk Road Economic Belt to the south’s Maritime Silk Road. Spanning from Chongqing through Guiyang to Nanning and onwards to the Beibu Gulf, including Beibu Gulf Port and Yangpu Port, this corridor designates Chongqing as a pivotal hub. Notably, Chongqing is a significant manufacturing center for automotive components, electronics, and more, boasting over 40 industrial parks. The New Western Land-Sea Corridor was selected as the empirical context for this study because it is a nationally strategic logistics channel in China designed to connect inland regions to international maritime routes via the Beibu Gulf ports.
Chongqing’s status as a major manufacturing hub, a key factor influencing port cargo throughput, represents a typical case of inland industrial clusters that generate substantial export freight flows, making it highly relevant for our analysis (Guo et al., 2025). Beibu Gulf Port and Yangpu Port are the primary maritime gateways for this corridor, making them highly relevant and representative for our analysis, as they not only serve as the main outlets for western inland provinces but also have been strategically promoted under China’s Belt and Road Initiative to enhance regional connectivity and international trade. Both ports are recognized for their rapidly expanding rail-sea intermodal services and their role in facilitating containerized exports from Chongqing and surrounding industrial clusters. This strategic positioning underscores their representativeness as case study ports for evaluating low-carbon logistics models within the dry port–seaport network.
5.1 Numerical example
This study visually contrasts carbon emissions across various transport modes by hypothesizing five export firms within an industrial park in Chongqing. The distance di,A from the park to the dry port is 120Km, while the distance DA,B from Chongqing to Qinzhou Port is 1300 Km; other parameters are sourced from reference.
The values of key parameters (e.g., emission factors u, congestion factor f, fuel efficiency ) are primarily sourced from Kovač et al (Kovač et al., 2023). to ensure comparability with existing literature. These values are derived from official Chinese transportation statistics and calculation guidance from World Resources Institute (Accounting, A.C, 2004). The distances are obtained based on real-world logistics maps and industry reports pertaining to the studied corridor. The parameters used in the numerical model are shown in Table 2.
Table 2
| Parameters | Value | Unit |
|---|---|---|
| DA,B | 1300 | Km |
| di,A | 120 | Km |
| di,B | 120 | Km |
| li,j | 7 | Km |
| Qi | 19600 | Kg |
| Mk | 1 | |
| f | 0.1231 | |
| λ | 16 | Km/L |
| u 1 | 2640 | g/L |
| u 2 | 0.0951 | g/Kg-km |
| u 3 | 0.0084 | g/Kg-km |
| T | 7 | Day |
| T 0 | 3.5 | day |
Parameters used in the numerical model.
Inserting the aforementioned parameters into Equations 5, 8, 9, 11 reveals the carbon emission values for various scenarios in Table 3, which correspond to the varying distances between the shippers and the dry port. According to the variation in distance between seaports and dry ports, the carbon emission values under different modes are shown in Table 4.
Table 3
| Distance(km) | Carbon emission values under S1 (10kg) | Carbon emission values under S2 (10kg) | Carbon emission values under S3(10kg) | Difference in carbon emissions between S2 and S1 (10kg) |
|---|---|---|---|---|
| 30 | 64.13 | 65.51 | 541.5 | 1.38 |
| 40 | 68.71 | 73.06 | 541.5 | 4.35 |
| 50 | 73.29 | 80.61 | 541.5 | 7.32 |
| 60 | 77.87 | 88.16 | 541.5 | 10.29 |
| 70 | 82.45 | 95.71 | 541.5 | 13.26 |
| 80 | 87.03 | 103.26 | 541.5 | 16.23 |
| 90 | 91.61 | 110.81 | 541.5 | 19.20 |
| 100 | 96.19 | 118.36 | 541.5 | 22.17 |
| 110 | 100.77 | 125.91 | 541.5 | 25.14 |
| 120 | 105.35 | 133.46 | 541.5 | 28.11 |
Carbon emission comparison under different scenarios while distances between shippers and dry port vary.
Table 4
| Distance(km) | Carbon emission values under S1 | Carbon emission values under S2(10kg) | Carbon emission values under S3(10kg) | Rate of reduction in carbon emissions between S1 and S2 | Rate of reduction in carbon emissions between S2 and S3 |
|---|---|---|---|---|---|
| 200 | 69.08 | 97.19 | 101.50 | 40.69% | 4.43% |
| 300 | 72.38 | 100.49 | 152.25 | 38.84% | 51.51% |
| 500 | 78.97 | 107.08 | 253.75 | 35.59% | 136.97% |
| 700 | 85.57 | 113.68 | 355.25 | 32.85% | 212.51% |
| 900 | 92.16 | 120.27 | 456.75 | 30.50% | 279.77% |
| 1200 | 102.05 | 130.16 | 507.50 | 27.55% | 289.90% |
| 1300 | 105.35 | 133.46 | 541.51 | 26.68% | 305.75% |
Carbon emission comparison under different scenarios while distances between seaport and dry port vary.
The calculated carbon emission results for the three scenarios under varying distances are summarized in Tables 3, 4. Table 3 presents the carbon emissions while the distance between the shippers and the dry port di,A varies from 30 km to 120 km, holding the seaport-dry port distance DA,B constant at 1300 km. It demonstrates a clear positive correlation between this di,A distance and the absolute carbon emissions for both the milk-run shared transport (S1) and the non-sharing multimodal transport (S2) scenarios. Crucially, the final column of Table 3 shows the difference in emissions between S2 and S1, which grows substantially as di,A increases, from 1.38×10 kg at 30 km to 28.11×10 kg at 120 km. This increasing gap visually validates Proposition 1, indicating that the milk-run strategy’s advantage over individual shipper transport to the dry port becomes more pronounced over longer collection distances.
Conversely, Table 4 presents the results while the distance between the seaport and the dry port DA,B varies from 200 km to 1300 km, holding the shipper-dry port distance di,A constant at 120 km. It highlights the dramatic escalation of emissions for the direct road transport scenario (S3) as this long-haul distance increases, far outpacing the more gradual increase seen in the multimodal scenarios (S1 and S2) which utilize rail for this leg. The table also includes the percentage reduction rates, showing S1’s significant advantage over S2 (ranging from 26.68% to 40.69% reduction) and S2’s immense advantage over S3 (from 4.43% to over 305% reduction) for the longer distances, empirically supporting Proposition 2 regarding the benefits of rail-based intermodal transport for long hauls.
5.2 sensitivity analyses
Both of the Table 3 and Figure 1 illustrate that there is a positive correlation between the distance from the shipper to the dry port and the relative reduction in carbon emissions for scenario S1 over S2. At a 30 km distance, the emission differential between S1 and S2 is a mere 2.15%, whereas at 120 km, this gap increases to 26.68%. Consequently, for distances under 20 km, direct shipment to the dry port by the shipper is the more beneficial option. Figure 2 depicts the fluctuation in carbon emission reduction for S1 compared to S2 as the distance between each shipper and the dry port expands. For shippers, carbon emission reduction translates directly into cost savings. With a carbon price of 48 RMB per ton (in line with the starting price in China’s carbon market on July 16, 2021), the cost efficiencies across transportation modes, when the distance between dry ports and seaports is constant, are detailed in Table 5. This table reflects how cost savings fluctuate with the changing distance between shippers and dry ports. These savings have tangible implications for encouraging shippers to adopt greener transportation practices.
Figure 1
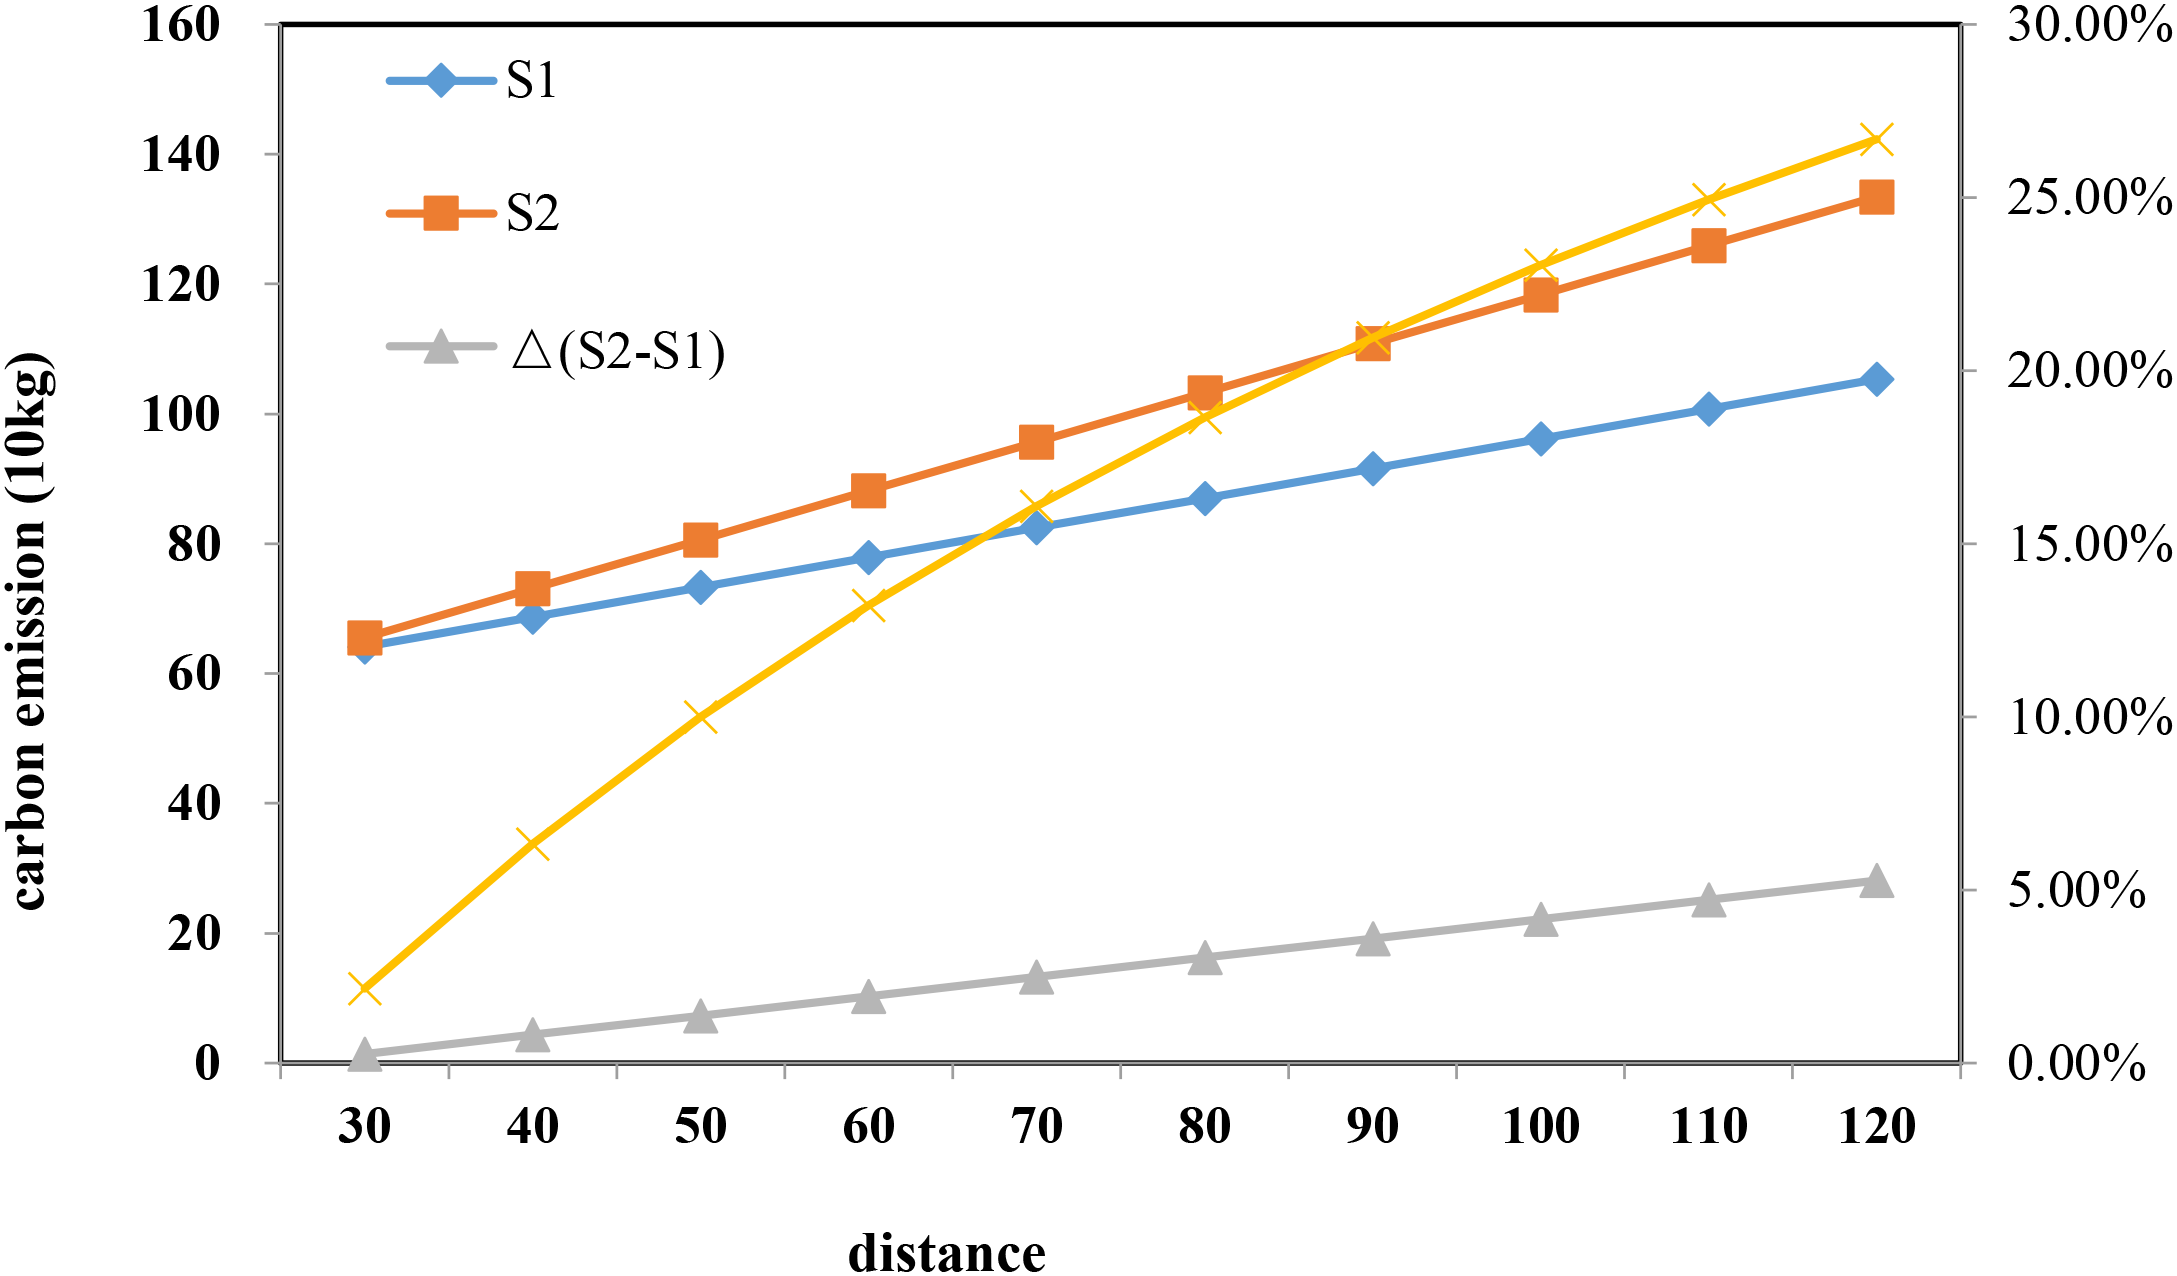
Simulating the carbon emission under model S1 and S2.
Figure 2
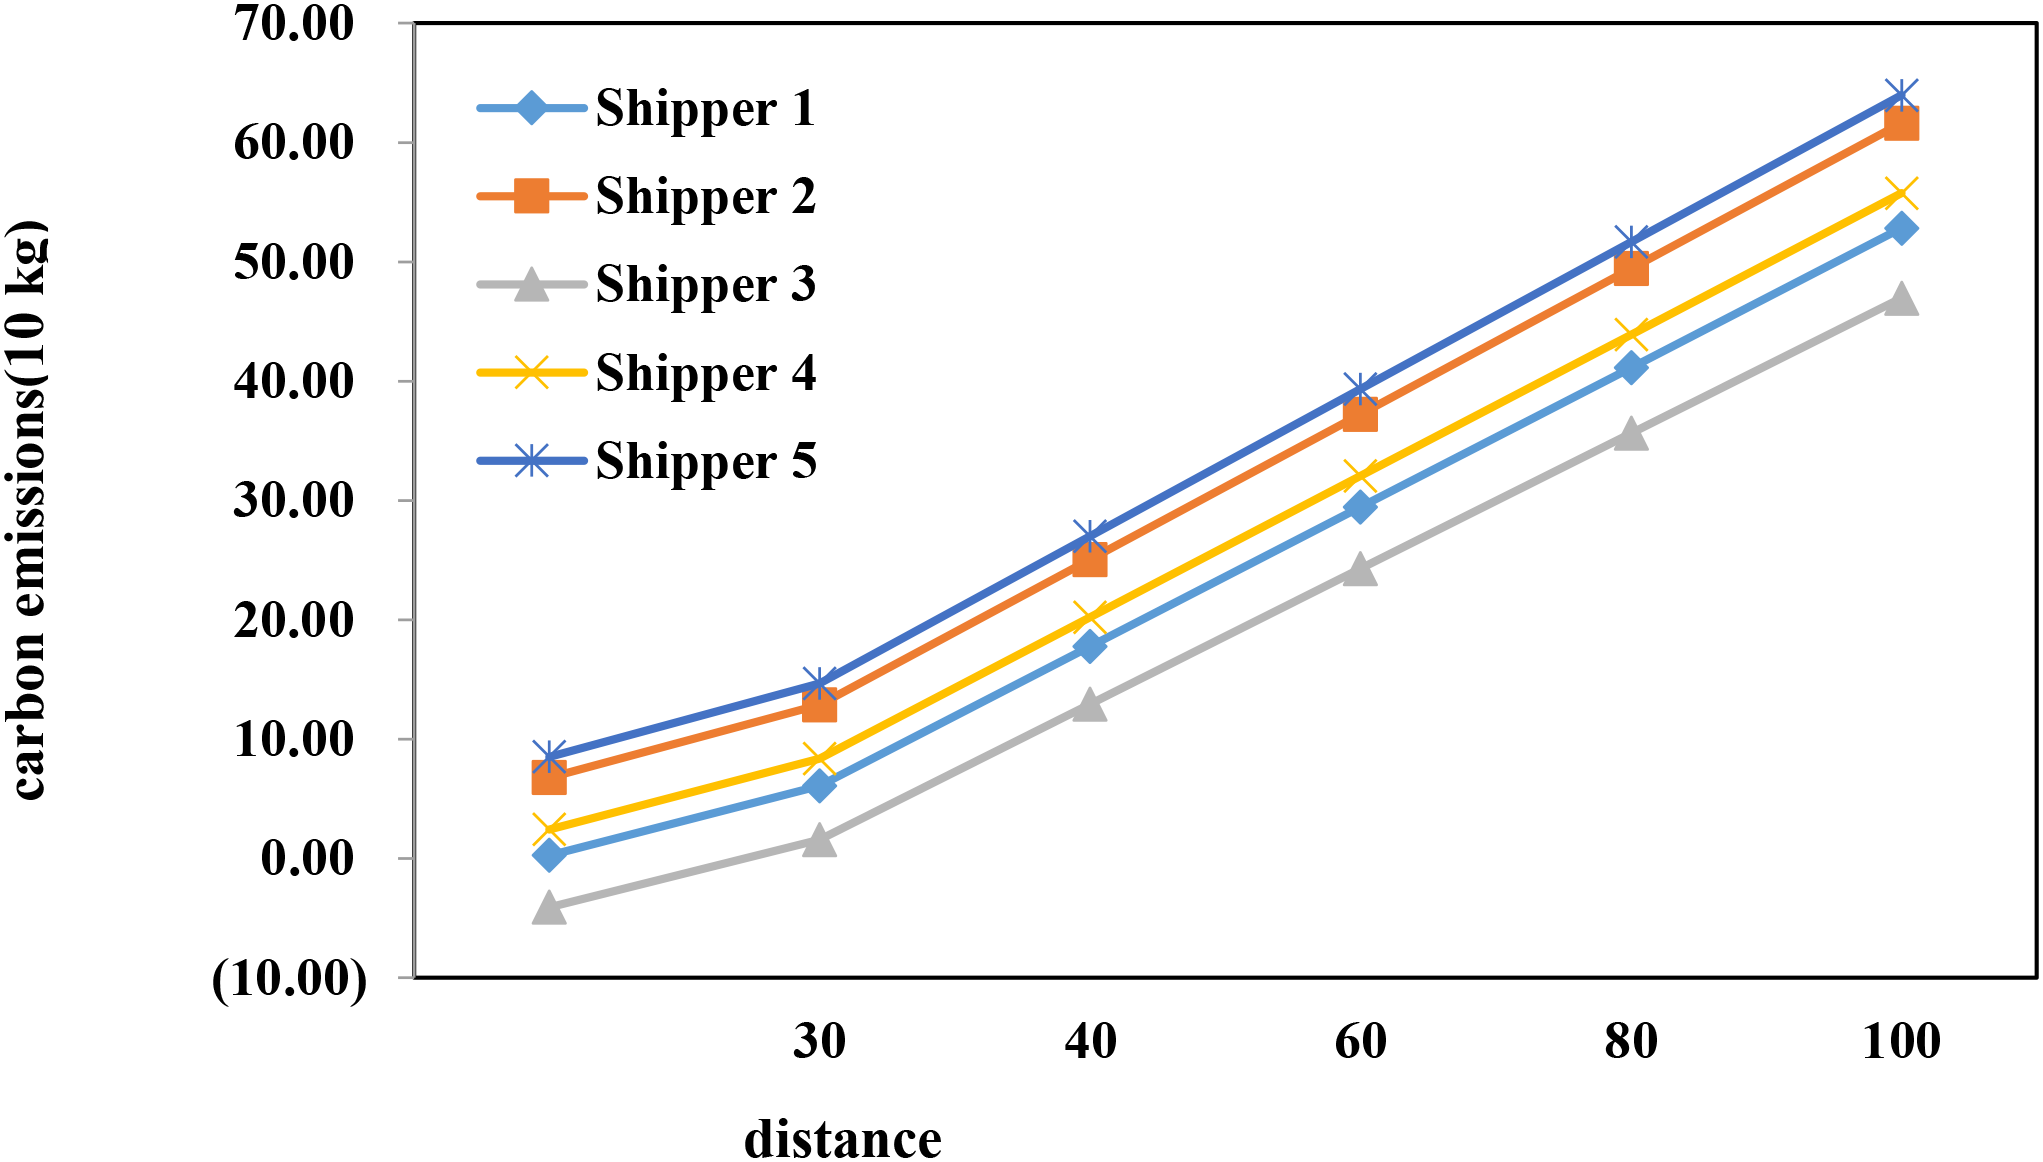
Simulating the carbon emission of the shippers.
Table 5
| Distance(km) | The amount of carbon cost saved by S1 compared to S2(Yuan per cycle) | The amount of carbon cost saved by S2 compared to S3(Yuan per cycle) | The amount of carbon cost saved by S1 compared to S3(Yuan per cycle) |
|---|---|---|---|
| 30 | 0.66 | 228.48 | 229.14 |
| 40 | 2.09 | 224.85 | 226.94 |
| 50 | 3.51 | 221.23 | 224.74 |
| 60 | 4.94 | 217.60 | 222.54 |
| 70 | 6.36 | 213.98 | 220.34 |
| 80 | 7.79 | 210.36 | 218.15 |
| 90 | 9.22 | 206.73 | 215.95 |
| 100 | 10.64 | 203.11 | 213.75 |
| 110 | 12.07 | 199.48 | 211.55 |
| 120 | 13.49 | 195.86 | 209.35 |
Compare of the carbon emission cost saving under different scenarios while distances between shippers and dry port varies.
Carbon cost savings are calculated based on the carbon emission difference between scenarios multiplied by a carbon price of 48 RMB/ton CO2e (aligning with the starting price in China’s national carbon market in July 2021). The ‘cycle’ refers to the defined milk-run cycle time (T = 7 days) as stated in Section 3.
Figure 3 reveals that as the distance between dry ports and seaports lengthens, carbon emissions for S3 surge, whereas those for S2 rise incrementally. The disparity between these scenarios increases with distance. The figure’s data indicate that direct road transport from Chongqing to Qinzhou Port emits nearly three times more carbon than the dry port-to-rail alternative. However, when the dry port to seaport distance is 200 km or less, the difference between S2 and S3 is minimal. This finding indirectly validates the rationale for selecting different transport modes based on distance, affirming Proposition 2. National Bureau of Statistics data for 2022 show that China’s average road freight and railway freight distances were 186 km and 721 km, respectively. Consequently, efforts to promote green transportation should target mode shifts for distances beyond 180 km within this market segment. Table 6 illustrates that, at a carbon price of 48 RMB per tonne, the milk-run shared transport mode (S1) confers substantial cost-saving benefits over the other methods, especially when contrasted with direct road transport (S3). Additionally, the table’s data suggests that direct transport through multimodal transport (S2) is cost-effective, with pronounced carbon cost savings for medium to long-distance shipments.
Figure 3
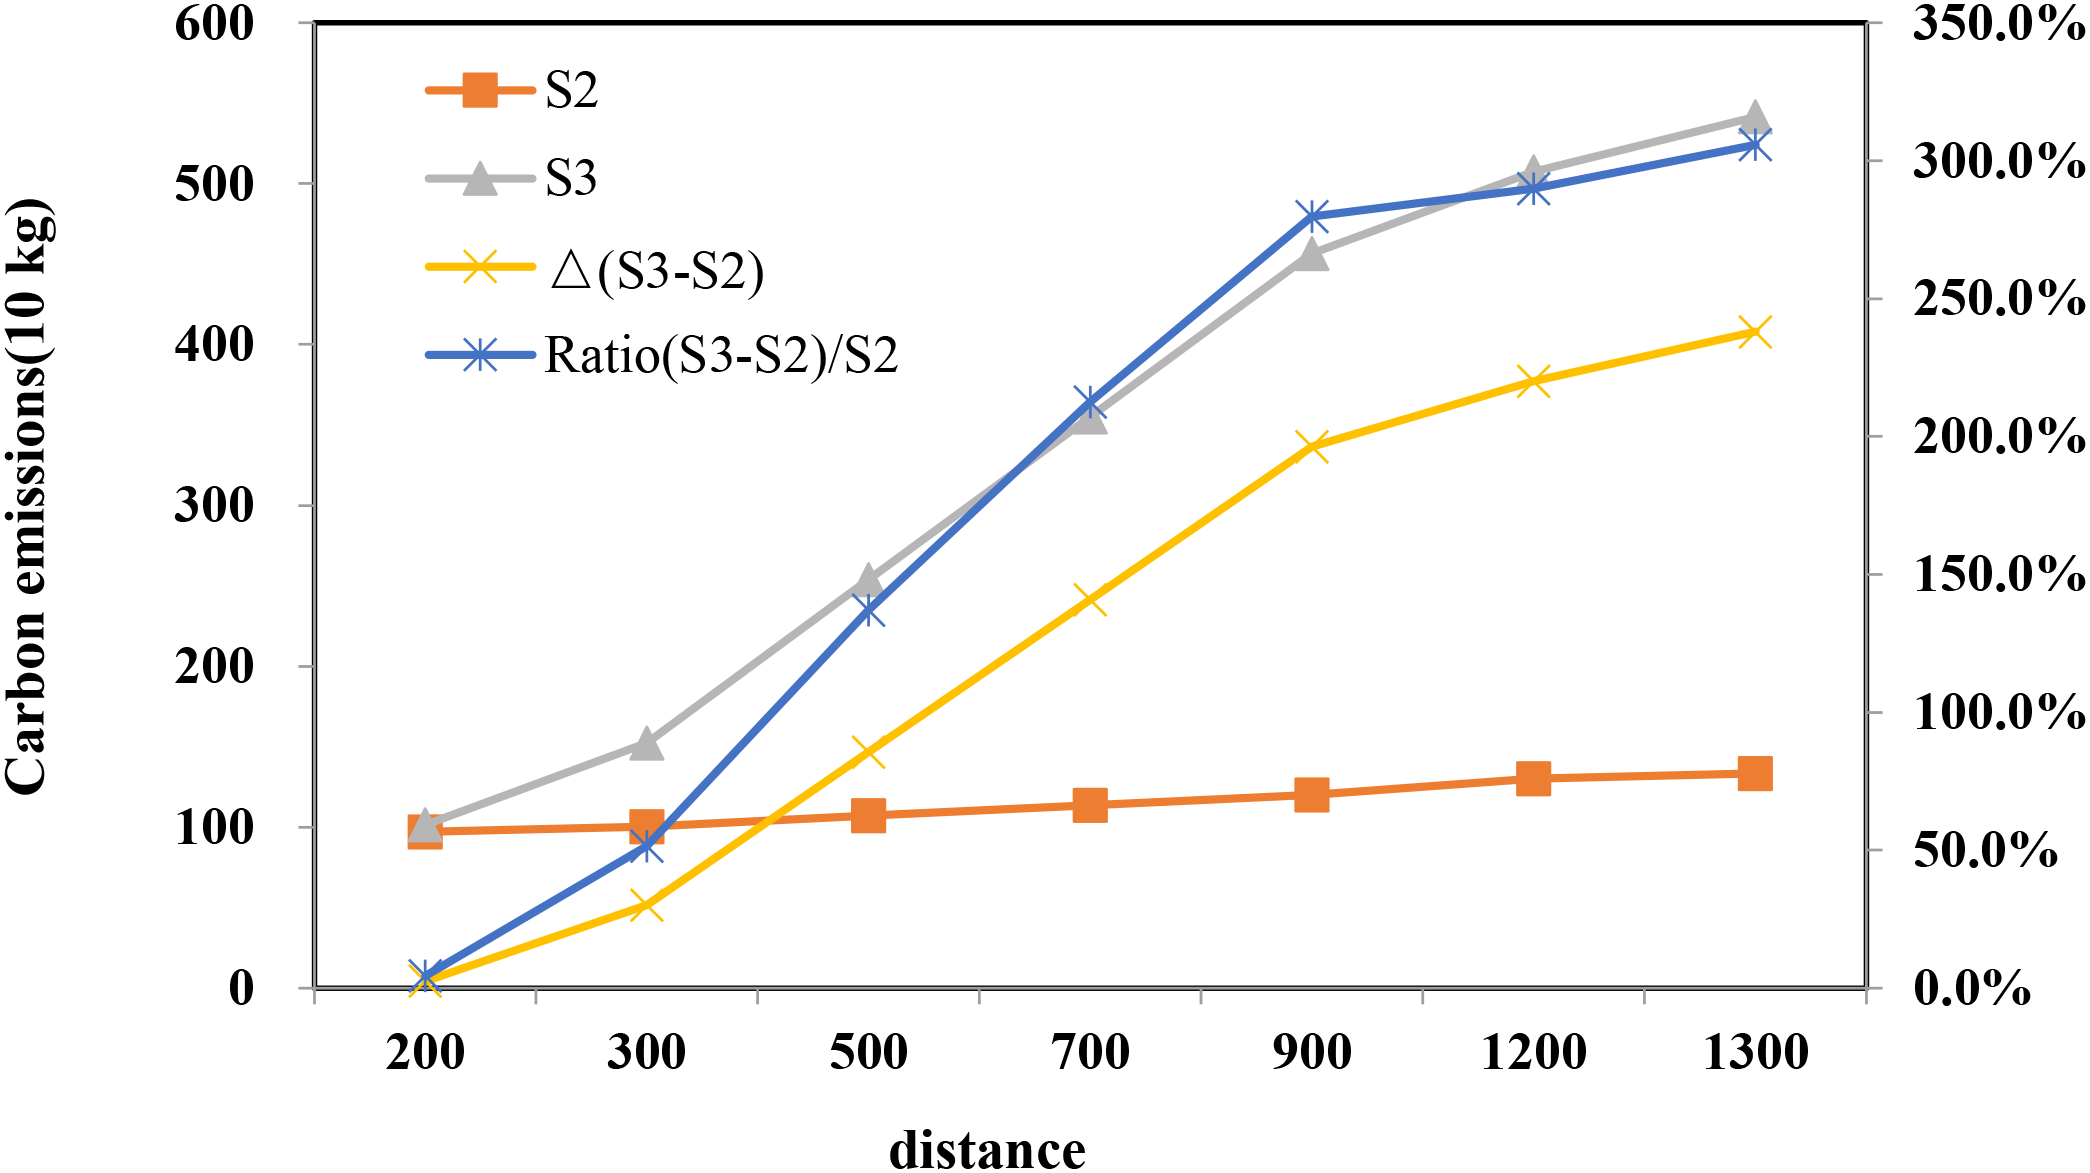
Simulating the carbon emission under model S2 and S3.
Table 6
| Distance(km) | The amount of carbon cost saved by S1 compared to S2(Yuan per cycle) | The amount of carbon cost saved by S2 compared to S3 (Yuan per cycle) | The amount of carbon cost saved by S1 compared to S3 (Yuan per cycle) |
|---|---|---|---|
| 200 | 33.16 | 2.07 | 15.56 |
| 300 | 34.74 | 24.84 | 38.34 |
| 500 | 37.91 | 70.40 | 83.89 |
| 700 | 41.07 | 115.95 | 129.45 |
| 900 | 44.24 | 161.51 | 175.00 |
| 1200 | 48.98 | 181.12 | 194.62 |
| 1300 | 50.57 | 195.86 | 209.36 |
Comparison of the carbon emission cost saving under different scenarios while distances between seaport and dry port vary.
6 Conclusion
This article investigates the efficacy of a milk-run shared transport model in curbing carbon emissions within industrial clusters served by dry ports and seaports. By analyzing the carbon emission disparities among milk-run shared transport (S1), direct multimodal transport (S2), and direct road transport (S3), the study verifies significant variations in emissions with changing distances. We found that S1 exhibits the superior emission reduction, with a marked decrease in carbon output as distance increases whilst the shipments exceeding the collection radius. In addition, the S2 yields substantial carbon savings over S3 beyond a certain threshold and there exists a direct correlation between emission reductions and distance.
Dry ports, acting as inland extensions of seaports, streamline customs processes and alleviate port congestion, enhancing transport efficiency and lowering emissions. This research spotlights dry ports and charts a course for low-emission emissions in transportation through the promotion of shared transport modes, propelling green transportation and aiding in the realization of ‘dual carbon’ objectives. Advancing shared transport necessitates a multi-faceted approach, including policy instruments like carbon taxes to incentivize eco-friendly shipping choices and data sharing to refine freight information services and optimize transport efficiency. The study omits a cost comparison of various transport organization methods and the impact of different cargo types. Future research could delve into these dimensions. Furthermore, integrating advanced data collection technologies, such as computer vision for distance measurement and IoT sensors, could help overcome the data acquisition bottlenecks identified and allow for more dynamic and real-time model calibration.
Looking ahead, future research could also investigate cross-border dry port-seaport collaborations, where differences in regulatory regimes and infrastructure standards create both opportunities and barriers for shared transport models. Comparative studies across countries with varying levels of logistics development would provide a broader understanding of the global applicability of the milk-run approach. Furthermore, incorporating behavioral insights into shipper decision-making could enrich existing models, bridging the gap between technical optimization and human factors in sustainable transport systems.
Statements
Data availability statement
The original contributions presented in the study are included in the article/Supplementary Material. Further inquiries can be directed to the corresponding author.
Author contributions
XiW: Investigation, Writing – original draft, Writing – review & editing. XuW: Methodology, Supervision, Writing – review & editing.
Funding
The author(s) declare that no financial support was received for the research and/or publication of this article.
Conflict of interest
The authors declare that the research was conducted in the absence of any commercial or financial relationships that could be construed as a potential conflict of interest.
Generative AI statement
The author(s) declare that no Generative AI was used in the creation of this manuscript.
Any alternative text (alt text) provided alongside figures in this article has been generated by Frontiers with the support of artificial intelligence and reasonable efforts have been made to ensure accuracy, including review by the authors wherever possible. If you identify any issues, please contact us.
Publisher’s note
All claims expressed in this article are solely those of the authors and do not necessarily represent those of their affiliated organizations, or those of the publisher, the editors and the reviewers. Any product that may be evaluated in this article, or claim that may be made by its manufacturer, is not guaranteed or endorsed by the publisher.
References
1
Accounting, A.C (2004). The greenhouse gas protocol (Washington, DC, USA: World Resources Institute and World Business Council for Sustainable Development).
2
Brar G. S. Saini G. (2011). “ Milk run logistics: literature review and directions,” in Proceedings of the world congress on engineering ( WCE).
3
Carboni A. Orsini F. (2020). Dry ports and related environmental benefits: a case study in Italy. Case Stud. Transport Policy8, 416–428. doi: 10.1016/j.cstp.2020.05.009
4
Chen X. Wu S. Shi C. Huang Y. Yang Y. Ke R. (2020). Sensing data supported traffic flow prediction via denoising schemes and ANN: A comparison. IEEE Sensors J.20, 14317–14328. doi: 10.1109/JSEN.2020.3007809
5
Chen X. Wu H. Han B. Liu W. Montewka J. Liu R. (2023). Orientation-aware ship detection via a rotation feature decoupling supported deep learning approach. Eng. Appl. Artif. Intell.125, 106686. doi: 10.1016/j.engappai.2023.106686
6
Chen X. Lv S. Shang W. Wu H. Xian J. et al . (2024). Ship energy consumption analysis and carbon emission exploitation via spatial-temporal maritime data. Appl. Energy360, 122886. doi: 10.1016/j.apenergy.2024.122886
7
Chen X. Ma F. Wu Y. Han B. Luo L. Biancardo S. (2025). MFMDepth: MetaFormer-based monocular metric depth estimation for distance measurement in ports. Comput. Ind. Eng.207, 11325. doi: 10.1016/j.cie.2025.111325
8
Dai Q. Yang J. Li D. (2018). Modeling a three-mode hybrid port-hinterland freight intermodal distribution network with environmental consideration: The case of the Yangtze river economic belt in China. Sustainability10, 3081. doi: 10.3390/su10093081
9
Dalivand A. A. Torabi S. A. (2024). Sustainable-resilient seaport-dry port network design considering inter-modal transportation. J. Cleaner Production452, 141944. doi: 10.1016/j.jclepro.2024.141944
10
Ekins P. Zenghelis D. (2021). The costs and benefits of environmental sustainability. Sustainability Sci.16, 949–965. doi: 10.1007/s11625-021-00910-5
11
European Chemical Transport Association and European Chemical Industry Council (2011). Guidelines for measuring and managing CO2 emission from freight transport operations. Brussels, Belgium, European Chemical Transport Association (ECTA) and the European Chemical Industry Council (Cefic).
12
Ferrer A. L. C. Thome A. M. T. (2023). Carbon emissions in transportation: A synthesis framework. Sustainability15, 8475. doi: 10.3390/su15118475
13
Guo R. Xiao G. Zhang C. Li Q. (2025). A study on influencing factors of port cargo throughput based on multi-scale geographically weighted regression. Front. Mar. Sci.12, 1637660. doi: 10.3389/fmars.2025.1637660
14
Irawan C. A. Salhi S. Jones D. Dai J. Liu M. (2024). A dry port hub-and-spoke network design: An optimization model, solution method, and application. Comput. Operations Res.167, 106646. doi: 10.1016/j.cor.2024.106646
15
Jeshvaghani M. D. Amiri M. Damghani K. Olfat L. (2023). A robust possibilistic multi-echelon multi-product multi-period production-inventory-routing problem considering internal operations of cross-docks: Case study of FMCG supply chain. Comput. Ind. Eng.179, 109206. doi: 10.1016/j.cie.2023.109206
16
Jiang G. Fan Q. Zhang Y. Xiao Y. Xie J. Zhou S. (2025). A tradable carbon credit incentive scheme based on the public-private-partnership. Transportation Res. Part E: Logistics Transportation Rev.197, 104039. doi: 10.1016/j.tre.2025.104039
17
Khaslavskaya A. Monios J. Roso V. (2024). Using coopetition to increase asset utilization and market coverage of dry ports. Res. Transportation Business Manage.57, 101219. doi: 10.1016/j.rtbm.2024.101219
18
Klenk E. Galka S. (2019). Analysis of real-time tour building and scheduling strategies for in-plant milk-run systems with volatile transportation demand. IFAC-PapersOnLine52, 2110–2115. doi: 10.1016/j.ifacol.2019.11.517
19
Kovač M. Tadić S. Krstić M. Roso V. (2023). Modelling dry port systems in the framework of inland waterway container terminals. Comput. Model. Eng. Sci.137, 1019–1046. doi: 10.32604/cmes.2023.027909
20
Kühlwein J. Friedrich R. (2000). Uncertainties of modelling emissions from road transport. Atmospheric Environ.34, 4603–4610. doi: 10.1016/S1352-2310(00)00302-2
21
Lam J. S. L. Gu Y. (2013). Port hinterland intermodal container flow optimisation with green concerns: a literature review and research agenda. Int. J. Shipping Transport Logistics5, 257–281. doi: 10.1504/IJSTL.2013.054190
22
Lattila L. Henttu V. Hilmola O.-P. (2013). Hinterland operations of sea ports do matter: Dry port usage effects on transportation costs and CO2 emissions. Transportation Res. Part E Logistics Transportation Rev.55, 23–42. doi: 10.1016/j.tre.2013.03.007
23
Li W. Hilmola O.-P. Panova Y. (2019). Container sea ports and dry ports: Future CO2 emission reduction potential in China. Sustainability11, 1515. doi: 10.3390/su11061515
24
Mathers J. Craft E. Norsworthy M. Wolfe C. (2014). The green freight handbook. Environ. Defense Fund86.
25
Qiu X. Huang G. Q. (2016). Transportation service sharing and replenishment/delivery scheduling in Supply Hub in Industrial Park (SHIP). Int. J. Production Econ175, 109–120. doi: 10.1016/j.ijpe.2016.02.002
26
Qiu X. Lam J. S. L. Huang G. Q. (2015). A bilevel storage pricing model for outbound containers in a dry port system. Transportation Res. Part E: Logistics Transportation Rev.73, 65–83. doi: 10.1016/j.tre.2014.10.009
27
Qiu X. Xu G. (2019). Optimizing rail transport service in a dry port system. IEEE Trans. Eng. Manage.69, 2670–2683. doi: 10.1109/TEM.2019.2951915
28
Rekabi S. Sazvar Z. Tavakkoli-Moghaddam R. Dolgui A. (2025). Developing a green multi-modal dry port-seaport logistics network enhanced by the internet of things and machine learning. Comput. Ind. Eng.207, 111270. doi: 10.1016/j.cie.2025.111270
29
Rekabi S. Sazvar Z. (2025). A smart and agile dry port-seaport logistic network considering industry 5.0: A multi-stage data-driven approach. Socio-Economic Plann. Sci.98, 102141. doi: 10.1016/j.seps.2024.102141
30
Rosenberg L. N. Balouka N. Herer Y. Dani E. Gasparin P. Dobers K. et al . (2021). Introducing the shared micro-depot network for last-mile logistics. Sustainability13, 2067. doi: 10.3390/su13042067
31
Solaymani S. Botero J. (2025). Reducing carbon emissions from transport sector: experience and policy design considerations. Sustainability17, 3762. doi: 10.3390/su17093762
32
Temizceri F. T. Kara S. S. (2024). Towards sustainable logistics in Turkey: A bi-objective approach to green intermodal freight transportation enhanced by machine learning. Res. Transportation Business Manage.55, 101145. doi: 10.1016/j.rtbm.2024.101145
33
Ülkü M. A. (2012). Dare to care: Shipment consolidation reduces not only costs, but also environmental damage. Int. J. Production Econ139, 438–446. doi: 10.1016/j.ijpe.2011.09.015
34
Wang T. Xiao G. Li Q. Biancardo S. (2025). The impact of the 21st-Century Maritime Silk Road on sulfur dioxide emissions in Chinese ports: based on the difference-in-difference model. Front. Mar. Sci.12, 1608803. doi: 10.3389/fmars.2025.1608803
35
Xiao G. Amamoo-Otoo C. Wang T. Li Q. Biancardo S. (2025). Evaluating the impact of ECA policy on sulfur emissions from the five busiest ports in America based on difference in difference model. Front. Mar. Sci.12, 1609261. doi: 10.3389/fmars.2025.1609261
36
Xie J. Sun Y. Huo X. (2021). Dry port-seaport logistics network construction under the belt and road initiative: a case of Shandong Province in China. J. Syst. Sci. Syst. Eng.30, 178–197. doi: 10.1007/s11518-021-5484-6
37
Zhou S. Liu X. Chen J. Zhao M. Wang F. Wu L. (2025a). Large containership stowage planning for maritime logistics: A novel meta-heuristic algorithm to reduce the number of shifts. Advanced Eng. Inf.64, 102962. doi: 10.1016/j.aei.2024.102962
38
Zhou S. Guo Z. Chen J. Jiang G. (2025b). Joint optimization of slot and empty container co-allocation for liner alliances with uncertain demand in maritime logistics industry. Transportation Res. Part E: Logistics Transportation Rev.204, 104437. doi: 10.1016/j.tre.2025.104437
39
Zhuge D. Wang S. Zhen L. Psaraftis H. (2023). Data-Driven modeling of maritime transportation: Key issues, challenges, and solutions. Engineering31, 25–26. doi: 10.1016/j.eng.2022.12.009
40
Zhuo X. Sun Y. Zhou S. (2025). Impact of consumers traceability awareness on blockchain adoption in supply chains. IEEE Trans. Eng. Manage. 72, 1140–1153. doi: 10.1109/TEM.2025.3552437
Summary
Keywords
carbon emission control, shared transportation, milk-run, dry port, new western land-sea corridor
Citation
Wang X and Wang X (2025) Reducing carbon emissions in the dry port-seaport system: a shared transport approach. Front. Mar. Sci. 12:1686552. doi: 10.3389/fmars.2025.1686552
Received
15 August 2025
Accepted
14 October 2025
Published
30 October 2025
Volume
12 - 2025
Edited by
Shaorui Zhou, Sun Yat-sen University, China
Reviewed by
Kai Morganti, Santos Limited, Australia; Salvatore Antonio Biancardo, University of Naples Federico II, Italy; Siming Fang, Jimei University, China
Updates
Copyright
© 2025 Wang and Wang.
This is an open-access article distributed under the terms of the Creative Commons Attribution License (CC BY). The use, distribution or reproduction in other forums is permitted, provided the original author(s) and the copyright owner(s) are credited and that the original publication in this journal is cited, in accordance with accepted academic practice. No use, distribution or reproduction is permitted which does not comply with these terms.
*Correspondence: Xinhui Wang, wangxh@shmtu.edu.cn
Disclaimer
All claims expressed in this article are solely those of the authors and do not necessarily represent those of their affiliated organizations, or those of the publisher, the editors and the reviewers. Any product that may be evaluated in this article or claim that may be made by its manufacturer is not guaranteed or endorsed by the publisher.