 Armando Caballero Acedo
 Jong Dae Do
 Vladimir Caballero Camejo
 Yeon S. Chang
- 1Korea Institute of Ocean Science and Technology, Busan, Republic of Korea
- 2University of Science and Technology, Marine Technology and Convergence Engineering, Daejeon, Republic of Korea
- 3Inversiones GAMMA SA, División de Ingeniería Costera, La Habana, Cuba
Effective sand nourishment for beach regeneration requires selecting sediments from a borrow zone compatible with the native materials, ensuring their stability and longevity. In Cuba, most of its beaches are predominantly covered by biogenic-marine sediments, and assessing the suitability of borrow sand presents unique challenges. This article compares two methods for assessing sand suitability in Cuba, where biogenic-marine sediments predominate: the Stability Index (Si) method and the traditional approach proposed in the Shore Protection Manual, herein referred to as the Overfill Factor (Ra) method. The Si method assesses compatibility by comparing grain-size distributions without assuming log-normality, while the latter uses the statistical parameter to estimate overfill requirements. The purpose of this study was then to provide a first assessment on this topic by evaluating a method that possibly allows for better adjustment than traditional methods, with the case studies on the beaches in Cuba specifically covered by biogenic-marine sediments. Using real-life case studies of artificial sand nourishment projects on beaches in this geographic region with varied sedimentary characteristics, we determined the performance of both Si and Ra methods in classifying borrow materials. The results of this initial approach suggest that the Si method offers greater flexibility when evaluating borrow zones, providing more accurate results and the possibility of utilizing areas that would have been discarded by conventional methods. The possibility of more efficient use of natural and economic resources is also becoming evident. Furthermore, it indicates that the application of Si is feasible in subsequent artificial sand replenishment projects in Cuba and on similar beaches with biogenic-marine sediments in the Caribbean region. This study represents the first application of a specific methodology to be applied for evaluation of the suitability of sand for Cuban projects, with the aim of its introduction as an additional tool for future studies.
1 Introduction
Artificial beach nourishment is a widely used strategy to combat erosion on sandy coasts, requiring sediments from an area commonly called a borrow zones, which must match or improve the stability of the native materials of the beach (National Research Council, 1995).
As stated in the Coastal Engineering Manual (EM 1110-2–1100 Part V, 2001), the particle size distribution of the borrow material can affect the cross-sectional shape of the nourished beach profile, the erosion rate of the fill material, and the beach’s response to storms. Typically, borrow material does not exactly match the native beach material, which is why an analysis is required to assess the compatibility of the borrow zones material with that of the native beach from a functional perspective. A comparative analysis is also required to economically evaluate alternatives for a given project.
The first investigations into the compatibility of borrow material were carried out by Krumbein (1957); Krumbein and James (1965); Dean (1974), and James (1974; 1975), who addressed this issue through various comparative analysis techniques that utilized the sand-size distributions of the natural beach and borrow material at candidate sites. These approaches develop a factor or parameter that indicates the amount of fill material needed, obtaining a unit volume equal to that of the native sediments, taking into account the differences in the characteristics of the borrow sediment and those of the native beach. They assumed that the deposited material would be separated as a result of coastal processes and, given sufficient time, would approximate the original grain size distribution. The portion of borrow material that did not match the grain size distribution of the native sediment would be lost offshore, illogically losing the contribution of the coarser grains.
The method proposed by James (1975) is the most widespread and used internationally, since it was adopted by the Shore Protection Manual (US Army Corps of Engineers, 1975).
More recently, Pranzini (2002) and Pranzini et al. (2018), after delving into the research on this topic, pointed out a series of problems and limitations in the application of the aforementioned method and proposed an alternative.
According to Pranzini (2002), the adjustments made by James (1975) and Hobson (1977) to the original method, and the one proposed by Dean (1974), partially resolved the limitations and problems of evaluating borrow zones, but did not overcome issues related to the log-normal distribution and were based primarily on the use of sediment similar to the native material.
The alternative method proposed by Pranzini (2002) allowed the suitability of borrowed materials to be assessed without considering the log-normality of the sediment as an essential condition, nor was it intended to provide materials identical to the native ones. His proposal was based on the hypothesis that the stability of each grain size fraction introduced into the beach was inversely proportional to the value of that same fraction on the cumulative curve of the native sediments. This means that the stability of a grain coarser than the coarsest grain present on the beach is equal to 1, and therefore can give a full contribution to the final volume. Conversely, the stability of a grain finer than the finest grain present on the beach will make a zero contribution.
This method has been extended and validated in beach nourishment designs and borrow zone evaluations mainly in Italy, Spain, and Israel (Pranzini et al., 2018, 2020; Bitan et al., 2020).
The phenomenon of erosion on Cuban beaches has been closely monitored since the 1970s, with the initial implementation of joint studies by the Institutes of Oceanology of the USSR and Cuba (Avello et al., 1973). Later, Juanes (1996), in his thesis for obtaining the degree of Doctor in Geographical Sciences, presented an inventory that summarizes the characteristics of 140 beaches in the archipelago, demonstrating that 86% of them are experiencing a continued retreat of their coastline and a general deterioration of their physical conditions. Specifically, for Varadero beach, this researcher demonstrated that it was maintaining a rate of coastline retreat of 1.2 m/year, with an annual loss of 50,000 m3 of sand. Subsequent research confirms this trend to a greater or lesser extent on different Cuban beaches (Tristá Barrera, 2002; García Hernández, 2005; Izquierdo, 2004).
Among the main causes of erosion in Cuba, a combination of natural causes associated with climate change and rising sea levels, as well as a lack of new natural sediment input, and causes originating from human intervention are cited. Among the latter, the most significant are the extraction of sand from the dunes and the island platform for the construction industry, the location of facilities on the dunes, damage to coastal vegetation, and inadequate construction of coastal defenses, port facilities, and tourist and sports marinas.
In response to this scenario, various actions have been implemented on Cuban beaches to control erosion, combining engineering interventions, adaptation measures, and regulatory approaches. Among these, Beach Nourishment has become the most widely used engineering technique. Therefore, deepening scientific knowledge is essential for the development of more efficient and sustainable projects that reduce the need for frequent interventions and optimize the use of available natural and financial resources. All existing methods for the design and stability assessment of beach nourishment projects are primarily based on studies conducted on beaches with terrigenous sediments. This has also been a concern for Cuban researchers, given that biogenic-marine sands predominate in this geographical region, showing significant differences in grain shape, weight, porosity, and density compared to terrigenous sediments. This issue is addressed in the work of Juanes (1996), and more notably in the studies by Tristá Barrera (2002) and García Hernández (2005), who propose adjustments to certain parameters in Dean’s equilibrium profile model (1977) to better reflect the specific characteristics of biogenic sediments found on Cuban beaches.
This article approaches these issues and compares the theoretical foundations, applicability, and performance of different methods in the selection of borrow materials for beach nourishment in the Caribbean region, taking case studies of different projects carried out in Cuba. This is the first time that a proposal different from that of the Shore Protection Manual [SPM84] is applied in this geographical environment, which will allow us to enrich the available work tools and evaluate their effectiveness for the first time in biogenic-marine sands, this being a first step in this line of research, which will allow the designs and analyses to be tailored to this environment.
2 Methods for assessing sand suitability
2.1 Overfill factor method Ra proposed in the shore protection manual
The first detailed method for assessing sand suitability in artificial sand nourishment projects and calculating an overfill factor to compensate for expected losses due to differences in particle size was proposed by Krumbein and James (1965). His method made it possible to determine the volumetric requirements of the borrow sand necessary to produce a granulometry identical to the native sand. These researchers assume that both native and borrow sediments have a log-normal distribution. A simple analytical formula—based on the “phi” means and classification values (in phi units) of both sediments—can be used to calculate the overfill factor. This method proved more effective than earlier approaches and, with modifications and expanded interpretive guidelines, was incorporated into the Shore Protection Manual [SPM73].
The procedure for calculating the overfill factor is described below. Following Dean (1974), the symbol is adopted herein to denote the overfill factor. The size of the grain of sand is typically expressed in “phi” () units (Equation 1),
where is the sand diameter in millimeters. The sand size distributions, , is reasonably approximated by a relationship called “log-normal”,
where and represent the mean and standard deviation of the particle size distribution of the sand in phi units. An example of approximations of the log-normal distribution is shown in Figure 1, which represents the two-sand distributions and their log-normal approximations as straight lines on logarithmic probability paper (Krumbein and James, 1965).
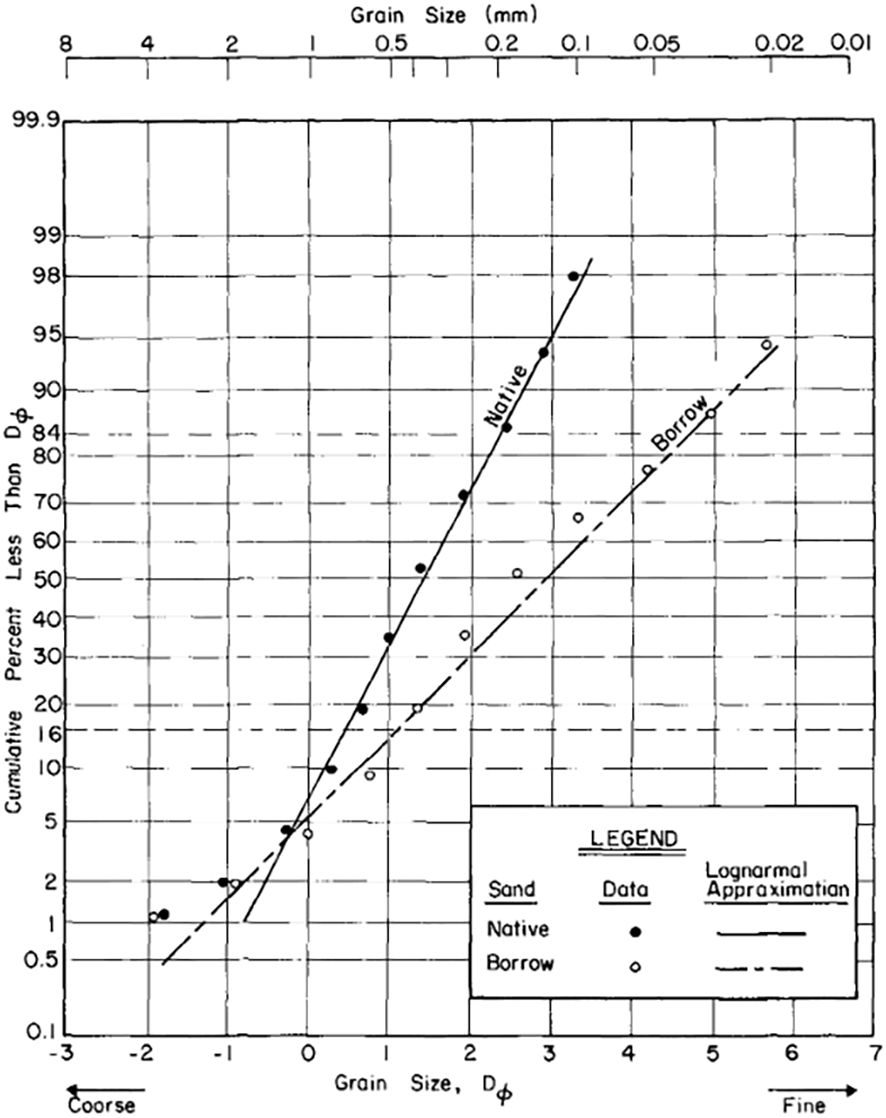
Figure 1. Approximations of the log-normal distribution of native and borrow sands for an Artificial Sand Nourishment project on Virginia beaches (Krumbein and James, 1965) (The figure is taken from Dean (1974)).
This method requires that the retained portion of the borrow material have exactly the same distribution as the native material, leading to the definition of a Critical Ratio in phi (), which represents the unit mass of introduced sand needed to produce a retained unit mass with a grain size (mm) exactly equal to that of the native sand. is estimated using the following (Equation 3),
whenever σb > σn (when σb< σn, cannot be calculated).
The Shore Protection Manual [SPM73], along with Dean (1974) and James (1974), describe certain limitations of the method; for example, it cannot be applied when the native material is more poorly graded than the borrow material. It also identifies unrealistic values when the borrow material is coarser than the native material.
Recognizing these limitations, independent Works by Dean (1974) and James (1974, 1975) led to proposals for alternative methods. For example, Dean (1974) proposed a refinement to the calculation of , and consequently an adjustment to the calculation of the overfill factor, , which he shared two similar assumptions of the method of Krumbein and James (1965):
a. Part of the distribution of the borrow material would be stable when placed on the beach.
b. The particle size distribution of the native material could be used as a guide to determine the “stable part”.
It was assumed that, during and after fill placement, selective sorting processes would remove excess material across all grain size classes until only the stable portion remains. Additionally, it was assumed that only the minimum amount of selective loss necessary to produce a stable distribution would occur.
Dean’s approach aims to establish a more realistic equivalence between the native material and the retained fraction of the borrow material. This allows for the loss of fine fractions absent in the native material, while the coarser fraction of the introduced sand is deemed ‘stable’.
Stability is based on the equivalence of the mean diameter between the altered borrow material and the native sand, assuming the log normal distribution as described in Equation 2.
Thus, the overfill factor proposed by Dean could be calculated by numerically solving two equations:
where is a dummy variable eliminated in the solution of the two equations, while and represent the Gaussian function and its integral (Equation 6), respectively,
Given the difficulty in solving Equations 4 and 5 without the use of computers, something that in those years constituted a real practical obstacle, it was decided to give it a graphical approach.
Figure 2 represents the graph constructed by Dean (1974), which depicts the isolines of K (RD) as a function of µb’ and µn’, dimensionless parameters assumed to simplify the mathematical solution of the equations defining the relationship between the characteristics of native sand and borrow sand. A semilogarithmic graph was chosen for this representation of the isolines because it was found that each isoline is simply a vertically shifted form of any of the others. For µb’ > µn’ (i.e., the borrow material is coarser than the native material), 100% of the sediment is compatible according to the criterion used in this method, whereas in the opposite case, this graph provides a useful solution for determining compatibility.
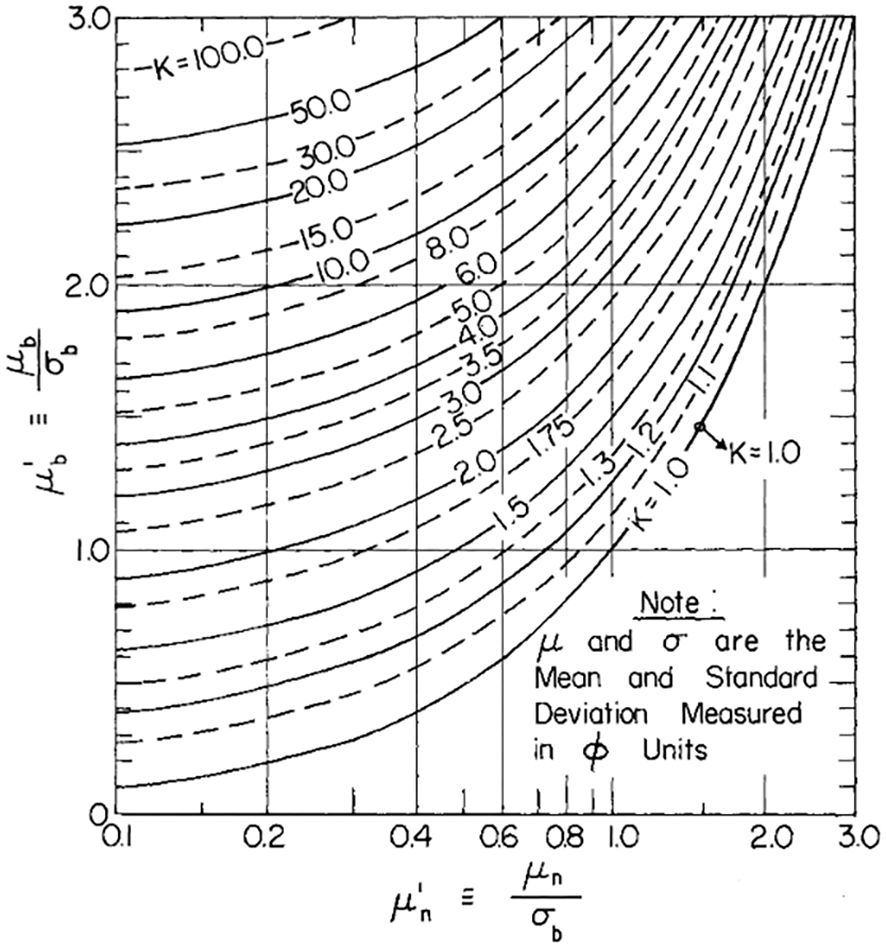
Figure 2. Isolines of overfill factor, K, indicating the required overfill volume of borrow material to obtain one unit of “compatible” beach material (Dean, 1974).
James (1975) offered a new adjusted method for the calculation of the overfill factor, arriving at the following conclusions regarding the methods offered by Dean (1974) (Dean74) and James (1975) (James75):
a. Both Krumbein and James (1965) and James (1975) coincided when the borrow material was coarser and better graded than the native material. In this case, they agreed in suggesting complete stability of the borrow material by providing fill factors equal to unity.
b. A partial match occured when the borrow material was finer and better graded than the native material. James75 did not offer quantitative guidance in these cases, recommending rejection of this material as unsuitable; however, Dean74 allowed for quantitative evaluation with low packing factors in some cases. In other cases, the numerical values obtained for the Dean74’s overfill factor were likely too high as to reject the material from consideration. When the borrow material had a mean phi fairly close to that of the native materials and also a similar grading value, Dean74 provided a useful quantitative estimate, whereas James75 did not.
c. When borrowed material was less graded than native material, Dean74 always provided lower overfill factors than James75.
d. In all quadrants there were reasonable arguments for interpreting the Dean74’s overfill factor as a lower bound and the James75’s overfill factor as an upper bound.
Based on these conclusions, it was determined necessary to find a compromise between the two methods, eliminating or minimizing the conceptual shortcomings they both presented. Thus, he proposed an adaptation of James75’s to meet the need, proposing the Adjusted Overfill Factor Ra.
The approach to obtain Ra was similar to that of Dean (1974), in which only the finer size classes required modification, but it differed in that modification by selective sorting was assumed to lead to a stable distribution. In this case, the finer fraction had the shape of the native material distribution, and the coarser fraction that of the borrow material. Previously, Dean (1974) assumed that all material finer than a cutoff grain size was considered unstable.
Dean75 method to use the native mean phi to determine the cutoff grain size was complicated, as it did not allow for the removal of significant fine fractions from very poorly sorted borrow materials, whose phi values were similar to or bigger than those of the native materials. In the new appraoch by James (1975), grading modifications were assumed to be applied to all grain sizes finer than a “stable grain size” to produce a modified density of the borrow material proportional to that of the native material in this size range.
In the conceptual framework of the method previously proposed in SPM73, the choice of this stable grain size occurred quite naturally. Krumbein and James (1965) defined a “critical phi value” that represented the grain size for which the ratio of the stable distribution of the native to the borrow material was maximum, based on the assumption that no sorting losses occurred at this size. According to James (1975), an obvious adjustment was derived from the assumption that no sorting losses occurred for materials with sizes equal to or greater than this value.
The new approach by James (1975) thus provided overfill factors higher than those of Dean (1974) and lower than those of SPM73 in almost all applications. Exceptions occurred when the borrow material was better sorted, but only slightly coarser than the native material. Furthermore, the adjustment performed provided overfill factors greater than unity, unlike previous methods.
Like Dean74’s method, the adjustment by James (1975) did not provide a simple mathematical formula for practical applications, so a graphical approach was also chosen.
In Figure 3, the isolines of Ra, commonly known as the Abacus of James (1975), were plotted in the range between 1.02 and 10, assuming that lower values, in quadrants 2 and 3, would assume Ra = 1, and therefore would be completely stable without the need for adjustments to the beach fill design. Values higher than the isolines plotted in quadrants 1 and 4 were considered completely unstable and indicated that the selected borrow zones should be discarded.
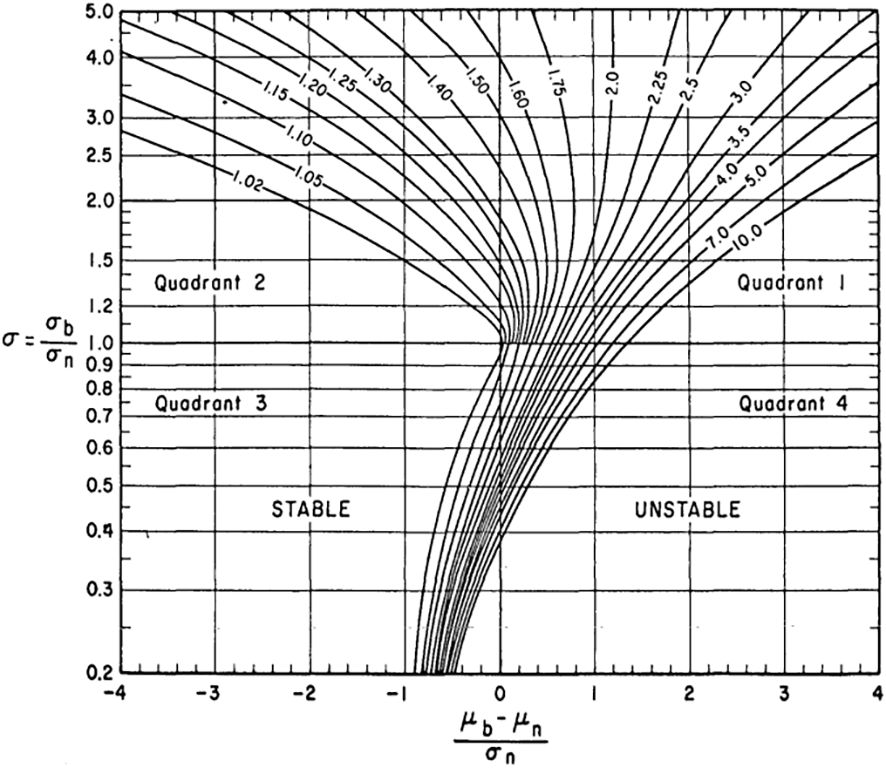
Figure 3. James (1975). Isolines of the adjusted overfill factor (Ra) versus the mean difference phi and the classification ratio phi.
In the final conclusions of James (1975), it was argued that “…the use of overfill factors had limitations and had to be evaluated against other considerations, such as the method of management and construction and the contractor’s payment basis … they did not represent definitive solutions to the important problems involved in planning and designing artificial beach nourishment programs. They were the result of exploring the rational implications of some fairly simple concepts, and they were useful in part because they were straightforward and could be easily rejected when inappropriate. New and refined techniques would undoubtedly be developed as research on this topic progressed and experience with beach nourishment increased.”
2.2 Stability index method Si
Despite the limitations recognized by the authors offered the use of overfill factor, developed and finally refined by James (1975), the Overfill factor Ra had been used in many beaches nourishment projects where artificial sand feeding was widely applied throghout the world, since it was proposed by the Shore Protection Manuals [SPM73, SPM75, and SPM84] (US Army Corps of Engineers, 1973, 1975, 1984), and due to its easy applicability and simplicity in calculations using graphics.
Therfore, there have been few researches and publications that addresses this topic until Pranzini (2002) proposed a new method, which has been successfully applied in projects carried out mainly in the Mediterranean Sea and Europe (Pranzini et al., 2018).
Among the limitations and problems identified in previous methods that this alternative method aims to solve are:
1. The old method only allows the estimation of the volume of borrow material required to obtain a final volume of sand with a granulometric distribution identical to the native sediments.
2. The need to hypothesize the log-normal distributions of native and borrow materials. The comparison is made using the respective values of Mean (Mϕ) and Sorting (σϕ) according to Inman (1952) formula. Native sediments frequently deviate from log-normality, especially composite sediments, which often present bi- or polymodal distributions, while log-normality does not occur in borrow materials that come from crushing or sieving coherent rocks, or when extracted from recent alluvial deposits. This logarithmic normality is more common in seafloor materials that do not constitute composite sediments.
3. This calculation does not yield accurate results with a ratio of Ra = 1 if the borrow material is better sorted than the native material. Consequrntly, a better graded, coarser borrow material is considered stable, regardless of its size. Different, coarser materials end up having the same Ra value and, therefore, the same suitability. The same is true for finer materials, which will always be considered unsuitable, making it impossible to determine the most suitable among two or more low-cost materials that could be used for beach restoration.
This last limitation is clearly seen in the James (1975) Abacus itself (Figure 4). This abacus was the subject of particular analysis by Pranzini et al. (2024), during the “XVII Spanish Conference on Coastal and Port Engineering. Ibiza, May 8 and 9, 2024”, with the presentation entitled “The problems of James’s abacus and an alternative solution.”
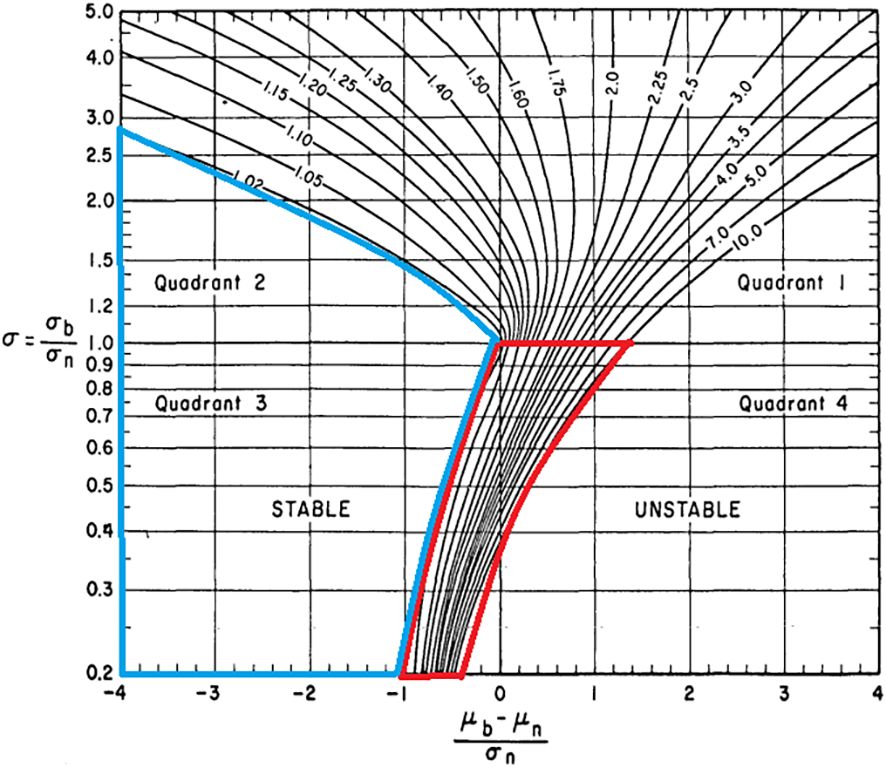
Figure 4. Problem area of James' Abacus (Pranzini et al., 2024).
According to these authors, there are two problematic areas within the abacus. The blue area in Figure 4, for instance, corresponds to borrow sands that are coarser and better-sorted than the native sands. These are simply considered “stable,” but the nomogram is unable to distinguish which of the different borrow sources is the most suitable. On the other hand, the red area in the same figure corresponds to well-sorted borrow sands of substantially similar size. In this area, the lines are so close together that small errors can lead to big differences volumetric in its use.
The proposed alternative method defines a Stability index Si, based on the premise that a stable beach does not necessarily have to have a granulometric distribution identical to the original, therefore, it does not consider the log-normality as an essential condition. Furthermore, it proposes that an eroded beach most likely has coarser sand than the original due to the selective erosion it has undergone. Consequently, an environmental project should be to restore the beach to its original state.
It can also be added that the project to be carried out is for a beach that has been previously restored already. Therefore, its native granulometric distribution might have been modified, and the borrow zone used might not meet the suitability criteria proposed by James (1975).
The hypothesis of this new method is that the stability of each fraction introduced into the beach is inversely proportional to its stability in the native sand. This implies that the stability of a grain coarser than the coarsest present in the beach is equal to 1, thus completely contributing to the final volume. Conversely, a grain finer than the finest present in the beach is equal to 0, contributing nothing to the final volume. Therefore, the Stability Factor for each granulometric fraction (fs) (Equation 7) is equal to the inverse of that same fraction “i” in the cumulative curve of the native sediment, divided by 100. (Figure 5).
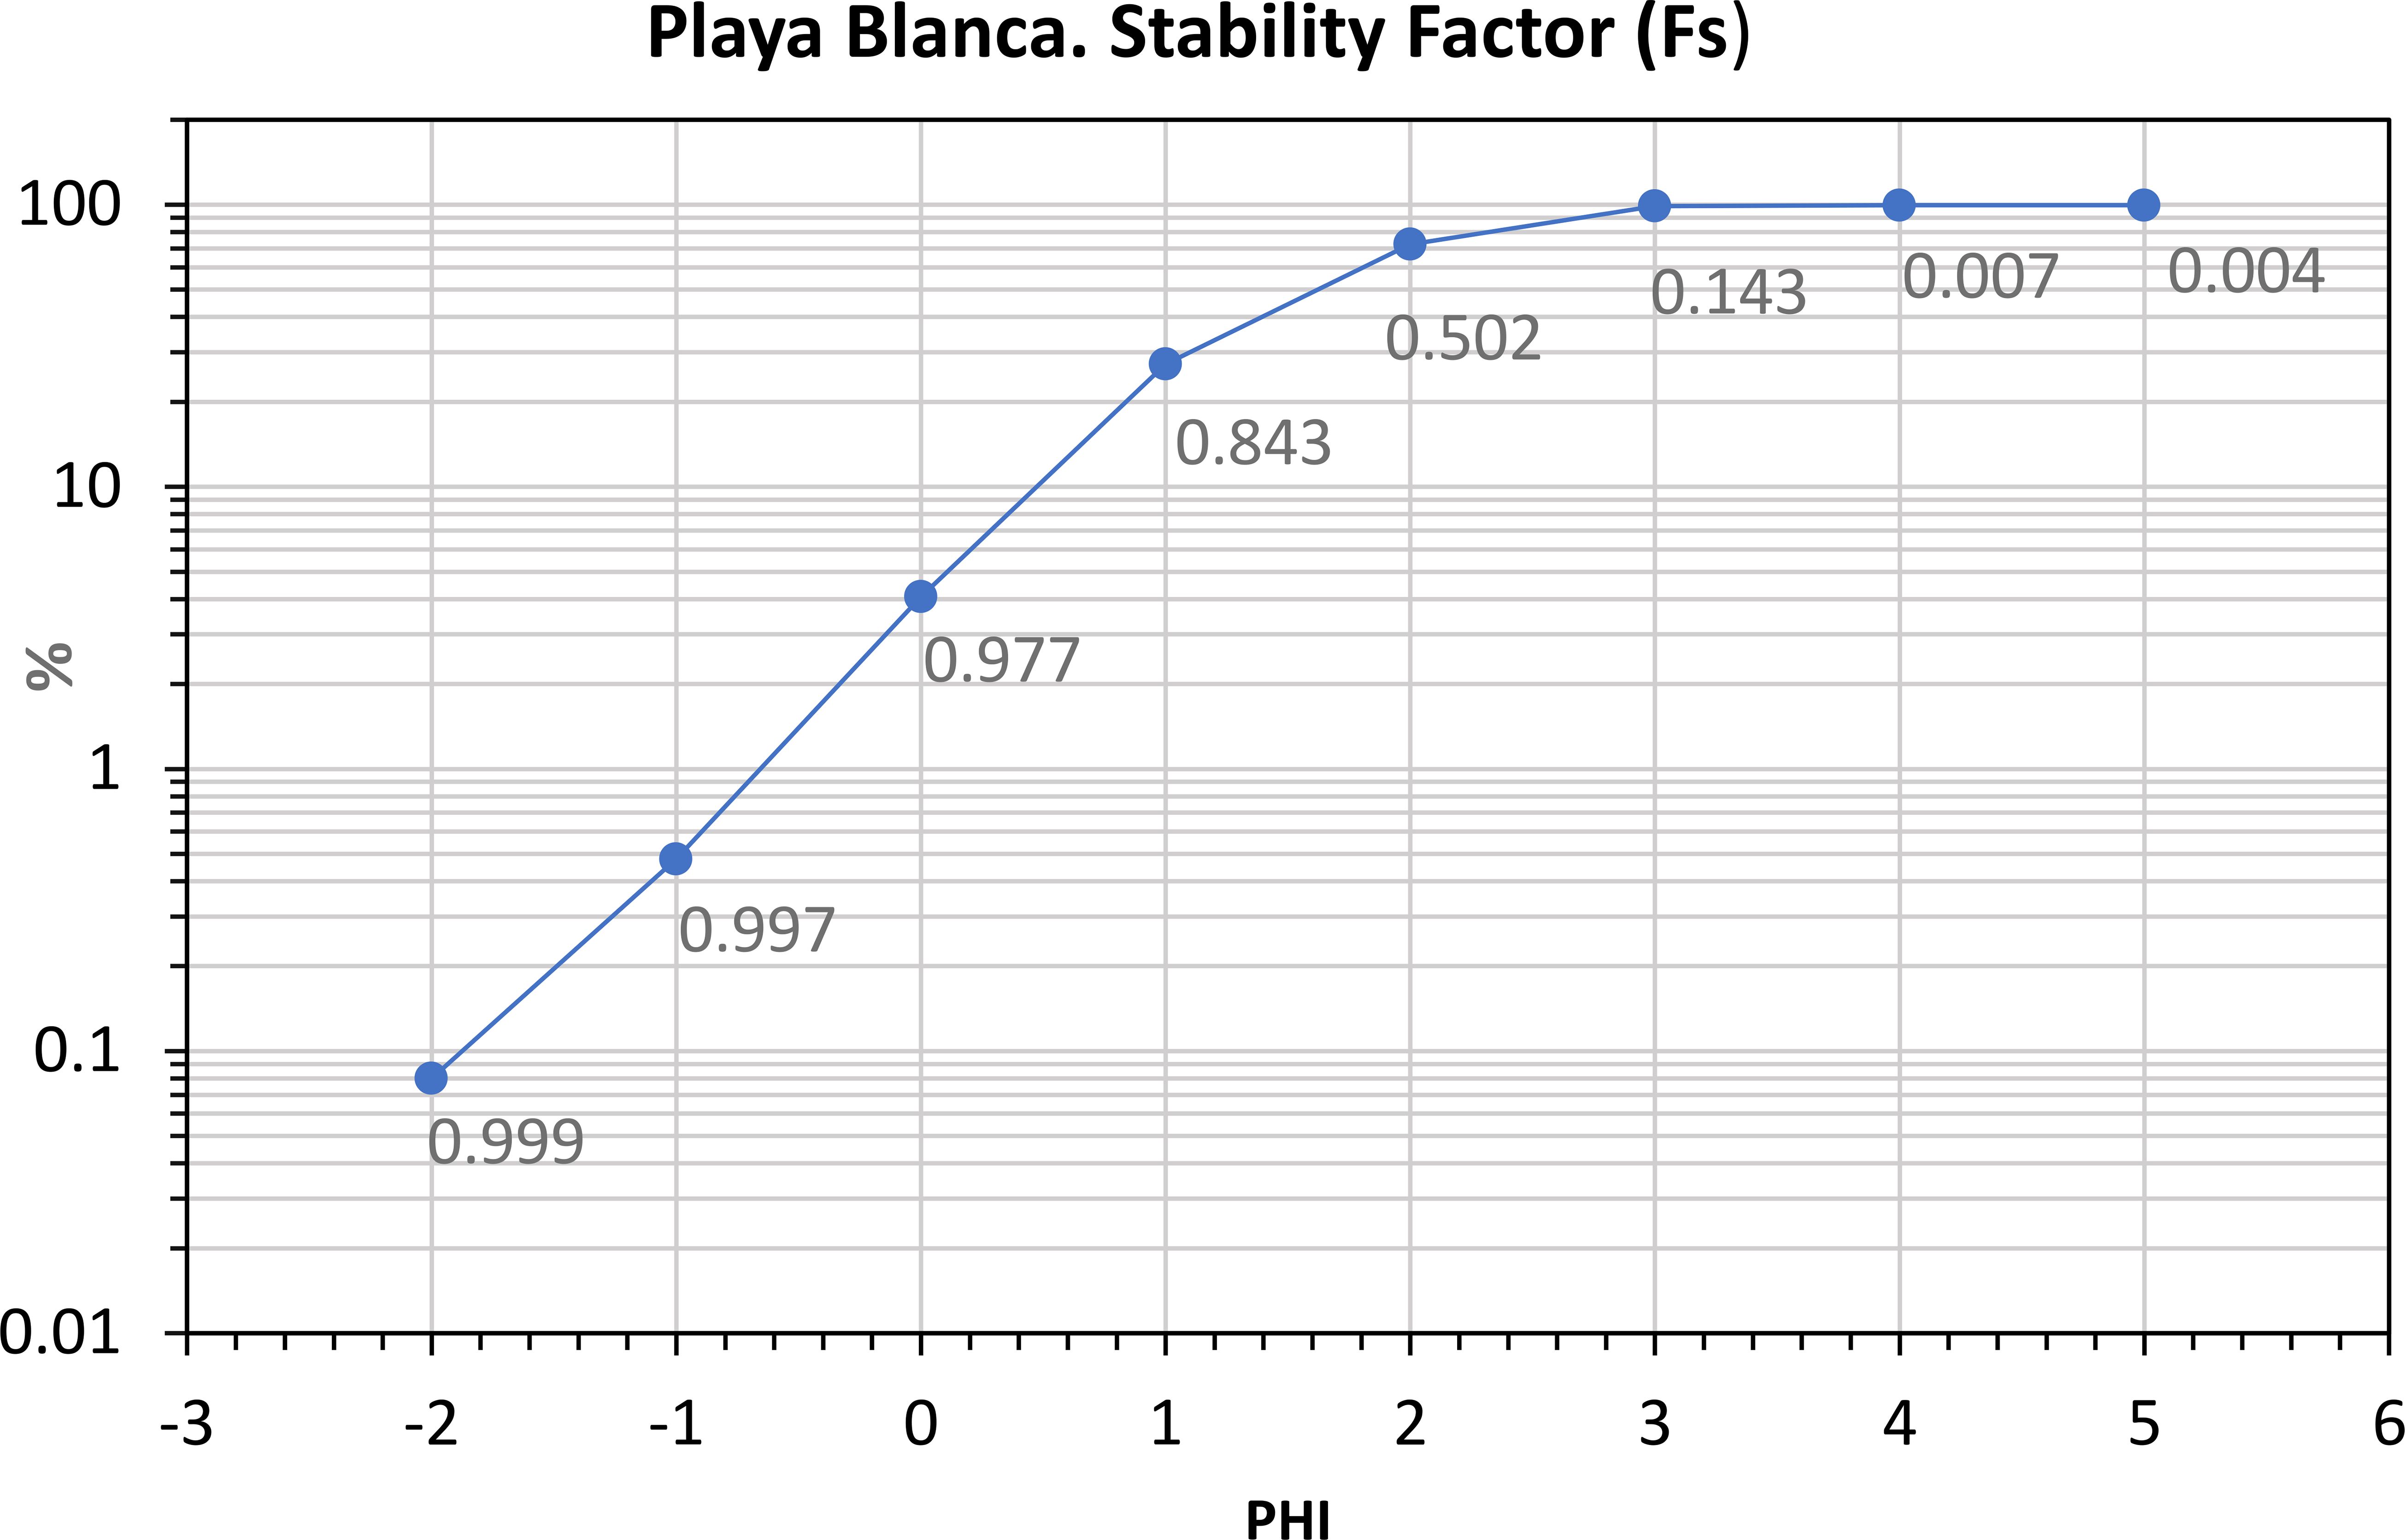
Figure 5. Cumulative curve and Stability Factor (Fs) calculated for Playa Blanca, Cayo Santa María, Cuba.
where Cni represents the cumulative percentage of the granulometric fraction “i” of the native sediment.
Multiplying “ “ by the value of the representative fraction of the borrow sand grain size class yields its contribution to artificial beach nourishment. The sum of these values, divided by 100, represents the stability index Si (Equation 8), which always has a value between 0 and 1.
Here, Si = 0 means that all the grains of the borrow material are finer than the native grains. Conversely, if Si = 1, all grains are coarser than the coarsest grain present in the beach. Therefore, a fill material with Si = 0.50 will therefore have a particle size distribution identical to that of the beach.
The main advantage claimed for this method is that a Stability Index Si can be assigned to any type of material. This even includes materials for which previously proposed methods either do not allow evaluation or assign a generic Overfill Facor Ra value of 1. More specifically, by calculating the Stability Index Si, it becomes possible to evaluate borrow materials that would have been discarded with the calculations of Ra. However, due to their availability and low cost, these materials are feasible to use, thus enabling the creation of a suitability scale for alternative materials.
Only materials with Si values exactly at 0 or 1 would be impossible to classify within a finer scale, but in practice, it is unlikely to obtain such precise results.
To perform the calculations, a routine is created in an Excel spreadsheet, where the cumulative percentages of native and borrow sediment are entered, which then produce the values. These values are multiplied by the respective values in the other column. The sum of these results ultimately provides the Si values. An example of the spreadsheet used for this research is shown in Figure 6.
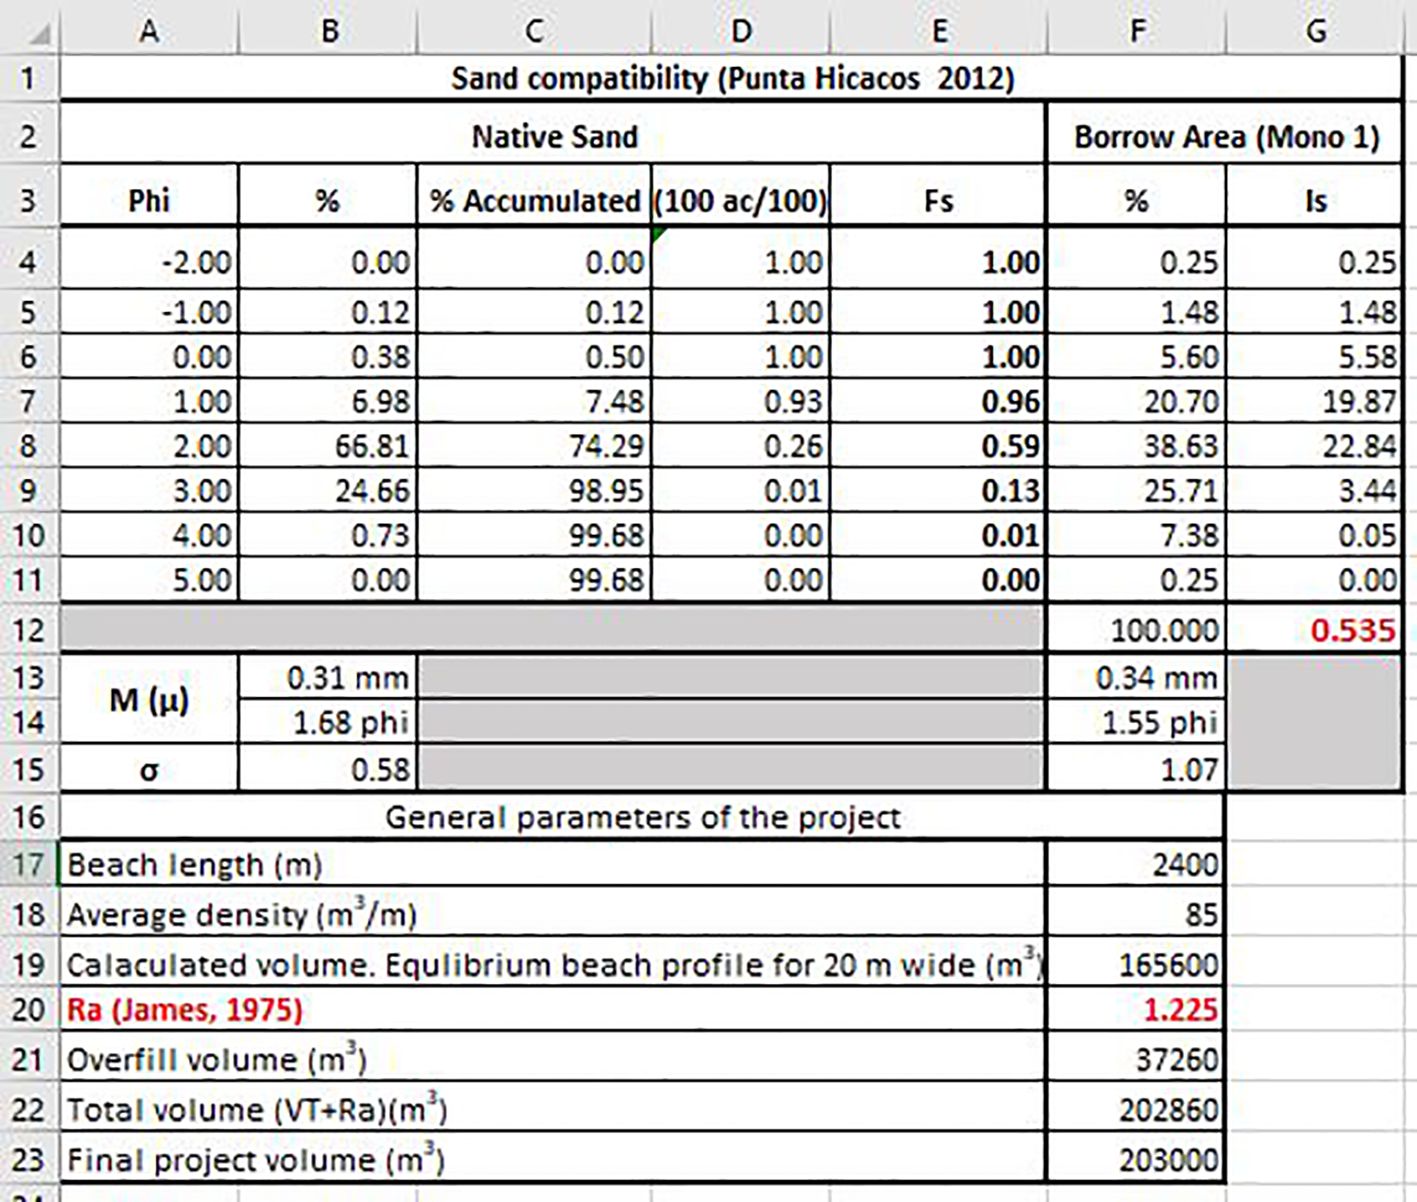
Figure 6. Example of excel sheet created for the Si calculation.
2.3 Data collection and analysis
As stated in the introduction, the objective of this research is to examine the different methods available for assessing the suitability of sand in beach regeneration projects where Artificial Sand Feeding is applied, comparing the performance of each of them by evaluating case studies in Cuba. This is the first time that a methodology other than the one proposed in the Shore Protection Manual [SPM84] is applied in the Caribbean’s biogenic-marine sand environment.
For this purpose, data will be taken from projects executed on the beaches of Varadero, Jardines del Rey (Cayo Coco and Guillermo), and Cayo Santa María – Las Brujas. As explained above, all sand suitability analyses for these projects were conducted using the James (1975).
Essentially, the same methodology, explained below, was followed for analyzing the granulometric characteristics of the native and borrow sands in these projects.
For native sands, sand samples were taken from selected profiles spaced 250 meters apart along the beach, with 28 samples collected per kilometer of shoreline for each project. The samples were collected to characterize each of the morphological element present in each profile (dune, post-beach, berm, fore-beach, inflection, valley, and submarine bar), as shown in Figure 7.
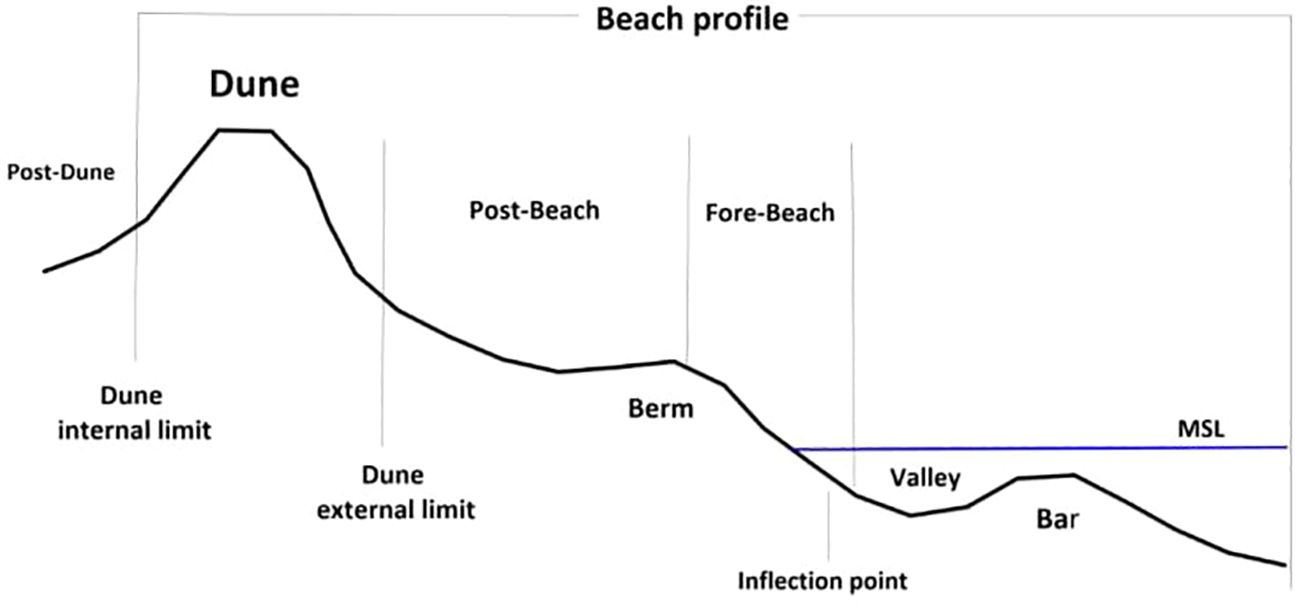
Figure 7. Morphological elements of the beach profile taken into consideration for sedimentological sampling.
Finally, to obtain the type sample of the beach, a composite sample was obtained, weighting the weights per sieve in each profile using mathematical methods, obtaining a single value for each of them. This process, using each of the weighted type samples from each profile, was repeated to obtain the final value for the entire beach. In the case studies presented below, no substantial changes were found in the grain size of the type samples along the beaches, which would require a differentiation in the selection of the sand to be introduced.
In the case of the borrow zones, the sediments were characterized through sampling using a network of stations, which were distributed based on the size of the area to be sampled and the homogeneity of the sediment body, spaced 100 meters apart. At all stations, surface samples were taken. Additionally, in areas with lower sampling density—stations spaced 300 meters apart—subsurface sampling was carried out to verify the continuity of sediment characteristics along the lithological column (Figures 8, 9). The characterization and definition of these mineral resource blocks were accompanied by geophysical, geological, and bathymetric surveys.
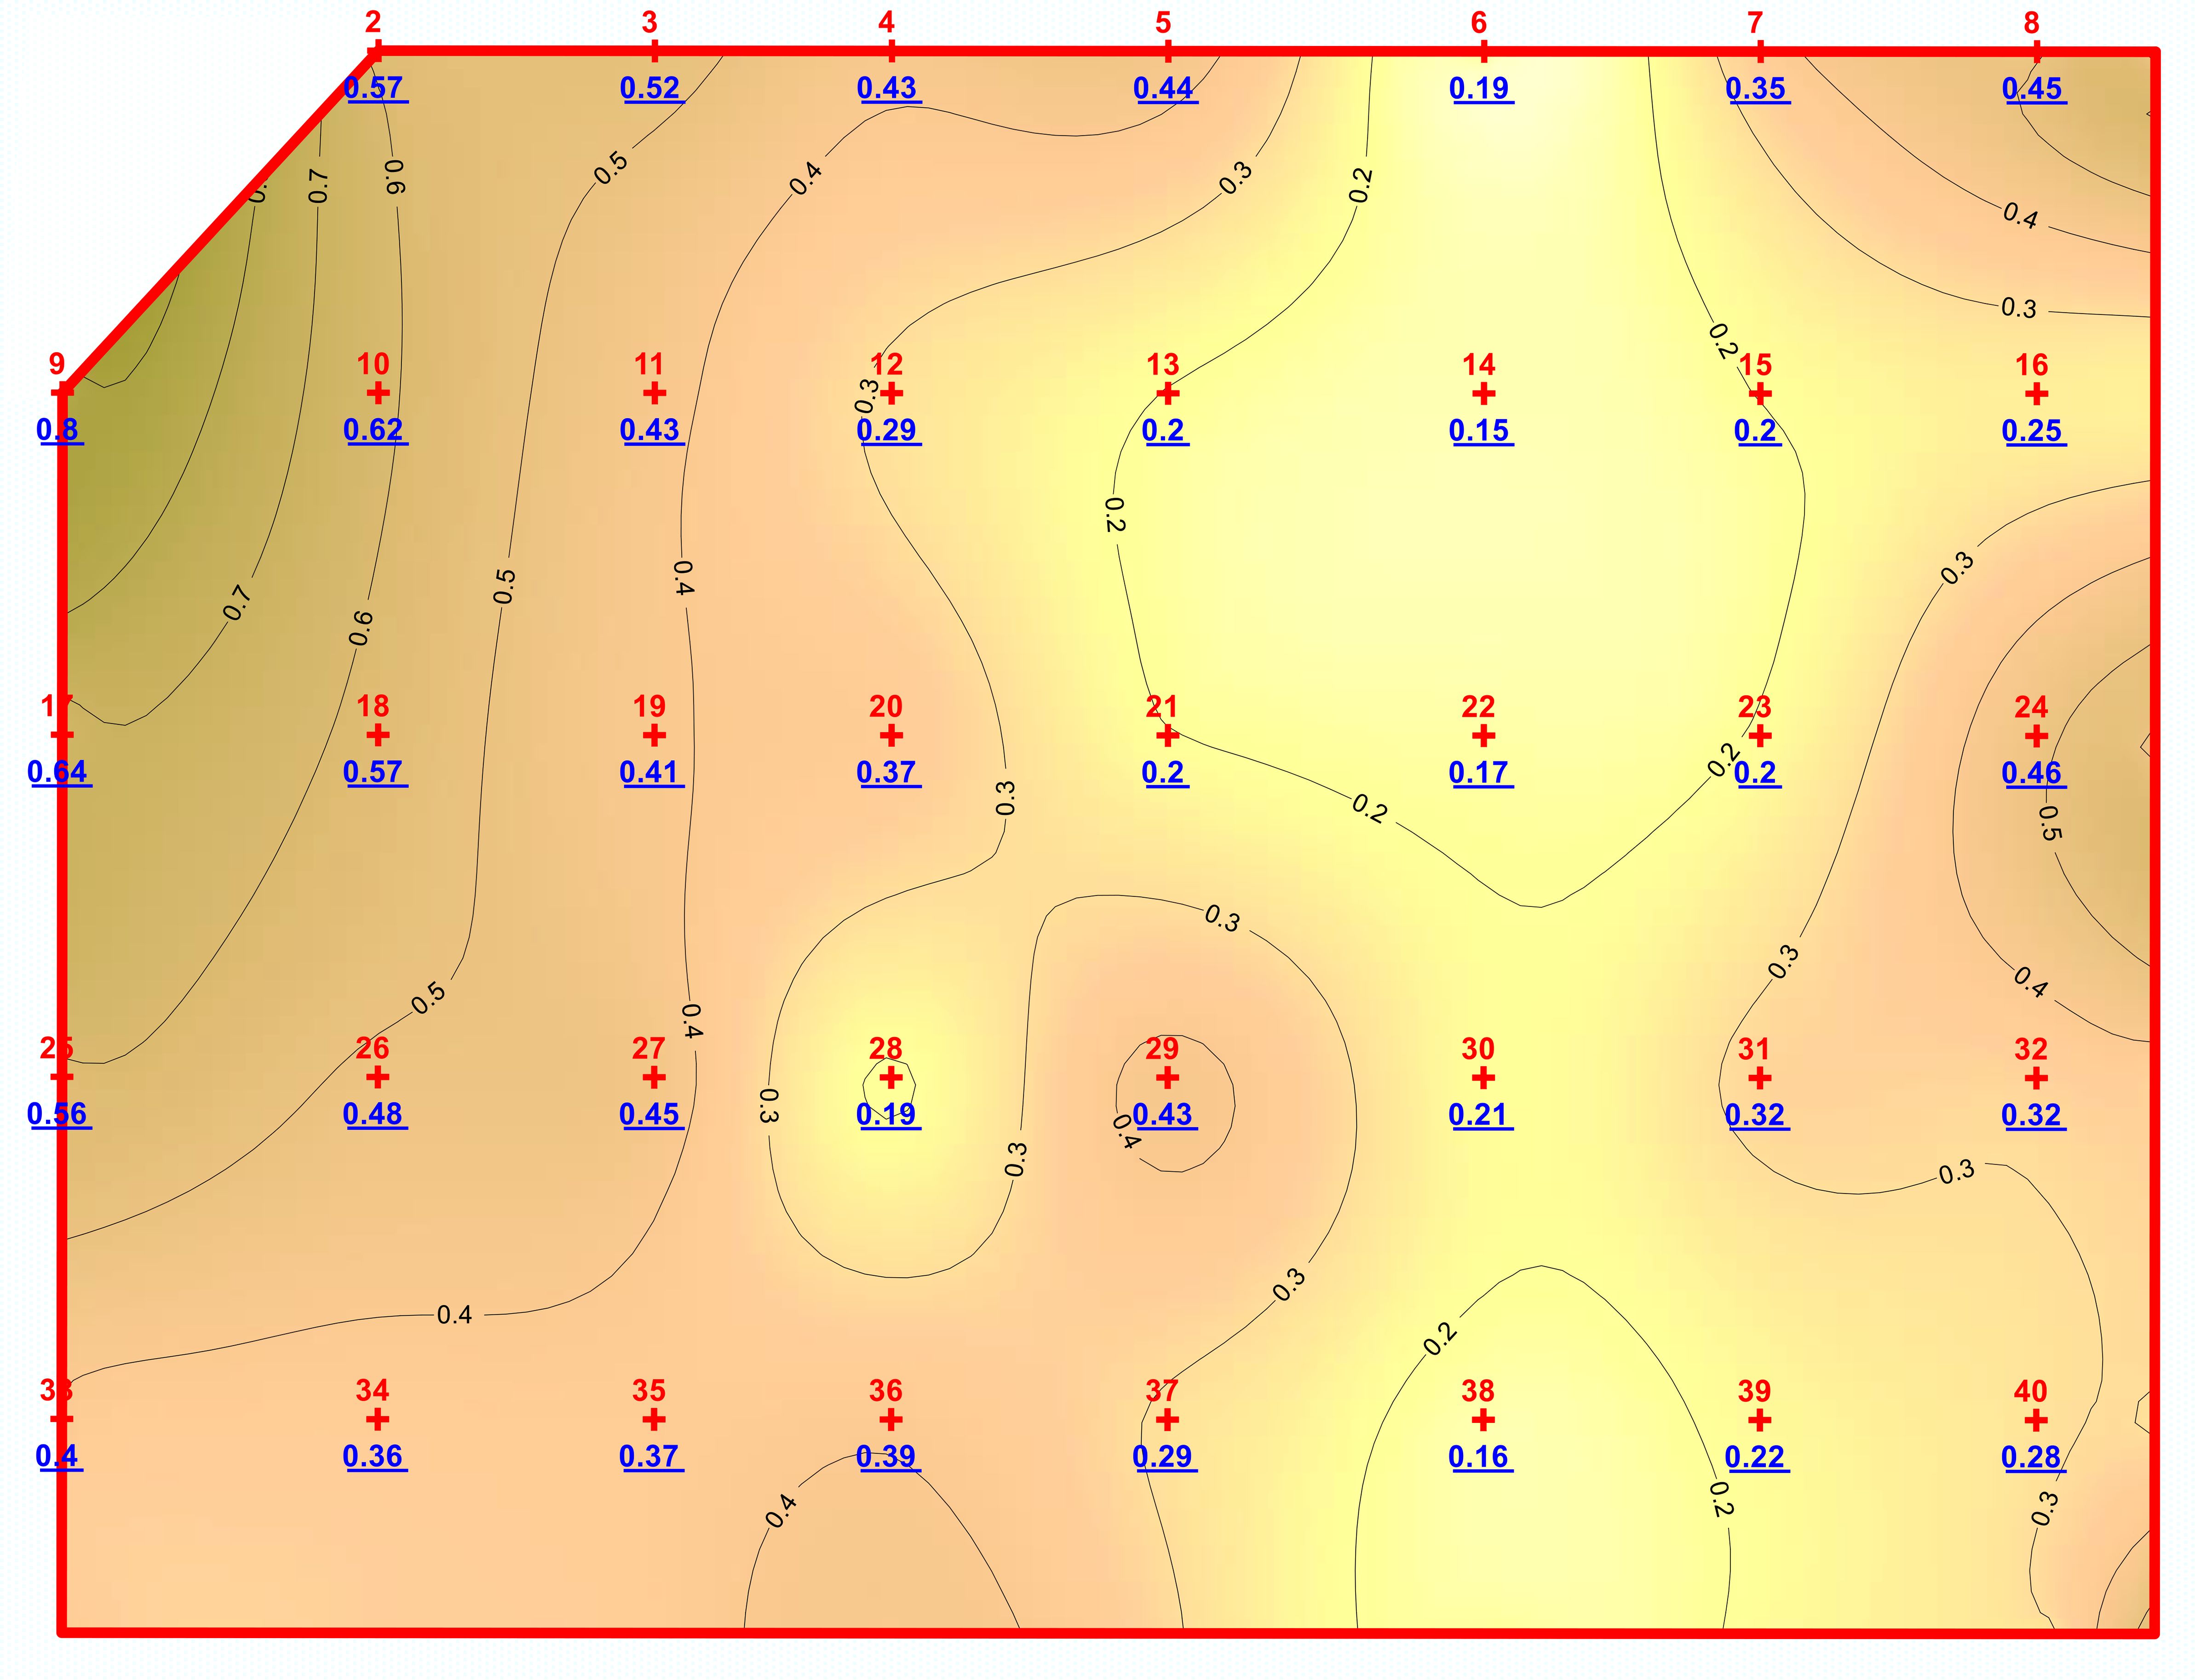
Figure 8. Example of a station network in the Mono I borrow area, on Varadero beach. In this case, the distribution of the particle size average (M) across the surface of the resource block is represented.
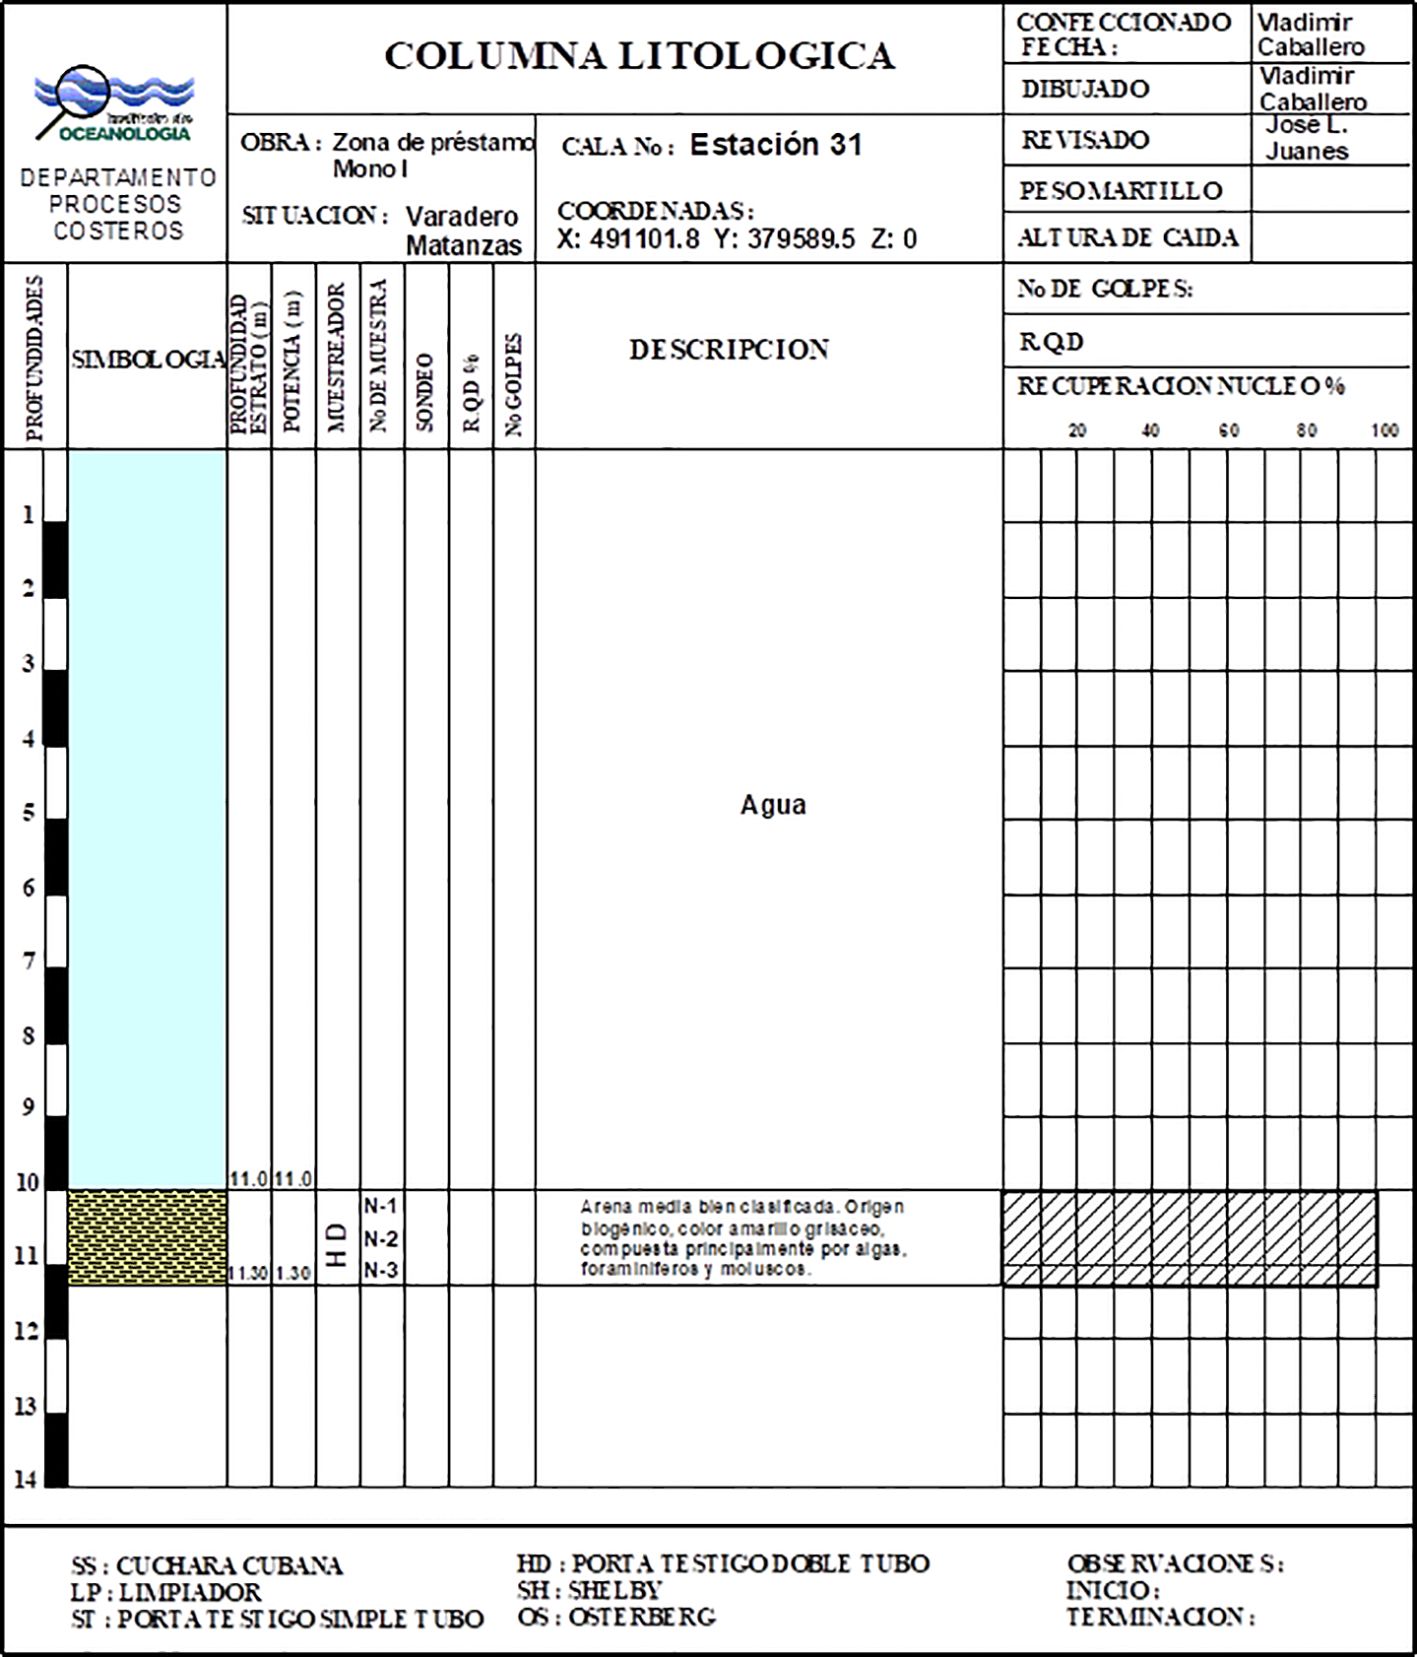
Figure 9. Example of a lithological column at station 31 of the Mono I Borrow Area, on Varadero beach.
The granulometric processing in the laboratory was carried out according to the methodology proposed by Petelín (1967) for the study and characterization of marine sediments. A Restsh AS 200 analytical sieve shaker was used, along with a set of sieves with mesh sizes of 0.062, 0.125, 0.25, 0.50, 1, 2, and 4 mm. Given the nature of the samples, consisting entirely of sand, the dry sieving method was employed.
The sieve weight data were processed using Gradistat Version 9.0 software, developed by Simon Blott of the Current Environments Research Group and belonging to the Department of Geology at Royal Holloway University of London. From this, the mean particle diameter () in mm and units, the standard deviation (), kurtosis and skewness were obtained by the method of moments.
For sediment classification, the system proposed by Wentworth, aligning with the range of sieves used, was employed as outlined in the Shore Protection Manual [SPM84]. Using mathematical methods, and also using Gradistat Version 9.0 software, the composite or type sample was then obtained for both native and borrow sands.
3 Results with case studies
3.1 Generalities
Cuba, belonging to the Greater Antilles group, is an archipelago made up of a main island, which gives the country its general name, and four sub-archipelagos that surround it. More than 3,000 islands and cays have been counted, with more than 6,000 km of coastline. Due to its geographical location, Cuba divides the waters of the Caribbean Sea from those of the Gulf of Mexico and the Straits of Florida.
Beaches, in particular, constitute an important natural resource for the country, not only for their use in tourism and the economic income they generate, but also for being an important line of defense against sea intrusion during extreme weather events and in combating the effects of climate change. Therefore, their preservation contributes to the protection of one of the country’s most important natural resources, in addition to constituting an important action for environmental protection (Juanes, 1996).
However, although signs of erosion on Cuban beaches had been observed since the 1950s, references to this phenomenon first appeared in scientific work in the late 1960s, particularly regarding Varadero beach. This was initiated by Zenkovich and Ionin (1969), and subsequent investigations into this issue have been continued by various researchers (Ionin et al., 1972; Pavlidis et al., 1977; Medvediev and Juanes, 1981; Medvediev, 1982; Suarez, 1976; Ramírez, 1989).
The search for solutions based on scientific advances led Cuban researchers and engineers to opt for Beach Nourishment as the preferred technique for beach restoration and maintenance, in combination with adaptation measures, management, planning, and updates to legislation. Thus, in 1987, the implementation of the first projects began at Varadero Beach, and the experience was later extended to other tourist regions of the country.
A key element in implementing this beach restoration strategy is the characteristics of the sediments. Many publications and research projects on the topic have been conducted over the years, but the most comprehensive summary can be found in the monograph, “Geology of the Cuban platform” (Pavlidis et al., 1977). This work describes that terrigenous sand beaches are distributed locally and are often limited to river mouths, with their almost total absence observed in abrasive areas. However, an analysis of the contribution of biogenic remains demonstrates the primary role of these components in the platform sediments, except for the southeastern part of Batabanó, where oolite predominates.
In a recently published study (Sánchez-Bellón et al., 2025) that utilized more advanced techniques, the textural, mineralogical, and chromatic characteristics of Cuban beach sediments were analyzed. This study, based on 91 beaches sampled throughout the archipelago, confirms the predominance of biogenic-marine sediments, mainly in the northwestern area and the keys. These are also the sites where Artificial Sand Replenishment works carried out to date are concentrated, due to their coincidence with the main tourist areas.
However, while research and project design have been greatly influenced by early international collaborations, local specialists have also drawn on other trends in the field. One of the main ones, as is the case in much of the world, was the results of the United States Army Corps of Engineers, whose experiences and guidelines are reflected in publications such as the Shore Protection Manual [SPM84], which do not provide specific treatment to the biogenic sediments predominant on the coasts of most Caribbean islands.
Recognizing this limitation, some specific research has been carried out to adapt methods, which base their results on terrigenous sands, to the particular conditions of Cuban sediments (Juanes, 1996; Tristá Barrera, 2002; García Hernández, 2005). More recently, in pursuit of this objective, the first Association Caribbean States (2024) was published within the framework of the Sandy Coasts project. This project was carried out by the Association of Caribbean States (ACS) with funding from the Korea International Cooperation Agency (KOICA). Despite these advances, there are still many areas to be researched in the region with a view to tailoring solutions. In the specific case of sand stability, there is no known record of any studies having been conducted on the subject.
For this reason, the objective of this article was to provide a first approximation to this topic, comparing a method that, while not specifically developed for biogenic sediments, offers greater flexibility in its application, possibly allowing for better adjustments than with traditional methods.
3.2 Case study of the Punta Hicacos sector, Varadero
The first site selected for the study was Varadero Beach, in the province of Matanzas, approximately 140 km from Havana, on the northwestern coast of Cuba. (Figure 10).
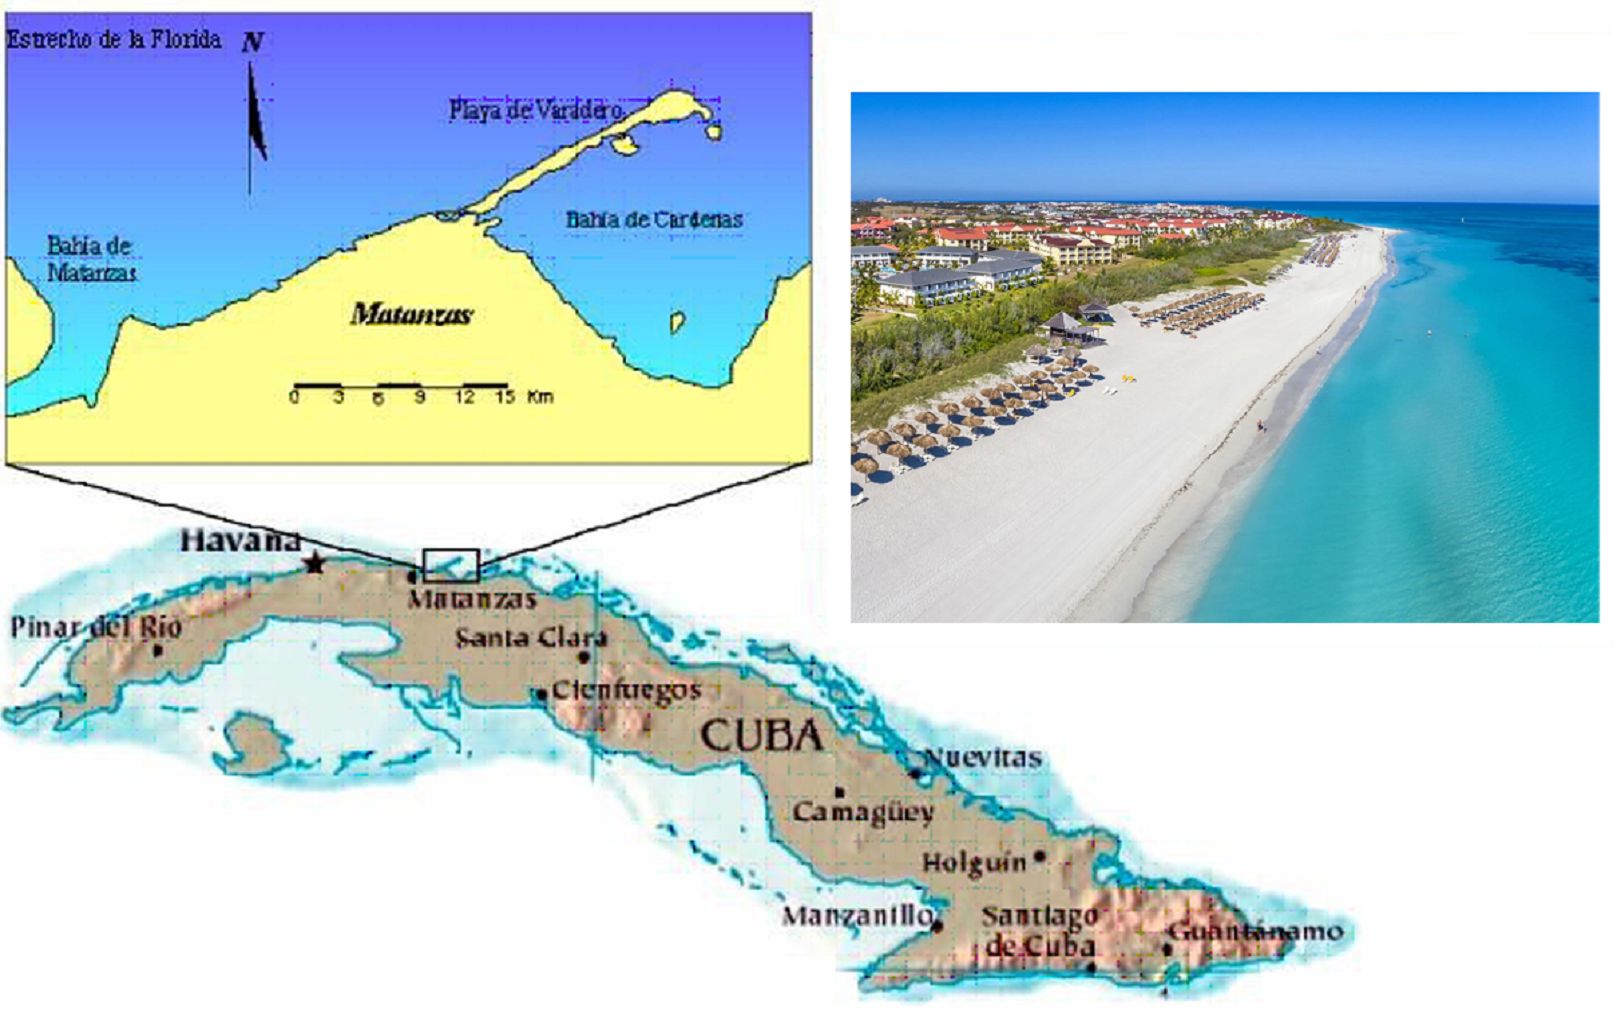
Figure 10. Location of Varadero beach.
Varadero is the country’s most iconic beach and one of the most famous in the Caribbean region due to the quality and beauty of its natural surroundings. However, erosion problems along its coastline have been evident since the late 1950s.
Since 1987, 15 artificial sand nourishment campaigns have been carried out in different sections of this 20-km-long beach, returning a volume of just over 4 million cubic meters to the coastal system. For this purpose, two borrow zones, commonly known as Mono I and Mono II, have been used. These zones differ slightly in their granulometric characteristics and sediment selection. For the present analysis, two of these campaigns were used, both carried out in the 4-km-long section known as Punta Hicacos, at the eastern end of the beach. These two campaigns were selected because both were carried out using different borrow zones for the same beach sector, allowing a comparative analysis of both. Additionally, the available data are more complete and reliable since, unlike previous campaigns, the same sampling and field data processing criteria were applied.The first of these artificial sand nourishment campaigns was carried out between 2003 and 2004, marking the first beach restoration action in this area. A total of 456,687 m3 of sand were supplied from the Mono II borrow pit (Caballero et al., 2004). The second of these campaigns was carried out in 2012, as a maintenance of the original project, this time 272,140 m3 of sand were supplied along 2.2 km, but, for this new campaign, the borrow zones used was Mono I (Caballero and Izquierdo , 2012). (Figure 11).
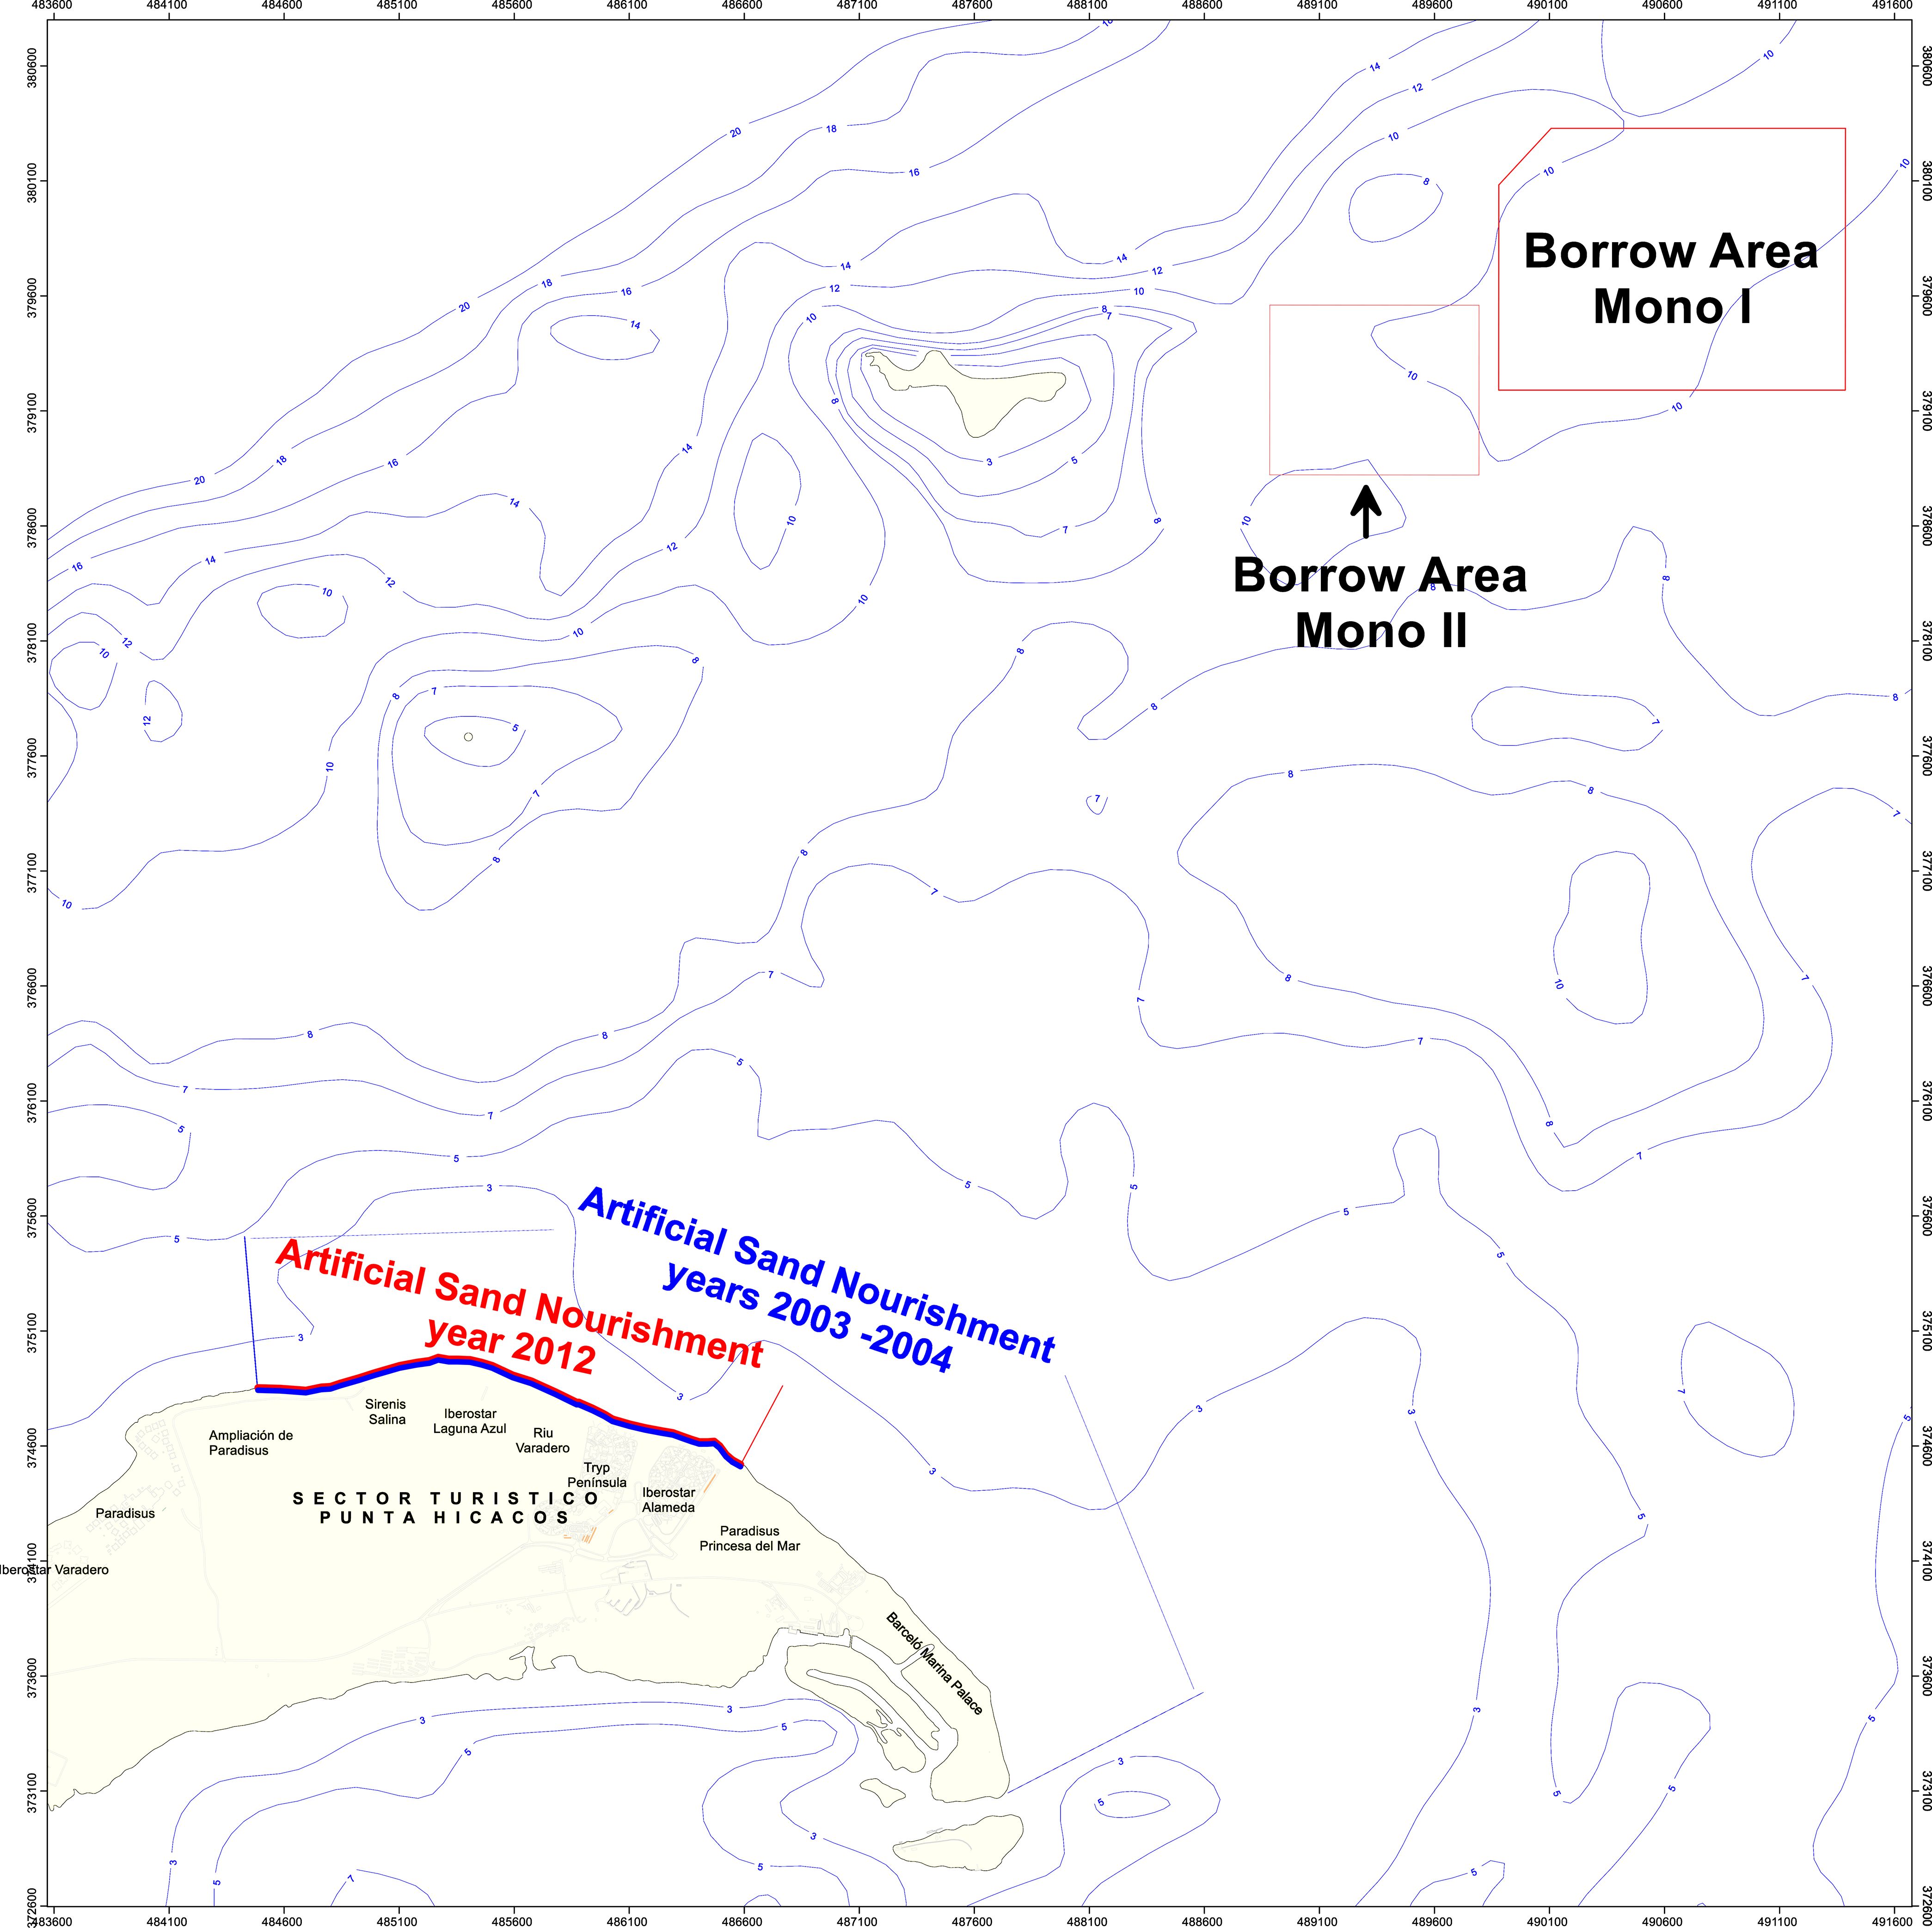
Figure 11. Punta Hicacos Project Sector and location of the Mono I and Mono II borrow zones.
Sedimentological sampling and subsequent laboratory analysis for the characterization of the beach sediments and borrow zones were carried out following the methodology explained in section 2 and the results of the granulometric and distribution characteristics of the type sample are presented in Table 1.
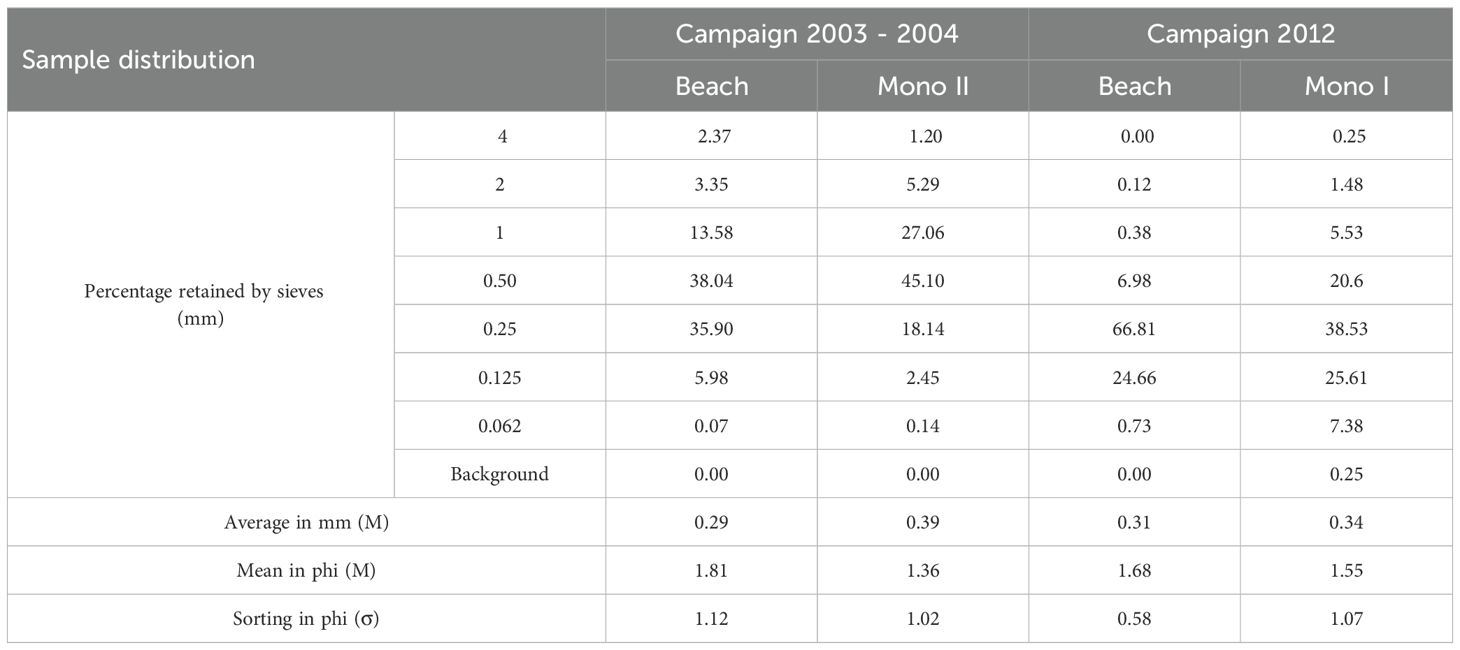
Table 1. Granulometry distribution of the typical samples of native and borrow sand in each of the Artificial Sand Nourisment campaigns.
The overfill factor Ra obtained for the campaign carried out in 2003–2004 is 1, which means no adjustments to the design volume are needed due to differences in granulometric characteristics. In contrast, for the year 2012, an overfill factor Ra of 1.225 was obtained, implying an addition of 22.5% (37,260 m³) to the original volume. However, when applying the stability index Si to both campaigns, the sand is classified as stable.The 2012 campaign is closer to the 0.5 threshold in the calculation of Si, which indicates that the beach will maintain an erosion rate similar to that observed up to that point; in other words, no greater stability of the fill is expected compared to its predecessor from 2003–2004. However, the Ra value requires increasing the fill by 22.5% over the original design, which will have implications for the project cost and environmental impacts, but without solving the problem of achieving greater fill stability (Table 2).
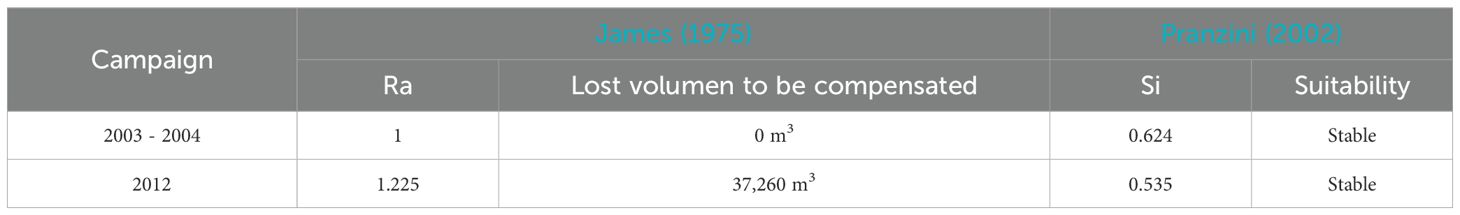
Table 2. Comparison of sand suitability assessment results James (1975)– Pranzini (2002) in the projects executed in the Punta Hicacos sector, Varadero, Cuba.
This is an interesting point to consider in future campaigns, and calculating Si is very useful for this. When the objective is to increase beach stability, another borrow zones should be selected. If previous results have been satisfactory, a reliable indicator will be available to predict future erosion rates and, thus, to plan new maintenance actions, making more rational use of the resource.
Figures 12 and 13 show the degree of overlap between the granulometric distributions, which is very well described by the results obtained with the application of the Stability Index.
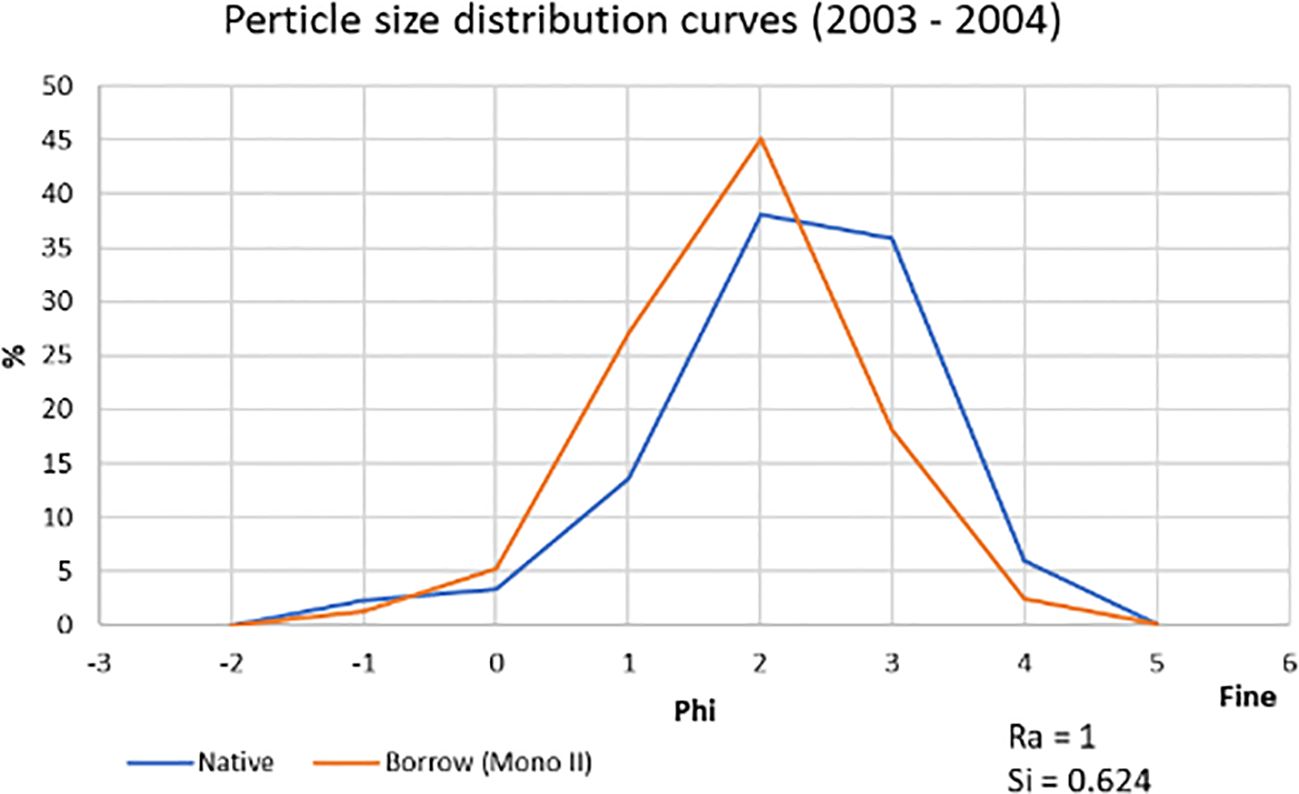
Figure 12. Overlapping of particle size distributions in the 2003-2004 campaign.
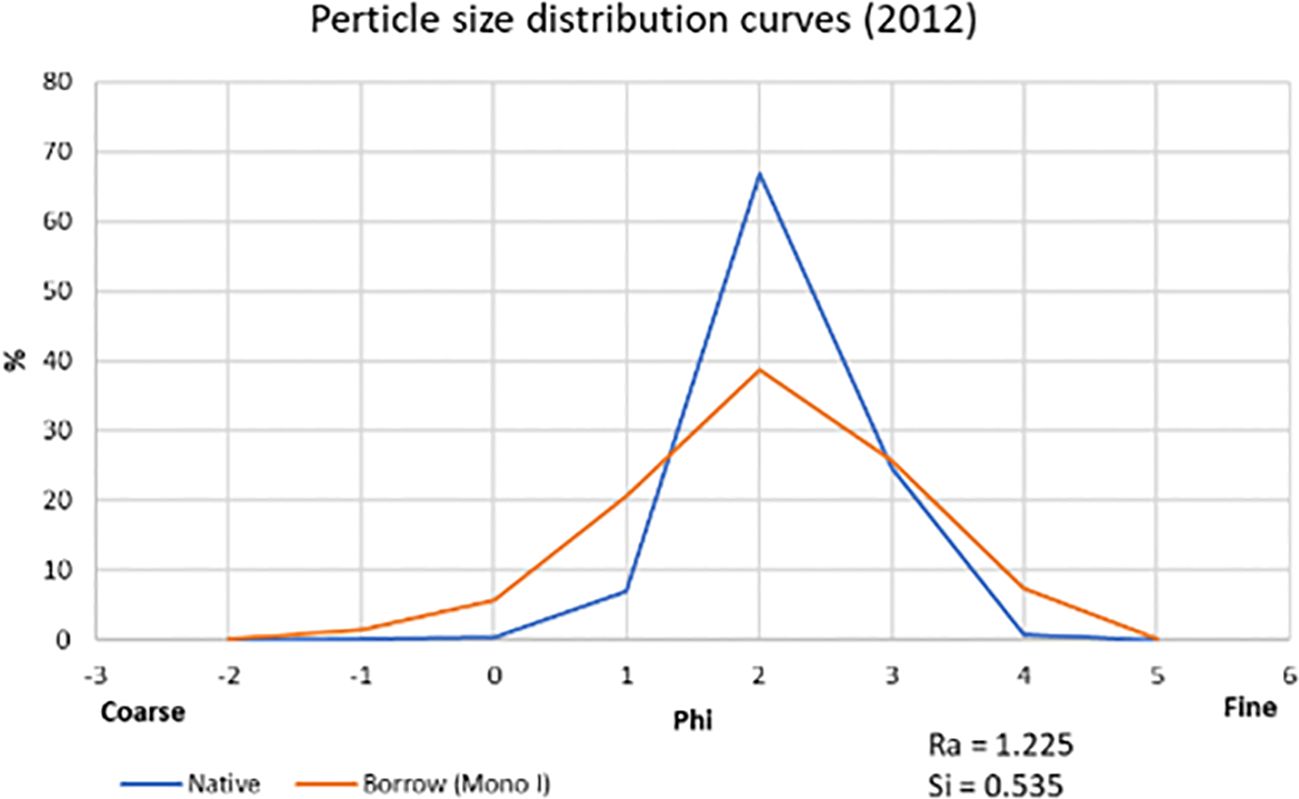
Figure 13. Overlapping of particle size distributions in the 2012 campaign.
3.3 Case study of Jardines del Rey (Coco and Guillermo Cays)
The tourist destination known as Jardines del Rey is made up of a group of islands or cays that form part of the Sabana-Camagüey archipelago in the central-eastern part of the northern coast of Cuba (Figure 14). Known for its lush nature and beautiful beaches, the latter have not escaped the effects of erosion, necessitating artificial sand nourishment projects in four sections of the sandy coast between 2016 and 2017.
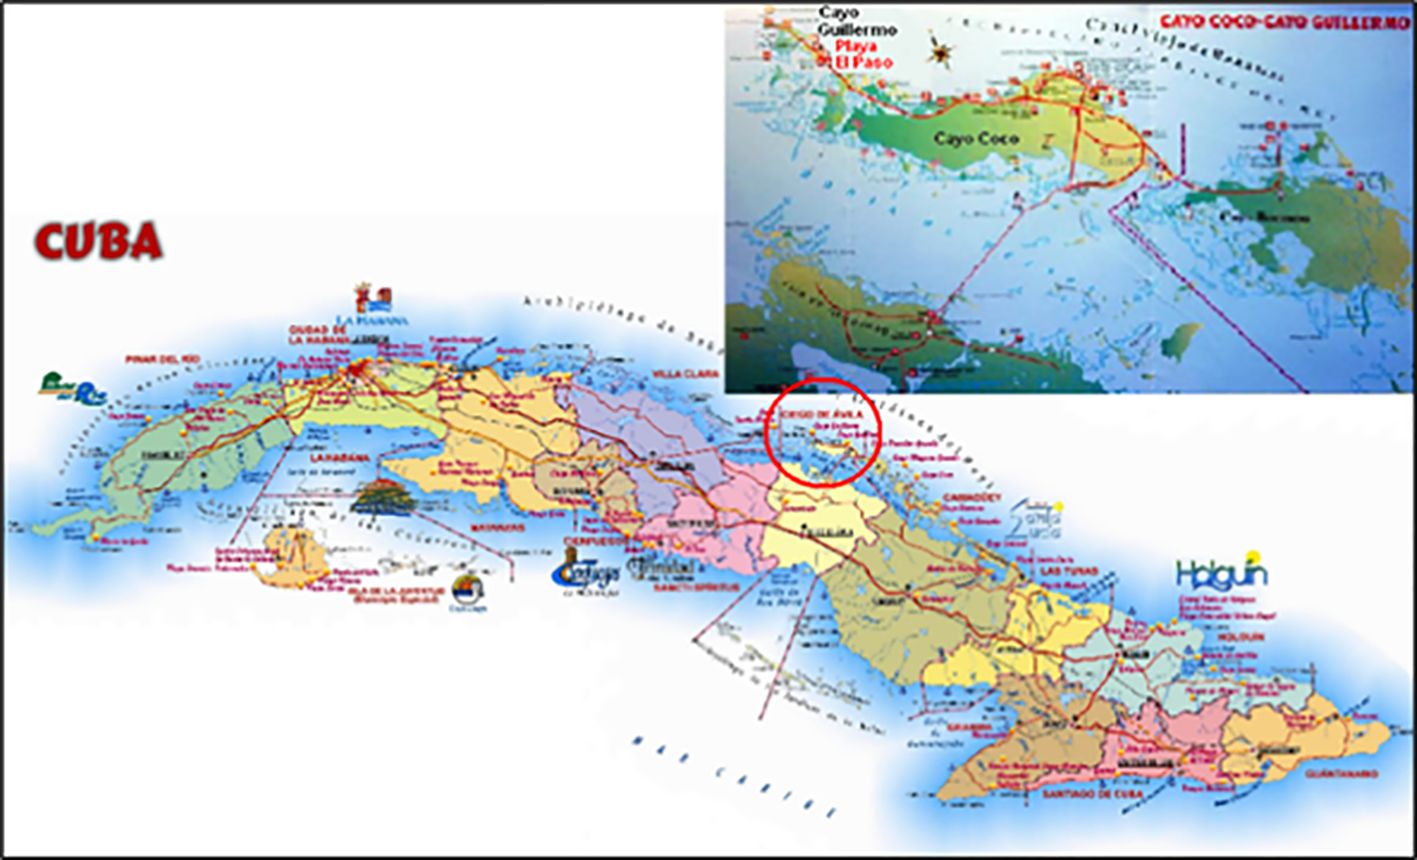
Figure 14. Location of Coco and Guillermo keys in Jardines del Rey.
For the execution of these projects, three borrow zones were defined (La Jaula, Felipe and Felipe 1, the latter being a limited area within its namesake), based on their proximity to each beach and the granulometric characteristics of the sand. Table 3 shows each of the beaches to be regenerated, the borrow zone used, and the volume of input, while Tables 4 and 5 show the granulometric comparison of the standard samples.
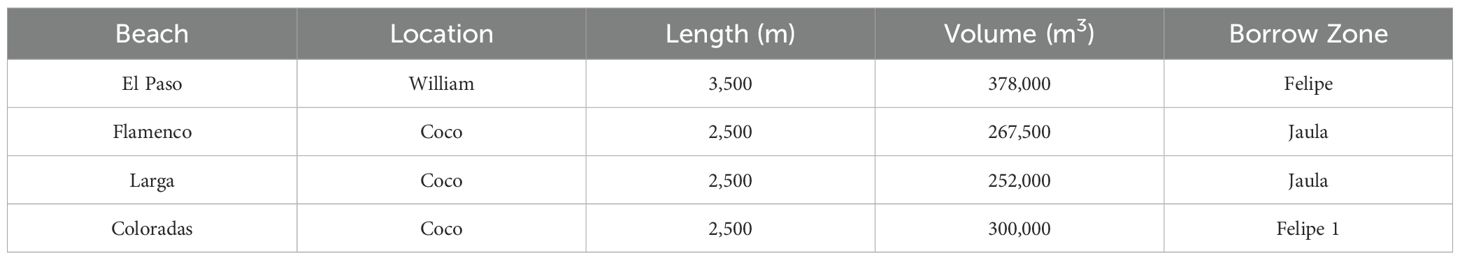
Table 3. Projects executed in Jardines del Rey (Cayos Coco and Guillermo) between 2016 and 2017 (Izquierdo et al., 2014).

Table 4. Granulometry distribution of typical samples of native and borrow sand on the beaches of El Paso (Cayo Guillermo) and Flamenco (Cayo Coco).
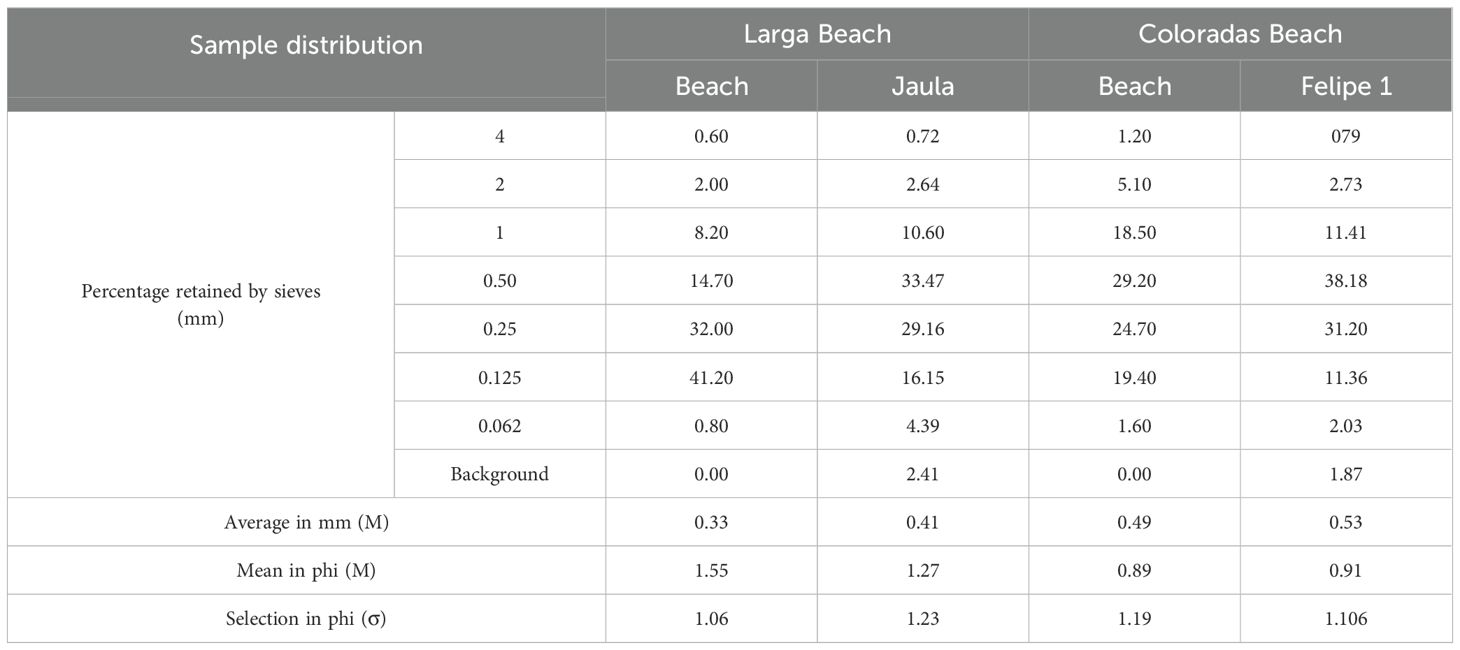
Table 5. Granulometry distribution of the typical samples of native and borrow sand on Larga (Cayo Coco) and Coloradas (Cayo Coco) beaches.
As shown in Tables 4 and 5, the relationship between the granulometric characteristics of the native and borrow sands in all the beaches complies with the recommendation that the introduced material be slightly coarser than the original, with the smallest range observed at Las Coloradas beach. Similarly to the previous case, the stability evaluation was carried out using the method proposed by James (1975), with this analysis being repeated through the calculation of the Stability Index Si proposed by Pranzini (2002). The results are presented in Table 6.As expected, the overfill factor Ra is found to be 1 or very close to 1 for El Paso, Larga, and Flamenco beaches, although the latter two indicate the need to provide an additional volume of 2,675 m3 and 12,000 m3, respectively, to the design. However, when calculating the Stability Index Si, high stability values are obtained. It is noteworthy that Flamenco, where a greater increase in fill is recommended, has the highest Si of all. This result highlights the inconsistencies pointed out by James (1975) regarding the calculation method of Ra, which were addressed by Pranzini (2002, 2018) in his new proposal. Pranzini’s method places greater emphasis on the sample distribution and the contribution of each granulometric fraction to stability, independently of the selection coefficient (σ) and the log-normality of the distribution.
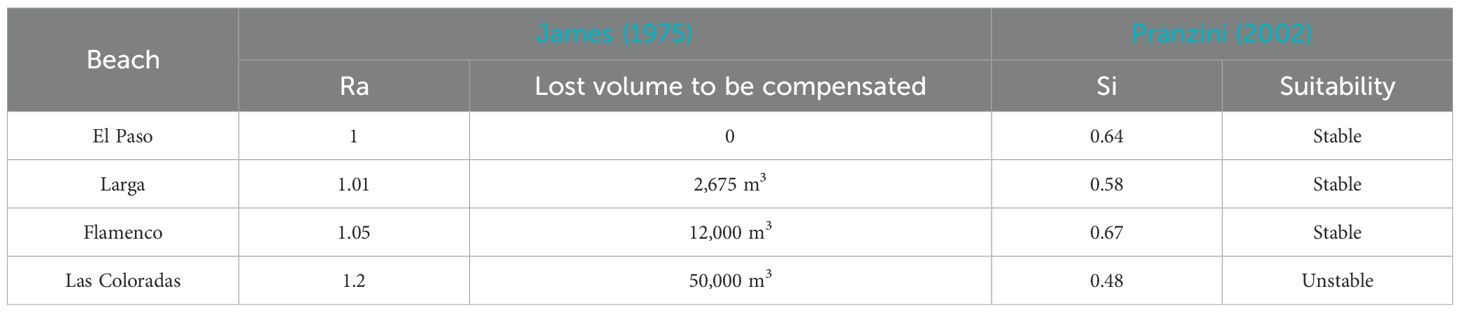
Table 6. Comparison of sand suitability assessment results James (1975) – Pranzini (2002) in the projects carried out in Jardines del Rey, Cuba.
As expected, Las Coloradas has the highest Ra, recommending an increase of 20% (50,000 m³) to the design volume. Meanwhile, the Si value is below the 0.5 threshold that defines sands as identical, so a higher erosion rate in the fill is expected compared to what was occurring on the beach before artificial nourishment. This is an important factor for planning future maintenance campaigns and for identifying the need to locate a new borrow zone that allows for greater stability. For a better understanding of the compatibility of the sands and the degree of overlap between them, Figures 15–18 are presented.
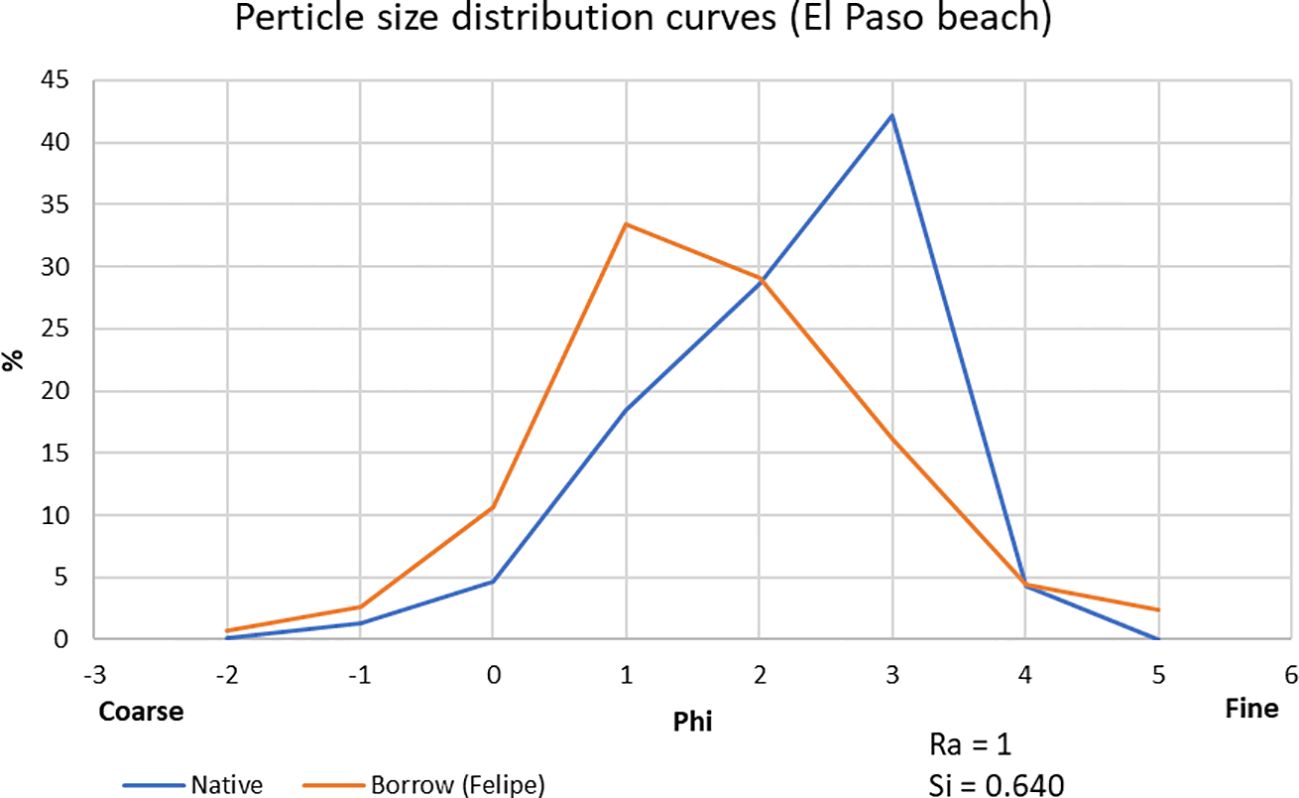
Figure 15. Overlapping of particle size distributions in the native sand of El Paso Beach and the Felipe borrow zone.
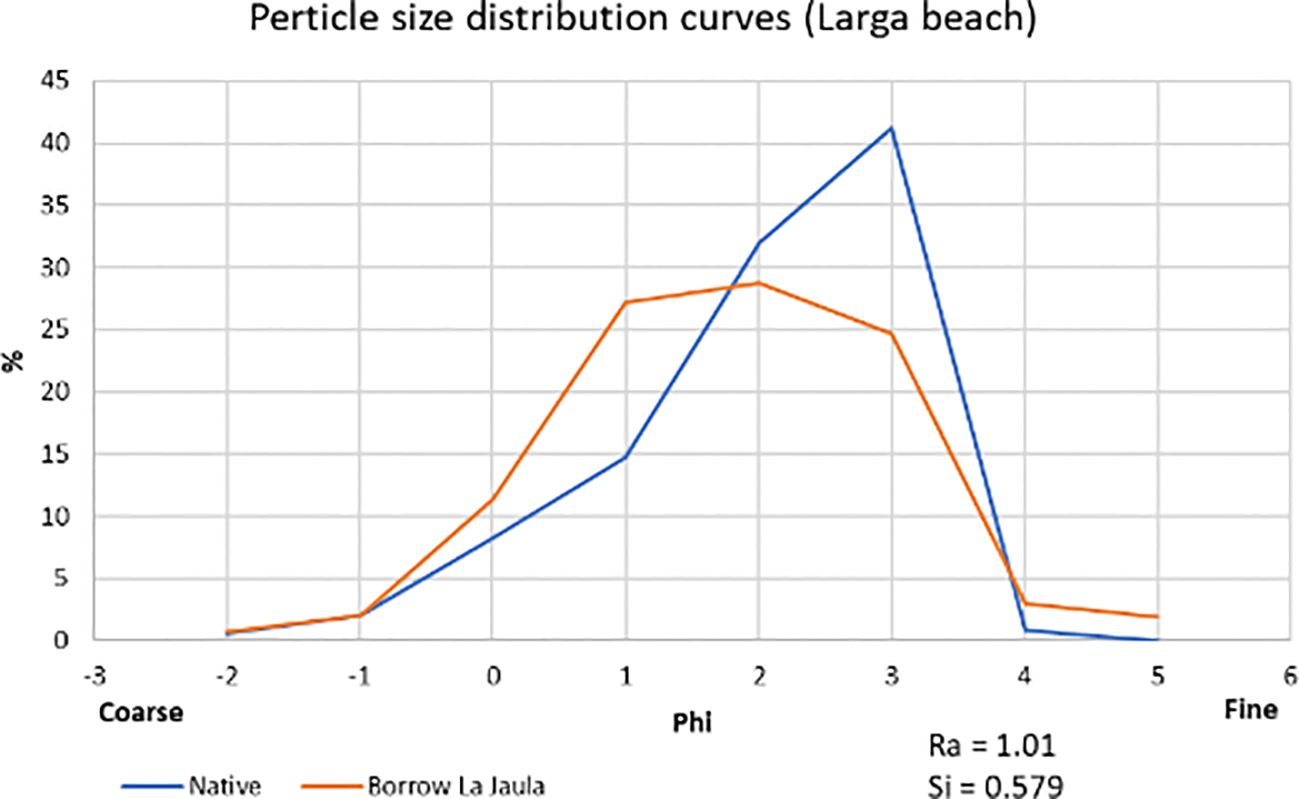
Figure 16. Overlapping of particle size distributions in the native sand of Playa Larga and the La Jaula borrow zone.
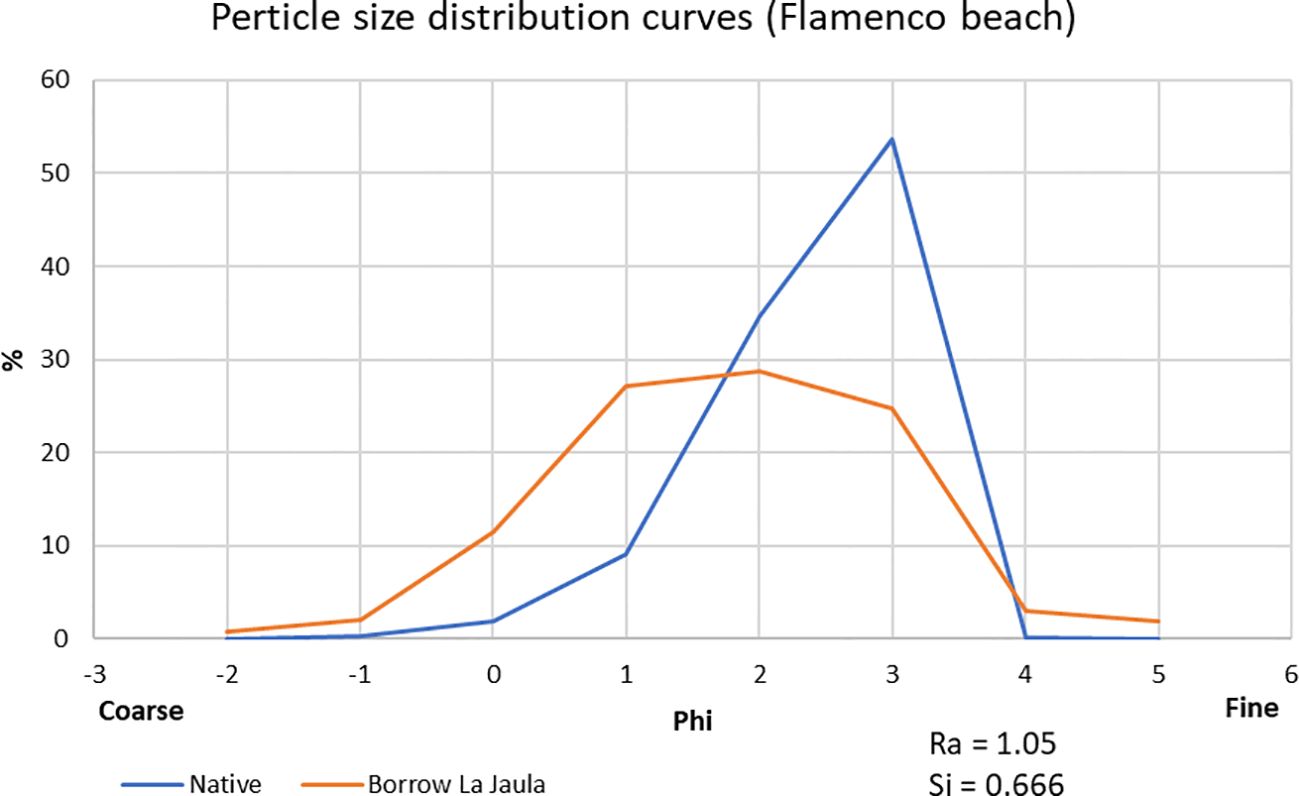
Figure 17. Overlapping of the granulometric distributions in the native sand of Playa Flamenco and La Jaula borrow zone.
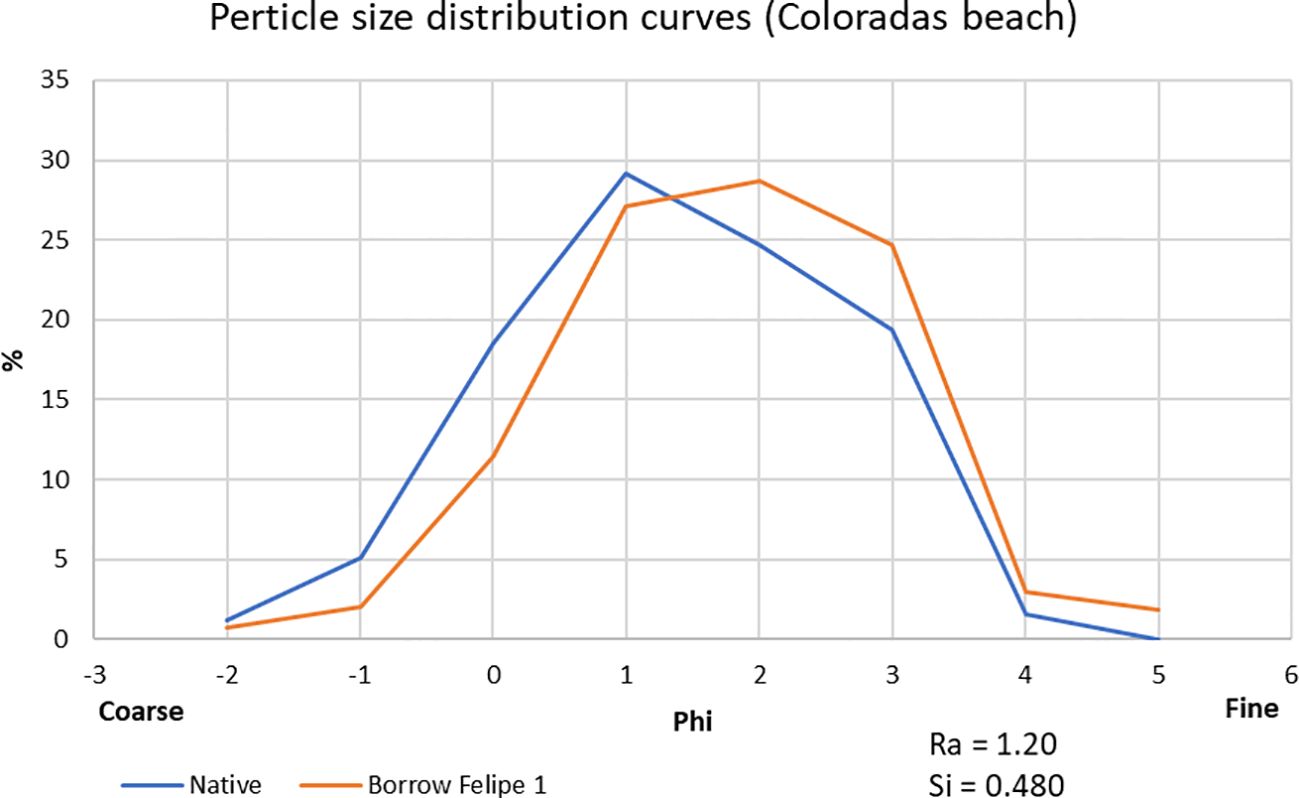
Figure 18. Overlapping of particle size distributions in the native sand of Las Coloradas beach and the Felipe 1 borrow zone.
It is striking, in the case of Las Coloradas beach, that the Ra value is very similar to that obtained for the 2012 campaign at Punta Hicacos, Varadero; however, the Si value is totally different, although not very far from each other. This result confirms the importance that Pranzini (2002) attributes to the contribution of each granulometric fraction, allowing a more accurate suitability analysis to be carried out without the need to hypothesize the log-normality of the sediment distribution, while allowing the evaluation and differentiation of materials that classical methods discard or classify within the same range.
3.4 Case study of Cayo Santa María
Cayo Santa María is located to the west of the Sabana-Camagüey Archipelago, in the province of Villa Clara, in the north of the island of Cuba (Figure 19). This small island, also home to attractive beaches and extensive areas of natural beauty, has recently seen the development of a new sun-and-sand tourist destination. However, as is the trend for Cuban beaches and the Caribbean in general, the effects of erosion have become evident in recent years, necessitating intervention with engineering measures, especially artificial sand nourishment, which, together with proper coastal management and urbanization, guarantees its quality.
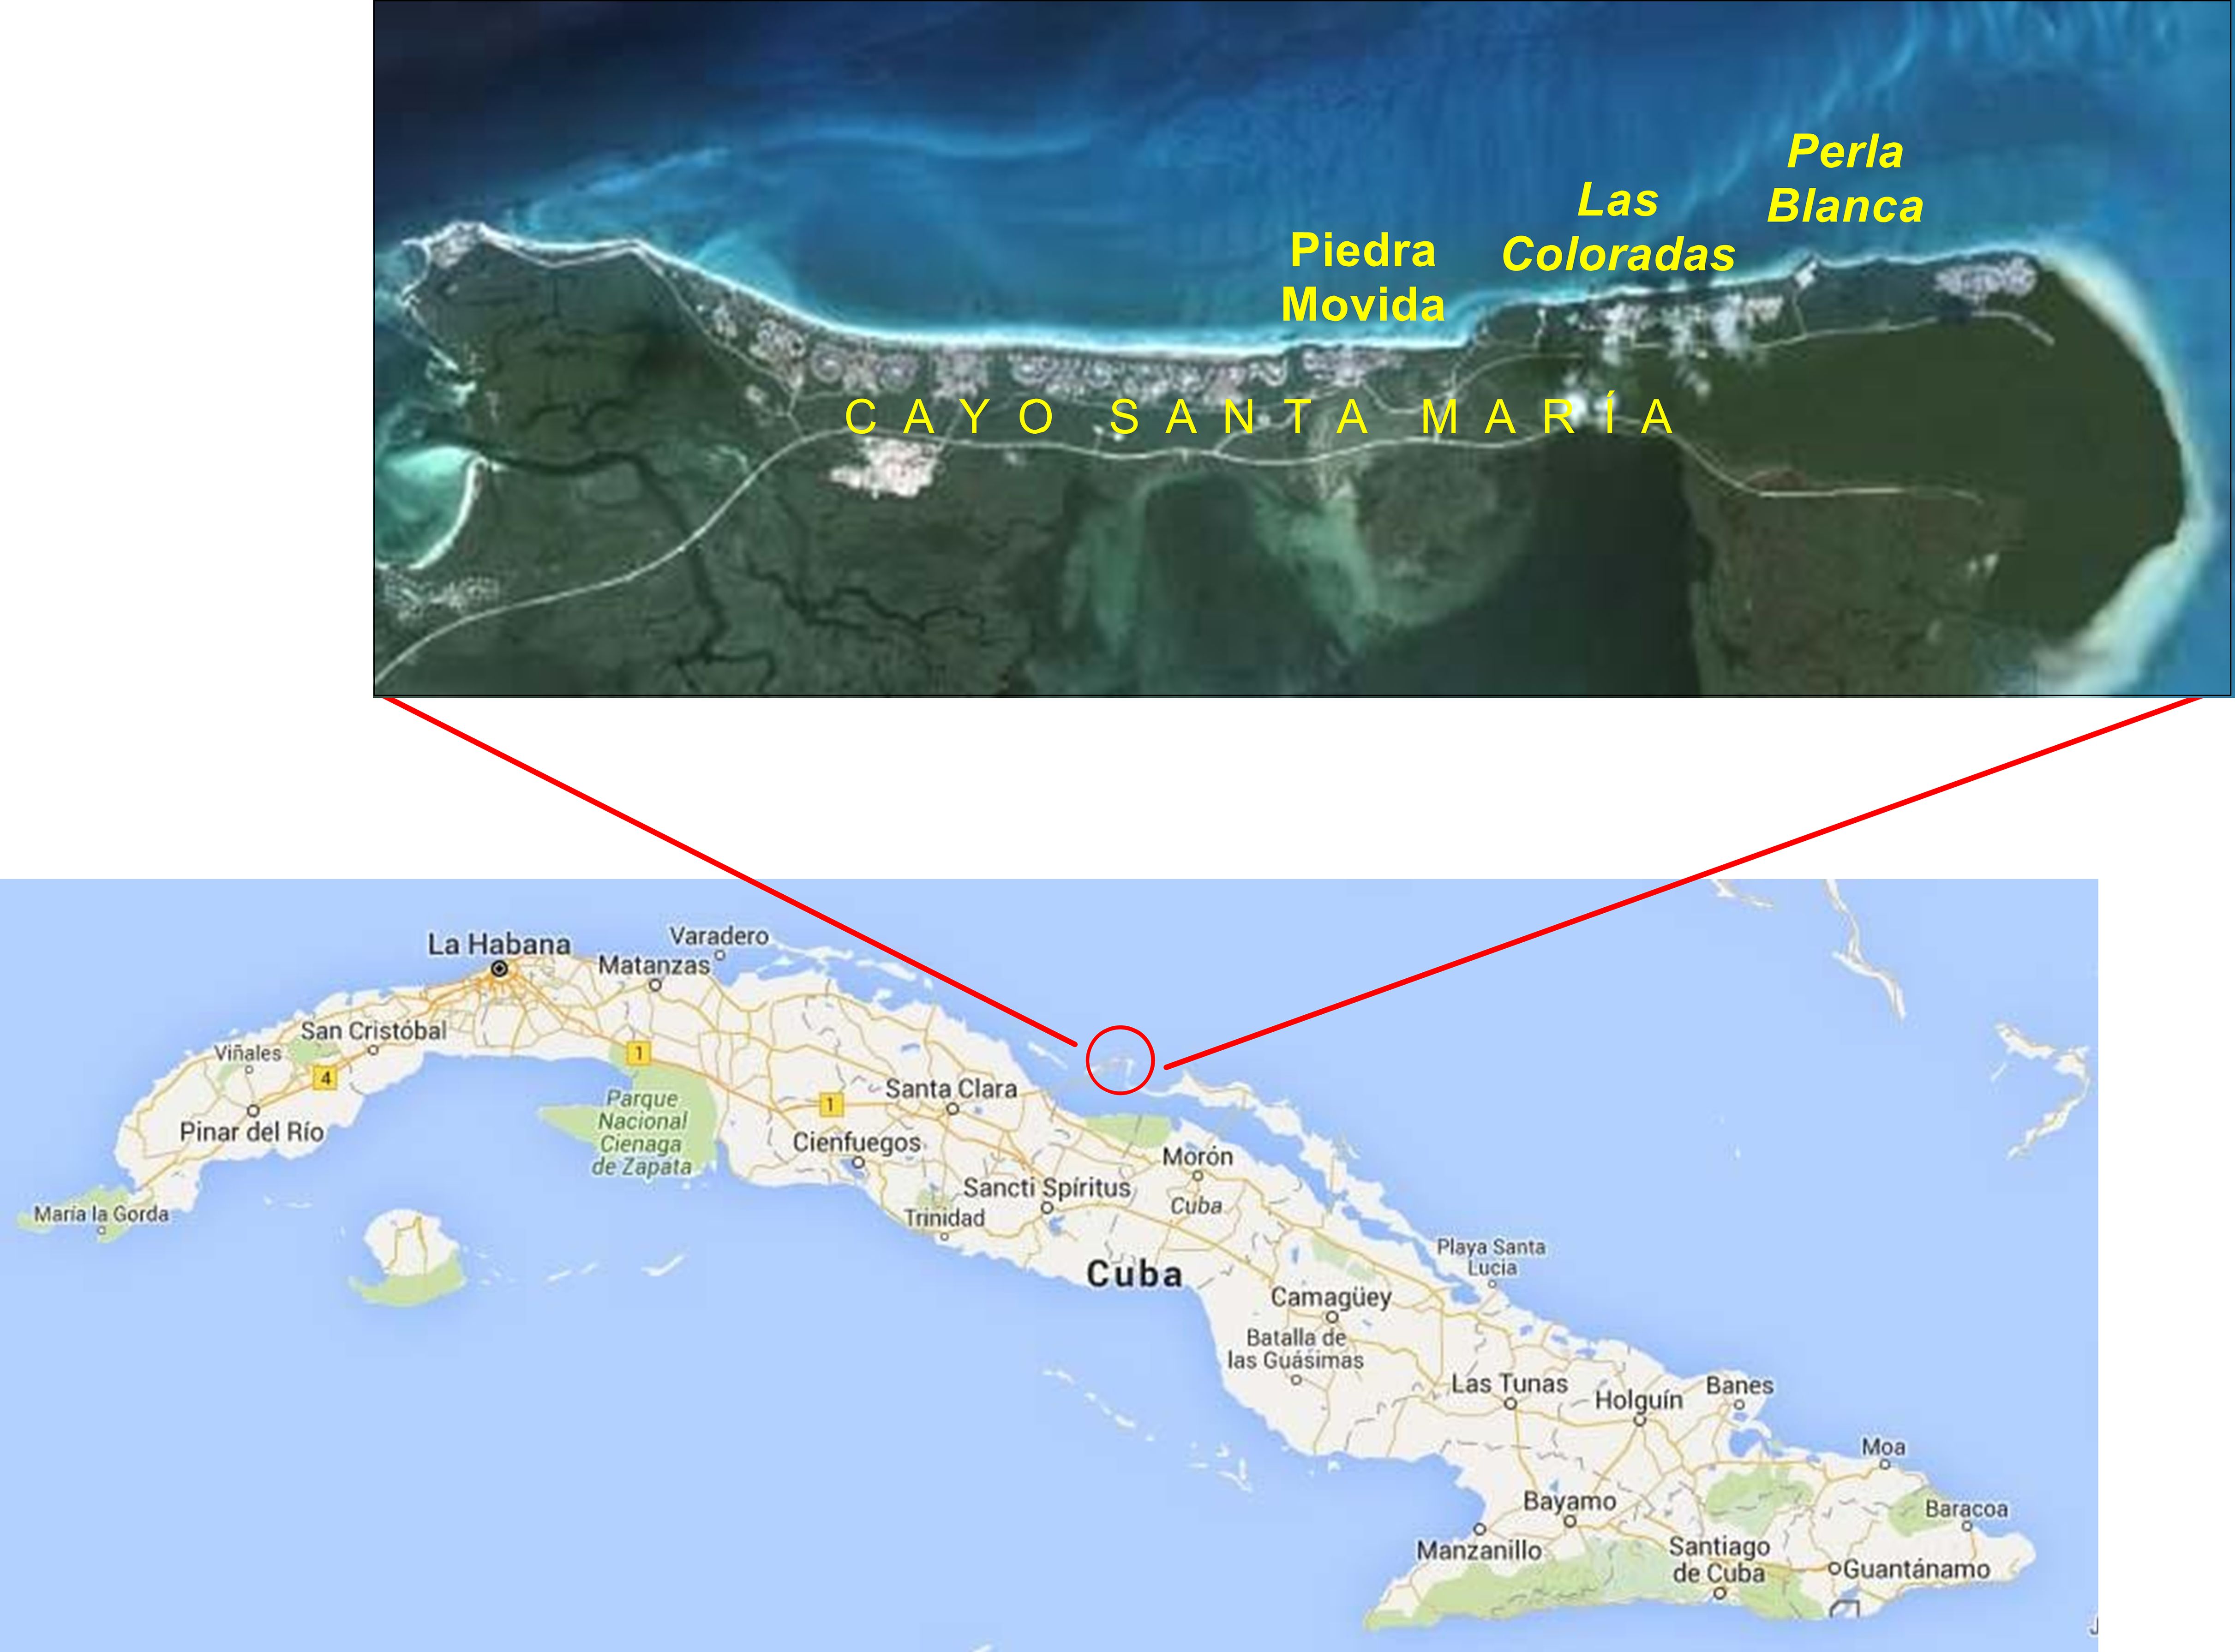
Figure 19. Location of Cayo Santa María.
During 2016, the necessary studies and work were carried out for the development of projects executed in 2017 across three beach sectors, using the same borrow zones known as Borracho, because of its proximity to the homonymous cay. Table 7 summarizes the main parameters of the projects, and Table 8 presents a comparison of the granulometric characteristics of the sands.
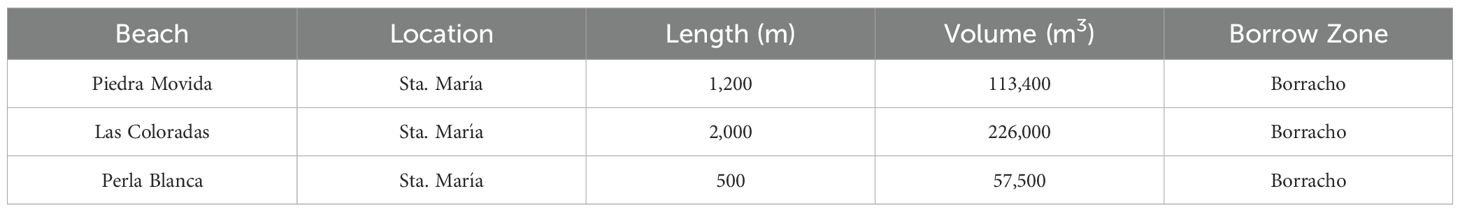
Table 7. Projects executed in the Santa María Keys in 2017 (Peña et al., 2016).
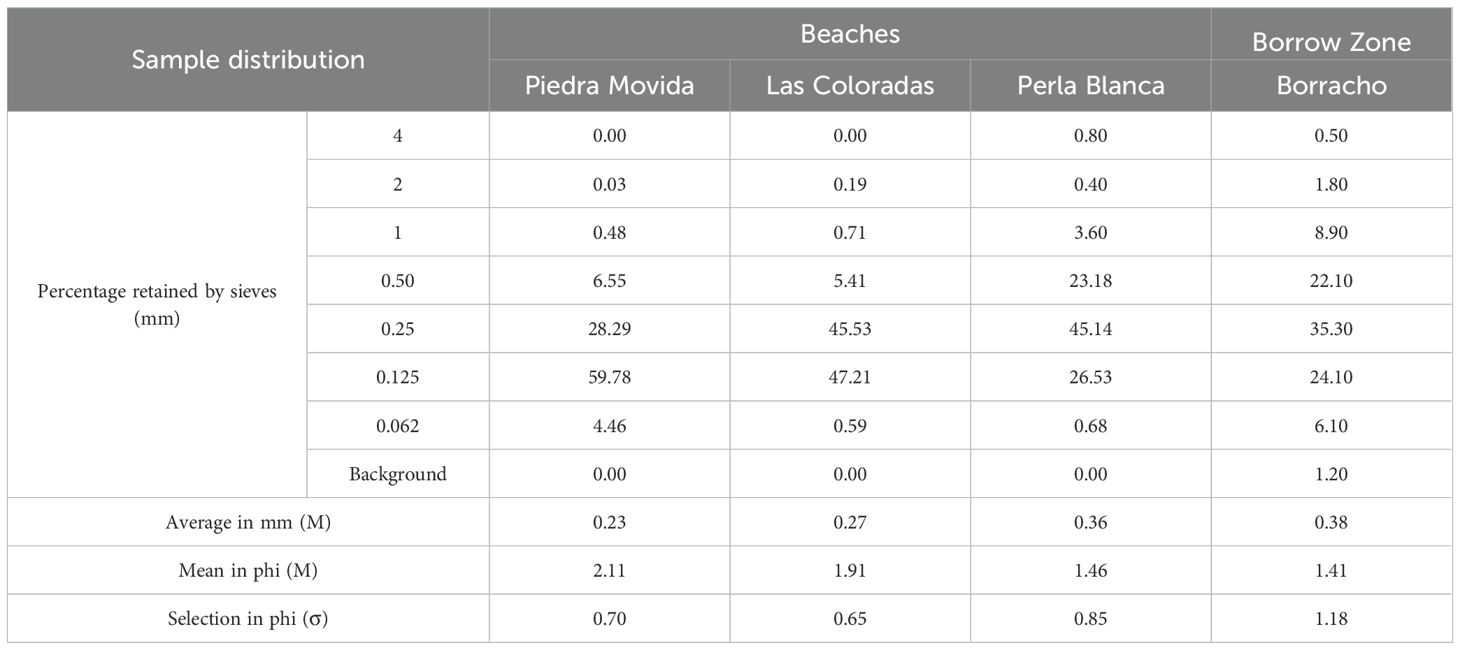
Table 8. Granulometric characteristics of the sample type from the projects executed in 2017 on the Santa María and Las Brujas keys (Peña et al., 2016).
According to the results shown in Table 8, the relationship between the granulometric characteristics of the native and borrow sands in all the beaches complies with the recommendation that the introduced material be slightly coarser than the original, with Perla Blanca showing the smallest difference. As in previous cases, the stability evaluation was carried out using the method proposed by James (1975), and this analysis was repeated using the Stability Index Si calculation proposed by Pranzini (2002). The results are presented in Table 9.In the case of these beaches, the calculation of the Overfill factor Ra is never equal to 1, despite all of them fulfilling the condition of providing coarser sand than the native ones. Particularly striking are the beaches of Piedra Movida and Las Coloradas, which, despite the great difference in sand granulometry, obtain values different from 1, the second of them even being very close to the Ra value of Perla Blanca, which is much closer to that of the borrow zone. These results demonstrate the importance given by the method of James (1975) to the selection coefficient and the log-normality of the sample type, where there are marked differences.
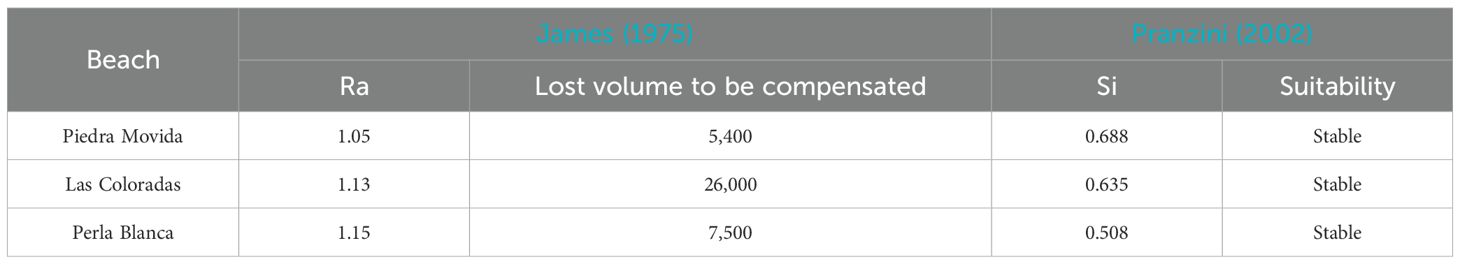
Table 9. Comparison of sand suitability assessment results James (1975) – Pranzini (2002) in the projects carried out in Cayo Santa María, Cuba.
However, when applying the Stability Index Si, it is precisely Piedra Movida and Las Coloradas that obtain the highest stability value, as expected, which would have avoided the incorporation of 5% and 13% respectively of additional sand volumes only in these two beaches and, in their entirety, 9.8% (38,900 m3). Figures 20–22 show the overlap of native and borrow sands, and it can be seen graphically how Si can describe more accurately the compatibility of the sands, since the contribution of the coarsest fractions in Piedra Movida and Las Coloradas is clearly observed.

Figure 20. Overlapping of particle size distributions in the native sand of Piedra Movida beach and the Borracho borrow zone.
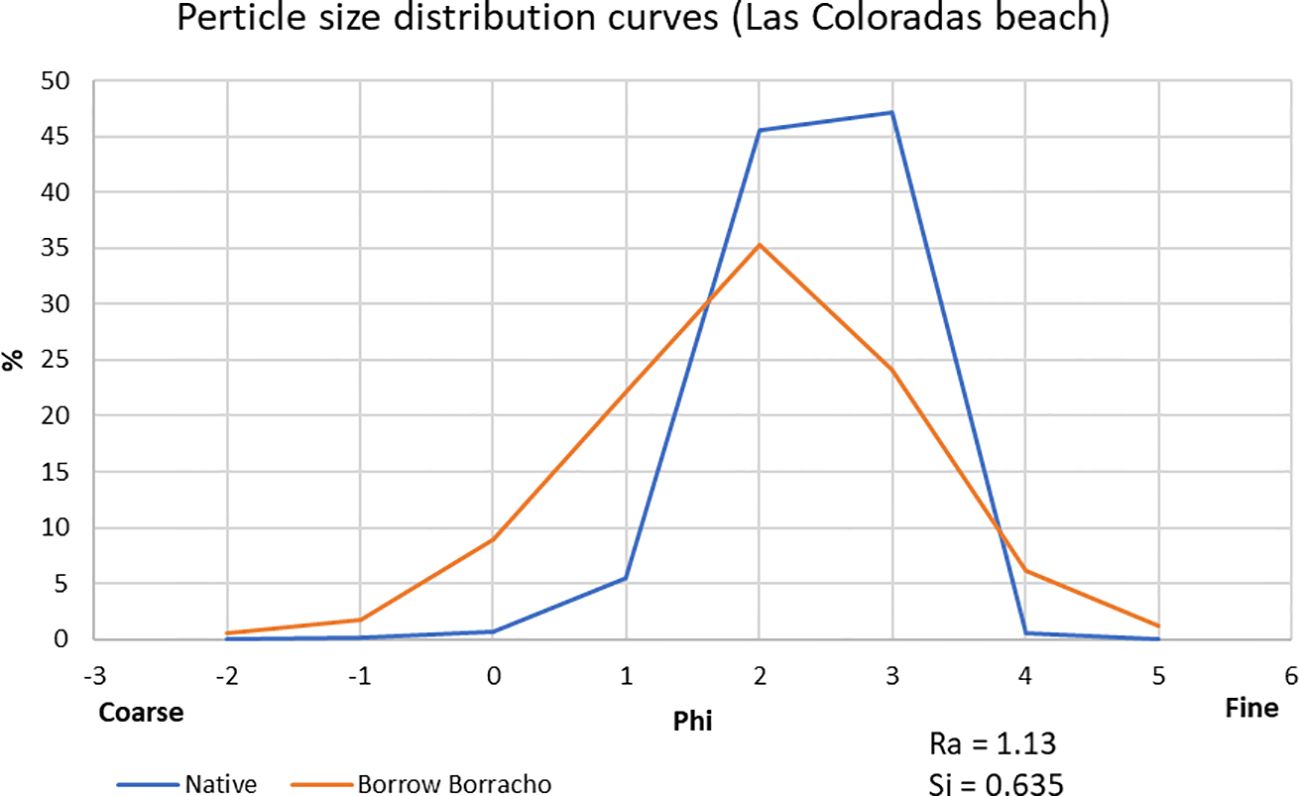
Figure 21. Overlapping of the granulometric distributions in the native sand of Las Coloradas beach (Cayo Santa María) and the Borracho borrow zone.
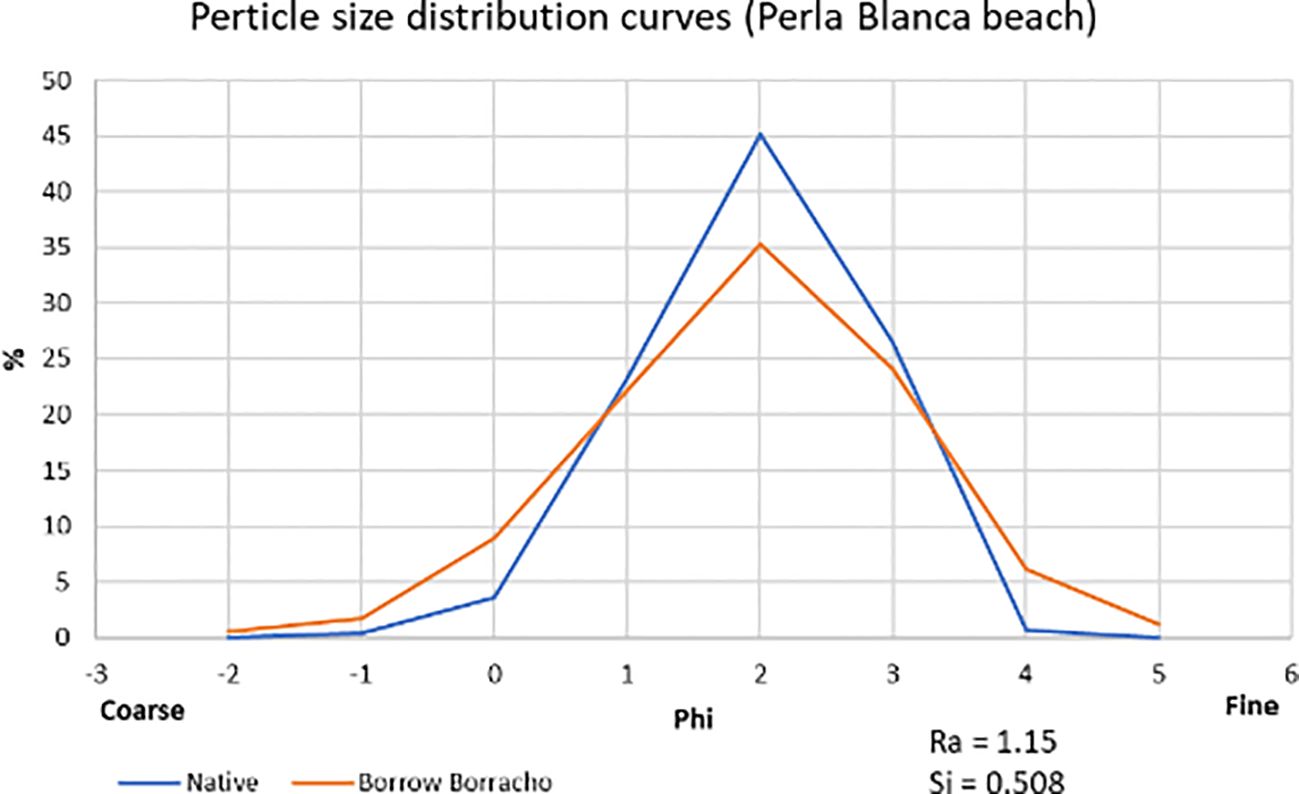
Figure 22. Overlapping of particle size distributions in the native sand of Piedra Movida beach and the Borracho borrow zone.
4 Discussion and conclusion
This article focuses on the calculation of stability based on the grain size difference between native and borrowed sediments, an essential part of beach nourishment projects, which generally receives little attention and the most commonly used methods date back to the 1970s and are often applied inadequately. The final morphology of the beach, its stability, and its dynamic equilibrium depend on various coastal processes, and wave action undoubtedly plays a leading role. However, it is not the aim of the article to analyze these complex processes, which are, indeed, studied in more depth in other research efforts or during the design phase of the projects.
The application of the Stability Index Si and its comparison with the calculation of the Overfill Factor Ra, in projects carried out on Cuban beaches, confirms the conclusions of Pranzini (2002) that it offers greater flexibility when evaluating borrow zones with different characteristics, opening up the range of possibilities.
More realistic and adjusted analysis were obtained, by offering the possibility of not hypothesizing the log-normality of the sediments and giving greater weight to the granulometric distribution in each of its fractions.
In cases like in (Table 6) Las Coloradas beach sand suitability assessment resulted unstable. Practically, on these cases, the use of the Stability Index Si is preferable because it doesn’t overestimate stability like the Overfill Factor Ra might, though it doesn’t improve it either. We recommend identifying an alternative borrow zone or proceed with the nourishment acknowledging that erosion rates may increase.
The possibility of optimizing the use of sand as a mineral resource therefore, directly implies a reduction in environmental impacts and a better use of economic resources, thus contributing to greater efficiency in solutions, bringing them closer to more sustainable and environmentally friendly coastal management practices.
In this sense, the analysis carried out demonstrates that the application of this method contributes to the saving of thousands of cubic meters of sand. Therefore, its inclusion as a working tool and adaptation to the specific conditions of the Caribbean will decisively contribute to achieving the objective of applying sustainable management and engineering measures, something crucial for a region that depends largely on its natural attractions, especially its beaches and coral reefs.
Although further research is needed, this initial approach indicates that its use is feasible in subsequent artificial sand replenishment projects in Cuba and on similar beaches in the Caribbean region with marine-biogenic sands.
The results presented demonstrate inconsistencies in the value of the Overfill Factor Ra, even in samples with a high degree of log-normality, as only the textural characteristics of the sediments are considered and not the specific weight of each fraction in its contribution to stability. This can lead, in some cases, to overestimation of dredging volumes. Therefore, we propose the introduction of the Stability Index Si method in new projects.
In this sense, establishing long-term monitoring programs on the beaches benefiting from this method is an essential tool for confirming its effectiveness. Likewise, the analysis of existing data from past monitoring will provide important results for the final validation of the method.
Its use and subsequent analysis of results on beaches with different sedimentological and morphodynamic characteristics will be an important step in its widespread use. Cuba and the Caribbean boast a wide variety of coastal environments and sandy shores, making it feasible to conduct these studies by incorporating new beach observation and monitoring techniques (drone photogrammetry, tracking cameras, etc.), which, until now, have been used to a limited extent in the region.
The Si method, unlike the Ra method, allows for a clear scale to be established when there are several possible borrow zones to be used, facilitating decision-making and establishing priorities, not only based on the quality and compatibility of the sediments, but also from the practical perspective of execution and available budget. This will improve the precision of the studies and the information available in the database of the Cuban National Office of Mineral Resources, allowing this experience to be generalized to other countries in the region. It also constitutes an important input to be taken into account for the Update of the Association Caribbean States (2024).
Data availability statement
The original contributions presented in the study are included in the article/supplementary material. Further inquiries can be directed to the corresponding author.
Author contributions
AA: Conceptualization, Investigation, Writing – original draft, Data curation. YC: Supervision, Writing – review & editing. JD: Funding acquisition, Writing – review & editing. VC: Writing – original draft, Investigation, Conceptualization, Visualization, Data curation.
Funding
The author(s) declare that financial support was received for the research and/or publication of this article. This research was funded by the Korea Institute of Ocean Science and Technology (PEA0305 and PG54330).
Conflict of interest
The authors declare that the research was conducted in the absence of any commercial or financial relationships that could be construed as a potential conflict of interest.
Generative AI statement
The author(s) declare that Generative AI was used in the creation of this manuscript. AI was used only for translation and English editing. AI was NOT used to generate/create any content of this manuscript.
Any alternative text (alt text) provided alongside figures in this article has been generated by Frontiers with the support of artificial intelligence and reasonable efforts have been made to ensure accuracy, including review by the authors wherever possible. If you identify any issues, please contact us.
Publisher’s note
All claims expressed in this article are solely those of the authors and do not necessarily represent those of their affiliated organizations, or those of the publisher, the editors and the reviewers. Any product that may be evaluated in this article, or claim that may be made by its manufacturer, is not guaranteed or endorsed by the publisher.
References
Association Caribbean States (2024). Guide for the Protection and Rehabilitation of the Beaches of the Greater Caribbean (Trinidad, West Indies: ACS Secretariat. 5–7 Sweet Briar Road, Saint Clair, Port of Spain).
Avello O., Ionin A., Medvediev V., and Pavlidis Y. (1973). Geomorphological and sedimentological study of the Hicacos Peninsula, northern coast of Cuba (Havana, Cuba: Institute of Oceanology).
Bitan M., Galili E., Spanier E., and Zviely D. (2020). Beach Nourishment alternatives for mitigating erosion of ancient coastal sites on the mediterranean coast of Israel. J. Mar. Sci. Eng. 8, 509. doi: 10.3390/jmse8070509
Caballero V. and Izquierdo M. (2012). Report on the results of the project: “Beach nourishment, Varadero 2012” (Havana, Cuba: Institute of Oceanology).
Caballero V., Tristá E., Guerra R., and Hernández K. (2004). Report on the results of the project: “Beach recovery in the Las Calaveras – Punta Molas sector, Varadero (Havana, Cuba: Institute of Oceanology).
Dean R. G. (1974). “Compatibility of borrow material for beach fill,” in Proceedings, 14th International Conference on Coastal Engineering, ASCE, New York, NY. 1319–1333.
EM 1110-2–1100 Part V (2001). Beach Fill Design (Washington, DC: Department of the US Army Corps of Engineers), 20314–21000.
García Hernández C. (2005). Particularities of erosion control on biogenic beaches. The case of Varadero Beach. Faculty of Geography, Havana.
Hobson R. D. (1977). Review of design elements for beach fill evaluation (Fort Belvoir: US Army Corps of Engineers).
Inman D. L. (1952). Measurements for describing the size distribution of sediments. Journ.Sedim. Petrol 22, 125–144.
Ionin A. S., Pavlidis Y., and Avello S. (1972). Coastal relief and bottom sediments of the northern coast of Cuba in the Sabana-Camagüey Archipelago region. Oceanological Ser. 12.
Izquierdo M. (2004). Estudio de la dinámica litoral de la playa de Varadero (España: Tesina de Maestría. Departamento de Ciencias y Técnicas del Agua, Universidad de Cantabria).
Izquierdo M., Núñez C., Caballero V., González R., Hernández K., and Tristá E. (2014). Executive Project: “Executive Project: Beach Nourishment, Jardines del Rey” (Havana, Cuba: GAMMA SA Investments).
James W. R. (1974). “Borrow material texture and beach fill stability,” in Proceedings, 14th International Conference on Coastal Engineering, ASCE, New York, NY. 1334–1344.
James W. R. (1975). Techniques in evaluating suitability of borrowing material for beach nourishment (Fort Belvoir, Virginia: US Army Corps of Engineers).
Juanes J. L. (1996). Beach erosion in Cuba. Alternatives for its control. University of Havana, Havana, Cuba.
Krumbein W. C. (1957). A Method for Specification of Sand for Beach Fills (Washington, DC: US Army Corps of Engineers, Beach Erosion Board).
Krumbein W. C. and James W. R. (1965). A lognormal size distribution model for estimating stability of beach fill material. Vicksburg, MS: U.S. Army Engineer Waterways Experiment Station, Coastal Engineering Research Center, Technical Memorandum No. 16.
Medvediev V. S. (1982). Morpho- and lithodynamic peculiarities of tropical coastal zones. J. Geomorphology Lithology Lithodynamics. Havana, Cuba: University of Havana. p. 33–46.
Medvediev V. S. and Juanes J. L. (1981). Morpholithodynamic investigations in the coastal zone and the northern coastal platform of Cuba. J. Continental Insular Platforms. Havana, Cuba: University of Havana. p. 229–250.
National Research Council (1995). Beach Nutrition and Protection (Washington, DC: National Academy Press).
Pavlidis Y., Ionin A. S., and Avello O. (1977). Geology of the Cuban Platform (Nauka Publishing House, USSR).
Peña L. I., Hernández K., Tristá E., García M., Rodriguez E., Rodriguez A., et al. (2016). Executive Project: “Beach Recovery in Cayos Santa María and Las Brujas” (Havana, Cuba: GAMMA SA Investments).
Petelín V. M. (1967). Granulometric analysis of marine sediments (Nauka, Moscow: American Society of Civil Engineers (ASCE)), 76.
Pranzini E. (2002). Probabilistic approach to the evaluation of borrow sediment's suitability for beach nutrition. Beach management in the Mediterranean & Black Sea. Ed. Ozhan E. (Kusadasy, Turchia: Int. Workshop), 37–48.
Pranzini E., Anfuso G., and Muñoz-Perez J. J. (2018). A probabilistic approach to borrow sediment selection in beach nutrition projects. Coast. Eng. 139, 32–35. doi: 10.1016/j.coastaleng.2018.05.001
Pranzini E., Anfuso G., and Muñoz-Perez J. J. (2024). Paper summary. James's abacus problems and an alternative solution. XVII Spanish Conf. Coast. Port Engineering Ibiza 2024.
Pranzini E., Cinelli I., Cipriani L. E., and Anfuso G. (2020). An integrated coastal sediment management plan: the example of the tuscany region (Italy). J. Mar. Sci. Eng. 8, 33. doi: 10.3390/jmse8010033
Ramírez E. (1989). Geomorphological Characterization of the Northern Coast (Havana-Matanzas). Havana, Cuba: Institute of Oceanology.
Sánchez-Bellón Á., Molina-Piernas E., Anfuso G., Asensio-Montesinos F., Cabrera-Hernández J. A., Botero C. M., et al. (2025). Textural, Mineralogical Beach sediments of Cuba: management implications. J. Mar. Sci. Eng. 13, 557. doi: 10.3390/jmse13030557
Tristá Barrera E. (2002). Evaluation of erosion processes on inland beaches in Cuba. Faculty of Geography, Havana.
US Army Corps of Engineers (1984). Shore Protection Manual (Washington, D.C: Volume I and II. Department of the Corps of Engineers, US Army).
Keywords: beach regeneration, artificial sand nourishment, sand suitability, stability index, critical ratio, borrow zones
Citation: Acedo AC, Do JD, Caballero Camejo V and Chang YS (2025) Application of the stability index in artificial sand nourishment projects in Cuba. Front. Mar. Sci. 12:1687163. doi: 10.3389/fmars.2025.1687163
Received: 16 August 2025; Accepted: 25 September 2025;
Published: 14 October 2025.
Edited by:
Juan Jose Munoz-Perez, University of Cádiz, SpainReviewed by:
Junliang Gao, Jiangsu University of Science and Technology, ChinaEnzo Pranzini, University of Florence, Italy
Copyright © 2025 Acedo, Do, Caballero Camejo and Chang. This is an open-access article distributed under the terms of the Creative Commons Attribution License (CC BY). The use, distribution or reproduction in other forums is permitted, provided the original author(s) and the copyright owner(s) are credited and that the original publication in this journal is cited, in accordance with accepted academic practice. No use, distribution or reproduction is permitted which does not comply with these terms.
*Correspondence: Yeon S. Chang, eWVvbnNjaGFuZ0BraW9zdC5hYy5rci4=