Abstract
The marine ecological economy has emerged as one of the most dynamic and promising sectors for economic expansion in coastal nations and regions. Its development is vital for fostering sustained, balanced and resilient economic growth. To enhance the precision of predictions and assessments of the marine eco-economic system, thereby supporting sustainable marine economic development, this study proposes a corrected discrete grey model (CDGM(1,1)) incorporating dynamic adjustment mechanisms. The model is further integrated with the driving force-pressure-state-impact-response (DPSIR) framework to establish a comprehensive forecasting and evaluation methodology. By introducing the concept of “grey effective information” and refining the probability accumulating generation operator (P-AGO), the approach effectively extracts critical information from data sequences. For datasets containing periodic patterns, a discrete GM(1,1) variant based on dynamic local accumulation is employed, allowing for combined forecasting. Finally, with the DPSIR framework and using the TOPSIS method, China’s marine economic data from 2010 to 2026 are analyzed. The prediction accuracy improved by 84% compared with traditional GM(1,1). The results demonstrate not only the effectiveness of marine ecological protection and economic development strategies but also elucidate the synergistic interplay of industrial growth, ecological feedback and policy regulation within the system.
1 Introduction
The ocean is a critical spatial resource underpinning economic and societal advancement, offering vast opportunities for future development. The high-quality growth of the marine economy is pivotal for optimizing terrestrial spatial structures, fostering emerging productive capacities and contributing to the formation of a modern development paradigm. Currently, the marine economy is experiencing unprecedented opportunities, with entire industrial chains spanning deep-sea energy exploration to offshore fisheries, expanding rapidly to become major drivers of sustainable economic growth. In the context of global carbon-emission reduction, accurately identifying the key determinants of marine economic growth, as well as forecasting and evaluating its developmental trajectory, has become central to achieving integrated land-sea governance (Sun et al., 2022; Mao et al., 2023; Xu et al., 2025a). The formulation of robust and scientifically rigorous prediction and evaluation models is therefore essential for monitoring and forecasting the dynamic evolution of marine ecological and economic systems, thereby ensuring the long-term sustainability of ocean-based development.
Several challenges hinder the development of an evaluation framework for the marine ecological-economic system. These include: (1) Mechanistic ambiguity – the evolution of the marine environment arises from the coupled interactions of physical, chemical and biological processes, which traditional black box models struggle to represent in terms of ecological mechanisms; (2) Dynamic adaptability – abrupt system changes driven by climate variability and anthropogenic activities, such as recurrent red tides, outbreaks, and demand models capable of real-time adjustment. Current research has yet to establish a unified framework that integrates data-driven methods with mechanistic analysis, resulting in a threefold bottleneck: inaccurate predictions from small datasets, poor interpretability of complex relationships, and delayed responses to dynamic disturbances.
Existing predictive assessments of the marine ecological–economic system predominantly rely on traditional statistical models, machine learning algorithms and classical grey models (Cai et al., 2023; Tao et al., 2021; Wang et al., 2023). However, these approaches are constrained when addressing the marine environment’s distinctive features, small samples, high noise and strong dynamics. Statistical models are limited by linearity assumptions and inadequate adaptability to dynamic change, making them ill-suited to capture the system’s nonlinear coupling relationships (Germano, 1999). While machine learning models perform well with large datasets, they exhibit poor generalization under small-sample conditions (Zhang et al., 2021) and suffer from black-box opacity, which detaches them from their underlying mechanisms (Yan et al., 2022). The static accumulation operator in classical grey models is unable to effectively extract relevant information from limited data or capture multifactor coupling (Yin and Zeng, 2022). Furthermore, most existing studies lack an integrated modelling framework encompassing the complete DPSIR chain, thereby limiting the ability to analyze the co-evolutionary dynamics of the marine ecological economy from a holistic perspective (Nielsen et al., 2018).
Given the characteristics of marine environmental data, namely small sample sizes, pronounced heterogeneity and multi-mechanism coupling, this study proposes a dynamically corrected discrete GM(1,1) model (CDGM(1,1)). It develops a comprehensive prediction–evaluation framework that integrates the DPSIR and CDGM (1,1) theoretical models (Patrício et al., 2016; Li X. et al., 2023). First, the model extracts the grey effective information from core indicators using a discrete GM(1, 1) model based on probability accumulation (PDGM(1,1)). The probability accumulation operator (P-AGO) is enhanced by incorporating dynamic parameters and the RLinear model to address operator degradation (Zhou et al., 2023; Li Z. et al., 2023). In addition, it is combined with the discrete GM(1,1) model based on dynamic local accumulation generation (DPDGM(1,1)) for hybrid prediction, thereby improving accuracy through a trend modelling-residual fusion mechanism. The experimental results demonstrate that the proposed method achieves high predictive performance. Furthermore, the study examines the strengths and weaknesses of current marine economic development by forecasting the future marine economic and proposes strategic priorities for future growth and development.
The principal contributions of this study are as follows:
-
For the marine economic system, key factors across the chain, from driving forces to societal responses, are identified, such as the marine circular gain industry and marine fishing output. Development priorities and strategic directions for the marine economy are analyzed and forecasted.
-
The PDGM(1,1) model is enhanced through the introduction of dynamic parameters, leading to the formulation of the CDGM(1,1) model. Its integration with the DPSIR framework addresses the limitations of conventional approaches in capturing complex interrelationships. The predictive outputs not only reflect the system’s dynamic evolution but also offer clear policy interpretability, thereby providing an effective solution to the challenges of “small data” and “interpretability” in marine environmental forecasting.
The rest of this paper is organized as follows: Section 2 reviews research on marine ecological and economic evaluation. Section 3 introduces the marine ecological economic evaluation model. Section 4 analyzes the applicability and effectiveness of the model using examples. Section 5 presents predicted results and offers management recommendations for the future marine ecological economy. Section 6 concludes the article and suggests directions for future research.
2 Literature review
In recent years, the intensification of global climate change and the escalating frequency of human marine activities have drawn increasing international concern regarding marine environmental issues. Phenomena such as ocean acidification, pollution and ecological degradation have repeatedly prompted academic debate (Xu et al., 2025b, 2025). Research has progressively shifted from focusing on individual pollutants and complex systems to describing dynamic trends, rather than static conditions (Benavides et al., 2022). Against this backdrop, the development of predictive models tailored to the unique features of the marine environment has become a critical step towards addressing modelling challenges associated with small datasets and high uncertainty.
Early research in marine environment prediction predominantly relied on traditional statistical approaches, including time series analysis and regression models. However, these methods are inadequate for handling non-linear and non-stationary data. Recent advances in machine learning and deep learning have revitalized the field. Wen et al. (2020) developed a data-driven time series prediction network to address the complex, dynamic characteristics of large-scale marine environmental datasets. By incorporating spatiotemporal correlation features and a fuzzy logic mechanism, their long-term surface water temperature prediction errors in the South China Sea were reduced by 12%, offering a refined tool for simulating ocean current dynamics and issuing more accurate extreme weather warnings. Using multi-source data from marine buoys and satellite remote sensing, they constructed a training set that demonstrated a strong representational capacity of deep learning in modelling high-dimensional spatiotemporal data. Deng et al. (2021) tackled the challenge of offshore water quality prediction by enhancing artificial neural network (ANN) and support vector machine (SVM) algorithms. Introducing an attention mechanism to dynamically optimize the weighting of water quality features, their approach improves COD concentration prediction accuracy by 8% in monitoring the Pearl River Estuary. The outcomes were applied directly to red tide early warning systems, enabling real-time decision support for coastal ecological management. Considerable progress was also reported by Ham et al. (2019) in forecasting El Niño events. They designed a deep learning architecture that integrates convolutional neural networks (CNNs) with long short-term memory networks (LSTMs) to capture the spatiotemporal propagation of sea surface temperature anomalies, achieving a six-month lead-time prediction accuracy of 78%, 23% points higher than conventional statistical models.
Although machine learning and deep learning have demonstrated notable success in predicting marine environments, the present study focuses on forecasting and assessing the sustainable development of the marine ecological economy. Small sample sizes, high noise levels and strong dynamics often characterize marine environmental datasets. Deep learning methods, such as the time series prediction network proposed by Wen et al. (2020), typically require large-scale labelled datasets and exhibit poor generalization in small-sample contexts, such as polar ocean monitoring or deep-sea ecological surveys. Consequently, in data-scarce regions, these models fail to deliver reliable predictions and cannot adequately support local marine ecological and economic development.
Regarding model interpretability and cross-regional adaptability, Deng et al. (2021) proposed an enhanced machine learning model; however, the persistent “black-box” dilemma remains unresolved. The logic of underpinning the weight allocation in the attention mechanism cannot be effectively linked to the physical processes governing water quality evolution. At the same time, the adaptation cost in cross-regional applications remains high. Consequently, rapid deployment across diverse marine environments is hindered, limiting the model’s ability to meet the varied requirements of predictive evaluation for global marine ecological and economic sustainability. Similar constraints have been reported by Akay and Mehmet (2007). From the standpoint of modelling the complex dynamics of the marine environment, although the traditional GM(1, 1) model offers advantages for small-sample datasets (Li et al., 2023), its static accumulation operator fails to capture the intricate dynamics arising from coupling of multiple marine environmental factors (Li X. et al., 2019). In comparison, this study investigates the prediction and evaluation of the sustainable development of the marine ecological-economic system through the CDGM(1,1)-DPSIR model. The analysis is grounded in the DPSIR theoretical framework, employing the dynamically modified discrete GM(1,1) model (CDGM(1,1)) for indicator forecasting. A comprehensive and systematic prediction-evaluation framework is established to provide robust scientific support for promoting sustainable marine ecological and economic development.
Therefore, further research must accurately characterize the interactions and dynamic evolution within marine ecological-economic systems and elucidate the underlying mechanisms of marine environmental change. Moreover, most existing studies address a single process or time point, with few developing an integrated prediction and evaluation framework that encompasses driving forces, environmental pressures, ecological states, impact effects and societal responses. A comprehensive understanding of the marine ecological-economic system, supported by systematic prediction and evaluation, is thus essential for assessing its sustainable development trajectory.
3 Model construction
3.1 Overall model architecture
This study integrates the DPSIR theoretical framework, enhances the PDGM(1, 1) and RLinear models, proposes the CDGM(1, 1) model and develops a full-chain prediction-evaluation system. The system comprises three primary modules (Figure 1):
Figure 1

Overall model system architecture.
-
Indicator collection and processing: Initially, 29 indicators were compiled. Following preprocessing, which included data cleaning, correction and integration, 22 valid indicators were retained.
-
Prediction using the CDGM(1,1) model: The CDGM(1, 1) model refines the P-AGO operator of the PDGM(1, 1) by incorporating dynamic parameters, which are forecast using the RLinear module. This enhancement improves the predictive performance of the PDGM(1, 1). Additionally, the DPDGM(1, 1) model is applied for correction, yielding the final prediction results.
-
Subsystem classification and evaluation, within the DPSIR framework, indicators are categorized into five subsystems: Driving forces (e.g., marine circular economy industries), environmental pressures (e.g., marine fishing output), ecological state (e.g., marine biomedicine industry), impact effects (e.g., frequency of red tide marine events) and societal responses (e.g., marine research, education and management services).
The entropy weight method is employed to determine the indicator weights, followed by the TOPSIS method (Cao et al., 2024) to calculate the annual evaluation scores for each subsystem. These scores are used to quantify dynamic trends and explore interrelationships between subsystems within the DPSIR framework. By combining current state assessments with future scenario forecasts, the study identifies key constraints on sustainable marine development, thereby providing a scientific basis for optimizing management strategies.
The subsequent sections present a detailed description of the construction of the DPSIR model and the CDGM(1, 1) model.
3.2 Prediction method based on CDGM(1, 1)
Given the characteristics of marine environmental data, namely small sample sizes, high noise levels, and pronounced dynamic variability, as well as the limitations of existing methodologies, this study develops a causality-driven grey prediction model, CDGM(1, 1), which integrates the DPSIR framework.
3.2.1 PDGM(1, 1) model based on the probability accumulation generation operator
The grey prediction model GM(1, 1) is widely applied in contexts with limited datasets. Unlike the conventional GM(1, 1) model, the PDGM(1, 1) model, proposed by Yin et al. (2024), employs a probability cumulative generation operator that differentiates between effective and ineffective information within a sequence in probabilistic terms. This feature confers substantial advantages in marine ecological and economic applications where reliable statistical data are scarce.
The procedure for constructing the PDGM(1, 1) model is outlined below.
3.2.1.1 Quantification of grey effective information and probability accumulation operator
The concept of grey effective information refers to behavioral data points that effectively characterize the governing laws of the system’s operation. This is quantified using the whitenisation value of the interval grey number: , where p is the positioning coefficient (), representing the proportion of effective information. The extraction process is modelled as a Bernoulli distribution, with the extraction probability expressed in the form of a Sigmoid function (Equation 1):
Here, denotes the information standard parameter, which determines the threshold for extracting effective information.
The P-AGO screens the grey effective information using a weighted accumulation method to produce a new sequence , calculated as Equation 2:
where is the information difference adjustment parameter, controlling temporal information disparities and enabling the weighting of effective information.
3.2.1.2 Discrete model structure
A discrete model is subsequently developed based on the probability accumulation sequence , as shown in Equation 3:
Estimate the parameters by the least squeares method (Equation 4), and boldface symbols indicate matrices.
The time-response expression is a discrete difference (Equation 5).
Using the time-response equation, the system’s future state can be predicted, providing the basis for subsequent inverse restoration and adjustment of growth rates.
3.2.1.3 Inverse restoration and growth-rate adjustment
The original sequence is restored by the inverse cumulative operator, incorporating the information-extraction weight (Equation 6):
The growth rate depends on a parameter , allows the model to accommodate different data trends.
Figure 2 presents the PDGM(1,1) predictions for marine environmental data, which exhibit pronounced dynamics. The model performs well in the early horizons; however, once the prediction horizon exceeds eight time-steps (e.g., years), its ability to capture fluctuation patterns declines noticeably. Because the P-AGO tends towards an ordinary accumulation operator as it increases, its sensitivity to fluctuations diminishes. In practice, this degradation manifests as reduced predictive accuracy, which is insufficient for complex, highly dynamic environments.
Figure 2
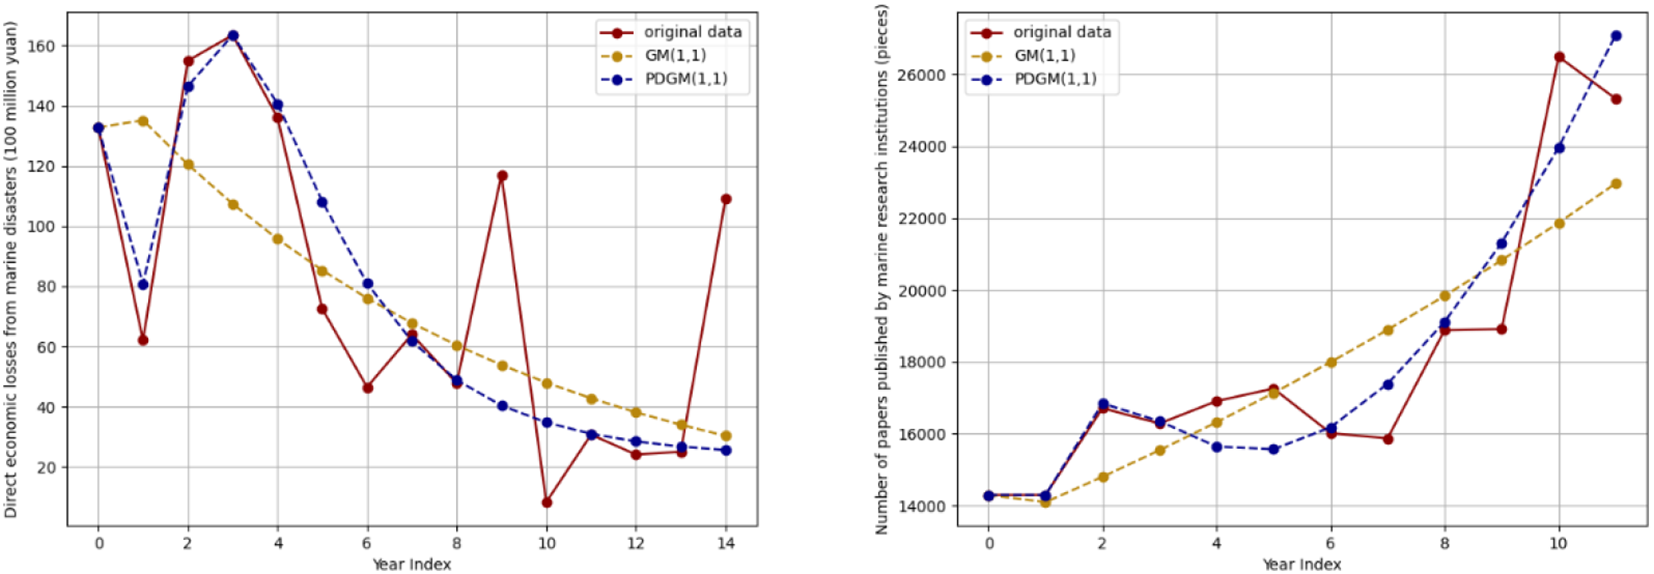
Prediction results of the PDGM(1, 1) model.
To address these limitations, we improve the P-AGO operator by introducing dynamic parameters and combine it with RLinear for prediction.
3.2.2 Improved P-AGO operator
From expression (2), for any fixed , as increases, the product term approaches zero, causing operator degradation. To overcome this, we introduce dynamic parameters, yielding a new cumulative-sequence generation formula (Equation 7):
and the corresponding reduction formula (Equation 8):
Let the length of the observed data sequence be is , we then formulate an optimization (planning) model to obtain an optimal set of parameters (Equation 9), and boldface symbols indicate matrices.
In conjunction with the existing sequence and , parameter setting, a sliding-window dataset is constructed. Regression prediction is carried out using the RLinear module to obtain , the intermediate results, which are then processed through the reduction formula (8) to produce the final predictions.
3.2.3 RLinear module
The RLinear module performs regression prediction on the target parameter , and its components are as follows:
3.2.3.1 Reversible normalization and multi-layer perceptron structure
The model incorporates a RevIN layer. This layer standardized the input data by computing its mean μ and standard deviation σ according to Equation 10.
Here, and the scaling and bias terms are learnable parameters, and a small constant is included to prevent division by zero. During the prediction phase, the reverse operation restores the data to its original scale, preserving its inherent characteristics.
The normalized data are then passed through an MLP comprising two fully connected layers, with a Sigmoid activation function in between to introduce a non-linear transformation. This enables the model to capture complex non-linear mappings with the residual sequence. A Dropout layer is applied to reduce overfitting. The MLP configuration is adjusted based on the characteristics of residual data and model performance, ensuring that nonlinear information is fully exploited.
3.2.3.2 Dataset construction and model training
The regression model utilizes the specified independent variable(s) and dependent variable(s) to generate a sliding-window dataset, as illustrated in Figure 3. Two data groups are selected, , as the test set, with the remainder forming the training set. Data augmentation is performed by adding normally distributed noise to the original data, thereby increasing the diversity of training samples. Weight decay and an additional Dropout layer are employed to mitigate overfitting further.
Figure 3
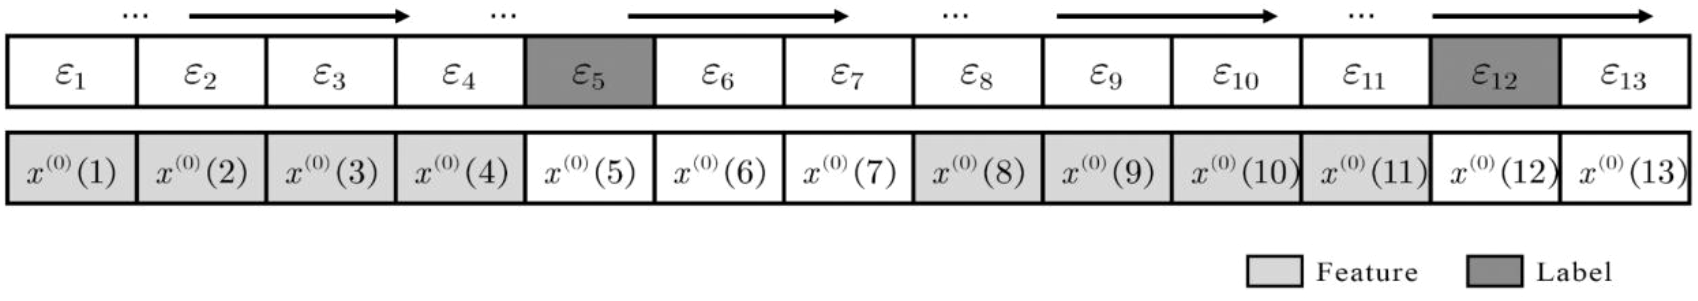
Generation method of the sliding window dataset.
Given the relatively small dataset, random errors during training are minimized by closely monitoring the training process, adjusting the number of epochs, setting an early-stopping criterion and recording the convergence behavior. The training is repeated multiple times, and the optimal solution is selected. The final output comprises the predicted values of the target variable generated by the RLinear model.
3.2.4 Residual dynamic mining and correction module (DPDGM(1,1))
To more effectively capture periodic trends in the data, the DPDGM(1, 1) model is employed to refine the prediction results of the improved PDGM(1, 1) model. The outputs of both models are then combined to generate the final prediction results of the CDGM(1, 1) model.
3.2.4.1 Sliding window accumulation
Following the principle of the dynamic partial accumulative generation operator (DPAGO), an appropriate sliding window size is selected. Let the residual sequence be . At the k-th time point, a partial accumulation is performed to obtain the sliding-window cumulative value , calculated as Equation 11:
where, . This approach effectively captures the local dynamic variations of the residual sequence within different time windows, aligning with the non-stationary nature of marine environmental data. Compared with the traditional accumulation method, it adapts more flexibly to the variability patterns of the data.
3.2.4.2 Discrete model construction and parameter estimation
A discrete model is then formulated based on the sliding-window cumulative sequence. The structure is inspired by the conventional grey model and is expressed as Equation 12:
where, . The model parameters and are estimated using the least-squares method.
3.2.4.3 Inverse cumulative subtraction for prediction restoration
The predicted values of the residuals are retrieved by applying a dynamic local cumulative-subtraction generation operation to the results from the sliding-window cumulative sequence (Equation 13).
These residual predictions are subsequently used to adjust the outputs of the improved PDGM(1, 1) model. This residual-correction mechanism enhances the accuracy of marine environmental data forecasting and mitigates the original model’s limitations in representing complex data features.
Finally, the pseudocode of the CDGM(1,1) algorithm is provided in Algorithm 1.
Algorithm 1
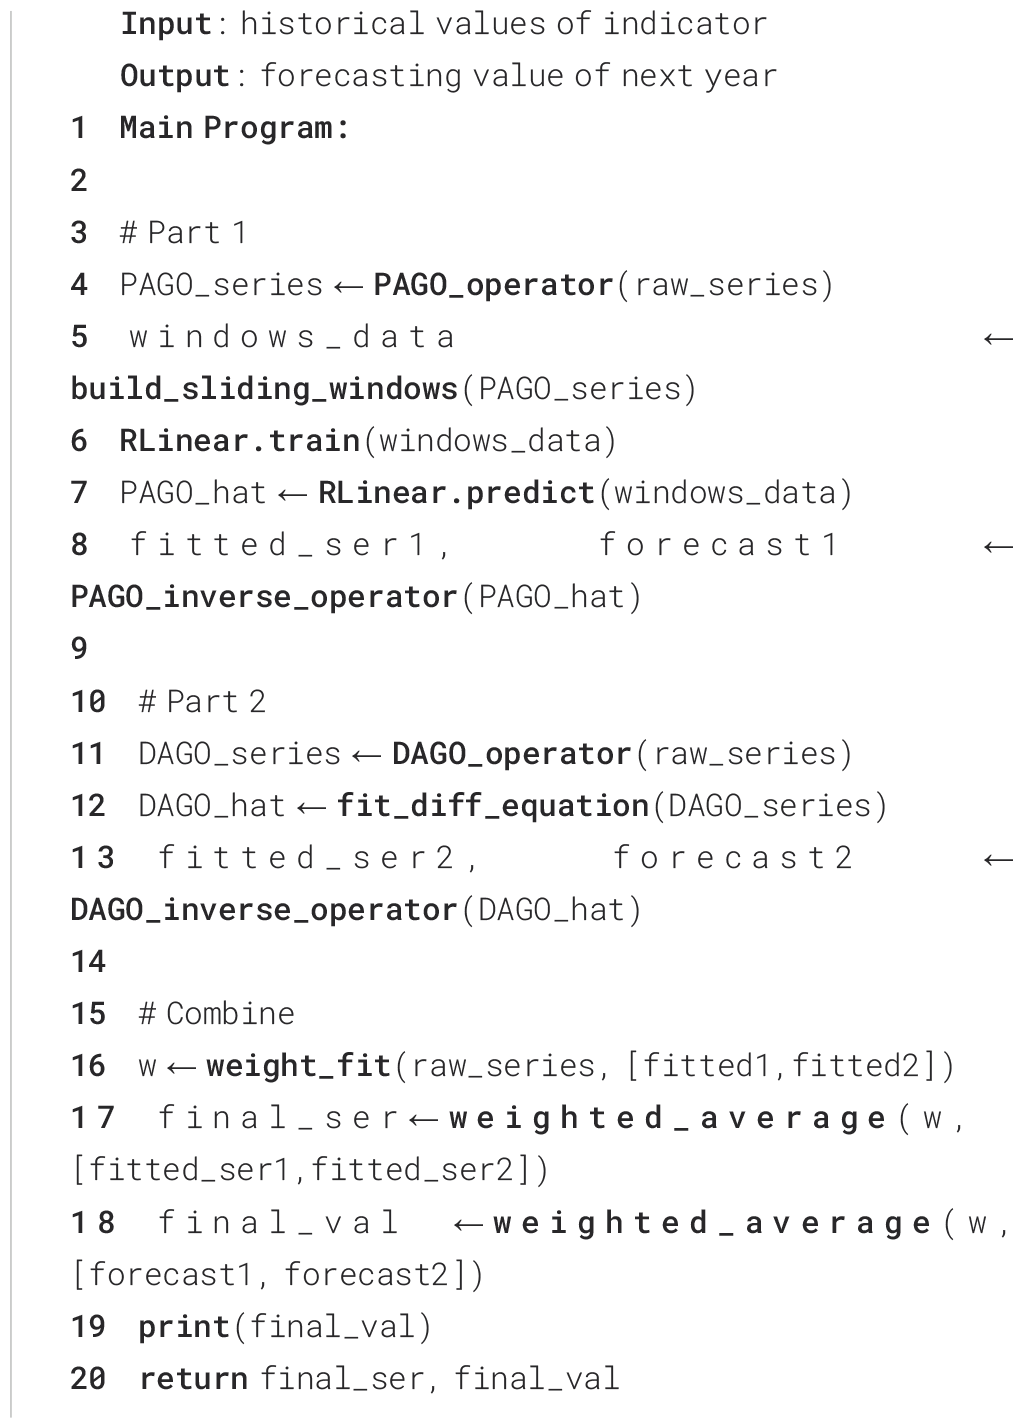
Pseudocode for CDGM(1,1).
3.3 Construction of the DPSIR model and indictor system
The DPSIR framework facilitates the analysis of causal relationships among five interlinked components: driving forces (D), pressures (P), state (S), impact effects (I), and societal responses (R). This structure enables a comprehensive and systematic evaluation of the interaction mechanisms between human activities and the environmental systems. It also fosters an in-depth understanding of the impact of industrial development on marine ecosystems and socio-economic conditions, thereby providing a robust basis for scientifically informed and rational policy formulation.
In this study, a DPSIR-based framework was established, with selected indicators categorized into the following five subsystems:
-
Driving Forces (D): Indicators capturing the dynamics of marine economic development, such as total marine production value and the output value of marine circular economy industries. These forces constitute the primary impetus for the marine ecological economy, where shifts can trigger a cascade of subsequent changes.
-
Environmental pressures (P): Indicators representing the stresses by human activities on the marine environment, including the extent of marine waters failing to meet Grade I water quality standards and marine fishing yields. These factors directly impact the marine ecosystem, disrupting its natural balance.
-
Ecological state (S): Indicators reflecting changes in the condition of the marine ecosystem under the influence of environmental pressures, such as the area of marine wetlands and the scale of the marine biomedicine industry (Xu et al., 2025d). This subsystem reveals the ecosystem’s actual response to external stressors and serves as a critical measure of ecosystem health.
-
Impact effects (I): Indicators describing the repercussions of changes in ecological state on the socio-economic sphere, including direct economic losses from marine disasters and the frequency of red tide events. This subsystem highlights the interdependence of ecological integrity and socioeconomic stability, illustrating the economic repercussions of ecological shifts.
-
Societal responses (R): Indicators covering measures taken by various societal sectors to address ecological degradation and associated socio-economic impacts, such as investment in marine scientific research, education, management services and the number of marine survey projects. These responses aim to foster sustainable industrial development.
4 Case verification
This study assesses the sustainable development of China’s marine economy using data from multiple authoritative sources, including the China Statistical Yearbook, the China Marine Statistical Yearbook and the China Marine Statistical Bulletin. By compiling and integrating data from these sources, a time-series dataset comprising 29 indicators was constructed. These indicators encompass economic, environmental and social dimensions, covering areas such as marine industry development, the state of the marine ecological environment and marine scientific research and education. This multidimensional dataset provides a comprehensive representation of the marine ecological system. In this section, the CDGM(1, 1) model is applied to the empirical data, with the results presented and analyzed, followed by predictions for each indicator for the year 2025.
4.1 Division of DPSIR subsystems
A total of 29 indicators were initially collected. Principal component analysis (PCA) was employed to determine the contribution of each indicator to the first five principal components. Indicators with minimal contributions were removed, while highly correlated variables were merged. This process yielded 22 core effective indicators, as illustrated in Figure 4. Furthermore, several indicators were deemed unsuitable for prediction due to constraints such as lengthy statistical cycles; these were also excluded from the subsequent forecasting tasks.
Figure 4
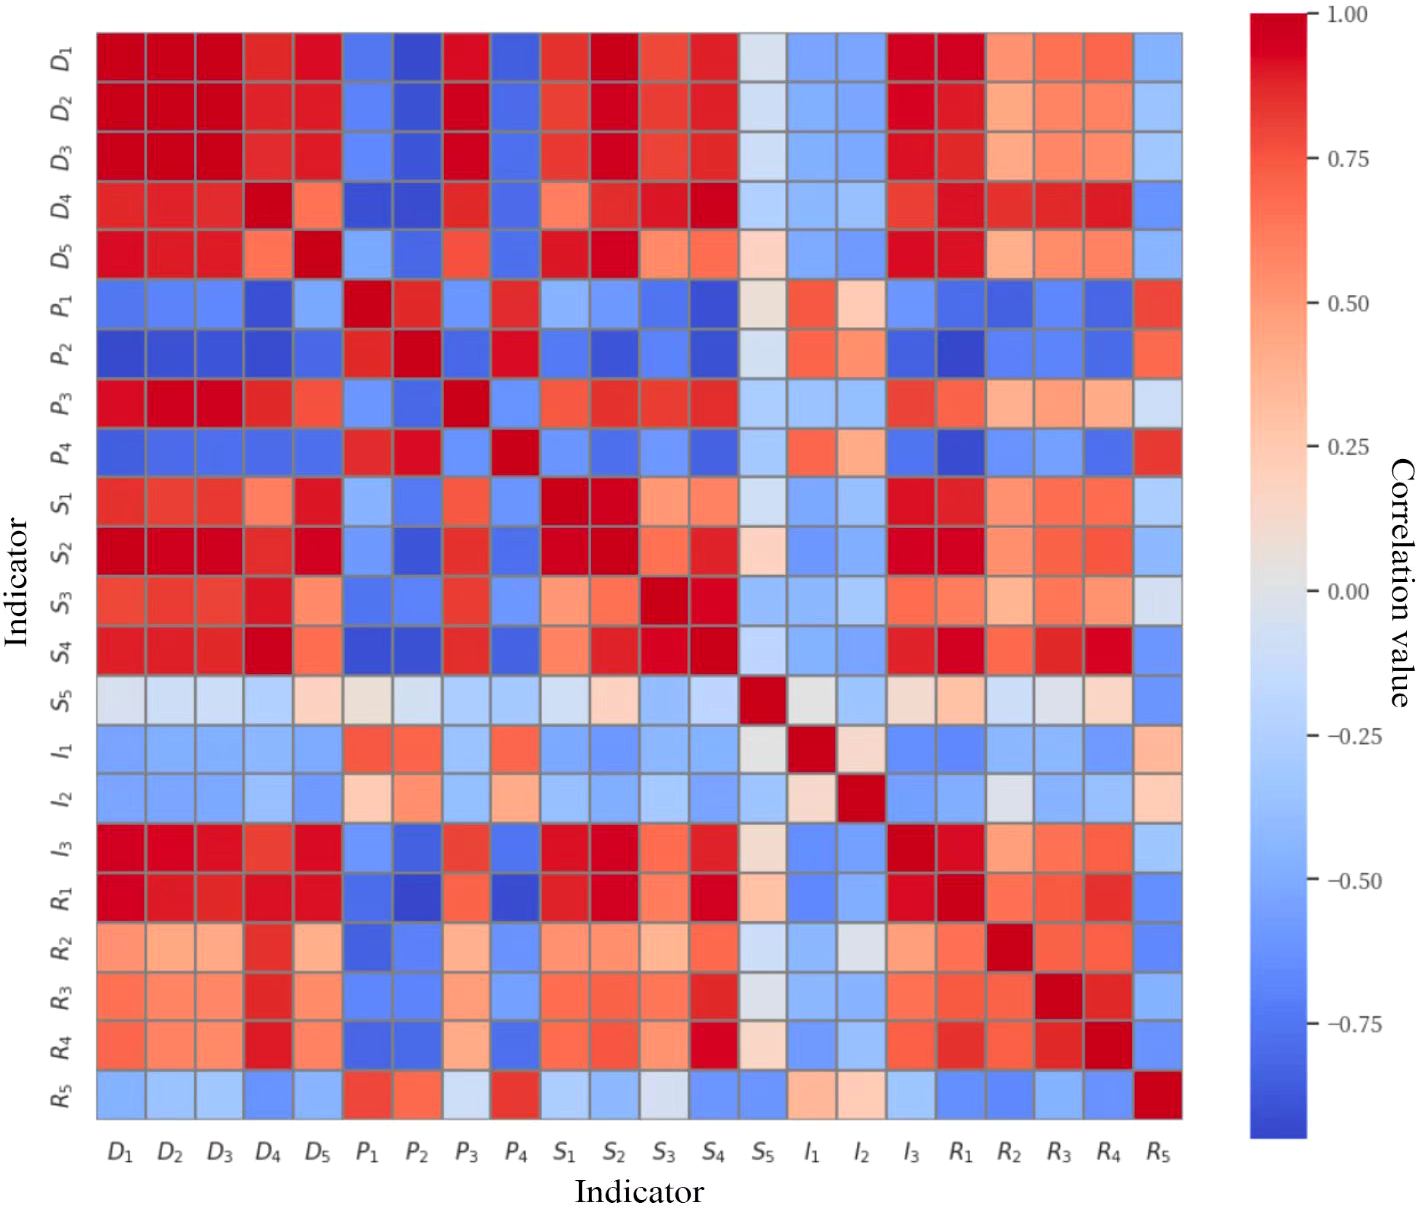
Correlation heatmap of the indicators.
The retained dataset was analyzed by the DPSIR framework, which categorizes indicators into five groups: D (driving force), P (pressure), S (state), I (impact) and R (response). Each indicator was re-numbered for clarity. Using 2010 as the reference year (year 0), subsequent years were renumbered sequentially. The entropy weight method was then applied to determine the weight of each indicator, with the results presented in Table 1.
Table 1
| Target layer | Criterion layer | Indicator | Indicator layer | Weight |
|---|---|---|---|---|
| Marine ecological economic sustainable development indicator system | Driving force (D) | gross marine product (trillion) | 0.071506 | |
| output value of major marine industries (trillion) | 0.040586 | |||
| output value of marine-related industries (trillion) | 0.049768 | |||
| output value of marine circular gain industries (trillion) | 0.062111 | |||
| output value of coastal tourism (trillion) | 0.058492 | |||
| Pressure (P) | fishery employees (person) | 0.034875 | ||
| area of sea areas with less-than-grade I water quality (square kilometer) | 0.045490 | |||
| output value of the traditional marine industry (trillion) | 0.029748 | |||
| marine fishing yield (ton) | 0.007501 | |||
| State (S) | output value of marine fishery (trillion) | 0.039268 | ||
| output value of the marine biomedical industry (trillion) | 0.050544 | |||
| Marine Crude Oil Production (10,000 tons) |
0.047554 | |||
| Marine natural gas production (10,000 cubic meters) |
0.049859 | |||
| Marine wetland area (1,000 hectares) | 0.033735 | |||
| Influence (I) | Direct economic loss from marine disasters (100 million yuan) | 0.060004 | ||
| Number of red tide marine disasters | 0.055214 | |||
| Proportion of the marine protected area to the territorial sea area | 0.057184 | |||
| Response (R) | Output value of marine scientific research, education and management service industries (trillion) | 0.053535 | ||
| number of postgraduate students in marine-related majors (person) | 0.035196 | |||
| Number of patent applications accepted by marine scientific research institutions (pieces) | 0.060113 | |||
| Number of scientific and technological papers published by marine scientific research institutions (papers) | 0.008994 | |||
| Number of marine survey projects (unit) | 0.048721 |
Classification of DPSIR subsystems and corresponding indicator weights.
4.2 Prediction dataset processing
Given the variation in the lengths of time series across different indicators, this study adopts a tailored dataset partitioning strategy to facilitate prediction for the year 2026. For model training, a differentiated approach is applied based on data availability. Where the original series length exceeds 11 years, the final two years are designated as the test set, with the remainder allocated to training. Where the length is fewer than 11 years, only the final year is reserved for testing.
For series extending up to 2025, a sequential multi-step prediction approach is employed. The most recent year is used as the test set, while preceding years are from the training set. Each prediction advances the series by one year; the forecast output is then reintroduced as input for the subsequent prediction. This iterative process continues until estimates for 2026 are obtained. Such an approach maximizes the utility of limited data, enables multiple training and prediction circles, progressively converges towards the 2026 true value, and enhances both prediction accuracy and reliability. The detailed procedure is illustrated in Figure 5.
Figure 5
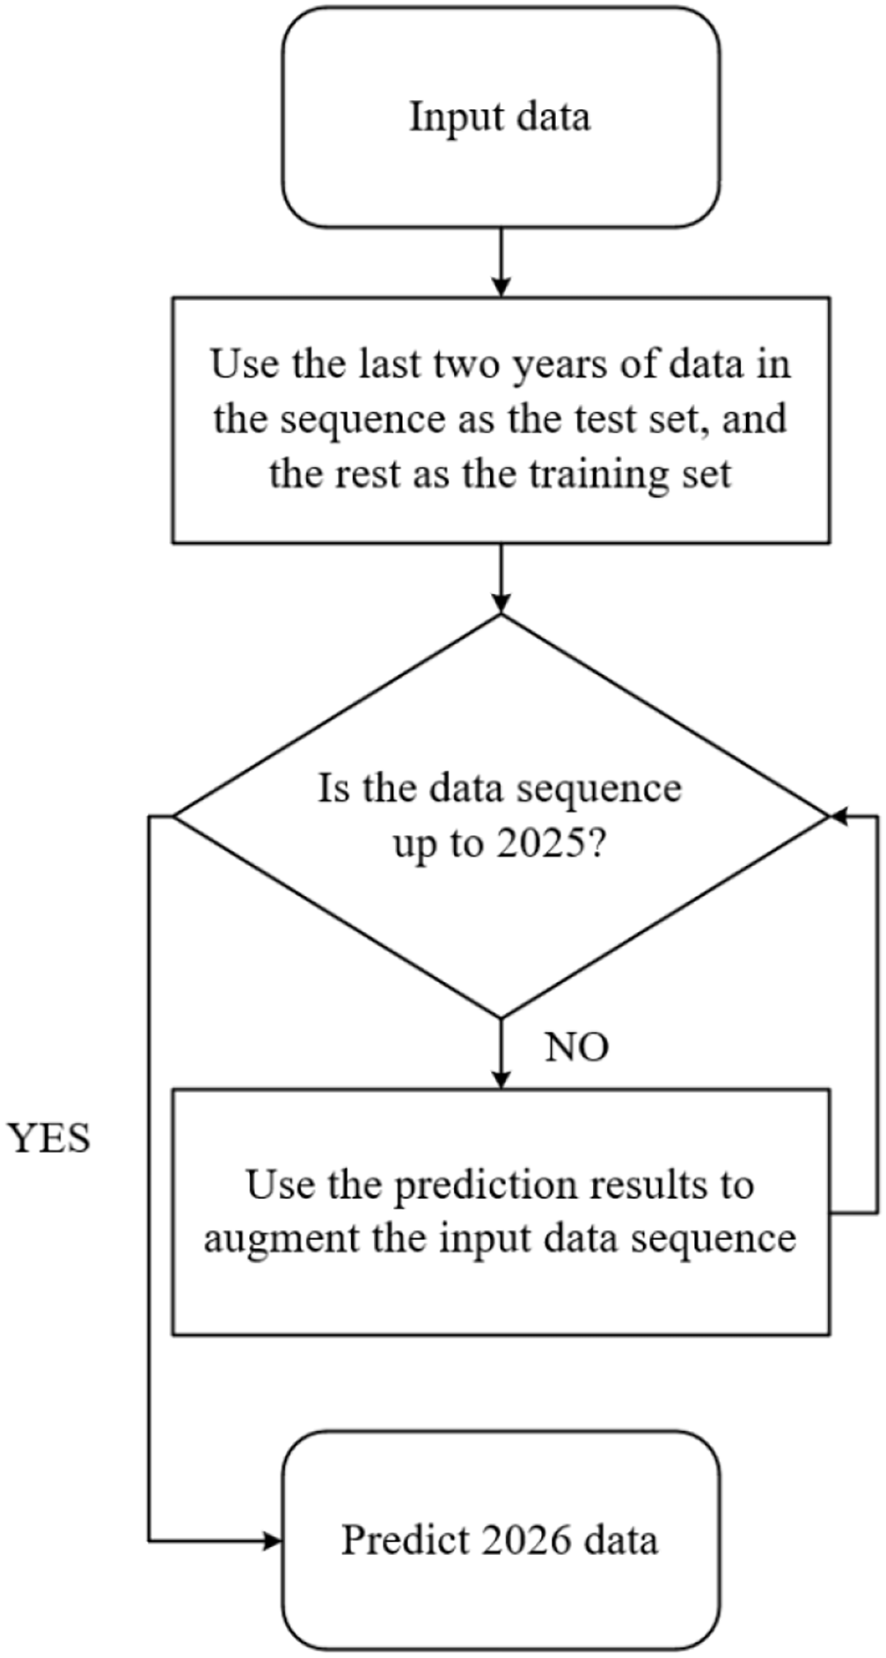
Prediction process of the CDGM(1, 1).
4.3 Sub-indicator prediction
Using the CDGM(1, 1) model, predictions were generated for each retained indicator. Due to the extensive workload, the indicator, direct economic losses from marine disasters (100 million yuan), hereafter referred to as Indicator I1, is presented as an illustrative example, without detailing the calculation process in Table 2.
Table 2
| Indicator\Year | 0 | 1 | 2 | 3 | 4 | 5 | 6 | |
|---|---|---|---|---|---|---|---|---|
| I1 | 132 | 62 | 155 | 163 | 136 | 72.5 | 46.5 | |
| Indicator\Year | 7 | 8 | 9 | 10 | 11 | 12 | 13(test) | 14(test) |
| I1 | 64.0 | 47.8 | 117 | 8.3 | 30.7 | 24.1 | 25.0 | 109.0 |
Direct economic losses from marine disasters (100 million yuan).
The first stage employed the PDGM model to generate predictions. The model parameters were estimated using the sequential least squares programming method, based on Equation (9), to obtain an optimal set of coefficients and (see Table 3).
Table 3
| 0.00 | -1.11 | 0.43 | 0.67 | 0.54 | -0.35 | -0.97 | -0.26 |
| (test) | (test) | ||||||
| -0.63 | 1.19 | -3.67 | -1.02 | -1.35 | -1.12 | 2.19 | 0.33 |
Optimized parameters of the improved P-AGO operator.
In the second stage, the RLinear model was applied to predict parameter values . As a machine learning model, the RLinear model takes the input of sliding window datasets. A window length of 6 is chosen to generate sliding window datasets, and the datasets are expanded after adding noise with a normal distribution. The probability of the Dropout layer is set to 0.15. By continuously observing the training process, a training early - stopping target is set, so that after the model is trained for a certain number of epochs, the fitting result of the RLinear model for residuals is obtained. The model is trained for a total of 500 epochs, and the fitting values of on the training set as well as the predicted values on the test set are obtained (see Table 4). Subsequently, the restoration formula is applied to get the prediction result of the improved PDGM(1,1).
Table 4
| Method\Year | 5 | 6 | 7 | 8 | 9 | 10 | 11 | 12 | 13 (test) | 14 (test) |
|---|---|---|---|---|---|---|---|---|---|---|
| PDGM (1,1) +RLinear |
2.33 | -23.0 | 2.40 | 8.70 | 25.96 | -10.05 | -0.52 | -23.79 | 1.06 | 0.45 |
Fitting of data by the RLinear model.
Subsequently, the DPDGM(1, 1) model was applied to fit the original dataset. Based on the performance of the training set, the results were combined using a weighted approach to derive the final performance of the CDGM(1, 1) model on the available data. The comparative prediction outcomes of the models are presented in Table 5.
Table 5
| Method\Year | 0 | 1 | 2 | 3 | 4 | 5 | 6 | 7 | |
|---|---|---|---|---|---|---|---|---|---|
| CDGM (1,1) | 132.80 | 59.40 | 150.75 | 161.80 | 137.04 | 76.75 | 46.55 | 64.92 | |
| PDGM (1,1) | 132.80 | 78.82 | 144.61 | 163.50 | 142.07 | 109.73 | 82.17 | 62.49 | |
| DPDGM (1,1) | 132.80 | 62.10 | 154.95 | 163.50 | 136.14 | 61.22 | -2.52 | 96.61 | |
| GM(1,1) | 132.80 | 135.19 | 120.50 | 107.41 | 95.74 | 85.34 | 76.06 | 67.80 | |
| Method\Year | 8 | 9 | 10 | 11 | 12 | 13 (test) | 14 (test) | TRAIN MAPE |
TEST MAPE |
| CDGM (1,1) | 57.49 | 130.46 | 11.72 | 31.59 | 27.80 | 22.51 | 95.34 | 8.26 | 11.23 |
| PDGM (1,1) | 49.27 | 40.53 | 34.72 | 30.83 | 28.20 | 26.41 | 25.20 | 41.31 | 76.53 |
| DPDGM(1,1) | 110.82 | 88.58 | 29.56 | 7.73 | 29.00 | 16.20 | 88.47 | 51.04 | 18.83 |
| GM(1,1) | 60.43 | 53.86 | 48.01 | 42.79 | 38.14 | 34.00 | 30.31 | 70.26 | 72.20 |
Comparison of prediction results between models.
Underlines indicate the best-performing results.
Table 5 presents a comparison of the prediction results obtained using the CDGM(1, 1), PDGM(1, 1), DPDGM(1, 1) and DM(1,1) models. As observed from Table 5, Figure 6, in the final year, the CDGM(1, 1) model demonstrates substantially superior performance compared with the other models, both on the training and test datasets. Figure 6 Illustrates the multi-model prediction and fitting results for the I1 index.
Figure 6
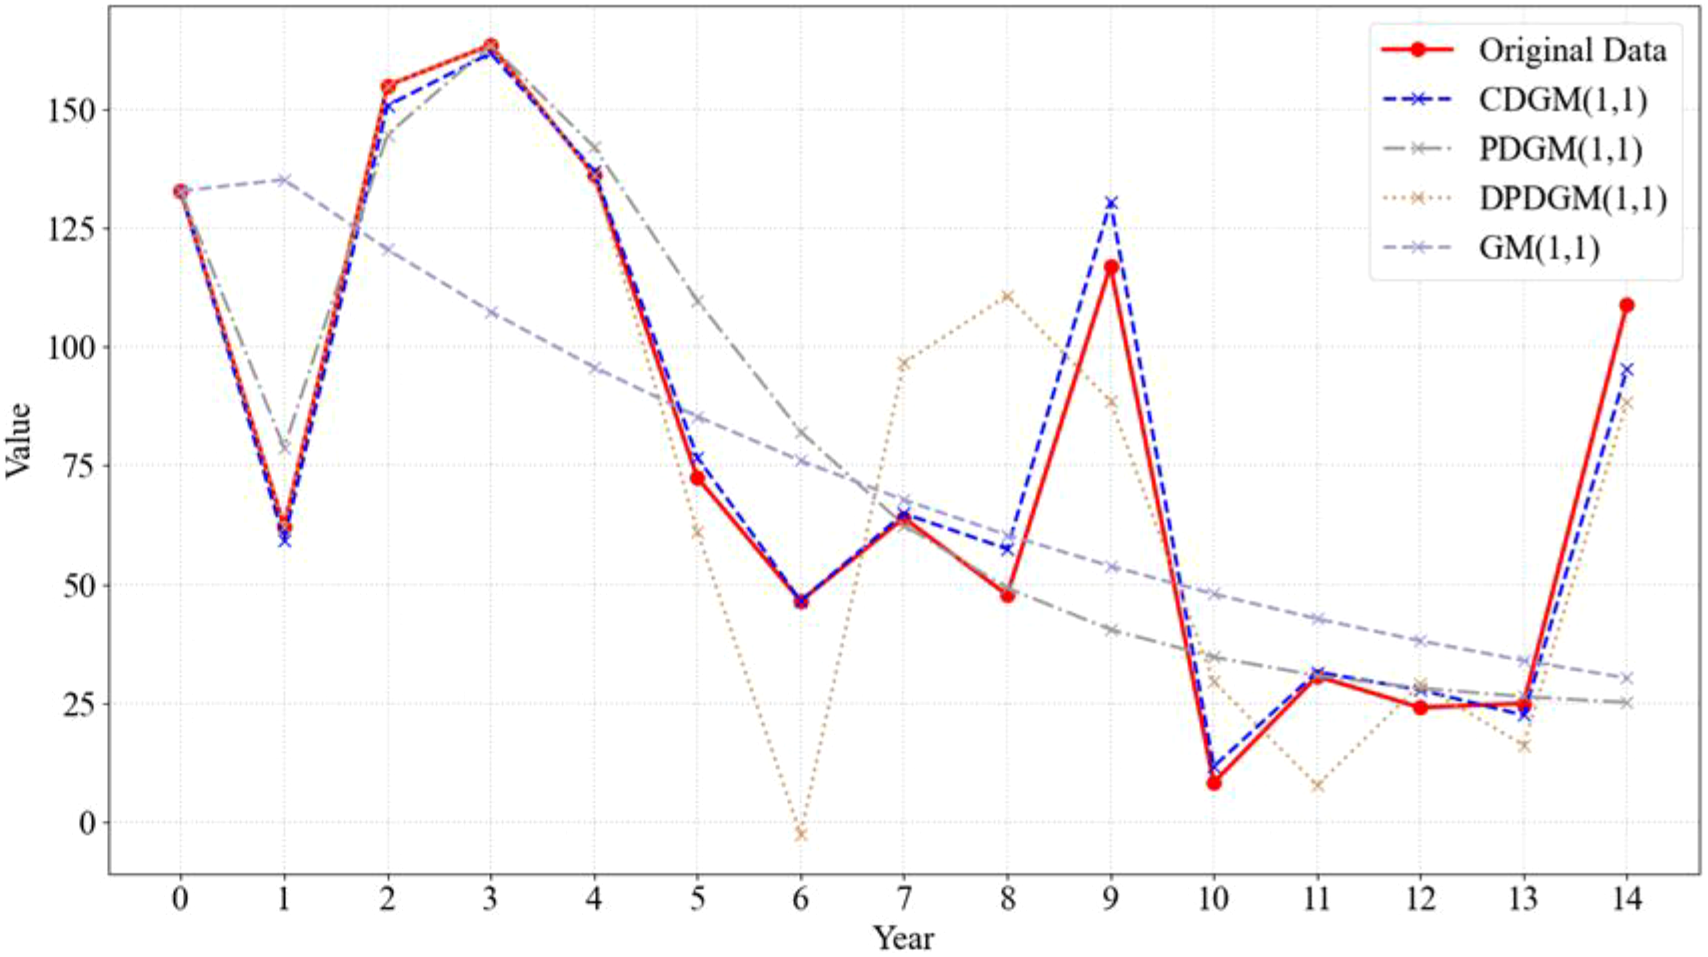
Multi-model prediction and fitting results of the I1 index.
Figure 7 presents the multi-model fitting performance of the D4 and D5 indicators, highlighting the superior performance of the CDGM(1, 1) model relative to the other models in the same category.
Figure 7
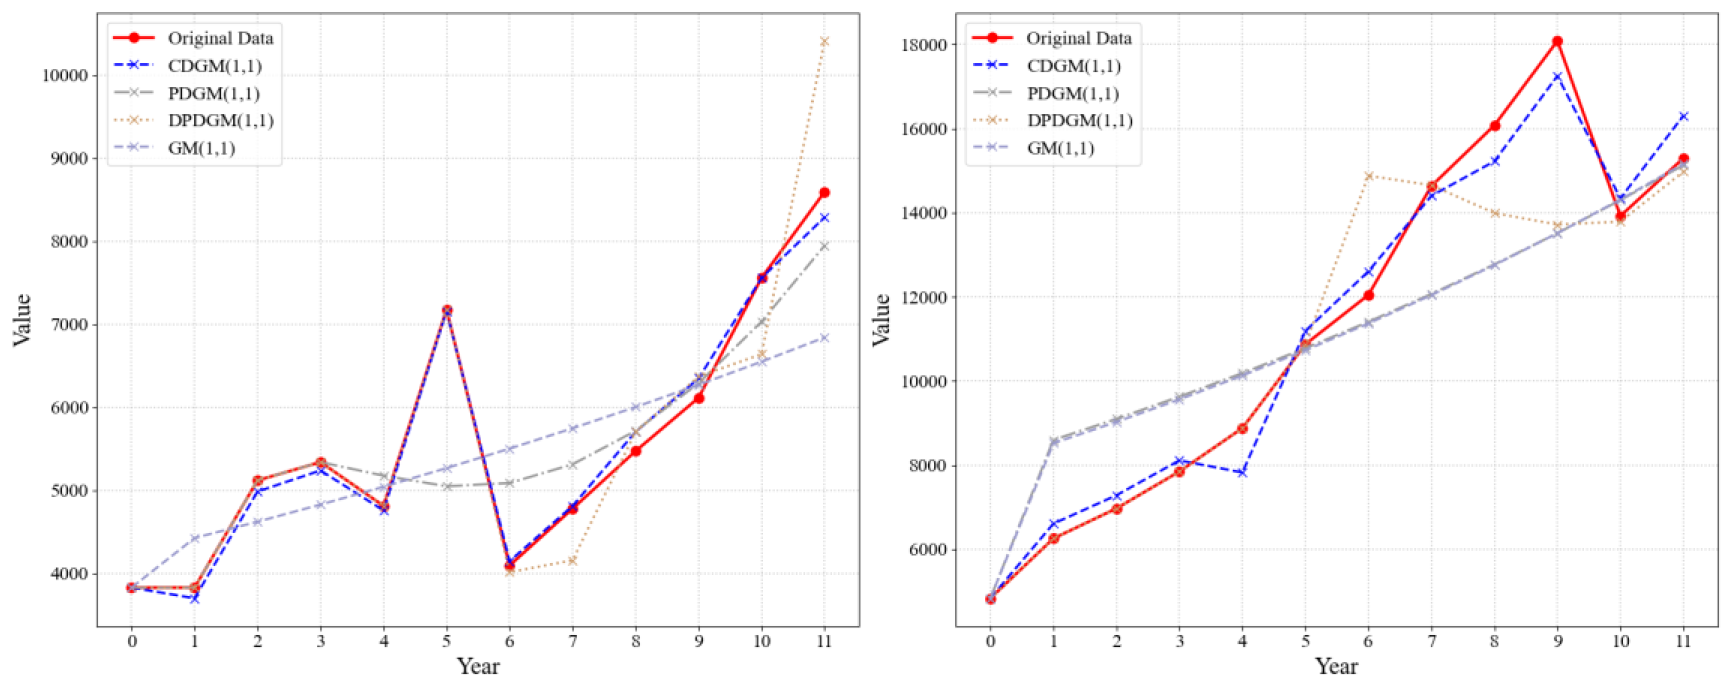
Multi-model prediction and fitting results for the D5 and R3 indicators.
A detailed comparative analysis of the fitting results for the CDGM(1, 1), PDGM(1, 1), DPDGM(1, 1) and GM(1, 1) models was conducted on both the training and test sets, as summarized in Tables 6, 7. For the majority of indicators, the CDGM(1, 1) model demonstrates superior predictive performance compared with the PDGM(1, 1), DPDGM(1,1), and GM(1,1) models. Therefore, the CDGM (1, 1) model was selected to forecast each indicator for 2026. The resulting predictions are presented in Table 8, which confirms that the CDGM(1, 1) model achieves high accuracy across indicators.
Table 6
| Method\Indicator | D1 | D2 | D3 | D4 | D5 | P1 | P2 | P3 | P4 | S1 |
|---|---|---|---|---|---|---|---|---|---|---|
| CDGM (1,1) | 4.16 | 2.27 | 1.42 | 0.59 | 4.85 | 1.15 | 2.93 | 2.52 | 1.80 | 2.04 |
| PDGM (1,1) | 5.00 | 6.09 | 5.30 | 5.58 | 15.44 | 2.30 | 8.23 | 5.12 | 3.82 | 2.52 |
| DPDGM (1,1) | 4.49 | 6.52 | 5.39 | 3.09 | 9.73 | 2.67 | 13.76 | 6.68 | 4.93 | 5.30 |
| GM (1,1) | 4.98 | 6.08 | 5.29 | 11.60 | 15.26 | 2.30 | 9.27 | 5.13 | 3.83 | 6.21 |
| Method\Indicator | S2 | S3 | S4 | S5 | I1 | I2 | R1 | R3 | R4 | R5 |
| CDGM (1,1) | 2.38 | 1.26 | 1.47 | 31.44 | 12.34 | 20.34 | 2.17 | 1.71 | 0.79 | 15.62 |
| PDGM (1,1) | 12.19 | 3.89 | 3.86 | 55.86 | 41.31 | 176.91 | 2.38 | 8.00 | 4.30 | 28.92 |
| DPDGM (1,1) | 2.20 | 3.51 | 4.93 | 28.51 | 51.04 | 192.55 | 1.94 | 7.13 | 7.38 | 122.76 |
| GM (1,1) | 12.20 | 4.03 | 6.07 | 60.34 | 70.26 | 182.24 | 2.97 | 13.31 | 6.82 | 29.14 |
Fitting performance on the training set (MAPE).
Underlines indicate the best-performing results.
Table 7
| Method\Indicator | D1 | D2 | D3 | D4 | D5 | P1 | P2 | P3 | P4 | S1 |
|---|---|---|---|---|---|---|---|---|---|---|
| CDGM (1,1) | 0.61 | 3.18 | 0.70 | 0.60 | 6.62 | 0.31 | 2.43 | 9.66 | 3.29 | 5.34 |
| PDGM (1,1) | 3.25 | 2.27 | 2.24 | 0.69 | 11.11 | 2.74 | 32.53 | 7.60 | 4.59 | 8.41 |
| DPDGM (1,1) | 1.23 | 7.83 | 8.44 | 3.18 | 14.51 | 16.09 | 20.23 | 17.04 | 25.68 | 1.11 |
| GM (1,1) | 3.26 | 2.21 | 2.18 | 12.62 | 11.73 | 2.76 | 24.63 | 7.51 | 4.52 | 5.51 |
| Method\Indicator | S2 | S3 | S4 | S5 | I1 | I2 | R1 | R3 | R4 | R5 |
| CDGM (1,1) | 1.55 | 5.38 | 2.53 | 6.44 | 23.62 | 17.64 | 2.41 | 3.56 | 6.42 | 65.90 |
| PDGM (1,1) | 14.84 | 10.10 | 2.54 | 51.88 | 76.53 | 51.12 | 8.63 | 7.53 | 6.97 | 894.89 |
| DPDGM (1,1) | 1.68 | 14.07 | 7.30 | 137.23 | 18.83 | 37.17 | 7.47 | 21.17 | 12.75 | 1006.44 |
| GM (1,1) | 14.81 | 10.24 | 10.04 | 46.32 | 72.20 | 48.84 | 7.51 | 20.39 | 9.33 | 933.85 |
Fitting performance on the test set(MAPE).
Underlines indicate the best-performing results.
Table 8
| Prediction\Indicator | D1 | D2 | D3 | D4 | D5 | P1 | P2 | P3 | P4 | S1 |
|---|---|---|---|---|---|---|---|---|---|---|
| RESULT | 122551 | 40514 | 36346 | 755.61 | 23512 | 3566155 | 56427 | 13451 | 8932964 | 5676 |
| Prediction\Indicator | S2 | S3 | S4 | S5 | I1 | I2 | R1 | R3 | R4 | R5 |
| RESULT | 648.56 | 7396.9 | 2444624 | 34311 | 45.93 | 29.51 | 49551 | 10840 | 57175 | 96.73 |
Prediction results of various indicators.
5 Result analysis and discussion
5.1 Analysis of prediction results
This section outlines the derivation of the fitting results and predicted values for various indicators in 2025 using the CDGM (1, 1) model. The results are subsequently incorporated into the DPSIR evaluation framework to assess the status of China’s marine sustainable development.
For each indicator, the TOPSIS method is employed to compute for each year, denoted as . Simultaneously, the entropy weight method is applied to the original data to determine the contribution of each indicator to the overall system, expressed as a weight, . Through the formula , the annual evaluation value for each indicator is calculated. The evaluation values of all indicators across the year are presented in Figure 8.
Figure 8
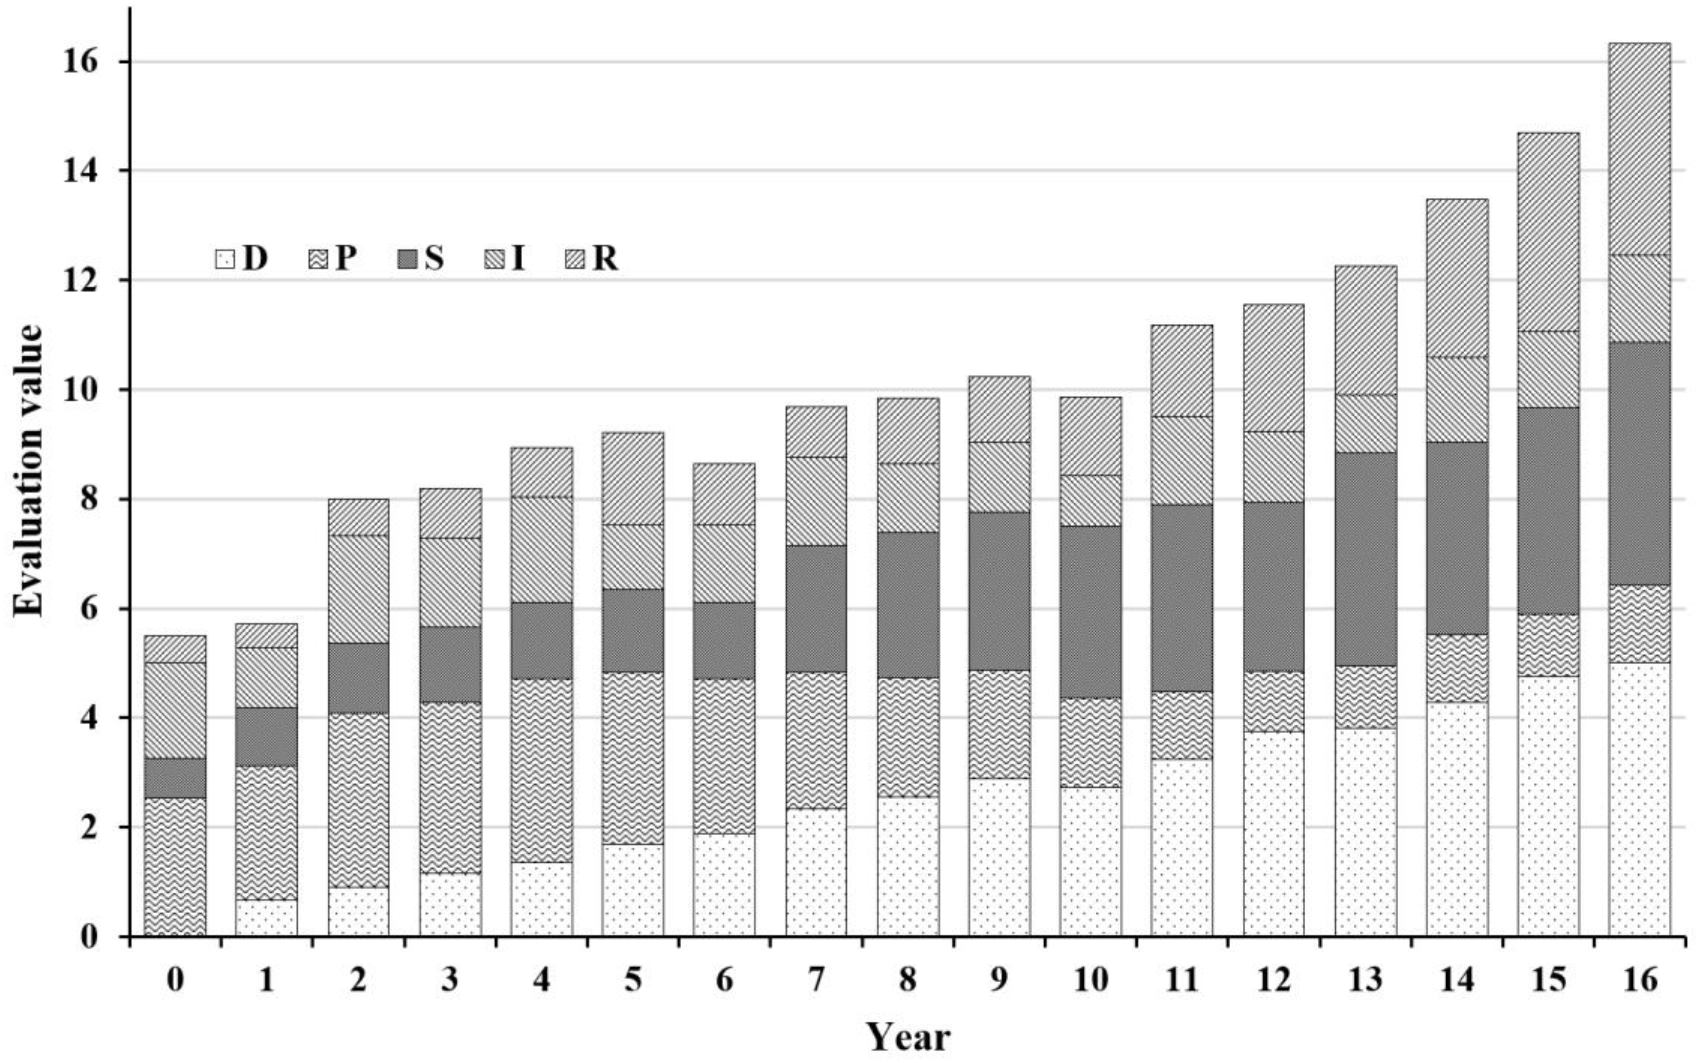
Evaluation values of the DPSIR sub-system.
5.2 Analysis of evaluation results
5.2.1 Driving force subsystem
As illustrated in Figure 9, the driving force subsystem of the marine ecological–economic system exhibits a consistent upward trend from 2010 to 2025. Its contribution to the sustainable development of the marine ecological economy increased from 0.00020 to 4.75443. Predictions from the CDGM(1, 1) model indicate that this contribution will reach 5.0000 by 2026, suggesting continuous improvement and substantial growth potential within this subsystem.
Figure 9
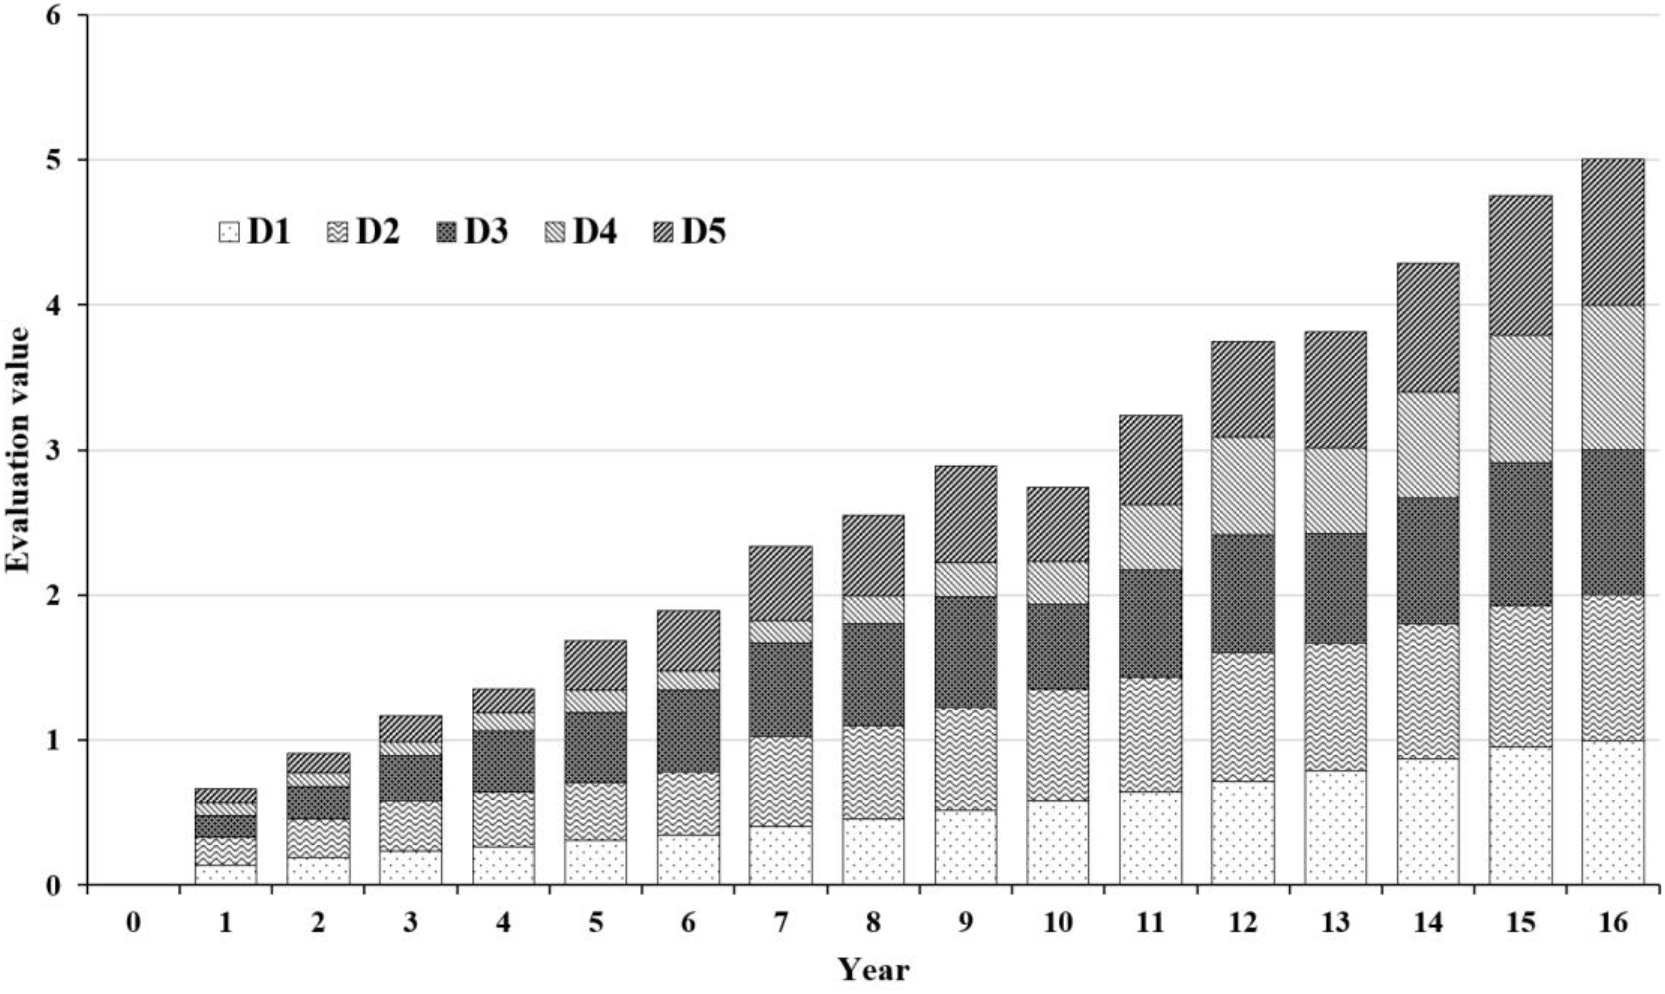
Sustainable utilization evaluation value of the driving force subsystem.
Notably, the contribution of the “output value of the marine circular gain industry (trillion yuan)” and “output value of the coastal tourism industry (trillion yuan)” to the driving force subsystem has steadily increased. This trend reflects China’s recent policies promoting the development of both the marine circular gain industry and coastal tourism.
According to the prediction results of the CDGM (1, 1) model, the output value of the marine circular economy sector is projected to rise from $91 trillion in 2010 to $756 trillion by 2026. Concurrently, the coastal tourism sector is forecast to reach an output value of 23,512 trillion in 2026. These projections suggest that both sectors will generate substantial economic value in 2026, underscoring the need to strengthen policy and financial support, while advancing initiatives for sustainable marine development.
Based on the above prediction results, policies should focus on guiding the transformation of economic development models. For instance, the government may establish a “Special Fund for Sustainable Marine Development”, allocate a certain amount of funds annually, and encourage enterprises to carry out research and development projects related to the circular utilization of marine resources and low-carbon development. Enterprises that adopt environmentally friendly and sustainable development technologies should be granted a 3- to 5-year corporate income tax reduction or exemption. On the other hand, it is necessary to continuously promote the in-depth integration of coastal tourism and ecological protection, and build an ecotourism demonstration belt in popular coastal tourism areas.
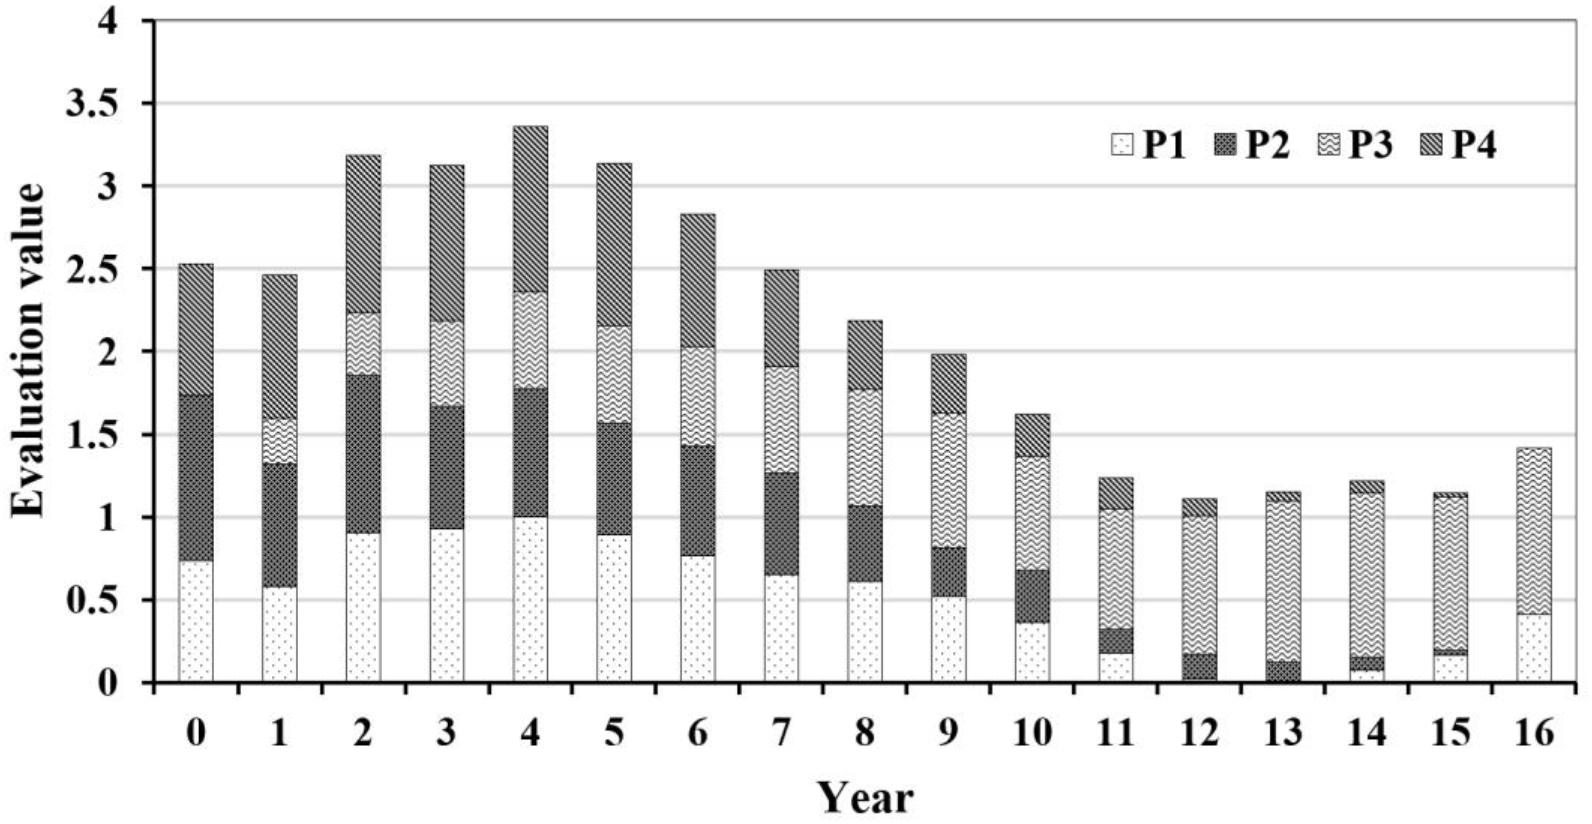
5.2.2 Pressure subsystem
The driving force subsystem of the marine ecological–economic system exhibited a gradual increase followed by a steady annual decline between 2010 and 2025. It is estimated that its contribution to the overall sustainability of the marine ecological economy will reach 1.41394 in 2026. This change is mainly attributable to improvements in the area of marine waters failing to meet Class I water quality standards (square kilometers), which has played a critical role in enhancing environmental conditions. With growing public awareness and concern for marine protection, ocean water quality has improved considerably, making a notable contribution to sustainable marine ecological development. CDGM(1, 1) model forecasts indicate that the non-compliant marine area will decline from 177,720 square kilometers in 2010 to 56,427 square kilometers in 2026, marking a historic low. Nonetheless, further progress is required to address the remaining shortfalls in this indicator. Figure 10 presents the contribution value of the pressure subsystem.
Figure 10
Contribution value of the pressure subsystem to sustainable utilization.
Pressure factors are alleviated but still require attention. Policies need to focus on consolidating the effectiveness of pollution control and resource protection, and preventing the rebound of local pressure. For sea areas where water quality fails to meet Grade I standards, on the basis of existing governance efforts, more precise pollution source control should be implemented to clearly identify the main pollution sources in each polluted sea area and the main entities responsible for governance. Regarding marine fishing, the fishing quota system should continue to be strictly enforced; at the same time, support for the transformation and transfer of the fishing industry should be strengthened. Skill training should be provided to fishermen who withdraw from fishing, and they should be guided to engage in fields such as marine ecological conservation and aquaculture, so as to reduce reliance on marine fishing.
5.2.3 Ecosystem state subsystem
Between 2010 and 2025, the contribution value of the pressure subsystem within the marine ecological–economic system exhibited a generally upward yet fluctuating trend, rising from 0.73429 to 3.76642. Model predictions indicate that this value will further increase to 4.44827 in 2026. The steady growth in the output value of the marine biomedicine industry (trillion yuan) substantiates the positive influence of its rapid expansion in recent years. Based on the CDGM (1, 1) model forecasts, the industry’s output value is projected to reach 649 trillion yuan by 2026. Consequently, policies that foster and support the development of biomedical enterprises are essential to sustaining and advancing the marine biomedicine sector. The contribution value of the state subsystem to sustainable utilization is presented in Figure 11.
Figure 11
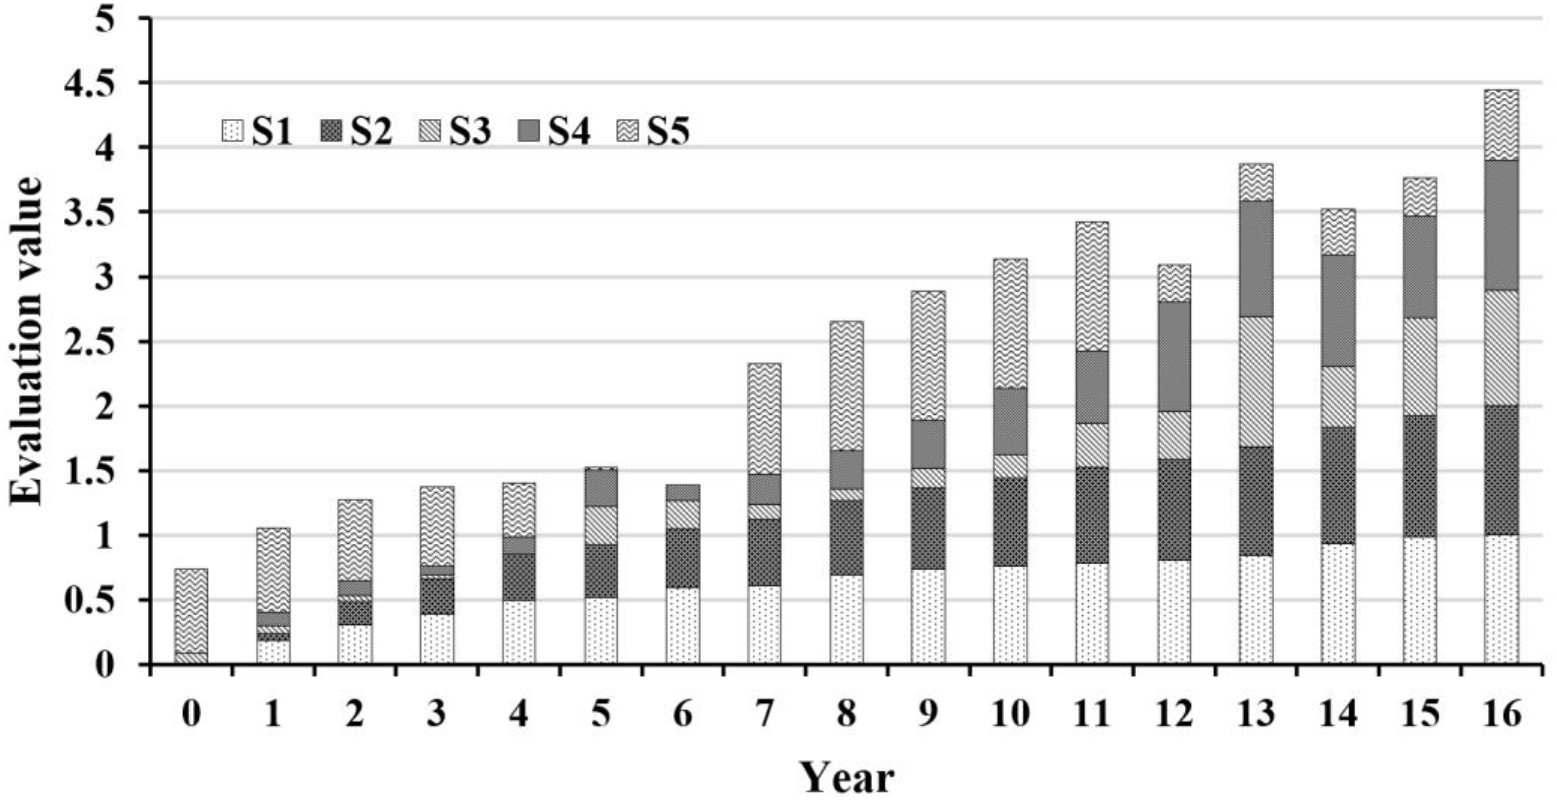
Contribution value of the state subsystem to sustainable utilization.
The overall state of marine ecology and industrial development tends to be positive. Policies should focus on consolidating the achievements of ecological restoration and promoting the upgrading of ecological functions. For emerging industries such as marine biomedicine, it is necessary to increase scientific research investment and policy support, while attaching importance to the protection of the ecological environment in the process of industrial development. With regard to marine wetlands, on the basis of existing protection efforts, the scope of marine wetland protection should be expanded; meanwhile, exploration should be conducted into pathways for realizing the ecological value of wetlands—such as developing wetland ecotourism and carbon sink trading—so as to provide more economic support for wetland ecological protection.
5.2.4 Impact subsystem
From 2010 to 2025, the contribution value of the impact subsystem of the marine ecological–economic framework exhibited a generally declining but fluctuating trend, falling from 1.74085 to 1.38554. Model projections indicate that this value will rise to 1.59395 by 2026. This improvement is attributed to China’s enhanced capacity to mitigate marine disasters, resulting in progressively reduced periodic direct economic losses. Additionally, the establishment of marine protected areas has considerably reinforced the sustainable development capacity of the impact subsystem. The contribution value of sustainable utilization for the subsystem is illustrated in Figure 12.
Figure 12
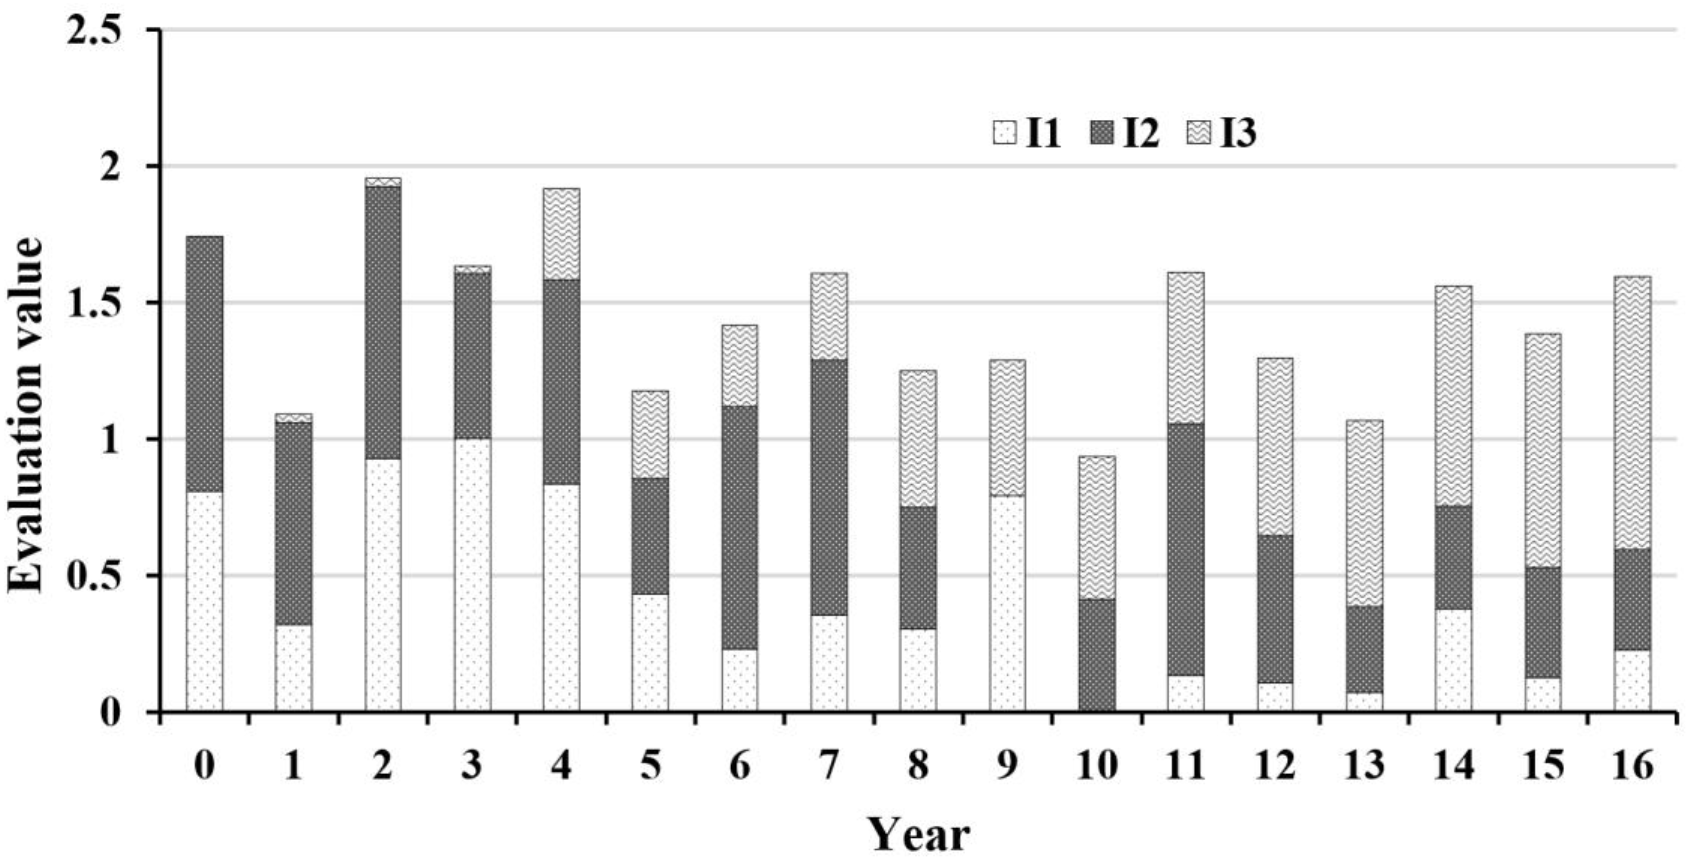
Contribution value of the impact subsystem to sustainable utilization.
Based on relevant indicators, the construction of protected areas has achieved certain results. However, the impacts of marine disasters still require attention. In terms of policies, efforts should be made to strengthen the development of marine disaster early warning and response capabilities, improve the marine disaster monitoring and early warning system, enhance the accuracy of disaster forecasting, and establish a marine disaster emergency rescue system simultaneously, so as to reduce the impacts of disasters on the economy.
5.2.5 Response subsystem
The response subsystem demonstrated a steady upward trajectory from 2010 to 2025, with its contribution value increasing from 0.48679 to 2.88017. It is forecast to reach 3.87146 in 2026. Notably, between 2019 and 2021, the subsystem’s contribution to sustainable development entered a temporary trough. This decline was primarily due to a reduction in the contribution value of the “Number of ocean survey projects”, offset by increases in four other indicators:
-
Output value of the marine scientific research, education, management and service industry
-
Number of master’s postgraduates enrolled in marine-related majors
-
Number of patent applications accepted by marine scientific research institutions
-
Number of scientific and technological papers published by marine scientific research Institutions.
These trends indicate that China has moved beyond the initial phase of ocean exploration and now possesses a substantially stronger capacity for advanced marine research. According to the CDGM(1, 1) model predictions, by 2026, the output value of the marine scientific research, education, management and service industry will reach CNY 49,551 trillion, while patent applications from marine research institutions will total 10,840. With robust financial and technical resources, the nation is positioned to deepen its understanding of the marine environment, thereby facilitating the construction of more sustainable ocean development framework. The contribution value of the response subsystem to sustainable utilization is shown in Figure 13.
Figure 13
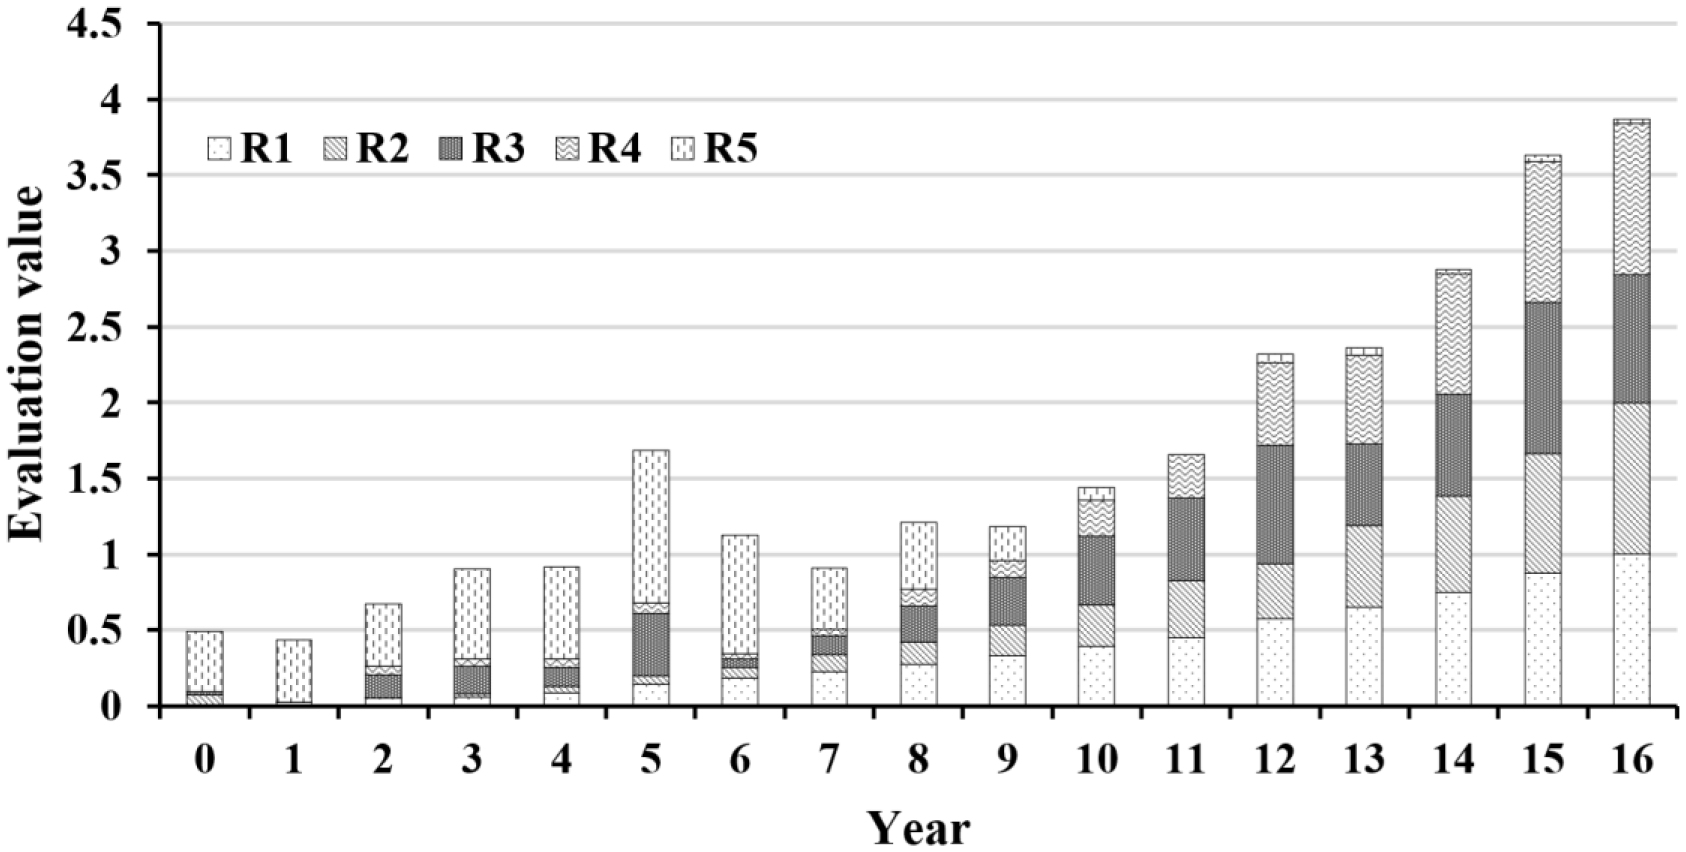
Contribution value of the response subsystem to sustainable utilization.
Based on the comprehensive forecast results, the government should increase investment in marine scientific research and education, construct more high-level marine scientific research platforms, and attract global marine scientific research talents. Meanwhile, it is necessary to improve the transformation mechanism of marine scientific research achievements, establish a cooperation and connection platform between scientific research institutions and enterprises, and promote the rapid transformation of marine scientific research achievements into practical productive forces.
6 Conclusions and prospects
To address the core challenges in evaluating China’s marine ecological-economic, system such as unclear underlying mechanisms and limited dynamic adaptability, such as nuclear underlying mechanisms and limited dynamic adaptability, this study develops an integrated, full-chain prediction and evaluation framework. The approach combines the dynamic correction discrete GM(1, 1) model (CDGM(1, 1)) with the DPSIR framework, offering a comprehensive solution to the dual problems of inaccurate prediction from small samples and insufficient interpretation of complex interrelationships.
From a methodological standpoint, the research introduces the concepts of grey effective information and a probability accumulation operator, enabling the effective extraction of critical signals from small-sample datasets. The P-AGO operator is refined through targeted improvements, and a dynamic parameter optimization mechanism, integrated with the RLinear module, is incorporated to mitigate the degradation observed in conventional probability accumulation processes. Furthermore, the DPDGM(1, 1) model is employed in a combined forecasting structure, enhancing the system’s capacity to capture periodic patterns. This results in a robust three-stage prediction architecture, trend modelling, dynamic fitting and residual correction, that substantially improves the modelling of complex dynamics in the marine eco-economic system and overcomes the limitations of traditional models in representing non-linear coupling effects.
At the empirical level, analysis of China’s marine economic data (2010–2025) indicates a steady increase in the sustainable development index of the marine eco-economy, exhibiting an evolutionary trajectory characterized by driving-force leadership and multi-subsystem synergy. The driving-force subsystem emerges as the principal engine, propelled by the rapid expansion of the marine circular-gain and coastal tourism industries. The pressure subsystem has progressively alleviated ecological stress through improvements in water quantity and quality. In the state subsystem, the sustained growth of the marine biomedicine sector highlights the potential of emerging industries. Meanwhile, the response subsystem has strengthened the technological foundation by increasing investment in scientific research. These dynamic interactions confirm the effectiveness of China’s marine ecological protection and economic development policies, while elucidating a collaborative operational mechanism characterized by industry-driven growth, ecological responsiveness and effective policy regulation.
The CDGM (1,1)-DPSIR framework developed in this study provides a robust analytical tool for assessing the marine ecological economy, integrating high predictive accuracy with strong policy relevance. Future work should focus on refining the indicator system to encompass emerging sectors, strengthening the model’s resilience to extreme outlier data and deepening analyses of regional disparities. Such improvements will enable more precise decision-making in support of the high-quality, sustainable growth of China’s marine economy. Despite its contributions, the study has certain limitations. The marine economy is influenced by a wide array of factors and intricate interdependencies, many of which remain unaccounted for. Expanding the evaluation indicators to incorporate additional relevant variables would improve comprehensiveness. From a modelling perspective, although the CDGM (1, 1) demonstrates notable progress in handling small-sample datasets and capturing the dynamic evolution of complex systems, its stability and adaptability declined when confronted with extreme anomalies. Consequently, future research should prioritize enhancing the model architecture, advancing data-processing techniques and improving simulation and forecasting capabilities to address the multifaceted nature of the marine ecological-economic system.
Statements
Data availability statement
The original contributions presented in the study are included in the article/supplementary material. Further inquiries can be directed to the corresponding author.
Author contributions
ZD: Methodology, Writing – original draft, Conceptualization, Investigation, Supervision, Formal Analysis, Writing – review & editing. JC: Software, Methodology, Investigation, Writing – original draft, Data curation, Formal Analysis. CL: Writing – original draft, Software, Methodology, Visualization, Investigation, Validation, Data curation. XG: Writing – review & editing, Validation. LY: Conceptualization, Investigation, Writing – review & editing, Funding acquisition.
Funding
The author(s) declare financial support was received for the research and/or publication of this article. This work was supported by the Major Project of the National Social Science Fund of China (No. 20&ZD100).
Conflict of interest
The authors declare that the research was conducted in the absence of any commercial or financial relationships that could be construed as a potential conflict of interest.
Generative AI statement
The author(s) declare that no Generative AI was used in the creation of this manuscript.
Any alternative text (alt text) provided alongside figures in this article has been generated by Frontiers with the support of artificial intelligence and reasonable efforts have been made to ensure accuracy, including review by the authors wherever possible. If you identify any issues, please contact us.
Publisher’s note
All claims expressed in this article are solely those of the authors and do not necessarily represent those of their affiliated organizations, or those of the publisher, the editors and the reviewers. Any product that may be evaluated in this article, or claim that may be made by its manufacturer, is not guaranteed or endorsed by the publisher.
References
1
Akay D. Mehmet A. (2007). Grey prediction with rolling mechanism for electricity demand forecasting of Turkey. Energy32, 9: 1670–1675. doi: 10.1016/j.energy.2006.11.014
2
Benavides I. F. Romero–Leiton J. P. Santacruz M. Barreto C. Puentes V. Selvaraj J. et al . (2022). Applying seasonal time series modeling to forecast marine fishery landings for six species in the Colombian Pacific Ocean. Regional Stud. Mar. Sci.56, 102716. doi: 10.1016/j.rsma.2022.102716
3
Cai L. Liang J. Guo Z. Ouyang Y. Yang M. Dai J. et al . (2023). Evaluation of the coordination between marine ecological environment protection and marine economic development in China. Environ. Sci. pollut. Res.30, 31524–31532. doi: 10.1007/s11356-022-24376-9
4
Cao M. Jin Y. Hu Y. Huang X. Wu J. (2024). A decision framework for Chinese-style cruise ship design based on informativeness weight method and group consensus reaching model. Advanced Eng. Inf.62, 102698. doi: 10.1016/j.aei.2024.102698
5
Deng T. Chau K. W. Duan H. F. (2021). Machine learning based marine water quality prediction for coastal hydro-environment management. J. Environ. Manage.284, 112051. doi: 10.1016/j.jenvman.2021.112051
6
Germano J. D. (1999). Ecology, statistics, and the art of misdiagnosis: The need for a paradigm shift. Environ. Rev.7, 167–190. doi: 10.1139/a99-014
7
Ham Y. Kim J. Luo J. (2019). Deep learning for multi-year ENSO forecasts. Nature, 568–572. doi: 10.1038/s41586-019-1559-7
8
Xuemei L. Cao Y. Wang J. Dang Y. Kedong Y . (2019). A summary of grey forecasting and relational models and its applications in marine economics and management. Mar. Econ Manage.2, 2: 87–2:113.
9
Li X. Wu X. Zhao Y. (2023). Research and application of multi-variable grey optimization model with interactive effects in marine emerging industries prediction. Technol. Forecast. Soc. Change187, 122203. doi: 10.1016/j.techfore.2022.122203
10
Li Z. Qi S. Li Y. Xu Z . (2023). Revisiting long-term time series forecasting: An investigation on linear mapping. arXiv preprint arXiv:2305.10721. doi: 10.48550/arXiv.2305.10721
11
Mao Z. Liu H. Zhang Z. (2023). Enhancing the ocean carbon sink capacity of Shandong province, China, under the “dual carbon” goal. Front. Mar. Sci.10, 1–6. doi: 10.3389/fmars.2023.1305035
12
Nielsen J. R. Thunberg E. Holland D. S. Schmidt J. O. Fulton E. A. Bastardie F. et al . (2018). Integrated ecological–economic fisheries models—Evaluation, review and challenges for implementation. Fish Fisheries19, 1–29. doi: 10.1111/faf.12232
13
Patrício J. Elliott M. Mazik K. Papadopoulou K. N. Smith C. J . (2016). DPSIR—two decades of trying to develop a unifying framework for marine environmental management. Front. Mar. Sci.3, 177.
14
Sun L. Ding P. Xiong Y. Liu W. Hu Z . (2022). Carbon emission reduction of shore power from power energy structure in China. Front. Mar. Sci.9, 1–11. doi: 10.3389/fmars.2022.1077289
15
Tao W. Guang-shun H. Li-jing D. Rui Z. Lu Y. Yue Y. et al . (2021). The framework design and empirical study of China’s marine ecological-economic accounting. Ecol. Indic.132, 108325. doi: 10.1016/j.ecolind.2021.108325
16
Wang C. Lin A. Liu C. (2023). Marine ecological security assessment from the perspective of emergy ecological footprint. Front. Mar. Sci.9, 1–13. doi: 10.3389/fmars.2022.1090965
17
Wen J. Yang J. Jiang B. Song H. Wang H . (2020). Big data driven marine environment information forecasting: a time series prediction network. IEEE Trans. Fuzzy Syst.29, 4–18. doi: 10.1109/TFUZZ.2020.3012393
18
Xu C. Y. Wang Y. Q. Yao D. L. Qiu S. Y. Li H. (2025a). Research on the coordination of a marine green fuel supply chain considering a cost-sharing contract and a revenue-sharing contract. Front. Mar. Sci.12, 1552136. doi: 10.3389/fmars.2025.1552136
19
Xu L. Huang J. C. Fu S. S. Chen J. H. (2025d). Evaluation of navigation capacity in the Northeast Arctic passage: evidence from multiple factors. Maritime Policy Manage.52, 497–513. doi: 10.1080/03088839.2024.2376126
20
Xu L. Li X. Yan R. Chen I. (2025b). How to support shore-to-ship electricity constructions: Tradeoff between government subsidy and port competition. Transport. Res. Part E: Logistics Transport. Rev.201, 104258. doi: 10.1016/j.tre.2025.104258
21
Xu L. Wu J. Yan. R. Chen J. (2025c). Is international shipping in right direction towards carbon emissions control? Transport. Policy166, 189–201. doi: 10.1016/j.tranpol.2025.03.009
22
Yan F. Wen S. Nepal S. Paris C. Xiang Y . (2022). Explainable machine learning in cybersecurity: A survey. Int. J. Intell. Syst.37, 12, 12305–12334. doi: 10.1002/int.23088
23
Yin F. Zeng B. (2022). A novel multivariable grey prediction model with different accumulation orders and performance comparison. Appl. Math. Model.109, 117–133. doi: 10.1016/j.apm.2022.04.031
24
Yin K. Zhang K. Yang W. (2024). A discrete GM(1,1) model based on probabilistic accumulation and its application to offshore gas production forecasting. Syst. Engineering-Theory Pract.44, 2733–2746. doi: 10.12011/SETP2023-1876
25
Zhang C. Bengio S. Hardt M. Recht B. Vinyals O . (2021). Understanding deep learning (still) requires rethinking generalization. Commun. ACM64, 107–115. doi: 10.1145/3446776
26
Zhou W. Jiang H. Dang Y. (2023). Construction and application of grey prediction model based on dynamic partial accumulation generation. Syst. Engineering-Theory Pract.43, 3353–3364. doi: 10.12011/SETP2022-2345
Summary
Keywords
marine economy, CDGM(1,1), DPSIR, sustainable development assessment, prediction
Citation
Dai Z, Chen J, Liu C, Gao X and Yang L (2025) Evaluation and prediction of marine eco-economic sustainable development using the CDGM(1,1)-DPSIR model. Front. Mar. Sci. 12:1687230. doi: 10.3389/fmars.2025.1687230
Received
17 August 2025
Accepted
29 September 2025
Published
20 October 2025
Volume
12 - 2025
Edited by
Lang Xu, Shanghai Maritime University, China
Reviewed by
Xu Changyan, Shanghai Maritime University, China; Yansong Shi, Ocean University of China, China
Updates
Copyright
© 2025 Dai, Chen, Liu, Gao and Yang.
This is an open-access article distributed under the terms of the Creative Commons Attribution License (CC BY). The use, distribution or reproduction in other forums is permitted, provided the original author(s) and the copyright owner(s) are credited and that the original publication in this journal is cited, in accordance with accepted academic practice. No use, distribution or reproduction is permitted which does not comply with these terms.
*Correspondence: Lin Yang, yanglin2128@126.com
Disclaimer
All claims expressed in this article are solely those of the authors and do not necessarily represent those of their affiliated organizations, or those of the publisher, the editors and the reviewers. Any product that may be evaluated in this article or claim that may be made by its manufacturer is not guaranteed or endorsed by the publisher.