Abstract
The Namibian hake fishery plays an essential role in both the national economy and marine biodiversity conservation. However, recent reports of declining catch volumes and profitability have raised concerns over the biological and economic sustainability of fishery. This study analyzes a 24-year dataset (2000-2024) using the Gordon-Schaefer bioeconomic model to assess sustainability, with a focus on defining Maximum Sustainable Yield (MSY), Maximum Economic Yield (MEY), and associated effort thresholds for two vessel types: wet-fish (DW) and freezer vessels (DF). In addition, using multivariate regression, we assessed the influence of environmental drivers, such as sea surface and bottom temperature anomalies, gear depth, haul duration, number of hauls, and spatial distribution. Haul duration was the only significant predictor (β = –69,179; p = 0.014), while bottom and surface temperature, mean gear depth, latitude, and number of hauls were not statistically significant (p > 0.05). The bioeconomic model outcome reveals a long-term decline of catch and CPUE trends, with historical lows recorded in 2024. The model’s estimated overall MSY was 132,832 tonnes with an EMSY (Ecosystem-based Maximum Sustainable Yield) of 53,534 hours, while MEY and EMEY (Ecosystem-based Maximum Economic Yield) were 125,413 tonnes and 38,188 hours, respectively. However, with the actual effort levels exceeding these thresholds, the findings suggest potential overexploitation and reduced economic efficiency. About 44% of the variance in catch by DF trawlers were explained by the bottom temperature model (R² = 0.44, Adj. R² = 0.37, p = 0.008). However, univariate relationships should be interpreted cautiously and primarily as exploratory patterns. Spatially, higher CPUE clusters were recorded between latitudes 24°S–28°S and at depths of 300–400 m. The economic assessments from 2018 and 2023 showed negative profitability when only hake revenue was considered, with breakeven prices increasing due to operational costs. However, profitability was attainable with the inclusion of ancillary revenues such as by-catch sales and quota leasing. Our study identifies the need to align fishing efforts with MEY to improve sustainability and economic returns. Long-term resilience of the hake fishery under changing climate can be achieved through stock rebuilding, adaptation to environmental variability, and implementation of cost-effective strategies.
1 Introduction
Namibian economy depends heavily on fisheries, alongside mining and agriculture, as a source of income, foreign exchange, and employment (Chiripanhura and Teweldemedhin, 2016; Sherbourne, 2010). The fisheries sector is a significant source of employment, with the hake industry (comprising Merluccius capensis and M. paradoxus) alone providing jobs for approximately 18,000 people, including both seagoing personnel and those involved in onshore processing (MFMR, 2023). Fish and fishery products contributed N$10 billion ($608.4 million) in export value and yielded 501,387 metric tonnes in 2020 (MFMR, 2021). In addition, the Namibian fishing industry, exports about 75% of its seafood products to over 80 countries with Spain, South Africa, and France being the three main consumers.
However, the contribution of the fishery industry to the national gross domestic product (GDP) declined from 7.2% in 2003 to 3% in the first quarter of 2025 (Erasmus et al., 2021; Kirchner, 2014; NSA, 2025). This decline is partly attributed to reductions in the stocks of key commercial species, including hake (Kirchner et al., 2012), sardine (De Oliveira et al., 2007), and horse mackerel (Kirchner et al., 2010). Namibia’s marine ecosystems and fish landings face growing threats from climate variability, fisheries management programs, and increasing fishing costs (Engelhard et al., 2024). These challenges impede the optimal economic viability of the country’s fishery resources, including the hake fishery.
Hake is one of the major species in the country, contributing to approximately 7.4% of Namibia’s total estimated exports, with a projected export value of USD 21.6 million in 2023 (Wilhelm et al., 2015; WITS, 2024). The two most common hake species are (1) cape or shallow-water hake (Merluccius capensis), found in shallow water occurring at 200-meter isobaths, and (2) the deep-water hake (Merluccius paradoxus), found in deeper water around 350-meter isobaths (Forde et al., 2025; Jansen et al., 2015). Together, these species accounted for approximately 38.8% of total landings in 2021 (MFMR, 2021). The latter is usually targeted by freezer trawlers while the former is typically caught by wet-fish trawlers (Sumaila, 2004). Freezer trawlers which are > 70 m long are equipped to freeze the catch onboard, while the wet-fish trawlers, generally about 30–50 m long, do not freeze their catches at sea, but instead store them on ice (Paterson, 2015).
The two hake species, however, are commonly managed as a single species group, as their differences are still not well understood (Kirchner et al., 2012). Despite the hake sector being an essential contributor to the Namibia’s blue economy, contributing significantly to the national economic development, its economic and ecological sustainability has recently been compromised. The total catch and landing of these species has continued to decline over the years. For example, the recent landings of hake has declined from 150,219 metric tonnes in 2016 to 122,429 metric tonnes in 2020 (MFMR, 2021). Hence, understanding the yield trends over the last decades, the adaptive management programs, effects of different environmental, and economic stressors are critical for adaptive management and long-term policy planning.
In the early 2000s, the total allowable catch (TAC) was deliberately reduced by the Ministry of Fisheries and Marine Resources in what was called “Interim Management Procedures” to ascertain the status of the species in the country’s territorial waters, but this does not account for its recent decline in landings (Butterworth and Geromont, 2001). The hake resource in Namibia is believed to be significantly below the level necessary to achieve maximum sustainable economic yield, which means that rebuilding the resource could enhance the present value of the industry’s future earnings (Elwen et al., 2025). However, the total allowable catch (TAC) for the two species has frequently not been fully landed (in 14 out of 21 years since the country’s independence) (Kirchner and Leiman, 2014), with the fishing companies continually requesting for increased quotas. The TAC is divided annually between freezer and wet-fish trawlers with each right-holder allocated an individual quota share of the TAC (Neethling and Goedhals-Gerber, 2023). Historically, approximately 60% of the TAC were often allocated to the wet-fish trawlers, while 30-40% were allocated to the freezer trawlers (Ithindi, 2003; Kirchner and Leiman, 2014). Other relieving requests commonly sought are reducing quota fees, extending payment schedules, or converting wet fish quotas to freezer quotas, which are perceived by the industry as more profitable.
With Namibia considered as an arid country, the impact of physical environment such as temperature could also be significant in the management of hake fisheries in the country. Studies have identified various biological and ecological impacts of rising temperatures in Namibian territorial waters (Engelhard et al., 2024; Kainge, 2013). Namibia is one of the countries expected to experience significant impacts from climate change on its marine ecosystems and the fisheries resources across its territorial waters (Engelhard et al., 2024; Kapuka and Hlásny, 2021). The country borders the Benguela Current Large Marine Ecosystem (BCLME), alongside Angola and South Africa. The current is characterized for its high productivity and high environmental variability (Hutchings et al., 2009). BCLME drives Benguela Niño which occurs roughly at decadal intervals and are known to cause intrusions of significant warmness, low-oxygen, and nutrient-poor water from the north are observed (Engelhard et al., 2024; Imbol Koungue et al., 2019). Recent climate-induced changes in the region include warming sea temperatures in the north, contrasting with cooling trends in the south (Lima and Wethey, 2012). While studies such as Engelhard et al. (2024) and Neethling and Goedhals-Gerber (2023) have established the biological and market relationships of the hake fishery with temperature changes, Gordoa et al. (2000) and Macpherson et al. (1991) examined the relationship between hake catches and bioeconomic factors in relation to temperature changes in the 90s. However, while these studies identified the influences of temperature changes on catch rates and other biological dynamics in the hake fishery, their economic implications such as the cascading effects of how the shifts affect the profitability, operational sustainability, and adaptive capacity of different vessel types and stakeholders — remain poorly understood. Aside from temperature, other environmental factors such as gear depth and latitude have also been identified to have significant influences on catchability and distribution in the hake fishery (Kainge et al., 2015, 2017).
Johnsen and Iilende (2007) showed that diel differences in CPUE varied with both latitude and depth, with CPUE around noon being 3.6 times higher than at night. Similarly, Kainge et al. (2015) and Kainge and Wieland (2017) found that temperature, oxygen, and depth strongly influenced the structures of hake distribution and size composition. While these studies highlighted the ecological impacts of these variables, they did not investigate their influence on fishing effort or economic performance. Since climate change alters both temperature regimes spatial distribution of hake, a more comprehensive understanding of how environmental and operational factors influence fishery performance can be achieved by integrating gear depth and latitude into bioeconomic framework. Kirchner (2014) used a bio-economic model to evaluate alternative management strategies for Nambian’s hake fisheries, estimating current economic rent and projecting future profits under different scenarios. The study found that the hake industry’s revenue is strongly impacted by the exchange rate [South African currency (ZAR) to Euro (€)], with a strong Nambian dollar significantly reducing export income. High labor and fuel costs, especially in the wet-fish sector, further strain profitability due to inefficiencies and underutilized vessels. For example, studies have reported that fuel costs are specifically burdensome in the wet-fish sector, as trips tend to be shorter (~8–9 days) and the reliance on-board ice which increases labour and fuel landed (Elwen et al., 2025; Kirchner, 2014). Hence, when CPUE is low and catchability is reduced by environmental conditions, vessel operators may choose to keep vessels idle to avoid losses (Cooper and Jarre, 2017; Gordoa et al., 2000). Freezer vessel operators face additional challenges from insufficient quotas, often leasing at high costs, while non-operating quota holders profit with minimal risk. The insufficient quota allocation is not necessarily due to limited resource availability, but rather a malignment between the allocated quota size and minimum viable operating scale. For example, freezer vessels are known to incur high fixed costs, and without sufficient quota to offset these, they are compelled to lease additional quota, which may constitute upto 20% of their total operational expenses (Kirchner and Leiman, 2014).
While existing studies have focused narrowly on either biological or economic factors solely to assess the various effects on the hake fishery, there is currently no harmonization of the interactions among these variables, and the integration of both will enable a depth-structured approach to assess the dynamics and economic performance of the hake sector in the country. Hence, this study integrated bioeconomic modeling and environmental indicators to introduce approach to effort and catch, enhancing understanding of gear-ecosystem interactions in demersal fisheries. Our study aims to: (1) evaluate the sustainability of the commercial hake fishery (M. capensis and M. paradoxus) off the coast of Namibia by identifying key economic reference points such as Maximum Economic Yield (MEY), Maximum Sustainable Yield (MSY), their corresponding effort levels, profits, and breakeven points using a bioeconomic model across vessel types; (2) assess the impact of surface and bottom temperature changes on the fisheries of these two species, and its relationship with hake catches and vessel types; and (3) investigate the impacts of gear depth and fishing location on catch rates of hake species. The study provides novel insights into climate-adaptive and effort-based management by linking ecological variability with economic performance in the Namibian hake fishery.
2 Materials and methods
2.1 Study area
Namibia’s Exclusive Economic Zone lies within the BCLME, a highly productive ecosystem, characterized by wind-driven coastal upwelling that supports high primary production and commercially valuable fish stocks (Gallego et al., 2025; Sowman and Cardoso, 2010). The country’s 1,572 km coastline stretches along the hyper-arid Namib Desert and the South Atlantic Ocean. The country has two ports, Walvis Bay and Lüderitz, where all fishing vessels dock (Figure 1). The country is located in the southwest of Africa, bordered by South Africa, Botswana, Zambia, Zimbabwe, and Angola. The country has an area of 824, 296 square kilometers with a population of about 3 million people (Namibia Statistics Agency, 2023). The combination of the desert and typography of the Namibian coastline such as the inhospitable arid land between the desert and the sea has limited coastal settlement (Manning, 1998).
Figure 1
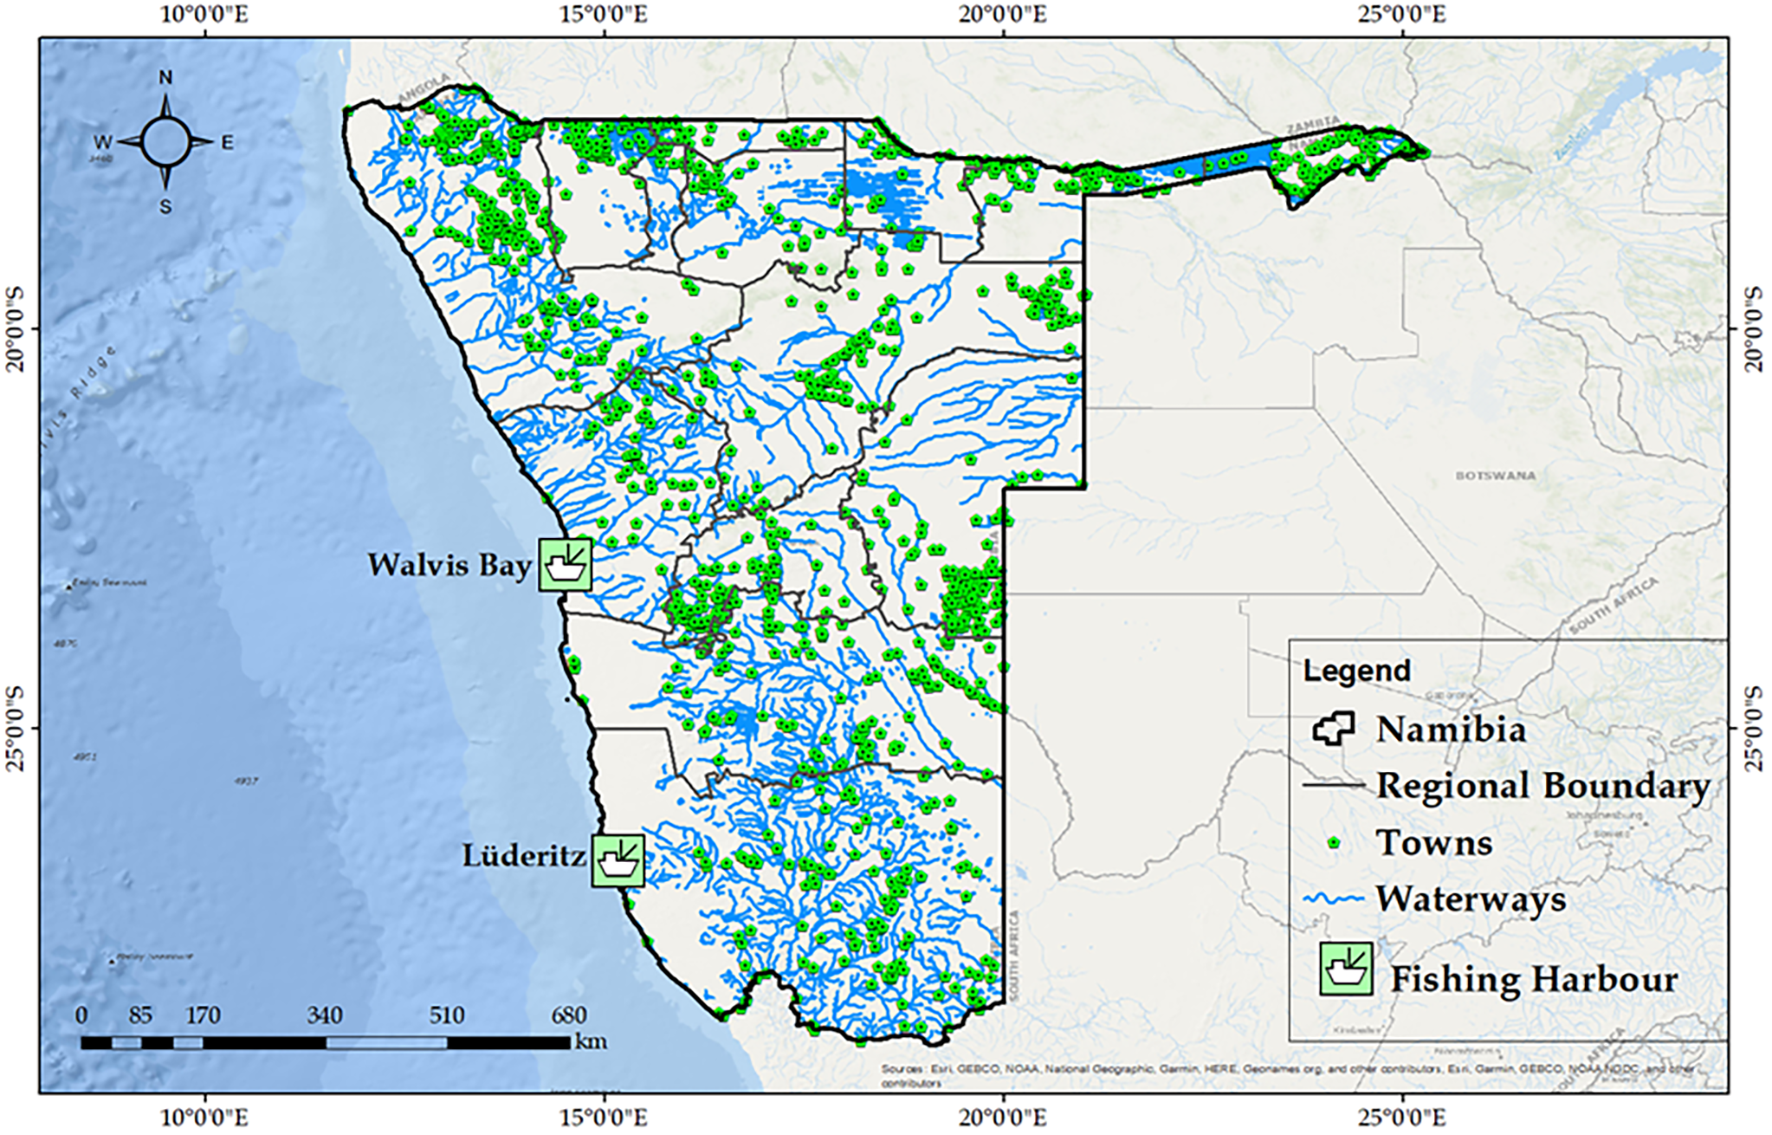
Map of Namibia’s Exclusive Economic Zone (EEZ), provincial boundaries, major coastal fishing harbours, and inland towns. The EEZ is delineated by the shaded light blue to indicate maritime jurisdiction. Administrative provinces are labeled with adjusted centroid placements, and key population centers are shown with name labels and port symbols. The waterways (rivers and lakes) are also included to provide hydrological context.
2.2 Data sources
2.2.1 Secondary data source
The data used in this study, covering the period from 2000 to 2024, are secondary, and were provided by the Namibian Ministry of Fisheries and Marine Resources (NMFMR). These data were collected by its National Marine Information Research Centre (Swakopmund, Namibia). Biological data such as catch, fishing efforts (fishing durations in hours), gear depth, geolocation (longitude and latitude), and the date of sampling (month and year), were collected by trained captains onboard commercial vessels harvesting hake. These captains, trained by Ministry scientists, were instructed on biological data collection and onboard sampling methods. The data are documented in logbooks, which are cross-checked and signed by vessel captains to verify all entries.
The hake data used constitutes the entire Namibian coastline where commercial vessels trawl, mostly between latitudes 17° to 29°S, and longitudes 10° to 17°E at 300–500 m bottom depth (Johnsen and Kathena, 2012). The biological and catch data consisting of 274,653 observations were received in an Excel format and were checked for errors before sorting and analyzing. The dataset includes two vessel types [freezer (DF) and wet-fish trawlers (DW)], along with information on year, number of days at sea, number and duration of tows, fishing depth, and catch weight (converted from kilograms to tonnes for ease of interpretation). The economic data, available only for the period from 2018 to 2023, consist of aggregated income and expenditure records from 47 quota holders. These data were not categorized into the vessel types (wet and freezer), but represent the total cashflow flow of Namibia’s hake fishing industry. The expenditure included operational costs such as salaries, fuel, consumables, fees and levies, acquisition of raw materials, and professional fees, among others. The aggregated annual revenue consisted of income from hake sales, by-catch sales, vessel charter fees, and fees from other operators for the usage of quota.
To ensure that relative contribution of each vessel was preserved in the combined estimates, the data of catch, effort, and cost were first standardized at the vessel level and subsequently aggregated across fleets using weighted averages based on landings. This approach helped in minimizing the risk of masking vessel-specific characteristics, which could occur with simple pooling (Kirchner and Leiman, 2014; Kirchner, 2014).
2.3 Models
To investigate economic and environmental sustainability of Namibia’s commercial hake fishery, (1) We assessed the sustainability of hake harvesting level by comparing the stock of hake through catches with the obtainable maximum yield (biological overfishing); and (2) the effect of the rate of increase of fishing effort on profits or resource rent and their maximization (economic overfishing). To provide essential values regarding long-term sustainability, Maximum Sustainable Yield (MSY), Maximum Economic Yield (MEY), and their corresponding effort levels were determined. This will help evaluate whether the current state of the hake fishery in the country’s territorial waters aligns with these reference points.
Furthermore, we employed Gordon-Schaefer model to integrate the biological and economic aspects of the hake fishery (Habib et al., 2014). This model considers fish stock dynamics, harvest levels, and fishing effort to provide holistic recommendations and insights for optimal, biologically and economically sustainable fishery management. According to Flaaten et al. (2017), the bioeconomic model is particularly useful for determining the long-term sustainable yield of a fishery. For this study, a single species bioeconomic model was used to focus specifically on the hake fishery.
2.3.1 Biological models
It is assumed that the overall hake stock follows a logistic growth curve. Flaaten and Mjølhus (2010), described the use of static Gordon Schaefer model in a theoretically manner as follows:
Where F(X) is the biomass growth per unit of time (natural growth), X is stock size, K is the carrying capacity, and r is the intrinsic growth rate of fish.
The Schaefer catch equation is referred to as the short-run harvest function and it is contingent on the level of the stock size and the effort, as shown below.
where H is catch measured in terms of biomass and fishing effort, and q is a constant catchability coefficient, while E is fishing effort.
When the rate of fishing is equal to the rate of natural stock growth, then the population will be at equilibrium, i.e., . This means qEX = based on Equations 1, 3. This gives us the biomass at equilibrium, solved to be:
Inserting Equation 3 into Equation 2 results in the long-term harvest function.
Hence;
where a=qK and b=
The long-run equilibrium harvest levels will increase with the level of effort until the maximum sustainable yield and after the MSY point, the harvest will start to decline despite the increase in effort.
Given the assumption of equilibrium harvesting, time series of catch and effort data will enable the estimation of a and b in Equation 5 by linear regression of the CPUE on effort (Berachi, 2003). To derive the catch per unit effort (CPUE), Equation 4 was divided by effort. CPUE measures the amount of harvested fish either in tons, kilograms or pounds in relation to the number of vessels (effort), number of fishing days or trawl hours at sea (Equation 6).
Therefore, CPUE =
To account for potential non-linear responses of hake landings to temperature changes, we explored quadratic terms in the regression models. In addition, temperature can exhibit an optimal range for target species, influencing catch of fish landings due to physiological stress, prey availability, or other environmental constraints. This approach has been applied in studies such as Fiorella et al. (2021) and Mediodia et al. (2023; 2024).
To investigate a combined effect of different predictors, we employed a multivariate ordinary squares (OLS) regression using annual aggregates (2000-2024). The total annual catch was the response variable, while predictors included average bottom and surface temperatures, mean gear depth, mean trawling latitude, mean haul duration, and average number of hauls. We fitted all models on complete cases with an intercept term; outcomes were reported as coefficient estimates with standard errors, t-statistics, p-values, and 95% confidence intervals, alongside model fit statistics (R², adjusted R², F, and model p).
2.3.1.1 Quota constraints
To evaluate quota constraint, realized catch was defined as the minimum of predicted catch and observed landings by vessel types (DF/DW). Observed landings were used as a proxy for allocated quotas, ensuring harvests did not exceed quota limits. In sensitivity tests, quota caps were varied by ±10% and conclusions were unaffected.
2.3.2 Economic models
Munro (1982) explained the connection between economic and biological models of fisheries, emphasizing that the usefulness of any economic model is rooted in the biological dynamics of the fishery. The bioeconomic model integrates harvest functions with revenue and cost components to evaluate the economic performance of the fishery, allowing for the estimation of optimal effort levels that maximize net returns, rather than focusing solely on harvest inputs.
The unit price of the harvest and the unit cost of fishing effort will be assumed constant and used to define the total sustainable revenue (Equation 7). The total revenue at equilibrium is as follows:
Where p is the average price per ton of fish.
Assuming a constant cost per unit effort and also assuming the relationship between cost and effort to be linear (Equation 8), then the total cost of fishing effort is given by:
Where c is the unit cost of fishing effort which is a combination of opportunity cost of labour, fuel, food and provision, vessel supplies and crew costs.
The total economic rent (profit) of the fishery is the difference between the total revenue and the total cost (Equation 9). The sustainable economic rent will be:
Under open access to the fishery, total fishing costs are equal to total revenues. I.e. if there is no limitation of access, effort will enter until all profits are dissipated (Check Equation 10). Using the Gordon Schaefer’s model, the open access effort can be derived by equating TC (E)=TR (E) which yields:
Given that the fishery is considered to be well-managed, this equation in not applicable because of the non-open access program of the hake fishery under consideration.
The maximum sustainable economic yield is obtained for sustainable catch realized at efforts lower than the EOAY (Clark, 1973), or more specifically when the difference between revenue and costs are maximized.
Using the total economic rent equation , the effort at maximum economic yield (EMEY) occurred where marginal revenue equals marginal cost (Equation 11), maximizing economic rent, as shown below:
Linear regression of the catch per unit effort on effort can be used to estimate parameters a and b, since the catch and effort data for the Namibian hake fishery are available. Therefore, effort at maximum sustainable yield (EMSY) can be estimated by taking the partial derivatives of harvest (H) with respect to Effort (E) and setting it equal to zero as (Equation 12):
And therefore, the output at MSY (Maximum Sustainable Yield) is (Equation 13):
However, while the assumption of constant values of costs and prices allow for comparisons of EMSY and EMEY across the study period, it does not fully capture temporal changes in fuel prices, quota costs, or market values which had substantially varied in the last few years.
3 Result
3.1 Historical trends in effort, catch, and CPUE
The 23-year dataset obtained from NMFMR was validated, and the units were standardized to analyze trends in fishing effort, total catch, and CPUE, establishing baseline indicators of fishery performance before applying the bioeconomic model.
Total catch fluctuated considerably across the study period. The catch of the wet-fish trawlers (DW) decreased from 2000, reaching a low of 2,074 tonnes in 2003, before steadily increasing to a peak of 91,862 tonnes in 2010 (Figure 2A). Their catches fluctuated from 2014 to 2022 followed by a sharp decline to 47,937 tonnes in 2024. In contrast, the catches of freezer trawlers showed a consistent downward trend, declining from a peak of 71,759 tonnes in 2003, to a low of 29,526 tonnes in 2024. The decline of the catches from 2000 to 2003 especially by the DW trawlers could reflect TAC reductions and management programs introduced during this period, followed by a sharp increase as quotas were relaxed.
Figure 2
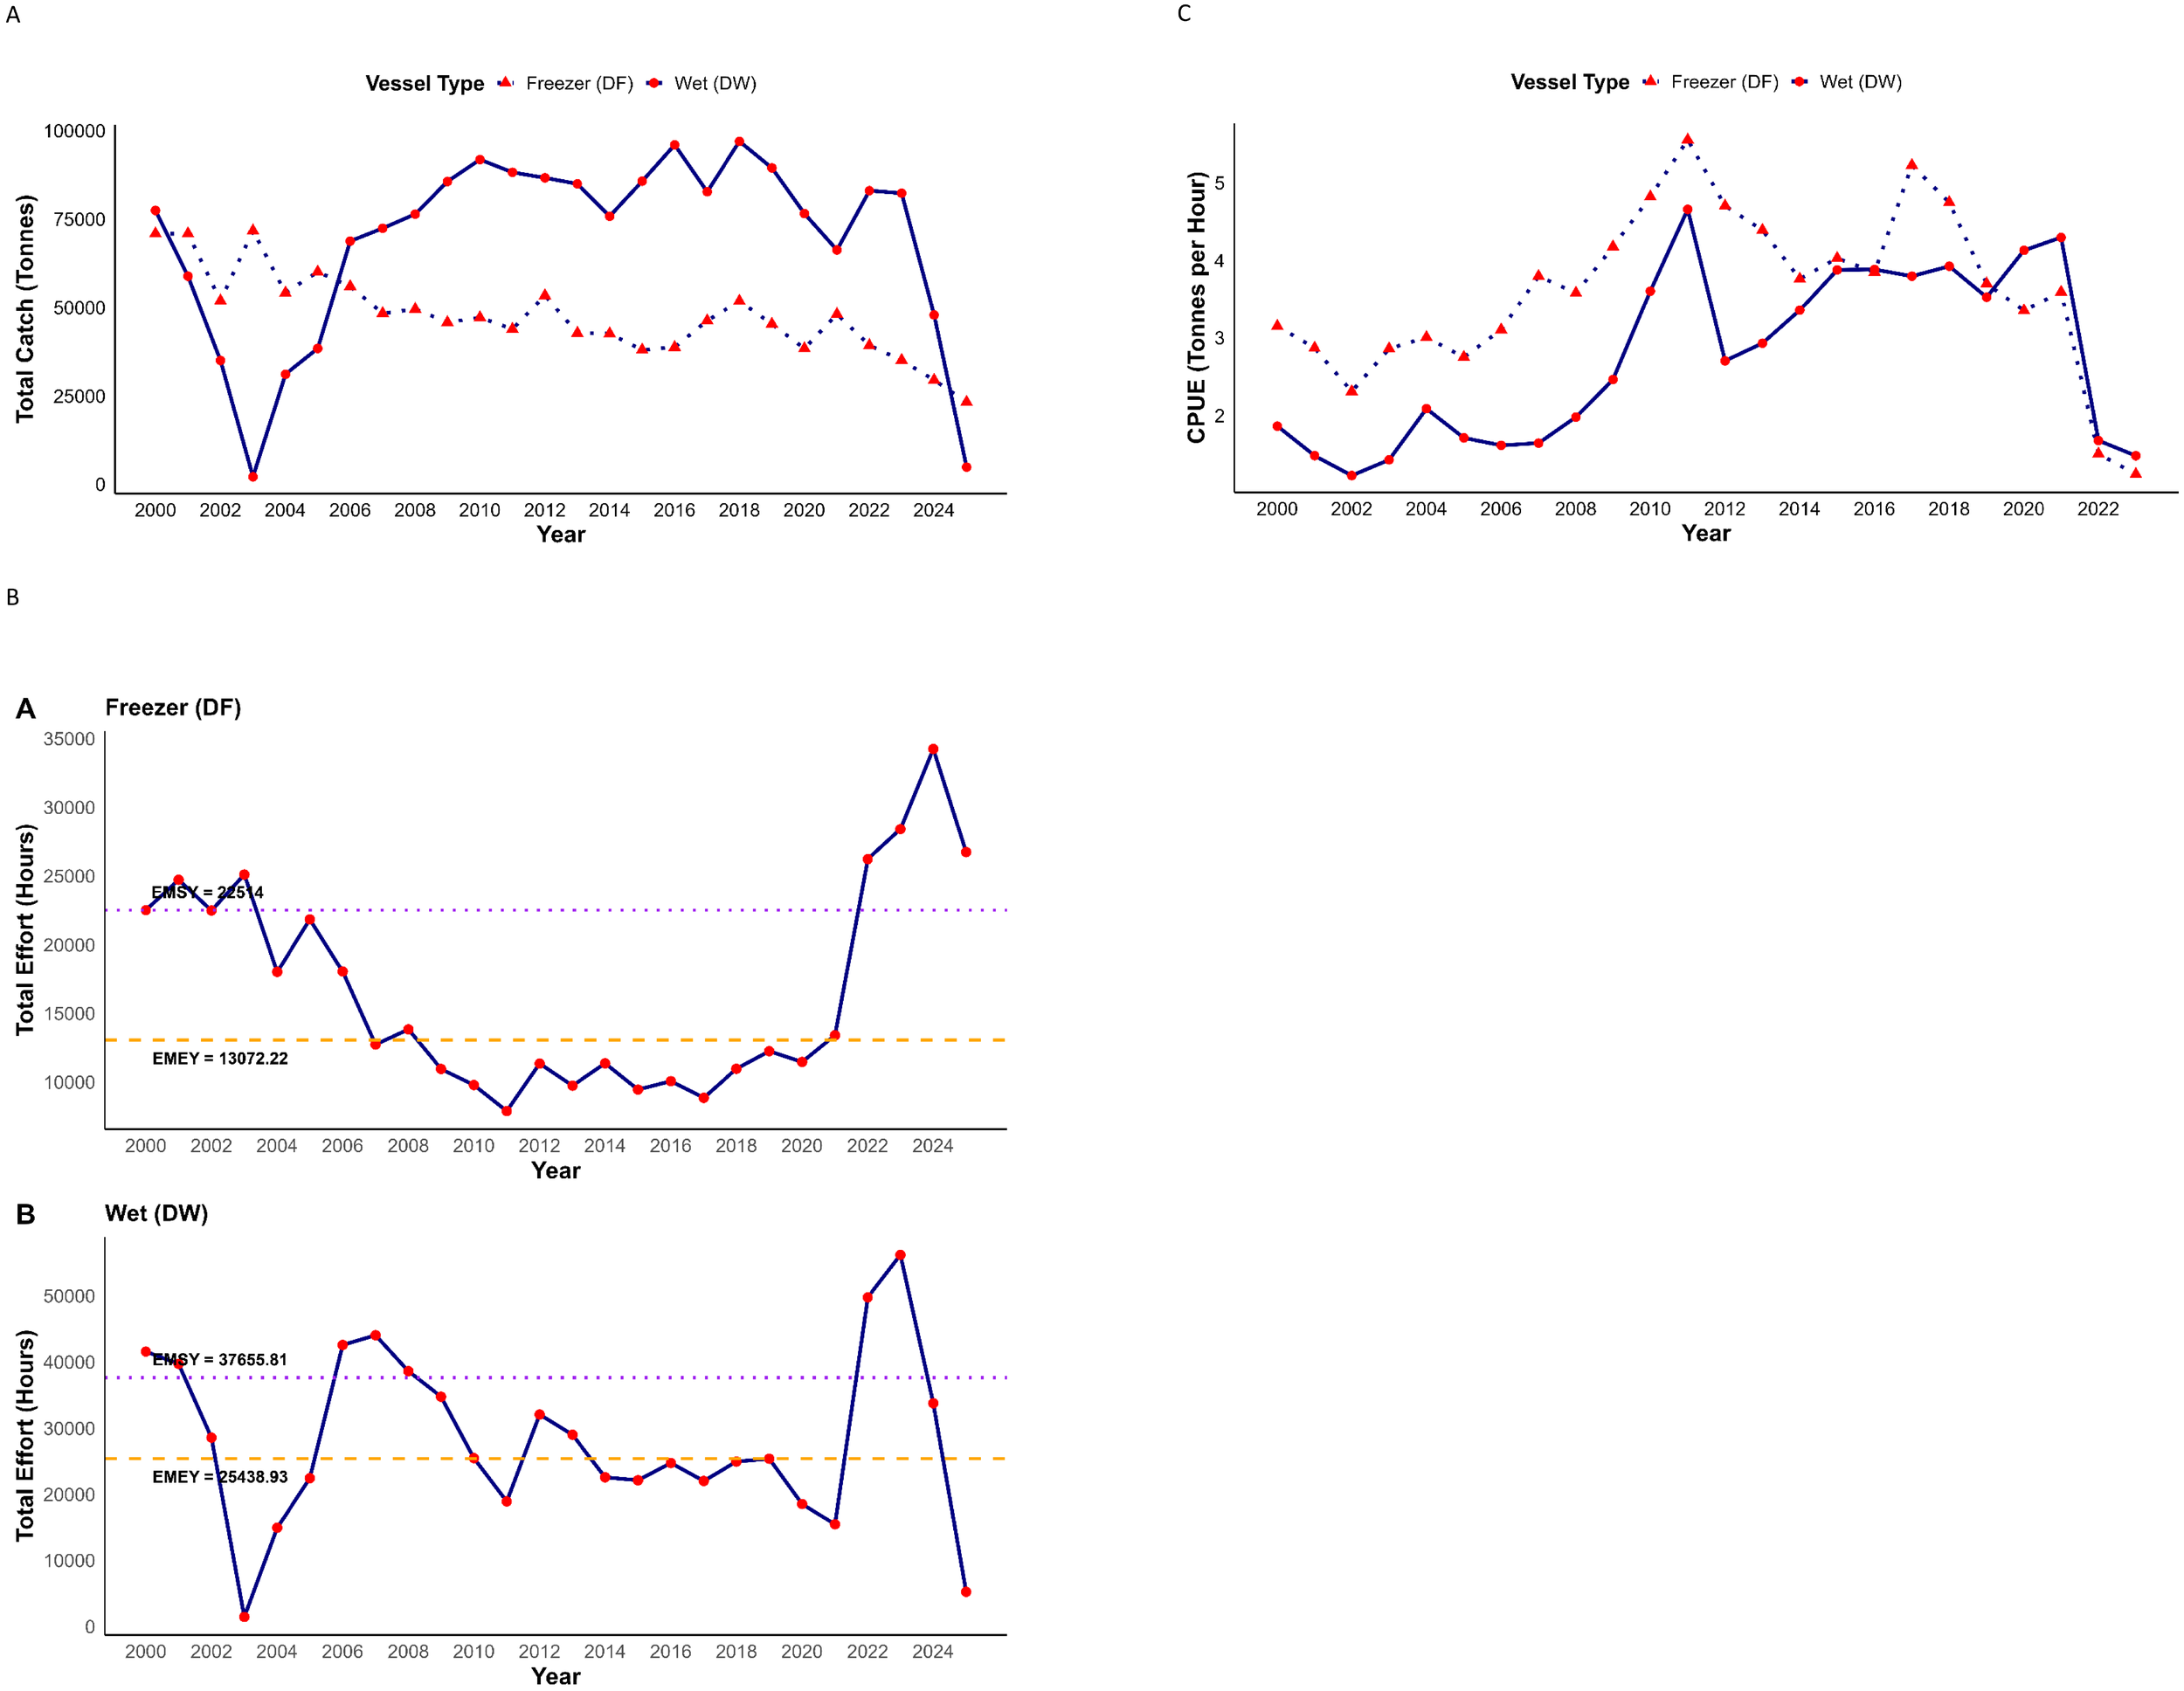
(A) Annual total hake catch (tonnes) in Namibia’s fishery by freezer and wet-fish trawlers from 2000 to 2024. (B) Annual fishing effort (hours) in Namibia’s hake fishery from 2000 to 2024. The horizontal dashed line represents the bioeconomic reference point for effort at Maximum Economic Yield (EMEY, orange), while the dotted line represents effort at Ecosystem-based Maximum Sustainable Yield (EMSY, purple). (C) Annual trends of Catch per unit effort (CPUE) for freezer and wet-fish trawlers in hake fishery between 2000 and 2024.
We assessed the historical fishing effort for both DF and DW, overlaid with estimated EMSY and EMEY as bioeconomic reference points, for the period between 2000 and 2024 (Figure 2B). In the early 2000s, the effort was consistently above EMEY (13,072 hours) and the EMSY (22,514 hours) in the DF trawlers (Figure 2B). However, it was marked by a sharp decline in 2005, reaching a low of 7,903 hours in 2011. Despite increasing to 11,356 hours in 2012, it remained below EMEY and EMSY until 2021 when it reached 13,409 hours. It continues to increase, reaching 35,000 hours in 2024. In contrast, in the DW hake fishing history, the effort hours sharply declined from 41,588 hours in 2000 to 1,451 hours in 2003. It however sharply increases from 2004, reaching 44,054 hours in 2007, from where it began to decline again, reaching 18,942 in 2011. Between 2013 and 2021, effort remained below the EMSY (37,655 hours) and EMEY (25,438 hours). Overall, the fishing efforts of both DF and DW trawlers fluctuated markedly over the study period, frequently exceeding the thresholds of EMSY and EMEY, which indicates sustained fishing pressure above the bioeconomic reference points.
3.2 Fishing effort and catch per unit effort - CPUE
CPUE, expressed in tonnes per hour, was used as a proxy for fishing efficiency and relative stock abundance. A linear regression of CPUE against total annual fishing effort revealed a significant negative relationship (R² = 0.50, p < 0.05), consistent with diminishing returns under increased fishing pressure. In other words, as trawling effort increased, the average catch per hour declined, suggesting either declining hake stock productivity or reduced catchability over time.
We assessed the relationship between CPUE and fishing effort across the two vessel types (Figure 3). In the DW dataset, we observed a significant negative relationship between fishing effort and CPUE (R2 = 0.2, p = 0.029), indicating that higher fishing effort was associated with lower CPUE. A similar trend was also observed for DF trawlers; however, the relationship was weaker and statistically non-significant (R2 = 0.04, p = 0.358). Overall, the significant decline of CPUE with increasing effort observed in DW trawlers, but not in DF trawlers indicates contrasting responses in catch efficiency between the two vessel types, possibly reflecting differences in the fishing strategies or sensitivity to stock abundance under varying fishing pressure. In addition, the sharp decline in efforts and catch in recent years likely reflects a combination of factors such as reduced stock productivity, lower catchability under unfavourable environmental conditions, and economic pressures on the fishing vessels.
Figure 3
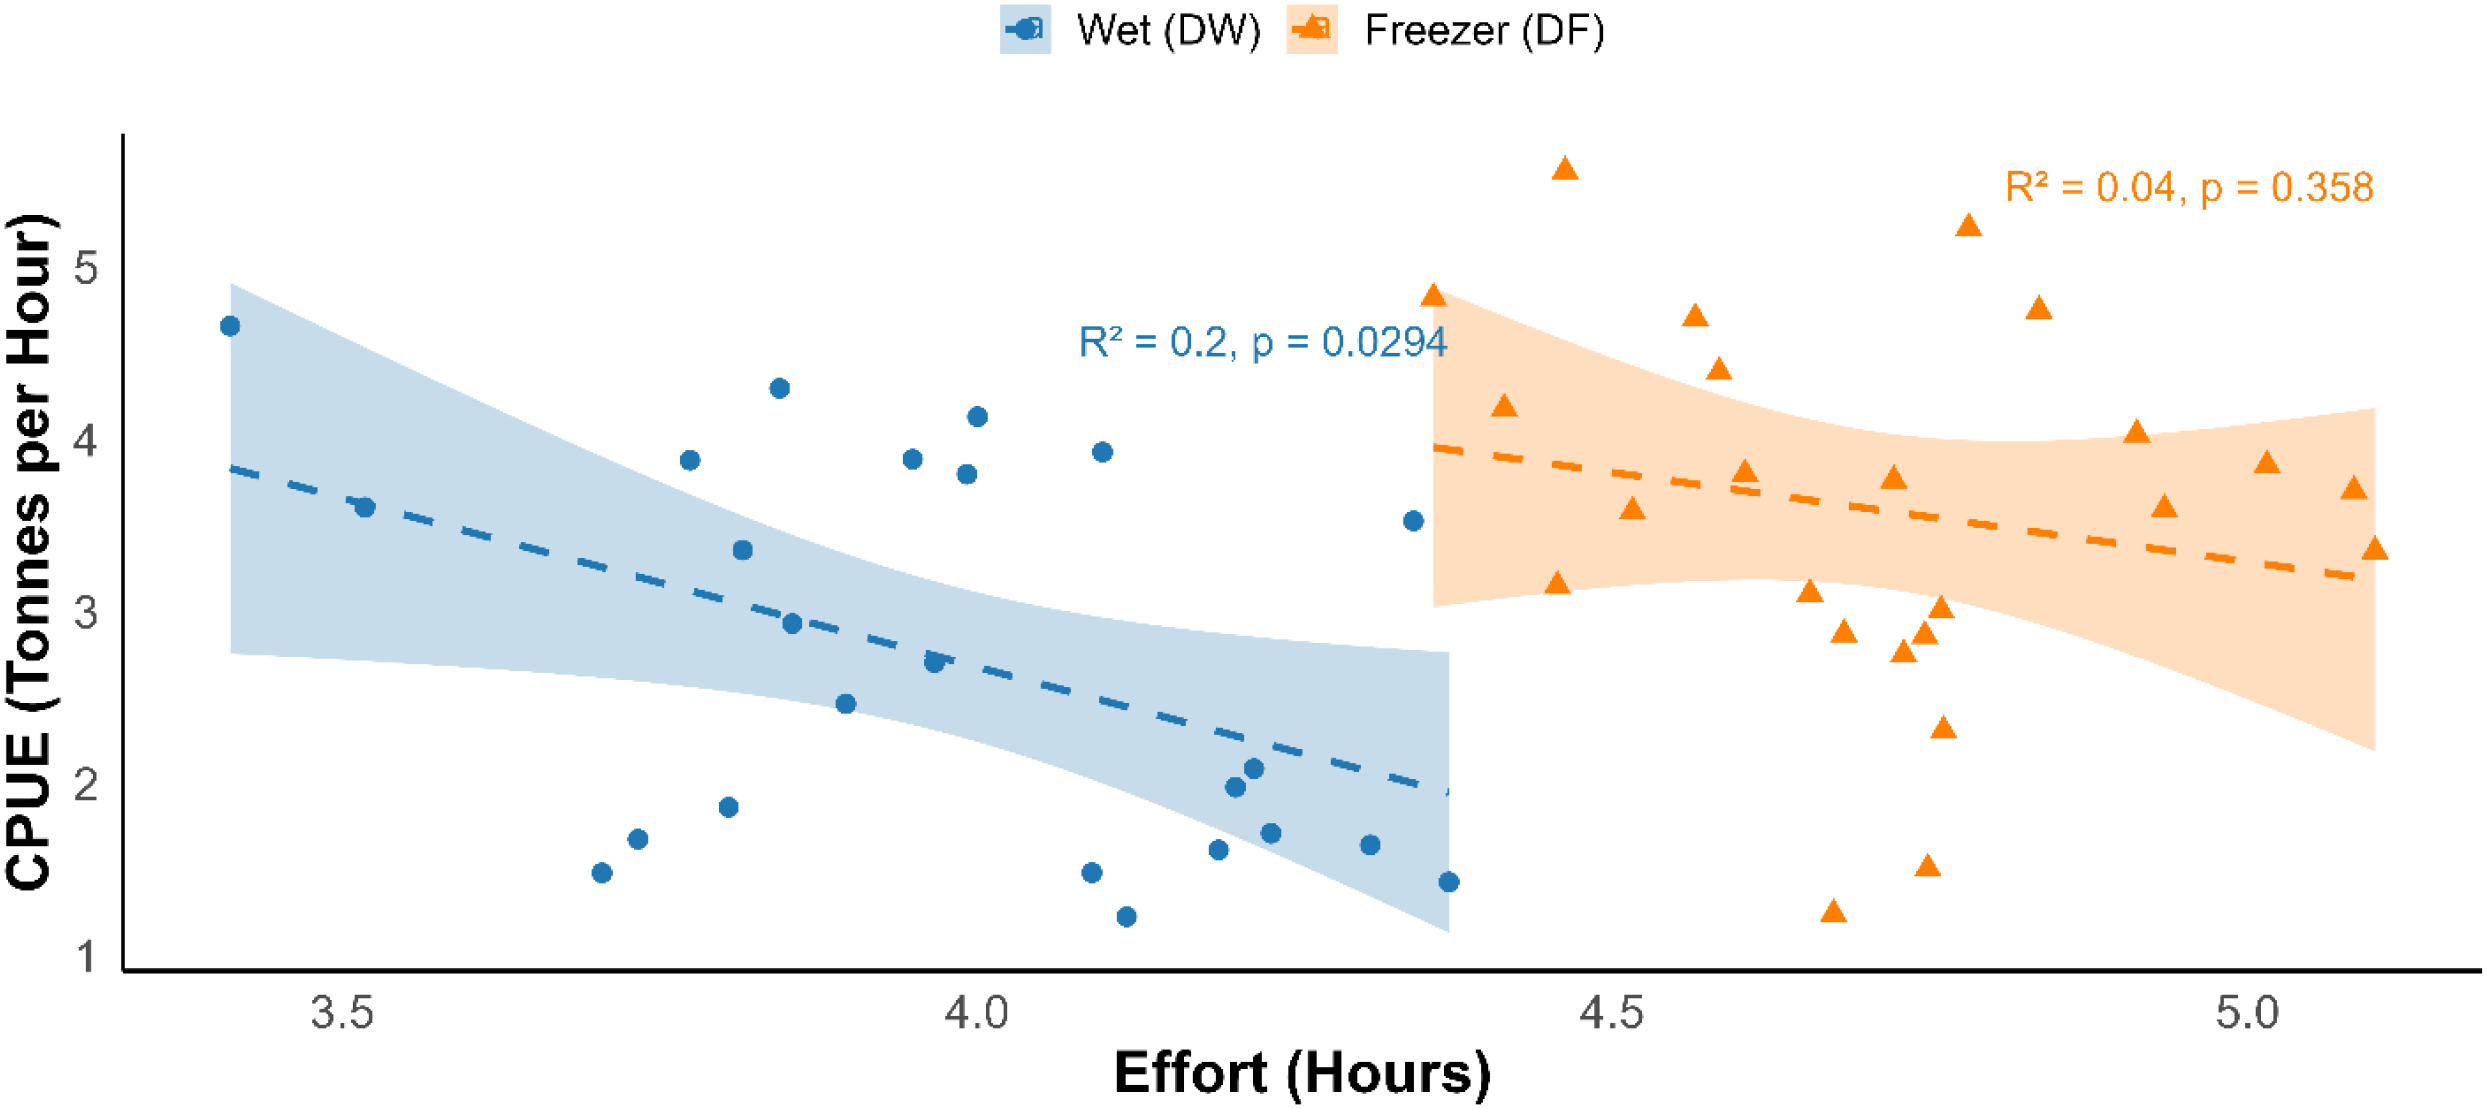
A regression plot showing the relationship between fishing effort (hours) and catch per unit effort (CPUE, in tonnes per hour) in Namibia’s hake fishery between year 2000 and 2024. The blue dashed line represents fitted linear regression for the wet-fish trawlers (DW) while the orange dashed line represent the one for the freezer trawlers. The shaded region shows 95% confidence interval.
3.3 Bioeconomic reference points and fishery performance
To assess the biological and economic performance of Namibia’s hake fishery, we applied the Gordon-Schaefer bioeconomic model using vessel-specific effort and catch data. The model estimates key reference points under equilibrium conditions, including Maximum Sustainable Yield (MSY) and Maximum Economic Yield (MEY), separately for freezer (DF) trawlers, wet-fish (DW) trawlers, and the overall fleet.
These biological reference points are presented in Table 1. The estimated effort to achieve MSY (EMSY) was 22,009 hours for DF vessels and 38,882 hours for DW vessels. The corresponding maximum yields were 53,600 tonnes and 85,971 tonnes for DF and DW trawlers respectively. On the other hand, the overall EMSY was 53,534 hours with a corresponding MSY of 132,832 tonnes. EMEY were consistently lower across both vessel categories. The EMEY was 12,494 hours for DF vessels, 25,427 hours for DW vessels, and 38,188 hours for the combined fleet. The stock levels at MEY was slightly lower than those at MSY, with values of 47,666 tonnes for DF, 79,907 tonnes for DW, and 125,413 tonnes for the overall fleet. The mismatch between DF effort and catch could be associated with a lagged stock response to reduced fishing pressure, with possible compensation by increased DW activity favourable environmental conditions.
Table 1
| Vessel type | EMSY (hours) | EMEY (hours) | MSY (tonnes) | MEY (tonnes) |
|---|---|---|---|---|
| DF | 22,009 | 12,494 | 53,600 | 47,666 |
| DW | 38,882 | 25,427 | 85,971 | 79,907 |
| Overall | 53,534 | 38,188 | 132,832 | 125,413 |
Estimated biological and economic reference points for Namibia’s hake fishery based on the Gordon-Schaefer bioeconomic model.
3.3.1 Economic performance
Economic performance was evaluated under two revenue scenarios: (i) hake-only income, and (ii) hake plus ancillary income (including bycatch revenue, charter fees, and quota leasing), using reported income and cost data for the years 2018 to 2023. It is essential to state that bycatch are regulated by MFMR, and operators are subject to pay bycatch fees designed to prevent targeting valuable species such as Monkfish (Lophius vomerinus) and Kingklip (Genypterus capensis) while avoiding incentives for discarding (Kirchner and Leiman, 2014).
In the hake-only scenario, the fishery operated at a net loss during the period examined, with maximum profit recorded at –N$186.9 million (≈–USD 12.9 million), despite effort reaching 37,650 hours (Figure 4). In contrast, the hake + ancillary income scenario yielded a positive maximum profit of N$532.5 million (≈USD 36.7 million) at the same effort level. Maximum catch were recorded at approximately 35,937 hours of effort in both scenarios, which fell below the overall EMSY (53, 534 hour).
Figure 4
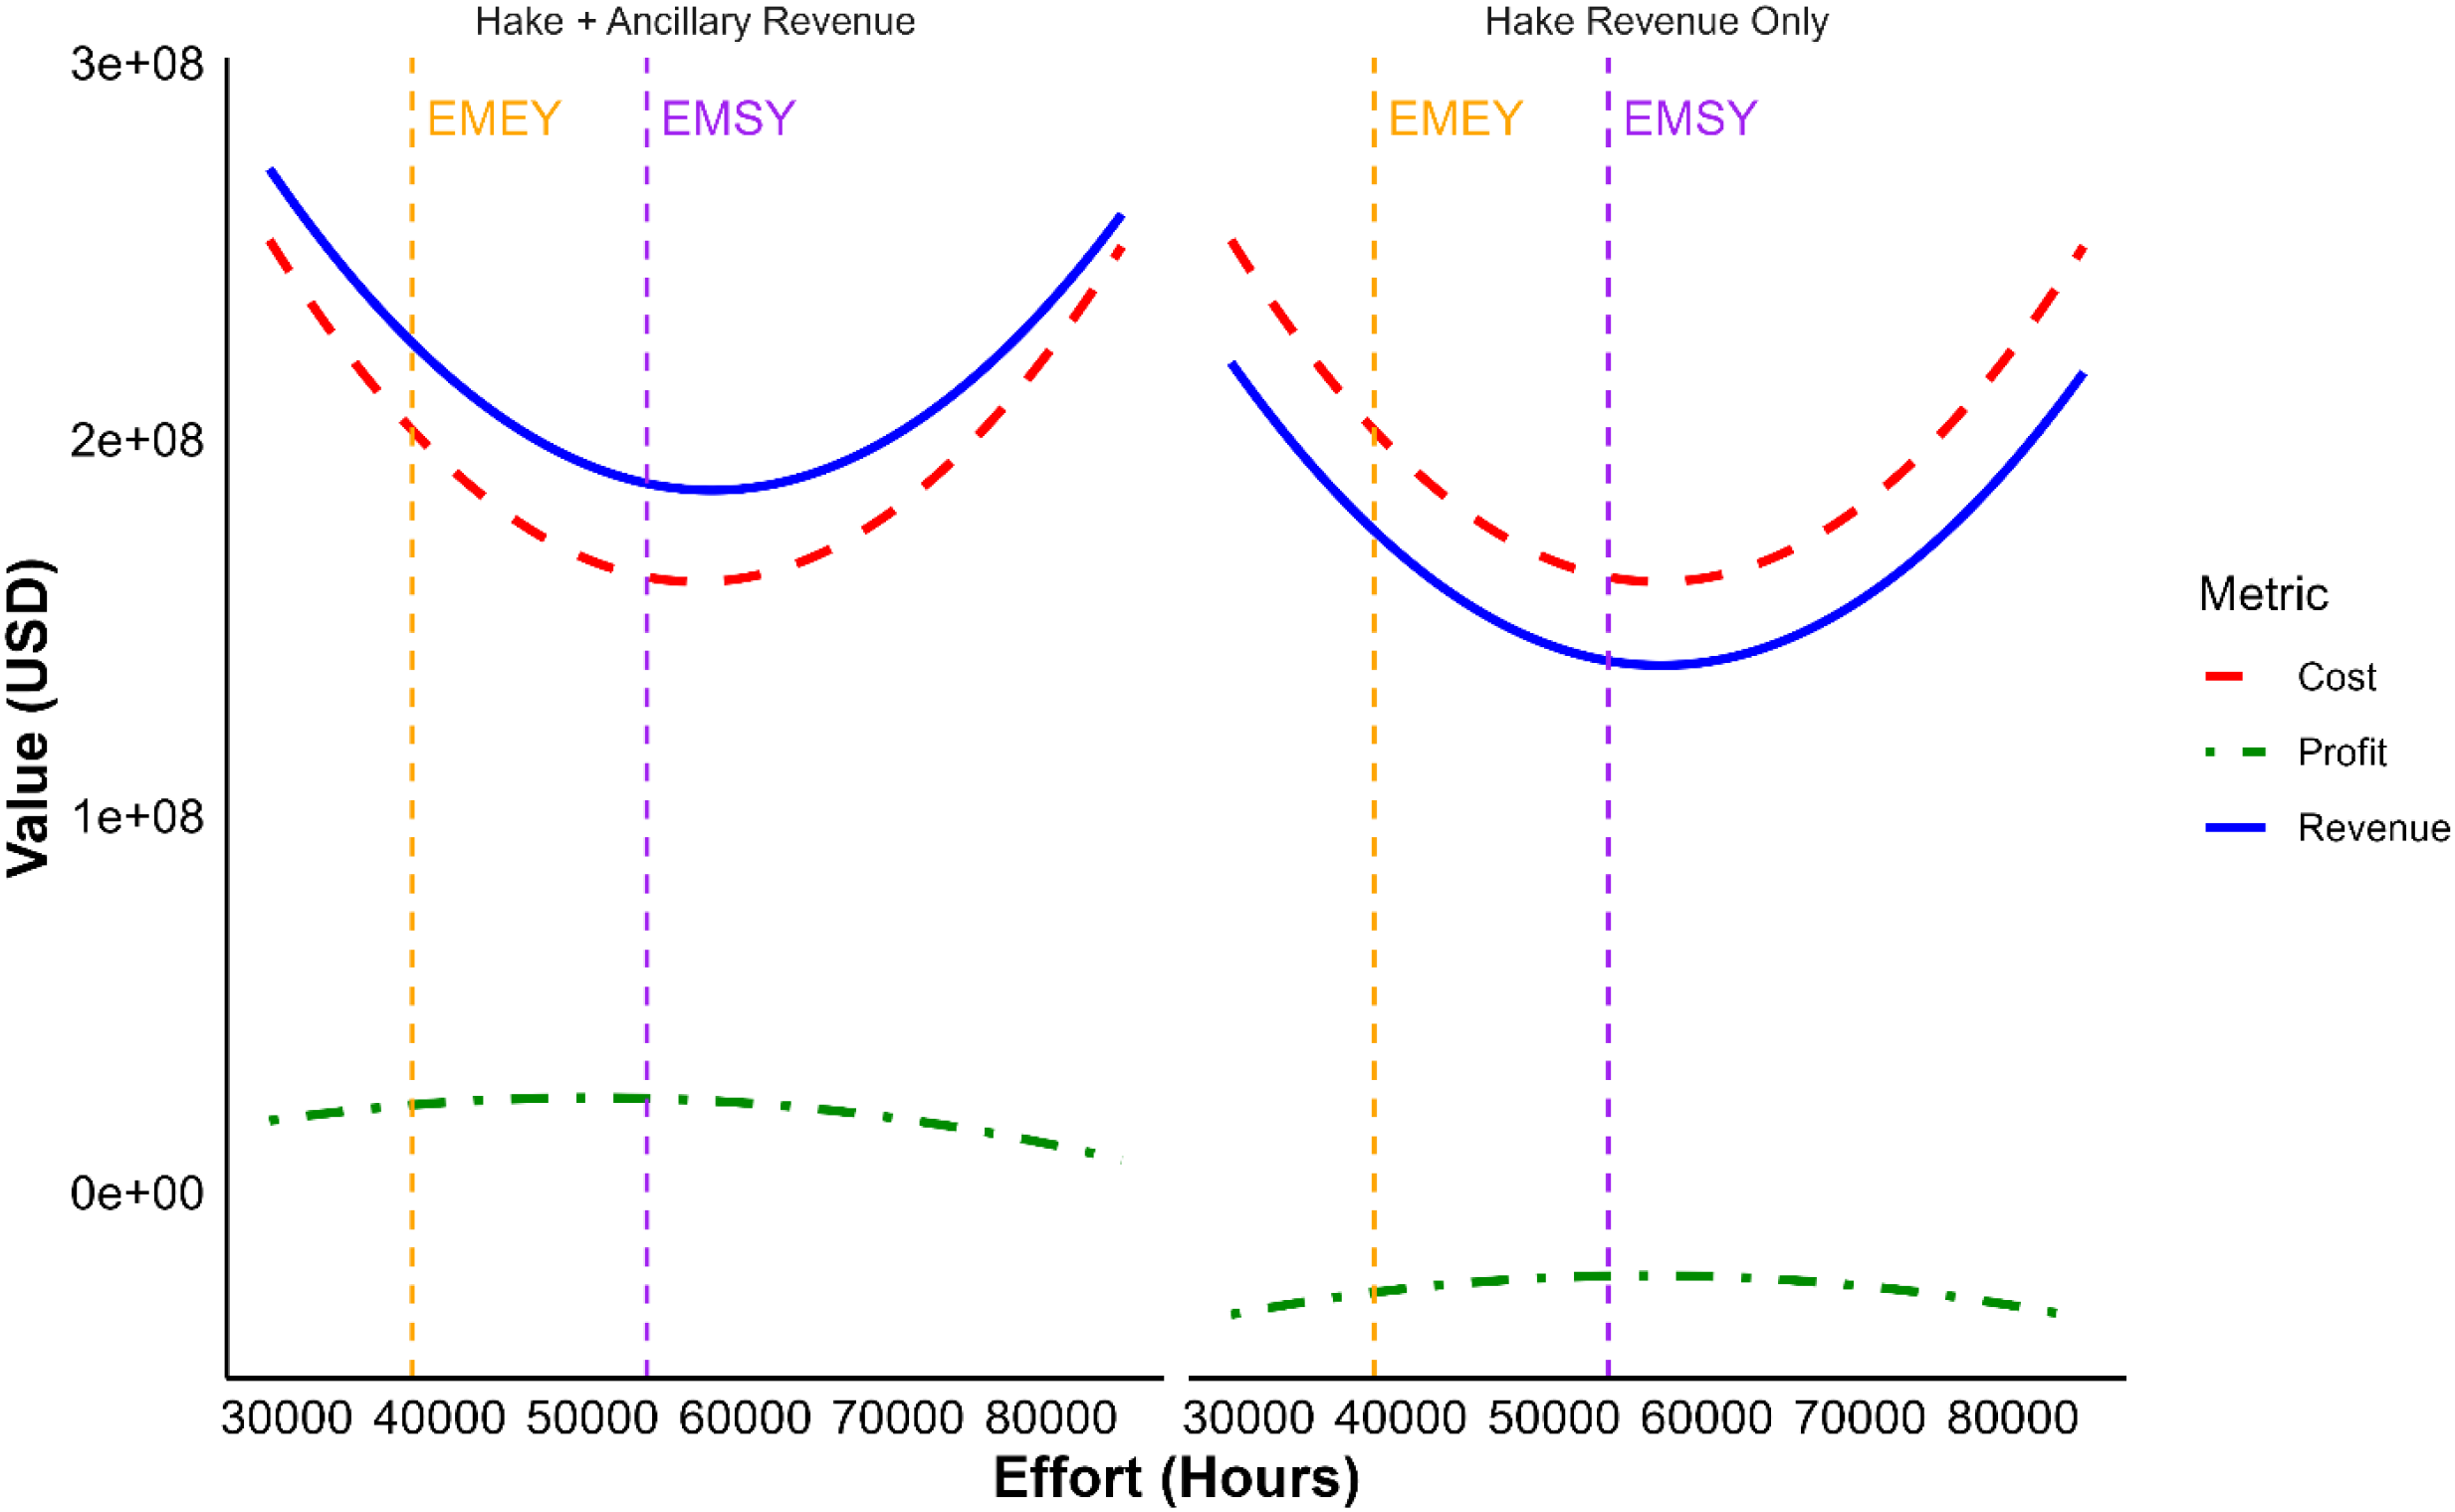
Economic overview of the Namibian hake fishery under varying fishing effort scenarios between 2018 and 2023. The plots show predicted annual total revenue (blue solid line), total average annual expenditure (red dashed line), and annual net-return/profit (green dot-dash line) as a function of fishing effort (hours per period) based on two revenue categories: (left) Hake + Ancillary Revenue including income from by-catch, vessel charters, and quota fees; and (right) Hake revenue Only. Vertical dashed lines indicate reference points: EMSY (Effort at Maximum Sustainable Yield) in purple, and EMEY (Effort at Maximum Economic Yield) in orange.
Furthermore, using breakeven price model, we assessed the margin between profit and the status quo between 2018 and 2023 (Figure 5). A significant increase in the breakeven price was observed between 2019 and 2020, rising from USD 9,956 per tonne in 2019 to USD 13,710 per tonne in 2020. This period corresponded with a substantial increase in the total variable costs, which increased to USD 297,587,399 in 2020 from USD 229,835,916 in 2019. In 2020, expenses on consumables accounted for 20% of the total variable costs, compared to 6.8%, 7.9%, and 9.8% recorded in 2018, 2019, and 2021, respectively (Supplementary Table S1). Other significant cost components contributing to the total average expenditure are salaries (26.8%), overheads (10%), fuel (9.6%), repairs and insurance (4.2%), raw materials (6.7%), packaging materials (4.3%), interest and paid payables (2.5%), and other costs (14.7%). The increase in operational cost between 2019 and 2020 was mainly driven by higher cost of consumables, which could be attributed to COVID-19 pandemics impacts. It further significantly raised the breakeven price during this period and contributed to negative returns.
Figure 5
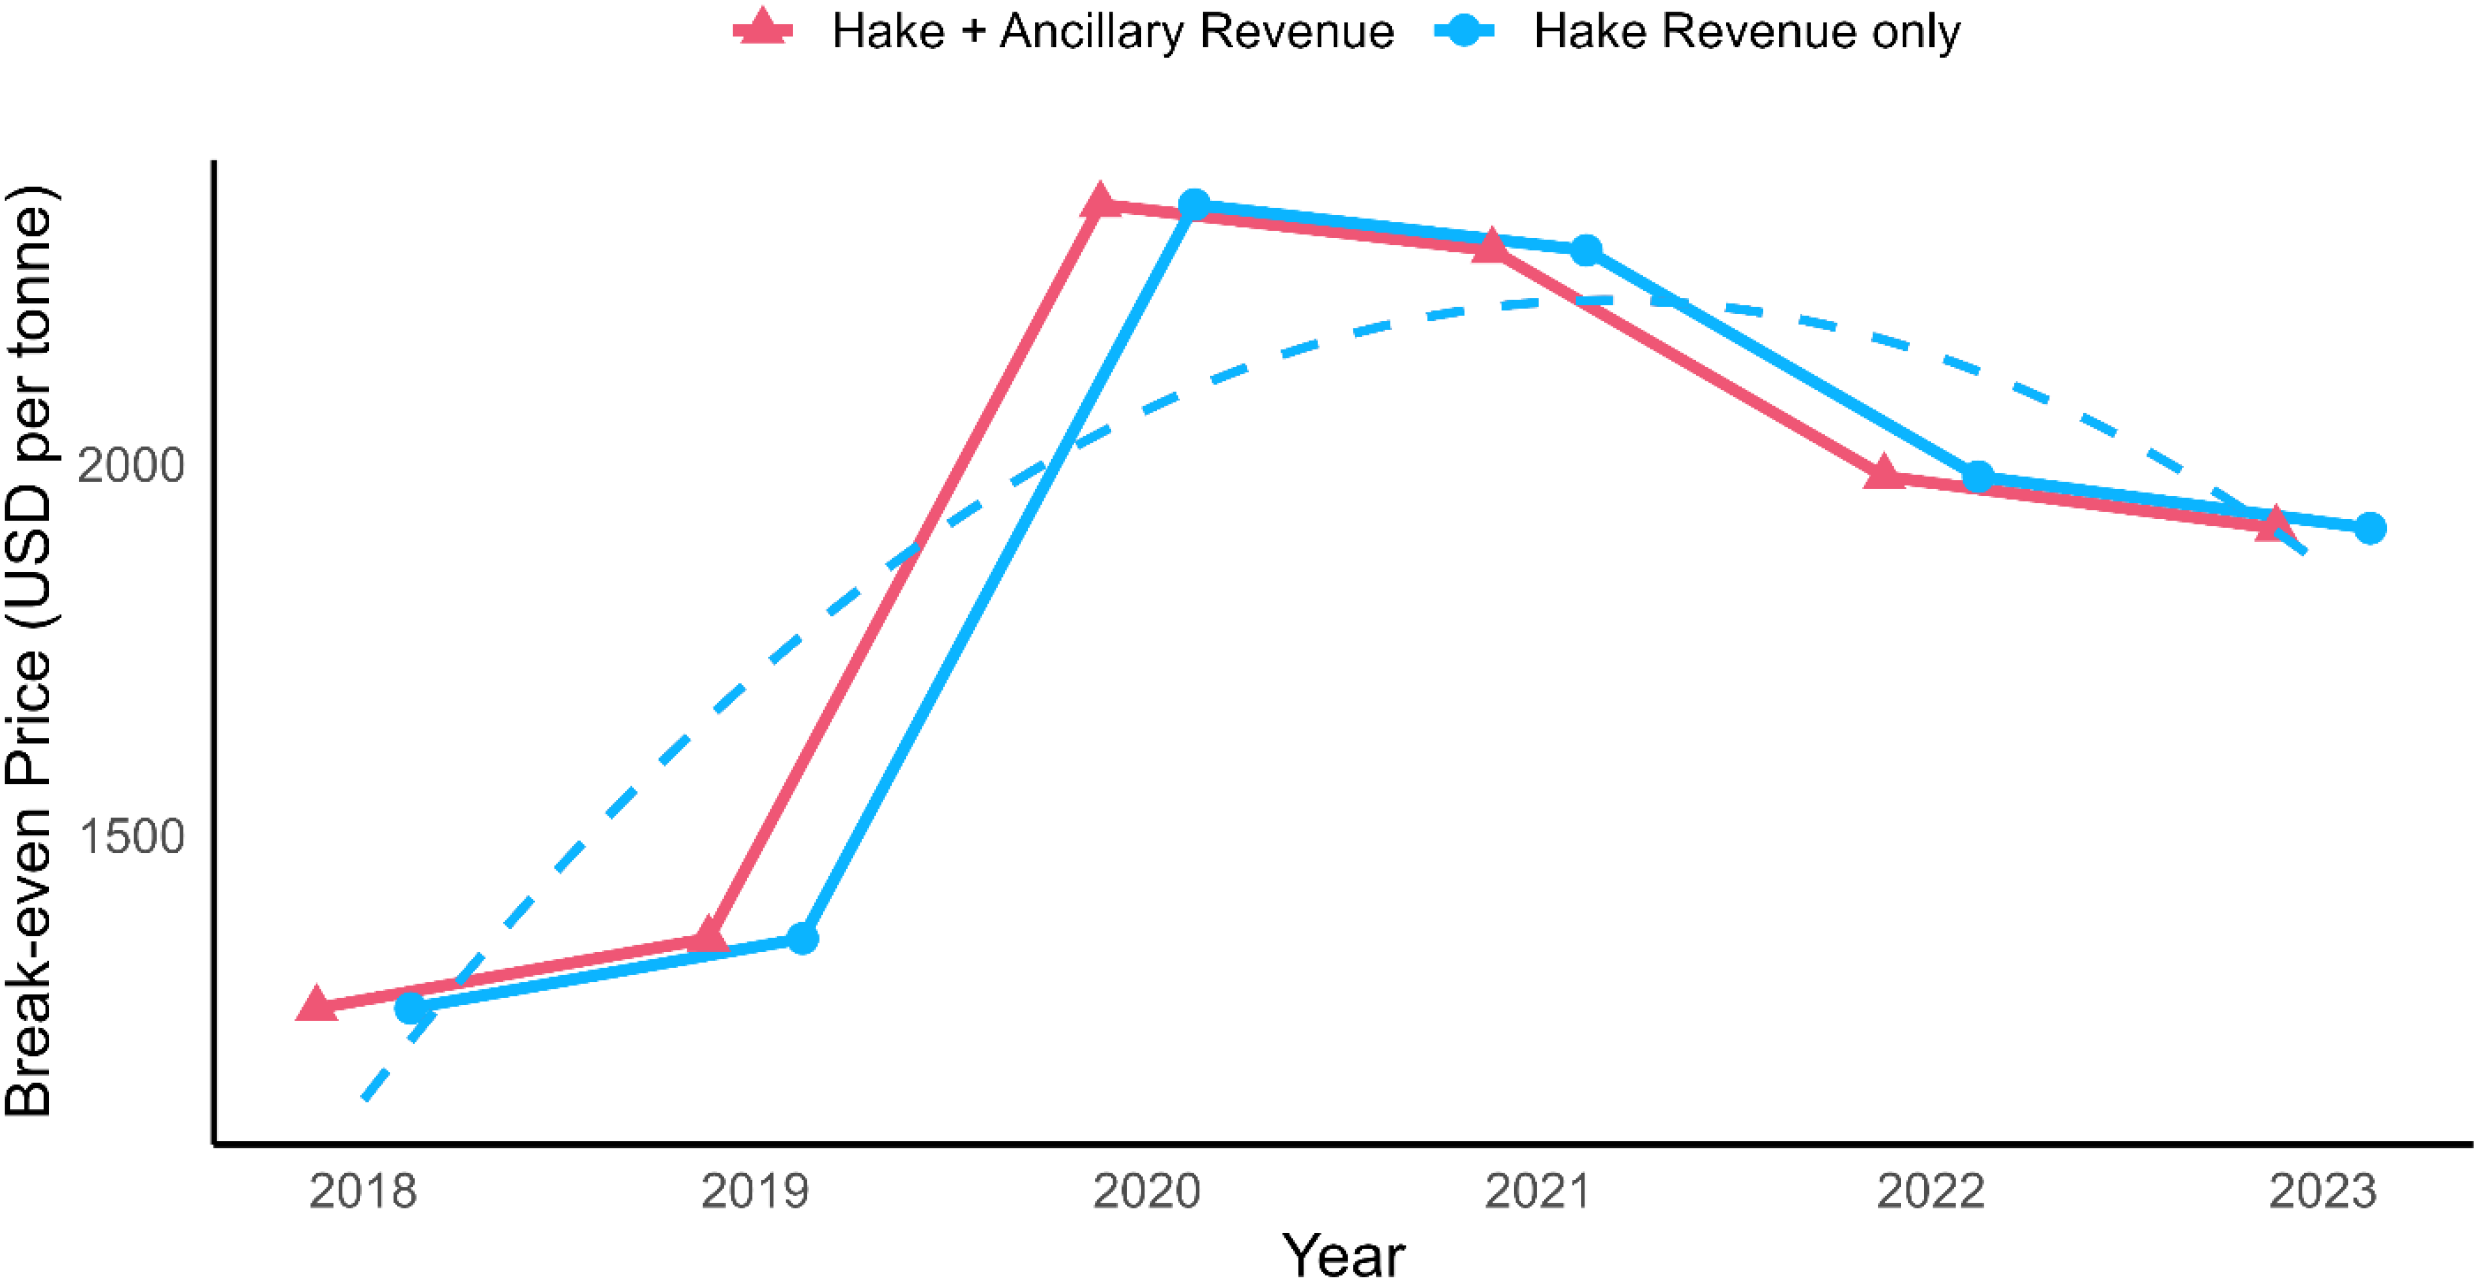
Breakeven price per tonne of hake in USD for the years 2018–2023, based on operational costs and catch volumes from Namibian hake fisheries. The solid blue line represents the annual break-even price trend, while the dashed red line shows a fitted second-degree polynomial trend. The increase in break-even price over time highlights rising costs or reduced catch, reinforcing economic vulnerability in the absence of supplementary income sources such as by-catch or quota fees.
Using regression-derived biological parameters a = 4.6467 and b = 0.000069, we computed the Gordon–Schaefer bioeconomic model for the overall catch detail. We established the unit cost of fishing effort (c) using cost and income data available between 2018 to 2022. The total operational cost was divided by total fishing hours, giving:
Converting to USD, an average exchange rate for the economic data period (2018-2023) was used (World Bank, 2025).
3.4 Variations in the mean surface and bottom temperature between 2000 and 2023
Significant variations were recorded in both the sea surface temperature (SST) and the bottom temperature over the last two decades (Supplementary Figure S1). The annual mean surface temperature ranged from 17.1°C in 2022 to a maximum of 19.8°C in 2009. On the other hand, the highest mean bottom temperature (12.4°C) was recorded in 2003, while the lowest mean temperature (8.84°C) occurred in 2002. Both the surface and bottom temperature layers experienced their lowest temperatures in the year 2002. In the bottom temperature layer, the locally estimated scatterplot smoothing (LOESS) trend showed that after reaching a peak of 12.4°C in 2003, the mean temperature declined steadily until 2010, after which it began to stabilize.
To further contextualize these temperature shifts, we calculated the anomalies of annual sea surface temperature anomalies by comparing each year’s mean SST to the long-term (2000–2023) average. As shown in Figure 6, anomalies ranged from –1.54°C to +1.2°C, illustrating pronounced departures from the climatological baseline.
Figure 6
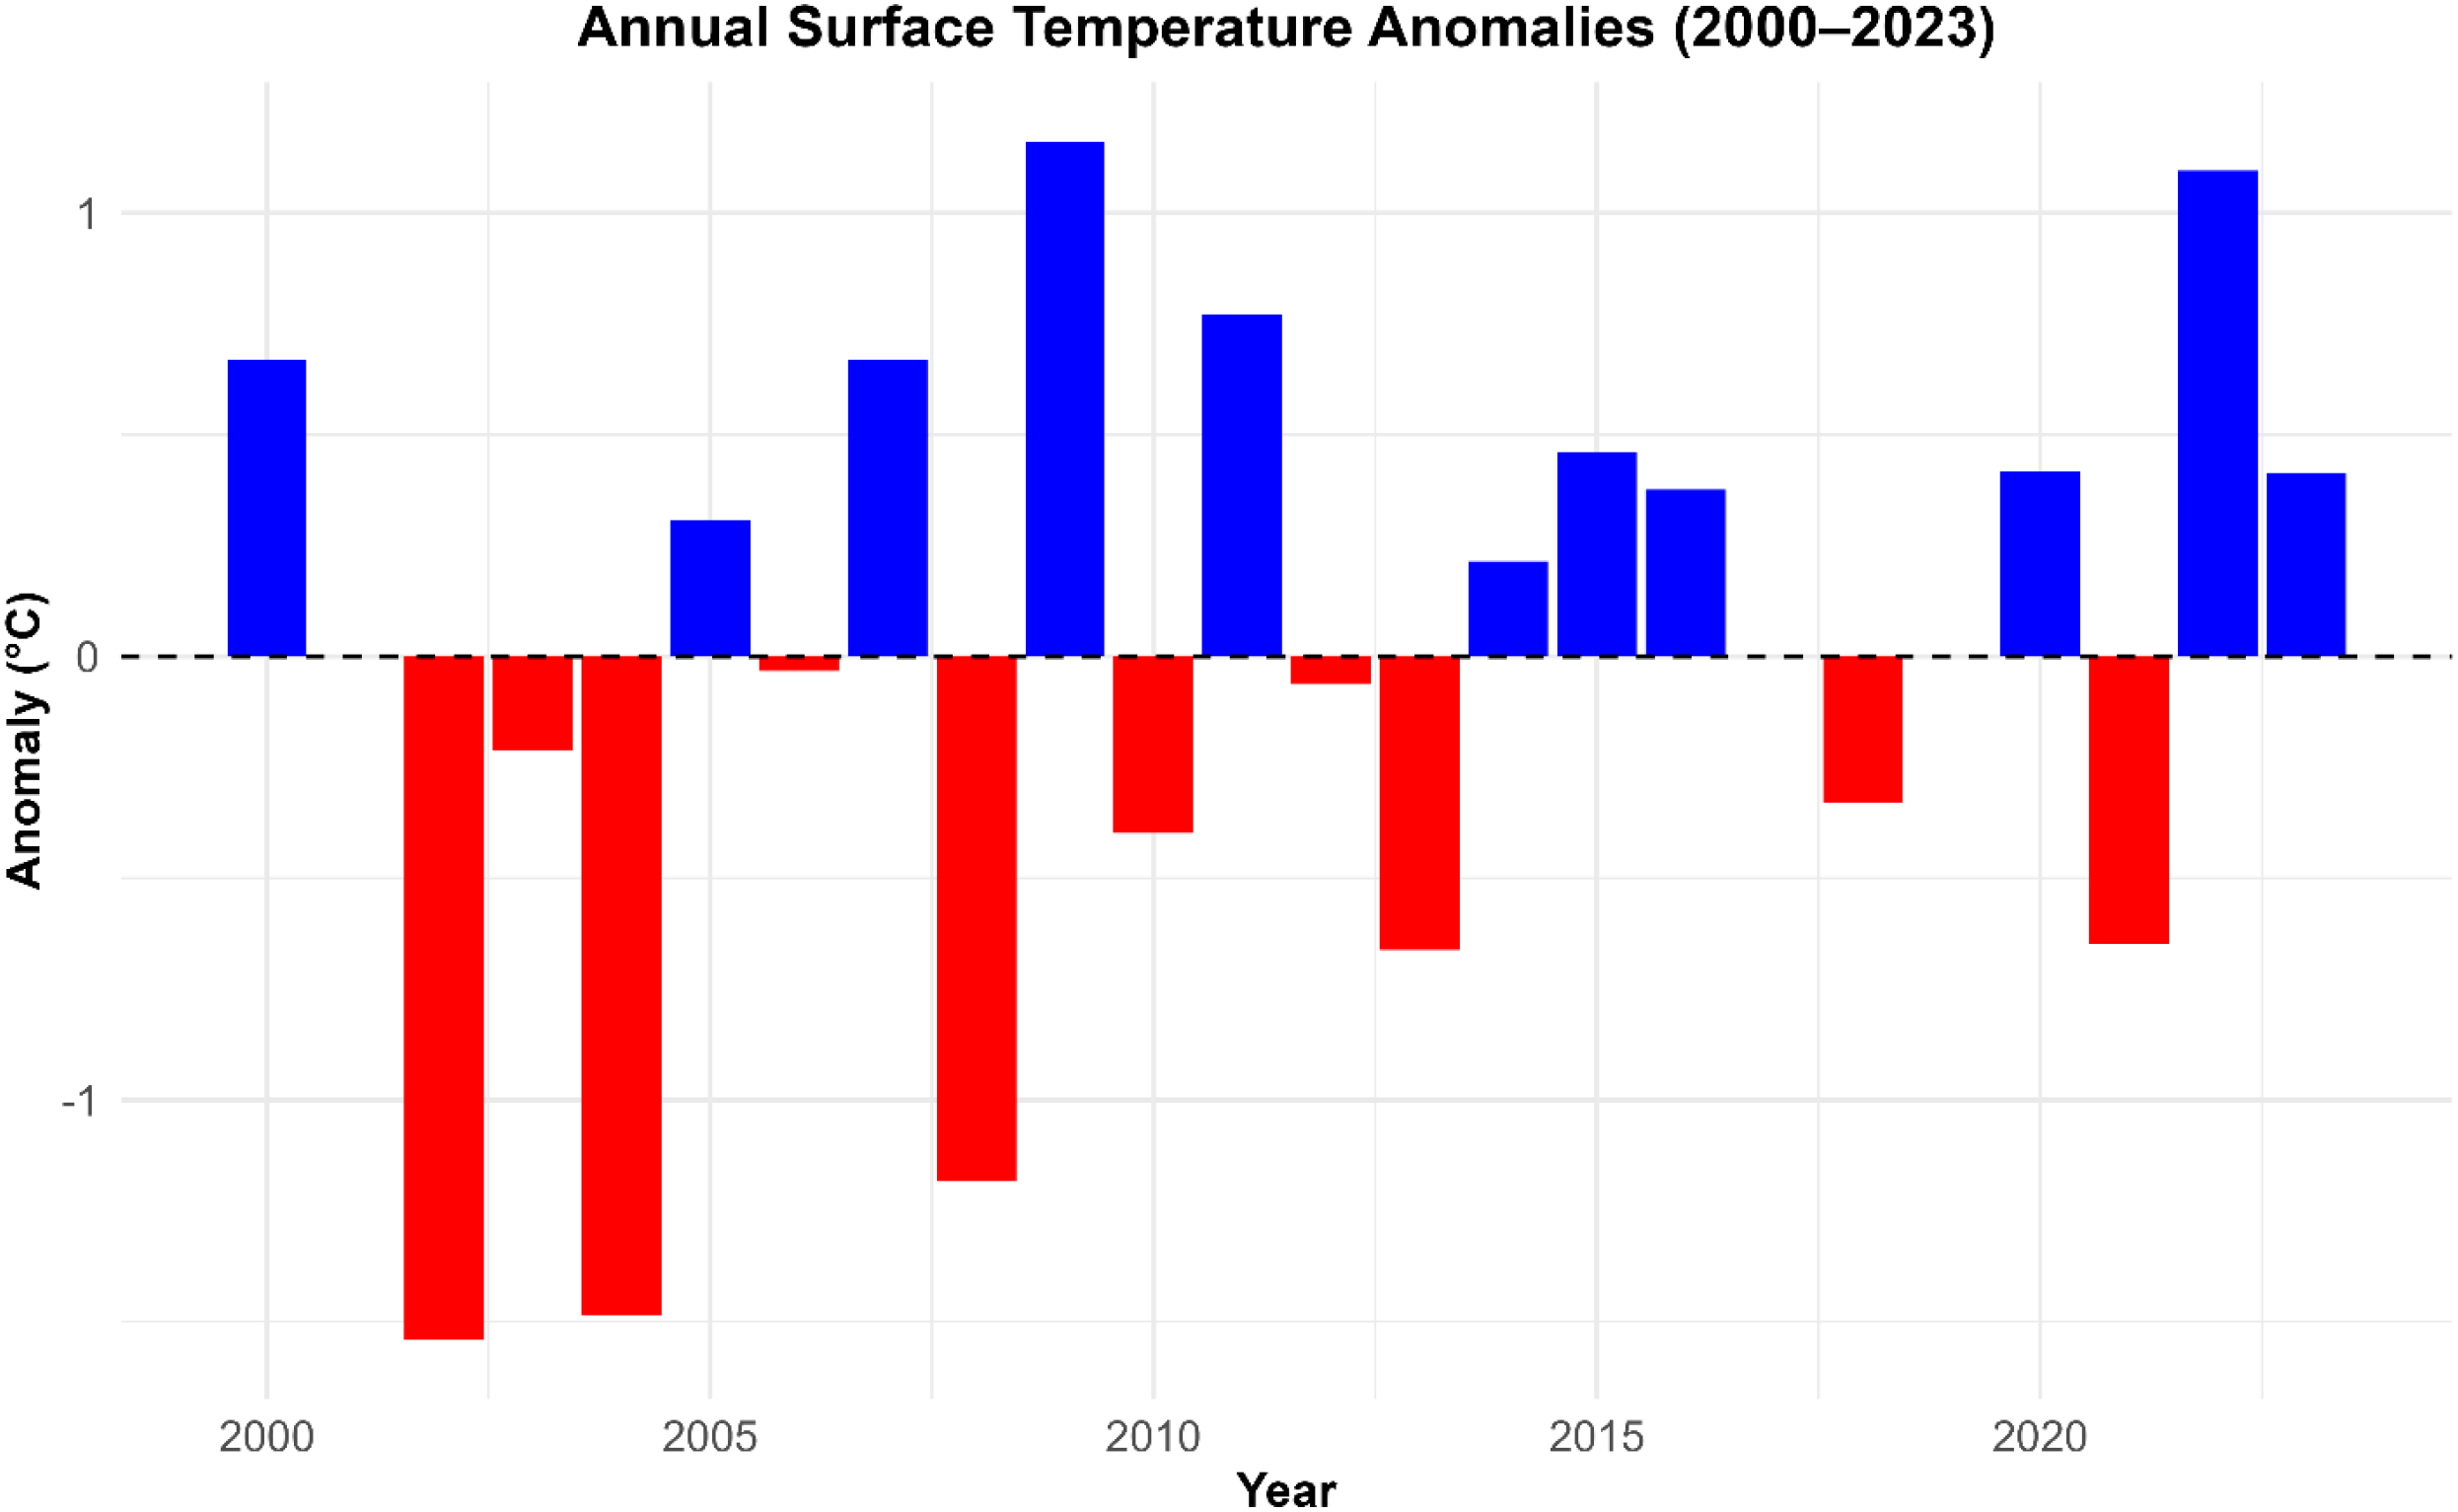
Annual sea surface temperature (SST) anomalies from 2018 to 2023 for the fishing zones for Hake from 2000 to 2023. The positive anomalies (blue bars) at the upper side indicate warmer-than-average years, which is above the long-term mean, while negative anomalies (red bars) at the lower part indicate cooler-than-average conditions. The long-term-mean temperature is denoted by the dashed black lines.
The highest positive anomaly was recorded in 2009 (+1.2°C), followed by 2022 (+1.1°C). Other years with positive anomalies include 2000 (+0.7°C), 2005 (+0.3°C), 2007 (+0.7°C), 2011 (+0.8°C), 2014 (+0.2°C), 2015 (+0.5°C), 2016 (+0.4°C), 2020 (+0.4°C), and 2023 (+0.4°C). In contrast, the highest negative anomaly occurred in 2002 (-1.5°C), followed by 2004 (-1.4°C). Additional years with negative anomalies include 2003 (-0.2°C), 2006 (-0.03°C), 2008 (-1.2°C), 2010 (-0.4°C), 2012 (-0.06°C), 2013 (-0.7°C), 2018 (-0.3°C), and 2021 (-0.6°C).
3.5 Does temperature anomalies over the years influences the catches over time
As temperature is known to have an optimal range for target species, beyond which catch may decline due to physiological stress, reduced survival of prey or other environmental constraints, hence, we investigated the effects of fluctuating annual temperature on annual hake catches, analysing the effects of quadratic relationships between annual hake catches and average annual sea surface and bottom temperature from 2000 and 2023 (Figures 7A, B). Similar relationships have been spotted in existing studies on other demersal species (Fiorella et al., 2021; Mediodia et al., 2023, 2024). For the DF trawlers, the variations of the surface temperature only explained little variation (R² = 0.25, Adj. R² = 0.17, F = 2.98, p = 0.076). Individually, both the linear (β = –3.28 × 10⁻⁴, p = 0.035) and quadratic terms (β = 2.92 × 10⁻⁹, p = 0.043) were statistically significant, however, the overall model was not statistically significant at α = 0.05 (Figure 7B). In contrast, in the case of the DW trawlers, there was no significant effects of the temperature on the total annual catch (R² = 0.19, p = 0.147). In addition, both the linear and quadratic terms was significant at α = 0.05.
Figure 7
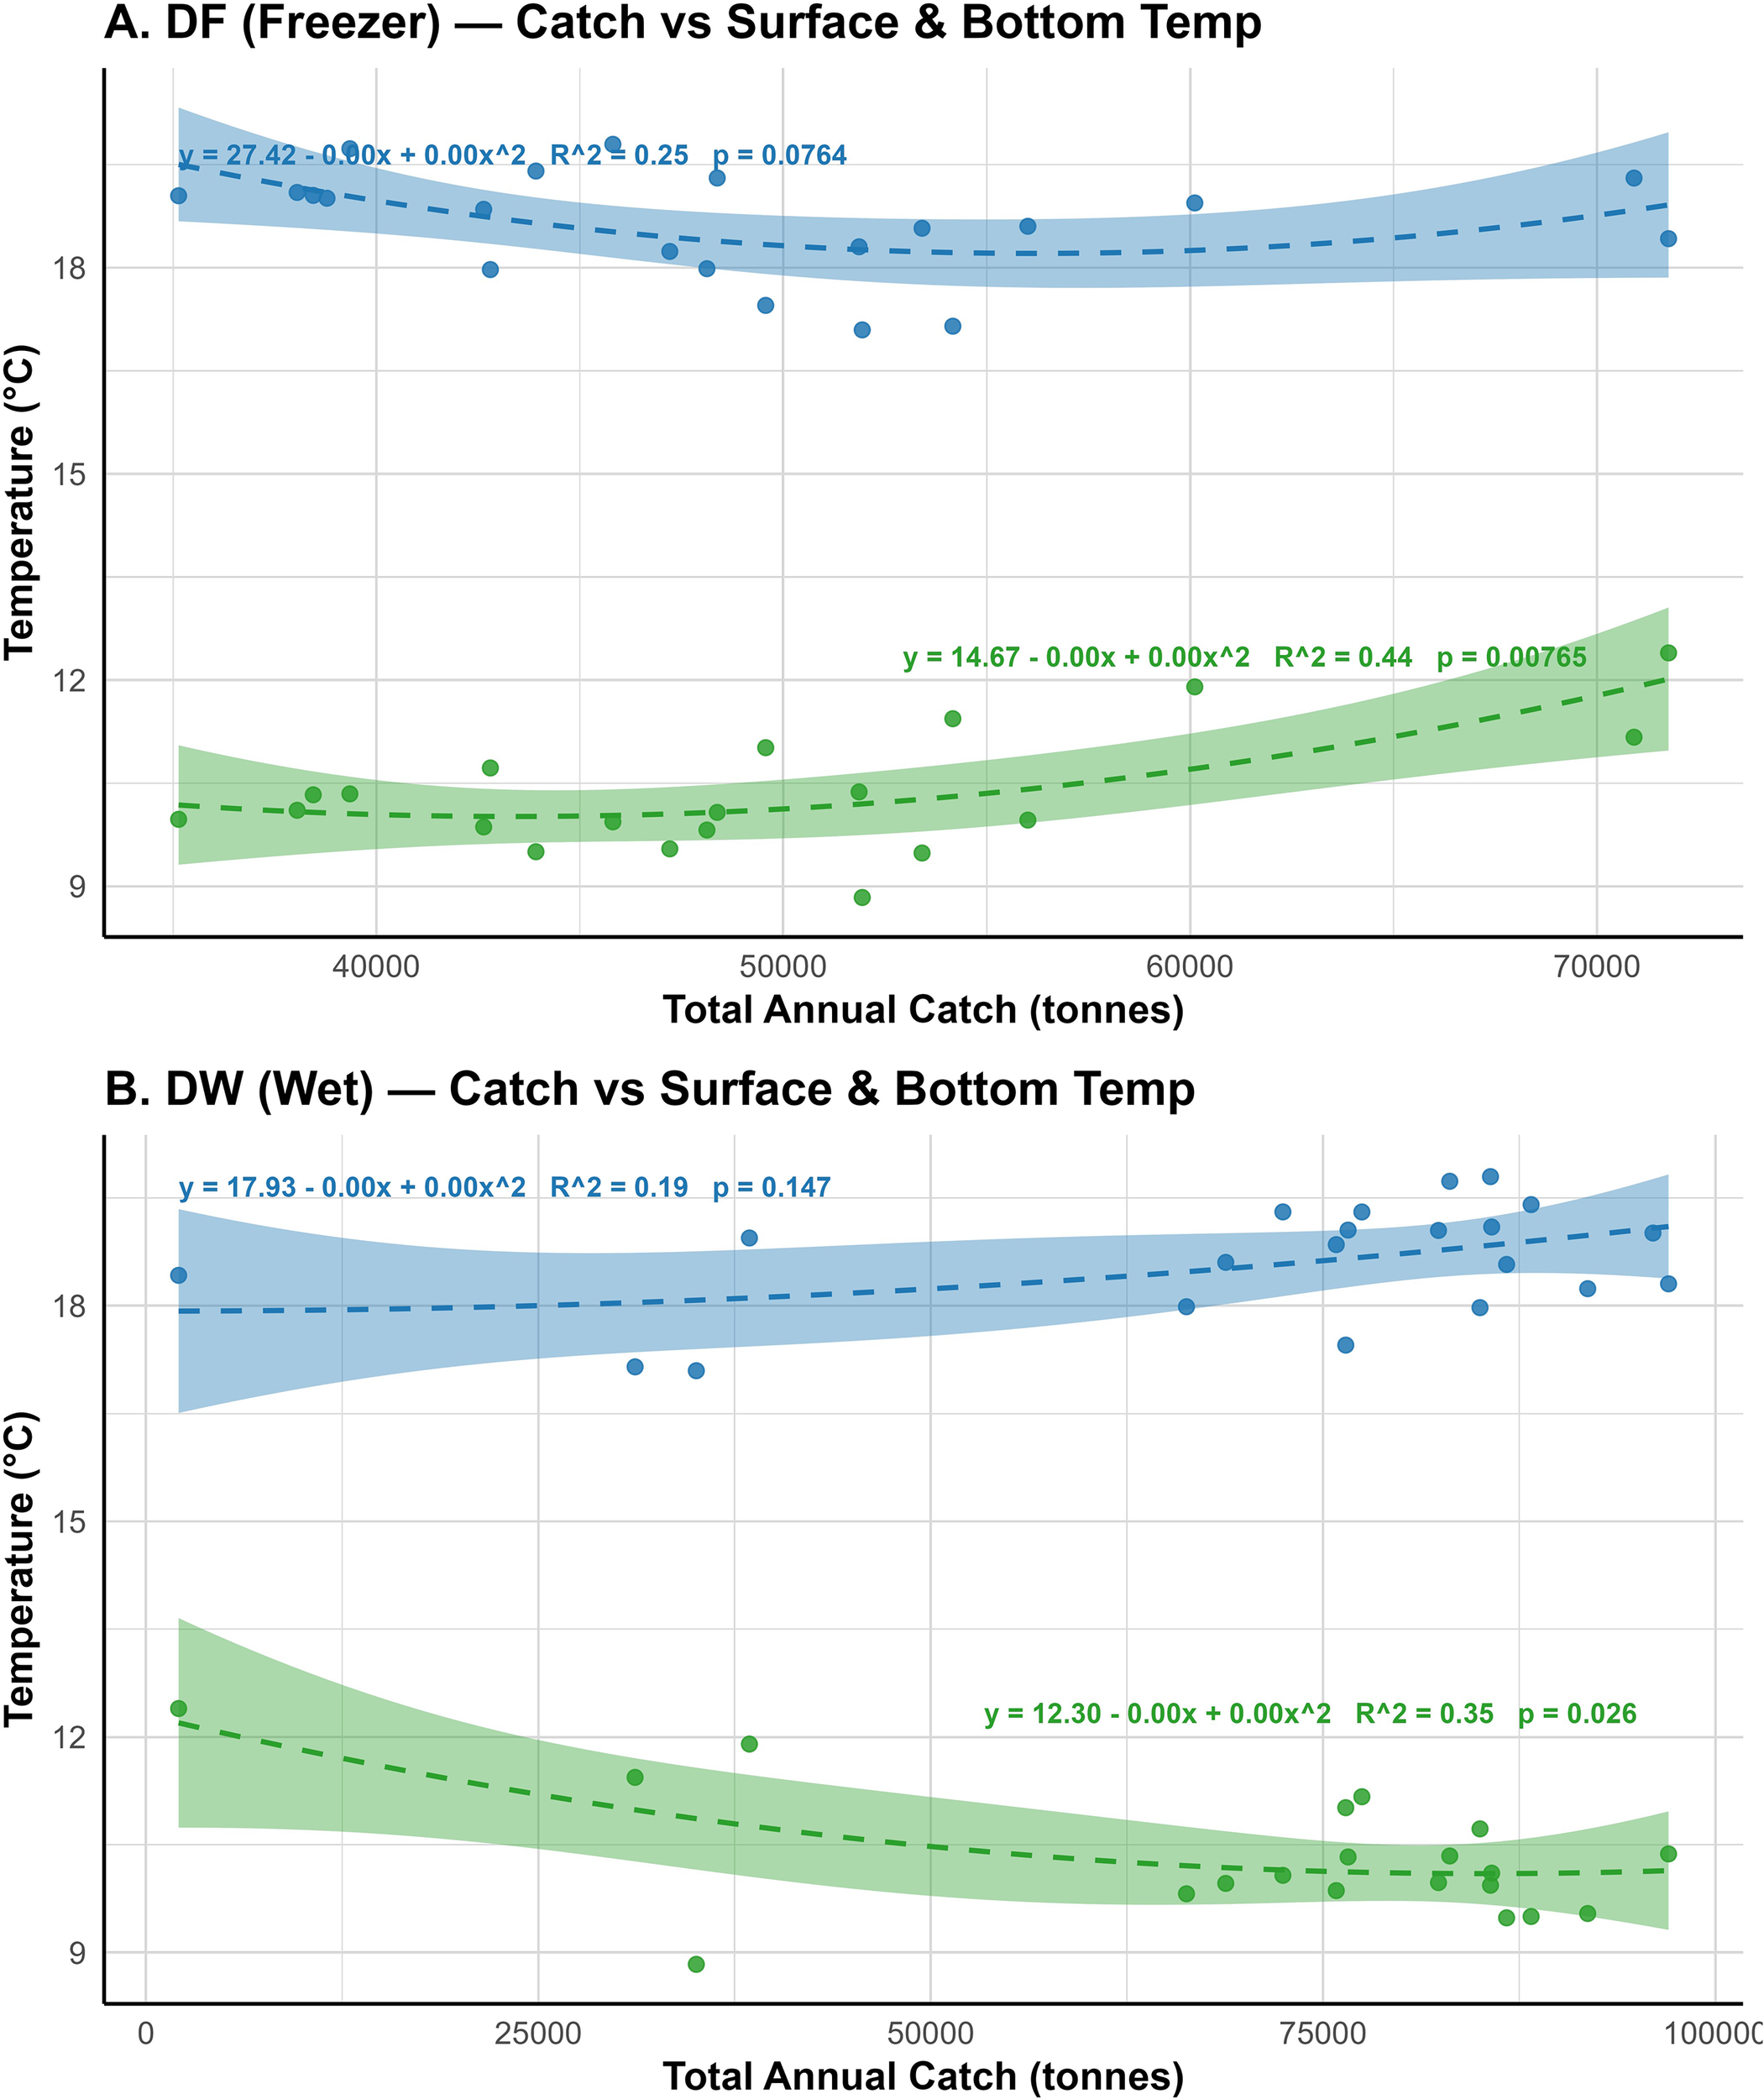
A relationship between the annual catches (tonnes) of Hake fishery and average annual surface and bottom temperatures from 2000 to 2023 for freezer (DF; A) and wet-fish (DW; B) trawlers. The dashed blue lines represent fitted quadratic regression models for surface temperature, while the dashed green lines represent that for bottom temperature. The shaped areas show the 95% confidence intervals. The R2 presented in each model shows the magnitude or proportion of variance in the CPUE that was explained by changes in the surface and bottom temperature.
On the other hand, the bottom temperature models showed significant effects on the annual catches of both trawlers. For the DF trawlers, 44% of the variance in catch were explained by the bottom temperature model (R² = 0.44, Adj. R² = 0.37, F = 6.58, p = 0.008) (Figure 7A) While the intercept was statistically significant (β = 14.67, p = 0.001), both the linear (p = 0.154) and the quadratic terms (p = 0.081) were not individually significant. Similarly, bottom temperature also showed a significant quadratic relationship with catch (R² = 0.35, Adj. R² = 0.27, F = 4.56, p = 0.026). Additionally, while the intercept was highly significant (β = 12.30, p < 0.001), neither the linear nor the quadratic terms were significant individually at α = 0.05. These analyses indicate more significant effects and influence of bottom temperature on annual hake catches compared to the surface temperature. A full regression output has been provided in Supplementary Table S3 of the Supplementary Material.
While visual overlaps in peaks and troughs between CPUE and bottom or surface temperatures are evident in Figure 8, these patterns should only be regarded as descriptive rather than indicative of statistical relationships. The formal statistical assessment capturing full quadratic regression models to explore the relationship between catch and temperature is summarized in Supplementary Table S3 of the Supplementary Material.
Figure 8
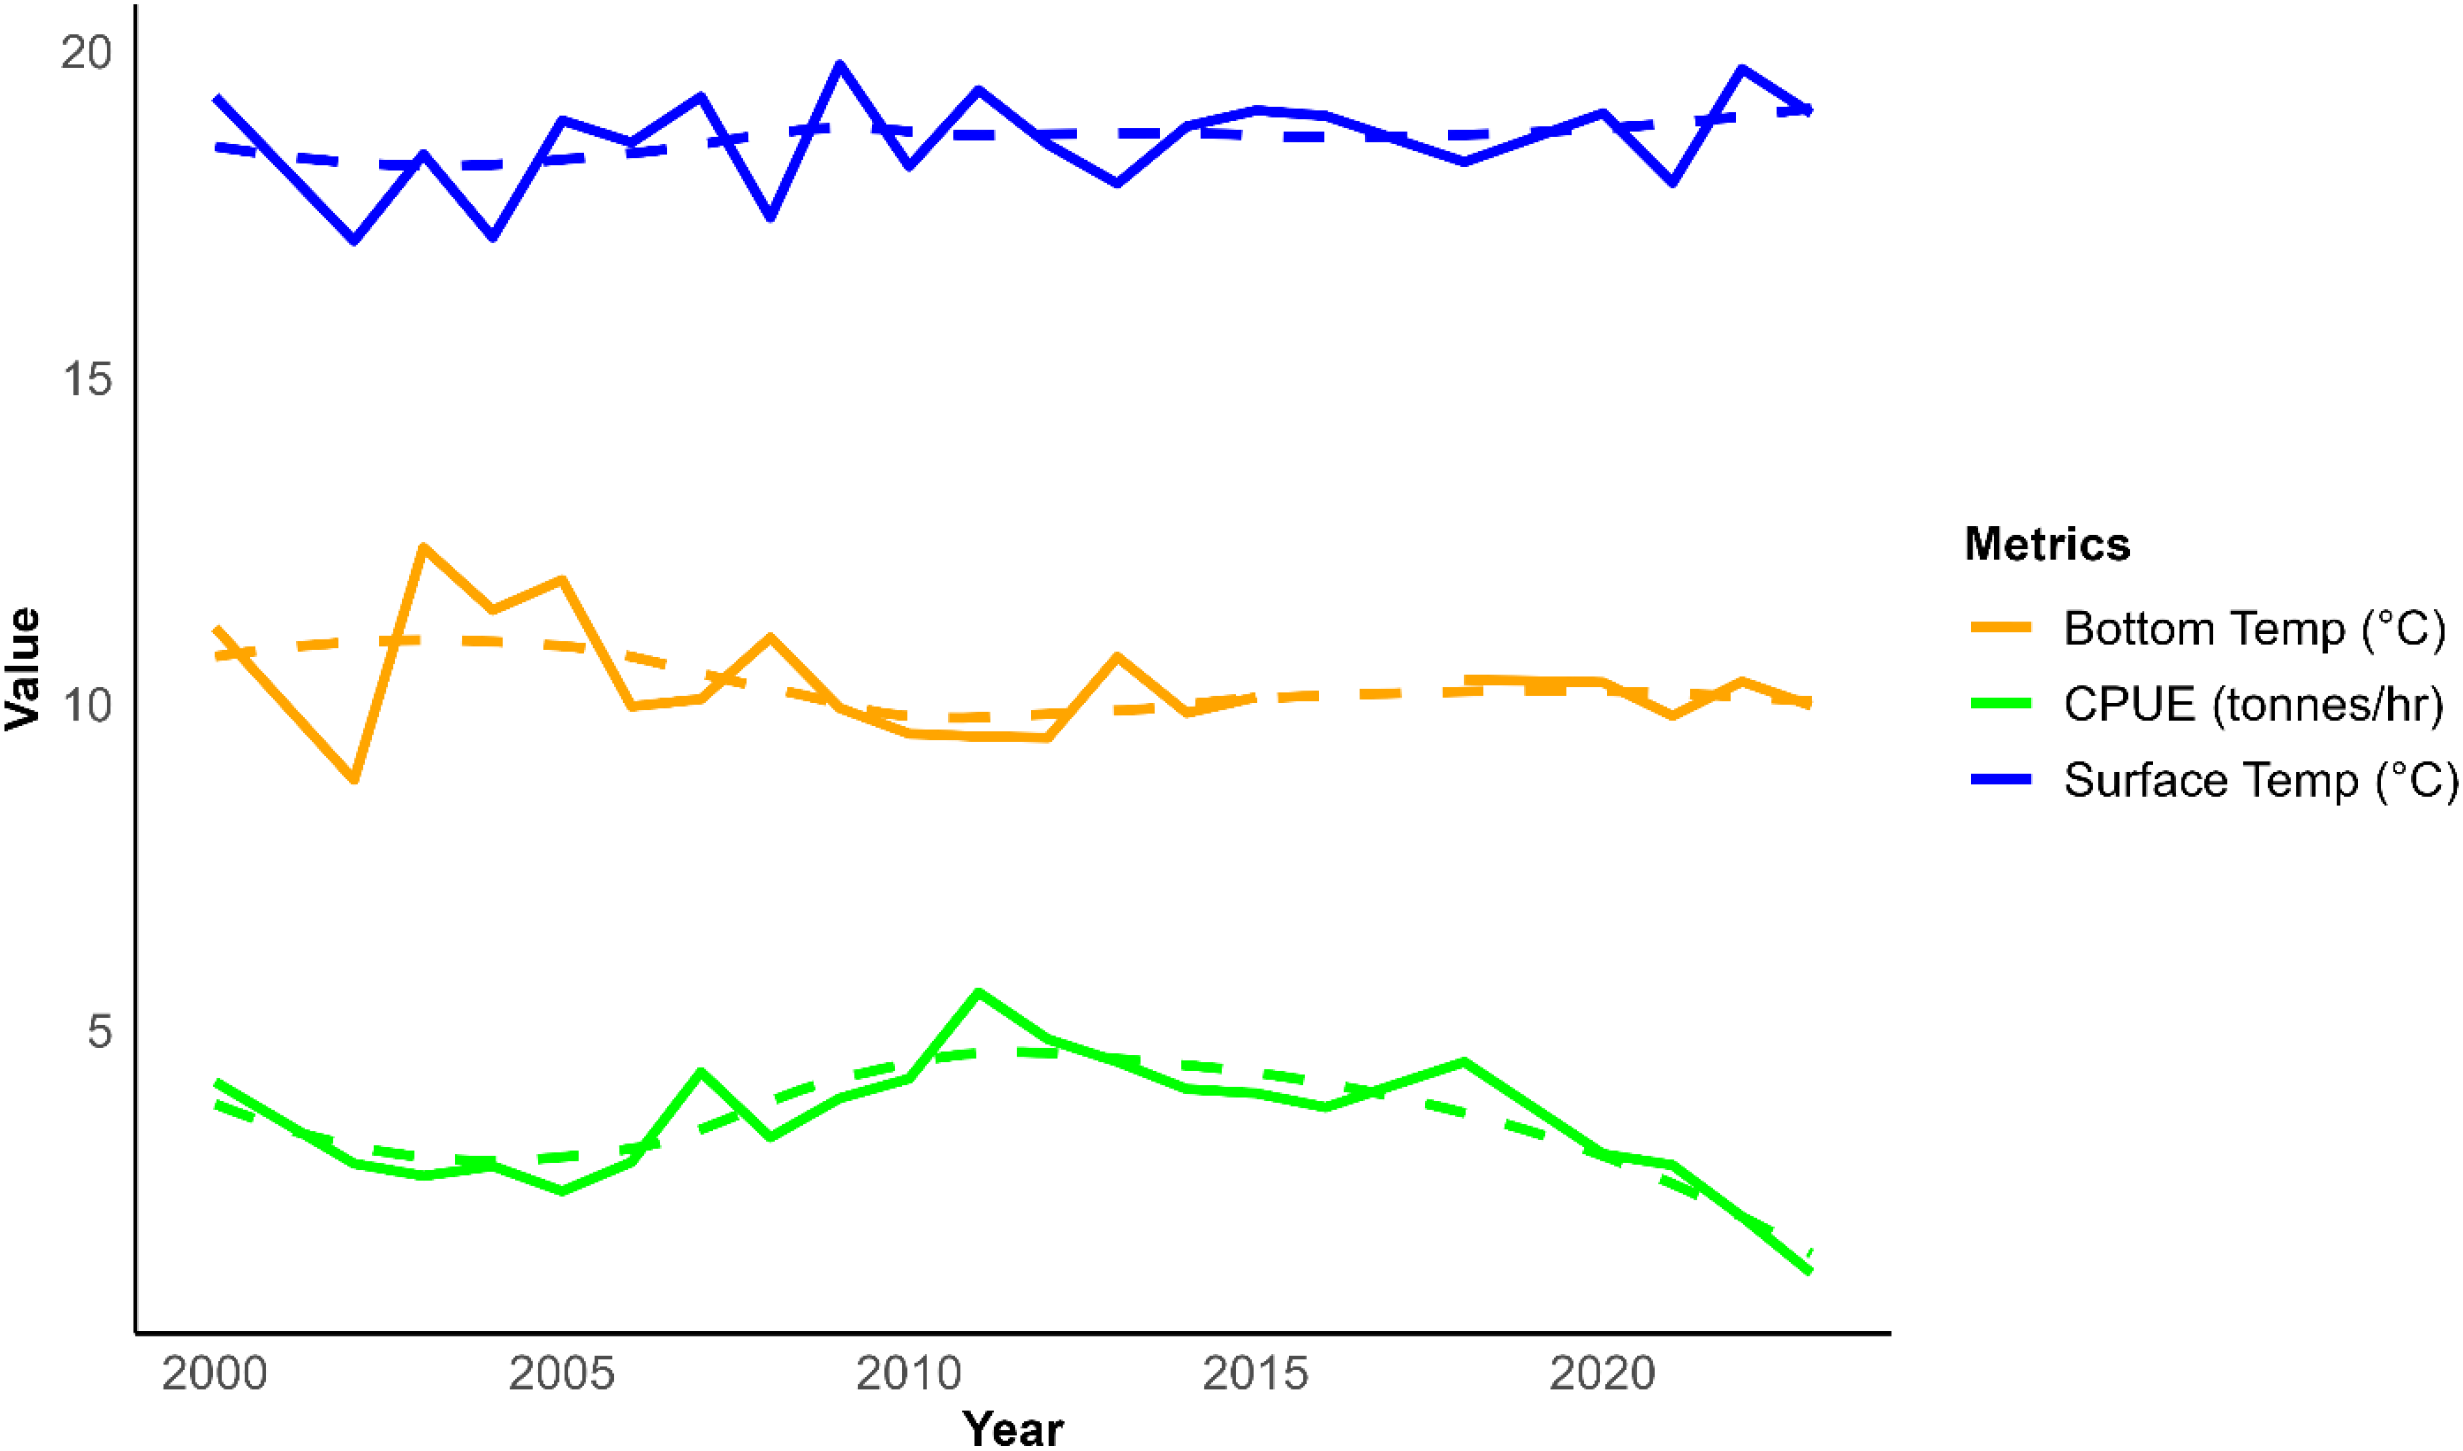
The annual trends of catch per unit effort (CPUE, tonnes/hour), the sea surface temperature and bottom temperature for Hake fishery between 2000 and 2023 in Nambian waters. The dashed lines show LOESS-smoothed trends, and the solid lines represent the observed values.
3.6 Spatial variation of hake CPUE at different depths along with the country’s exclusive economic zone
The relationship between hake catches and gear depth over the 23-year period was weak and statistically non-significant (DF: R² = 0.04, p = 0.322; DW: R² = 0.035, p = 0.364; Figure 9). However, the descriptive distribution patterns showed that about 69% of the total catch were obtained at a depth ranging from 300-400m. The remaining 31% were obtained at a depth range of 400-500m (Supplementary Figures S2A, B). The dominant depth range varied between years with the vessel types. For example, 81% of DW catches were recorded at 300-400m, compared with 51% for DF trawlers in the same range.
Figure 9
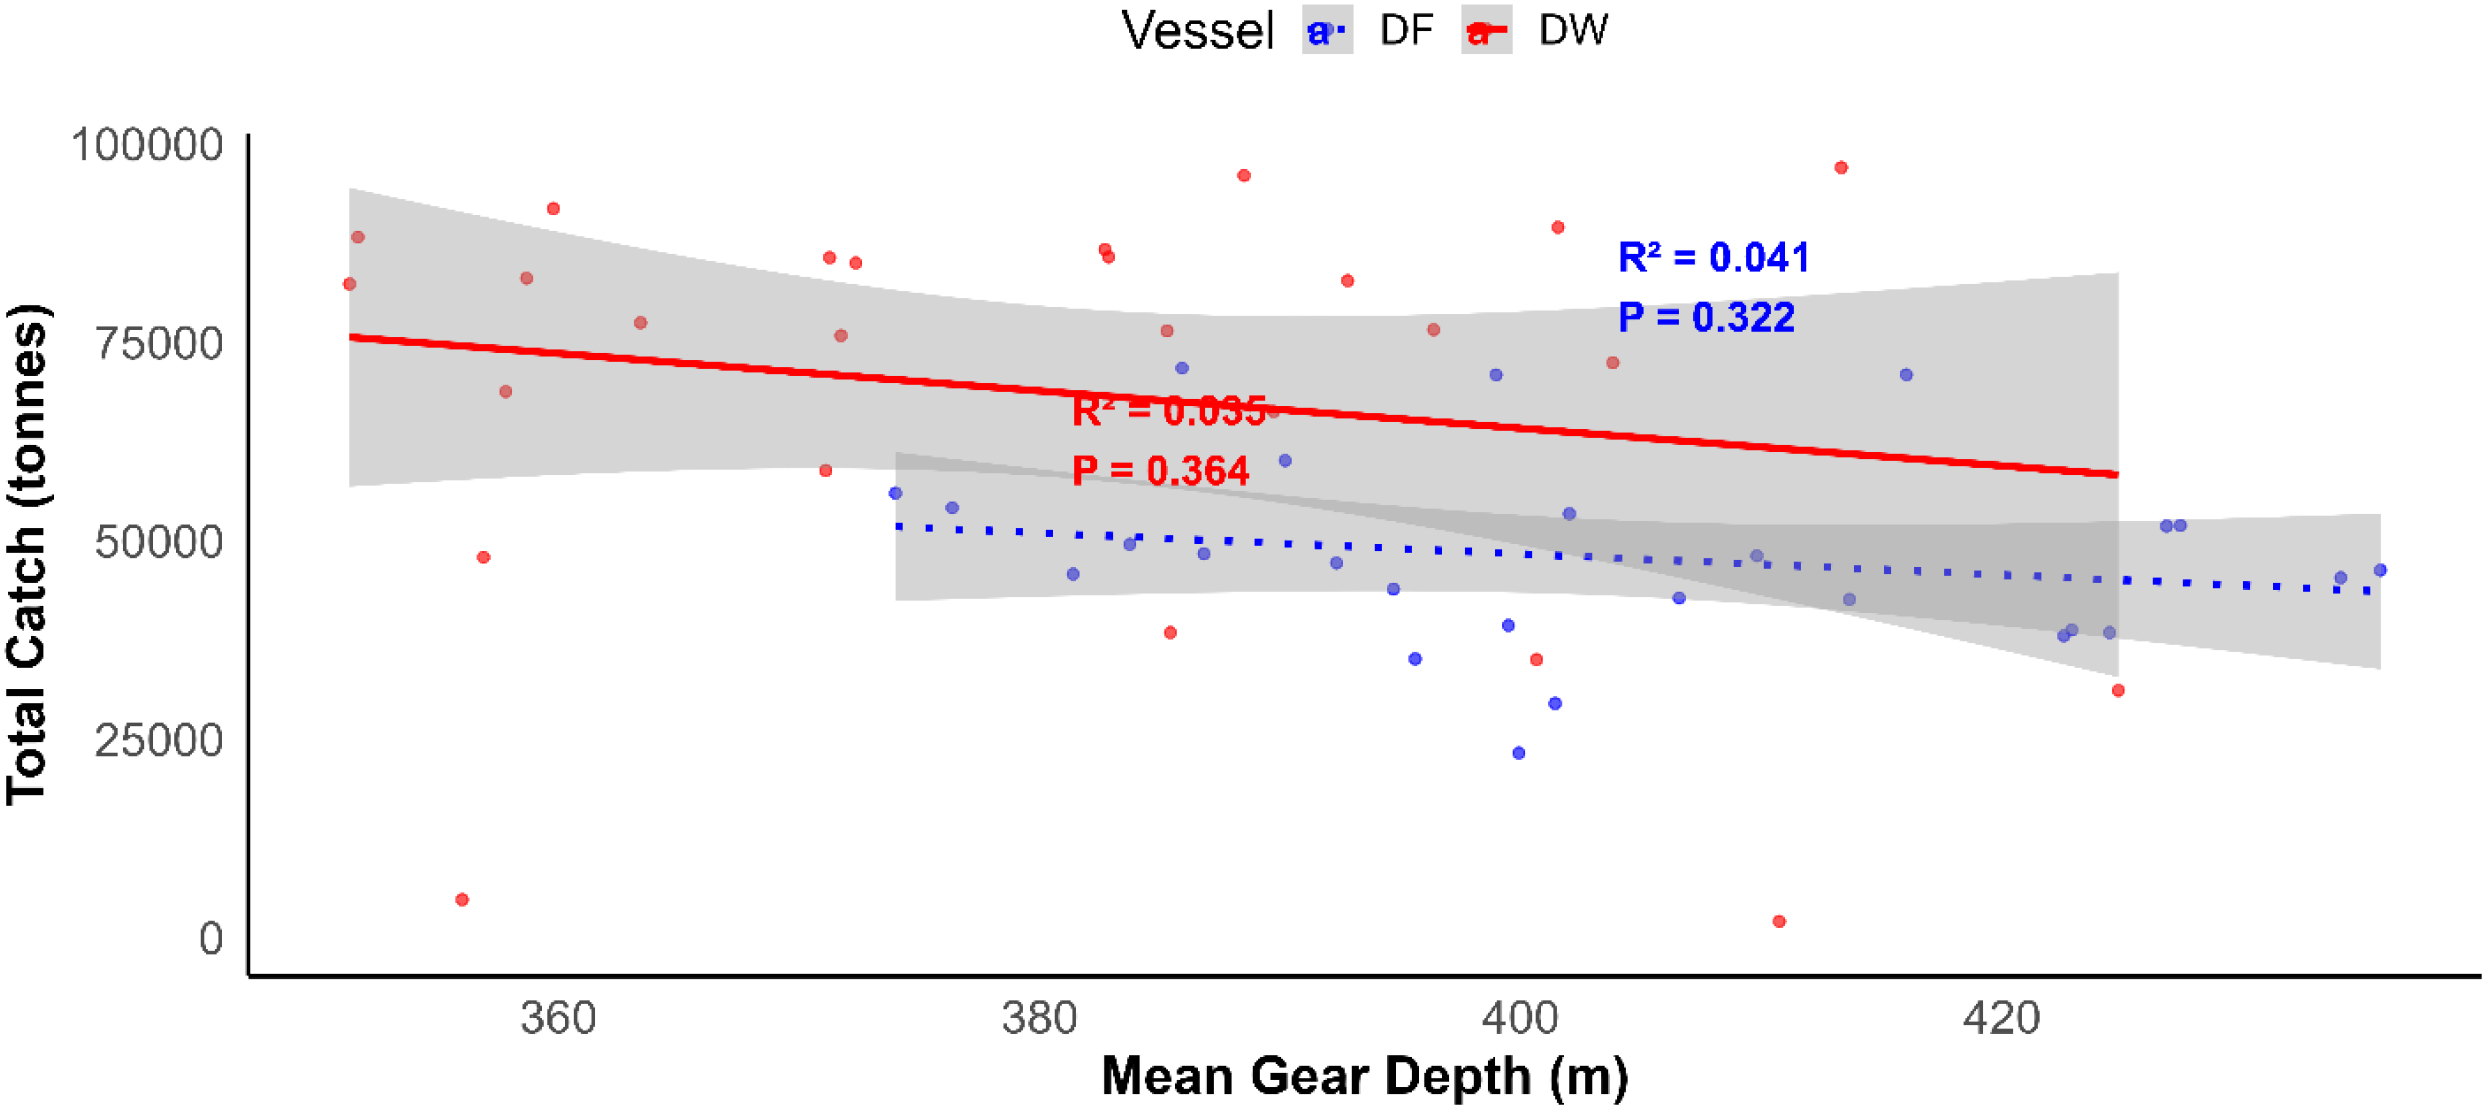
Regression plot showing the relationship between fishing gear depth (m) and average catches (tonnes) on hake species in Nambian water between the year 2000 and 2024. The blue and red lines represent fitted linear regressions for freezer (DF) and wet-fish trawlers (DW), respectively. The shaded areas indicates a 95% confidence interval.
We also investigated the spatial distribution of CPUE across Namibia’s EEZ over a recent three-year period (Figure 10). The results show consistent latitudinal patterns, with CPUE consistently concentrated along the central to southern coastal zones, specifically between 24°S and 28°S off Walvis Bay and Lüderitz. DW trawlers displayed a slightly broader distribution, with occasional northward extensions to 22°S–24°S in some years. In contrast, DF trawlers were majorly clustered around 26°S–28°S near the central Namibian shelf.
Figure 10
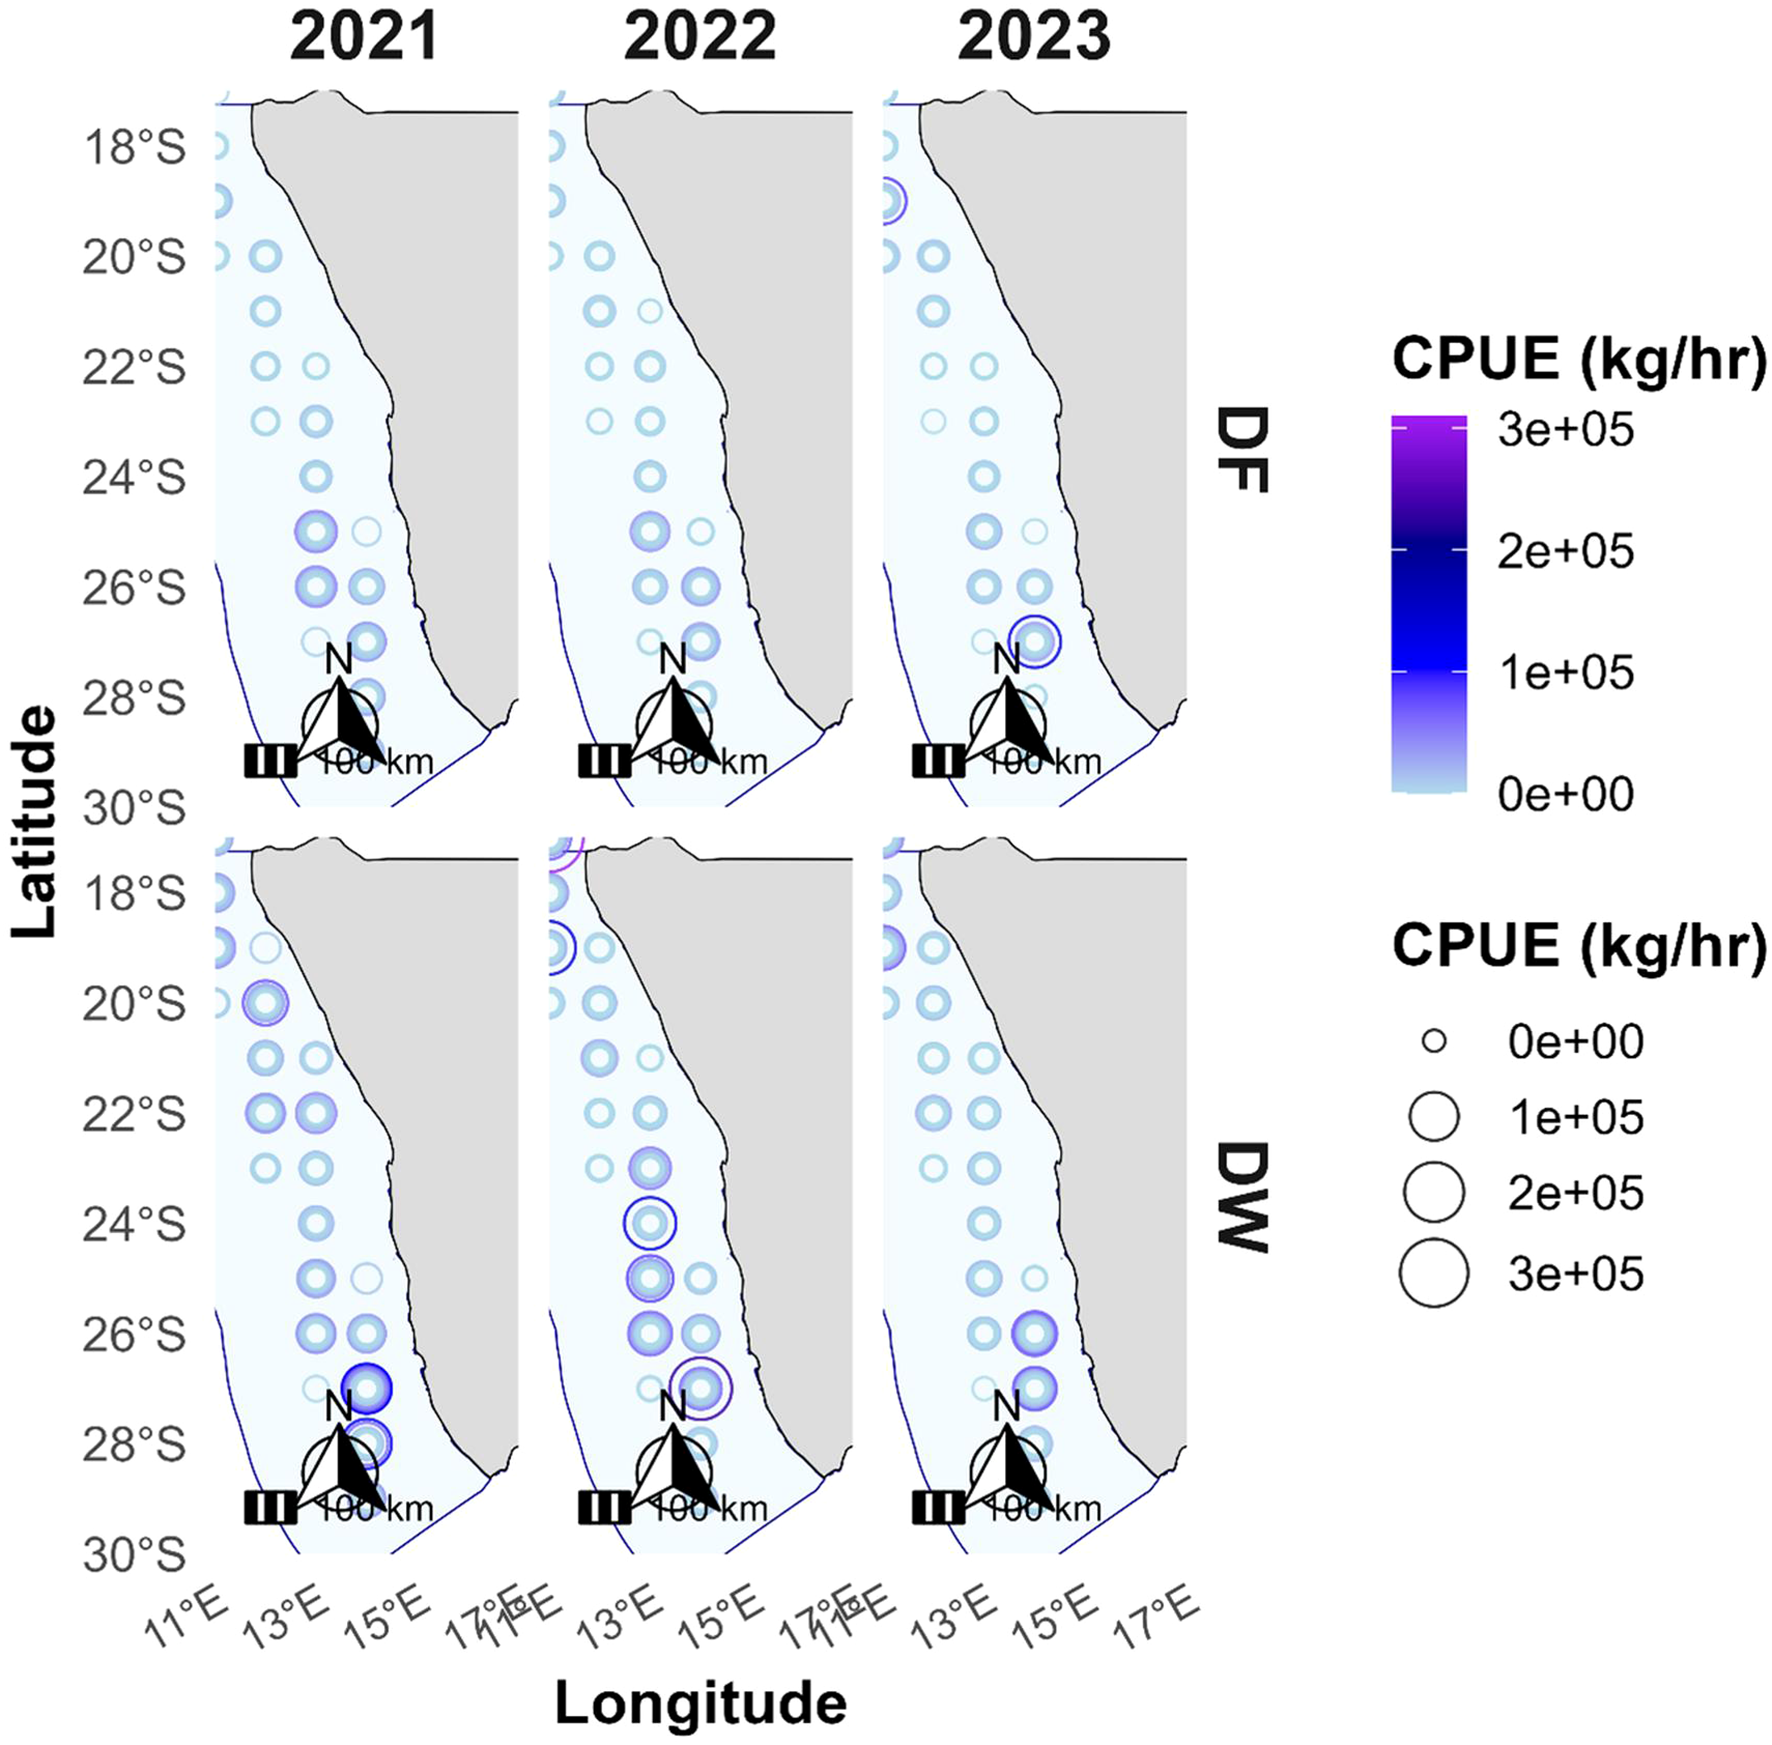
Spatial distribution of Catch Per Unit Effort (CPUE, kg/hr) along the Namibian Exclusive Economic Zone (EEZ) for freezer (DF) and wet-fish (DW) trawlers from 2021 to 2024. CPUE values are represented by point size and color intensity, with larger, darker markers indicating higher fishing efficiency. The EEZ boundary is shown in light blue, and the Namibian coastline is shaded grey.
3.6.1 Multivariate analysis of catch variability
The multivariate OLS model showed that the combined predictors (temperature, latitude, gear depth, mean haul duration, and number of hauls) explained a moderate share of annual catch variability (R² = 0.59; adj. R² = 0.40; F = 3.09; model p = 0.042) (Supplementary Table S4). Mean haul duration had a significant negative impact on total catch (β = –69,179; p = 0.014). In contrast, bottom and surface temperature, mean gear depth, latitude, and number of hauls were not statistically significant (p > 0.05). These results suggest that while environmental and operational factors jointly explain a moderate proportion of the variability in hake catch, only mean haul duration emerged as a significant predictor. This finding suggests that operational practices, rather than environmental drivers alone, may play an immediate role in shaping interannual variability of catch levels.
3.6.2 Quota constraint validation
The incorporated quota constraint ensured that realized hake catches did not exceed the allocated quotas across the two vessel types. Similarly, across all study years, there was no significant differences between observed landings for either vessel types (Supplementary Figure S2; Supplementary Material). In addition, the sensitivity analysis showed that there was no material change in the economic outcomes when quota caps were varied by ±10%, indicating that quota-constrained model remains consistent with observed data and robust enough for moderate variations.
4 Discussion
Studies have highlighted the significant role of hake fisheries in various national economies and the potential impact of climate change on hake ecosystems and associated fishing livelihoods (Engelhard et al., 2024). However, there are limited knowledge base regarding the specificity of ecological dynamics of hake stocks and the socio-economic vulnerabilities affecting the associated fishing communities. In the current study, we explored the trends in sea surface and bottom temperatures, gear depth, and trawling location on catch rates of two hake species in Namibian waters from 2000 and 2023. The present study identified the relationship between the temperature anomalies and the catch over the explored period, and the effects of depths and location of trawling on catch rates. In addition, we assessed the profitability of the industry over the period from 2018 to 2023.
4.1 Trends in hake catches and sea temperature change between 2000 and 2023
The present study identified the fluctuated declination of hake catches and CPUE, especially in freezer trawlers, with a yearly average of 43,623 tonnes and 3.58 tonnes per hour, respectively. The 2011–2012 spike in hake biomass observed in freezer and wet-fish trawlers coincided with a Benguela Niño, which may have caused a change in distribution that led to increased catch (Bahamon et al., 2022). Similarly, the 2016 Benguela Niño likely influenced the depth and location of hake, contributing to the residual increase in catch observed in 2017.
The declination observed from 2013 in both vessel types could be associated with fluctuations in stock abundance and recruitment, common in upwelling systems like the Benguela current, where environmental variability affect recruitment success and catchability (Kathena et al., 2016; Paterson and Kainge, 2014). For instance, the spawning stock of M. capensis, declined from 1.4 million tonnes in 2008 to about 600, 000 tonnes in 2012 (Kathena et al., 2016). In addition, the recovery phase marked by a surge in catch could be due to stock rebuilding and possible improvements in fleet efficiency or targeting behaviour. Our study found a minimal and non-significant relationship between the surface temperature and annual average catch volumes. Macpherson et al. (1991) and Kainge and Wieland (2017) reported significant positive relationship between hake biomass and sea surface temperature. In contrast, bottom temperature in the present study had opposing effects on catch volume from DW and DF. In the latter, the regression showed a positive significant relationship, explaining 44% variability in the data, and indicating that DF catches increased with increasing bottom temperature. On the other hand, for DW trawlers, the relationship was significantly negative, indicating that at lower catch levels (<20,000 tonnes), bottom temperatures were relatively high (~8.8–12.4°C). However, univariate regression is not sufficient to capture the impact of single variables on catch variability. Our multivariate model revealed that operational practices, particularly average haul duration, were influential, with longer hauls associated with reduced total hake catch. This result aligns with findings from related trawl fisheries, where extended towing times can lower CPUE due to diminishing returns, net saturation, and reduced fish quality (Kirchner and Leiman, 2014; Paterson and Kainge, 2014). Although, there was no statistical significance for bottom and surface temperature, depth, and latitude in the multivariate model, this does not negate their ecological importance. It rather highlights the substantial influence of vessel operations on short-term catch outcomes. Hence, the contrasting bottom-temperature-catch relationship among the vessel types may be associated with differences in fishing strategies, depth preferences, and hake distribution. For instance, under extreme warm conditions, such as during the Benguela Niño event in 2011, Cape hake were recorded to move to deeper waters with bottom temperatures around 11°C, which may favour DF at this time period (Bahamon et al., 2022). Despite these spatial shifts, the biomass remained resilient and within historical ranges, suggesting that the species adapts to maintain favourable environmental conditions.
Gordoa et al. (2000) investigated hake catch and sea temperature variability between 1994 and 1996 and recorded a clear seasonal fluctuation (every 3 months) in catch patterns. Authors reported a strong correlation between SST and CPUE, attributing SST anomalies recorded in 1997 to sustained upwelling and lack of warm water intrusion, disrupting the seasonal cycle. On the other hand, Voges et al. (2005) employed Ideal Free Distribution (IFD) theory to effort allocation in the Namibian hake fishery, highlighting spatial CPUE variation between the two main hake species, with values ranging from 1 to 6 tonnes per hour during the 1994–1999 period. The catch rates and bioeconomic of hakes differs across regions. In the South African offshore hake trawl analysis, an average CPUE of 0.724 tonnes per hour was recorded in 2013 (Cooper and Jarre, 2017). In contrast, the present study estimated a CPUE between 2.9 and 4.4 tonnes per hour for the same year, indicating higher catches per hour in Namibia compared to South Africa. In the mediterranean, the CPUE of hake fishery varies depending on the fishing method, with trawlers recording an average 0.17 tonnes per hour (based on 435.1 tonnes and 2560 trawling hours per year), and longliners recording an average of 0.058 tonnes per hour (from 126.1 tonnes over 2160 trawling hours per year) (Lleonart et al., 2003). However, comparisons of catch rates across regions must consider factors such as time periods, environmental variability, and differences in management programs.
While our models identified relationships between hake catches and temperature variations, a major limitation in the present study is that temperature was the single environmental explanatory variable included in the model. Other environmental factors such as salinity, wind speed and dissolved oxygen, as well as operational drivers such as fishing effort, location, and gear depth are well reported to have significant influence on hake distribution and catchability (Engelhard et al., 2024; Gallego et al., 2025; Gordoa et al., 2000; Kainge and Wieland, 2017). However, the long-term consistent datasets for these additional variables were not available across the study period. Hence, this result should therefore be interpreted with caution. Future studies should adopt a multi-variable approach that enable a more holistic exploration of the combined effects of environmental and operational factors on hake catch dynamics.
4.1.1 Variations in catches and efforts across vessel types
The present study showed a significant positive correlation between annual CPUE and fishing efforts for DW vessels, while the relationship was weaker and not statistically significant for DF vessels. The non-significant result in the latter may be associated with high variability in spatial targeting, depth distribution, and environmental influences on hake availability. For example, DF vessels operate over broader ranges, which can weaken the direct coupling between CPUE and effort (Johnsen and Iilende, 2007; Kainge and Wieland, 2017). Hence, variability in the data may have masked statistical significance despite existing effort-stock dynamics. In contrast, Gordoa et al. (2000) reported a significant negative correlation between CPUE and fishing efforts using a data from 1994 to 1997 (r = 0.72, p < 0.001). However, authors did not find significant monthly correlations between CPUE and effort at the stratum level across the four years analyzed. The discrepancy between these studies may be associated with the differences in the length of time series data, hake distributions during the respective periods, or the management programs in place.
Our study showed that the sharp decline in DF effort during the mid-period (between 2008 and 2021) was not accompanied by a similar reduction in overall catch levels, which contrasted with DW fleets, where the trawlers activities increased along with the landings during the same period. The mismatch could be associated with several interacting ecological and management dynamics. First, it could be attributed to a biological lag between reduced fishing pressure and visible recovery of hake stocks, which may be due to slow growth and delayed maturation characteristics of hake species (Kathena et al., 2016). Hence, even when effort was reduced, the biomass rebuild may not been immediately reflected in catch volumes. In addition, due to high variable ecosystems such as in BCLME, stock biomass may not respond promptly to instant changes in exploitation due to environmental variability (Engelhard et al., 2024). Another possible explanation for the stable catch levels is increased or more efficient fishing by DW vessels, which often target overlapping stocks. Although, both vessels are generally known to differ in target depth and range of operations, but there are reports that quota allocations and operational behaviour enables fleet substitutions (Kirchner and Leiman, 2014).
The sharp decline of effort and landings observed in recent years (2023-2024) across the vessel types may be explained by reduced stock productivity, as also acknowledged in a recent NSA report (2025). For example, the total hake landings decreased from 45,159 metric tonnes reported in the first quarter of 2024 to 26,165 metric tonnes in the fourth quarter, accounting for a 42% reduction. This reduced productivity may partly reflect the declining spawning of M. capensis reported by Paterson and Kainge (2014). Additionally, factors such as oxygen depletion, temperature anomalies, environmental seasonality, and diel behavioural changes may have also contributed to low CPUE independently of stock size (Gordoa et al., 2000; Kainge and Wieland, 2017).Operational constraints such as rising fuel prices and quota costs, may also have contributed to the observed reduction of the fishing efforts and landings (Cooper and Jarre, 2017).
4.2 The bioeconomic analysis on hake fisheries
The present study found that, based on catch revenue and cost analysis, livelihoods in the hake fishery were not profitable during the four-year period from 2018 to 2023 when relying solely on hake revenue. Profitability was only achieved when additional income sources—such as by-catch sales and quota fees—were included. Between 2007 and 2009, the hake (only) industry of Namibia was reported to be highly profitable with an annual profit of N$80 million, which only account for 36% of the potential normal profit (Kirchner, 2014). Despite the study suggesting that with less risks, the hake industry in the country would experience higher returns, the result from the present study has shown that the industry was unprofitable between 2017 and 2021. The lack of higher returns could be attributed to the declines in the catch of the fish species from 2009 and the years selected in the present study (2017-2021). Additionally, it is likely that the allocation of 70% of the hake TAC to wet-fish trawlers, aimed at supporting and securing employment, reduces overall profitability, since freezer trawlers, with only 30% of the TAC, appear to be more profitable under current operating costs. Given that wet-fish operations are more affected by fuel prices and longer travel distances to fishing grounds, this might be a reason for the reduced profitability, and unless the wet-fish sector becomes more competitive, its economic efficiency could remain limited (Kirchner and Leiman, 2014).
In other regions where Hake fishing is being practiced, profits are being recorded. In the Gulf of California, a low but positive profit of Pacific hake fishery was achieved with a profitability of 5.19% and a benefit-to-cost ratio of 1.05 (Ramírez-Rodríguez, 2017). Authors suggested that profit could be increased in the future if the catches were to rise from 72 metric tonnes to 90 or 100 metric tonnes. In contrast, in South African hake fishery, profitability decreases in the hake fishing industry due to factors such as high fuel prices, low CPUE, and high environmental variability (Cooper and Jarre, 2017). In summary, the integration of economic and biological thresholds emphasizes the need for fisheries policy to go beyond sustainability alone. Given the sharp decline in profits beyond EMSY, aligning management with EMEY recorded in the present study, could boost profitability without compromising biological objectives. These findings support the adoption of effort-based tools, such as quota limits, effort caps, or economic incentives, to align harvesting practices with optimal reference points.
The present study observed a significant increase in the total expenditure in hake fishing during 2020, compared to other years in the study period, due to the increasing cost of consumables, leading to negative returns. It was reported that the industry’s actual landings are less than half of the processing capacity, creating economic inefficiencies and prompting pressure to raise quotas. This, combined with TAC levels that have consistently exceeded scientific recommendations, may contribute to overfishing or stock depletion (Paterson et al., 2013). Also, the loss could be associated with the impacts of COVID-19. In Peru, for instance, the gross income of vessel owners and primary buyers involved in hake fishing decreased to negative territory due to a 97% reduction in fishing trips (Grillo-Núñez et al., 2021). However, in the current study, there was no sharp decline corresponding to fishing efforts between 2019 and 2020. While COVID-19 may not have significantly altered hake catches in Namibian waters, the increased cost of consumables such as fuel and lubricants, gear materials, and packaging materials, many of which are imported—could have escalated sharply due to global supply chain disruptions caused by the pandemic.
Aside from cost-related variabilities, price dynamics also have a significant influence on hake profitability. According to NSA (2024), despite stable hake landings, export earnings declined by 7.5% between the second quarter of 2023 and the second quarter of 2024, reflecting volatility in international market values. In addition, fresh hake exports face additional challenges linked to cold chain integrity, particularly in markets such as Spain, where minor breaches can reduce product quality and market prices (Neethling and Goedhals-Gerber, 2023). Hence, the interplay between operational costs, export logistics, and global market demand underscores the need to account for price variability in bioeconomic modelling, as constant price assumptions may mask the real drivers of economic sustainability.
The EMEY and EMEY results obtained in the present study should be regarded as more representative of recent years, due to substantial increase in costs and prices since 2018. The assumptions of constant prices and cost across the study period may not accurately reflect the true reality of the earlier years. Therefore, future studies should incorporate time-varying economic data to better capture the differences between the present and the past conditions.
4.3 Spatial, temporal, and depth-related variability in catch rates
Our study revealed a non-significant influence of gear depth on the catch volumes of hake species in Namibian waters, with 69% of the landings caught between 300–400 m depth. In a study that assessed how seine rope length, seine rope diameter, and seine net configurations of different sizes and shapes affect the catch efficiency of demersal fishes, shorter seine ropes (4 coils) were found to significantly lower catches than longer ones (8 coils) (Noack et al., 2024). About 75% of M. capensis are usually caught shallower than 300 m, while the same amount of M. paradoxus are found deeper than 300 m depth (Burmeister, 2005; Kainge and Wieland, 2017). However, the depth at which the fish were caught may have been influenced by the age of the fish, time, conservation measures, and spatial factors that affected the density of their distribution. In the present study, all wet-fish trawler catches during 2008–2017 and 2020–2024 occurred at depths of 300–400 m. On the other hand, all hake catches by freezer trawlers between 2012 and 2021 were also caught at similar depths.
Hake showed a preference for deeper water as they age, and this may also influence their location (Jansen et al., 2016). Additionally, the Namibian hake trawling is limited to a depth above 200m in the central region and north, and 300m in the south (Elwen et al., 2025). Specifically, fishing south of 25°S has been restricted, with wet−trawl vessels limited to depths greater than 300 meters and freezer−trawl vessels limited to depths greater than 350 meters (Kathena et al., 2016). In addition, the occurrence of Benguela-Niño events has been reported to cause maximum hake densities at depths between 260–320 m (Bahamon et al., 2022). Hence, it can be inferred that the reason for the majority of landings in the 300-400m depth and the variations in annual catch might be a combination of the species migration pattern, age, conservation, and geographical position. Furthermore, studies have reported that temporal and spatial variability of hypoxia in the sea bottom usually plays a significant role in the dynamics of hake depth location, especially for M. capensis (Bartholomae and Van Der Plas, 2007; Hamukuaya et al., 1998). Hence, other factors such as dissolved oxygen and temperature play significant roles in the depth distribution of hake species (Kainge et al., 2017; Voges et al., 2005). The high catch of 2011 was reported to occur as a result of the presence of both species in deeper water, due to changes in the environment (Kathena et al., 2018).
The current study revealed that the majority of the high hake catches clustered around 24°S and 27°S latitude, specifically from the central to the southern costal zones. This finding aligns with Burmeister (2001). The study reported that highest average biomass of M. capensis was recorded in the north of 27°S using survey data from 1990 to 1999. Similarly, in Johnsen and Lilende (2007), authors found that day–night differences in CPUE varied with latitude, and the fraction of M. capensis and M. paradoxus in survey catches changed significantly with latitude. Their study also reported that M. capensis dominated the shallow waters (<350 m) in the northern latitudes, while M. paradoxus was more prevalent in deeper waters (>450 m) in the southern latitudes. In relation to the present study, this partially suggests that M. capensis may have been the most frequently caught species between 2000 and 2023. In a study by Gordoa et al. (2000), which assessed monthly variability in the catchability of Namibian hake and its relationship with environmental seasonality from 1994 to 1997, the standardized CPUE data were analyzed across latitudes ranging from 18°S to 28°S. These studies have established the latitudinal and depth-related structuring of hake populations, supporting the spatial catch patterns recorded in the present study.
5 Conclusion
Using an integrative analysis that combines bioeconomic analysis and environmental dynamics of hake fishery, this present study examines hake fishery, focusing on Merluccius capensis and M. paradoxus over a 24-year period. It highlights biological and economic indicators, identifying overexploitation and declining profitability particularly in recent years. Despite CPUE and total hake catches reaching peaks in the early 2010s, both indicators have significantly declined, reaching lowest in 2024, suggesting decreased stock productivity or changes in fleet efficiency or management programs. In addition, the bioeconomic model showed that current effort levels have consistently, over the years, exceed both MSY and MEY thresholds, indicating that the two hake species in the Namibian waters are not being harvested at optimal levels for long-term sustainability or profitability. However, the differences between the vessel types were preserved by aggregating vessel data through weighted averages, and realized catches were constrained by quotas, confirming that harvests did not exceed allocations and that results were robust to moderate sensitivity variations.
The assessed environmental effects show that bottom temperatures have significant opposing influences on catches of freezer and wet-fish trawlers. However, depth-catch relationship was weak and statistically non-significant, indicating that univariate patterns should be interpreted cautiously and primarily as exploratory. Our multivariate analysis models identified haul duration as a stronger predictor of catch. On the other hand, spatial analysis reveals consistent clustering of high catches at mid-depths (300–400 m) and latitudes between 24°S and 28°S—areas.
The economic assessment shows high reliance of the hake fishery on ancillary income (e.g., quota fees and by-catch sales) to remain profitable, as revenue from hake alone has not been sufficient to cover annual operational cost. The reliance seems to be further compounded by structural inefficiencies associate with quota allocation and expensive leasing agreement, placing additional pressure on vessel operators. A sudden surge in increasing operational cost in the 2020s—particularly during the COVID-19 period—exposed vulnerabilities in the value chain of hake fishery in the country, with breakeven prices sharply increasing in recent years.
Conclusively, it is essential to rebuild the Namibian hake stocks while fishing effort is aligned with EMEY rather than MSY to unleash a dual benefit of ecological resilience and increased economic returns. It is essential for policy makers to consider employing effort-based management tools and initiate cost-reduction strategies. In addition, the management programs focusing on the understanding of the dynamics and fine-scale habitat due to temperature changes should be developed or encouraged.
Statements
Data availability statement
The original contributions presented in the study are included in the article/Supplementary Material, further inquiries can be directed to the corresponding author/s.
Ethics statement
Ethical approval was not required for the studies involving animals in accordance with the local legislation and institutional requirements because the study used secondary data.
Author contributions
TN: Data curation, Project administration, Funding acquisition, Resources, Writing – original draft, Methodology, Conceptualization, Formal Analysis, Visualization, Investigation, Software, Writing – review & editing. LM: Methodology, Writing – original draft, Investigation, Data curation, Software, Conceptualization, Resources, Formal Analysis, Visualization, Writing – review & editing. MA: Data curation, Investigation, Conceptualization, Visualization, Writing – original draft, Methodology, Writing – review & editing, Formal Analysis. GD: Investigation, Writing – review & editing, Methodology, Formal Analysis, Data curation, Software, Visualization, Writing – original draft. OO: Validation, Formal Analysis, Writing – original draft, Writing – review & editing, Methodology, Data curation. AN: Resources, Writing – original draft, Formal Analysis, Project administration, Writing – review & editing, Data curation, Investigation, Conceptualization, Software, Methodology. KM: Writing – review & editing, Formal Analysis, Validation, Methodology, Writing – original draft. RG: Validation, Writing – review & editing, Writing – original draft, Data curation, Supervision, Formal Analysis. EF: Project administration, Validation, Methodology, Formal Analysis, Data curation, Conceptualization, Visualization, Software, Writing – review & editing, Supervision, Writing – original draft, Investigation.
Funding
The author(s) declare that no financial support was received for the research, and/or publication of this article.
Acknowledgments
The authors would like to thank all the branches of the Namibian Ministry of Fisheries and Marine Resources for providing the raw data for this article, and their support and consultations during the data analysis and writing of the manuscript.
Conflict of interest
The authors declare that the research was conducted in the absence of any commercial or financial relationships that could be construed as a potential conflict of interest.
Generative AI statement
The author(s) declare that no Generative AI was used in the creation of this manuscript.
Any alternative text (alt text) provided alongside figures in this article has been generated by Frontiers with the support of artificial intelligence and reasonable efforts have been made to ensure accuracy, including review by the authors wherever possible. If you identify any issues, please contact us.
Publisher’s note
All claims expressed in this article are solely those of the authors and do not necessarily represent those of their affiliated organizations, or those of the publisher, the editors and the reviewers. Any product that may be evaluated in this article, or claim that may be made by its manufacturer, is not guaranteed or endorsed by the publisher.
Supplementary material
The Supplementary Material for this article can be found online at: https://www.frontiersin.org/articles/10.3389/fmars.2025.1688036/full#supplementary-material
References
1
Bahamon N. Kathena J. N. Van Der Plas A. K. Kainge P. Paramo J. Gordoa A. (2022). Spatial and biomass structure of shallow-water cape hake (Merluccius capensis) in the light of episodic environmental shifts. Fisheries. Oceanogr.31, 524–538. doi: 10.1111/fog.12602
2
Bartholomae C. Van Der Plas A. (2007). Towards the development of environmental indices for the Namibian shelf, with particular reference to fisheries management. Afr. J. Mar. Sci.29, 25–35. doi: 10.2989/AJMS.2007.29.1.2.67
3
Berachi I. G. (2003). “ MSc. Thesis submitted in partial fulfilment of the requirements for the master of science in international fisheries management,” in BIOECONOMIC ANALYSIS OF ARTISANAL MARINE FISHERIES OF TANZANIA ( Mainland ) ( University of Tromsø, Norway).
4
Burmeister L.-M. (2001). Depth-stratified density estimates and distribution of the Cape hake Merluccius capensis and M. paradoxus off Namibia deduced from survey data 1990–1999. South Afr. J. Mar. Sci.23, 347–356. doi: 10.2989/025776101784528863
5
Burmeister L. (2005). Is there a single stock of Merluccius paradoxus in the Benguela ecosystem? Afr. J. Mar. Sci.27, 23–32. doi: 10.2989/18142320509504065
6
Butterworth D. S. Geromont H. F. (2001). Evaluation of a class of possible simple interim management procedures for the Namibian hake fishery. South Afr. J. Mar. Sci.23, 357–374. doi: 10.2989/025776101784528962
7
Chiripanhura B. Teweldemedhin M. (2016). “ An analysis of the fishing industry in Namibia: the structure, performance, challenges, and prospects for growth and diversification” in AGRODEP Working Paper 0021. Washington, DC: International Food Policy Research Institute (IFPRI). Available online at: https://hdl.handle.net/10568/146325 (Accessed December 25, 2025).
8
Clark C. W. (1973). Profit maximization and the extinction of animal species. J. Political. Econ.81, 13. doi: 10.1086/260090
9
Cooper R. Jarre A. (2017). An agent-based model of the South African offshore hake trawl industry: part II drivers and trade-offs in profit and risk. Ecol. Econ142, 257–267. doi: 10.1016/j.ecolecon.2017.06.027
10
De Oliveira J. A. A. Boyer H. J. Kirchner C. H. (2007). Developing age-structured stock assessment models as a basis for management procedure evaluations for Namibian sardine. Fisheries. Res.85, 148–158. doi: 10.1016/j.fishres.2007.01.010
11
Elwen S. H. Khan U. Kreiner A. Van Der Plas A. K. Wilhelm M. R. Barnes D. et al . (2025). Blue carbon in an eastern boundary upwelling zone – A case study in Namibia. Deep. Sea. Res. Part II.: Topical. Stud. Oceanogr.221, 105478. doi: 10.1016/j.dsr2.2025.105478
12
Engelhard G. H. Bova C. Gusha M. N. C. Harrod O. L. Kadhila T. Kanyimba A. et al . (2024). Climate risk assessment of the fisheries in Namibia. Rev. Fish. Biol. Fisheries.34, 1231–1260. doi: 10.1007/s11160-024-09871-1
13
Erasmus V. N. Kadhila T. Gabriel N. N. Thyberg K. L. Ilungu S. MaChado T. (2021). Assessment and quantification of Namibian seafood waste production. Ocean. Coast. Manage.199, 105402. doi: 10.1016/j.ocecoaman.2020.105402
14
Fiorella K. J. Bageant E. R. Schwartz N. B. Thilsted S. H. Barrett C. B. (2021). Fishers’ response to temperature change reveals the importance of integrating human behavior in climate change analysis. Sci. Adv.7, eabc7425. doi: 10.1126/sciadv.abc7425
15
Flaaten O. Heen K. Matthíasson T. (2017). Profit and resource rent in fisheries. Mar. Resour. Econ32, 311–328. doi: 10.1086/692074
16
Flaaten O. Mjølhus E. (2010). Nature reserves as a bioeconomic management tool: A simplified modelling approach. Environ. Resour. Econ47, 125–148. doi: 10.1007/s10640-010-9368-3
17
Forde S. Von Der Heyden S. Le Moan A. Nielsen E. S. Durholtz D. Kainge P. et al . (2025). Management and conservation implications of cryptic population substructure for two commercially exploited fishes (Merluccius spp.) in southern Africa. Mol. Ecol. Resour.25, e13820. doi: 10.1111/1755-0998.13820
18
Gallego D. García-Herrera R. Tomety F. S. Álvarez-Castro M. C. Peña-Ortiz C. (2025). Historical record of upwelling-favorable winds in Southern Benguela 1833–2014. NPJ Climate Atmospheric. Sci.8, 36. doi: 10.1038/s41612-025-00925-0
19
Gordoa A. Masó M. Voges L. (2000). Monthly variability in the catchability of Namibian hake and its relationship with environmental seasonality. Fisheries. Res.48, 185–195. doi: 10.1016/S0165-7836(00)00160-0
20
Grillo-Núñez J. Mendo T. Gozzer-Wuest R. Mendo J. (2021). Impacts of COVID-19 on the value chain of the hake small scale fishery in northern Peru. Mar. Policy134, 104808. doi: 10.1016/j.marpol.2021.104808
21
Habib A. Ullah M. Duy N. N. (2014). Bioeconomics of commercial marine fisheries of bay of bengal: status and direction. Econ Res. Int.2014, 538074. doi: 10.1155/2014/538074
22
Hamukuaya H. O’Toole M. J. Woodhead P. M. J. (1998). Observations of severe hypoxia and offshore displacement of Cape hake over the Namibian shelf in 1994. South Afr. J. Mar. Sci.19, 57–59. doi: 10.2989/025776198784126809
23
Hutchings L. Van Der Lingen C. D. Shannon L. J. Crawford R. J. M. Verheye H. M. S. Bartholomae C. H. et al . (2009). The Benguela Current: An ecosystem of four components. Prog. Oceanogr.83, 15–32. doi: 10.1016/j.pocean.2009.07.046
24
Imbol Koungue R. A. Rouault M. Illig S. Brandt P. Jouanno J. (2019). Benguela niños and benguela niñas in forced ocean simulation from 1958 to 2015. J. Geophys. Res.: Oceans.124, 5923–5951. doi: 10.1029/2019JC015013
25
Ithindi A. P. (2003). RENT CAPTURE IN THE NAMIBIAN FISHERIES: the Case of Hake ( Reykjavik University). Available online at: https://www.grocentre.is/ftp/moya/gro/index/publication/rent-capture-in-the-Namibian-fisheries-with-specific-reference-to-newcomers-in-the-industry (Accessed September 23, 2025).
26
Jansen T. Kainge P. Singh L. Wilhelm M. Durholtz D. Strømme T. et al . (2015). Spawning patterns of shallow-water hake (Merluccius capensis) and deep-water hake (M. paradoxus) in the Benguela Current Large Marine Ecosystem inferred from gonadosomatic indices. Fisheries. Res.172, 168–180. doi: 10.1016/j.fishres.2015.07.009
27
Jansen T. Kristensen K. Kainge P. Durholtz D. Strømme T. Thygesen U. H. et al . (2016). Migration, distribution and population (stock) structure of shallow-water hake (Merluccius capensis) in the Benguela Current Large Marine Ecosystem inferred using a geostatistical population model. Fisheries. Res.179, 156–167. doi: 10.1016/j.fishres.2016.02.026
28
Johnsen E. Iilende T. (2007). Factors affecting the diel variation in commercial CPUE of Namibian hake—Can new information improve standard survey estimates? Fisheries. Res.88, 70–79. doi: 10.1016/j.fishres.2007.07.013
29
Johnsen E. Kathena J. N. (2012). A robust method for generating separate catch time-series for each of the hake species caught in the Namibian trawl fishery. Afr. J. Mar. Sci.34, 43–53. doi: 10.2989/1814232X.2012.673274
30
Kainge S. (2013). The effects of temperature and dissolved oxygen on the distribution of the deep-water hake(Merluccius paradoxus), stock in the Namibian waters. Available online at: https://digital.unam.edu.na/xmlui/handle/11070.1/1795 (Accessed December 30, 2024).
31
Kainge P. Van Der Plas A. K. Bartholomae C. H. Wieland K. (2017). Effects of environmental variables on survey catch rates and distribution by size of shallow- and deep-water Cape hakes, Merluccius capensis and Merluccius paradoxus off Namibia. Fisheries. Oceanogr.26, 680–692. doi: 10.1111/fog.12227
32
Kainge P. Wieland K. (2017). Fine-scale environmental effects on Cape hake survey catch rates in the northern Benguela, using data from a trawl-mounted instrument package. Mar. Ecol. Prog. Ser.584, 185–198. doi: 10.3354/meps12350
33
Kainge P. Wieland K. Feekings J. (2015). Diel effects on bottom-trawl survey catch rates of shallow- and deep-water Cape hakes Merluccius capensis and M. paradoxus off Namibia, using solar zenith angle. Afr. J. Mar. Sci.37, 583–592. doi: 10.2989/1814232X.2015.1114969
34
Kapuka A. Hlásny T. (2021). Climate change impacts on ecosystems and adaptation options in nine countries in southern Africa: What do we know? Ecosphere12, e03860. doi: 10.1002/ecs2.3860
35
Kathena J. N. Nielsen A. Høgsbro Thygesen U. Berg C. W. (2016). Hake species (Merluccius capensis and M. paradoxus) assessment in the Benguela Current Large Marine Ecosystem. Environ. Dev.17, 193–201. doi: 10.1016/j.envdev.2015.11.011
36
Kathena J. Yemane D. Bahamon N. Jansen T. (2018). Population abundance and seasonal migration patterns indicated by commercial catch-per-unit-effort of hakes (Merluccius capensis and M. paradoxus) in the northern Benguela Current Large Marine Ecosystem. Afr. J. Mar. Sci.40, 197–209. doi: 10.2989/1814232X.2018.1476264
37
Kirchner C. H. (2014). Estimating present and future profits within the Namibian hake industry: A bio-economic analysis. Afr. J. Mar. Sci. 36 (3), 283–292. doi: 10.2989/1814232X.2014.920727
38
Kirchner Bauleth-D’Almeida G. Wilhelm M. R. (2010). Assessment and management of Cape horse mackerel Trachurus capensis off Namibia based on a fleet-disaggregated age-structured production model. Afr. J. Mar. Sci.32, 525–541. doi: 10.2989/1814232X.2010.538144
39
Kirchner C. Kainge P. Kathena J. (2012). Evaluation of the Status of the Namibian Hake Resource (Merluccius spp.) Using Statistical Catch-at-Age Analysis ( Environment for Development Initiative). Available online at: https://www.jstor.org/stable/resrep14967 (Accessed December 27, 2024).
40
Kirchner C. Leiman A. (2014). Resource rents and resource management policies in Namibia’s post-Independence hake fishery. Maritime. Stud.13, 7. doi: 10.1186/2212-9790-13-7
41
Lima F. P. Wethey D. S. (2012). Three decades of high-resolution coastal sea surface temperatures reveal more than warming. Nat. Commun.3, 704. doi: 10.1038/ncomms1713
42
Lleonart J. Maynou F. Recasens L. Franquesa R. (2003). A bioeconomic model for Mediterranean fisheries, the hake off Catalonia (western Mediterranean) as a case study. Scientia Marina67 (S1), 337–351. doi: 10.3989/scimar.2003.67s1337
43
Macpherson E. Masó M. Barange M. Gordoa A. (1991). Relationship between measurements of hake biomass and sea surface temperature off southern Namibia. South Afr. J. Mar. Sci.10, 213–217. doi: 10.2989/02577619109504633
44
Manning P. R. (1998). Managing Namibia’s Marine Fisheries: Optimal Resource Use and National Development Objectives . London: London School of Economics and Political Science. Available online at: https://the-eis.com/elibrary/sites/default/files/downloads/literature/Managing%20Namibias%20marine%20fisheries_1998.pdf.
45
Mediodia H. J. Kahui V. Noy I. (2023). Sea surface temperature and tuna catch in the eastern pacific ocean under climate change. Mar. Resour. Econ38, 329–351. doi: 10.1086/726023
46
Mediodia H. J. Noy I. Kahui V. (2024). The impact of ocean warming on selected commercial fisheries in New Zealand. Aust. J. Agric. Resour. Econ68, 587–607. doi: 10.1111/1467-8489.12564
47
MFMR (2021). Annual Report 2020/2021, Ministry of Fisheries and Marine Resources (Windhoek, Namibia: Ministry of Fisheries and Marine Resources). Available online at: https://mfmr.gov.na/downloads/-/document_library/DWqND60MzhTr/view_file/3809730.
48
MFMR . (2023). Cabinet Minister Programme. Ministry of Fisheries and Marine Resources, 7.
49
Munro G. R. (1982). Fisheries, extended jurisdiction and the economics of common property resources. Can. J. Econ. 15, 405–425. 10.2307/134758
50
Namibia Statistics Agency (2023). Namibia Statistics Agency | Census Disemination ( Namibia Statistics Agency). Available online at: https://census.nsaNamibia.com/ (Accessed December 30, 2024).
51
Neethling C. Goedhals-Gerber L. L. (2023). Identifying temperature deviations in the hake cold chain from Namibia to Spain. J. Transport. Supply. Chain. Manage.17, 16. Available online at: https://jtscm.co.za/index.php/jtscm/article/view/923 (Accessed August 9, 2025).
52
Noack T. Berg F. Kindt-Larsen L. (2024). Length matters: Effects of fishing gear and fishing behavior on the catch efficiency of demersal seines. Heliyon10, 1–11. doi: 10.1016/j.heliyon.2024.e37953
53
NSA (2025). Gross Domestic Product (First Quarter 2025). (Windhoek, Namibia: Namibia Statistics Agency), 64.
54
Paterson B. (2015). Tracks, trawls and lines—Knowledge practices of skippers in the Namibian hake fisheries. Mar. Policy60, 309–317. doi: 10.1016/j.marpol.2014.07.017
55
Paterson B. Kainge P. (2014). Rebuilding the Namibian hake fishery: A case for collaboration between scientists and fishermen. Ecol. Soc.19 (2), 49. doi: 10.5751/ES-06370-190249
56
Paterson B. Kirchner C. Ommer R. (2013). A Short History of the Namibian hake fishery—A social-ecological analysis. Ecol. Soc.18 (4), 66. doi: 10.5751/ES-05919-180466
57
Ramírez-Rodríguez M. (2017). A profitability analysis of catch quotas for the pacific hake fishery in the gulf of California. North Am. J. Fisheries. Manage.37, 23–29. doi: 10.1080/02755947.2016.1227400
58
Sherbourne R. (2010). Guide to the Namibian Economy 2010 at Namibiana Buchdepot ( Institute for Public Policy Research). Available online at: https://www.Namibiana.de/en/guide-to-the-Namibian-economy-2010.html (Accessed December 25, 2024).
59
Sowman M. Cardoso P. (2010). Small-scale fisheries and food security strategies in countries in the Benguela Current Large Marine Ecosystem (BCLME) region: Angola, Namibia and South Africa. Mar. Policy34, 1163–1170. doi: 10.1016/j.marpol.2010.03.016
60
Sumaila U. R. (2004). Namibia’s Fisheries: Ecological, Economic and Social Aspects (Deft, Netherlands: Eburon Academic Publishers).
61
Voges E. Gordoa A. Field J. G. (2005). Dynamics of the Namibian hake fleet and management connotations: Application of the ideal free distribution. Sci. Marina.69 (2), 285–293. doi: 10.3989/scimar.2005.69n2285
62
Wilhelm M. R. Kirchner C. H. Roux J. P. Jarre A. Iitembu J. A. Kathena J. N. et al . (2015). “ Biology and fisheries of the shallow-water hake (Merluccius capensis) and the deep-water hake (Merluccius paradoxus) in Namibia,” in Hakes (Chichester, UK: John Wiley & Sons, Ltd), 70–100. doi: 10.1002/9781118568262.ch3
63
WITS (2024). Namibia Frozen hake exports by country | 2023 | Data ( World Integrated Trade Solution). Available online at: https://wits.worldbank.org/trade/comtrade/en/country/NAM/year/2023/tradeflow/Exports/partner/ALL/product/030378 (Accessed December 26, 2024).
64
World Bank . (2025). Global Economic Prospects. Washington, DC: World Bank, Washington, DC. doi: 10.1596/978-1-4648-2193-6
Summary
Keywords
bioeconomic analysis, hake (Merluccius capensis, Merluccius paradoxus), fishery, economic, Namibia
Citation
Nalukaku T, Mueni LM, Adebote MO, Darko G, Olowe OS, Namboga A-M, Muhammad K, Gebauer R and Folorunso EA (2025) Optimizing effort for profit and sustainability: a bioeconomic and environmental evaluation of the Namibian hake fishery. Front. Mar. Sci. 12:1688036. doi: 10.3389/fmars.2025.1688036
Received
18 August 2025
Accepted
15 October 2025
Published
31 October 2025
Volume
12 - 2025
Edited by
Vitor H. Paiva, University of Coimbra, Portugal
Reviewed by
Tannaz Alizadeh Ashrafi, UiT The Arctic University of Norway, Norway; Ibtisam Al Abri, Sultan Qaboos University, Oman
Updates
Copyright
© 2025 Nalukaku, Mueni, Adebote, Darko, Olowe, Namboga, Muhammad, Gebauer and Folorunso.
This is an open-access article distributed under the terms of the Creative Commons Attribution License (CC BY). The use, distribution or reproduction in other forums is permitted, provided the original author(s) and the copyright owner(s) are credited and that the original publication in this journal is cited, in accordance with accepted academic practice. No use, distribution or reproduction is permitted which does not comply with these terms.
*Correspondence: Ewumi Azeez Folorunso, Efolorunso@frov.jcu.cz
†These authors have contributed equally to this work
ORCID: Tomas Nalukaku, orcid.org/0009-0005-7937-683X; Laurine Mule Mueni, orcid.org/0009-0001-5150-4730; Mary Opeyemi Adebote, orcid.org/0000-0001-6700-4717; George Darko, orcid.org/0009-0005-7166-2073; Olumide Samuel Olowe, orcid.org/0000-0002-1677-492X; Anna-Marie Namboga, orcid.org/0009-0003-0876-9578; Radek Gebauer, orcid.org/0000-0003-0894-0577; Ewumi Azeez Folorunso, orcid.org/0000-0003-2664-6195; Kabiru Muhammad, orcid.org/0009-0004-6527-5790
Disclaimer
All claims expressed in this article are solely those of the authors and do not necessarily represent those of their affiliated organizations, or those of the publisher, the editors and the reviewers. Any product that may be evaluated in this article or claim that may be made by its manufacturer is not guaranteed or endorsed by the publisher.