Abstract
Introduction:
The biogeochemical processes underlying carbon cycling in Arctic coastal systems are rapidly evolving due to intensified ice loss. (Aim) This study examined the distinct contributions of dissolved organic carbon (DOC) and particulate carbon from sea ice in Kongsfjorden, Svalbard (Methods) focusing on the optical characteristics of coloured dissolved organic matter (CDOM) to trace its fate.
Results:
Our results reveal that sea ice melt delivers a complex mixture: specific types of CDOM and a dominant load of total particulate carbon (TPC) that was identified as being primarily particulate inorganic carbon (PIC). The fate of the dissolved fraction was clearly traced by Gaussian decomposition.
Discussion:
Sea ice delivered nitrogen-rich organic components, creating spatial hotspots of aCDOM275 at the innermost site and of aCDOM330 at the outermost site, with a strong correlation with CO2. At the surface, photodegradation breaks down high-molecular-weight (HMW) (low S275–295) dissolved organic matter (DOM) into low-molecular-weight (LMW) fractions (high S275–295). Below the surface, microbial degradation further transforms this organic carbon, promoting remineralisation processes and releasing dissolved inorganic carbon (DIC) and CO2. Higher N:P and Si:P ratios and nutrients in these layers indicated enrichment by meltwater (sea ice/glacial) and microbial organic matter (OM) degradation, supported by shifts in CDOM spectral properties (SR, S275–295, and S350–400) and higher CO2. In contrast, the PIC-dominated TPC pool was decoupled from these biological transformations. Given the accelerating rate of Arctic warming, the impacts of sea ice and glacial melting on carbon dynamics in fjords like Kongsfjorden are likely to intensify, with potential positive feedback in the Arctic.
1 Introduction
Climate-driven changes in the Arctic are having profound and far-reaching effects on the Earth system and the living beings that depend on it (Rødven and Wilson, 2022). Arctic marine systems are experiencing an increased land-water discharge, a trend that may be exacerbated in the future due to climate warming (Pörtner et al., 2019). This influx of freshwater runoff influences the overall circulation in the Arctic Ocean, which can affect carbon and nutrient cycles and fluxes (Carmack et al., 2016). Glaciated environments emerge as focal points in the carbon cycle in polar and sub-polar regions, playing an important role in maintaining carbon balance (Lawson et al., 2014; Smith et al., 2017) and sequestering high volumes of organic carbon (Milner et al., 2017; Wadham et al., 2019). Fjords located at the nexus between glacial and marine environments are important in mediating the flux of particulate and dissolved carbon from glaciated landscapes to the open ocean (Hopwood et al., 2019). Fjords have been identified as hotspots of organic carbon sequestration. Compared to the ocean global average, fjords’ burial rate per area could be much larger (e.g., a hundred times) (Seifert et al., 2019). Certain components of the column, and as sources of readily available organic matter that sustain aquatic food webs, affect light penetration in the water column and facilitate the mobilisation and transportation of pollutants by affecting the release and complex binding properties (Khoo et al., 2022; Lund-Hansen et al., 2023).
The amount and composition of dissolved organic matter (DOM) fluctuate across different locations and over time, affected by its distance from source materials as well as the environmental changes it undergoes (Coble, 2007; Helms et al., 2008; Hood et al., 2015). Under certain conditions, processes like sorption, colloid formation, and precipitation can shift DOM into the particulate organic matter (POM) pool. Phytoplankton and other marine microorganisms initially release organic carbon (OC) in the form of easily degradable metabolites (Moran et al., 2022). The most defining processes impacting DOM, both quantitatively and qualitatively, are biodegradation and photodegradation in aquatic systems (Mopper et al., 2015; Vecchio & Blough, 2002) (Table 1). Both mechanisms can result in the transformation of DOM into inorganic compounds, such as CO2, leading to its further removal from the water column, as well as altering the chemical composition of DOM (Hansen et al., 2016). Biodegradation and photodegradation can transform DOM from larger molecules [high molecular weight (HMW)] to smaller labile compounds [low molecular weight (LMW)] that are then removed either by the volatilisation of CO2 or by rapid microbial consumption, or can change labile compounds to HMW refractory material.
Table 1
| Station | Lat. ° N | Lon. ° E | Date | Parameters |
|---|---|---|---|---|
| KB3 | 78.951 | 11.944 | 24.04.2023 | Hydrography, nutrients, DOC, TPC, CDOM, CO2, DIC, TA, pH |
| KB3/4 | 78.932 | 12.111 | 24.04.2023 | Hydrography, nutrients, DOC, TPC, CDOM, CO2, DIC, TA, pH |
| KB4 | 78.911 | 12.201 | 24.04.2023 | Hydrography, nutrients, DOC, TPC, CDOM, CO2, DIC, TA, pH |
| KB5 | 78.897 | 12.202 | 23.04.2023 | Hydrography, nutrients, DOC, TPC, CDOM, CO2, DIC, TA, pH |
| KB5c | 78.892 | 12.341 | 23.04.2023 | Hydrography, nutrients, CO2, DIC, TA, pH |
| KB5G | 78.894 | 12.353 | 23.04.2023 | Hydrography, nutrients, DOC, TPC, CDOM, CO2, DIC, TA, pH |
| A | 78.976 | 12.353 | 20.04.2023 | sea ice core, DOC, TPC, CDOM |
| B | 78.973 | 12.370 | 20.04.2023 | sea ice core, DOC, TPC, CDOM |
| C | 78.874 | 12.466 | 24.04.2023 | sea ice core, DOC, TPC, CDOM |
Coordinates, sampling dates, and parameters measured or calculated at each station.
DOC, dissolved organic carbon; TPC, total particulate carbon; CDOM, coloured dissolved organic matter; DIC, dissolved inorganic carbon; TA, total alkalinity.
To better assess DOM, typically by measuring dissolved organic carbon (DOC) concentration, it is crucial to have a better understanding of its composition to understand its role in the environment (Cantoni et al., 2020; Nebbioso and Piccolo, 2013; Novak et al., 2022; Stein and Macdonald, 2004). Chromophoric dissolved organic matter (CDOM), the coloured component of DOM, provides valuable insights into biogeochemical processes in the open and coastal ocean (Matsuoka et al., 2015; Milner et al., 2017). In contrast to Antarctica, where CDOM is scarce, the Arctic Ocean is characterised by abundant CDOM primarily sourced from large rivers (Milner et al., 2017). Matsuoka et al. (2015) showed that 76% of light absorption at 443 nm (top 2-m depth) in the Arctic is due to CDOM and that changes in the spectral slope of CDOM absorption (SCDOM) are driven by variations in bacterial production and abundance (e.g., lower spectral slopes in some Arctic Ocean water masses are linked to increased bacterial activity). They also found that of the total non-water absorption at 443 nm, CDOM remained independent of changes in chlorophyll a; that is, even when chlorophyll a levels varied, the amount of light absorbed by CDOM at 443 nm remained relatively constant. This observation was made in both sea ice and surface waters. Pavlov et al. (2014) highlighted the predominance of marine CDOM in Kongsfjorden’s surface waters during summer and the generally low DOC concentrations (below 90 μmol L−1). However, a more recent study in the Barents Sea reported that aCDOM(440) and DOC are relatively continuous from January to May, even during spring blooms, peaking until summer (Sandven et al., 2023) (Equation 1).
Although sea ice melting may not be the main source of carbon, it can produce specific types of CDOM, enriching the system with different types of OC (Granskog et al., 2005). The Arctic sea ice cover extends throughout the Arctic Ocean in winter and is characterised by multi-year ice (MYI) and first-year ice (FYI), with an average thickness of approximately 2 m. Due to warming during the last decades (Pörtner et al., 2019), the extent of MYI has decreased and been replaced by FYI (Serreze & Stroeve, 2015). During ice formation, the majority of CDOM from the water (marine and glacial) column is expelled during the brine rejection process. However, a small portion of CDOM may become trapped in the ice and is eventually released back into the water column when the sea ice melts (Matsuoka et al., 2012; Xie et al., 2014). CDOM in sea ice was found to be two orders of magnitude higher than in the adjacent water column in Baffin Bay in the Canadian Arctic and up to four times higher than within sea ice brines in Antarctica (Logvinova et al., 2016; Norman et al., 2011; Stein and Macdonald, 2004). Further observations have reported that sea ice can provide an additional input of DOM in these environments, and CDOM can further contribute to the warming of sea ice by absorbing shortwave visible radiation (380–760 nm) (Hill and Zimmerman, 2016). DOM can also be photomineralised to dissolved inorganic carbon (DIC), with subsequent outgassing of CO2 to the atmosphere (Bélanger et al., 2006; Lønborg et al., 2020; Osburn and Stedmon, 2011; Stubbins et al., 2012).
Particulate inorganic carbon (PIC) in Svalbard waters originates from two primary sources: biogenic material from calcifying organisms and lithogenic minerals from glacial and terrestrial runoff. The relative importance of these sources is seasonal, with a peak in terrigenous carbonates during the summer melt, while biogenic carbonates dominate for the rest of the year (Koziorowska et al., 2017). Kongsfjorden, a well-studied fjord in Svalbard, is heavily influenced by freshwater and material inputs from both sea ice and marine-terminating glaciers such as Kongsbreen and Kronebreen. The geology of the surrounding region is rich in carbonate-bearing rocks, including limestone (Streuff, 2013; Fransson et al., 2020). As a result, glaciers are known to be a significant source of total particulate carbon (TPC) and PIC, of which the latter is delivered to the fjord as finely ground rock flour (Görlich, 1986; Forwick et al., 2010). Sea ice also plays a role in this process, incorporating minerals like dolomite and calcite during the freezing of glacial meltwater (Fransson et al., 2020). The cumulative effect of these inputs is reflected in the fjord’s sediments, which consist of a mixture of siliciclastic material, biogenic carbonates, and clastic carbonates from glacial erosion, which in turn can influence the fjord’s total alkalinity (TA) budget (D'Angelo et al., 2018; Fransson et al., 2020). Meltwater profoundly affects the marine inorganic carbon system. This carbonate system, which consists of CO2, bicarbonate, and carbonate ions, governs seawater pH and the ocean’s capacity to absorb atmospheric CO2. The influence of meltwater on this system is twofold and complex. On the one hand, the large volume of freshwater can dilute the high-alkalinity seawater, reducing its buffering capacity. On the other hand, as glaciers interact with the landscape, the meltwater becomes enriched with dissolved minerals and PIC. TA measurements of glacial discharge across the Arctic reveal a wide range (20 to 550 µmol kg−1), with the highest values corresponding to greater interaction between meltwater and carbonate-rich bedrock (e.g., Wadham et al., 2010; Fransson et al., 2015; Meire et al., 2016). The dissolution of these minerals can therefore increase TA, counteracting the dilution effect. Finally, meltwater also affects the carbonate system indirectly, as the nutrients and stratification it provides can fuel intense primary production, leading to the biological uptake of DIC, lower pCO2, and thus higher pH.
Recognising the pressing need to monitor ocean carbon uptake and storage, the Global Ocean Observing System (GOOS) considers DOC, DIC, and associated physical properties as Essential Ocean Variables (EOVs). Assessments of these EOVs are used to inform policymakers. However, gaps exist in the role and variability of carbon in coastal glaciated systems (Amon et al., 2024; Bhatia et al., 2013; Lawson et al., 2014a; Mopper et al., 2015; Musilova et al., 2017; Wadham et al., 2019). Research on CDOM in Arctic sea ice, and more broadly on polar sea ice, remains sporadic (Barber et al., 2015; Castellani et al., 2022; Mundy and Meiners, 2021). Even though sea ice is expected to continue decreasing in volume and area, large uncertainties about its impact on DOM in coastal waters remain. We hypothesise that sea ice meltwater introduces distinct types of carbon into Kongsfjorden, influencing transformation processes and modulating CO2, thereby impacting the coastal Arctic carbon cycle.
This study has two main objectives: 1) to assess the influence of sea ice on the carbon pool in an Arctic fjord and 2) to characterise and, where applicable, link the optical and chemical properties of DOM in an Arctic coastal environment to better understand carbon cycling in these settings. We focus on identifying different types of CDOM, with an emphasis on spring when detection is most feasible. As the year progresses, glacial meltwater may dilute or obscure sea ice-derived carbon, making differentiation more challenging.
2 Materials and methods
2.1 Study area
Field observations were conducted at Kongsfjorden during spring, from 20 to 30 April 2023. Kongsfjorden is positioned approximately 79°N, 12°E at Spitsbergen’s western coast, and it stretches approximately 25 km long and 5 to 10 km wide (Svendsen et al., 2002) (Figure 1). Kongsfjorden is home to numerous glaciers, with roughly 80% of its drainage basin covered by ice (Kohler et al., 2007). The fjord’s dynamics are strongly shaped by tidewater glaciers such as Kronebreen and Kongsvegen at its head, as well as Conwaybreen and Blomstrandbreen along its northeastern and northern coasts. Notably, Kongsvegen and Kronebreen are renowned for their high ice flux rates (Schuler et al., 2020), of which Kronebreen has long been recognised as Svalbard’s most dynamically calving glacier (Schellenberger et al., 2015; Sevestre et al., 2015). Kongsfjorden is hydrologically linked to the North Atlantic through the Kongsfjordenrenna, allowing warm Atlantic water from the West Spitsbergen Current to flow in, which delays winter sea ice formation. Atlantic water enters along the fjord’s southern coast, mixing with meltwater and runoff, before exiting through the northern side, partially via Krossfjorden. The wide fjord entrance, along with its connection to Krossfjorden, enables ocean swells from storms to reach the central fjord (Cottier et al., 2007; Svendsen et al., 2002; Tverberg et al., 2019).
Figure 1
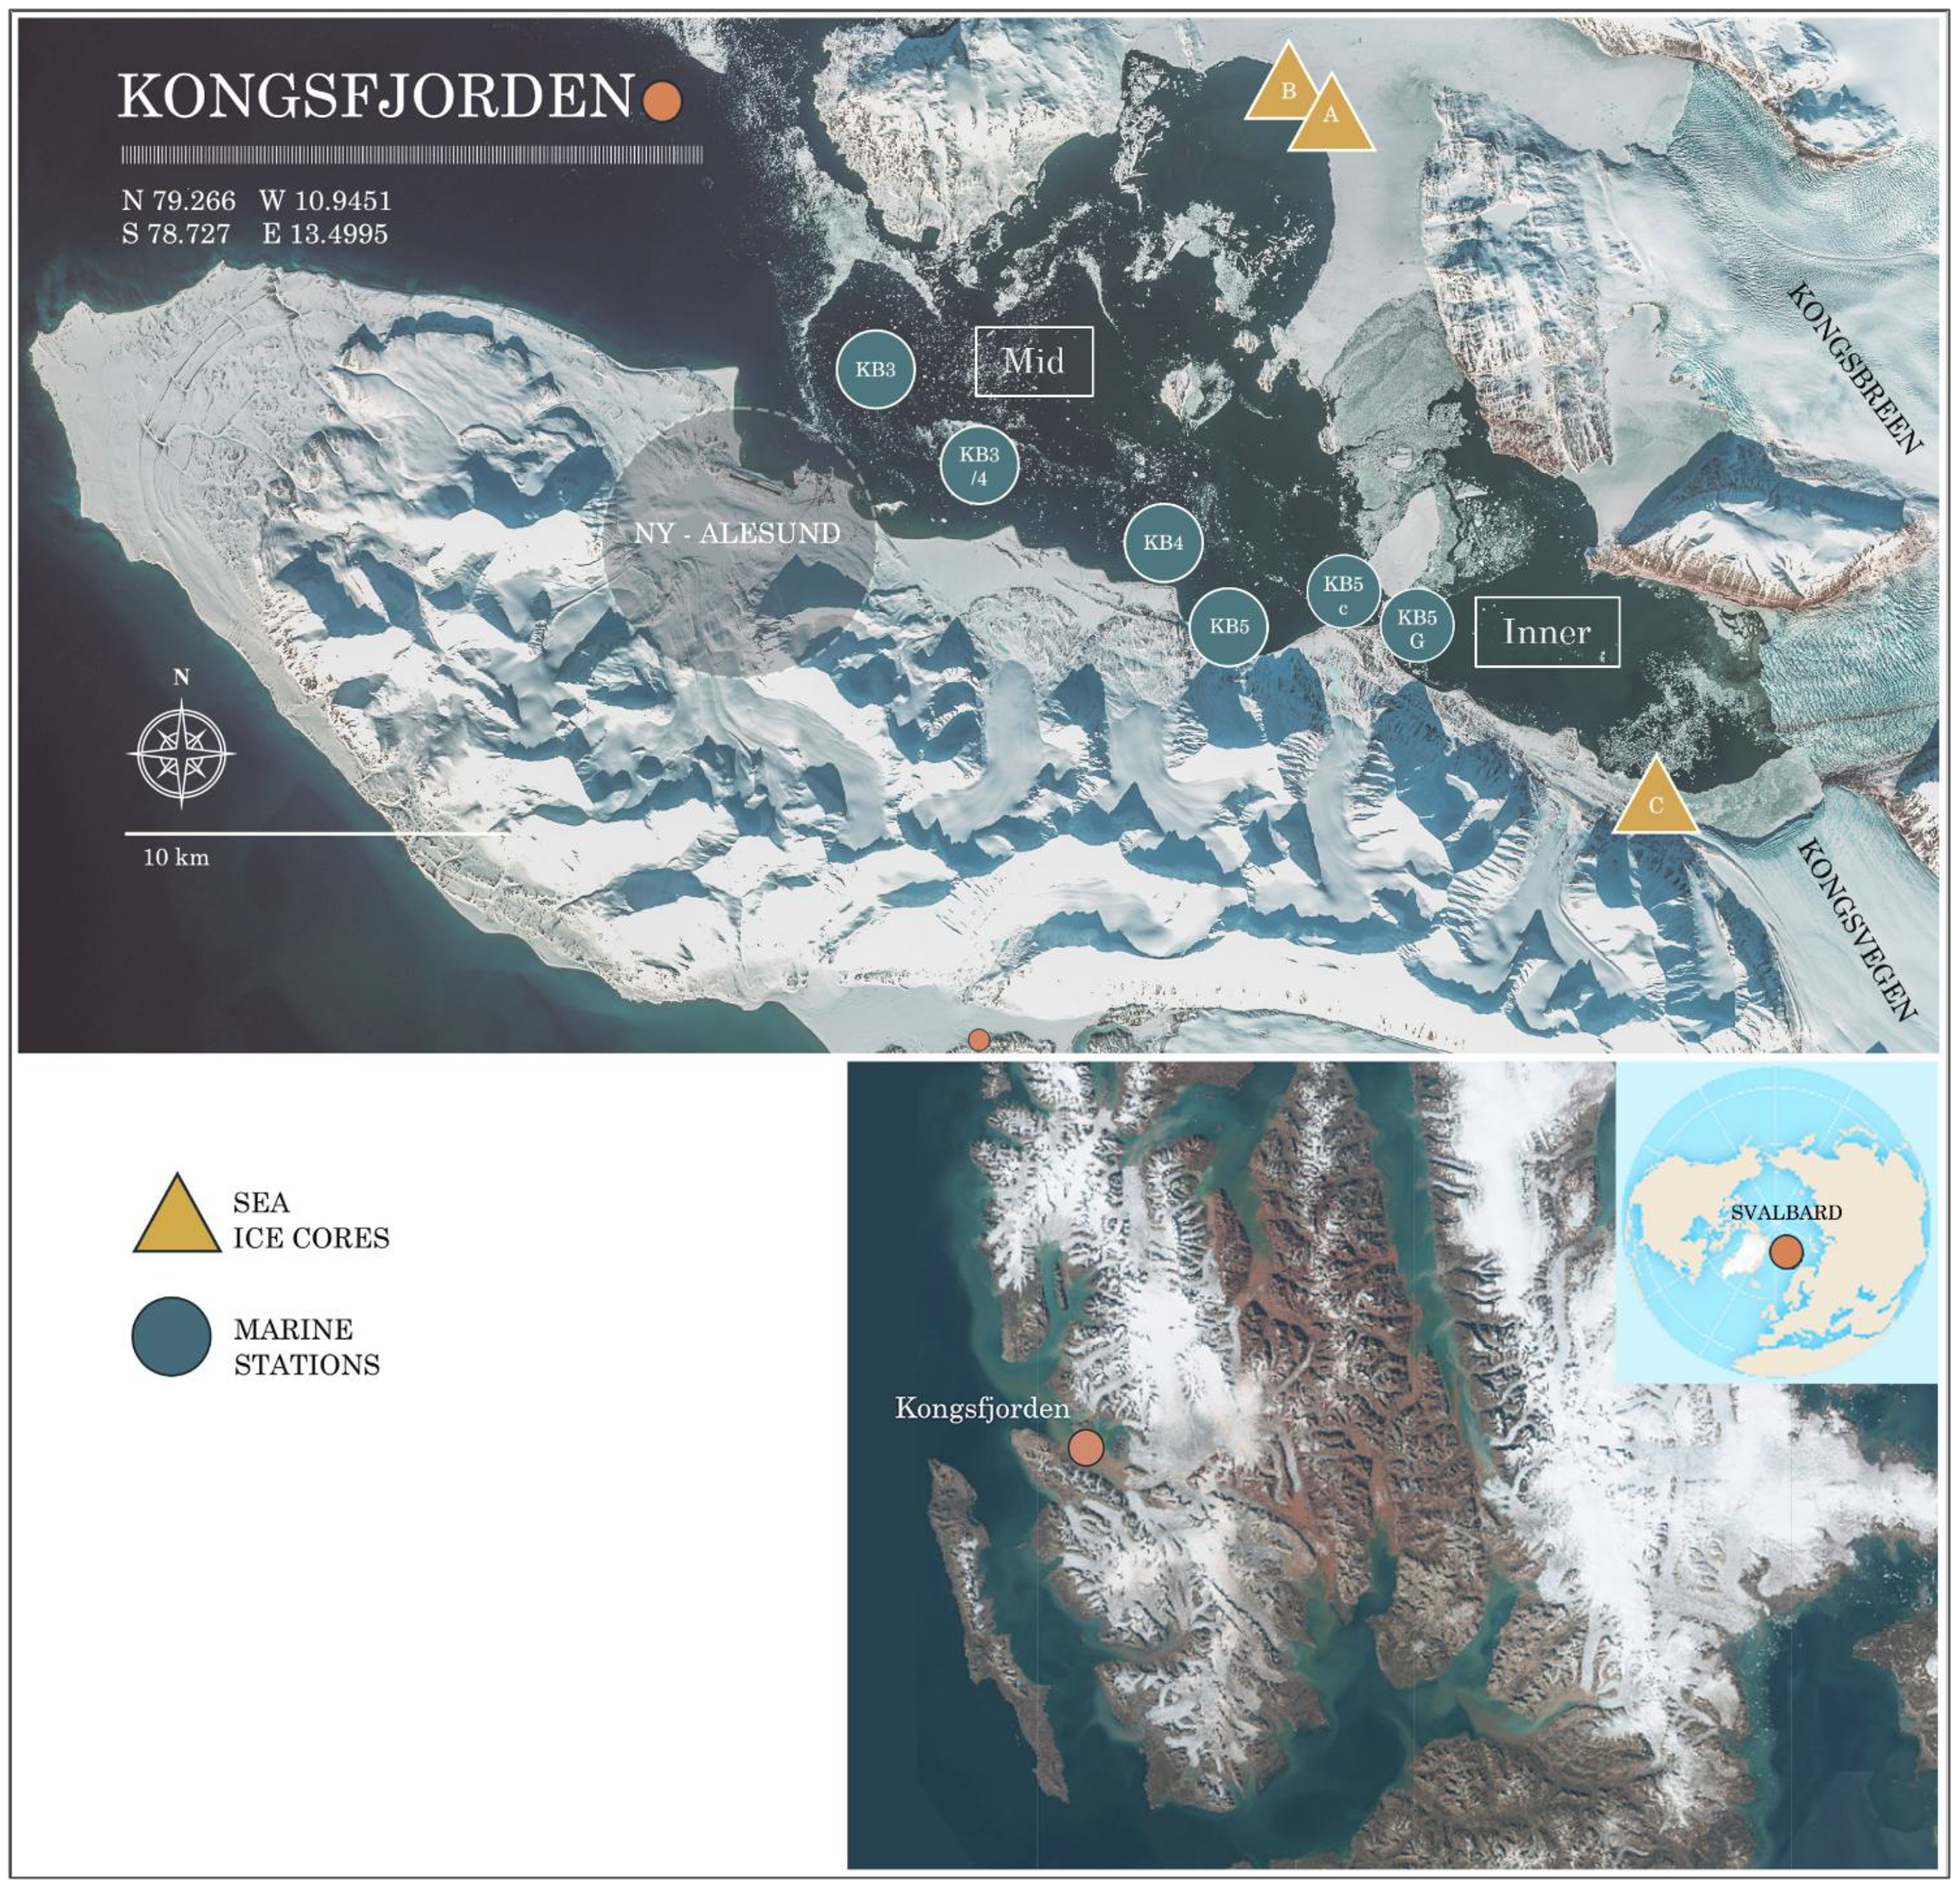
Map of the study area, Kongsfjorden, with marine water sampling points (blue circles) and sea ice core extraction sites (yellow triangles). Ny-Ålesund research station is indicated by an orange dot. The background image was acquired by the Sentinel-2 MSI on 23 April 2023. Data: Copernicus Programme/ESA.
2.1.1 Seawater sampling and hydrography
Seawater sampling was carried out on board M/S Teisten (Kings Bay) along a transect of five stations and depth profiles (0–25 m) (Figure 1) spanning from waters in the inner part of the fjord adjacent to sea ice and glacier front (KB5G) to the mid-part of Kongsfjorden (at KB3) across Kongsfjorden. The Profiles of salinity, temperature, fluorescence (chlorophyll a, NU), and turbidity (FTU) in the water column were acquired at each station from surface to bottom using a conductivity–temperature–pressure sensor (CTD profiler Model SD204). A total of 20 water samples were collected using a single Niskin bottle on a wire, repeated to cover four different depths in the water column (0–25 m). TPC and DOC water samples were filtered through pre-furnaced (450°C, 5 h) GF/Fs (0.7 µm) and CDOM samples through Whatman GF/F filters (0.7 µm). DOC and CDOM samples were stored in the dark at −20°C in polypropylene sterile tubes for later analysis at the University of Stirling. Samples for carbonate system parameters, including DIC and TA, were collected in 250-mL borosilicate bottles following established protocols (Dickson et al., 2007). To preserve the samples, 50 µL of saturated mercuric chloride was added, and they were stored in the dark at 4°C until analysis at the Institute of Marine Research in Tromsø. Nutrient samples were collected in 20-mL High density polyethylene (HDPE) vials, frozen at −20°C, and later analysed at the Institute of Marine Research in Bergen.
2.1.2 sea ice sampling
sea ice samples were collected on 20 and 23 April from two distinct locations using a KOVACS ice corer (Mark II coring system, inner diameter 9 cm) (Figure 1). Cores A and B were obtained from sea ice within the northern region influenced by the glaciers Kongsbreen and Conway, and Core C was collected from the inner part and easternmost side of the study area, located near the glacial front of Kongsvegen (Figure 1). Each core had dimensions between 40 and 50 cm in length and 9 cm in diameter and was segmented into four equal sections (top, II, III, and IV) from top to bottom (IV). Each 10-cm section was thawed at 5°C in a dark room. Subsequently, all samples underwent filtration for TPC, DOC, and CDOM, after which they were stored frozen at −20°C until further analysis at the University of Stirling.
2.2 Samples and data analyses
2.2.1 Coloured dissolved organic matter
CDOM absorbance was measured using a dual-beam spectrophotometer Cary 4000 UV-Vis with Milli-Q water serving as a reference. Spectral measurements were collected from 200 to 800 nm at intervals of 0.5 nm. Absorbance a(λ) spectra were transformed to the CDOM absorption coefficients, aCDOM(λ) (m−1), as follows:
where 2.303 is the natural logarithm of 10, a(λ) is the corrected spectrophotometer absorbance reading at a specific wavelength (λ), and L is the path length of the optical cell in meters (here 0.1 m). The absorption spectra’s characteristics between 250 and 700 nm were delineated by determining the exponential spectral slope coefficient (S), following the methodology outlined by Stedmon et al. (2001). An alternative approach proposed by Helms et al. (2008) was also examined, which involved calculating slopes within two different wavelength ranges (S275–295 and S350–400) and their ratio (SR) (S275–295:S350–400).
2.2.2 Dissolved organic carbon and total particulate carbon
Samples for DOC were measured on an “enviro TOC Elementar” analyser following the Total Inorganic Carbon (TIC)/ Total Carbon (TC)/ Total Nitrogen (TN) method. DOC was calculated as Total Dissolved Carbon (TDC) − DIC = DOC. DOC instrument detection limit was 0.10 mgC L−1. An aliquot of the sample was first injected into a sparger containing 1% phosphoric acid (H3PO4) to purge the DIC, which was quantified as CO2 by a non-dispersive infrared (NDIR) detector. A second aliquot was then injected into a high-temperature (750°C for seawater) combustion furnace with a platinum catalyst, oxidising all TDC to CO2 for quantification using the NDIR detector. DOC was subsequently calculated as the difference between TDC and DIC. For TPC, after filtration, a smaller subsample of the filter was obtained using a coring tool with an 8-mm diameter, ensuring a proportional representation of the total filtered material. The dry mass of the filter used for TPC was measured considering the volume filtered and analysed using a Thermo Scientific NC-org “Flash smart” elemental analyser; the detection limit for TPC was 0.0240 mgC L−1. The final mass of C for the triplicate core sections for each sample was multiplied to account for the full surface area used by the filter during filtration. To compute the total TPC concentration per sample, the relationship between the full filter and core filter areas was considered. Calibration curves for particulate C were established using weighed solid standards (nicotinamide, 22.83% N and 59.01% C; Hydrophobic Organic Carbon (HOC), 0.52% N and 7.45% C; NC soil, 0.21% N and 2.29% C; chalk soil, 0.32% N and 4.64% C), covering the full analytical range of our samples. The resulting regressions showed excellent linearity (R2 = 0.9996 for both C and N), and replicate precision was better than 3% for C.
2.2.3 Inorganic nutrients and carbonate system parameters
Inorganic nutrients, such as nitrite NO2−: (NO2), nitrate NO3−: (NO3), phosphate PO43−: (PO4), and silicic acid Si(OH)4: (Si), were analysed using spectrophotometric methods following established protocols (Grasshoff et al., 2009; Gundersen et al., 2022) at the Institute of Marine Research in Bergen, Norway. In this study, dissolved inorganic nitrogen (DIN) is defined as the sum of dissolved nitrate and nitrite (DIN = NO2 + NO3). The analyser’s performance was validated through routine measurements of reference seawater from Ocean Scientific International Ltd., UK. Precision based on triplicate analysis was 0.06, 0.04, 0.06, and 0.07 µmol L−1 for NO2, NO3, PO4, and Si, respectively. The lowest detection limits were 0.06 µmol L−1 for NO2−, 0.5 μmol L−1 for NO3−, 0.06 µmol L−1 for PO43−, and 0.7 µmol L−1 for Si (OH)4. DIC was quantified using coulometric titration (Johnson et al., 1985) with a Versatile Instrument for the Determination of Total Inorganic Carbon and Titration Alkalinity (VINDTA 3C, Marianda, Tulpenweg, Germany). Alkalinity (TA) was measured using a VINDTA 3S (Marianda, Germany). The precision for both TA and DIC was ±2 µmol kg−1, determined by replicate measurements of a certified reference material (CRM). Accuracy was ensured by comparing results against the CRM provided by A. Dickson (San Diego, CA, USA). The input parameters for calculating the full carbonate system—using the CO2SYS program (Millero et al., 2006)—included AT, DIC, nutrients (phosphate and silicic acid), salinity, pressure, and temperature. This model calculated in situ pH, partial pressure of CO2 (pCO2, µatm), bicarbonate (HCO3−), and CO2 concentration (CO2, µmol kg−1) on the total hydrogen ion scale. The dissociation constant for hydrogen sulphate ([HSO4−]) was taken from A. G. Dickson (1990), while carbonate system constants were derived from Mehrbach et al. (1973) as refit by A. G. Dickson and Millero (1987). Borate concentrations were estimated following Lee et al. (2019).
2.2.4 Data analyses
The graphical software Ocean Data View was used to create x, y plots and section profiles employing a weighted gridding to interpolate the measurements spatially at each depth profile. A Gaussian decomposition method was employed to model the CDOM absorption spectra and determine specific absorptive components. This method assumes that deviations, such as shoulders and peaks, from a typical exponential pattern in the absorption spectra are due to the significant presence of specific compounds or structures (Massicotte and Markager, 2016). Massicotte and Markager stated that this method offers a more accurate estimation of the spectral slope than other modelling techniques and eliminates issues related to choosing a wavelength range. The decomposition was performed over the wavelength range of 270–700 nm to capture all spectral characteristics using the Asfit software (Omanović et al., 2019). The statistical analysis of the decomposed Gaussian components was conducted in Python. To examine the relationship between parameters and the properties of CDOM, Pearson’s method was employed to calculate Pearson’s coeffcient in Python, and a Kruskal–Wallis test was applied to define statistical differences throughout the marine stations. For both methods, Pearson’s correlation and Kruskal–Wallis test, the Python programming language was used.
3 Results
3.1 Water column properties
3.1.1 Hydrography and water mass composition
Water masses were identified by their temperature–salinity (T–S) signatures following Svendsen et al. (2002). Distribution varied markedly among the five stations (Figure 2; Table 2). At KB5G (innermost), Local Water (LW) dominated the upper 25 m. Between 10 and 5 m, the column transitioned through Arctic Water (ArW) to Winter Cooled Water (WCW), before LW re-appeared at the surface. At KB4, the surface layers consisted of LW underlain by ArW at ≈50 m. At KB5, the profile was almost entirely ArW. At KB5C (closer to glacier fronts), WCW occupied the full depth. Transect measurements showed systematic freshening and cooling from mid-fjord (KB3) to the glacier (Figures 3a, b). Salinity fell from 34.84 ± 0.03 at KB3 to 34.20 at KB5G, while temperature declined from 0.77°C ± 0.12°C to −1.13°C at KB5C, confirming WCW dominance in the inner basin. Turbidity peaked in the upper 10 m at KB3 (12.49 FTU) and KB3/4 (12.43 FTU) and dropped sharply with depth (minimum 0.42 FTU at 25 m, KB3; Figure 3d). Elevated turbidity at KB3/4 coincided with the highest surface chlorophyll a fluorescence (2.49 NU; Figures 3c, d). In contrast, high turbidity near the glaciers (KB5C) was accompanied by very low fluorescence (0.23 NU), indicating predominantly inorganic particle input.
Figure 2
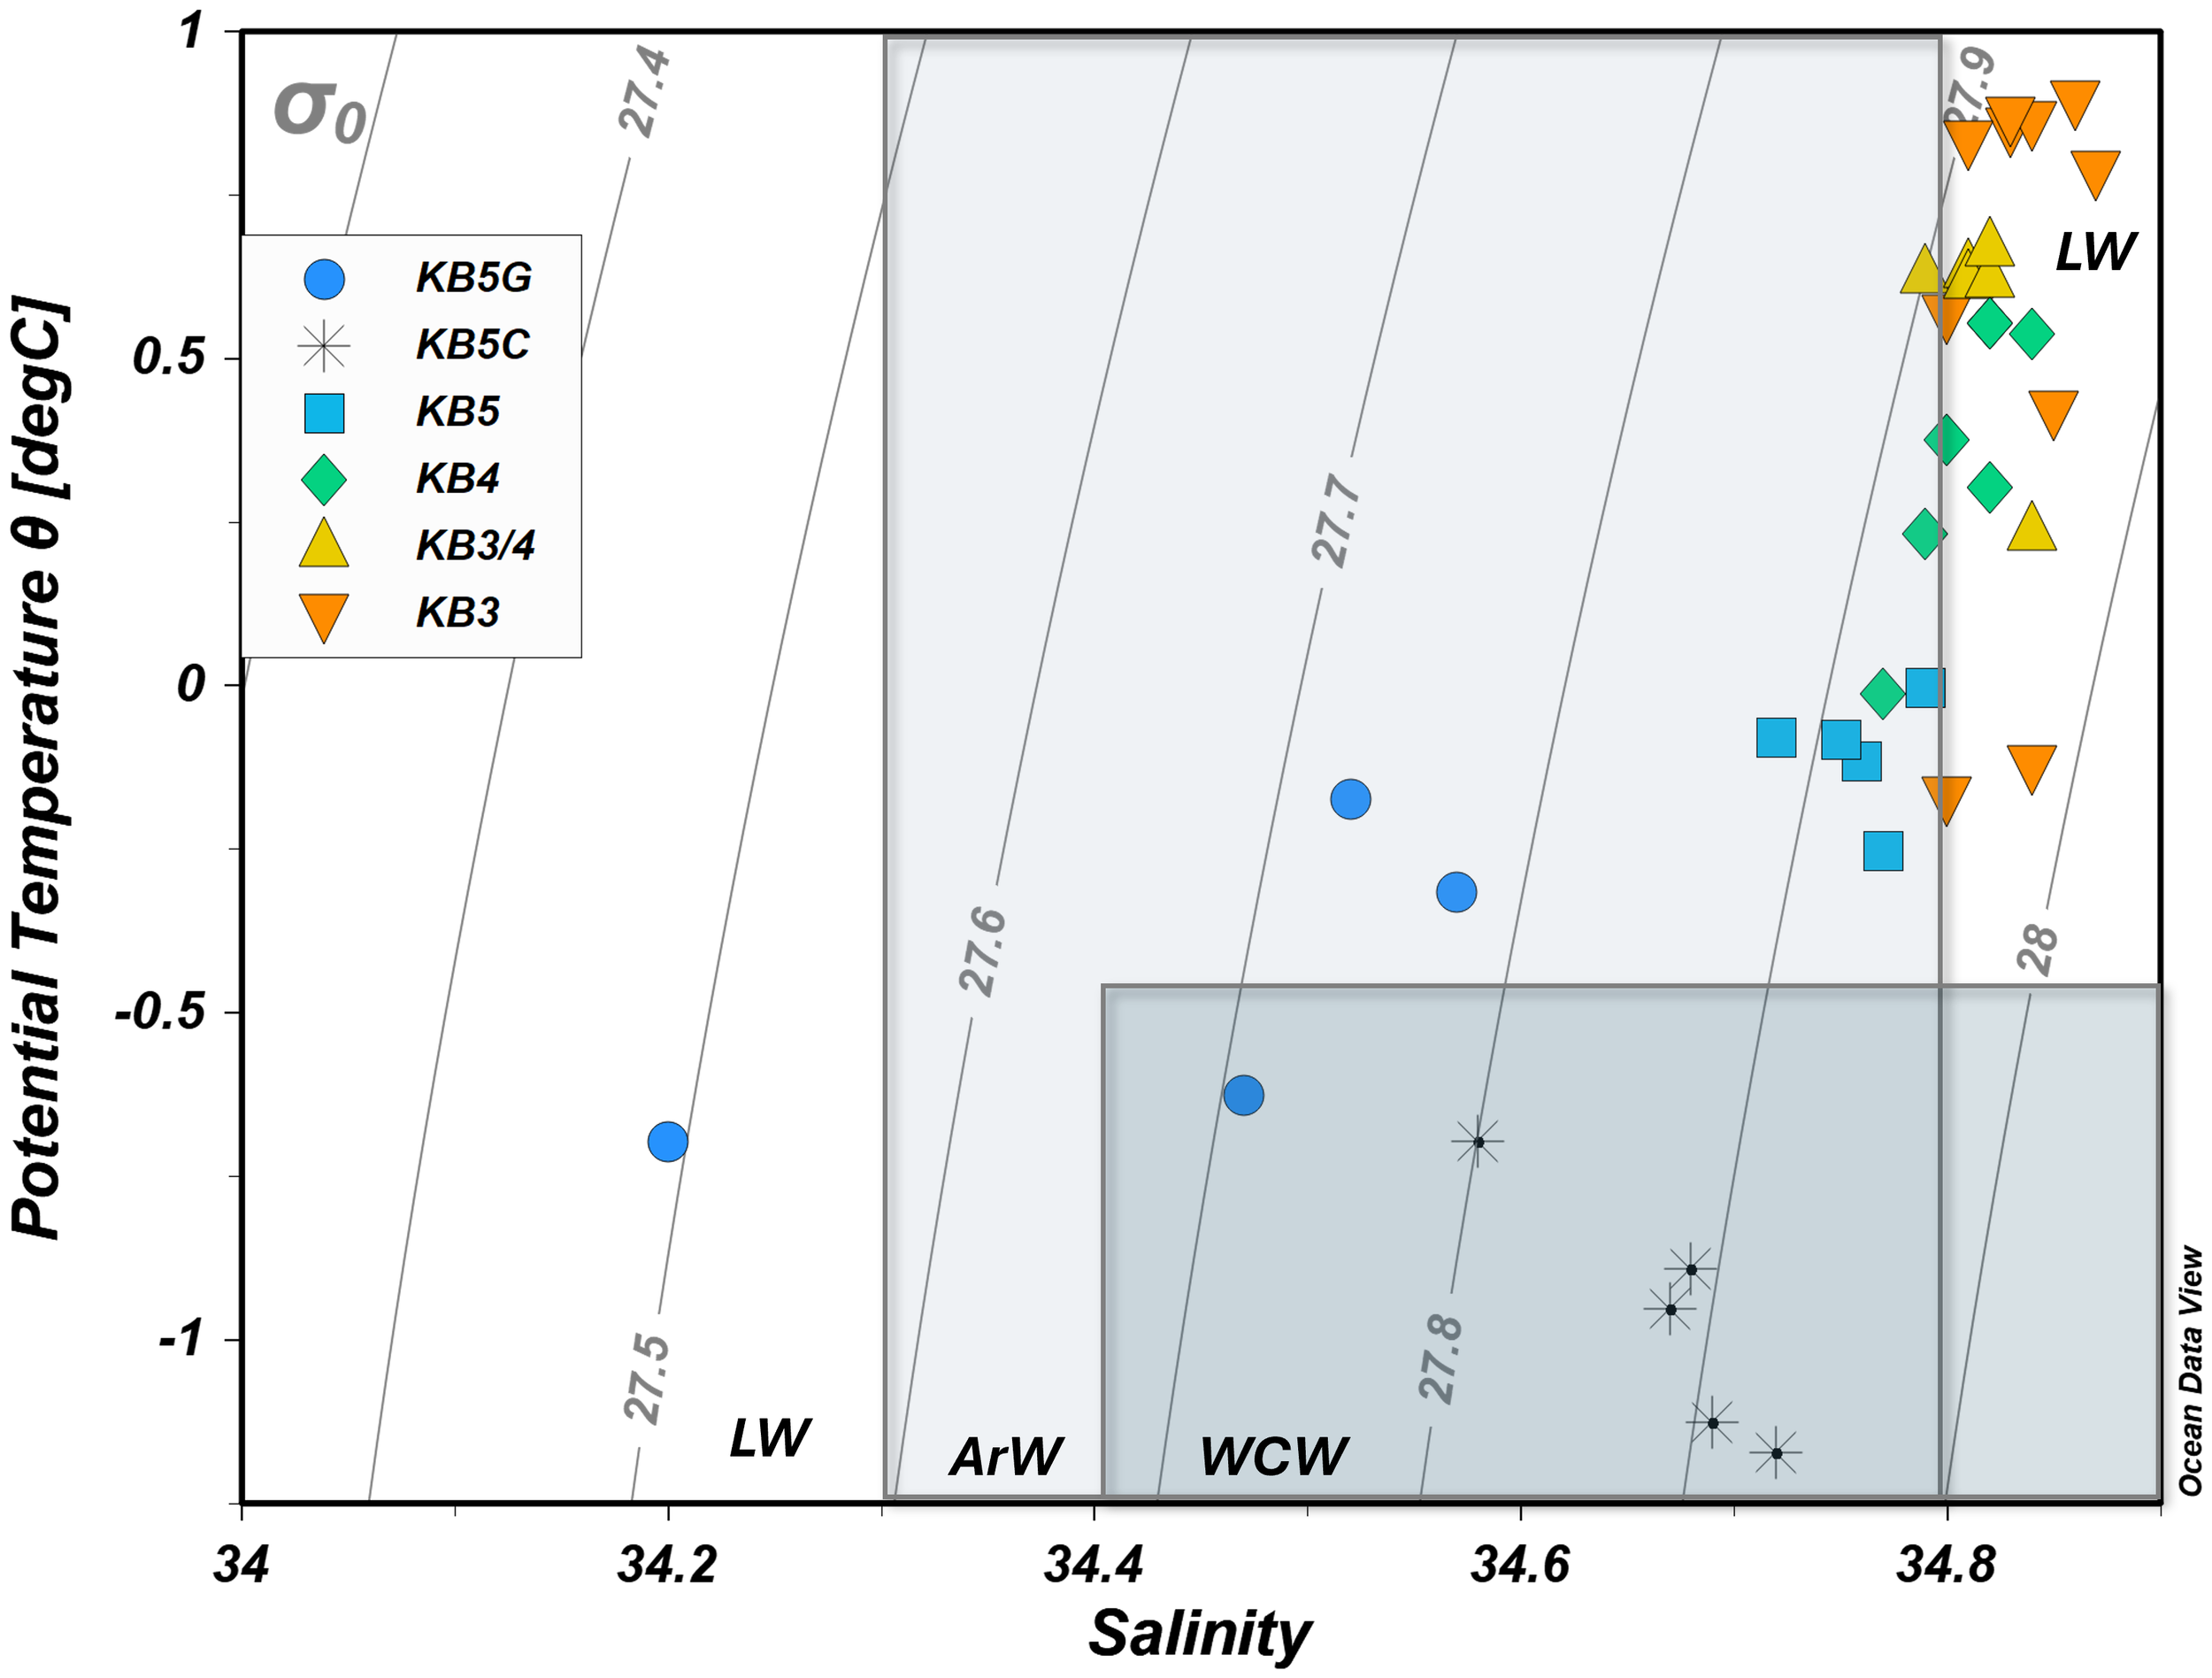
Temperature and salinity plot for all depths (0–300 m) to identify water masses in Kongsfjorden during spring. The masses identified were Local Water (LW), Arctic Water (ArW), and Winter Cooled Water (WCW). Water masses were calculated following Svendsen et al. (2002) and Cottier et al. (2005).
Figure 3
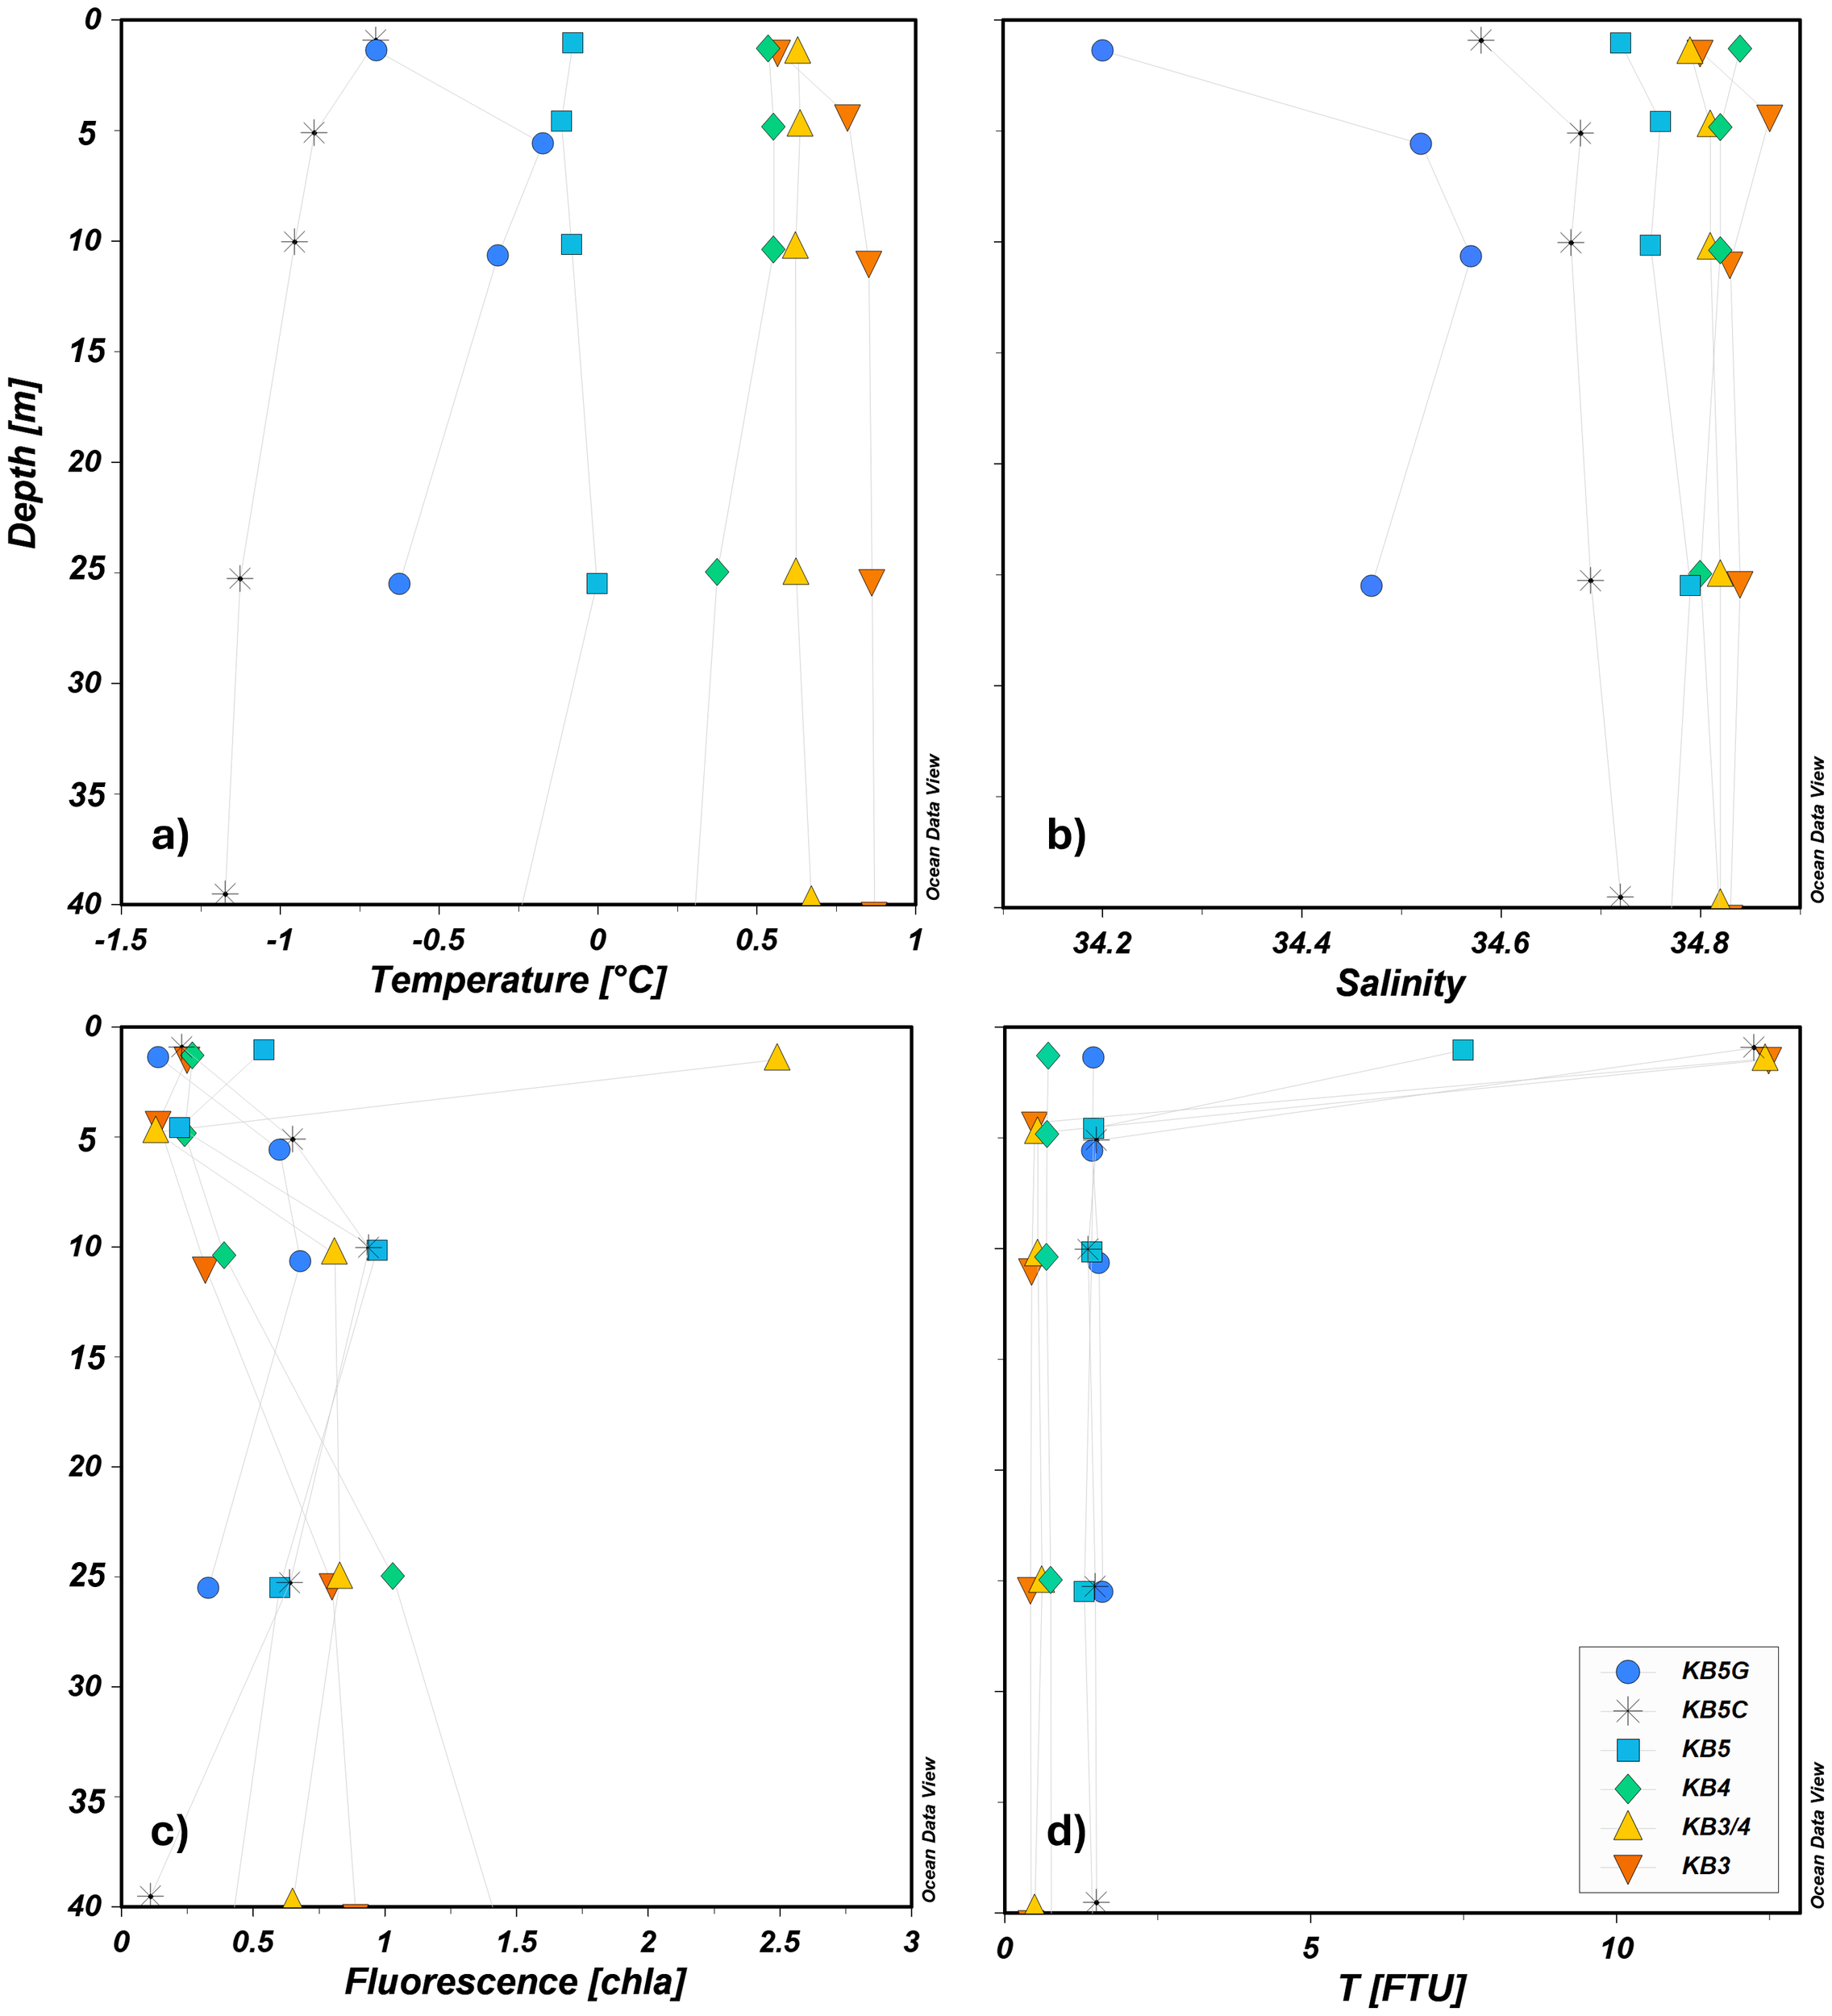
Vertical profiles in the upper 40 m in the water column for (a) temperature, (b) salinity, (c) chlorophyll a fluorescence NU, and (d) turbidity (FTU).
Table 2
| Water mass | AW | ArW* | TAW | WCW | LW | IW | SW |
|---|---|---|---|---|---|---|---|
| Temperature (°C) | >3.0 | −1.5 < 1.0 | >1 | <−0.5 | <1 | >1.0 | >1.0 |
| Salinity (PSU) | >34.9 | 34.30 < 34.80 | >34.7 | >34.4 | >34.4 | 34 < S < 34.7 | <28−30 |
Water mass characteristics.
Adaptation suggested by Cottier et al. (2005). Atlantic Water: TAW, Transformed Atlantic Water; WCW, Winter Cooled Water; LW, Local Water; IW, Intermediate Water; SW, Surface Water; ArW*, Arctic Water.
3.1.2 Nutrients and carbonate system variability
Detectable concentrations of NO2 (>0.06 µmol L−1) were found at the inner fjord, and the highest NO2 concentrations were recorded at KB5 (0.09 µmol L−1), followed by KB5C and KB5G, both with 0.08 µmol L−1 (Table 3). NO3 varied between 8 and 10 µmol L−1, with the lowest surface values at KB5G and KB3 (Table 3). The highest NO3 and Si values were observed below 25 m at KB3 and at the bottom near the glacier front at KB5C (Table 3), which was opposite to the PO4 distribution (Table 3). Si had inverse concentrations compared to PO4, with lower concentrations at the inner fjord and higher at the mid-section of the fjord (Figures 4e, f). TA and DIC showed a gradient of concentrations with the highest mean at KB3 and the lowest at KB5 (Figure 4c; Table 3). The highest DIC and CO2 values coincided with the highest NO3 and Si at KB5C and KB3 (Table 3). Finally, pH indicated a clear gradient with the lowest mean values at KB3 (8.09), increasing towards the inner section of Kongsfjorden, reaching the highest mean at KB5 with 8.12 (Figure 4b).
Table 3
| Station | Salinity | °C | Fluo (Chla) | T (FTU) | NO2 (µmol/L) | NO3 (µmol/L) | PO4 (µmol/L) | Si (µmol/L) | CO2 (µmol/kg) | TA (µmol/kg) | DIC (µmol/kg) | pH | |
|---|---|---|---|---|---|---|---|---|---|---|---|---|---|
| KB3 | Mean | 34.84 ± 0.03 | 0.77 ± 0.12 | 0.38 ± 0.25 | 3.46 ± 5.21 | 0.06 ± 0.01 | 9 ± 0.35 | 0.55 ± 0.04 | 4.55 ± 0.15 | 21.07 ± 0.53 | 2,312 ± 7 | 2,169 ± 9 | 8.09 ± 0.01 |
| Min | 34.80 | 0.57 | 0.14 | 0.42 | 0.05 | 8.44 | 0.51 | 4.30 | 20.51 | 2,302 | 2,158 | 8.07 | |
| Max | 34.87 | 0.86 | 0.80 | 12.49 | 0.08 | 9.32 | 0.60 | 4.66 | 21.92 | 2,320 | 2,182 | 8.10 | |
| KB3/4 |
Mean | 34.81 ± 0.01 | 0.63 ± 0.01 | 1.07 ± 0.87 | 3.53 ± 5.14 | 0.06 ± 0.01 | 9.22 ± 0.40 | 0.54 ± 0.05 | 4.47 ± 0.17 | 20.34 ± 0.24 | 2,310 ± 3 | 2,162 ± 4 | 8.11 ± 0.00 |
| Min | 34.79 | 0.62 | 0.13 | 0.54 | 0.05 | 8.54 | 0.47 | 4.18 | 20.01 | 2,307 | 2,157 | 8.10 | |
| Max | 34.82 | 0.64 | 2.49 | 12.43 | 0.07 | 9.54 | 0.59 | 4.59 | 20.66 | 2,314 | 2,168 | 8.11 | |
| KB4 |
Mean | 34.82 ± 0.01 | 0.51 ± 0.07 | 0.48 ± 0.32 | 0.71 ± 0.03 | 0.07 ± 0.01 | 9.07 ± 0.30 | 0.56 ± 0.03 | 4.52 ± 0.08 | 20.66 ± 0.09 | 2,310 ± 4 | 2,164 ± 3 | 8.10 ± 0.00 |
| Min | 34.80 | 0.38 | 0.24 | 0.68 | 0.06 | 8.67 | 0.53 | 4.43 | 20.50 | 2,304 | 2,160 | 8.10 | |
| Max | 34.84 | 0.55 | 1.03 | 0.75 | 0.08 | 9.36 | 0.60 | 4.59 | 20.73 | 2,316 | 2,169 | 8.10 | |
| KB5 |
Mean | 34.76 ± 0.03 | −0.07 ± 0.04 | 0.58 ± 0.27 | 2.92 ± 2.64 | 0.09 ± 0.01 | 9.20 ± 0.17 | 0.61 ± 0.03 | 4.32 ± 0.06 | 20.08 ± 0.29 | 2,305 ± 4 | 2,156 ± 4 | 8.12 ± 0.01 |
| Min | 34.72 | −0.12 | 0.22 | 1.30 | 0.08 | 9.05 | 0.55 | 4.23 | 19.69 | 2,301 | 2,152 | 8.11 | |
| Max | 34.79 | 0.00 | 0.97 | 7.49 | 0.09 | 9.47 | 0.64 | 4.37 | 20.40 | 2,309 | 2,163 | 8.13 | |
| KB5c |
Mean | 34.66 ± 0.04 | −0.92 ± 0.15 | 0.62 ± 0.25 | 4.15 ± 4.68 | 0.10 ± 0.01 | 9.23 ± 0.65 | 0.53 ± 0.04 | 4.50 ± 0.26 | 21.06 ± 1.04 | 2,307 ± 5 | 2,166 ± 11 | 8.11 ± 0.02 |
| Min | 34.58 | −1.13 | 0.23 | 1.36 | 0.09 | 8.22 | 0.47 | 4.13 | 19.55 | 2,301 | 2,152 | 8.09 | |
| Max | 34.69 | −0.70 | 0.94 | 12.25 | 0.11 | 9.99 | 0.59 | 4.84 | 22.37 | 2,312 | 2,180 | 8.14 | |
| KB5G |
Mean | 34.44 ± 0.14 | −0.45 ± 0.22 | 0.44 ± 0.22 | 1.51 ± 0.07 | 0.08 ± 0.00 | 8.76 ± 0.32 | 0.5 0 ± 0.05 | 4.16 ± 0.24 | 20.16 ± 0.69 | 2,308 ± 5 | 2,161 ± 9 | 8.12 ± 0.01 |
| Min | 34.20 | −0.70 | 0.14 | 1.43 | 0.07 | 8.25 | 0.43 | 3.85 | 19.28 | 2,301 | 2,149 | 8.11 | |
| Max | 34.57 | −0.17 | 0.68 | 1.60 | 0.08 | 9.14 | 0.57 | 4.51 | 21.18 | 2,314 | 2,174 | 8.15 | |
Overview of the mean values +/− standard deviation and the range (minimum and maximum) in the water column (0–25 m) for each station.
TA, total alkalinity; DIC, dissolved inorganic carbon.
Figure 4
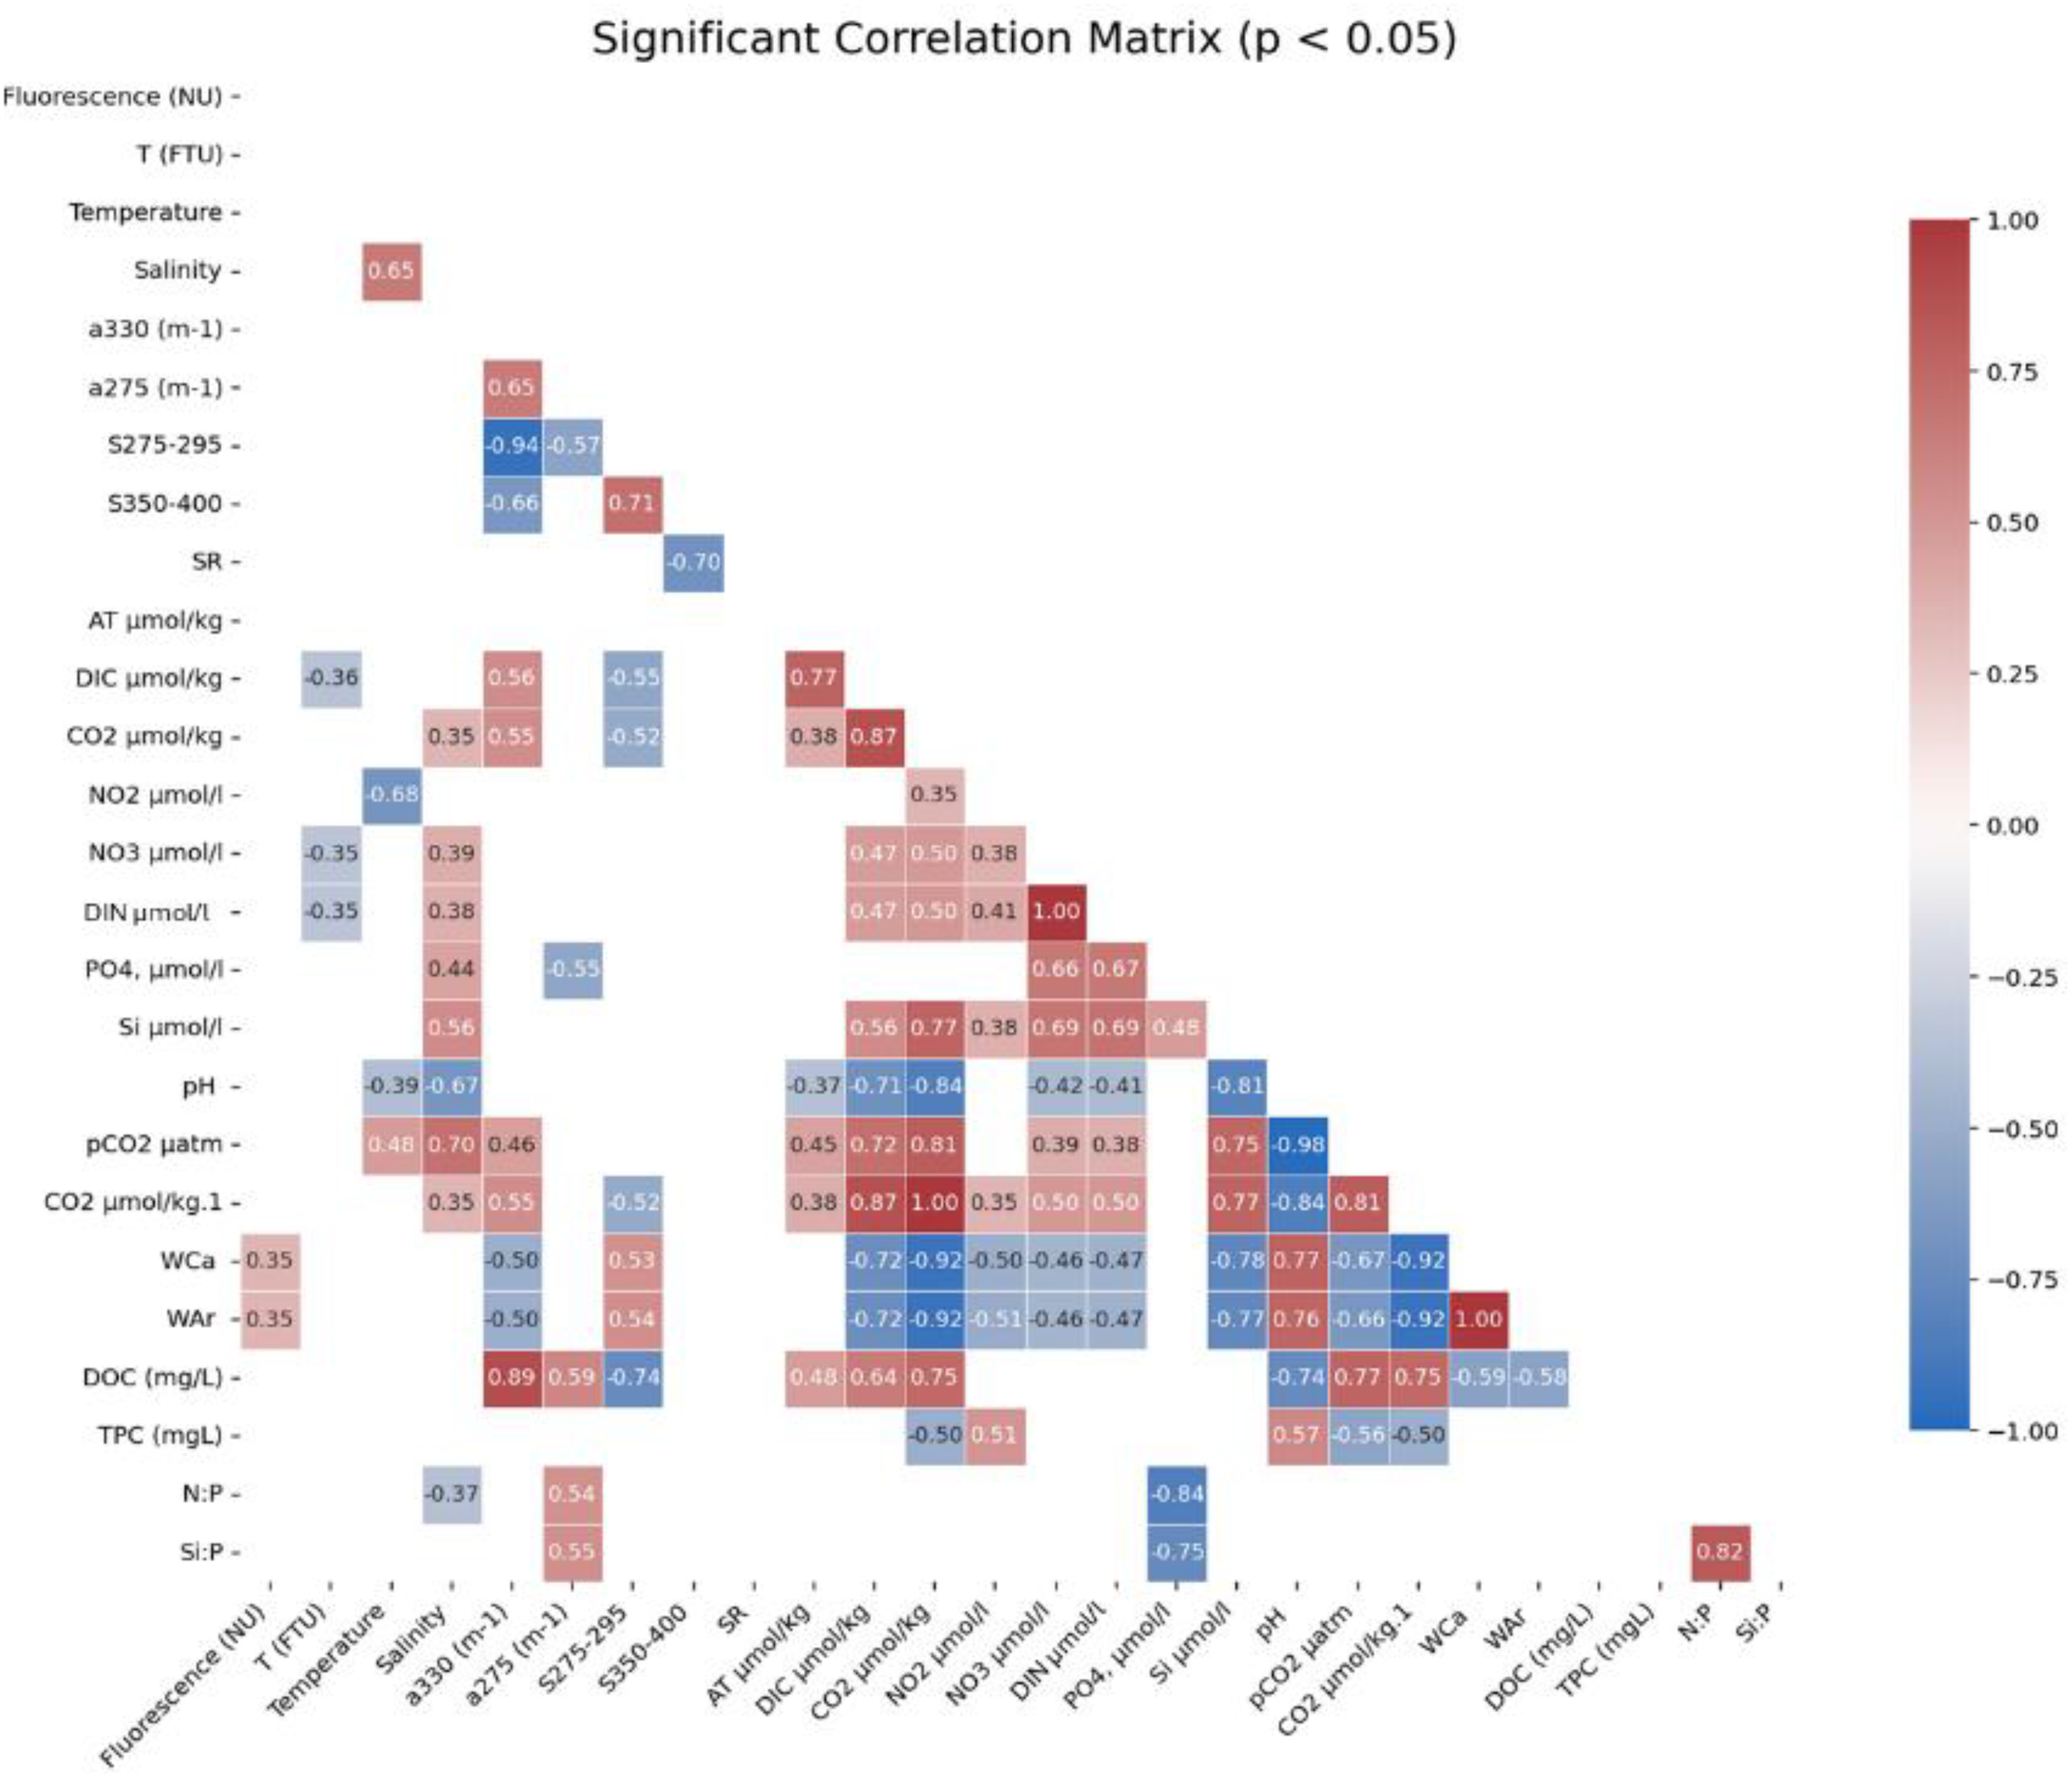
Significant (p<0.05) correlation matrix for all parameters considered in this study.
The N:P ratio section (Figure 4g) revealed pronounced spatial and vertical gradients along the fjord. In the inner fjord (0–2 km), subsurface layers between 10 and 25 m exhibited the lowest N:P ratios (~15.5–16.5). In contrast, the surface layers (0–5 m) in this region displayed slightly elevated N:P ratios (17–18.5) towards the mid-fjord (3–10 km); N:P ratios increased both with depth and towards the surface, reaching peak values of 18–18.5, with distinct local maxima (>18.5) observed at both shallow (5–10 m) and deeper (>25 m) depths at the outermost stations. Vertically, the lowest N:P ratios formed a subsurface minimum lens in the inner fjord, whereas mid-fjord and outer stations were more vertically homogeneous, with ratios consistently above 17. Similarly, the Si:P ratio section (Figure 4h) showed clear spatial patterns. In the inner fjord, subsurface Si:P ratios were the lowest (7.5–8.0) at 10–20-m depth, coinciding with the N:P minimum. Surface Si:P values were more variable, reaching 8.5–9.0 in isolated patches. In the mid-fjord, Si:P ratios increased with depth, peaking above 9.0 in deeper waters at mid-fjord and outer fjord stations. Surface Si:P values in this area ranged from 8.0 to 8.5, remaining slightly elevated compared to the innermost subsurface layers.
3.1.3 Organic carbon
DOC showed the mean highest concentration at the station most influenced by oceanic waters (KB3) (3.66 mgC L−1), whereas TPC showed the minimum mean values (0.25 mgC L−1) at this station (Figures 5a, b). At KB5, the mean concentrations for DOC were 0.501 and 0.422 mgC L−1 for TPC. KB5G showed similar DOC and TPC values to KB5 (Table 3). TPC had the minimum concentration (0.175 mgC L−1) at the outermost station (KB3), whereas the highest was at KB5 (0.512 mgC L−1) and KB4 (0.047 mgC L−1) at the surface (Figure 5b). Detectable TPC (0.028 mgC L−1) was also found in the shallow layers of KB5G (above 15 m), and DOC exhibited minimum concentrations below the detection limit (0.100 mgC L−1) at KB5 (0–10 m) and KB3/4 (25 m), while the highest DOC values (3.66–7.43 mgC L−1) were recorded at station KB3 between depths of 10 and 25 m (Table 3). A spatial gradient in carbon partitioning was observed as measured by the TPC: DOC ratio (Appendix 6). At the mid station (KB3), TPC: DOC was consistently low, ranging from 0.04 to 0.13. In stations KB3/4 and KB4, TPC: DOC remained below 0.7. The highest TPC: DOC was observed in the inner fjord at station KB5, where values stayed consistently above 0.7 and approached 1.0, with a maximum of 0.99 at 5-m depth. This demonstrates a clear spatial trend, shifting from low TPC relative to DOC at the mid-fjord to a near-equal balance between TPC and DOC in the inner fjord. The highest DOC concentrations coincided with high values of CO2 at KB3 (Figures 4a, 5a).
Figure 5
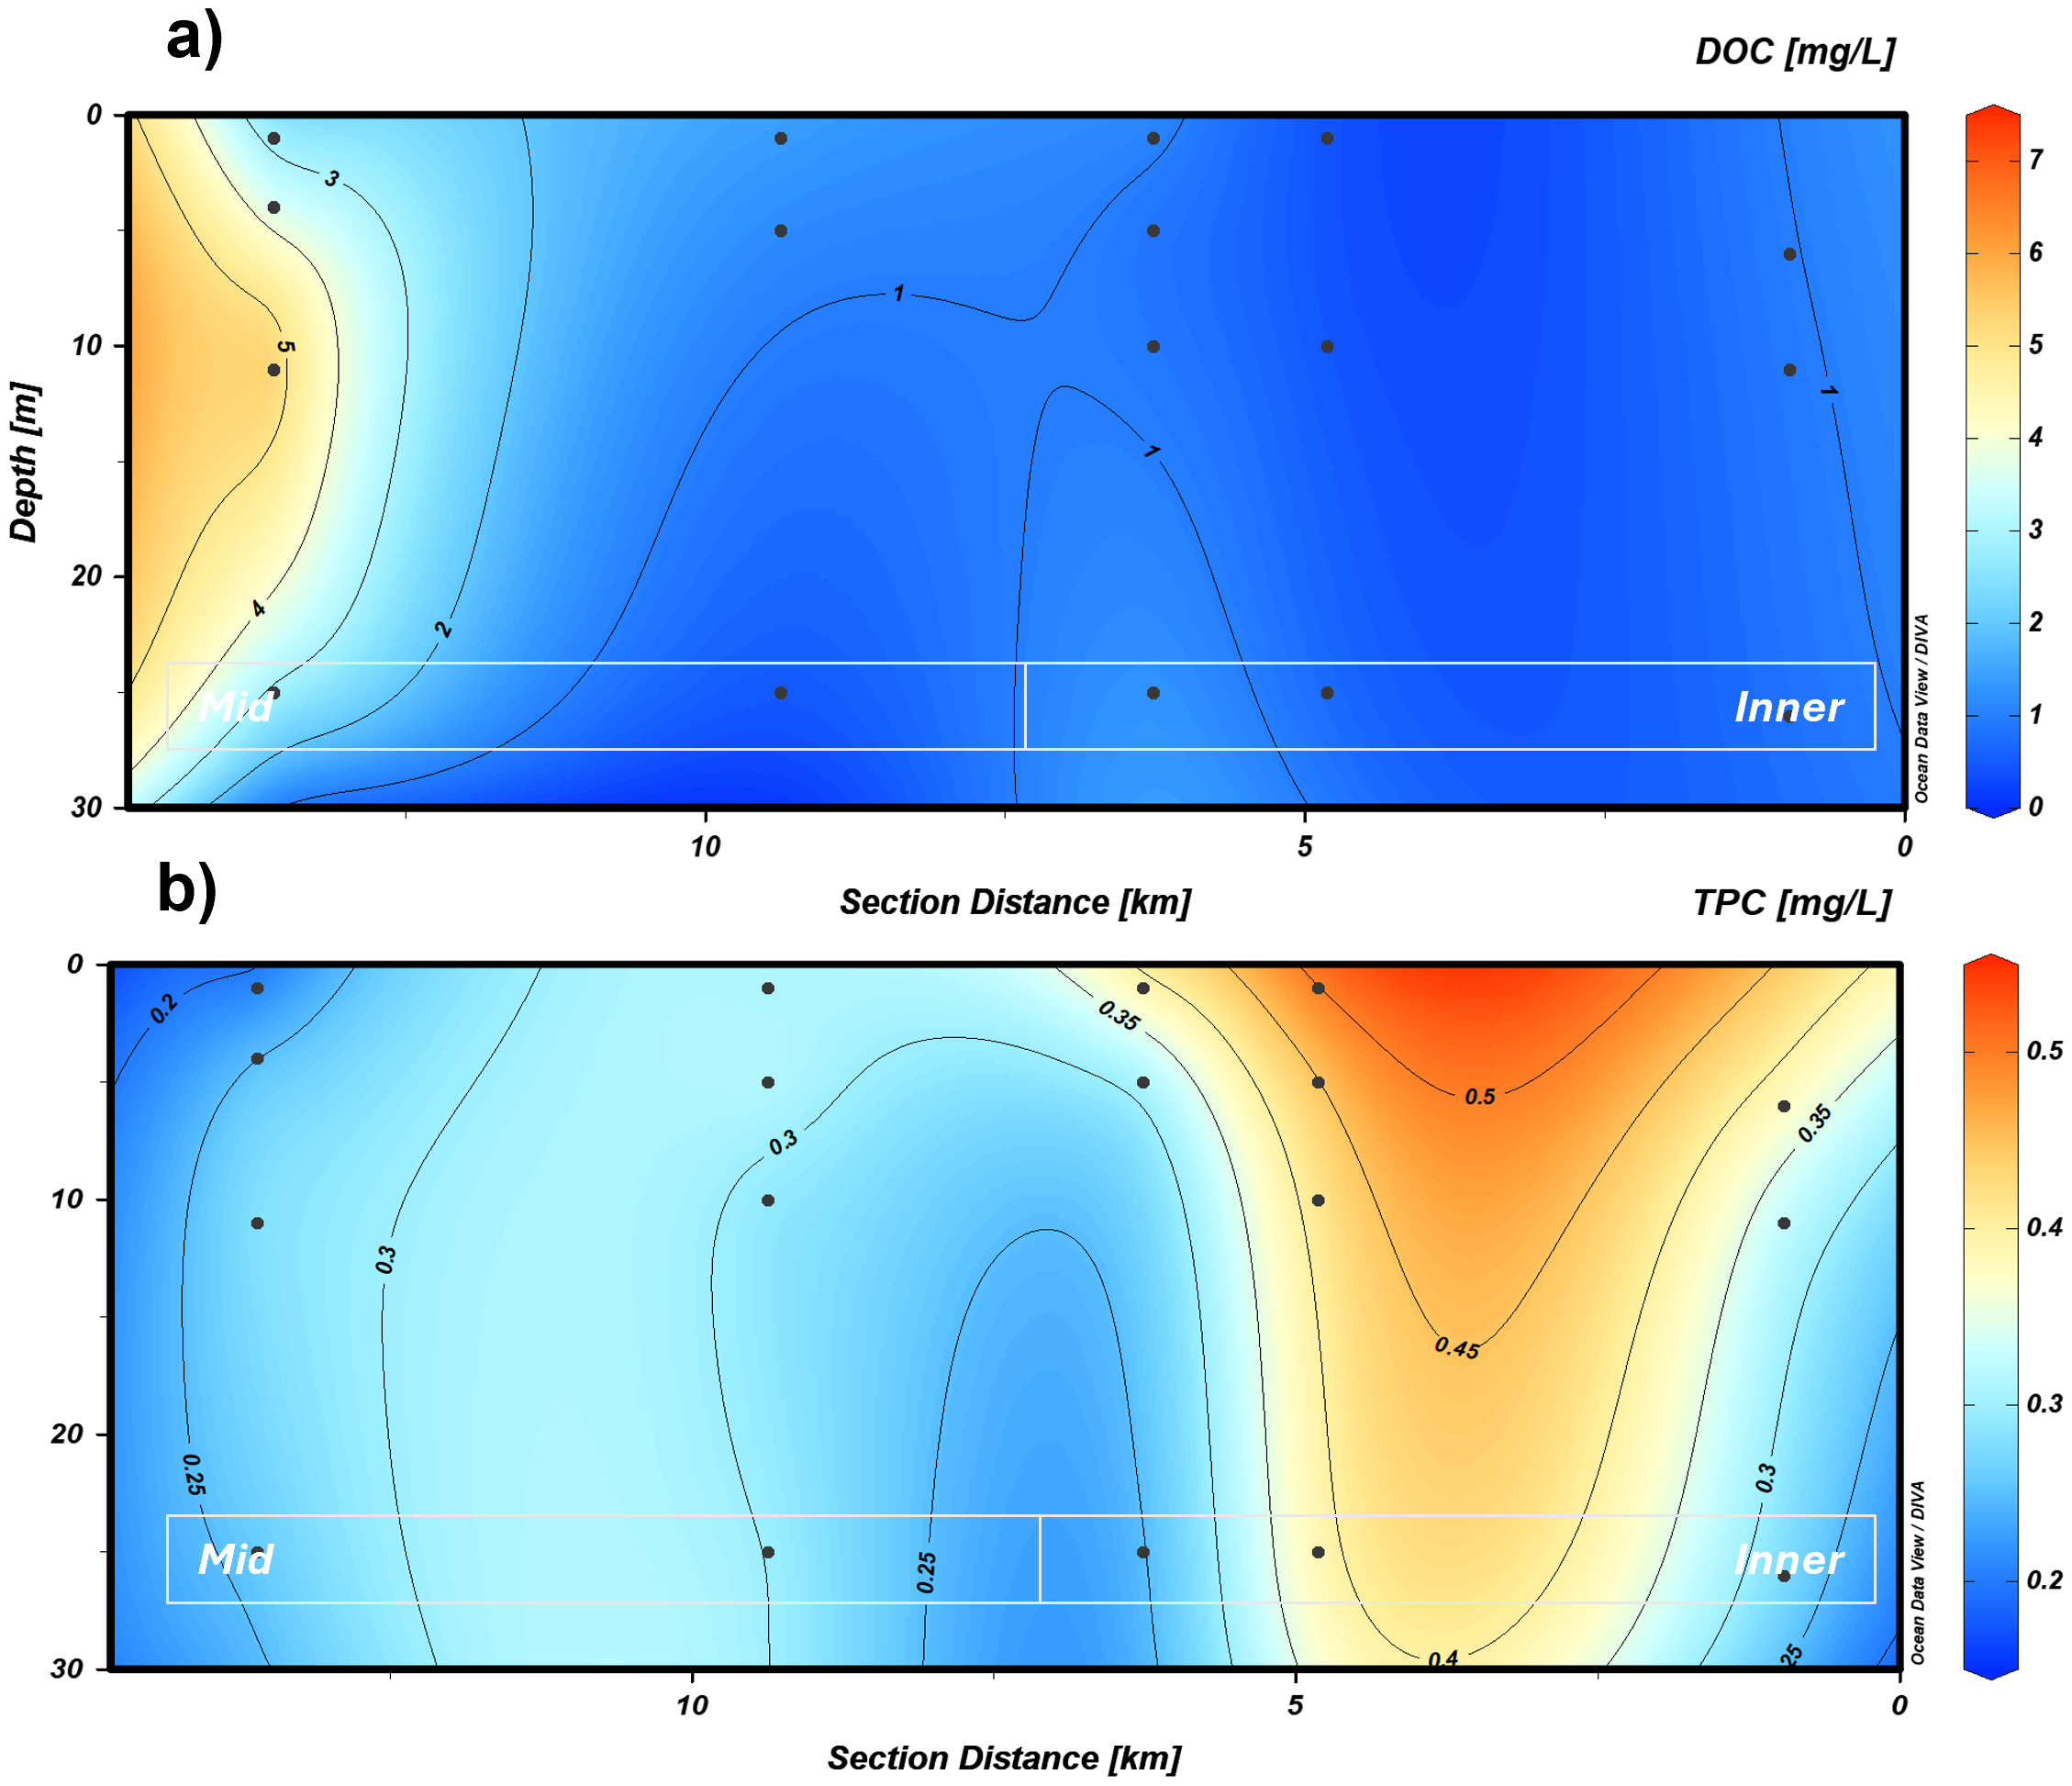
Profile section of the marine transect for (a) DOC and (b) TPC in the upper 30 m. Black dots indicate the location and depth of water sampling. DOC, dissolved organic carbon; TPC, total particulate carbon.
3.1.4 Coloured dissolved organic carbon
The absorption of the coloured fraction of organic matter showed the highest mean values of aCDOM(330) at KB3 (0.337 m−1), followed by the innermost station (KB5G) with 0.269 m−1. Lower mean values were recorded at KB5 with 0.16 m−1, followed by KB4. For aCDOM(275), the highest mean absorption was found at KB5G (1.139 m−1), followed by KB3 (0.99 m−1), whereas KB5 had the smallest value with 0.721 m−1 (Table 4). Spectral slopes (S275–295 and S350–400) depicted the lowest mean absorption at the mid and innermost stations (KB3 and KB5G, respectively) (Table 4). Additionally, KB5 showed the highest mean value for S275–295 (0.034 m−1) whereas station KB4 for S350–400 with 0.013 m−1. The maximum mean value of SR was observed at KB3/4 (3.034 m−1) and the minimum at the following station (KB4) with 2.471 m−1 (Table 4).
Table 4
| Station |
a
CDOM330 (m−1) |
a
CDOM275 (m−1) |
DOC (mgC L−1) |
TPC (mgC L−1) |
S275–295 (m−1) |
S350–400 (m−1) |
SR | |
|---|---|---|---|---|---|---|---|---|
| KB3 | Mean | 0.337 ± 0.22 | 0.99 ± 0.13 | 3.663 ± 2.53 | 0.25 ± 0.05 | 0.028 ± 0.01 | 0.010 ± 0.00 | 2.86 ± 0.13 |
| Min | 0.203 | 0.890 | 1.954 | 0.175 | 0.013 | 0.005 | 2.640 | |
| Max | 0.727 | 1.208 | 7.431 | 0.294 | 0.033 | 0.011 | 2.972 | |
| KB3/4 | Mean | 0.228 ± 0.02 | 0.921 ± 0.15 | 0.684 ± 0.71 | 0.307 ± 0.04 | 0.03 ± 0.00 | 0.010 ± 0.00 | 3.03 ± 0.479 |
| Min | 0.199 | 0.663 | 0.100 | 0.251 | 0.028 | 0.007 | 2.686 | |
| Max | 0.257 | 1.050 | 1.472 | 0.373 | 0.032 | 0.012 | 3.849 | |
| KB4 | Mean | 0.199 ± 0.02 | 0.951 ± 0.05 | 1.058 ± 0.37 | 0.308 ± 0.8 | 0.032 ± 0.00 | 0.014 ± 0.00 | 2.47 ± 0.40 |
| Min | 0.177 | 0.860 | 0.621 | 0.240 | 0.031 | 0.011 | 1.858 | |
| Max | 0.238 | 0.995 | 1.465 | 0.427 | 0.033 | 0.017 | 2.879 | |
| KB5 | Mean | 0.160 ± 0.05 | 0.722 ± 0.13 | 0.404 ± 0.31 | 0.442 ± 0.04 | 0.034 ± 0.00 | 0.012 ± 0.00 | 2.87 ± 0.30 |
| Min | 0.096 | 0.520 | 0.100 | 0.403 | 0.030 | 0.010 | 2.428 | |
| Max | 0.230 | 0.876 | 0.701 | 0.512 | 0.037 | 0.015 | 3.240 | |
| KB5G | Mean | 0.269 ± 0.02 | 1.044 ± 0.09 | 0.904 ± 0.09 | 0.327 ± 0.5 | 0.028 ± 0.00 | 0.010 ± 0.00 | 2.90 ± 0.13 |
| Min | 0.249 | 0.881 | 0.799 | 0.283 | 0.024 | 0.009 | 2.776 | |
| Max | 0.297 | 1.139 | 0.989 | 0.397 | 0.030 | 0.011 | 3.124 | |
OC, CDOM, slopes, and ratio overview in the water column (0–25 m).
OC, organic carbon; CDOM, coloured dissolved organic matter; DOC, dissolved organic carbon; TPC, total particulate carbon.
3.2 Statistical analyses
A strong link was observed between DOM and its optical properties. DOC was strongly, positively correlated with aCDOM330 (r = 0.89) and moderately with aCDOM275 (r = 0.59). Conversely, DOC showed a strong negative correlation with S275–295 (r = −0.74). The optical parameters were also tightly coupled: aCDOM330 and aCDOM275 were strongly correlated (r = 0.89), similar to S275–295 and S350–400 (r = 0.71). Moreover, carbonate system parameters were strongly inter-correlated: CO2 exhibited a near-perfect inverse relationship with pCO2 (r = −0.98), whereas CO2 and DIC had a strong positive correlation (r = 0.87). Furthermore, aragonite saturation state (WAr) correlated positively with pH (r = 0.76) and negatively with CO2 (r = −0.93).
DIN showed positive correlations with both PO4 (r = 0.67) and Si (r = 0.69). This signal was linked to the carbonate system: CO2 was positively correlated with both Si (r = 0.77) and DIN (r = 0.50), and finally, there was a strong negative correlation between pH and Si (r = −0.81). Dissolved carbon pools were also significantly linked. DOC showed strong positive correlations with CO2 (r = 0.75) and DIC (r = 0.64) and a strong negative correlation with pH (r = −0.74). This was supported by optical data, with aCDOM330 positively correlating with CO2 (r = 0.58) and S275–295 negatively correlating with CO2 (r = −0.53). Contrastingly, TPC showed an opposing trend to DOC. TPC was negatively correlated with CO2 (r = −0.50) and pCO2 (r = −0.56) and positively correlated with pH (r = 0.57). Finally, physical parameters also showed significant correlations. Salinity was positively correlated with Si (r = 0.56) and PO4 (r = 0.44), but negatively with pH (r = −0.67). Temperature showed a strong negative correlation with NO2 (r = −0.68).
Kruskal–Wallis tests (Appendix 5) identified significant differences among stations (p < 0.05) for aCDOM275, aCDOM330, CO2, DOC, and NO2. Differences in TPC (p = 0.056) and S275–295 (p = 0.050) were near the significance difference threshold but did not reach it.
3.2.1 Spatial differences and carbon linkages in the fjord system
At the mid-fjord station KB3, DOC reached 3.66 ± 2.50 mg C L−1, and absorption at 330 nm (aCDOM330) was 0.33 ± 0.20 m−1, the highest values recorded along the transect. These peaks occurred at 10-m depth together with the largest inorganic nutrient concentrations except silicate (Figures 4f, 5a). Optical indices indicated high-molecular-weight material: both S350–400 and S275–295 were minima, while temperature, salinity, CO2, and pH shifts were greater than those at the other stations (Figures 4a–f, 6e). From 25 m to the surface, SR declined steadily as CO2 rose (Figures 4a, 6c). The innermost station KB5G showed the highest absorption at 275 nm (aCDOM275 = 1.04 ± 0.09 m−1), matching the nitrogenous chromophore signal observed at 270–275 nm in sea ice samples (Figures 4a, 7). The surface waters there contained lower N (8.50 µmol L−1), Si (3.85 µmol L−1), and PO4 (0.43 µmol L−1) (Figures 4d, c, f). Both S350–400 and S275–295 remained low, whereas SR was relatively high (Figures 6c–e).
Figure 6
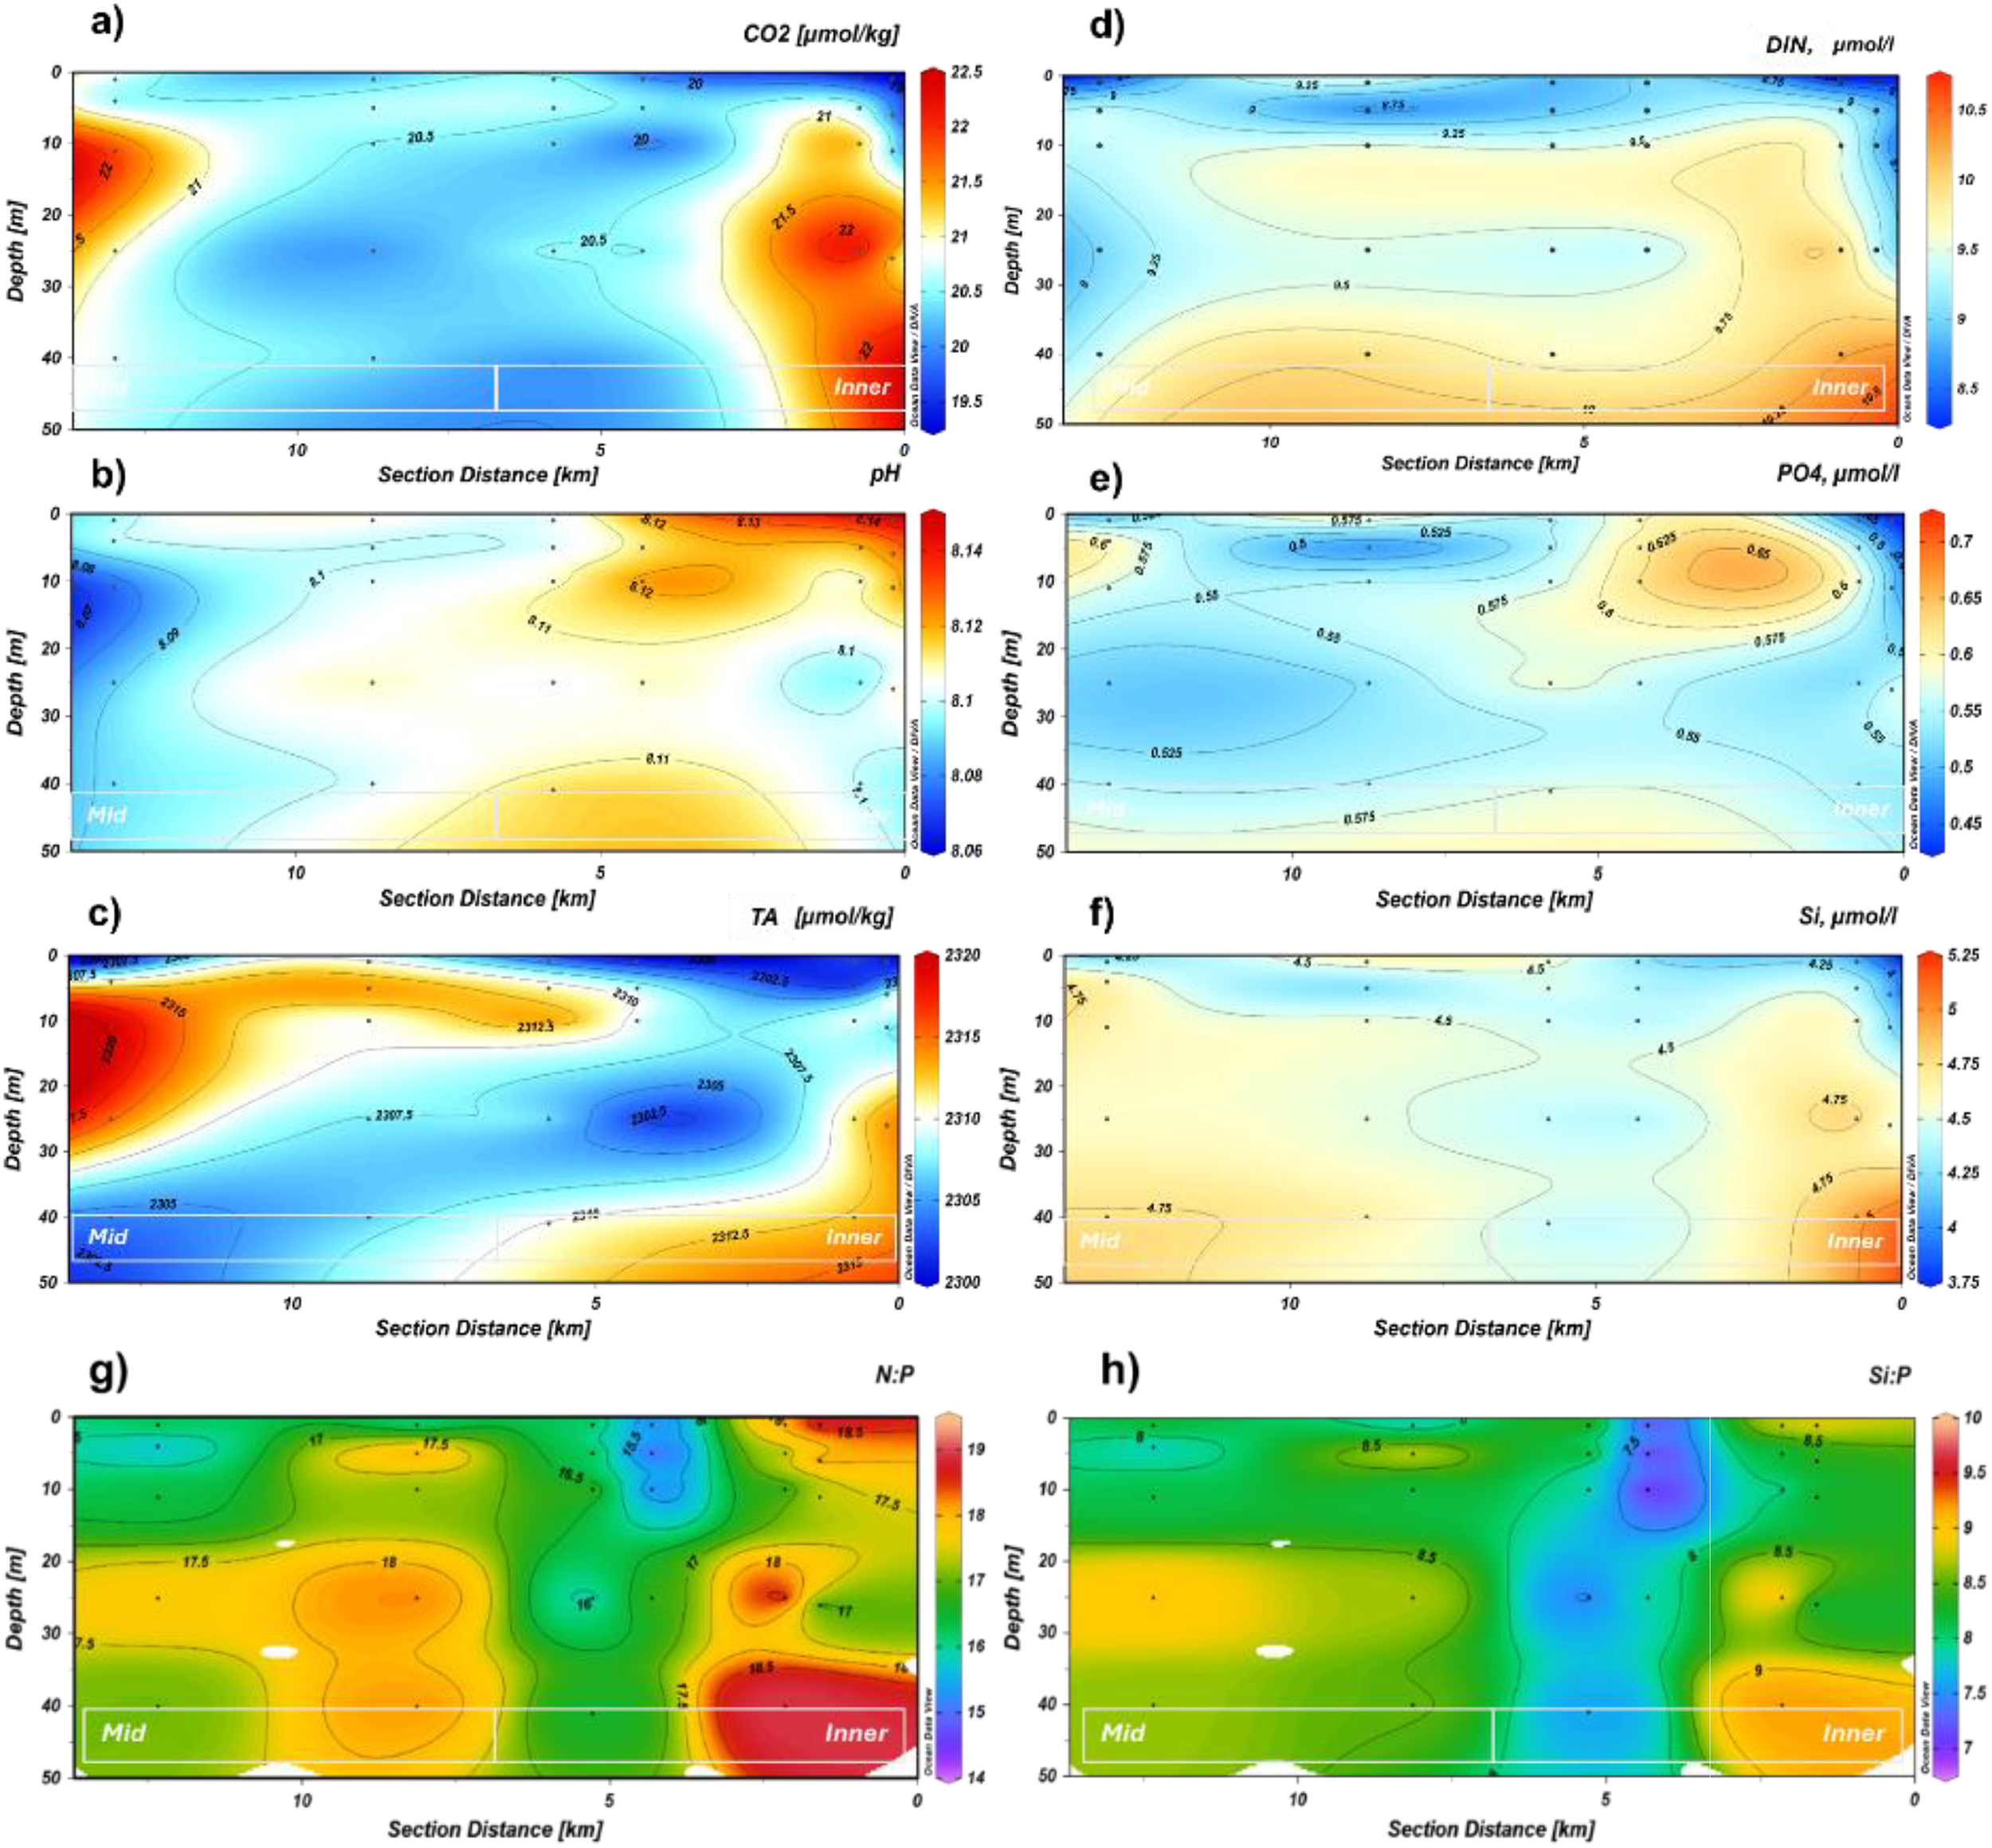
Profile section of the marine transect for (a) CO2, (b) pH, (c) TA, (d) DIN, (e) PO4, (f) Si, (g) N:P and (h) Si:P in the upper 50 m.
Figure 7
![Five contour plots labeled a) to e), displaying data on a vertical axis of depth in meters and a horizontal axis of section distance in kilometers. Each plot has a color gradient indicating different data values, with a corresponding color bar on the right. Plot a) labeled “a275 [m-1]”, b) “a330 [m-1]”, c) “SR”, d) “S350_400”, and e) “S275_295”. Areas are marked “Mid” and “Inner” within the plots.](https://www.frontiersin.org/files/Articles/1688237/xml-images/fmars-12-1688237-g007.webp)
Profile section of the marine transect for (a)aCDOM275, (b)aCDOM330, (c) SR, (d) S350-400, and (e) S275-295 in the upper 30 m.
3.3 Sea ice
3.3.1 Distribution of DOC and TPC
sea ice core data revealed a variable stratification in concentrations of DOC and TPC (Table 5). Notably, DOC concentrations were the highest at the bottom layer (0.69 mgC L−1) and the lowest at layers II and III (0.226 mgC L−1 and 0.218 mgC L−1, respectively). In contrast, TPC exhibited a different distribution, with maximum concentrations at the top layer (2.293 mgC L−1) and minimum at the bottom layer (1.254 mgC L−1).
Table 5
| Parameters | Top | II | III | Bottom | Mean | Range |
|---|---|---|---|---|---|---|
| DOC (mgC L−1) | 0.433 | 0.238 | 0.218 | 0.691 | 0.390 ± 0.25 | 0.110–1.088 |
| TPC (mgC L−1) | 2.293 | 1.278 | 1.306 | 1.254 | 1.292 ± 0.51 | 1.254–2.293 |
| a CDOM275 (m−1) | 0.988 | 0.831 | 0.667 | 1.272 | 0.939 ± 0.223 | 0.667–1.272 |
| a CDOM330 (m−1) | 0.778 | 0.616 | 0.178 | 0.449 | 0.505 ± 0.222 | 0.178–0.778 |
| S275–295 (m−1) | 0.021 | 0.023 | 0.021 | 0.018 | 0.021 ± 0.002 | 0.018–0.023 |
| S350–400 (m−1) | 0.037 | 0.034 | 0.022 | 0.015 | 0.027 ± 0.009 | 0.015–0.037 |
| SR | 1.345 | 1.160 | 0.759 | 0.577 | 0.960 ± 0.306 | 0.577–1.345 |
sea ice chemical and absorption coloured dissolved organic carbon properties.
DOC, dissolved organic carbon; TPC, total particulate carbon.
3.3.2 CDOM
sea ice aCDOM spectra showed characteristic shoulders within the range of 260–400 nm (Figure 8a). CDOM at 275 nm showed the highest absorption at the bottom layer with 1.27 m−1 and aCDOM(330) at the top layer with 0.78 m−1. In general, aCDOM showed a decreasing gradient from the top layer to layer III, while the bottom layer showed an increase for both aCDOM275 and aCDOM330 (Appendix 2). Spectral slopes exhibited very low variations across layers; however, S275–295 showed a slight increase from the top to layer II, followed by a decrease from layer II to IV (Table 5). S350–400 showed a gradual decrease from the top to bottom layer (IV), with maximum values at the top and minimum at the bottom (Table 5). The SR ratio also showed a clear decreasing trend from the top to the bottom layer.
Figure 8
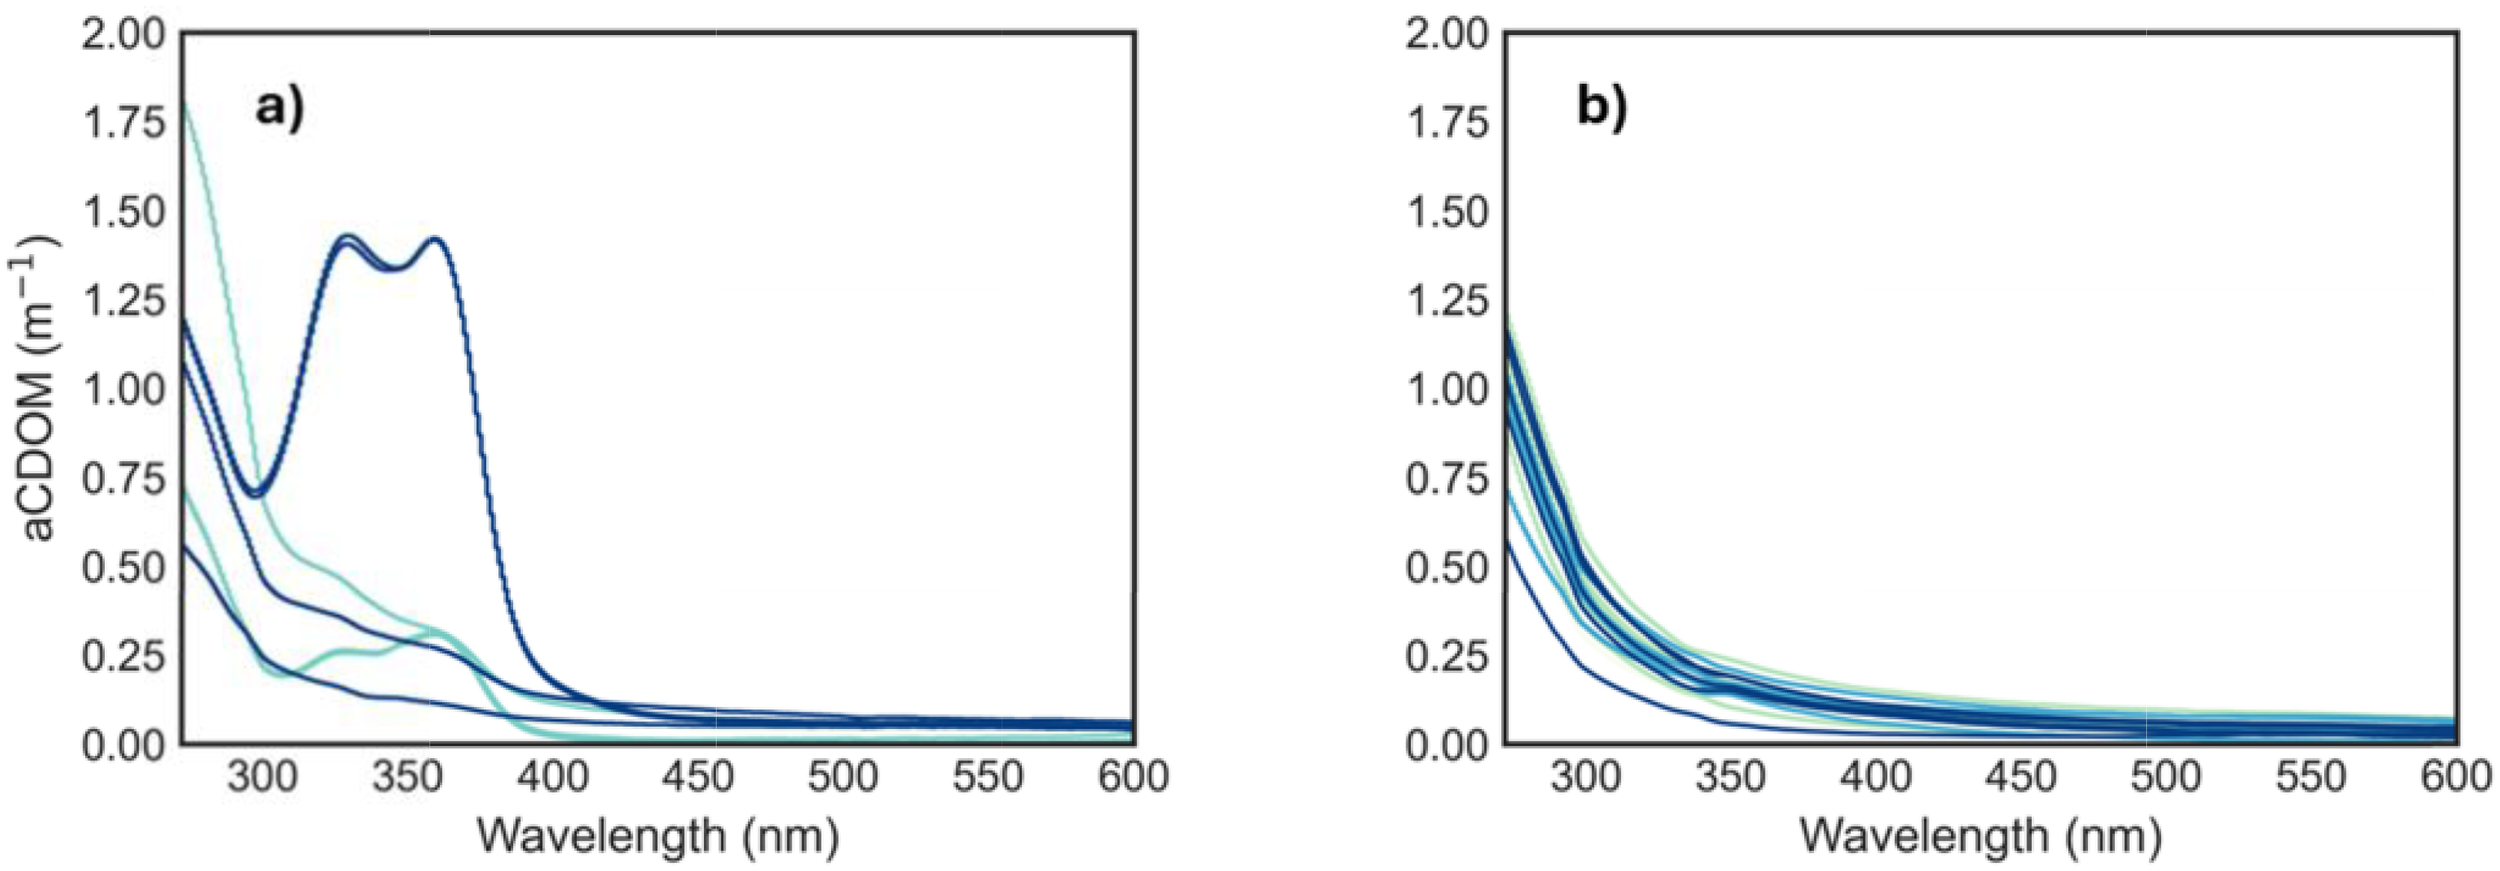
Absorption (aCDOM) spectra (m−1) for (a) sea ice core samples and (b) seawater samples from all stations and depths. Detailed sea ice spectra for each core layer are available in Appendix 2.
3.3.3 Gaussian decomposition of aCDOM in the water column and the sea ice
The absorbing components resolved from each spectrum showed a gradual increase in diversity throughout the marine transect (Figure 7). Stations KB3, KB3/4, and KB4 exhibited the fewest absorbing components (N = 4), followed by KB5 with five and the innermost station (KB5G) with a total of seven. The analysis indicated that marine water predominantly displayed peaks corresponding to specific absorbing components within the range of 273–390 nm. From mid-fjord (KB3) to the glacier front (KB5G), the number of individual absorbing components decreased with depth. The highest peaks were observed at the surface and at 10 m. Interestingly, KB3 had the overall maximum peak height (0.28 m−1 at 294 nm) located at 10 m, followed by KB5G (0.18 m−1 at 324 nm). Overall, we identified a gradual shift in absorbing components across the marine transect. At the inner stations, we observed a higher number of absorption components towards smaller wavelengths. In contrast, the absorbing components from KB3 to KB4 were more homogeneous and situated at longer wavelengths (Figure 7; Appendix 3).
With regard to sea ice absorbing components, our study found 10 absorbing components at the top layers (270, 271, 273, 330, 332, 366, 367, 417, 418, and 493 nm). The diversity of absorbing components increased from layer I to layer IV, where the highest number of components (N = 11) was identified. At the bottom layer, a prominent peak was observed at 276 nm, and a constant absorbing component was present in all layers at 273 nm (Figure 9). At the top layer and layer II, four absorbing components peaked at ~330, 332, 366, and 367 nm (Figure 9). Overall, sea ice absorbing components shifted gradually from the top to the bottom layers (Figure 9). The top layers displayed higher peaks, primarily located at smaller wavelengths, whereas at deeper layers, lower peaks were observed at longer wavelengths. In general, sea ice exhibited higher peaks and greater variability of absorbing components compared to the seawater samples, highlighting differences in qualitative CDOM characteristics between these environments. In terms of aCDOM slopes, all ice cores (A, B, and C) showed a constant decrease from the top to bottom layers in S275–295, S350–400, and SR (Table 5).
Figure 9
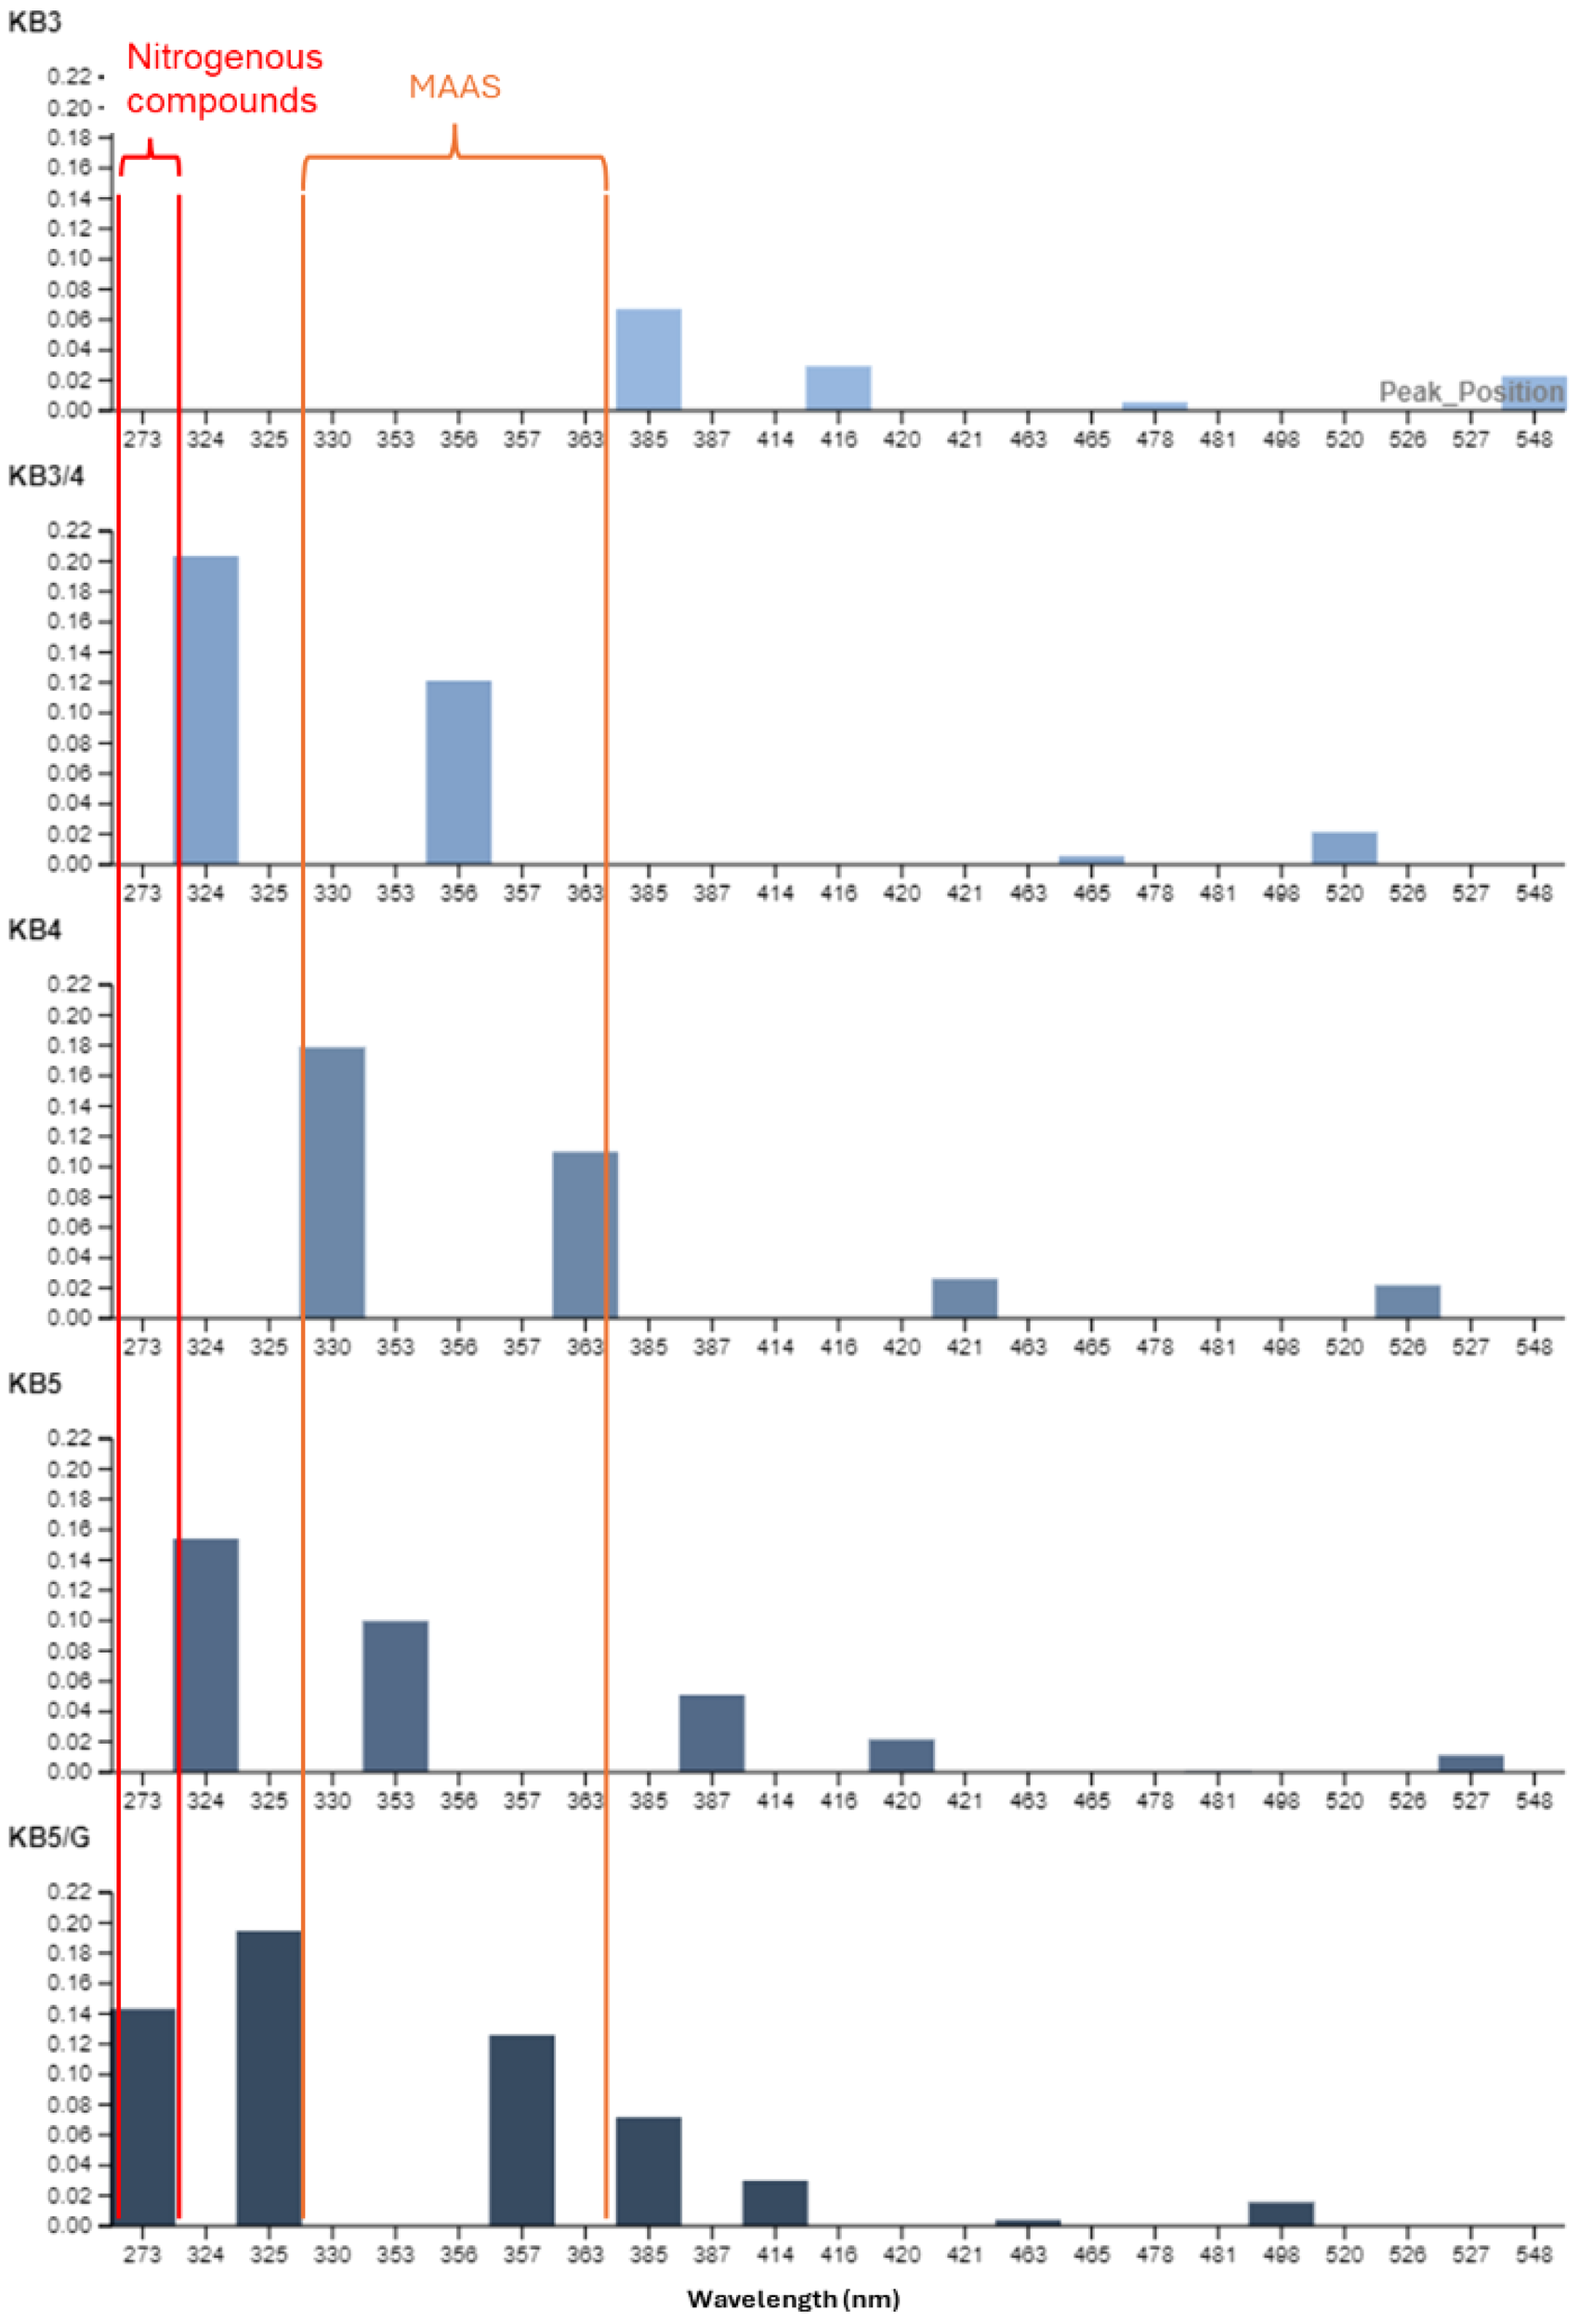
Histograms of absorbing components derived from seawater samples, computed for all marine stations and depths. The x-axis represents the wavelength of absorption peaks, and the y-axis represents their height (magnitude). Orange and red boxes highlight the characteristic "two-shoulder" signal of mycosporine-like amino acids (MAAS) and nitrogenous compounds, respectively.
4 Discussion
4.1 Water masses and organic–inorganic carbon connections
Kongsfjorden spring hydrography was a mixture of LW, ArW, and WCW, driven by glacial melt, sea ice runoff, and incursions of the West Spitsbergen Current (Table 2; Fransson et al., 2015). Our temperature–salinity analysis identified these three water masses distinctly (Figure 2). Salinity fell from 34.84 ± 0.03 at KB3 to 34.20 at KB5G, and temperature declined from 0.77°C ± 0.12°C to −1.13°C at KB5c, documenting a clear LW → ArW → WCW sequence along the transect. Turbidity and chlorophyll fluorescence further delineated these regimes. In the LW/ArW transition at KB3/4, high turbidity (12.5 FTU) coincided with elevated fluorescence (~2.5 NU), consistent with active phytoplankton production and the subsequent photodegradation of organic matter at surface waters. Contrastingly, at the inner fjord (>5 m), turbidity remained elevated, while fluorescence dropped to ~0.23 NU, indicating minimal primary production and a dominance of microbial processing in the organic matter cycle backed up by high N:P and CO2 patches. Our data show that the latter is likely a consequence of remineralisation: CO2 concentration was significantly and positively correlated with the key products of microbial degradation, including DIN and Si (Figure 10). Furthermore, the “high N:P” and “Si:P” ratios, which suggest enrichment by meltwater (sea ice/glacial), were correlated with the optical properties of organic matter (OM) (Figure 10). These correlations (meltwater → CDOM properties → CO2 production) suggest a narrative for microbial OM degradation. Contrastingly, the TPC pool was decoupled from this cycle, which showed no significant correlation with any CDOM or spectral slope properties and was negatively correlated with CO2, confirming that it was not part of this biological transformation. Mixing intensified towards the inner fjord, adding LW, ArW, and WCW layers, but the imprint of ice-derived inputs on the fjord strongly horizontally stratified the system. These hydrographic gradients were reflected in nutrient and carbon distributions: at KB5G, fresh meltwater diluted salinity, dissolved nutrients (DIN, PO4, and Si), DIC, and CO2 (Figures 3b, 4d–f). There, both chlorophyll a fluorescence (Appendix 1) and N:P and Si:P ratios remained low (Figures 4g, h), confirming a dilution effect of CO2 in areas highly influenced by ice (Figure 4a), rather than by phytoplankton uptake as previously reported by Hopwood et al. (2019) and Fransson et al. (2015), most likely due to a diluting effect caused by sea ice/glacial melting, as supported by high N:P and Si:P ratios. Additionally, a glacial plume was identified at the subsurface of the inner fjord, coincident with Darlington et al. (2015), who observed that the glacial meltwater plume in Kongsfjorden influences a broader depth throughout the water column, rising from the grounding line of tidewater glaciers at approximately 60 m. These, explained further by Everett et al. (2018), were glacial plumes that mixed the melted and salty waters throughout the water column, decreasing the fresh signal of a glacial plume as observed in our study (Figures 3a,b; Appendix 1).
Figure 10
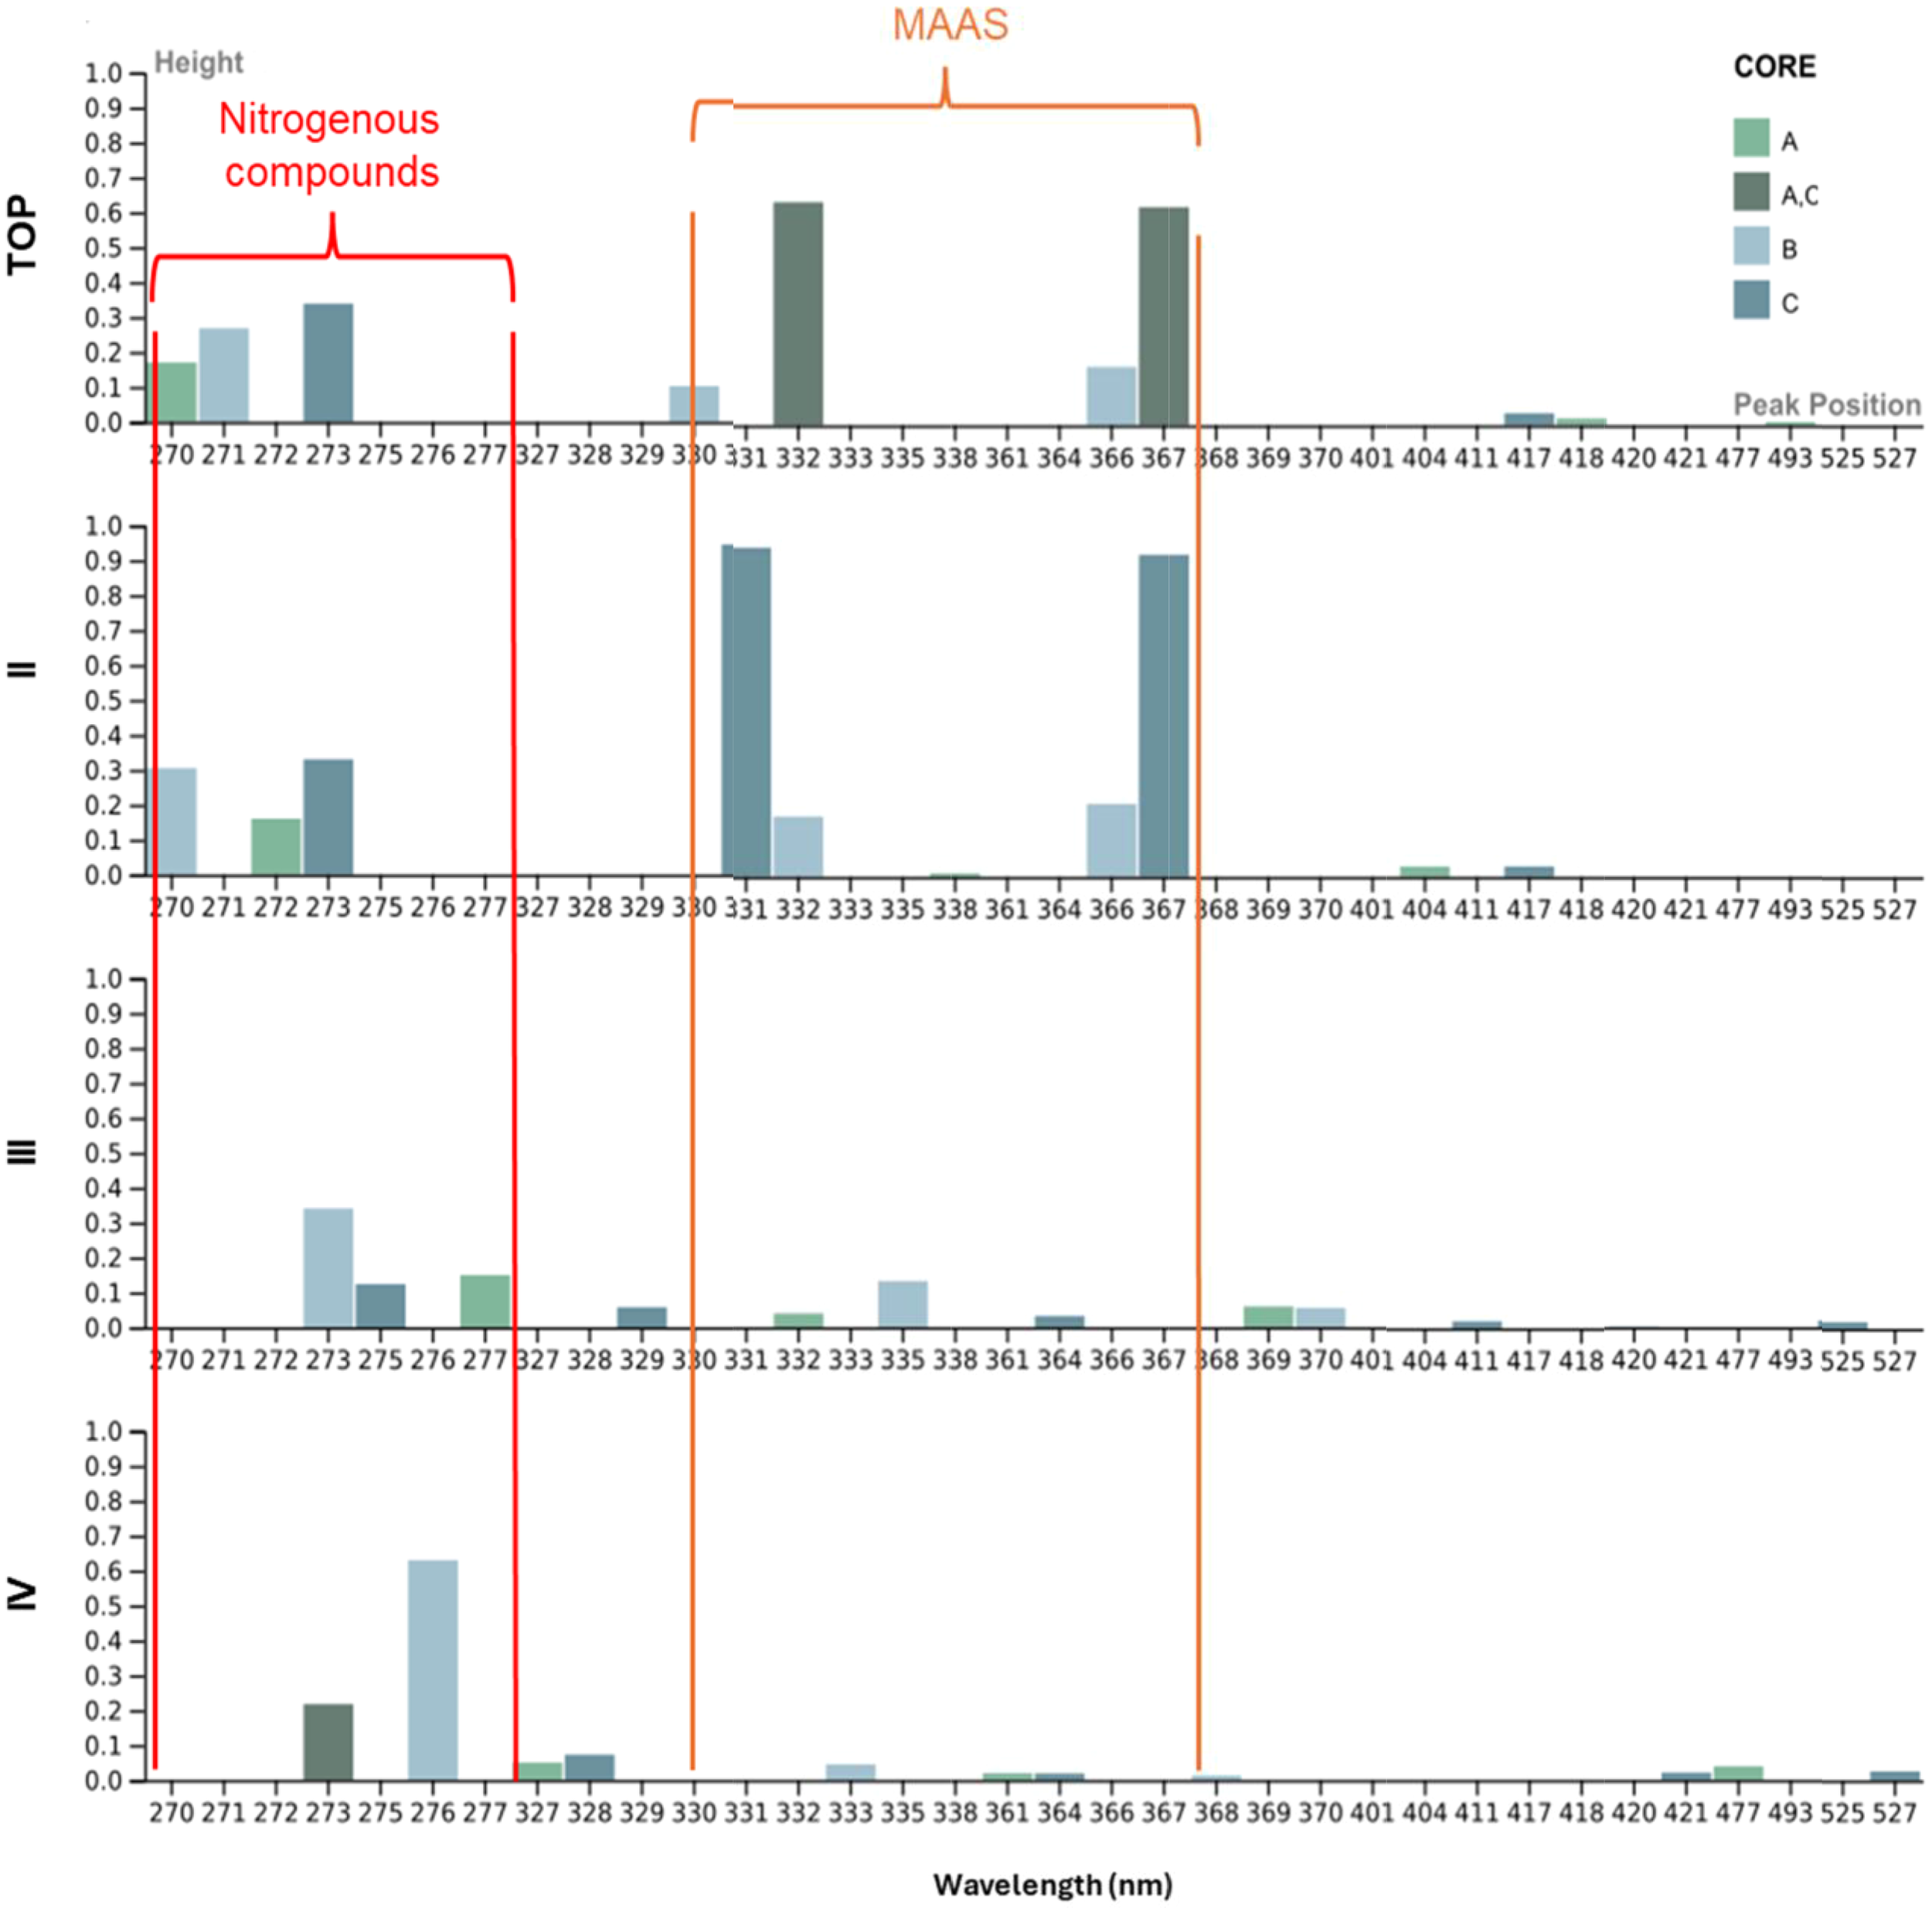
Histograms of absorbing components computed for individual sea ice core layers (Top, II, III, and IV) from cores A, B, and C. The x-axis represents the wavelength of absorption peaks, and the y-axis represents their height (magnitude). The orange and red boxes highlight absorption peaks associated with mycosporine-like amino acids (MAAS) and nitrogenous compounds, respectively.
4.2 Carbon and CDOM patterns
The significant variability observed across the fjord is likely driven by a combination of seasonal processes. The spring season marks the beginning of sea ice thaw and pulses of glacial melt, introducing cold water and terrestrial-derived carbon into the fjord (Svendsen et al., 2002). Brogi et al. (2018) found DOC average concentrations of 4.818 ± 1.7 mgC L−1 in sea ice, whereas 1.321 ± 0.42 mgC L−1 in seawater in spring, while Han et al. (2022) found average concentrations of 0.804 ± 0.08 mgC L−1 in surface waters and slightly higher concentrations (0.816 mgC L−1) at subsurface waters in the Arctic. Our results for sea ice showed much lower concentrations of DOC than those reported by Brogi et al. (2018), with a mean of 0.343 ± 0.13, and seawater concentrations varied significantly throughout the transect, with mean max values at the outermost station (KB3, 3.66 ± 2.19 mgC L−1) to min values at one of the innermost stations (KB5, 0.501 ± 0 mgC L−1).
Increases in light availability and stratification at the inner fjord caused by melting during spring alter primary production, affecting both DOC and TPC concentrations and distribution (Granskog et al., 2015; Pavlov et al., 2019). DOC concentrations were higher in the mid-fjord throughout the column water, while inner stations showed depleted DOC reservoirs (Figure 5a), likely due to winter microbial mineralisation, mainly below 5 m, as previously observed (e.g., Retelletti Brogi et al., 2019). An exceptionally high DOC concentration of 7.431 mg/L was observed at KB3 (10 m). Such concentrations are not unprecedented in Arctic coastal systems during the spring freshet (e.g., Köhler et al., 2003; Holmes et al., 2023; Cantoni et al., 2020). We interpret this as evidence of a local hotspot of heterotrophic activity. Elevated concentrations of CO2 and PO4, both products of OM decomposition, support this interpretation. Moreover, low fluorescence and minimal turbidity suggest that the observed signal was driven primarily by decomposition rather than by in situ primary production. Relatively low N:P and Si:P ratios further indicate a terrestrial origin of the consumed OM. Together, these findings point to a scenario in which terrestrial DOC was transported into a relatively stable, marine-influenced location, creating a highly reactive site for microbial processing (Figures 4a, g, h, 5a). Inner stations (KB4, KB5, and KB5G) exhibited high TPC concentrations (Figure 5b). While TPC includes both organic (POC) and inorganic (PIC) fractions, the particulate carbon fraction was found to be decoupled from the fjord’s biological activity. Although measured as TPC, our statistical analysis revealed its inorganic nature. TPC showed no significant correlation with any indicators of phytoplankton biomass (e.g., chlorophyll fluorescence and nutrients). Instead, its distribution was significantly correlated with pH and CO2, providing clear evidence that the pool was dominated by PIC (Appendix 5). The nutrient-rich meltwater likely fuelled biological responses early in spring during the sea ice brine release, leaving behind depleted DOC and dead cells. At KB5G, signals of sea ice-derived HMW OM were prominent at the surface, reflected in high aCDOM(275), and low spectral slope values (Figures 6a, c–e). Throughout the water column, evidence of CDOM transformation (through both photodegradation and microbial degradation) (Figures 6c–e) was observed by differences in spectral slopes (Figure 4), highlighting the role of sea ice and glacial inputs in introducing specific types of carbon and transforming it into bioavailable forms in the early freshet.
Higher S275–295 and S350–400 values are typically associated with LMW DOM (Stedmon et al., 2000; Helms et al., 2008; Fichot et al., 2012). The spectral slope ratio SR has been widely used as a proxy for the source of DOM. Specifically, lower values indicate a greater contribution from terrestrial, HMW humic substances (Zhao et al., 2024; Tzortziou et al., 2008; Helms et al., 2008). This ratio is highly dynamic. It can increase due to microbial respiration and decrease via photobleaching. Microbial activity is known to establish an inverse relationship between SR and spectral slopes (S275–295 and S350–400) (Helms et al., 2008; Moran et al., 2000; Vähätalo and Wetzel, 2004). Our findings align with this principle, showing an overall inverse trend between S350–400 and SR (Figures 6c, d, 10). However, the relationship with S275–295 was more complex, as mid stations showed a positive trend and inner stations an inverse trend below the surface (Appendix 7a, c). Furthermore, the observation that S275–295 values were consistently higher than S350–400 during spring suggests a predominantly marine, rather than terrestrial, origin (Helms et al., 2008). This pattern in the spectral slopes further supports a non-terrestrial origin for the dominant DOM components during this period.
The variability observed in this study is likely driven by the interplay between the input of different DOM sources from sea ice and glacial melt, and photodegradation by continuous sunlight exposure during spring (Logvinova et al., 2015). Microbial OM decomposition processes, evidenced in our study by the positive correlation between DOC and DIC/pCO2 (Appendix 5), also contribute to variations in CO2 levels, influencing OM transformation routes within the system (Matsuoka et al., 2015, Vähätalo et al., 2004, Del Vecchio and Blough, 2002). Given the highly dynamic nature of Kongsfjorden in spring, with increasing light availability due to the decrease in sea ice coverage and episodic meltwater pulses, these factors play a fundamental role in controlling turnover pathways within the fjord (Table 6) (Mopper et al., 2015; Piquet et al., 2014).
Table 6
| Process identified | Key parameter signatures |
|---|---|
| Microbial regime Hotspot (KB3, 10 m) |
Lowest S275–295 + Lowest S350–400 + Lowest a275:a330 + Highest a330 + Highest CO2 + N:P > 16 |
| Photodegradation OM from sea ice (surface) |
High a275 + High S275–295 + High SR + Low S350–400 + High N:P, Si:P + Lowest PO4 + Lowest CO2 |
| Post-bloom Microbial fuel (KB5, 5 m) | Lowest a330 + Highest S275–295 + Highest a275:a33 + Lowest N:P/Si:P + Highest PO4 |
| Subglacial plume (KB5G) | Low S275–295 + High CO2 + Moderate values for all other parameters |
Summary of key biogeochemical processes found in our study and the combination of parameters used for their identification.
Full combination of variables can be found in Appendix.
4.3 Carbon and nutrient transformations along the transect
The contrasting characteristics between KB5c and KB5 underscored the complex interplay between sea ice, glacial inputs, and OM degradation processes. At KB5c, N and CO2 concentrations (at >5-m depth) were greater by comparison with other stations, combined with decreasing temperature and turbidity, a signature of the microbial remineralisation of DOM sourced from mixed sea ice and glacial water (Figures 3a, d, 4a, d), consistent with previous studies (e.g., Halbach et al., 2019; Hood et al., 2009; Pelikan et al., 2019). In contrast, surface waters (<5 m) at KB5 were likely dominated by a different process: photodegradation. The evidence for this was the high S275–295 and low S350–400 (Figure 6). This layer also contained high turbidity, TPC, and high DIN, likely due to the influence of sea ice melt and allochthonous materials susceptible to fast photodegradation (Figures 3c, 4, 5b). No high CO2 or DIC was observed, most likely due to meltwater dilution. These findings align with previous studies (Lønborg et al., 2020; Mopper et al., 2015) that reported that photodegradation processes are mainly driven by the availability of allochthonous rather than autochthonous OM on the surface layer, as non-local OM has been shown to be more susceptible to photodegradation.
The spatial distribution of CO2 showed three hotspots of OC transformation regimes in Kongsfjorden during our study (Figure 4a). The first one, a zone of photomineralisation between the surface and 5 m, was detected at KB5 by increasing S275–295 and SR but decreasing S350–400 (Appendix 7a–c), a signal of photomineralisation as previously reported by Helms et al. (2008). This process can be traced to a specific source: HMW OM from sea ice. sea ice core data provided the “parent” signature of this meltwater plume, which contained HMW DOM (S275–295 = 0.021, S350–400). When this ice melts, it releases this allochthonous HMW material into the surface water (e.g., at KB5), where it is immediately exposed to sunlight. This exposure drives the photomineralisation, breaking down the “parent” HMW material (low spectral slopes) into “child” LMW fragments (higher spectral slopes) (Table 5). This process breaks a330, causing the a275:a330 to jump from the parent value of ~1.86 to ~4.0 (3.84–4.39) in the meltwater plume (Appendix 8). Additionally, the presence of low N:P ratios (<16) but generally high nutrient concentrations in this spot suggests a post-bloom setting where freshly generated DOM went through a photomineralisation regime (Table 6, Figures 4a, g). No increase in DIC/CO2 was detected in this spot, most likely due to the dilution effect.
The second hotspot regime, observed in deeper waters of the innermost station (KB5G, >5 m), was characterised by elevated CO2 and DIC together with high nutrient ratios (N:P > 18, Si:P > 8.5) and an inverse relationship between spectral slopes and SR (Appendix 7a–c). These features are consistent with microbial remineralisation of DOM (Table 6, Figures 6g, h). The high nutrient ratios and depleted PO4 may reflect the combined effects of microbial nitrogen regeneration, together with the enriched Si (Torres-Valdés et al., 2013) glacial plume input described for Kongsfjorden (McCutcheon et al., 2021). A third CO2 hotspot was identified in shallow waters at the mid-fjord (KB3, 10 m), representing the strongest microbial degradation regime with both the highest aCDOM(275, 330) and CO2 (Table 6 and Appendix 7d,e). This zone was characterised by the lowest spectral slopes and SR, suggesting the presence of HMW DOM (Table 6 and Appendix 7a–c). The regimes described above show that CO2 production in the fjord is not a single process but is driven by different biogeochemical pathways at different depths.
4.4 Absorbing components and sea ice/glacial influence
sea ice cores showed a constant decrease in spectral slopes from top to bottom layers, indicating the gradual utilisation of LMW DOM within the sea ice system, consistent with high microbial activity rates reported by Piontek et al. (2021). Additionally, Meiners and Michel (2017) found that microbial activity within the semi‐enclosed sea‐ice matrix plays a key role in marine surface biogeochemistry by accelerating nutrient regeneration. More recently, Tuerena et al. (2022) observed that in spring and summer, this recycling increases the regenerated nitrogen in the ice’s nutrient reservoir, which then alters surface‐water nutrient availability during ice–ocean exchanges. It is important to acknowledge that specific absorption features in complex environmental samples are not unique identifiers, as many compounds can absorb at similar wavelengths. Therefore, we interpret these features within the specific sea ice-influenced biogeochemical context of the fjord to infer the likely nature of the dominant chromophores. In our study, absorbing components such as mycosporine-like amino acids (MAAs) and Extracellular polymeric substance (EPS), typically associated with sea ice and cyanobacteria, were observed near sea ice-influenced stations like KB5G. We found the presence of absorbing peaks approximately 275 nm in sea ice (Figure 9, Appendix 3). While this signal can be attributed to a variety of hydroxylated aromatic compounds, its presence in our samples aligns with recent findings by Han et al. (2022), who identified tyrosine-like (nitrogen-rich) DOM as dominant in Kongsfjorden during spring. Additionally, a characteristic two-shoulder peak was found approximately 330–367 nm (Figure 9, top and II). This feature is strongly associated with MAAs as previously reported by Carreto et al. (2005) and Xie et al. (2014). These specific spectral signatures, along with other absorbing components (between 275 and 360 nm), collectively support the established role of sea ice in contributing unique OM to the marine system (Figure 9) (Granskog et al., 2015; Pavlov et al., 2014).
4.5 Stratification and ice-melt plumes in carbon dynamics
We observed a strong horizontal gradient along the fjord, together with a well‐developed vertical stratification in the inner basin caused by the spring melt of sea ice and glaciers (Fransson et al., 2016). This stratification was a key control on the fate of the two distinct carbon pools delivered by the meltwater.
For the DOC pool, the stratification trapped the DOM in the surface layer, prolonging its UV exposure. This intensified the photochemical breakdown of HMW DOM into smaller, more bioavailable fractions, as evidenced by the high spectral slopes in these waters (Figures 3b, 4e) (Lee et al., 2021). For the TPC pool, the strong stratification and the buoyancy of the meltwater plume may have overcome the higher density of the particles, slowing the export of TPC (dominated by PIC) (Figure 5b). This provides a physical explanation for the elevated surface-water TPC observed at the inner-fjord stations. Additionally, the non-significant (p > 0.05) correlation in our study between TPC, Si, and Si:P indicates a non-biogenic origin. For example, D'Angelo et al. (2018) found a higher proportion of opal with respect to OC in spring samples, characterised by high diatom export fluxes. The lack of a significant correlation between TPC and either salinity or TA suggests that the system is not governed by simple two-component mixing but by the complex interplay of multiple freshwater sources with varying particle loads and biogeochemical processes. Therefore, stratification had a dual and contrasting effect: it created a surface highly reactive where DOM was rapidly transformed, boosting its remineralisation as discussed by previous studies (e.g., Hansen et al., 2016; Lawson et al., 2014; Rickard et al., 2022; Vähätalo & Wetzel, 2004) while simultaneously acting as a slow physical conveyor belt for PIC.
Our research demonstrates that sea ice plays essential roles in shaping the carbon cycle in Kongsfjorden by the introduction of specific DOC rich in nitrogenous compounds likely through a mixture of sea ice and glacial melt as shown by the specific absorption characteristics found by the Gaussian decomposition (Figure 9), high aCDOM275 (Figure 4a), and TPC (PIC dominated) (Figure 5b). This contribution is not unique in its chemical nature; the TPC: DOC ratio within our sea ice samples averaged 4.8, indicating a system dominated by particulate matter (Appendix 6). This is more than 10 times higher than the average ratio in the ambient surface water (0.42), providing quantitative evidence that sea ice delivers particle-rich material (D'Angelo et al., 2018). It is important to highlight that most of the glacial meltwater in Kongsfjorden has been observed to be subglacial, as registered by How et al. (2017). As sea ice melts and glacial plumes are released, they deliver mixed autochthonous and allochthonous materials in the form of TPC and unique CDOM absorbing components (Table 6; Figure 9). OM is rapidly transformed by photodegradation on the surface and microbial degradation below surface depths, driving the remineralisation of carbon and nutrients, which fuel microbial communities. The latter was further evidenced by characteristics suggesting microbial recycling loop: processes driven by sea ice melt facilitate the availability of labile DOC and contribute to DIC and CO2 production, which is then cycled back into the atmosphere or reincorporated into the marine carbon pool (Lønborg et al., 2020).
As Arctic sea ice continues to decline and glacial meltwater inputs increase (Parkinson and DiGirolamo, 2021), the dynamics of CDOM and carbon cycling in fjords like Kongsfjorden will likely shift (Logvinova et al., 2016). Our study contributes to this understanding by demonstrating that these freshwater inputs deliver two distinct and decoupled carbon pools: a biologically reactive dissolved organic pool and a particulate inorganic pool. Zhuo-Yi Zhu (2022) showed that the rising melt DOC flux from Svalbard’s marine-terminating glaciers, coupled with its rapid photodegradation in the offshore water column, is turning adjacent fjords into net CO2 sources, results that coincide with the findings in this study. However, our work adds a critical layer of complexity by identifying a co-delivered TPC (dominated by PIC) load that is uncoupled from this biological cycle (non-biogenic), likely from glacial rock flour and/or material trapped in sea ice. Our study contributes to this understanding by highlighting the interconnected roles of sea ice, photodegradation, and microbial activity in the transformation of carbon in Kongsfjorden.
Future research must focus on quantifying the long-term impacts of declining sea ice cover on the complex carbon cycle of Arctic fjords. A key challenge will be to distinguish the fates of the two distinct carbon pools delivered by meltwater. Advanced bio-optical methods, like the CDOM absorbance spectroscopy used in this study, are essential for recognising the relative contributions of photodegradation and microbial degradation to the dissolved organic carbon pool. Simultaneously, these monitoring efforts must also quantify the flux and fate of the often-overlooked particulate inorganic carbon and its role in regional alkalinity budgets. Ultimately, combining traditional biogeochemistry with continuous bio-optical monitoring will be critical for accurately modelling the interplay between these different carbon pathways and predicting the future of carbon fluxes in a rapidly changing Arctic.
5 Conclusions
Our study demonstrates that sea ice and glacial melt drive distinctly and decoupled biogeochemical pathways for carbon in Kongsfjorden. Our results show that the influx of freshwater delivers two fundamentally different carbon packages: a biologically active dissolved organic pool and a non-biogenic particulate inorganic pool. The first of these, the DOC pool, was successfully traced using aCDOM. We identified sea ice as a rich source of nitrogenous organic components, which created hotspots of aCDOM275 at the sea ice–glacier front (Figure 1, KB5G). The subsequent transformation of this DOM was governed by two processes, which we identified using its spectral characteristics. In stratified surface waters, photodegradation broke down HMW (evidenced by low (S275–295 and S350–400) into more bioavailable LMW fractions (higher S275–295 and lower S350–400). Deeper in the water column, microbial degradation was the primary processing mechanism (Figure 4). The statistically significant correlation (R2 = 0.64, p = 0.005) observed between aCDOM(330) and DIC/CO2 (Figure 10) suggests a dominance of the microbial pathway at subsurface waters, leading to significant carbon remineralisation (heterotrophic respiration fuelling CO2 production). However, this positive relationship is counterintuitive for the respiration process (Sulzberger and Durisch-Kaiser, 2009), which would typically show an inverse relationship as CDOM is consumed and DIC is produced. This trend is possibly explained as a signature of meltwater subsidy. The constant injection of meltwater from sea ice and glaciers acts as a continuous, external source of OM-enriched water. The mixing of this enriched meltwater (sea ice and glacial plumes) into the fjord creates a spatial gradient: locations strongly influenced by meltwater are higher in both aCDOM(275) and TPC, as observed in our sea ice cores (DOC and TPC concentrations) (Tables 5, 6) and the identified glacial plume at the inner fjord (Figure 5b). Therefore, the observed positive correlation is not a measure of respiration but rather reflects a signature of how meltwater may feed the concurrent, spatially linked input of OM and DIC/CO2 precursors via meltwater. The TPC pool was found to be generally dominated by PIC. This was suggested by the lack of correlation between PIC and biological indicators (e.g., Figure 10; aCDOM275 and 330, chlorophyll a fluorescence, and nutrients) and its strong relationship with key parameters of the carbonate system, specifically pH and pCO2.
Understanding these decoupled transformations is critical for local and regional carbon budgets. Mistaking the large, chemically controlled PIC pool for biologically active organic carbon would lead to a significant overestimation of the fjord’s role in the biological carbon pump. Accurately predicting the future trajectory of Arctic climate feedbacks, therefore, requires a clear distinction between the separate fates of these dissolved organic and particulate inorganic carbon pools.
Statements
Data availability statement
The datasets and software can be accessed in the following data citation references: Fransson A. and M. Chierici (2024) Kongsfjorden CO2 system and nutrients data in April 2023 [DOI 10.21334/npolar.2024.ac625759] and Aguilar Vega, Ximena; Fransson, Agneta; Chierici, Melissa; Spyrakos, Evangelos; Washbourne, Ian (2025), “Carbon in an Arctic coastal system: sea ice meltwater inputs, organic carbon transformations, and CO2 linkages”, Mendeley Data, V2, doi: 10.17632/xv9ygwtfpr.2. Software for this research included in this paper [Omanović, D., Santinelli, C., Marcinek, S., & Gonnelli, M. (2019). ASFit - An all-inclusive tool for analysis of UV–Vis spectra of coloured dissolved organic matter (CDOM). Computers and Geosciences, 133. https://doi.org/10.1016/j.cageo.2019.104334 at Asfit https://sites.google.com/site/daromasoft/home/asfit), and Ocean Data View [Schlitzer, R. (2014) Ocean Data View] at (https://odv.awi.de/).
Author contributions
XA-V: Conceptualization, Visualization, Investigation, Software, Validation, Funding acquisition, Formal analysis, Writing – review & editing, Project administration, Data curation, Methodology, Writing – original draft, Resources. AF: Funding acquisition, Formal analysis, Investigation, Resources, Validation, Supervision, Data curation, Methodology, Writing – review & editing. MC: Validation, Resources, Funding acquisition, Writing – review & editing, Supervision, Formal analysis, Methodology, Data curation. IW: Writing – review & editing, Validation, Formal analysis. ES: Supervision, Writing – review & editing, Validation, Data curation, Resources.
Funding
The author(s) declare financial support was received for the research and/or publication of this article. This research was possible through the generous support of the SAGES SALTIRE Emerging Researcher Scheme (2023), which funded the project “Implications of glacial organic carbon on the marine net primary production in the most rapidly warming place on Earth: the Svalbard archipelago”, with the grant ID: PO 20315773. The study was also supported by the project CLEAN within the FRAM – High North Research Centre for Climate and the Environment (The Fram Centre).
Acknowledgments
We would like to extend our gratitude to the Sverdrup station in Ny-Ålesund (Norwegian Polar Institute) for providing the necessary infrastructure and logistics that were essential for the success of this study. We are deeply grateful to the Earth Observation group at the University of Stirling for supplying equipment for fieldwork measurements. A special thanks to Sebastian Gerland and Dmitry Divine at the Norwegian Polar Institute for their assistance in sampling sea ice cores for this study. This project is a contribution to the efforts of the Kongsfjorden System flagship.
Conflict of interest
The authors declare that the research was conducted in the absence of any commercial or financial relationships that could be construed as a potential conflict of interest.
Generative AI statement
The author(s) declare that no Generative AI was used in the creation of this manuscript.
Any alternative text (alt text) provided alongside figures in this article has been generated by Frontiers with the support of artificial intelligence and reasonable efforts have been made to ensure accuracy, including review by the authors wherever possible. If you identify any issues, please contact us.
Correction note
This article has been corrected with minor changes. These changes do not impact the scientific content of the article.
Publisher’s note
All claims expressed in this article are solely those of the authors and do not necessarily represent those of their affiliated organizations, or those of the publisher, the editors and the reviewers. Any product that may be evaluated in this article, or claim that may be made by its manufacturer, is not guaranteed or endorsed by the publisher.
References
1
Amon R. M. W. Kaiser K. Engel A. (2024). “ Chapter 15 - Dissolved organic matter in the Arctic Ocean,” in Biogeochemistry of Marine Dissolved Organic Matter (Third Edition), 3rd ed. Eds. HansellD. A.CarlsonC. A. (San Diego, CA, USA: Academic Press), 693–737. doi: 10.1016/B978-0-443-13858-4.00017-4
2
Barber D. G. Hop H. Mundy C. J. Else B. Dmitrenko I. A. Tremblay J.-E. et al . (2015). Selected physical, biological and biogeochemical implications of a rapidly changing Arctic Marginal Ice Zone. Prog. Oceanography139, 122–150. doi: 10.1016/j.pocean.2015.09.003
3
Bélanger S. Xie H. Krotkov N. Larouche P. Vincent W. F. Babin M. (2006). Photomineralization of terrigenous dissolved organic matter in Arctic coastal waters from 1979 to 2003: Interannual variability and implications of climate change. Global Biogeochemical Cycles20. doi: 10.1029/2006GB002708
4
Bhatia M. P. Das S. B. Xu L. Charette M. A. Wadham J. L. Kujawinski E. B. (2013). Organic carbon export from the Greenland ice sheet. Geochimica Cosmochimica Acta109, 329–344. doi: 10.1016/j.gca.2013.02.006
5
Brogi S. R. Ha S. Y. Kim K. Derrien M. Lee Y. K. Hur J. et al . (2018). Optical and molecular characterization of dissolved organic matter (DOM) in the Arctic ice core and the underlying seawater (Cambridge Bay, Canada): Implication for increased autochthonous DOM during ice melting. Science of the Total Environment, 627, 802–811.
6
Cantoni C. Hopwood M. J. Clarke J. S. Chiggiato J. Achterberg E. P. Cozzi S. (2020). Glacial drivers of marine biogeochemistry indicate a future shift to more corrosive conditions in an arctic fjord. J. Geophysical Research: Biogeosciences125, e2020JG005633. doi: 10.1029/2020JG005633
7
Carmack E. C. Yamamoto-Kawai M. Haine T. W. N. Bacon S. Bluhm B. A. Lique C. et al . (2016). Freshwater and its role in the Arctic Marine System: Sources, disposition, storage, export, and physical and biogeochemical consequences in the Arctic and global oceans. In J. Geophysical Research: Biogeosciences121, 675–717. doi: 10.1002/2015JG003140
8
Carreto J. I. Carignan M. O. Montoya N. G. (2005). A high-resolution reverse-phase liquid chromatography method for the analysis of mycosporine-like amino acids (MAAs) in marine organisms. Mar. Biol.146, 237–252. doi: 10.1007/s00227-004-1447-y
9
Castellani G. Veyssière G. Karcher M. Stroeve J. Banas S. N. Bouman A. H. et al . (2022). Shine a light: Under-ice light and its ecological implications in a changing Arctic Ocean. Ambio51, 307–317. doi: 10.1007/s13280-021-01662-3
10
Coble P. G. (2007). Marine optical biogeochemistry: The chemistry of ocean color. Chem. Rev.107, 402–418. doi: 10.1021/cr050350+
11
Cottier F. Tverberg V. Inall M. Svendsen H. Nilsen F. Griffiths C. et al . (2005). Water mass modification in an Arctic fjord through cross-shelf exchange: The seasonal hydrography of Kongsfjorden, Svalbard. Journal of Geophysical Research: Oceans, 110(C12).
12
Cottier F. R. Nilsen F. Enall M. E. Gerland S. Tverberg V. Svendsen H. (2007). Wintertime warming of an Arctic shelf in response to large-scale atmospheric circulation. Geophysical Res. Lett.34. doi: 10.1029/2007GL029948
13
D'Angelo A. Giglio F. Miserocchi S. Sanchez-Vidal A. Aliani S. Tesi T. et al . (2018). Multi-year particle fluxes in Kongsfjorden, Svalbard. Biogeosciences15, 5343–5363. doi: 10.5194/bg-15-5343-2018
14
Darlington E. F . (2015). Meltwater delivery from the tidewater glacier Kronebreen to Kongsfjorden, Svalbard; insights from in-situ and remote-sensing analyses of sediment plumes ( Doctoral dissertation, Loughborough University).
15
Del Vecchio R. Blough N. V. (2002). Photobleaching of chromophoric dissolved organic matter in natural waters: kinetics and modeling. Marine chemistry, 78(4), 231–253.
16
Dickson A. G. Andrew G. Sabine C. L. Christian J. R. North Pacific Marine Science Organization (2007). Guide to best practices for ocean CO2 measurements (Sidney, Canada: North Pacific Marine Science Organization).
17
Everett A. Kohler J. Sundfjord A. Kovacs K. M. Torsvik T. Pramanik A. et al . (2018). Subglacial discharge plume behaviour revealed by CTD-instrumented ringed seals. Scientific reports, 8(1), 13467.
18
Fichot C. G. Benner R . (2012). The spectral slope coefficient of chromophoric dissolved organic matter (S275–295) as a tracer of terrigenous dissolved organic carbon in river-influenced ocean margins. Limnology and oceanography, 57(5), 1453–1466.
19
Dickson A. G. Millero F. J. (1987). A comparison of the equilibrium constants for the dissociation of carbonic acid in seawater media. Deep Sea Res. Part A. Oceanographic Res. Papers34, 1733–1743. doi: 10.1016/0198-0149(87)90021-5
20
Forwick M. Vorren T. O. Hald M. Korsun S. Roh Y. Vogt C. et al . (2010). Spatial and temporal influence of glaciers and rivers on the sedimentary environment in Sassenfjorden and Tempelfjorden, Spitsbergen. Geol. Soc. Spec. Publ. doi: 10.1144/SP344.13
21
Fransson A. Chierici M. Hop H. Findlay H. S. Kristiansen S. Wold A. (2016). Late winter-to- summer change in ocean acidification state in Kongsfjorden, with implications for calcifying organisms. Polar Biol.39(10), 1841–1857. doi: 10.1007/s00300-016-1955-5
22
Fransson A. Chierici M. Nomura D. Granskog M. A. Kristiansen S. Martma T. et al . (2015). Effect of glacial drainage water on the CO2 system and ocean acidification state in an Arctic tidewater-glacier fjord during two contrasting years. J. Geophysical Research: Oceans120, 2413–2429. doi: 10.1002/2014JC010320
23
Fransson A. Chierici M. Nomura D. Granskog M. A. Kristiansen S. Martma T. et al . (2020). Influence of glacial water and carbonate minerals on wintertime sea ice biogeochemistry and the CO2 system in an Arctic fjord in Svalbard. Ann. Glaciology61, 320–340. doi: 10.1017/aog.2020.52
24
Görlich K. (1986). “ Glacimarine sedimentation of muds in Hornsund fjord, Spitsbergen,” in Annales Societatis Geologorum Poloniae. 56, 433–477.
25
Granskog M. A. Kaartokallio H. Thomas D. N. Kuosa H. (2005). Influence of freshwater inflow on the inorganic nutrient and dissolved organic matter within coastal sea ice and underlying waters in the Gulf of Finland (Baltic Sea). Estuarine Coast. Shelf Sci.65, 109–122. doi: 10.1016/j.ecss.2005.05.011
26
Granskog M. A. Pavlov A. K. Sagan S. Kowalczuk P. Raczkowska A. Stedmon C. A. (2015). Effect of sea ice melt on inherent optical properties and vertical distribution of solar radiant heating in Arctic surface waters. J. Geophysical Research: Oceans120, 7028–7039. doi: 10.1002/2015JC011087
27
Grasshoff K. Kremling K. Ehrhardt M . (Eds.). (2009). Methods of seawater analysis. John Wiley & Sons.
28
Gundersen K. Møgster J. S. Lien V. S. Ershova E. Lunde L. F. Arnesen H. et al . (2022). Thirty years of nutrient biogeochemistry in the barents sea and the adjoining arctic ocean 1990–2019. Scientific Data9, 649. doi: 10.1038/s41597-022-01781-w
29
Halbach L. Vihtakari M. Duarte P. Everett A. Granskog M. A. Hop H. et al . (2019). Tidewater glaciers and bedrock characteristics control the phytoplankton growth environment in a fjord in the arctic. Front. Mar. Sci.6. doi: 10.3389/fmars.2019.00254
30
Han D. Son M. Eom K. H. Park Y. T. Choi M. Kim J. et al . (2022). Distribution of dissolved organic carbon linked to bacterial community composition during the summer melting season in Arctic fjords. Polar Biol.45, 331–343. doi: 10.1007/s00300-021-02995-1
31
Hansen A. M. Kraus T. E. C. Pellerin B. A. Fleck J. A. Downing B. D. Bergamaschi B. A. (2016). Optical properties of dissolved organic matter (DOM): Effects of biological and photolytic degradation. Limnology Oceanography61, 1015–1032. doi: 10.1002/lno.10270
32
Helms J. R. Stubbins A. Ritchie J. D. Minor E. C. Kieber D. J. Mopper K. (2008). Absorption spectral slopes and slope ratios as indicators of molecular weight, source, and photobleaching of chromophoric dissolved organic matter. Limnology Oceanography53, 955–969. doi: 10.4319/lo.2008.53.3.0955
33
Hill V. J. Zimmerman R. C . (2016). Characteristics of colored dissolved organic material in first year landfast sea ice and the underlying water column in the Canadian Arctic in the early spring. Marine Chemistry, 180, 1–13.
34
Holmes F. A. van Dongen E. Noormets R. Pętlicki M. Kirchner N . (2023). Impact of tides on calving patterns at Kronebreen, Svalbard–insights from three-dimensional ice dynamical modelling. The Cryosphere, 17(5), 1853–1872.
35
Hood E. Battin T. J. Fellman J. O’neel S. Spencer R. G. M. (2015). Storage and release of organic carbon from glaciers and ice sheets. Nat. Geosci.8, 91–96. doi: 10.1038/ngeo2331
36
Hood E. Fellman J. Spencer R. G. M. Hernes P. J. Edwards R. Damore D. et al . (2009). Glaciers as a source of ancient and labile organic matter to the marine environment. Nature462, 1044–1047. doi: 10.1038/nature08580
37
Hopwood M. J. Carroll D. Dunse T. Hodson A. Holding J. M. Iriarte J. L. et al . (2019). Review Article: How does glacier discharge affect marine biogeochemistry and primary production in the Arctic? Cryosphere Discussions, 1–51. doi: 10.5194/tc-2019-136
38
How P. Benn D. I. Hulton N. R. Hubbard B. Luckman A. Sevestre H. et al . (2017). Rapidly changing subglacial hydrological pathways at a tidewater glacier revealed through simultaneous observations of water pressure, supraglacial lakes, meltwater plumes and surface velocities. Cryosphere11, 2691–2710. doi: 10.5194/tc-11-2691-2017
39
Johnson K. M. King A. E. Sieburth J. M. (1985). Coulometric TCO2 analyses for marine studies; an introduction. Mar. Chem.16, 61–82. doi: 10.1016/0304-4203(85)90028-3
40
Khoo C. L. L. Sipler R. E. Fudge A. R. Beheshti Foroutani M. Boyd S. G. Ziegler S. E. (2022). Salt- induced flocculation of dissolved organic matter and iron is controlled by their concentration and ratio in boreal coastal systems. J. Geophysical Research: Biogeosciences127, e2022JG006844. doi: 10.1029/2022JG006844
41
Kohler J. James T. D. Murray T. Nuth C. Brandt O. Barrand N. E. et al . (2007). Acceleration in thinning rate on western Svalbard glaciers. Geophysical Res. Lett.34. doi: 10.1029/2007GL030681
42
Köhler H. Meon B. Gordeev V. V. Spitzy A. Amon R. M. (2003). “ Dissolved organic matter (DOM) in the estuaries of Ob and Yenisei and the adjacent Kara Sea, Russia,” in Proceedings in Marine Science, vol. 6. ( Elsevier, Amsterdam), 281–310.
43
Koziorowska K. Kuliński K. Pempkowiak J. (2017). Distribution and origin of inorganic and organic carbon in the sediments of Kongsfjorden, Northwest Spitsbergen, European Arctic. Continental Shelf Res.150, 27–35. doi: 10.1016/j.csr.2017.08.023
44
Lawson E. C. Wadham J. L. Tranter M. Stibal M. Lis G. P. Butler C. E. H. et al . (2014). Greenland ice sheet exports labile organic carbon to the arctic oceans. Biogeosciences11, 4015–4028. doi: 10.5194/bg-11-4015-2014
45
Lee K. Lee C.-H. Lee J.-H. Han I.-S. Kim M. (2019). Deviation of boron concentration from predictions using salinity in coastal environments. Geophysical Res. Lett.46, 4809–4815. doi: 10.1029/2019GL082520
46
Lee H. S. Hur J. Shin H. S . (2021). Dynamic exchange between particulate and dissolved matter following sequential resuspension of particles from an urban watershed under photo-irradiation. Environmental Pollution, 283, 117395.
47
Logvinova C. L. Frey K. E. Mann P. J. Stubbins A. Spencer R. G . (2015). Assessing the potential impacts of declining Arctic sea ice cover on the photochemical degradation of dissolved organic matter in the Chukchi and Beaufort Seas. Journal of Geophysical Research: Biogeosciences, 120(11), 2326–2344.
48
Logvinova C. L. Frey K. E. Cooper L. W. (2016). The potential role of sea ice melt in the distribution of chromophoric dissolved organic matter in the Chukchi and Beaufort Seas. Deep-Sea Res. Part II: Topical Stud. Oceanography130, 28–42. doi: 10.1016/j.dsr2.2016.04.017
49
Lønborg C. Carreira C. Jickells T. Álvarez-Salgado X. A. (2020). Impacts of global change on ocean dissolved organic carbon (DOC) cycling. Front. Mar. Sci.7. doi: 10.3389/fmars.2020.00466
50
Lund-Hansen L. C. Dahllöf I. Nielsen M. H. (2023). A fjord with a land-terminating glacier: Meltwater, bio-optics, particulate matter, nutrients, phytoplankton species, and primary production in west Greenland. Regional Stud. Mar. Sci.64, 103054. doi: 10.1016/j.rsma.2023.103054
51
Massicotte P. Markager S. (2016). Using a Gaussian decomposition approach to model absorption spectra of chromophoric dissolved organic matter. Mar. Chem.180, 24–32. doi: 10.1016/j.marchem.2016.01.008
52
Matsuoka A. Bricaud A. Benner R. Para J. Sempéré R. Prieur L. et al . (2012). Tracing the transport of colored dissolved organic matter in water masses of the Southern Beaufort Sea: relationship with hydrographic characteristics. Biogeosciences9, 925–940. doi: 10.5194/bg-9-925-2012
53
Matsuoka A. Ortega-Retuerta E. Bricaud A. Arrigo K. R. Babin M . (2015). Characteristics of colored dissolved organic matter (CDOM) in the Western Arctic Ocean: Relationships with microbial activities. Deep Sea Research Part II: Topical Studies in Oceanography, 118, 44–52.
54
McCutcheon J. Lutz S. Williamson C. Cook J. M. Tedstone A. J. Vanderstraeten A. et al . (2021). Mineral phosphorus drives glacier algal blooms on the Greenland Ice Sheet. Nat. Commun.12, 570. doi: 10.1038/s41467-020-20627-w
55
Mehrbach C. Culberson C. H. Hawley J. E. Pytkowicx R. M . Measurement Of The Apparent Dissociation Constants Of Carbonic Acid In Seawater At Atmospheric Pressure1. Limnol. Oceanogr.18, 897–907.
56
Meiners K. M. Michel C. (2017). “ Dynamics of nutrients, dissolved organic matter and exopolymers in sea ice,” in Sea Ice. Chichester, UK: Wiley-Blackwell. doi: 10.1002/9781118778371.ch17
57
Meire L. Meire P. Struyf E. Krawczyk D. W. Arendt K. E. Yde J. C. et al . (2016). High export of dissolved silica from the Greenland Ice Sheet. Geophysical Res. Lett.43, 9173–9182. doi: 10.1002/2016GL070191
58
Milner A. M. Khamis K. Battin T. J. Brittain J. E. Barrand N. E. Füreder L. et al . (2017). Glacier shrinkage driving global changes in downstream systems. Proc. Natl. Acad. Sci. United States America114, 9770–9778. doi: 10.1073/pnas.1619807114
59
Millero F. J. Graham T. B. Huang F. Bustos-Serrano H. Pierrot D . (2006). Dissociation constants of carbonic acid in seawater as a function of salinity and temperature. Marine Chemistry, 100(1-2), 80–94.
60
Mopper K. Kieber D. J. Stubbins A. (2015). “ Marine Photochemistry of Organic Matter: Processes and Impacts. Processes and Impacts,” in Biogeochemistry of Marine Dissolved Organic Matter, 2nd ed. (London, England: Elsevier Inc), 389–450. doi: 10.1016/B978-0-12-405940-5.00008-X
61
Moran M. A. Sheldon W. M. Zepp R. G . (2000). Carbon loss and optical property changes during long-term photochemical and biological degradation of estuarine dissolved organic matter. Limnology and Oceanography, 45(6), 1254–1264.
62
Moran M. A. Ferrer-González F. X. Fu H. Nowinski B. Olofsson M. Powers M. A. et al . (2022). “ The Ocean’s labile DOC supply chain,” in Limnology and Oceanography, vol. 67. (Chichester, UK: John Wiley and Sons Inc), 1007–1021. doi: 10.1002/lno.12053
63
Mundy C. J. Meiners K. M. (2021). “ Ecology of Arctic Sea Ice,” in Arctic Ecology, Chichester, UK: Wiley-Blackwell261–288. doi: 10.1002/9781118846582.ch10
64
Musilova M. Tranter M. Wadham J. Telling J. Tedstone A. Anesio A. M. (2017). Microbially driven export of labile organic carbon from the Greenland ice sheet. Nat. Geosci.10, 360–365. doi: 10.1038/ngeo2920
65
Nebbioso A. Piccolo A. (2013). “ Molecular characterization of dissolved organic matter (DOM): A critical review,” in Analytical and Bioanalytical Chemistry. Heidelberg, Germany: Spring Nature405, 109–124. doi: 10.1007/s00216-012-6363-2
66
Norman L. Thomas D. N. Stedmon C. A. Granskog M. A. Papadimitriou S. Krapp R. H. et al . (2011). The characteristics of dissolved organic matter (DOM) and chromophoric dissolved organic matter (CDOM) in Antarctic sea ice. Deep-Sea Res. Part II: Topical Stud. Oceanography58, 1075–1091. doi: 10.1016/j.dsr2.2010.10.030
67
Novak M. G. Mannino A. Clark J. B. Hernes P. Tzortziou M. Spencer R. G. M. et al . (2022). Arctic biogeochemical and optical properties of dissolved organic matter across river to sea gradients. Front. Mar. Sci.9. doi: 10.3389/fmars.2022.949034
68
Omanović D. Santinelli C. Marcinek S. Gonnelli M. (2019). ASFit - An all-inclusive tool for analysis of UV–Vis spectra of colored dissolved organic matter (CDOM). Comput. Geosciences133, 104334. doi: 10.1016/j.cageo.2019.104334
69
Osburn C. L. Stedmon C. A. (2011). Linking the chemical and optical properties of dissolved organic matter in the Baltic-North Sea transition zone to differentiate three allochthonous inputs. Mar. Chem.126, 281–294. doi: 10.1016/j.marchem.2011.06.007
70
Parkinson C. L. DiGirolamo N. E. (2021). Sea ice extents continue to set new records: Arctic, Antarctic, and global results. Remote Sens. Environ.267, 112753. doi: 10.1016/J.RSE.2021.112753
71
Pavlov A. K. Leu E. Hanelt D. Bartsch I. Karsten U. Hudson S. R. et al . (2019). “ The Underwater Light Climate in Kongsfjorden and Its Ecological Implications,” in The Ecosystem of Kongsfjorden, Svalbard. Advances in Polar Ecology, vol. 2 . Eds. HopH.WienckeC. ( Springer, Cham). doi: 10.1007/978-3-319-46425-1_5
72
Pavlov A. K. Silyakova A. Granskog M. A. Bellerby R. G. J. Engel A. Schulz K. G. et al . (2014). Marine CDOM accumulation during a coastal Arctic mesocosm experiment: No response to elevated pCO2 levels. J. Geophysical Research: Biogeosciences119, 1216–1230. doi: 10.1002/2013JG002587
73
Pelikan C. Jaussi M. Wasmund K. Seidenkrantz M. S. Pearce C. Kuzyk Z. Z. A. et al . (2019). Glacial runoff; Promotes deep burial of sulfur cycling- associated microorganisms in marine sediments. Front. Microbiol.10. doi: 10.3389/fmicb.2019.02558
74
Piontek J. Galgani L. Nöthig E.-M. Peeken I. Engel A. (2021). Organic matter composition and heterotrophic bacterial activity at declining summer sea ice in the central Arctic Ocean. Limnol Oceanogr66, S343–S362. doi: 10.1002/lno.11639
75
Piquet A. M. T. Van De Poll W. H. Visser R. J. W. Wiencke C. Bolhuis H. Buma A. G. J. (2014). Springtime phytoplankton dynamics in Arctic Krossfjorden and Kongsfjorden (Spitsbergen) as a function of glacier proximity. Biogeosciences11, 2263–2279. doi: 10.5194/bg-11-2263-2014
76
Pörtner H. O. Roberts D. C. Masson-Delmotte V. Zhai P. Tignor M. Poloczanska E. Weyer N. M. et al (2019). The ocean and cryosphere in a changing climate. IPCC special report on the ocean and cryosphere in a changing climate. 1155, 10–1017.
77
Retelletti Brogi S. Jung J. Y. Ha S. Y. Hur J. (2019). Seasonal differences in dissolved organic matter properties and sources in an Arctic fjord: Implications for future conditions. Sci. Total Environ.694, 133740. doi: 10.1016/j.scitotenv.2019.133740
78
Rickard P. C. Uher G. Upstill-Goddard R. C. (2022). Photo-reactivity of surfactants in the sea-surface microlayer and subsurface water of the tyne estuary, UK. Geophysical Res. Lett.49, e2021GL095469. doi: 10.1029/2021GL095469
79
Rødven R. Wilson S. (2022). (Research): Combining Knowledge for a Sustainable Arctic – AMAP Cases as Knowledge Driven Science-Policy Interactions.
80
Sandven H. Hamre B. Petit T. Röttgers R. Liu H. Granskog M. A. (2023). Seasonality and drivers of water column optical properties on the northwestern Barents Sea shelf. Prog. Oceanography217, 103076. doi: 10.1016/j.pocean.2023.103076
81
Schellenberger T. Dunse T. Kääb A. Kohler J. Reijmer C. H. (2015). Surface speed and frontal ablation of Kronebreen and Kongsbreen, NW Svalbard, from SAR offset tracking. Cryosphere9, 2339–2355. doi: 10.5194/tc-9-2339-2015
82
Schuler T. V. Kohler J. Elagina N. Hagen J. O. M. Hodson A. J. Jania J. A. et al . (2020). Reconciling svalbard glacier mass balance. Front. Earth Sci.8. doi: 10.3389/feart.2020.00156
83
Seifert M. Hoppema M. Burau C. Elmer C. Friedrichs A. Geuer J. K. et al . (2019). Influence of glacial meltwater on summer biogeochemical cycles in scoresby sund, east Greenland. Front. Mar. Sci.6. doi: 10.3389/fmars.2019.00412
84
Sevestre H. Benn D. I. Hulton N. R. J. Bælum K. (2015). Thermal structure of Svalbard glaciers and implications for thermal switch models of glacier surging. J. Geophysical Research: Earth Surface120, 2220–2236. doi: 10.1002/2015JF003517
85
Serreze M. C. Stroeve J . (2015). Arctic sea ice trends, variability and implications for seasonal ice forecasting. Philosophical Transactions of the Royal Society A: Mathematical, Physical and Engineering Sciences, 373(2045), 20140159.
86
Smith H. J. Foster R. A. McKnight D. M. Lisle J. T. Littmann S. Kuypers M. M. M. et al . (2017). Microbial formation of labile organic carbon in Antarctic glacial environments. Nat. Geosci.10, 356–359. doi: 10.1038/ngeo2925
87
Stedmon C. A. Markager S. Kaas H . (2000). Optical properties and signatures of chromophoric dissolved organic matter (CDOM) in Danish coastal waters. Estuarine, Coastal and Shelf Science, 51(2), 267–278.
88
Stein R. Macdonald R. W. (2004). The Organic Carbon Cycle in the Arctic Ocean. doi: 10.1007/978-3-642-18912-8
89
Streuff K. T. (2013). Landform assemblages in inner Kongsfjorden, Svalbard: evidence of recent glacial (surge) activity. Universitetet i Tromsø.
90
Stubbins A. Hood E. Raymond P. A. Aiken G. R. Sleighter R. L. Hernes P. J. et al . (2012). Anthropogenic aerosols as a source of ancient dissolved organic matter in glaciers. Nat. Geosci.5, 198–201. doi: 10.1038/ngeo1403
91
Sulzberger B. Durisch-Kaiser E. (2009). Chemical characterization of dissolved organic matter (DOM): A prerequisite for understanding UV-induced changes of DOM absorption properties and bioavailability. Aquat. Sci.71, 104–126. doi: 10.1007/s00027-008-8082-5
92
Svendsen H. Beszczynska-Møller A. Hagen J. O. Lefauconnier B. Tverberg V. Gerland S. et al . (2002). The physical environment of Kongsfjorden–Krossfjorden, an Arctic fjord system in Svalbard. Polar Res.21, 133–166. doi: 10.3402/polar.v21i1.6479
93
Torres-Valdés S. Tsubouchi T. Bacon S. Naveira-Garabato A. C. Sanders R. McLaughlin F. A. et al . (2013). Export of nutrients from the arctic ocean. J. Geophysical Research: Oceans118, 1625–1644. doi: 10.1002/jgrc.20063
94
Tuerena R. E. Mahaffey C. Henley S. F. De La Vega C. Norman L. Brand T. et al . (2021). Nutrient pathways and their susceptibility to past and future change in the Eurasian Arctic Ocean. Ambio51, 355–369. doi: 10.1007/s13280-021-01673-0
95
Tverberg V. Skogseth R. Cottier F. Sundfjord A. Walczowski W. Inall M. E. et al . (2019). “ The Kongsfjorden Transect: Seasonal and Inter-annual Variability in Hydrography,” in The Ecosystem of Kongsfjorden, Svalbard. Eds. HopH.WienckeC. (Heidelberg, Germany: Springer International Publishing), 49–104. doi: 10.1007/978-3-319-46425-1_3
96
Tzortziou M. Neale P. J. Osburn C. L. Megonigal J. P. Maie N. Jaffé R. (2008). Tidal marshes as a source of optically and chemically distinctive colored dissolved organic matter in the Chesapeake Bay. Limnology Oceanography53, 148–159. doi: 10.4319/lo.2008.53.1.0148
97
Vähätalo A. V. Wetzel R. G . (2004). Photochemical and microbial decomposition of chromophoric dissolved organic matter during long (months–years) exposures. Marine Chemistry, 89(1-4), 313–326.
98
Wadham J. L. Hawkings J. Tarasov L. Gregoire L. Spencer R. G. M. Gutjahr M. et al . (2019). Why ice sheets matter for the global carbon cycle. Nat. Commun. doi: 10.1038/s41467-019-11394-4
99
Wadham J. L. Tranter M. Skidmore M. Hodson A. J. Priscu J. Lyons W. B. et al . (2010). Biogeochemical weathering under ice: Size matters. Global Biogeochemical Cycles24. doi: 10.1029/2009GB003688
100
Xie H. Aubry C. Zhang Y. Song G. (2014). Chromophoric dissolved organic matter (CDOM) in first- year sea ice in the western Canadian Arctic. Mar. Chem.165, 25–35. doi: 10.1016/j.marchem.2014.07.007
101
Zhao Z. Shi K. Zhang Y. Zhou Y. Qin B. (2024). Increased dominance of terrestrial component in dissolved organic matter in Chinese lakes. Water Res.249, 121019. doi: 10.1016/j.watres.2023.121019
102
Zhu Z. Y . (2022). Clarifying the fate of dissolved organic carbon in turbid glacier meltwater rivers in Svalbard via a series of incubations. Biogeochemistry, 159(3), 337–352.
Summary
Keywords
dissolved organic carbon, total particulate carbon, coloured dissolved organic carbon, sea ice, Fjord, Kongsfjorden
Citation
Aguilar-Vega X, Fransson A, Chierici M, Washbourne I and Spyrakos E (2025) Carbon in an Arctic fjord: sea ice carbon transformations and CO2 linkages. Front. Mar. Sci. 12:1688237. doi: 10.3389/fmars.2025.1688237
Received
18 August 2025
Accepted
28 October 2025
Published
27 November 2025
Corrected
12 February 2026
Volume
12 - 2025
Edited by
Travis Blake Meador, Academy of Sciences of the Czech Republic (ASCR), Czechia
Reviewed by
Katarzyna Koziorowska, Marine Biochemistry Laboratory, Institute of Oceanology (PAS), Poland
Ashok Jagtap, Ministry of Earth Sciences, India
Updates
Copyright
© 2025 Aguilar-Vega, Fransson, Chierici, Washbourne and Spyrakos.
This is an open-access article distributed under the terms of the Creative Commons Attribution License (CC BY). The use, distribution or reproduction in other forums is permitted, provided the original author(s) and the copyright owner(s) are credited and that the original publication in this journal is cited, in accordance with accepted academic practice. No use, distribution or reproduction is permitted which does not comply with these terms.
*Correspondence: Ximena Aguilar-Vega, x.a.aguilar.vega@stir.ac.uk
Disclaimer
All claims expressed in this article are solely those of the authors and do not necessarily represent those of their affiliated organizations, or those of the publisher, the editors and the reviewers. Any product that may be evaluated in this article or claim that may be made by its manufacturer is not guaranteed or endorsed by the publisher.