Abstract
Introduction:
Microorganisms exist and survive in complex and variable environments. Bacteria communities response and adapt to the changing conditions. The Mechanisms underlying bacterial survival can be elucidated through the use of multi-omics techniques.
Methods:
In this study, we test an approach for measuring how different temperatures (4°C, 25°C, and 37°C) affected bacterial physiological functions. Proteomic and metabolomic analyses were conducted on Vibrio parahaemolyticus LF1113 under different temperatures.
Results and discussion:
A total of 2,899 proteins and 396 metabolites were identified. The differentially expressed proteins (DEPs) and differentially metabolites (DMs) were involved in Lysine degradation, metabolic pathways, ABC transporters, and microbial metabolism in diverse environments pathways. An integrated metabolomics/proteomics analysis approach was employed in this study. The analysis of both types of data information (proteins and metabolites) aids to reveal the microbial adaptive regulation in response to temperature stimuli. The study can further help clinical research of V. parahaemolyticus from the perspective of metabolomics and proteomics.
1 Introduction
Microbes live in complex and changeable environments. Bacteria could adapt quickly and efficiently to a variety of challenging environments after long-term evolution. Temperature is a common challenge, requiring bacteria to adapt to fluctuating or extreme temperatures to ensure their survival and colonization. Microbial adaptation to temperature is a key area of focus, involving how bacteria sense, react, and regulate gene expression under stress (Zhang and Gross, 2021). This study focuses on the cold shock response (CSR) of microbes. The CSR is complex and might be associated with unknown mechanisms. Therefore, high-throughput analysis is a powerful method to study the molecular mechanism of cold acclimatization.
New techniques allow in-depth studies. Omics technology provides a more comprehensive and systematic perspective for interpreting biological processes. The growing availability of omics techniques including genomics, transcriptomics, proteomics, and metabolomics facilitates to reveal incomprehensible biological processes, genotypes, phenotypes, and so on, providing an opportunity for the mechanistic interpretation of bacterial response to a complex and variable external environment at the molecular level. Quantitative proteomics could elucidate the function of the microbiota by examining protein abundance in a high-throughput manner. Quantitative mass spectrometry (MS)-based proteomics has emerged as a powerful technique for exploring the biological processes of microorganisms. Recent advancement in protein quantification using tandem mass tags (TMTs) and isobaric tags has significantly enhanced measurement accuracy, precision, and reproducibility (Thompson et al., 2003; Ross et al., 2004). TMT-based MS proteomics is a robust quantitative approach for measuring the relative abundance of proteins across multiple samples. Metabolomics is a technique to quantitatively measure a wide range of metabolites. The metabolism of pathogen must be highly flexible, enabling pathogenic bacteria to efficiently adapt to challenging environments. In recent years, metabolomics has evolved into a powerful technique for microbial metabolism and has helped rebuild the understanding of bacterial metabolism.
The outbreak of vibriosis diseases has threatened aquaculture sustainability and led to economic losses (De Schryver et al., 2014; Stentiford et al., 2017; Baker-Austin et al., 2018; Gu et al., 2021). Vibrio parahaemolyticus is a ubiquitous Gram-negative bacterium found in coastal, marine, and freshwater environments. It can infect a variety of aquatic species, including shrimp, marine fish, oysters, crabs, clams, and mussels (McCarter, 1999; Johnson et al., 2012; Yang et al., 2019), causing diseases such as external hemorrhage and tail rot in Aphanius iberus, white spots on abalone foot, and the acute hepatopancreatic necrosis disease (AHPND) in shrimp (Alcaide et al., 1999; Cai et al., 2007; Imaizumi et al., 2018; Jin et al., 2024). The proteomic profiling of the resuscitated state, the non-culturable (VBNC) state, and the exponential state has been previously reported (Zhong et al., 2019; Yoon et al., 2017).
Groupers are a popular tropical fish species of high economic and nutritional value in aquaculture (Qu et al., 2024). Pearl gentian groupers are widely distributed in China, including provinces such as Fujian, Guangxi, Guangdong, and Hainan (Zhou et al., 2017, 2019; Wu Z, et al., 2022). In a previous study, a novel pathogenic V. parahaemolyticus strain was firstly isolated from a pearl gentian grouper in Hainan, China, revealing genetic and phenotypic characteristics. In this study, three temperatures, namely, 37 °C (optimal culture temperature), 25 °C (environmental temperature), and 4 °C (storage temperature of fresh aquatic product), were selected. The mechanism by which the bacterium overcomes the challenge and adapts to lower temperature was unknown. The objective of this study was to investigate the underlying molecular mechanism under different temperature stresses using proteomic combined metabolomic analyses.
2 Materials and methods
2.1 Bacterial strain and growth conditions
V. parahaemolyticus LF1113 was isolated from infected pearl gentian groupers from a fish factory farm in Hainan (Hu et al., 2024). It was precultured in 2216 liquid medium (Hope Bio, Qingdao, China) at 37 °C (180 rpm). The overnight culture was inoculated to fresh medium at a ratio of 1:100 and shaken at 37 °C and 25 °C, respectively. Then, the culture was transferred to 4 °C for 24 h. The samples at three different culture conditions were named the normal culture temperature group (S37 °C), the environmental temperature group (S25 °C), and the low-temperature treatment group or temperature of fresh aquatic products (S4 °C), respectively. All proteomics and metabolomics samples were collected in the same experimental batch at the identical growth point. To prepare samples for proteomic analysis, strains were pelleted at 5,000×g for 5 min and washed with sterile phosphate-buffered saline (PBS) solution twice. To prepare samples for metabolite analysis, strains were collected at 14,000×g for 4 min when the OD600 reached 1.0.
2.2 Tandem mass tag-based quantitative proteomic analysis
Proteins were extracted using the SDT protein extraction protocol as previously reported (Zhu et al., 2014; Mosier et al., 2015). Concentrations of the protein samples were quantified with the BCA protein assay kit (P0012, Beyotime). Two hundred micrograms of each protein sample was processed using the filter-aided sample preparation method (Wiśniewski et al., 2009). Then, digested peptide samples were labeled by using the TMT reagent according to the manufacturer’s manual (Thermo Fisher Scientific). TMT-labeled peptides were fractionated by RP chromatography with the Agilent 1260 Infinity II LC system (Agilent Technologies USA). The collected fractions were dried via vacuum centrifugation at 45 °C. Fractions of each sample were injected for nano LC-MS/MS analysis. Peptide mixtures were loaded onto a C18 reversed-phase analytical column (Thermo Fisher Scientific, Acclaim PepMap RSLC 50 μm × 15 cm, nano viper, P/N164943) in buffer A (0.1% formic acid) and separated with a linear gradient of buffer B (80% acetonitrile and 0.1% formic acid) at a flow rate of 300 nL/min. LC-MS/MS analysis was performed on a Q Extractive Plus mass spectrometer (Thermo Fisher Scientific). MS/MS spectra were searched by using the MASCOT engine (Matrix Science, London, UK; version 2.6) embedded into Proteome Discoverer 2.1. For each group, in-depth analyses of differentially expressed proteins (DEPs) (FC ≥ 2 or ≤0.05 and p < 0.05), including Gene Ontology (GO) enrichment, Kyoto Encyclopedia of Genes and Genomes (KEGG) enrichment, and cluster analysis, were performed.
2.3 Metabolomic analysis
Each group contains six replicate samples of LF1113 for metabolomic analysis. Metabolites were extracted with 80% methanol as described previously (Turner et al., 2016) and stored at −80 °C prior to LC-MS analysis. Chromatographic separations were performed by using the Ultimate 3000 UPLC system (Thermo Fisher Scientific, Bremen, Germany). The reversed-phase separation was performed by using an ACQUITY UPLC T3 column (100 mm × 2.1 mm, 1.8 μm, Milford Waters, USA). Metabolites eluted from the column were detected by using a high-resolution mass spectrometer Q-Extractive (Thermo Fisher Scientific). The acquired MS data pretreatments including peak picking, peak grouping, retention time correction, second peak grouping, and annotation of isotopes and adducts were performed using the XCMS software.
A quality control sample was acquired after every 10 samples throughout the acquisition process to evaluate the stability of the LC-MS, which was processed by the XCMS (Smith et al., 2006), CMAERA (Kuhl et al., 2012), and metaX toolbox (Wen et al., 2017). The metabolites were annotated by matching the exact molecular mass data (m/z) of all samples using KEGG and the HMDB database [a mass difference between observed and the database value was less than 10 parts per million (ppm)]. The molecular formula of metabolites was further identified and validated by the isotopic distribution measurements. An in-house fragment spectrum library of metabolites was used to validate the metabolite identification. There were three crucial processing steps: first, data filtering to remove samples with missing values exceeding 80% or quality control (QC) samples with missing data exceeding 50%; second, data imputation using the K-nearest neighbor (KNN) method; and last, data normalizaiton via probabilistic quotient normalization (PQN). Cluster heatmaps were generated with the R package pheatmap.
Partial least squares discriminant analysis (PLSDA) was performed using the R package ropls, and the variable importance for the projection (VIP) values for each variable were calculated. The significant differentially expressed metabolites (DEMs) were identified based on the following three criteria: FC≥1.2 or ≤1/1.2, p < 0.05 from t-test, and VIP≥1. The correlation analysis was performed based on the Pearson correlation coefficient (PCC). Gene set enrichment analysis was carried out using GSEA software (v4.1.0) and the Molecular Signatures Database (MSigDB). The network diagram was drawn according to the pathways where the metabolites were located. Six replicates were used for this analysis.
2.4 Statistical analysis
Annotations and classification of the DEGs and DEMs were based on the KEGG. Annotations of the DEPs were based on the GO, KEGG, and MapMan databases. Graphs were analyzed using GraphPad Prism 8.4 (GraphPad, Inc, CA, USA). p < 0.05 was considered to be statistically significant.
3 Results
3.1 TMT-based proteomic analysis
We applied the TMT quantitation technique to analyze proteomic profiles under different temperature conditions. Principal components analysis was conducted to analyze the differences between the proteins affected by V. parahaemolyticus in different temperatures. The scat plot using the first principal component (PC1) and the second principal component (PC2) is shown in Figure 1A. The samples of V. parahaemolyticus were clustered into three distinct groups according to different temperatures. In general, the close clustering of the samples indicated that they were highly similar in terms of protein composition and abundance.
Figure 1
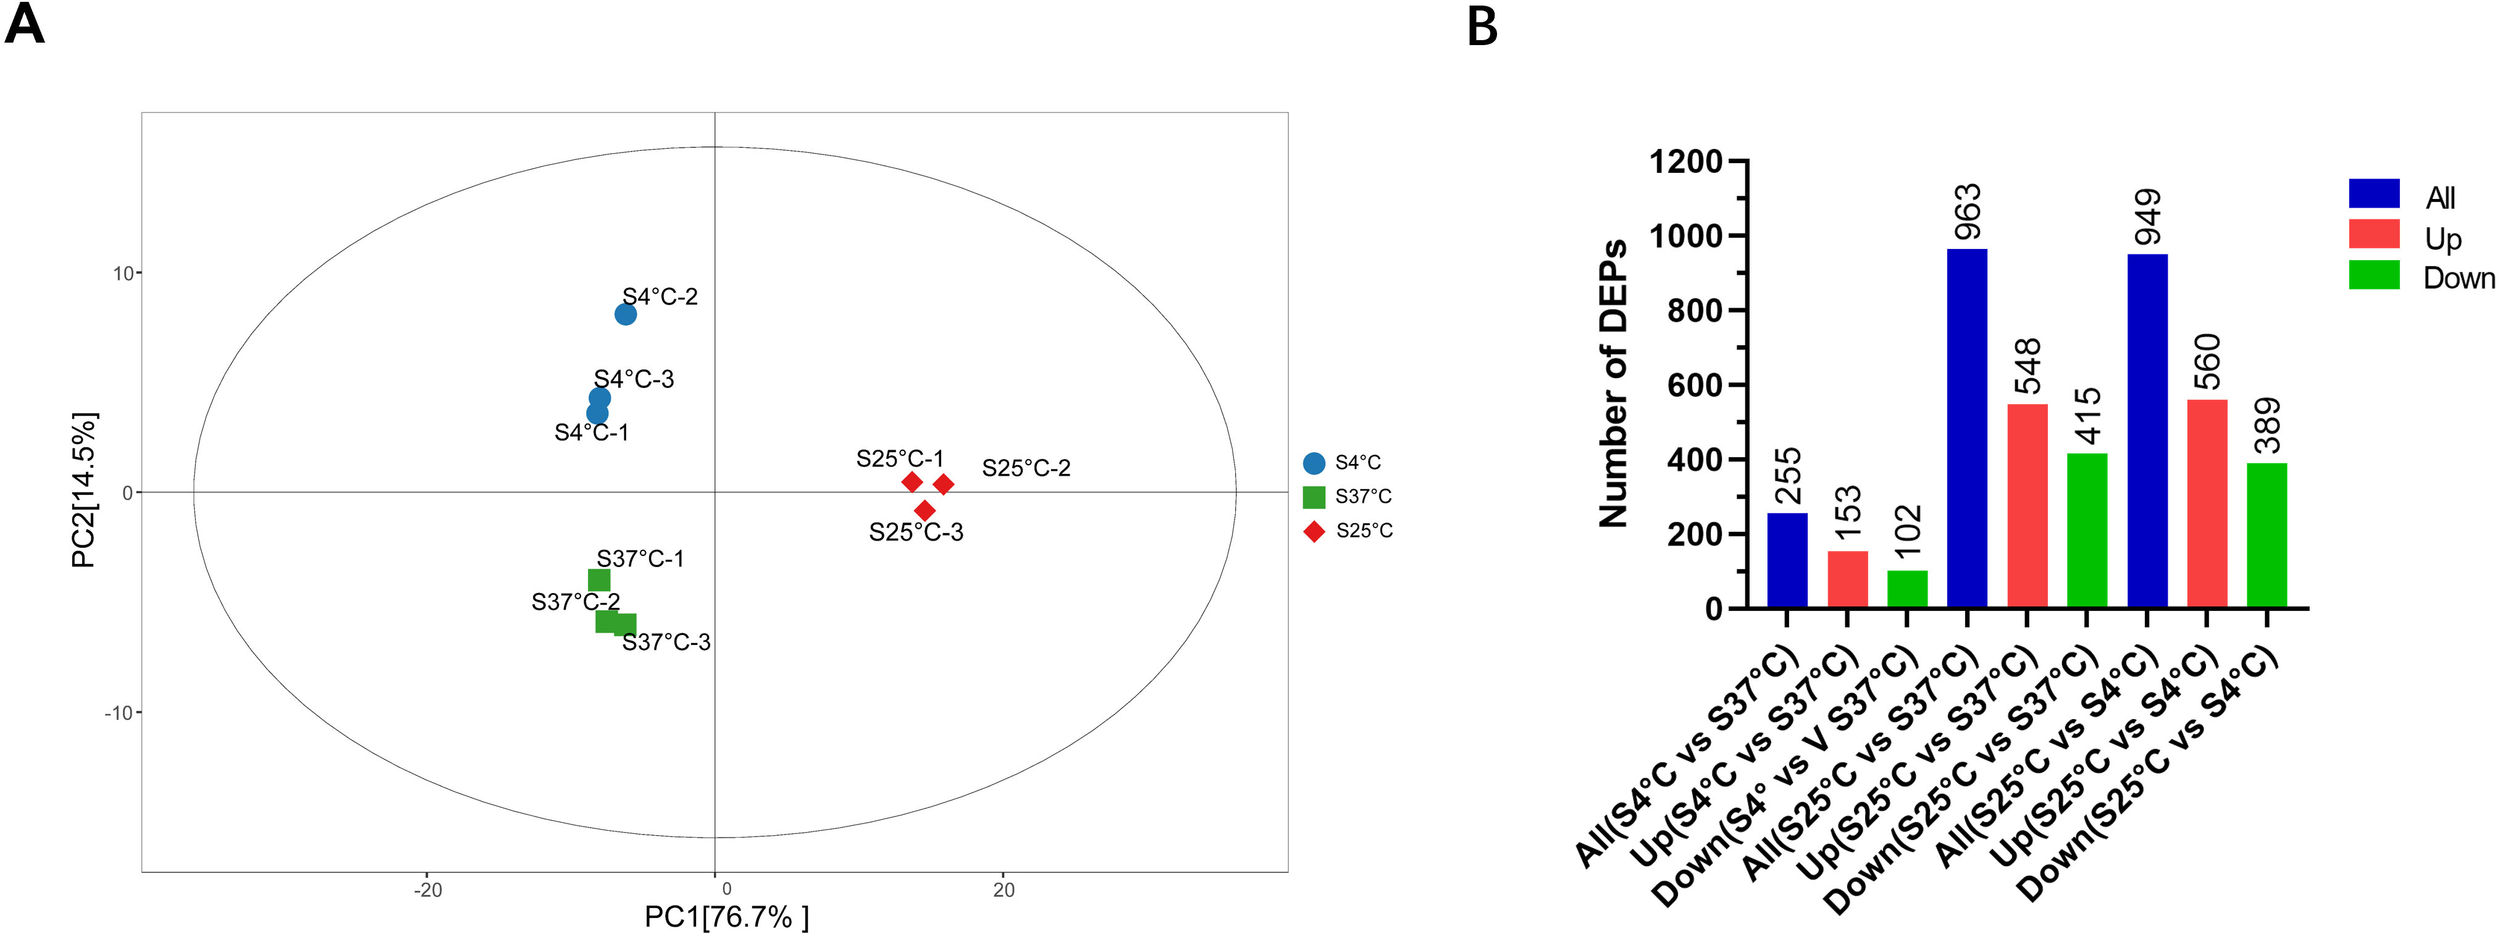
(A) Principal component analysis score scatter plot. First and second PCs from proteins found in V. parahaemolyticus cultured at 37 °C, 25 °C, and 4 °C. (B) Differentially expressed proteins at different culture temperatures in V. parahaemolyticus. The number of proteins was shown in each category.
A total of 2,899 proteins were detected and quantified. Volcano plots of DEPs are shown in Figures 2A–C. Compared with V. parahaemolyticus under normal culture conditions, 963 deregulated proteins were identified in the low-temperature stress-treated group, of which 548 were upregulated and 415 were downregulated (as shown in Figure 1B). When we compared the 25 °C cultivation group with the low-temperature-treated group, a total of 949 deregulated proteins were detected, of which 560 were upregulated and 389 were downregulated. Subcellular localization of all the DEPs is shown in Figures 2D–F. There were 225 DEPs in V. parahaemolyticus at 37 °C cultivation compared with 25 °C cultivation. Subcellular localization was used to determine the location of DEPs in bacterial cells (Yu et al., 2004, 2006). As shown in Figure 2D, of the 225 DEPs, 41.18% were located in the cytoplasm, 34.51% were secreted proteins, 12.16% were located in the cell inner membrane, 7.45% were located in the periplasm, 3.92% were located in the cell outer membrane, and 0.78% were fimbrium.
Figure 2
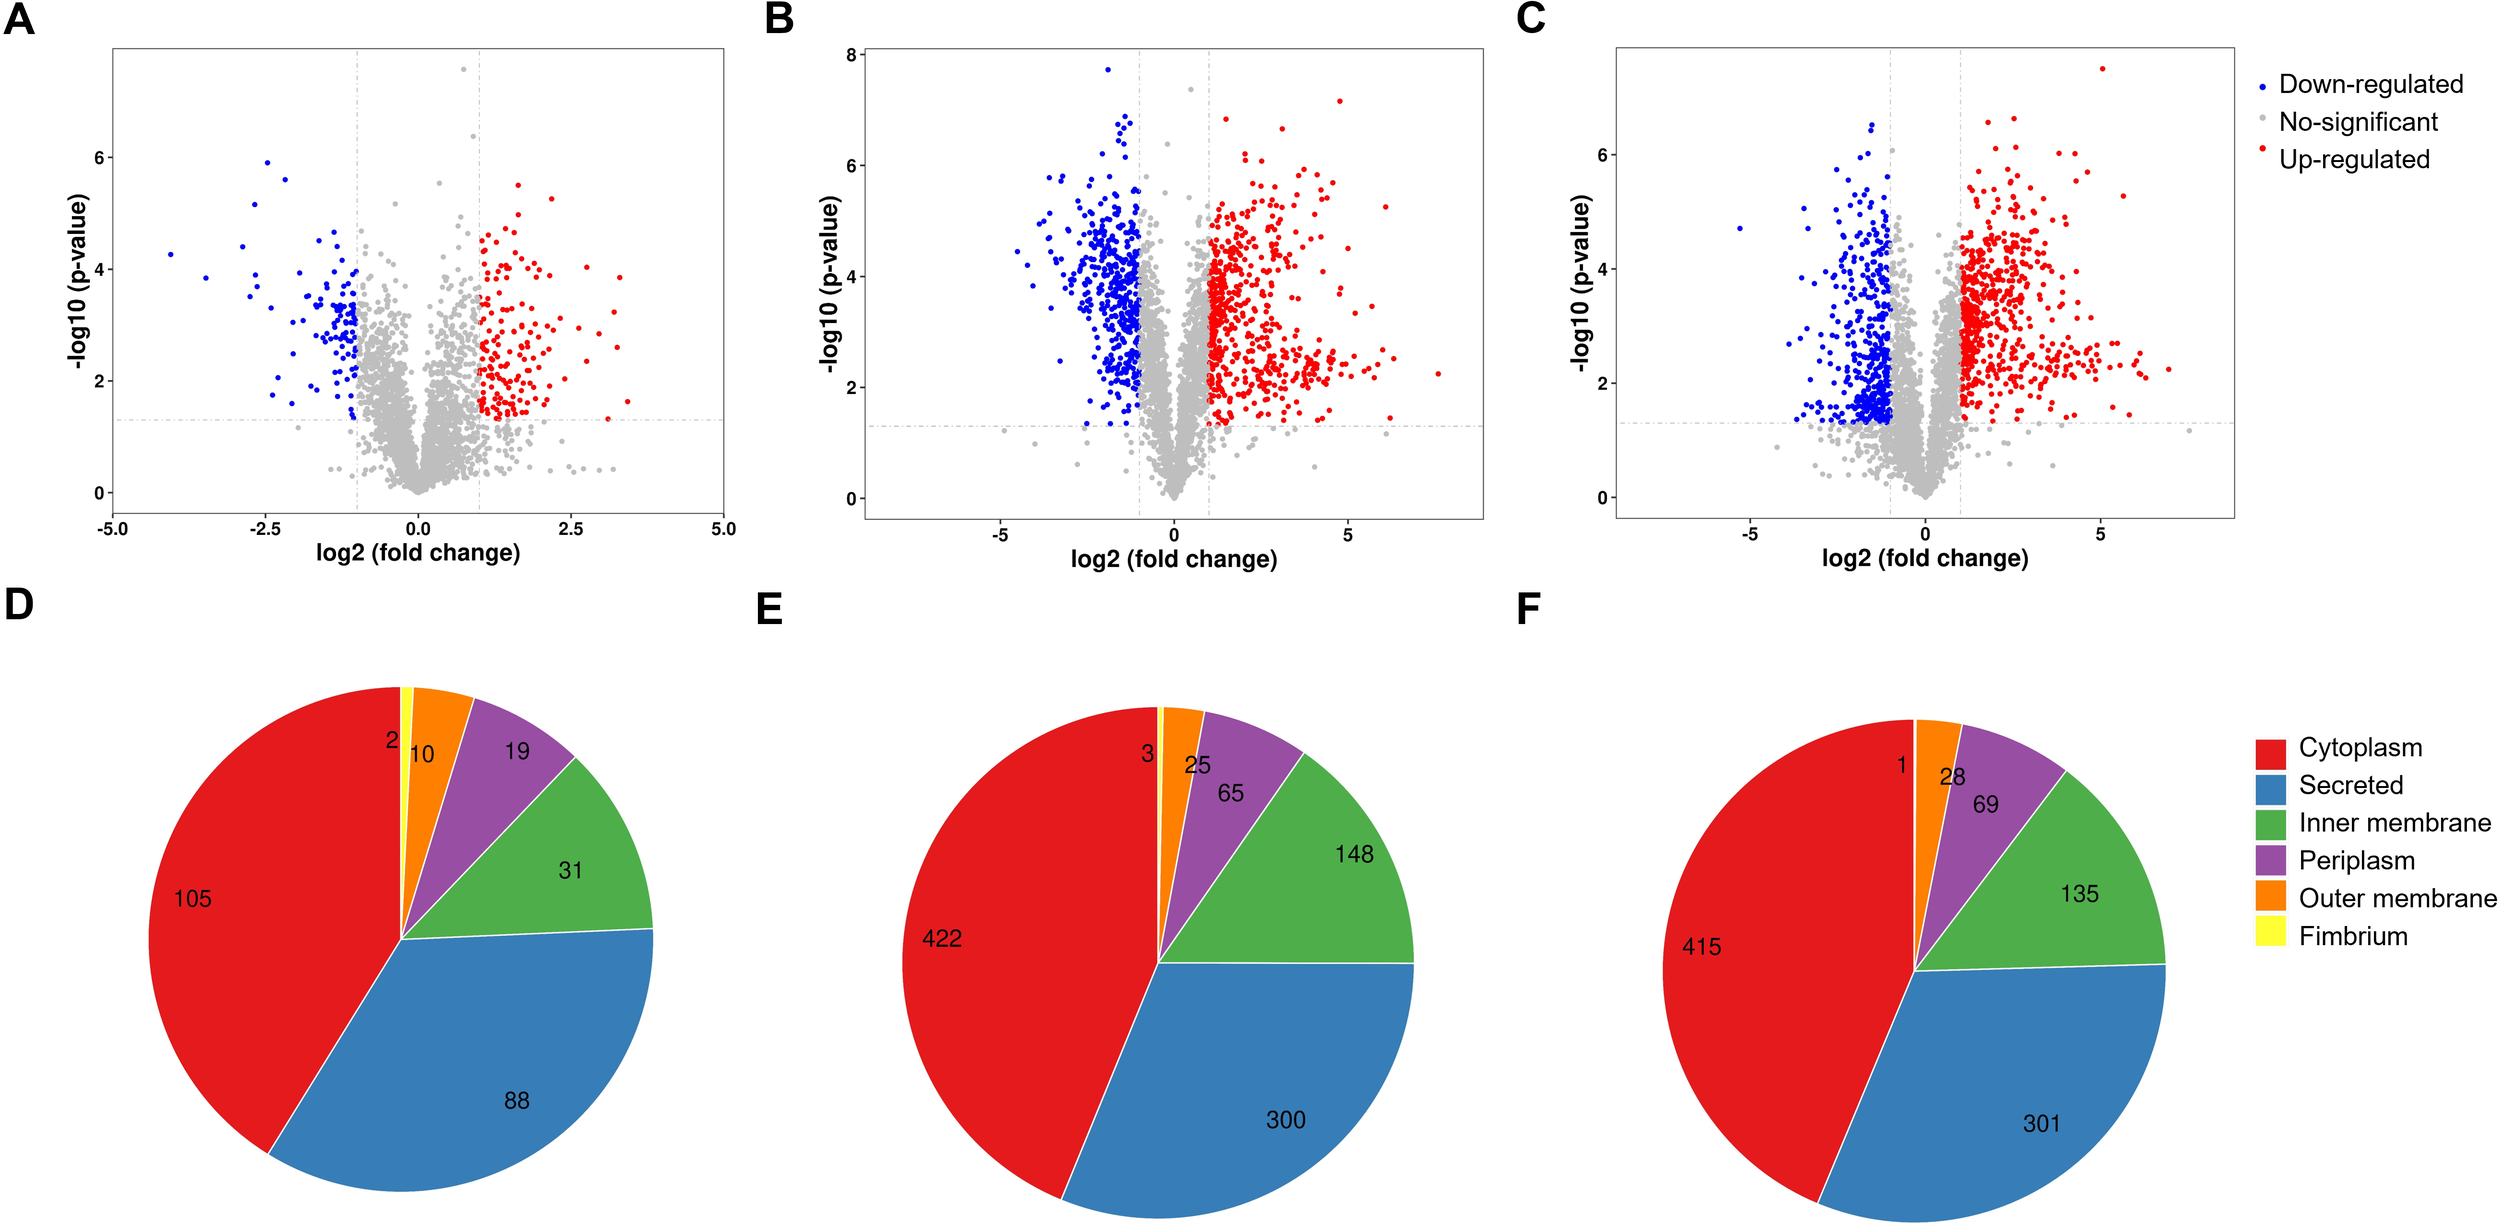
Volcano plot of V. parahaemolyticus under different culture temperatures. (A) Volcano plot of the DEPs between the 37 °C group and the cold-treated group. (B) Volcano plot of the DEPs between the 37 °C group and the 25 °C group. (C) Volcano plot of the DEPs between the 25 °C group and the cold-treated group. (D–F) The pie chart shows the subcellular localization of the DEPs in V. parahaemolyticus at different culture temperatures. (D) The subcellular localization of the DEPs between the 37 °C group and the cold-treated group. (E) The subcellular localization of the DEPs between the 37 °C group and the 25 °C group. (F) The subcellular localization of the DEPs between the 25 °C group and the cold-treated group.
3.2 Functional classification
Overall, 2,861 proteins were categorized into 22 different classes through a cluster of orthologous groups (COG)-based functional analysis (Figure 3). Comparison of V. parahaemolyticus samples grown at 25 °C with samples grown at 37 °C showed that the prevalent functional clusters were amino acid transport and metabolism (12.50%), signal transduction mechanisms (9.89%), inorganic ion transport and catabolism (9.18%), and general function prediction only (8.39%). Comparison of V. parahaemolyticus samples grown at 25 °C with cold-treated samples revealed that the predominant functional clusters were amino acid transport and metabolism (11.53%), signal transduction mechanisms (9.09%), general function prediction only (9.05%), inorganic ion transport and metabolism (8.21%), and energy production and conversion (7.75%). Comparison of V. parahaemolyticus cold-treated samples with samples grown at 37 °C showed that the most common functional clusters were amino acid transport and metabolism (10.12%), signal transduction mechanisms (10.40%), transcription (8.88%), inorganic ion transport and metabolism (8.46%), and general function prediction only (8.32%).
Figure 3
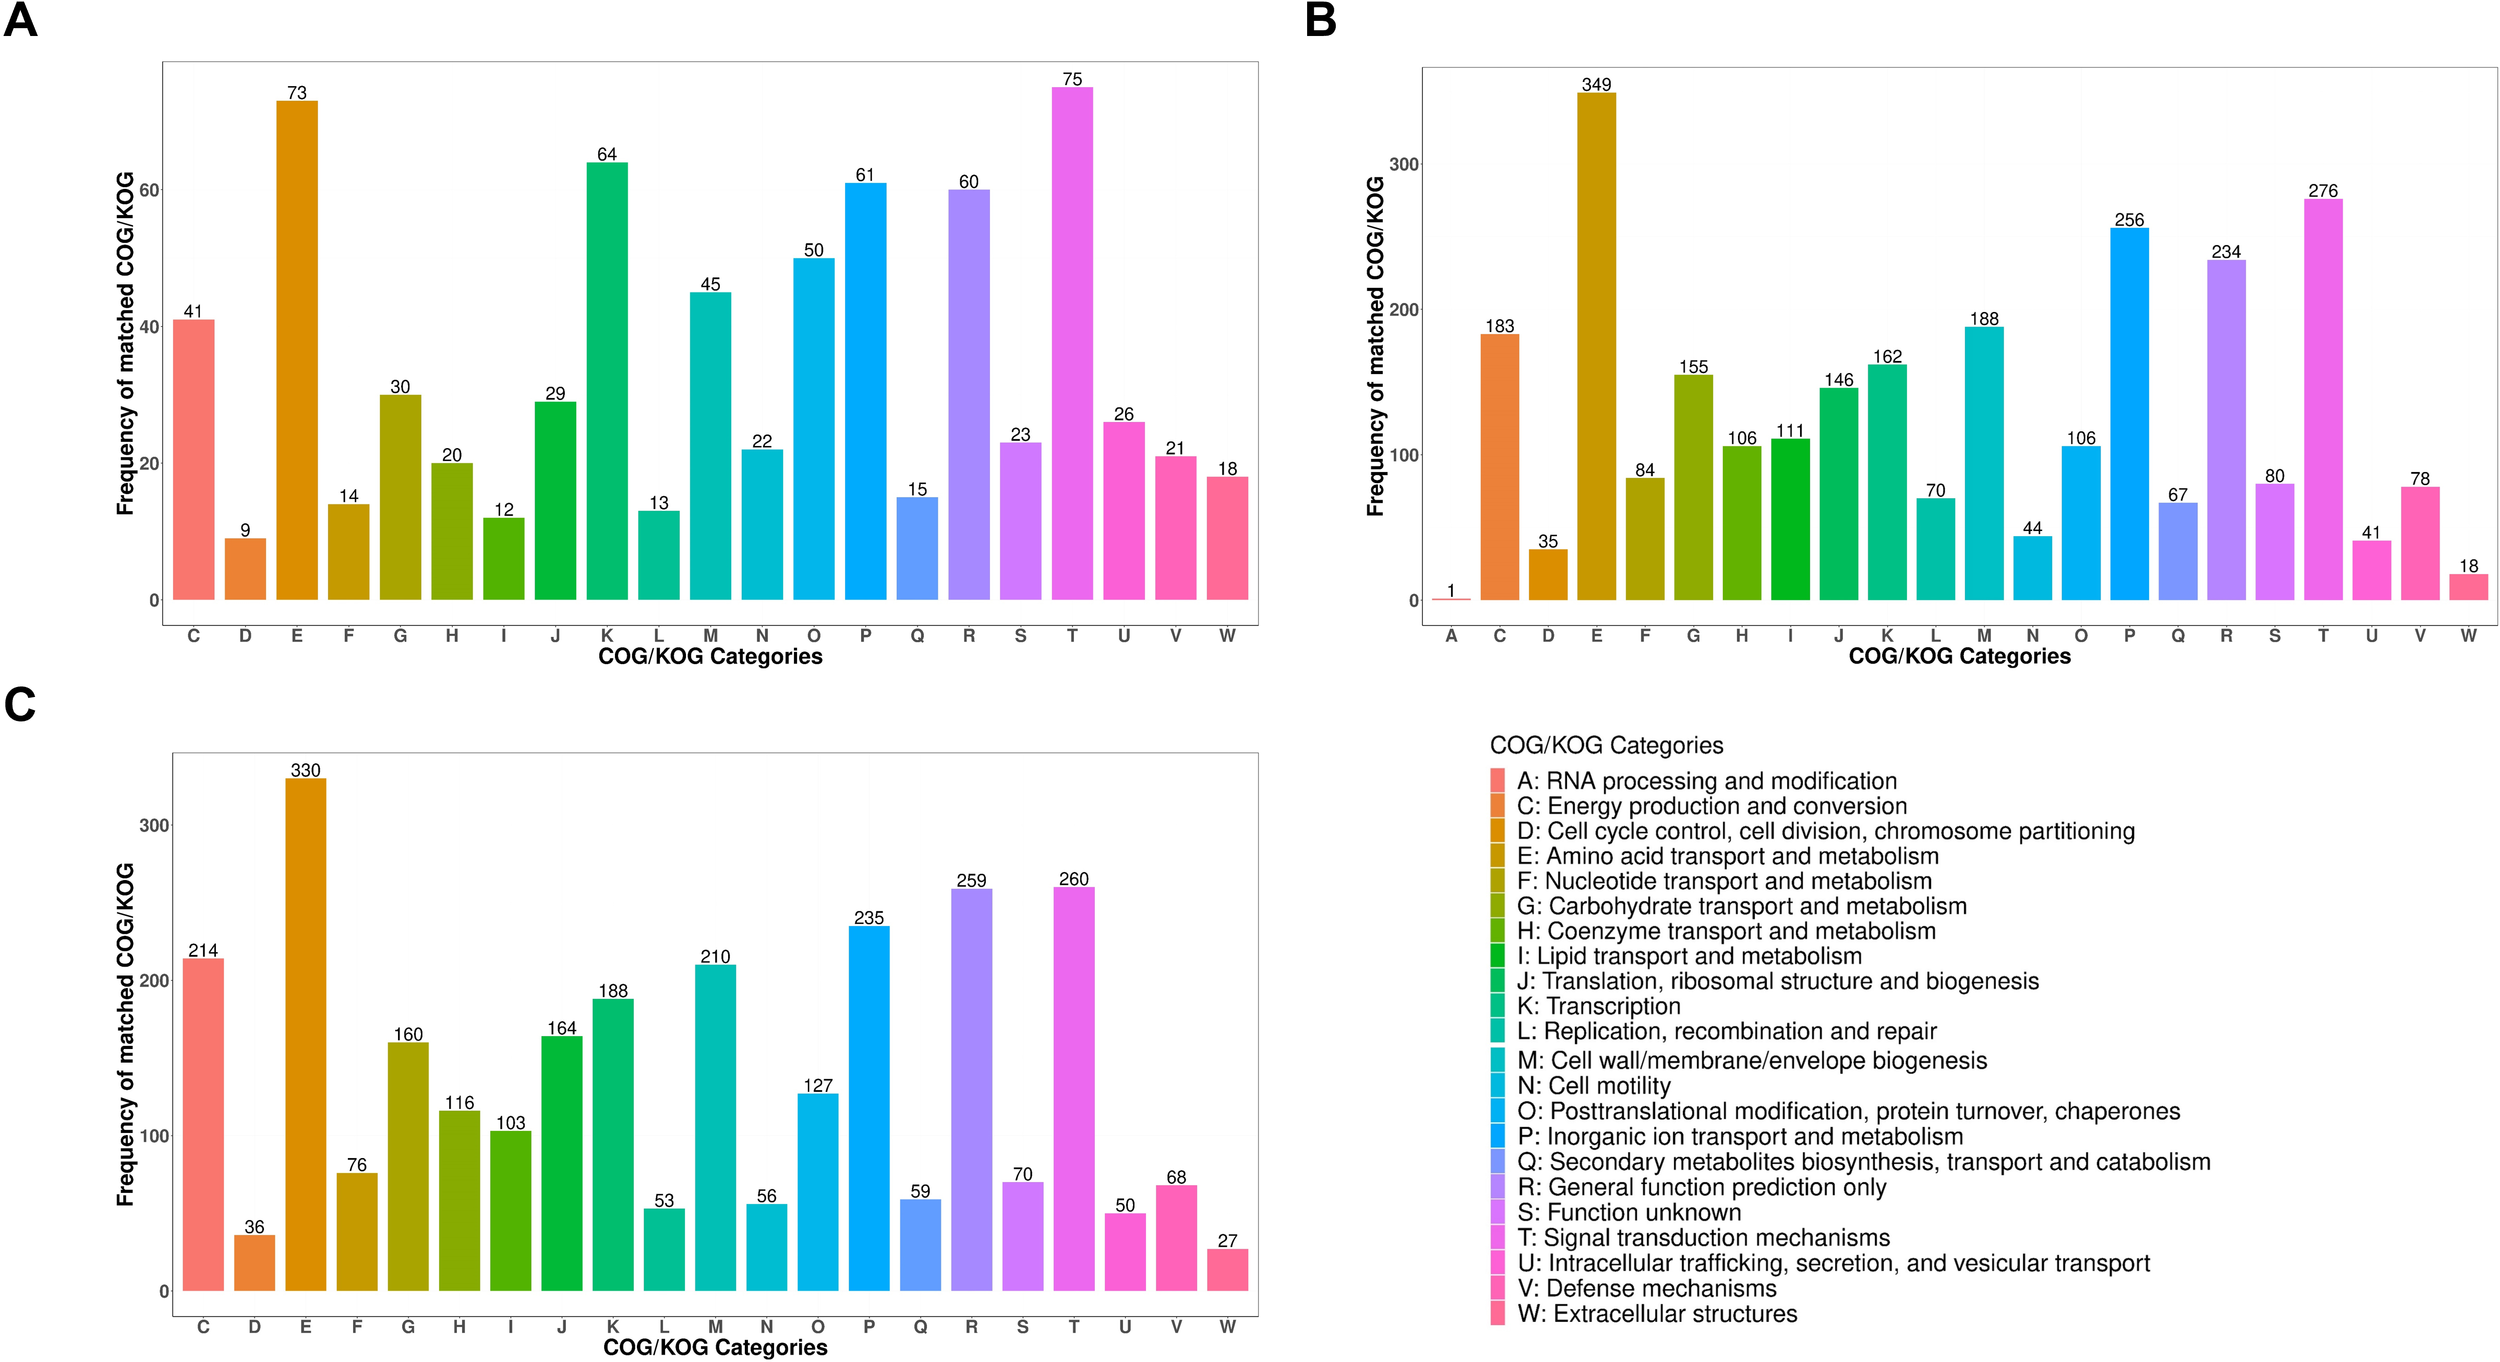
The COG classification. The DEPs were grouped into 22 different categories. (A) COG classification of DEPs between the 37 °C group and the cold-treated group. (B) COG classification of DEPs between the 37 °C group and the 25 °C group. (C) COG classification of DEPs between the 25 °C group and the cold-treated group.
Based on the KEGG pathway enrichment analysis comparing V. parahaemolyticus samples grown at 25°C with the ones grown at 37°C, DEPs were associated with six KEGG pathways, namely, ABC transporters, lysine degradation, starch and sucrose metabolism, phosphotransferase system (PTS), microbial metabolism in diverse environments, and metabolic pathways. ABC transporters was the only pathway that had one downregulated DEP (Supplementary Figure S1A). Comparing V. parahaemolyticus samples grown at 25°C with samples grown at 37°C, DEPs were related to nine KEGG pathways, namely, metabolic pathways, ascorbate and aldarate metabolism, pentose and glucuronate interconversions, lysine degradation, D-amino acid metabolism, starch and sucrose metabolism, phosphotransferase system (PTS), ABC transporters, and microbial metabolism in diverse environments (Supplementary Figure S1B).
3.3 Metabolomic analysis of V. parahaemolyticus LF1113 under different temperature challenges
Metabolomic profiles of V. parahaemolyticus LF1113 at three different temperatures were constructed by using a non-targeted metabolomics technique. A total of 356 metabolites were detected and identified. An orthogonal partial least squares discriminant analysis (OPLS-DA) was performed to remove irrelevant differences between normal and treated groups. Samples from the same group were relatively clustered, indicating good repeatability. Samples from different groups were discrete, indicating obvious differences between groups (Figure 4A). The line of Q2 was consistently lower than that of R2, demonstrating that this model was reliable (Figure 4B).
Figure 4
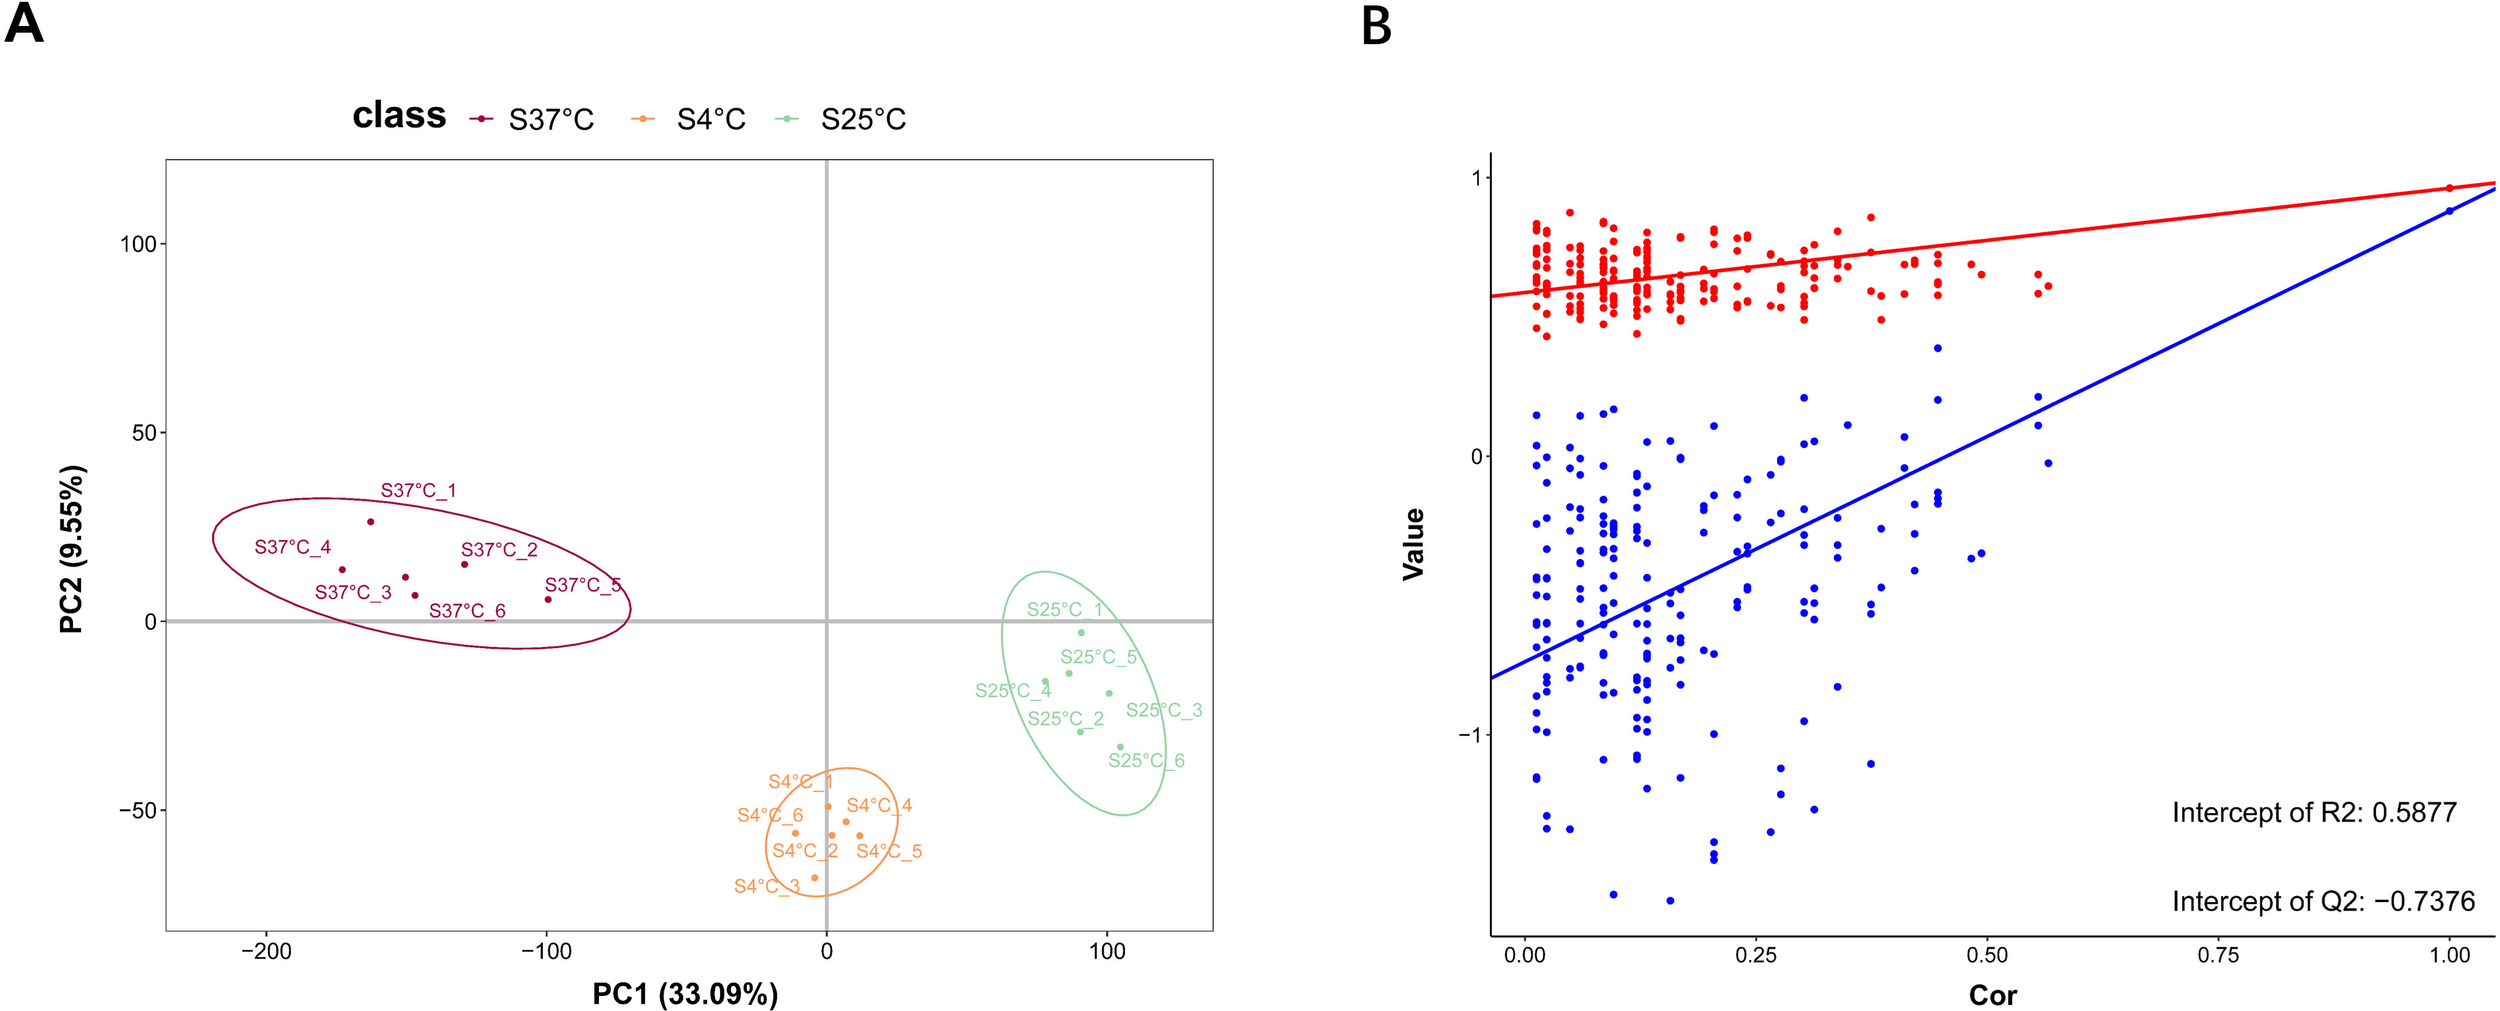
(A) PLS-DA analysis for each group. Each group represents a sample group, and each sample in the same group were displayed by using the same color. (B) Validate plots. The closer R2 and Q2 to 1, the model was more reliable and stable; Q2 represents the prediction ability of this model, which was greater than 0.5, indicating that the model was good.
Comparison of the 37 °C group with the cold-treated group revealed that 42 metabolites were upregulated and 30 metabolites were downregulated. Comparing the 25 °C group with the cold-treated group, 40 upregulated metabolites and 28 downregulated metabolites were identified (Supplementary Figure S2). Meanwhile, hierarchical cluster analysis was conducted to visualize the different expression levels of metabolites in all samples. The top 30 DEMs were selected for heatmap analysis (Supplementary Figure S3). The results showed that more than half of the metabolites were upregulated after treatment.
KEGG pathway analysis was the most efficient and direct method to explore cellular biological processes. DEMs belonged to six compound categories, namely, cellular processes, environmental information processing, genetic information processing, human diseases, metabolism, and organismal systems. In this study, a total of 21 KEGG pathways were significantly enriched by referring to the KEGG database, among which 6 pathways, namely, glycerophospholipid metabolism, teichoic acid biosynthesis, nucleotide metabolism, biosynthesis of alkaloids derived from histidine and purine, AMPK signaling pathway, and caffeine metabolism, have the maximum enrichment ratio (ER). In addition, glycerophospholipid metabolism, metabolic pathways, nucleotide metabolism, teichoic acid biosynthesis, and ABC transporters were the five main pathways with the most metabolites (Figure 5).
Figure 5
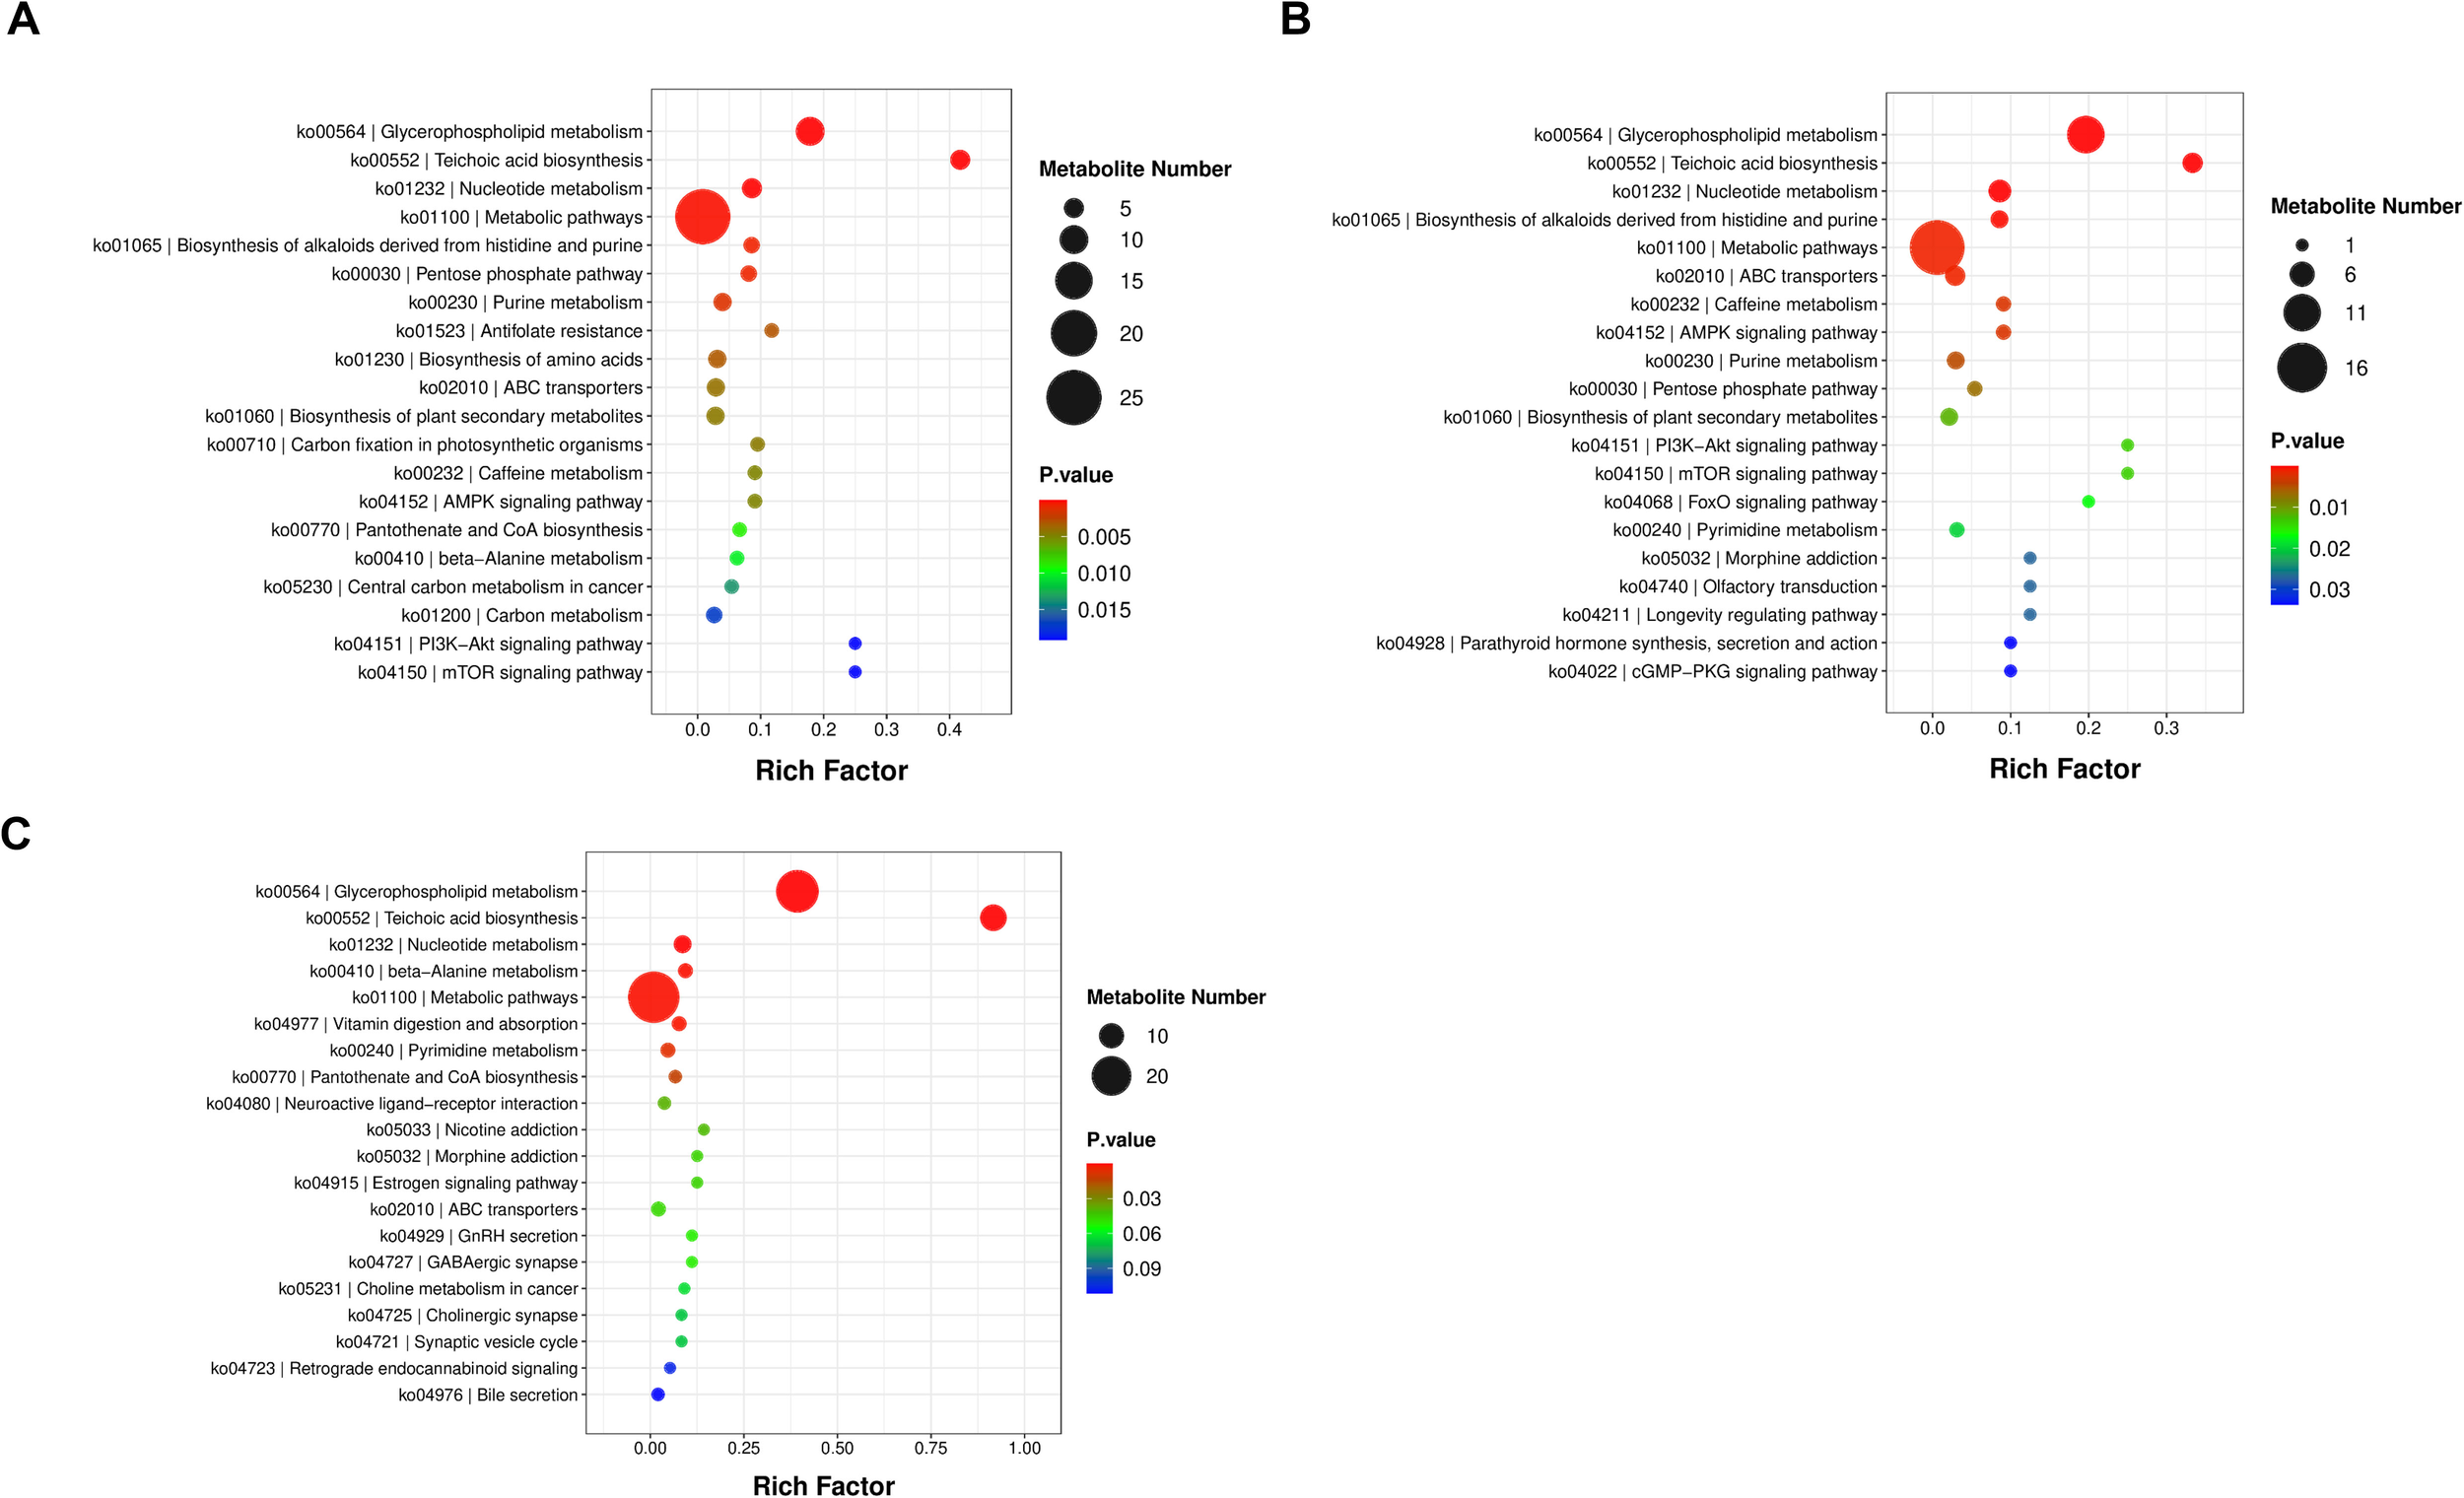
Scatterplots of the top 20 KEGG enrichment pathways based on differential metabolites among three compared groups. (A) The enriched KEGG pathways of the S4 °C group versus the S37 °C group. (B) The enriched KEGG pathways of the S25 °C group versus the S37 °C group. (C) The enriched KEGG pathways of the S25 °C group versus the S37 °C group. p-value ≤0.05 was considered significantly enriched.
Because of the limited number of metabolites included in the KEGG database, a number of metabolites were not integrated into the pathway. Accordingly, possible associations among DRs were explored based on the Pearson correlation analysis and the abundance of DRs. Correlation analysis of the significant DRs with the top 30 p-values is shown in Supplementary Figure S4. The depth of the color represented the strength of the correlation of the metabolites. Results indicated that the smaller the p-value, the more significant the correlation of metabolites.
3.4 Bioinformatics integrative analysis of proteomics and metabolomics
In this study, the proteomic and metabolomic data of V. parahaemolyticus at three temperatures were analyzed jointly. The correlation between proteins and metabolites was calculated based on PCC. The top 20 relative content data of DEPs and DEMs were extracted based on the p-values. Correlation heatmaps were plotted (Figure 6). The DEPs and DEMs were mapped based on the KEGG genes database to obtain common pathways, and three were obtained. All four metabolites, namely, thiamine, uridine, xanthosine, and cytidine, were involved in ATP-binding cassette (ABC) drug transporters and metabolic pathways. The three metabolites, xanthine, phosphogluconic acid, and D-fructose 1, 6-bisphosphate, were involved in microbial metabolism in diverse environments and metabolic pathways (Supplementary Table S1).
Figure 6
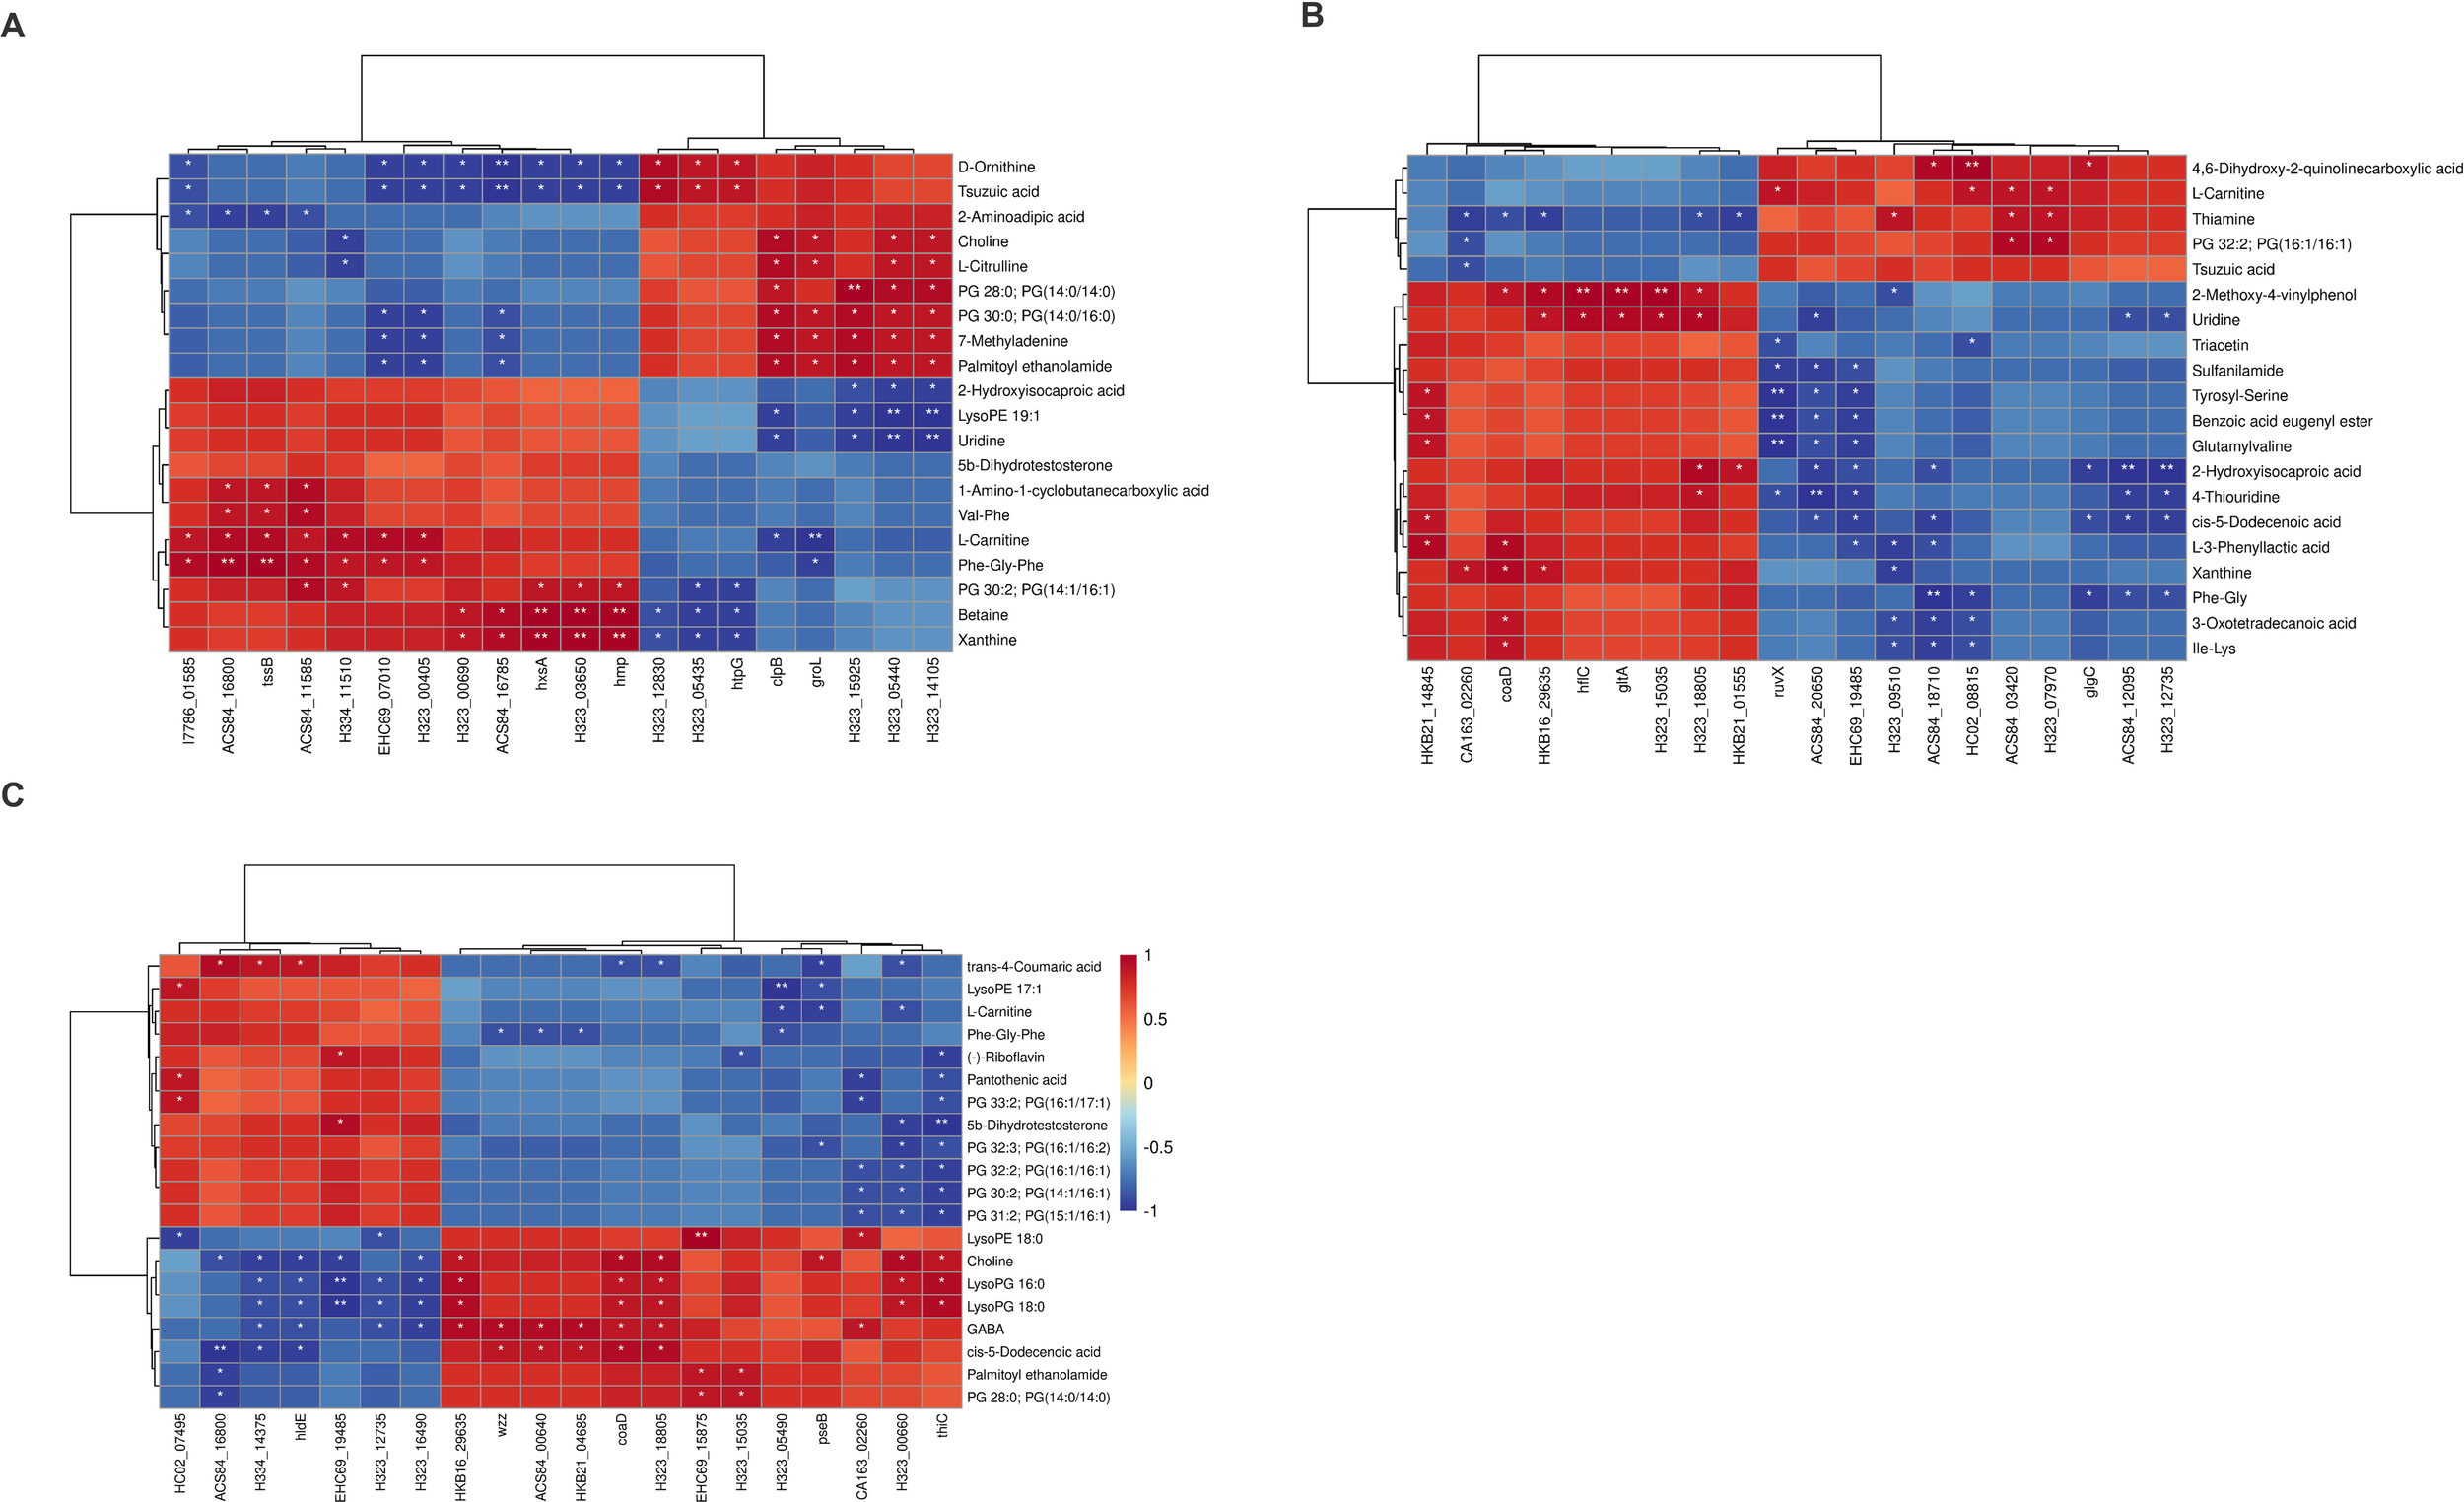
Correlation analysis of the top 20 DEPs and DEMs. Red was positively correlated and blue was negatively correlated. The statistically significant differences were presented at the level of *p < 0.05, **p < 0.01.
4 Discussion
Environmental temperatures fluctuated greatly in the bacterial natural habitat. Therefore, bacteria must adapt to the changing temperatures to survive. The development of the omics technique was a powerful method to explore bacterial survival, pathogenesis, and biomarkers in the course of infection and diseases (Liesenfeld et al., 2013). V. parahaemolyticus was a primary pathogen originating from seafood (Zhang and Orth, 2013). A lot of foodborne disease outbreaks were associated with V. parahaemolyticus. Most cases were infected by eating fresh or undercooked aquatic products, including shellfish, fish, and oysters (Chao et al., 2010; Sani et al., 2008). In this study, a combined quantitative proteomics and non-targeted metabolomic analysis was performed to investigate the protein/metabolic profiles under three different temperature culture conditions. Our study combined proteomics and metabolomics for the first time to analyze the potential pathway in V. parahaemolyticus.
Using the proteomics method, ABC transporters, lysine degradation, ascorbate and aldarate, pentose and glucuronate interconversions, and D-amino acid metabolism were the five main enriched pathways. The levels of aldehyde dehydrogenase (ALDH) were downregulated in the three pathways, namely, ascorbate and aldarate, pentose and glucuronate interconversions, and D-amino acid metabolism. In Edwardsiella piscicida, expression of ALDH (AdhE) was critical for carbon source utilization, and AdhE played an important role in adapting to changes in the external environment by regulating sugar metabolic pathways. It is also reported that AdhE participated in various physiological processes, including bacterial growth, sugar utilization, type III secretion system, type VI secretion system, pH homeostasis, and bacterial survival in fish. In Escherichia coli, carbohydrate sources were converted into pyruvate, part of which were converted into acetaldehyde by pyruvate decarboxylase anaerobic conditions. AdhE was a bifunctional alcohol and ALDH, and catalyzed two terminal steps, including the reduction of acetyl coenzyme A to acetaldehyde and the reduction of acetaldehyde to ethanol (Lo et al., 2015). AdhE was known for its roles, including metabolism, fermentation, and virulence, and forms spirosomal filaments in E. coli (Kim et al., 2019; Pony et al., 2020) and in Vibrio cholerae (Cho et al., 2021). Despite the important roles of AdhE in bacterial physiology, little was known about the global roles played by V. parahaemolyticus. In this study, the data showed that AdhE was involved in pentose and glucuronate interconversions, ascorbate and aldarate metabolism, and D-amino acid metabolism, which appeared to play a role in environmental adaptation in pathogens. The levels of VP1270 and VP0999 were upregulated in lysine degradation and ABC transporters pathways, respectively.
Simultaneously, metabolomic analyses were carried out, and 396 DEMs were identified, which were mainly enriched in metabolic pathways, glycerophospholipid metabolism, biosynthesis of secondary metabolites, microbial metabolism in diverse environments, ABC transporters, nucleotide metabolism, and so on. In the metabolic pathway and microbial metabolism in diverse environments pathway, the level of xanthine (Xan) in the cold stress treatment group was significantly higher than that in the 37 °C group. In the ABC transporters pathway, the level of xanthosine (Xao) in the cold stress treatment group was significantly higher than that in the 37°C group. The level of Xao was upregulated 16.97-fold.
The structural properties of ionic and neutral forms of Xan, Xao, and XMP were essential in many enzyme systems, such as purine nucleoside phosphorylases, biosynthesis of phosphoribosyltransferases and caffeine, IMP dehydrogenase, and some nucleic acid polymerase (Stoychev et al., 2002). Ashihara and Crozier provided an extensive review of the biosynthesis of caffeine pathway, which proceeds through a series of enzymatic steps with intermediates including Xao and Xan, and m7XMP and XMP, followed by the generation of caffeine (Ashihara and Crozier, 1999). In this study, Xao and Xan, as intermediates in the biosynthesis of caffeine pathway, were significantly regulated. E. coli contained two purine phosphoribosyltransferases, which function in the salvage pathway, one with a preference for Hx, and the other with a preference for Gua and Xan (Shivashankar et al., 2001; Vos et al., 1997).
Taken together, the metabolism of purine and pyrimidine nucleotide was promoted under cold stress, which favored bacterial growth and multiplication. In addition, the abundance of arginine and ornithine was significantly upregulated.
Finally, an integrated bioinformatic analysis of proteomics and metabolomics was performed. Integrating proteomics and metabolomics through the KEGG database, which was a convenient method to study the interactions in a systematic way (Li et al., 2022), showed that three were obtained, namely, ABC transporters, microbial metabolism in diverse environments, and metabolic pathways. The three metabolites, namely, xanthosine, uridine, and cytidine, were upregulated in both ABC transporters and metabolic pathways. 6-Phosphogluconic acid and D-fructose 1,6-bisphosphate were downregulated in both microbial metabolism in diverse environments and metabolic pathways. The protein VP1270 [D-2-hydroxyglutarate dehydrogenase (D2HGDH)] was upregulated in ABC transporters and microbial metabolism in diverse environments pathways. D2HGDH, as a vital enzyme in bacterial L-serine biosynthesis by maintaining central carbon metabolism, was involved in D-2-HGA dehydrogenase metabolism (Zhang et al., 2017; Reid et al., 2018). D2HGDHs have been characterized in Pseudomonas aeruginosa (Zhang et al., 2017; Quaye and Gadda, 2020), Achromobacter denitrificans (Xiao et al., 2021), humans (Toplak et al., 2019; Yang et al., 2021), Ralstonia solanacearum (Wu B. et al., 2022), E. coli, and Pantoea ananatis (Samsonov et al., 2022). D2HGDH may be a potentially antimicrobial target for V. parahaemolyticus. However, this study has limitations. Three different temperatures were chosen in this study, and furthermore, temperatures are needed and explored to verify some of our findings.
5 Conclusion
In summary, this study proved a correlation between the proteome and metabolome of V. parahaemolyticus under three different culture temperatures. This relationship provided a new perspective for better monitoring the physiological adaptation mechanisms of the bacterium under cold stress and exploring bacterial pathogenesis. Moreover, further exploration of omics data at 4 °C represents a key direction for our future research, aiming to deliver more direct benefits to the global aquatic food safety sector.
Statements
Data availability statement
The raw data supporting the conclusions of this article will be made available by the authors, without undue reservation.
Author contributions
AM: Data curation, Formal Analysis, Investigation, Methodology, Writing – original draft. ZT: Formal Analysis, Visualization, Writing – review & editing. LH: Conceptualization, Data curation, Funding acquisition, Software, Validation, Writing – review & editing. FC: Supervision, Writing – review & editing.
Funding
The author(s) declare financial support was received for the research and/or publication of this article. This study was supported by Hainan Provience Natural Science Foundation (321QN0961 and 323RC555).
Acknowledgments
We are grateful to Feifei Guo and Lu Peng for the critical reading of this manuscript.
Conflict of interest
The authors declare that the research was conducted in the absence of any commercial or financial relationships that could be construed as a potential conflict of interest.
Generative AI statement
The author(s) declare that no Generative AI was used in the creation of this manuscript.
Any alternative text (alt text) provided alongside figures in this article has been generated by Frontiers with the support of artificial intelligence and reasonable efforts have been made to ensure accuracy, including review by the authors wherever possible. If you identify any issues, please contact us.
Publisher’s note
All claims expressed in this article are solely those of the authors and do not necessarily represent those of their affiliated organizations, or those of the publisher, the editors and the reviewers. Any product that may be evaluated in this article, or claim that may be made by its manufacturer, is not guaranteed or endorsed by the publisher.
Supplementary material
The Supplementary Material for this article can be found online at: https://www.frontiersin.org/articles/10.3389/fmars.2025.1689231/full#supplementary-material
References
1
Alcaide E. Amaro C. Todoli R. Oltra R. (1999). Isolation and characterization of Vibrio parahaemolyticus causing infection in Iberian toothcarp Aphanius iberus. Dis. Aquat. organisms35, 77–80. doi: 10.3354/dao035077
2
Ashihara H. Crozier A. (1999). Biosynthesis and catabolism of caffeine in low-caffeine-containing species of Coffea. J. Agric. Food Chem.47, 3425–3431. doi: 10.1021/jf981209n
3
Baker-Austin C. Oliver J. D. Alam M. Ali A. Waldor M. K. Qadri F. et al . (2018). Vibrio spp. infections. Nat. Rev. Dis. Primers.4, pp.1–pp19. doi: 10.1038/s41572-018-0005-8
4
Cai J. Li J. Thompson K. D. Li C. Han H. (2007). Isolation and characterization of pathogenic Vibrio parahaemolyticus from diseased post-larvae of abalone Haliotis diversicolor supertexta. J. Basic Microbiol.47, 84–86. doi: 10.1002/jobm
5
Chao G. X. Jiao X. N. Zhou X. H. Wang F. Yang Z. Q. Huang J. L. et al . (2010). Distribution of genes encoding four pathogenicity islands VPaIs., T6SS, Biofilm, and type I Pilus in food and clinical strains of Vibrio parahaemolyticus in China. Foodborne Pathog. Dis.76, 649–658. doi: 10.1089/fpd.2009.0441
6
Chen T. Ma J. Liu Y. Chen Z. Xiao N. Lu Y. et al . (2022). iProX in 2021: connecting proteomics data sharing with big data. Nucleic Acids Res. 50, D1522–D1527. doi: 10.1093/nar/gkab1081
7
Cho S. Kim G. Song J. J. Cho C. (2021). Cryo-EM structure of Vibrio cholerae aldehyde- alcohol dehydrogenase spirosomes. Biochem. Biophys. Res. Commun.536, 38–44. doi: 10.1016/j.bbrc.2020.12.040
8
De Schryver P. Defoirdt T. Sorgeloos P. (2014). Early mortality syndrome outbreaks: a microbial management issue in shrimp farming. PloS Pathogens.10, e1003919. doi: 10.1371/journal.ppat.1003919
9
Gu D. Wang K. Lu T. Li L. Jiao X. (2021). Vibrio parahaemolyticus CadC regulates acid tolerance response to enhance bacterial motility and cytotoxicity. J. Fish Dis.44, 1155–1168. doi: 10.1111/jfd.13376
10
Hu L. Meng A. Tu Z. Jia S. Liu Q. Chen F. (2024). The analysis of complete genome sequence and comparative genomics of Vibrio parahaemolyticus LF1113 in Hainan. Infection Genet. Evol.119, 105574. doi: 10.1016/j.meegid.2024.105574
11
Imaizumi K. Tinwongger S. Kondo H. Hirono I. (2018). Disinfection of an EMS/AHPND strain of Vibrio parahaemolyticus using ozone nanobubbles. J. fish diseases.41, 725–727. doi: 10.1111/jfd.12783
12
Jin J. Chen N. Hu Y. Chen Y. Yin B. Wang X. et al . (2024). Transcriptome and metabolome for identifying key metabolites impacting the Vibrio parahaemolyticus in Litopenaeus vannamei. Front. Mar. Sci.11. doi: 10.3389/fmars.2024.1400082
13
Johnson C. N. Bowers J. C. Griffitt K. J. Molina V. Clostio R. W. Pei S. et al . (2012). Ecology of Vibrio parahaemolyticus and Vibrio vulnificus in the coastal and estuarine waters of Louisiana, Maryland, Mississippi, and Washington (United States). Appl. Environ. Microbiol.78, 249–7257. doi: 10.1128/AEM.01296-12
14
Kim G. Azmi L. Jang S. Jung T. Hebert H. Roe A. J. et al . (2019). Aldehyde-alcohol dehydrogenase forms a high-order spirosome architecture critical for its activity. Nat. Commun.10, 4527. doi: 10.1038/s41467-019-12427-8
15
Kuhl C. Tautenhahn R. Bottcher C. Larson T. R. Neumann S. (2012). CAMERA: an integrated strategy for compound spectra extraction and annotation of liquid chromatography/mass spectrometry data sets. Analytical Chem.84, 283–289. doi: 10.1021/ac202450g
16
Li M. Lan D. Chen Y. (2022). Integrated analysis of proteomics and metabolomics in girls with central precocious puberty. Front. Endocrinol. (Lausanne).13. doi: 10.3389/fendo.2022.951552
17
Liesenfeld D. B. Habermann N. Owen R. W. Scalbert A. Ulrich C. M. (2013). Review of mass spectrometry-based metabolomics in cancer research. Cancer epidemiology Biomarkers Prev.22, 2182–2201. doi: 10.1158/1055-9965
18
Lo J. Zheng T. Hon S. Olson D. G. Lynd L. R. (2015). The bifunctional alcohol and aldehyde dehydrogenase gene, adhE, is necessary for ethanol production in Clostridium thermocellum and Thermoanaerobacterium saccharolyticum. J. bacteriology.197, 1386–1393. doi: 10.1128/JB.02450-14
19
Ma J. Chen T. Wu S. Yang C. Bai M. Shu K. et al . (2019) iProX: an integrated proteome resource. Nucleic Acids Res. 47, D1211–D1217. doi: 10.1093/nar/gky869
20
McCarter L. (1999). The multiple identities of Vibrio parahaemolyticus. J. Mol. Microbiol. Biotechnol.1, 51–57. doi: 10.1109/16.405277
21
Mosier A. C. Li Z. Thomas B. C. Hettich R. L. Pan C. Banfield J. F. (2015). Elevated temperature alters proteomic responses of individual organisms within a biofilm community. ISME J.9, 180–194. doi: 10.1038/ismej.2014.113
22
Pony P. Rapisarda C. Terradot L. Marza E. Fronzes R. (2020). Filamentation of the bacterial bi-functional alcohol/aldehyde dehydrogenase AdhE is essential for substrate channeling and enzymatic regulation. Nat. Commun.11, 1426. doi: 10.1038/s41467-020-15214-y
23
Qu Y. Yin Z. Fan X. Hu H. Cui H. Cui Z. et al . (2024). A comparative analysis of growth and nutritional quality of the hybrid grouper (Epinephelus fuscoguttatus ♀ × Epinephelus lanceolatus♂) in a simulated pond system and a recirculating aquaculture system. Front. Mar. Sci. 11, 1466656. doi: 10.3389/fmars.2024.1378735
24
Quaye J. A. Gadda G. (2020). Kinetic and Bioinformatic Characterization of d-2-Hydroxyglutarate Dehydrogenase from Pseudomonas aeruginosa PAO1. Biochemistry59, 4833–4844. doi: 10.1021/acs.biochem.0c00832
25
Reid M. A. Allen A. E. Liu S. Liberti M. V. Liu P. Liu X. et al . (2018). Serine synthesis through PHGDH coordinates nucleotide levels by maintaining central carbon metabolism. Nat. Commun.9, 5442. doi: 10.1038/s41467-018-07868-6
26
Ross P. L. Huang Y. N. Marchese J. N. Williamson B. Parker K. Hattan S. et al . (2004). Multiplexed protein quantitation in Saccharomyces cerevisiae using amine-reactive isobaric tagging reagents. Molecular & cellular. Proteomics.3, pp.1154–1169. doi: 10.1074/mcp.M400129-MCP200
27
Samsonov V. V. Kuznetsova A. A. Rostova J. G. Samsonova S. A. Ziyatdinov M. K. Kiriukhin M. Y. (2022). Revealing a New Family of D-2-Hydroxyglutarate Dehydrogenases in Escherichia coli and Pantoea ananatis Encoded by ydiJ. Microorganisms.10, 1766. doi: 10.3390/microorganisms10091766
28
Sani N. A. Ariyawansa K. W. S. Babji A. S . (2008). Prevalence and risks of vibrio parahaemolyticus in black tiger shrimp (penaeus monodon). IJID. 12, e230. doi: 10.1016/j.ijid.2008.05.574
29
Shivashankar K. Subbayya I. S. Balaram H. (2001). Development of a bacterial screen for novel hypoxanthine-guanine phosphoribosyltransferase substrates. J. Mol. Microbiol. Biotechnol.3, pp.557–pp.562. doi: 10.1016/S0167-7012(01)00296-2
30
Smith C. A. Want E. J. O’Maille G. Abagyan R. Siuzdak G. (2006). XCMS: processing mass spectrometry data for metabolite profiling using nonlinear peak alignment, matching, and identification. Analytical Chem.78, 779–787. doi: 10.1021/ac051437y
31
Stentiford G. D. Sritunyalucksana K. Flegel T. W. Williams B. A. Withyachumnarnkul B. Itsathitphaisarn O. et al . (2017). New paradigms to help solve the global aquaculture disease crisis. PloS Pathogens.13, e1006160. doi: 10.1371/journal.ppat.1006160
32
Stoychev G. Kierdaszuk B. Shugar D. (2002). Xanthosine and xanthine: Substrate properties with purine nucleoside phosphorylases, and relevance to other enzyme systems. Eur. J. Biochem.269, 4048–4057. doi: 10.1046/j.1432-1033.2002.03097.x
33
Thompson A. Schäfer J. Kuhn K. Kienle S. Schwarz J. Schmidt G. et al . (2003). Tandem mass tags: a novel quantification strategy for comparative analysis of complex protein mixtures by MS/MS. Analytical Chem.75, 1895–1904. doi: 10.1021/ac0262560
34
Toplak M. Brunner J. Schmidt J. Macheroux P. (2019). Biochemical characterization of human D-2-hydroxyglutarate dehydrogenase and two disease related variants reveals the molecular cause of D-2-hydroxyglutaric aciduria. Biochim. Biophys. Acta Proteins Proteom.1867, 140255. doi: 10.1016/j.bbapap.2019.07.008
35
Turner M. F. Heuberger A. L. Kirkwood J. S. Collins C. C. Wolfrum E. J. Broeckling C. D. et al . (2016). Non-targeted metabolomics in diverse sorghum breeding lines indicates primary and secondary metabolite profiles are associated with plant biomass accumulation and photosynthesis. Front. Plant Science.7. doi: 10.3389/fpls.2016.00953
36
Vos S. de Jersey J. Martin J. L. (1997). Crystal structure of Escherichia coli xanthine phosphoribosyltransferase. Biochemistry.36, 4125–4134. doi: 10.1021/bi962640d
37
Wen B. Mei Z. Zeng C. Liu S. (2017). metaX: a flexible and comprehensive software for processing metabolomics data. BMC Bioinf.18, 1–14. doi: 10.1186/s12859-017-1579-y
38
Wiśniewski J. R. Zougman A. Nagaraj N. Mann M. (2009). Universal sample preparation method for proteome analysis. Nat. Methods6, 359–362. doi: 10.1038/nmeth.1322
39
Wu B. Li Z. Kang Z. Ma C. Song H. Lu F. et al . (2022). An enzymatic biosensor for the detection of D-2-hydroxyglutaric acid in serum and urine. Biosensors.12, 66. doi: 10.3390/bios12020066
40
Wu Z. Wu Y. Gao H. He X. Yao Q. Yang Z. et al . (2022). Identification and whole-genome sequencing analysis of Vibrio vulnificus strains causing pearl gentian grouper disease in China. BMC Microbiol.22, 200. doi: 10.1186/s12866-022-02610-1
41
Xiao D. Zhang W. Guo X. Liu Y. Hu C. Guo S. et al . (2021). A D-2-hydroxyglutarate biosensor based on specific transcriptional regulator DhdR. Nat. Commun.12, 7108. doi: 10.1038/s41467-021-27357-7
42
Yang C. Pei X. Wu Y. Yan L. Yan Y. Song Y. et al . (2019). Recent mixing of Vibrio parahaemolyticus populations. ISME J.13, 2578–2588. doi: 10.1038/s41396-019-0461-5
43
Yang J. Zhu H. Zhang T. Ding J. (2021). Structure, substrate specificity, and catalytic mechanism of human D-2-HGDH and insights into pathogenicity of disease-associated mutations. Cell Discov.7, 3. doi: 10.1038/s41421-020-00227-0
44
Yoon J. H. Bae Y. M. Lee S. Y. (2017). Effects of varying concentrations of sodium chloride and acidic conditions on the behavior of Vibrio parahaemolyticus and Vibrio vulnificus cold-starved in artificial sea water microcosms. Food Sci. Biotechnol.26, 829–839. doi: 10.1007/s10068-017-0105-3
45
Yu C. S. Chen Y. C. Lu C. H. Hwang J. K. (2006). Prediction of protein subcellular localization. Proteins: Structure. Function Bioinf.64, 643–651. doi: 10.1002/prot.21018
46
Yu C. S. Lin C. J. Hwang J. K. (2004). Predicting subcellular localization of proteins for Gram-negative bacteria by support vector machines based on n-peptide compositions. Protein science.13, 1402–1406. doi: 10.1110/ps.03479604
47
Zhang Y. Gross C. A. (2021). Cold shock response in bacteria. Annu. Rev. Genet.55, 377–400. doi: 10.1146/annurev-genet-071819-031654
48
Zhang L. Orth K. (2013). Virulence determinants for Vibrio parahaemolyticus infection. Curr. Opin. Microbiol.16, 70–77. doi: 10.1016/j.mib.2013.02.002
49
Zhang W. Zhang M. Gao C. Zhang Y. Y. Ge Y. Guo S. et al . (2017). Coupling between D-3-phosphoglycerate dehydrogenase and D-2-hydroxyglutarate dehydrogenase drives bacterial L-serine synthesis. Proc. Natl. Acad. Sci. U.S.A.114, E7574–E7582. doi: 10.1073/pnas.1619034114
50
Zhong Q. Wang B. Wang J. Liu Y. Fang X. Liao Z. (2019). Global proteomic analysis of the resuscitation state of Vibrio parahaemolyticus compared with the normal and viable but non-culturable state. Front. Microbiol.10. doi: 10.3389/fmicb.2019.01045
51
Zhou T. Gui L. Liu M. Li W. Hu P. Duarte et al . (2019). Transcriptomic responses to low temperature stress in the Nile tilapia, Oreochromis niloticus. Fish Shellfish Immunol.84, 1145–1156. doi: 10.1016/j.fsi.2018.10.023
52
Zhou Y. Han Y. L. Luo J. Wang X. Chen G. H. (2017). MSAP analysis of DNA methylation of Epinephelus malabaricus, Epinephelus malabaricus and their hybrid offspring. Nat. Sci. J. Hainan Univ.35, 7. doi: 10.15886/j.cnki.hdxbzkb.2017.0026
53
Zhu Y. Xu H. Chen H. Xie J. Shi M. Shen B. et al . (2014). Proteomic analysis of solid pseudopapillary tumor of the pancreas reveals dysfunction of the endoplasmic reticulum protein processing pathway. Mol. Cell. Proteomics13, 2593–2603. doi: 10.1074/mcp.M114.038786
Summary
Keywords
Vibrio parahaemolyticus , temperature, proteomics, metabolomics, correlation
Citation
Meng A, Tu Z, Hu L and Chen F (2025) Proteomics and metabolic profiling of Vibrio parahaemolyticus at three different temperatures. Front. Mar. Sci. 12:1689231. doi: 10.3389/fmars.2025.1689231
Received
20 August 2025
Accepted
30 September 2025
Published
21 October 2025
Volume
12 - 2025
Edited by
Xi-Ying Zhang, Shandong University, China
Reviewed by
Xixiang Tang, State Oceanic Administration, China; Zhuosheng Liu, University of California Davis, United States
Updates
Copyright
© 2025 Meng, Tu, Hu and Chen.
This is an open-access article distributed under the terms of the Creative Commons Attribution License (CC BY). The use, distribution or reproduction in other forums is permitted, provided the original author(s) and the copyright owner(s) are credited and that the original publication in this journal is cited, in accordance with accepted academic practice. No use, distribution or reproduction is permitted which does not comply with these terms.
*Correspondence: Linlin Hu, 442954558@qq.com
Disclaimer
All claims expressed in this article are solely those of the authors and do not necessarily represent those of their affiliated organizations, or those of the publisher, the editors and the reviewers. Any product that may be evaluated in this article or claim that may be made by its manufacturer is not guaranteed or endorsed by the publisher.