Abstract
As global concerns over carbon emissions intensify, regulators worldwide have implemented diverse carbon tax policies, each shaped by specific environmental objectives and economic considerations. In response, shipping carriers have increasingly invested in Research and Development (R&D) or purchased low-carbon technologies to comply with varying regulatory standards and maintain market competitiveness. Against this backdrop, this study develops game-theoretic models to analyze optimal technology licensing strategies for shipping carriers holding carbon-reduction technology in a competitive market. It further examines how regulators can set appropriate carbon tax levels to influence licensing behaviors under different policy objectives. Our findings reveal that when the implementation costs of the green technology are manageable, sole licensing can effectively align regulatory goals with carriers’ profit objectives. However, as costs increase, the patentee carrier may gradually prefer licensing strategies that restrict the technology adoption to only the carrier with lower initial carbon efficiency, deviating from the regulator's intended outcome. If the regulator's goal is to maximize the adoption of green technology, it can realign incentives or achieve suboptimal outcomes by lowering carbon taxes or offering subsidies. Conversely, if the regulator is more focused on social welfare, the most robust choice is to set the tax at a level that maximizes welfare under sole licensing conditions. Finally, we find that providing carbon tax discounts to carriers implementing green technology does not alter the decision structure but can amplify the advantages of sole licensing, resulting in higher social welfare.
1 Introduction
Maritime transportation, one of the most energy-efficient modes of transport, accounts for a substantial share of global trade, with approximately 90% of all non-bulk cargo being moved by sea (Zhou et al., 2025). As the backbone of global trade, the maritime shipping industry has long faced uncertainties from natural forces, operational challenges, and policy changes, making resilience a key focus (Lau et al., 2024; Bathke et al., 2022). While classical discussions on resilience have predominantly centered on firms’ responses to physical disruptions and logistical shocks, such as schedule recovery, vessel rerouting, capacity reallocation, and infrastructure reliability (Gu and Liu, 2025; Liu et al., 2023), the emergence of fragmented and increasingly stringent environmental regulations has brought regulatory resilience to the forefront. Measures such as the International Maritime Organization (IMO) 2020 sulfur cap, the EU Emissions Trading System, and region-specific Carbon Intensity Indicator (CII) reflect not only the growing ambition of climate policy but also its fragmentation (Charamis et al., 2025). These policies differ widely across jurisdictions in terms of scope, timing, and technical criteria, leading to inconsistent implementation schedules, varying emission standards (e.g., between the EU and Asia-Pacific), and even conflicting definitions of key concepts such as green fuels (Park et al., 2024). In this context, for ease of description, this paper refers to the ability to adapt to different regulatory environments as regulatory resilience. In fact, as representatives of high-carbon-emission industries, shipping enterprises face significant pressure from environmental regulations (Zheng, 2024). Unlike general companies or industries, which can avoid the impact of carbon tax differences by tailoring products to specific countries, vessels traverse international waters, navigating through regions with diverse regulations (Olaniyi et al., 2024). As a result, they must comply with the carbon tax policies of multiple nations, making the variation in carbon taxes across countries particularly impactful for shipping carriers. Cariou et al. (2023) found that shipping companies may adjust their routes, vessel speeds, and operational strategies in response to changes in carbon tax policies.
Adopting green technologies, such as energy-efficient ship designs, emission control systems, and carbon monitoring tools, is one way that carriers seek to strengthen their ability to adapt to regulatory pressure (Yang, 2018; Raza, 2020). These technologies can lower emissions and reduce compliance costs across jurisdictions. However, access to green technology alone does not guarantee resilience. In a competitive market, a firm's performance also depends on whether and how others adopt similar tools and on the conditions under which technologies are shared or withheld (Wang et al., 2021). A substantial body of case studies has indicated that the licensing of green technologies within the maritime sector has been instrumental in facilitating the diffusion and scaled adoption of these technologies, thus playing a pivotal role in advancing the industry-wide green transition. In May 2025, Seatrec announced that it had secured an exclusive license from Sea-Bird Scientific to manufacture floats for Argo, an international program to monitor the global ocean 1. In December 2024, Wärtsilä and Elomatic signed a 12-year licensing agreement for the Elogrid technology2. Hyundai Heavy Industries Co., Ltd. (HHI) is a long-standing member of the Winterthur Gas & Diesel Ltd. (WinGD) family of low-speed engine licensees. In March 2017, WinGD and HHI signed an amendment to extend their current license agreement for another 10 years3.
Thus, to analyze how technology access shapes carriers' behavior under regulatory pressure, we construct a Stackelberg game in which a technology owner holds a low-carbon innovation and considers whether—and how—to license it to a competing carrier, trying to solve the following questions:
-
From the carriers' perspective, which licensing structure offers greater resilience in terms of stable economic outcomes under varying carbon tax levels?
-
From the regulator's perspective, which licensing strategy better supports socially resilient outcomes under different carbon policy regimes?
Furthermore, we have also classified regulators into two categories based on different policy goals: the first, which we refer to as the green-expansion type, prioritizes the rapid diffusion of low-carbon technologies, often treating adoption itself as a policy end. The second, the sustainable-transition type, focuses on maximizing overall social welfare, balancing environmental gains with economic impacts such as carrier profits, consumer surplus, tax revenue, and environmental influence.
Our analysis first shows that when the technology adoption costs of adopting green technology are manageable, sole licensing consistently leads to more stable and favorable outcomes for the patentee and also aligns with the regulator's objective, regardless of whether the priority is technology adoption or welfare optimization. However, as technology adoption costs increase, the patentee begins to shift away from sole licensing and instead favors licensing strategies that allow the initially less efficient carrier to adopt the green technology. In such cases, the patentee's incentives no longer align with the regulator's preferred outcomes. To restore alignment, regulators may need to offer additional instruments (such as subsidies) to steer the patentee toward licensing choices that better support policy goals.
Our second finding is that the optimal carbon tax levels differ depending on the regulator's type. For a green expansion-oriented regulator, demand declines monotonically with carbon taxes, and the optimal level depends on external constraints such as total allowable emissions. In contrast, for a sustainable transition-oriented regulator, there exists a tax level that maximizes social welfare and an interior solution that balances environmental benefits and economic impacts.
Finally, we further explore the implications for regulators and find that sole licensing also tends to align with welfare-maximizing outcomes. Moreover, we show that carbon tax discounts, commonly used as policy incentives, do not change the structure of optimal licensing decisions but tend to reinforce the advantage of sole licensing.
Overall, the main contributions of this paper are reflected in the following three aspects.
-
Introducing a concept of “regulatory resilience”. While existing literature often defines “resilience” as the ability to cope with physical or operational disruptions, this study is among the first to explicitly define and model “regulatory resilience” as a firm’s capacity to maintain stable economic performance amidst varying carbon tax policies. We quantify it through firms’ performance across different licensing strategies within a game-theoretic equilibrium, providing a novel theoretical lens and an operational framework for analyzing corporate responses to policy uncertainty.
-
Identifying regulator types and designing alignment mechanisms. Moving beyond a mere application of existing licensing models to shipping, we introduce two types of regulators—“green expansion” vs. “sustainable transition”—and uncover their divergent policy objectives (technology diffusion vs. social welfare maximization). Consequently, our model precisely identifies how a combination of carbon taxes and subsidies can align corporate profit motives with public policy goals. This precise “incentive compatibility” design is a nuanced insight not fully captured in prior studies.
-
Bridging innovation economics and marine policy. This research theoretically integrates intellectual property strategy with environmental regulation, demonstrating that technology licensing can serve not only as a profit tool but also as a strategic lever for building regulatory resilience. This finding offers a new pathway for the green transition of the shipping industry that simultaneously addresses business viability and regulatory compliance, thereby making substantive contributions to both innovation economics and marine policy.
The findings of this study can benefit all participants in the maritime shipping industry. For carriers holding patents on green innovation technologies, carbon reduction innovations not only generate licensing revenues through intellectual property transactions but also help them cope with the complex and dynamic carbon emission regulations across regions. For carriers without green innovation technologies, the results provide guidance for making informed technology acquisition decisions to better adapt to varying regulatory environments. For governments, implementing well-designed carbon tax policies can effectively incentivize carriers to pursue carbon reduction innovations and promote the wider adoption of green technologies, thereby driving the industry's overall green transition. For shippers, adopting green innovation technologies allows them to respond to governmental calls for carbon reduction and enhance their social influence.
The rest of the paper is organized as follows. In Section 2, we review the relevant literature on maritime resilience and regulatory compliance frameworks. In Section 3, we introduce the model in detail. In Section 4, we analyze the optimal strategy of the patentee and the regulator. Finally, we conclude the paper in Section 6.
2 Relevant literature
We divide the relevant literature into four streams: carbon pricing and regulatory adaptation, maritime resilience, competition in shipping, and innovation licensing strategy.
2.1 Carbon pricing and regulatory adaptation
Carbon pricing is an effective strategy for reducing carbon emissions and addressing environmental crises (Yang, 2023). Carbon pricing frameworks have been applied in a range of economic industries, shaping corporate strategies, guiding investment choices, and informing government policies (Samuel, 2025). The main pricing mechanisms adopted are carbon taxes and carbon trading (Yang, 2023; Xu and Yang, 2024). Avagyan (2018) pointed out that the impact of carbon pricing varies across industries and also shows significant differences between countries.
In the maritime industry, in July 2023, the IMO member states adopted the 2023 IMO strategy on the reduction of greenhouse gas (GHG) emissions from ships (2023 IMO GHG Strategy), aiming to implement a new mechanism for reducing maritime greenhouse gas emissions4. Dominioni (2024) examined whether World Trade Organization (WTO) law constrains the IMO's capacity to implement a GHG pricing instrument that considers equity by providing exemptions for developing countries, least developed countries, and small island developing states. In addition, Dominioni and Petit (2024) also pointed out that the carbon tax pricing mechanism promoted by the IMO, combined with regional carbon tax schemes, could lead to double or multiple pricing. A recent study has shown that the combination of an emission intensity standard and GHG emission pricing can promote the transition to low-carbon vessels, but achieving full decarbonization will still require quite an ambitious level of pricing (Cret et al., 2024). It is undeniable that carbon pricing can promote corporate innovation and improve efficiency (Goyal and Llop, 2024).
2.2 Maritime resilience
Maritime resilience is the capacity of the maritime system to withstand disruptions, continue operating under stress, recover quickly, and adapt to changing conditions (Gu and Liu, 2025). Existing studies on maritime resilience have primarily focused on operational system resilience, such as infrastructure resilience targeting recovery capabilities (Akpinar and Özer-Çaylan, 2023; Mansouri et al., 2009; Song et al., 2016), supply chain resilience (Gu et al., 2023; Lam and Bai, 2016), and environmental resilience (Verschuur et al., 2022; Panahi et al., 2020).
However, as environmental regulations become increasingly stringent and policy fragmentation intensifies, the resulting rise in compliance costs has made regulatory resilience ever more critical for carriers. Recent studies have indicated that adherence to multi-jurisdictional regimes such as the EU Emissions Trading System (ETS) and IMO CII can account for 18% to 34% of a carrier's operational budget, significantly impacting both planning and profitability (Yuan et al., 2023; Ferrara and Giua, 2022; Compagnie et al., 2023). Moreover, overlapping carbon policies have been shown to exacerbate these costs by an additional 12% to 29% on Asia–Europe routes (Park et al., 2024; Vukić and Del Mar Cerbán, 2022).
Some studies have explored how maritime shipping firms adapt to these regulatory shifts by strengthening resilience through operational adjustments and investment strategies.
SChinas and Stefanakos (2012) addressed this challenge by modeling the cost impact of MARPOL Annex VI sulfur limits. They used stochastic linear programming to reflect the probabilistic exposure to sulfur emission control areas (SECAs), which enabled ship operators to optimize fleet mix and routing in light of compliance cost variability. Building on this, Balland et al. (2013) incorporated regulatory uncertainty into a stochastic planning model by treating future emission standards as uncertain parameters, thereby facilitating compliance decision-making through the evaluation of retrofit and fuel-switching strategies under diverse regulatory conditions.
In contrast to these cost-centric approaches, Haehl and Spinler (2018) advanced a real options investment model incorporating uncertainty as stochastic jumps in future costs. Using dynamic programming, they demonstrated that the presence or absence of grandfathering provisions substantially affects investment timing and fleet flexibility. Further, Haehl and Spinler (2020) developed a regime-switching real options model to evaluate both capacity and technology choices under regulatory uncertainty, showing how different policy instruments' emissions caps, taxes, and cap-and-trade systems affect not only investment value but also the level and timing of emission reduction. Lastly, Melas et al. (2025) examined the issue from a macroeconomic perspective, using a Bayesian Vector Autoregression (VAR) model to quantify the impact of trade and policy uncertainty on freight rates. While trade-related uncertainty had a strong but short-term impact, policy uncertainty had more persistent effects on costs.
In summary, although the above studies enhance carriers' regulatory resilience through a range of strategic approaches, intellectual property management, particularly in the form of green technology licensing, remains an underexplored dimension. By facilitating access to compliant technologies without requiring full-scale in-house development or investment, licensing can offer a fallback or complementary mechanism, especially when operational or financial constraints limit the effectiveness of traditional responses.
2.3 Competition in shipping
The shipping industry is historically characterized by intense competition (Davis, 1968). Numerous scholars have examined this issue from different angles. Kou and Luo (2016) employed a game-theoretic model to analyze ocean carriers' capacity expansion strategies, demonstrating that expansion is rational during both market peaks and troughs. Asadabadi and Miller-Hooks (2020) introduced a stochastic optimization model aimed at strengthening the reliability and resilience of ports in the face of catastrophic maritime events. Song et al. (2024) developed a three-level Stackelberg game model involving two ports and one shipping company to analyze the impact of carbon tax policies on the efficiency of the maritime supply chain. The study demonstrates that, under a carbon tax mechanism, ports should adopt limited non-cooperative strategies to optimize overall performance.
Service attributes such as capacity, transit time, reliability, and frequency shape decision-making, yet shipping price is a decisive factor in carrier choice. Hence, accurate and forward-looking price information is critical for sound strategic planning (Cullinane et al., 2012; Tang and Wan Sun, 2018). Fox (1992) constructed models of ocean liner cartel pricing and quality setting. Fox pointed out that despite collusion, monopoly profits are unmet due to myopic quality choices. Shah and Brueckner (2012) incorporated shippers’ loyalty into the analysis and developed a model of price and frequency competition among carriers. Lin et al. (2021) developed a pricing decision model that incorporates factors such as price elasticity, market competition, and green investment. The findings reveal that in a market with strong environmental concerns, shipping lines that prioritize green initiatives can achieve higher payoffs than those solely pursuing profit maximization. Zhang et al. (2025) analyzed green-pricing strategies of marine freight platforms under different competition modes and found that monopolies maximize profit via low commissions, while multi-homing competition leads to strategic profit dominance.
The fiercely competitive nature of the maritime industry has long attracted widespread scholarly attention. Among various issues, freight rate competition represents a critically important topic. Multiple factors influence shipping pricing, including market competition, policies, and service quality aspects such as reliability, all of which have been validated in previous studies. Within the sector, technology licensing serves as a common form of collaboration and competition. Whether it involves energy-saving and emission-reduction technologies for vessels, shipping management systems, or the application of green fuels, shipping companies often facilitate the diffusion and adoption of technologies through licensing agreements. However, whether and how technology transfer affects final pricing in the maritime industry remains a question that demands further exploration.
2.4 Green innovation licensing
The global imperative to mitigate climate change and reduce environmental degradation has positioned green technology transfer as a cornerstone of international environmental policy efforts. Technology licensing represents a formalized channel for such transfer, enabling the diffusion of environmental innovations while presenting complex strategic decisions for technology holders (Hall and Helmers, 2013).
Similar to the classical licensing game literature (Kamien, 1992; Kamien and Tauman, 2002; Arora and Fosfuri, 2003), a number of studies on green innovation licensing have also examined optimal licensing strategies through the lens of payment schemes (such as fixed fees or royalties) and licensing structures (unilateral or cross-licensing). However, compared with research on non-green innovation, this body of work often places greater emphasis on the roles of policy incentives, environmental regulation, and corporate social responsibility (CSR). As a result, the research objectives tend to align more closely with broader societal interests.
For example, Li (2021) demonstrated that when CSR is taken into account, fixed-fee licensing may be preferred even in scenarios where royalty-based schemes would traditionally be considered optimal. Zhang et al. (2024) investigated fixed-fee licensing strategies focusing on unilateral and cross-licensing among competing firms under emissions trading schemes. Their analysis reveals interactions between licensing choices, market competition, and environmental regulation, highlighting how cross-licensing can accelerate innovation diffusion by combining complementary technologies. Similarly, Li et al. (2022) analyzed optimal green technology licensing in a mixed oligopoly, comparing fixed-fee and royalty mechanisms. Their findings indicate that the optimal strategy is contingent on the relative efficiency of public versus private firms, with distinct implications from those observed in purely private market structures.
Lin et al. (2024) conducted a strategic analysis of unilateral green technology licensing under a carbon cap-and-trade framework, showing that environmental regulation, particularly carbon pricing, can significantly reshape firms' licensing incentives, potentially encouraging technology diffusion that would not occur in its absence. Complementing this perspective, Ma and Sun (2023) examined the role of government subsidies in green technology licensing, focusing on firms with differing efficiency levels. Their study finds that the effectiveness of such subsidies hinges on both the relative efficiency of the firms involved and the specific design of the subsidy scheme, which may at times lead to unintended outcomes.
This orientation toward public interest is also evident in empirical research. Kim (2011) examined the role of the patent system in promoting innovation and technology transfer for climate change mitigation. Their study highlights how legal frameworks, policy instruments, and patent information systems influence green technology development and licensing, and their study identifies potential reforms to improve environmental outcomes without undermining innovation incentives. Piana (2022) examined the diffusion of green technologies via patents and licensing, focusing on measures such as expedited examination for green patents. While such initiatives can support innovation and dissemination, their impact has been constrained by a decline in green patent applications in certain jurisdictions, underscoring the need for patent system reforms that effectively balance innovation and diffusion goals.
However, while regulatory authorities can design mechanisms intended to steer firm behavior toward socially desirable outcomes, this does not guarantee that firms will adopt the strategies most preferred by policymakers. Firms remain fundamentally profit-driven, and profit maximization continues to serve as the primary criterion guiding their strategic decisions. Therefore, how to effectively align public policy goals with corporate interests remains a key issue in the governance of green innovation to be solved.
3 Model description
Consider a market with two competing shipping firms, each offering alternative services. One of these firms holds a patent for green technology that reduces carbon emissions during shipping operations, while the other can only continue using traditional technology unless it acquires a license for the green technology. For clarity, we will refer to the firm holding the patent as the “patentee” and the competing firm as the “potential licensee”. Both firms are subject to a carbon tax imposed by environmental regulations.
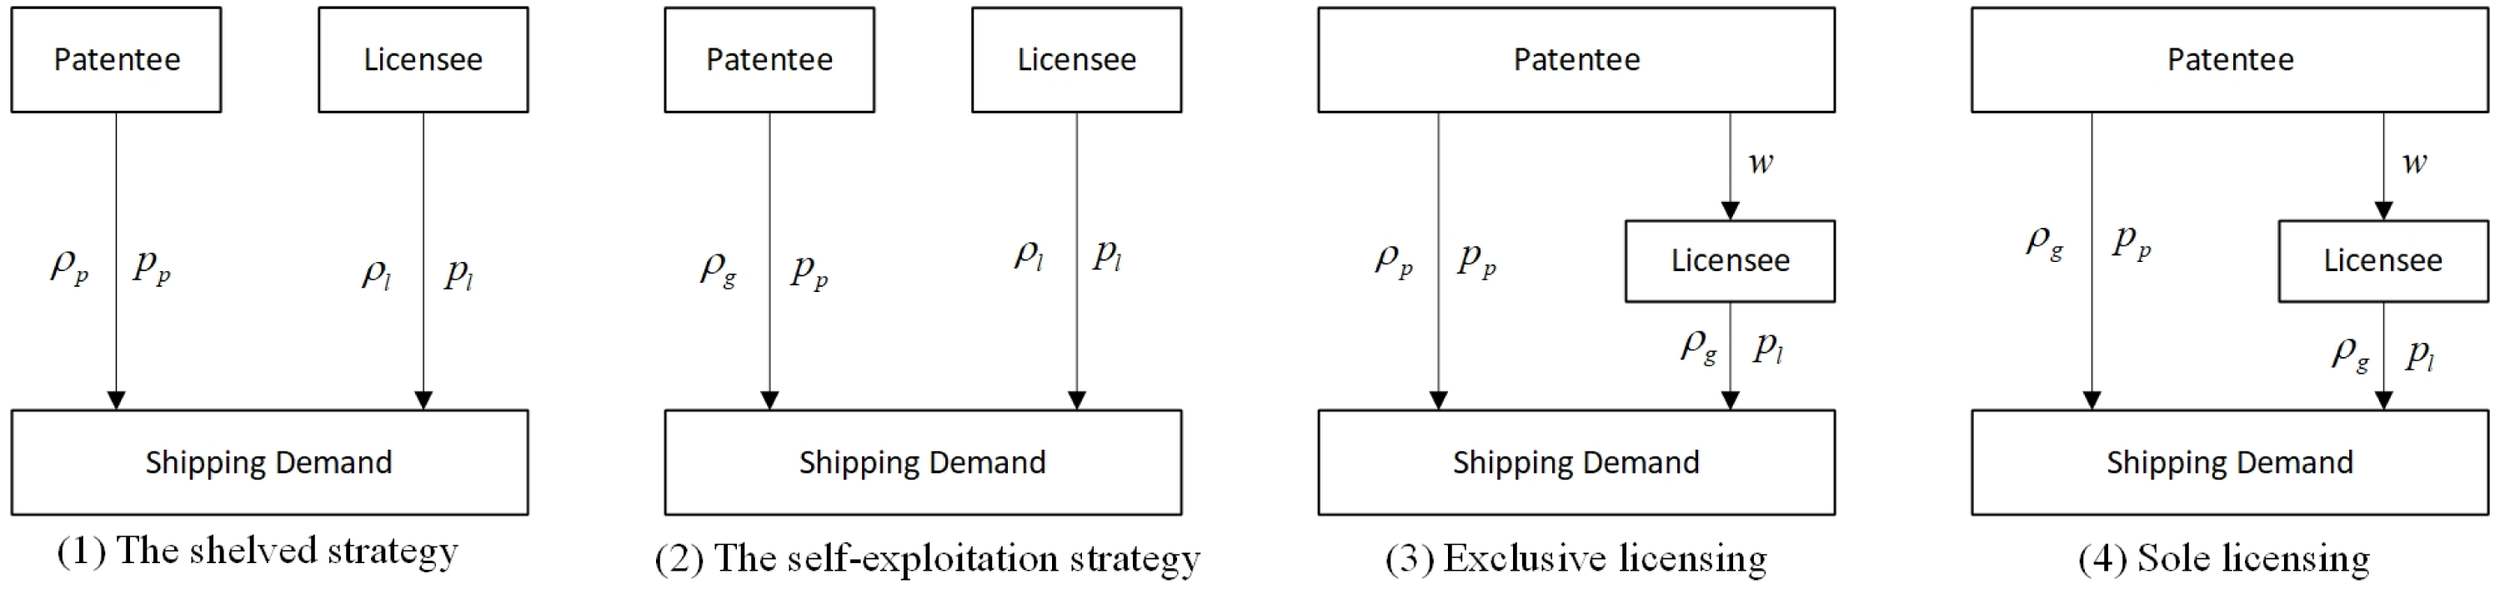
Typically, after achieving R&D success, the patentee has four distinct strategic options (see Figure 1). The first is the shelved scenario (denoted as strategy N), in which the patentee, despite having obtained the patent, chooses not to implement the technology in the shipping industry. At this time, both parties just need to decide on their prices. This scenario often arises when the patentee anticipates that the costs of adopting the technology outweigh its potential benefits, whether due to high implementation expenses, regulatory constraints, or insufficient market demand.
Figure 1
A schematic of the model.
The second option is the self-exploitation scenario (denoted as strategy S), where the patentee decides to adopt the green technology exclusively for their own operations without licensing it to the licensee. Since no licensing occurs in this scenario, both parties also only need to engage in pricing decisions. This strategy is commonly observed when the patentee aims to secure a competitive advantage by lowering their own emissions while restricting competitors from accessing the innovation.
Another possibility is exclusive licensing (denoted as strategy E), in which the patentee grants an exclusive license to a single licensee, relinquishing their own right to use the technology and continuing high-carbon shipping. This scenario is relatively rare, as it suggests that the patentee prioritizes licensing revenues over direct environmental benefits. In real-world scenarios, exclusive licensing is occasionally observed when the licensee possesses significantly stronger market power, superior operational capabilities, or an established customer base, facilitating more efficient commercialization of the technology. Alternatively, this approach may be adopted when the patentee is seeking a strategic transition, such as shifting focus to other business areas or restructuring operations.
Finally, there is the sole licensing scenario (denoted as strategy SO), in which the patentee not only applies the green technology in their own shipping operations but also licenses it to a licensee. This is one of the most common cases, as it allows the patentee to benefit from both direct technological implementation and licensing revenues. By adopting this approach, the patentee can enhance their own competitiveness in green shipping while simultaneously expanding the technology's market adoption, thereby accelerating industry-wide decarbonization.
Common types of licensing structures include exclusive licensing, sole licensing, non-exclusive licensing, and cross-licensing. Exclusive, sole, and non-exclusive licensing fall under unilateral licensing, whereas cross-licensing belongs to bilateral licensing. It is worth noting that this paper focuses on exclusive licensing and sole licensing, which exhibit clear legal distinctions specifically regarding whether the licensor retains the right to use the technology, providing a stable and well-defined baseline for comparison. In contrast, other licensing approaches, such as non-exclusive licensing, differ fundamentally in their authorization structures, market intentions, and commercial implications. Including them within the same analytical framework would obscure the research focus and introduce unnecessary complexity and imprecision into the analysis. Therefore, to enable a more in-depth and concentrated investigation, a deliberate and clearly bounded research scope has been established.
Under both exclusive and sole license agreements, the decision-making sequence we consider is as follows: the patentee determines the licensing fee first, and then, based on that, both the patentee and the licensee independently decide on the market prices for their respective products. The distinction lies in that under an exclusive license, the patentee’s market price is determined only by the conventional technology, whereas under a sole license, the market prices of both the patentee’s and the licensee’s products depend on the innovative technology.
Strategies E and SO involve licensing decisions, where the patentee first sets the licensing royalty rate w, followed by both parties independently determining their respective pricing decisions. The relevant notations and parameters associated with these four strategic choices are presented in Table 1.
Table 1
| Type | Notation | Description |
|---|---|---|
| Decision variables | pi | The price of unit shipping service provided by the patentee (licensee), where i = p, l. |
| w | Patent licensing royalty rate. | |
| Parameters | Di | The demand of patentee’s (licensee’s) shipping service, where i = p, l. |
| a | Market potential. | |
| θ | Product substitutability. | |
| τ | Carbon tax rate per unit of carbon emission. | |
| ρi | Initial unit carbon emission during shipping operations for the patentee (licensee), where i = p, l. | |
| ρg | Unit carbon emission after applying green technology. | |
| Fi | Patentee’s (licensee’s) setup cost of applying green technology to shipping operations, where i = p, l. |
Notations.
Before elaborating on each strategic choice, we establish the following assumptions:
Assumption 1. Customer demand: This paper adopts the following linear demand functions (See Equations 1, 2), which are widely used in supply chain literature (Gurnani et al., 2007; Ranjan and Jha, 2019; Li, 2020):
Here, a represents the market potential, while θ captures the degree of product substitutability, reflecting the intensity of market competition. As θ approaches 1, the two products become increasingly similar, indicating a highly competitive market with strong substitutability. Conversely, as θ approaches 0, the products become more differentiated, leading to weaker substitutability and reduced competitive pressure (Ingene and Parry, 2007; Cai et al., 2012).
Assumption 2. Carbon emission: Drawing on the framework of existing cost-reducing and quality-enhancing innovation licensing papers (Chen et al., 2023; Kamien et al., 1992; Zhang et al., 2024), although there is no explicit size relationship between the initial carbon emission baselines of the patentee ρp and the licensee ρl, the adoption of green technology can effectively reduce both parties’ emissions to ρg.
This assumption is justified by the fact that in the shipping industry, green technologies are typically standardized and endorsed by authoritative institutions, ensuring their universality and compliance with industry standards. Technologies such as low-carbon fuel solutions and energy-efficient vessel designs are developed to comply with stringent environmental regulations rather than being tailored to specific firms’ initial emission levels.
3.1 The shelved strategy
In strategy N, the patentee neither adopts nor licenses the green technology, instead maintaining the current state of shipping operations with existing emission levels.
Referring to Ding and Jin (2019) depiction of the carbon tax, the patentee’s profit can be expressed by . The manufacturer uses traditional technology for production, and their profit is . The patentee and the licensee independently determine their respective market prices to maximize their own profits. Here, without the loss of generality, we normalize the production costs of the two firms to zero for simplicity.
3.2 The self-exploitation strategy
Under this condition, the patentee uses their own green innovation technology in shipping but does not license it. At the same time, applying (or commercializing) the technology requires a fixed investment . Then, the profit function of patentee can be expressed by , while the licensee’s profit function keeps the same with strategy N. Here, we refer to the payoff part that does not account for fixed investments as , where .
3.3 The exclusive licensing strategy
When using the exclusive license, only the licensee can apply the technology for low-carbon shipping and reduce the unit carbon emission to ρg. However, while the patentee cannot directly implement low-carbon shipping, they can earn licensing revenue from the licensee. Thus, the profit functions changed to (see Equations 3, 4).
The payoff function of licensee is πlE = (pl − w − τρg)Dl.
3.4 The sole licensing strategy
In a sole licensing strategy, the patentee, while applying the carbon reduction technology themselves, also grants the licensee permission to use it, thereby promoting the technology across the entire industry. At this time, the unit carbon emission of both parties decreased to ρg. The profit functions of the patentee and the manufacturer are as follows (see Equations 5, 6):
The payoff functions are (see Equations 7, 8).
4 Result analysis
In this section, we will first present the equilibrium solutions under different strategies, followed by an analysis of the patentee’s optimal licensing strategy under varying initial carbon efficiencies of the two parties. Finally, from the perspective of the regulator, we will analyze how carbon tax policies can align the goals of different stakeholders.
4.1 The optimal strategy of the patentee
Based on the profit functions of each strategy in Section 3, we can obtain the equilibrium solutions of licensing fee rate w and the price p, as well as feasible regions that maximize the profits of both parties, as detailed in Proposition 1.
Proposition 1. Equilibrium prices and license fees under different strategies,
where , , , .
As shown in Table 2, regardless of the strategy adopted, an increase in carbon tax leads to higher prices, indicating that the tax burden is transferred to shippers. However, whether licensing occurs affects the sensitivity of prices to carbon tax fluctuations. Specifically, in the absence of licensing, the carbon tax imposed by the government is entirely passed to shippers, resulting in substantial price volatility in response to tax changes. Conversely, when licensing takes place, the carbon tax burden is not fully transferred; instead, part of it is absorbed and mitigated through licensing activities, enabling carriers to adopt a more stable pricing strategy in the face of carbon tax variations.
Table 2
| Strategies | Strategy | Strategy | Strategy | Strategy |
|---|---|---|---|---|
| Feasible regions | , if | |||
| , if | ||||
Equilibrium solutions.
However, in this context, although the patentee theoretically has four strategic options, not all of them are feasible under different carbon tax environments. The feasibility of each strategy varies, leading to distinct application scenarios.
Lemma 1. As the carbon tax increases, the number of strategies available to the patentee decreases. The set of potential available strategies under different carbon tax policies is closely related to the relative carbon reduction effects of the two firms, Δpg and Δlg, as shown inTable 3.
Table 3
| Carbon tax | High | Medium high | Medium low | Low | |
|---|---|---|---|---|---|
| Available strategies | SO | SO, S | SO, S, N | SO, S, N, E | |
| SO | SO, N | SO, N, S | SO, N, S, E | ||
| SO | SO, N | SO, N, E | SO, N, E, S | ||
| SO | SO, E | SO, E, N | SO, E, N, S | ||
Potential strategies for patentees under different carbon tax environments.
and .
Carbon taxes serve as a policy instrument to internalize the externalities associated with carbon emissions, compelling firms to treat carbon-related social costs as part of their marginal cost structure when formulating operation and licensing strategies. In competitive markets, pricing decisions by both the patentee and the licensee are mutually influential. As carbon taxes rise, these marginal costs increase accordingly, compressing profit margins through intensified price competition. Consequently, some licensing strategies that were previously viable may no longer generate sufficient returns under the new cost structure and are thus eliminated from the firm's feasible strategies set.
This effect is particularly pronounced for the non-innovating party (i.e., the licensee), who must bear both its own carbon tax burden and the additional cost of licensing the green technology. Similarly, for the patentee, if a licensing strategy fails to offset carbon costs efficiently or offers limited pricing flexibility, the strategy may likewise become unprofitable. Therefore, only those licensing strategies that effectively internalize carbon costs between both parties, alleviate pricing pressure, and preserve sufficient payoff buffers can remain feasible across a broader range of carbon tax levels.
As shown in Lemma 1, strategy SO exhibits structural advantages by allowing both parties to adopt the green technology and symmetrically reduce emissions, mitigating the risk of either firm falling into a disadvantageous competitive position due to inferior carbon efficiency. As a result, strategy SO allows both firms to avoid substantially raising prices or inflating licensing fees to offset carbon costs, thereby maintaining stable market demand and profitability even under higher carbon tax environments. Among all licensing structures, it thus demonstrates the greatest resilience.
By contrast, strategies S and E, which allow only one of the two carriers to apply the green technology, tend to have narrower applicability and are more dependent on the initial carbon efficiency structure of the two parties. In general, the carrier with a lower initial carbon efficiency faces greater pressure to reduce emissions. Therefore, the licensing strategy that grants this party access to the green technology tends to exhibit greater resilience under carbon tax pressure. For example, when the licensee has significantly lower carbon efficiency than the patentee, strategy E is more robust than strategy S; the opposite holds when the patentee is under greater pressure to decarbonize.
However, the feasible carbon tax range for strategy E is typically more restricted than that of strategy S. Even in cases where the licensee's decarbonization pressure is slightly higher than that of the patentee, the level of carbon tax that strategy E can accommodate often remains lower than that of strategy S. One important reason is that under strategy E, the patentee is unable to apply the green technology and still bear the full tax burden. Consequently, the patentee must rely on licensing revenues to offset these costs, increasing its dependency on the licensee's market performance and decarbonization effectiveness. This heightened reliance raises the threshold for successful implementation and ultimately reduces the adaptability of strategy E.
It is worth noting that when , that is, when the initial carbon efficiency gap between the patentee and the licensee is relatively small, strategies E and S may disrupt an otherwise balanced market structure. In such cases, the non-adopting firm bears a heavier carbon tax burden and greater pricing risks, which can reduce the overall robustness of the strategy, sometimes making strategies E and S even less robust than strategy N, which maintains competitive balance despite no decarbonization. By contrast, when the carbon efficiency gap is large, the unilateral decarbonization enabled by strategies E and S not only effectively reduces carbon costs but also helps rebalance the previously asymmetric market structure, thereby enhancing the strategies' overall stability.
Proposition 2. Within any carbon tax range where strategy comparisons are feasible, we have . The relative size between and depends on the intensity of market competition and the relative carbon-reduction effectiveness of the two firms. Based on this:
-
When , and always holds. However, whether strategy SO dominates others depends on how much Fp erodes the payoff advantage of SO.
-
When , strategybecomes infeasible, always holds. While whether strategydominates strategydepends on whether the setup costerodes its payoff advantage. In this case:
-
Under a low carbon tax and a highly competitive market, strategy E tends to be more favorable. The larger the Fp and the closer the two firms' initial carbon efficiencies, the greater the profit advantage of strategy E.
-
Under a moderate carbon tax, as long as , the optimal licensing strategy is the one that allows the firm with the lower initial carbon efficiency to apply the green technology.
-
No strategy is feasible under a high carbon tax.
-
3. When, both strategies SO and E become infeasible. Unless, the patentee will eventually shelve the technology as the carbon tax increases, potentially failing to meet regulatory compliance.
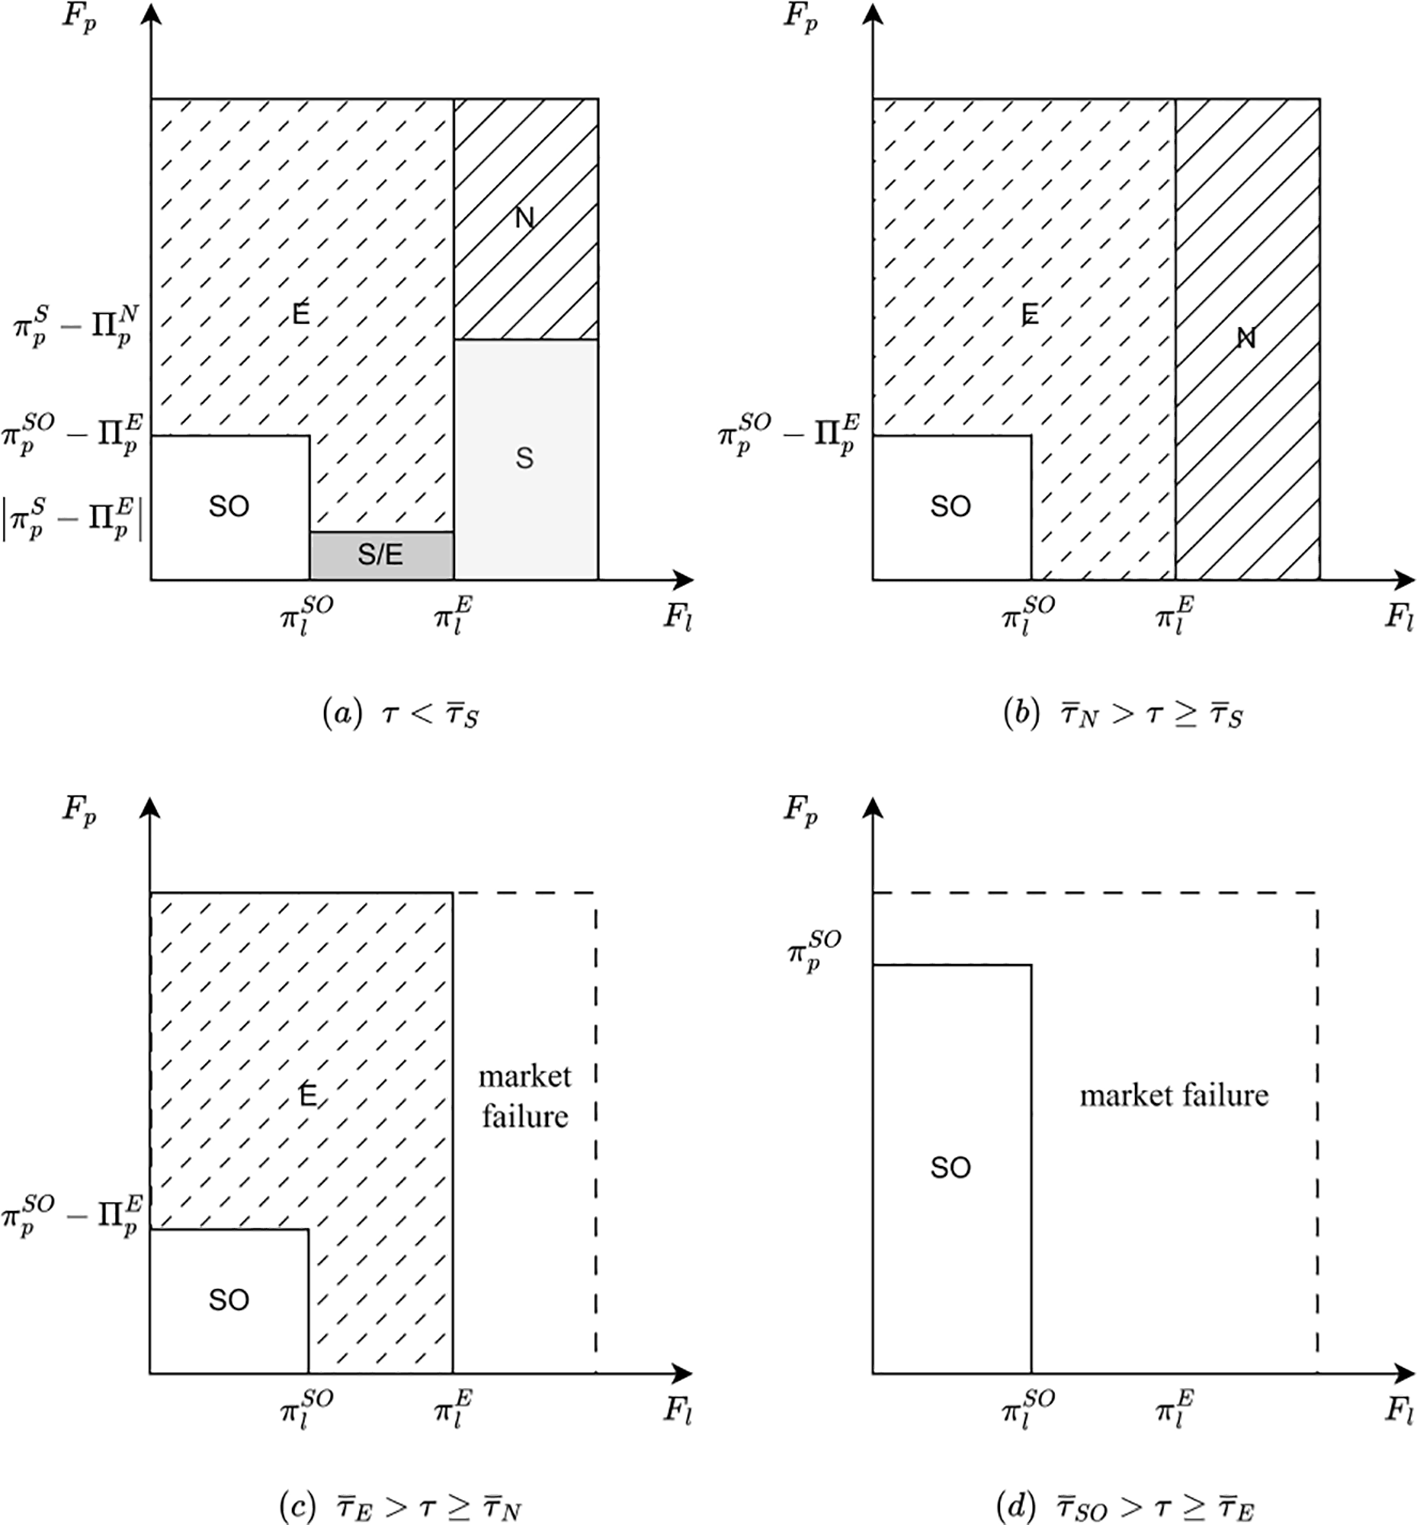
To provide a clearer illustration, we present the optimal strategy structures of the patentee in Figures 2–5.
Figure 2
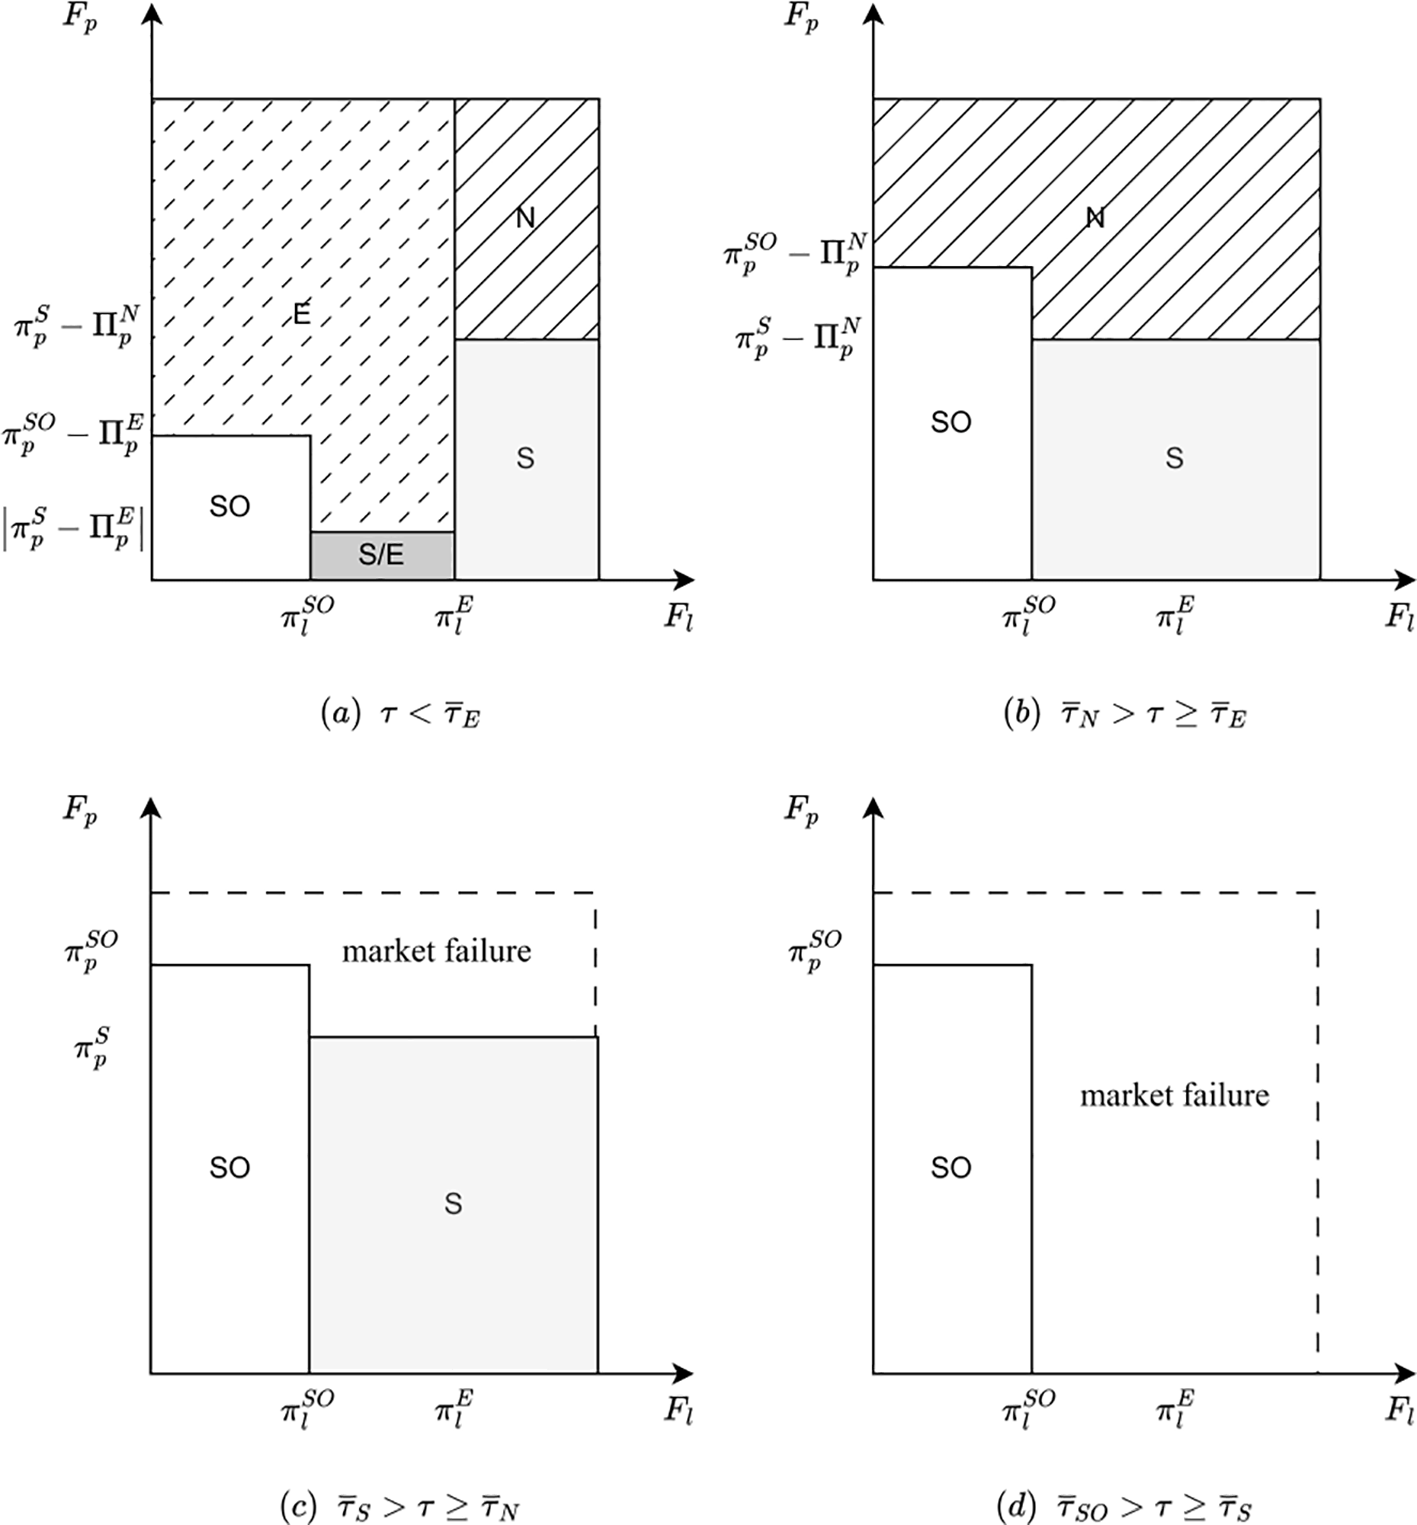
Optimal strategies for patentee when , with the horizontal axis representing the licensee's technology adoption cost and the vertical axis representing that of the patentee. (a–d) Schematic diagrams of the patentee's optimal strategies under different ranges of carbon tax. Taking panel (a) as an example, when , and , SO is the dominant strategy. Figures 3-5 all represent the same concept.
Figure 3
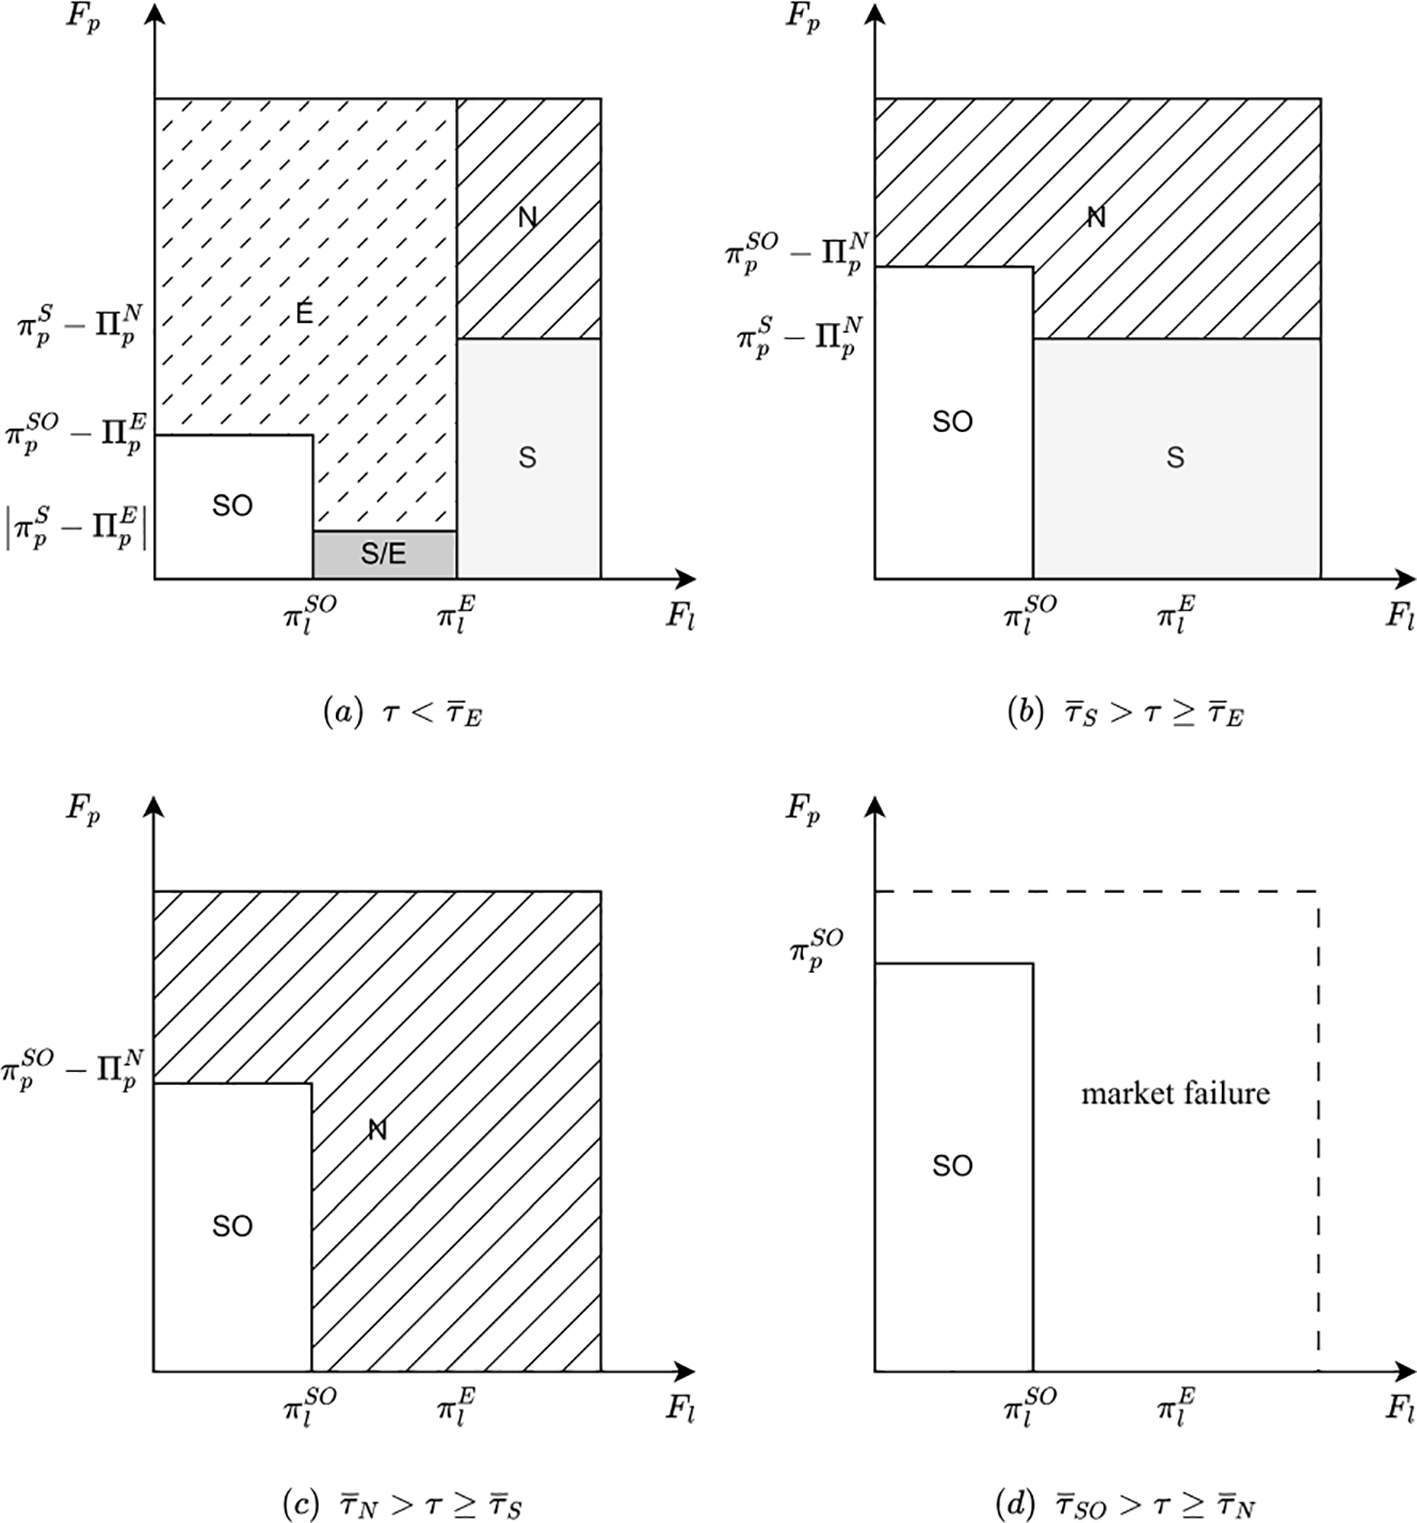
(a–d) Optimal strategies for patentee when with the horizontal axis representing the licensee's technology adoption cost and the vertical axis representing that of the patentee.
Figure 4
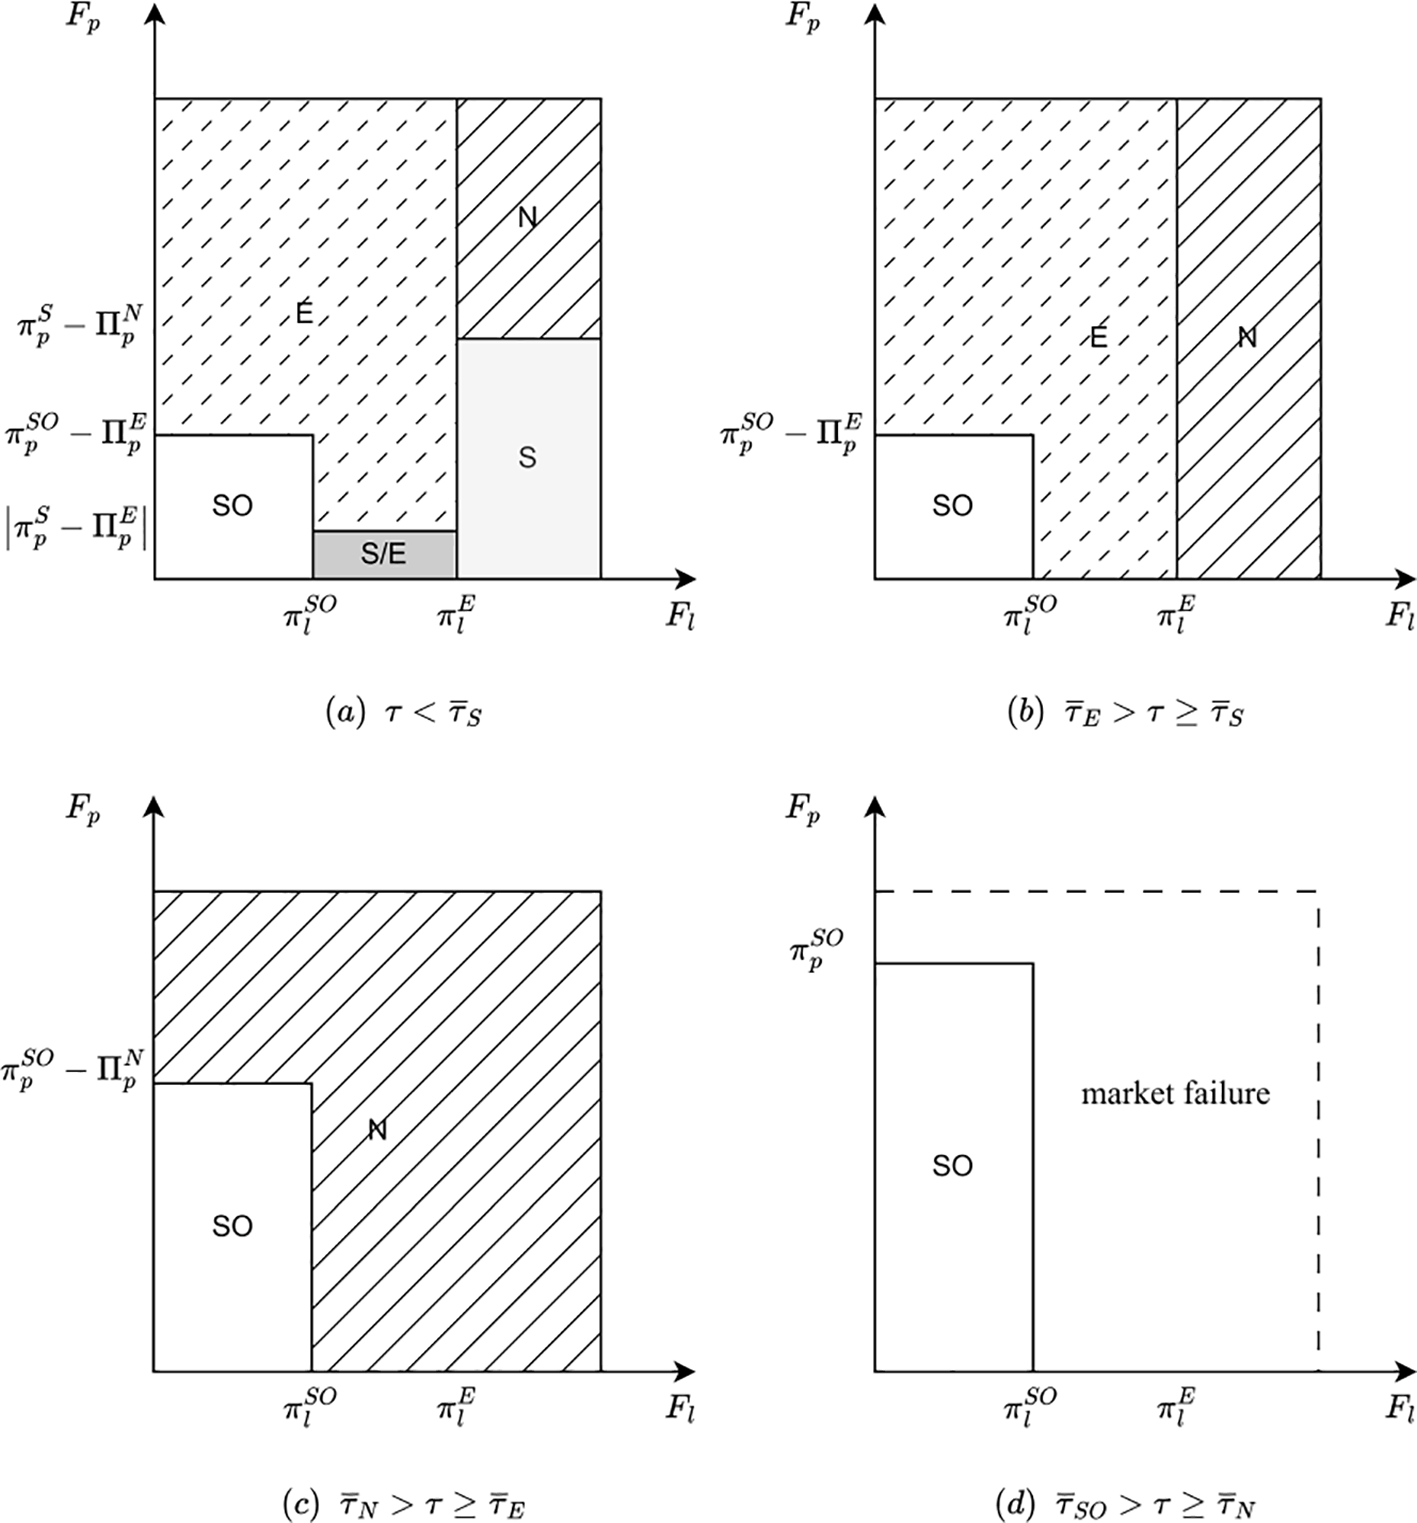
(a–d) Optimal strategies for patentee when with the horizontal axis representing the licensee's technology adoption cost and the vertical axis representing that of the patentee.
Figure 5
(a–d) Optimal strategies for patentee when with the horizontal axis representing the licensee's technology adoption cost and the vertical axis representing that of the patentee.
It can be observed that within any feasible carbon tax range, strategy SO consistently yields the highest payoff for the patentee owing to its lower carbon cost, higher market demand, and associated licensing revenues. In contrast, strategy N produces the lowest payoff, as it offers no mechanism for mitigating carbon pressure.
However, payoffs do not equate to final profits, as the application of any green technology requires an initial capital investment. These technology adoption costs can vary significantly: some technologies, such as route optimization systems or fuel-efficient navigation software, require relatively modest investments; others, such as switching to cleaner fuel engines or undertaking major vessel retrofits, entail substantially higher costs. As technology adoption costs increase, strategies that are initially less attractive in terms of payoff may eventually yield higher net profits, potentially changing the firm's optimal choice.
As discussed earlier, strategy SO demonstrates both high resilience and attractive payoffs, making it the most adaptable option among all licensing structures. However, this strategy also faces inherent limitations: because it requires both parties to adopt and invest in the green technology, it is only feasible when both firms can maintain non-negative profits. If either party, particularly under high technology adoption costs, fails to ensure basic profitability, the foundation for cooperation collapses, rendering the strategy SO unviable.
Therefore, strategy SO is better suited to contexts where technology adoption costs for both parties are relatively manageable, especially when these costs do not significantly erode the patentee's profitability advantage. In fact, such situations are quite common in practice, largely because the green technologies considered in this paper fall under the category of process innovations. Unlike drastic innovations, process innovations primarily focus on optimizing and upgrading existing operational procedures. As a result, they typically feature replicability, lower implementation barriers, and stronger cross-firm compatibility, making them more readily adoptable across the industry and more conducive to large-scale diffusion.
As the licensee's technology adoption costs increase, strategy SO gradually becomes infeasible, making the selection process more complex. However, it is clear that since all alternative strategies operate within narrower feasible carbon tax ranges than strategy SO, the failure of strategy SO implies that no licensing structure can sustain operation under high carbon tax environments, potentially leading to market failure.
Then, under moderate carbon tax levels, strategies E and S typically yield higher payoffs than strategy N. In most cases, the patentee can achieve optimal profits by selecting the strategy that grants green technology access to the party with lower initial carbon efficiency, unless the patentee's own technology adoption costs are prohibitively high, significantly eroding the profitability of any licensing arrangement and leading to technology shelving.
Additionally, strategies E and S are only simultaneously feasible under low carbon tax conditions, and neither consistently dominates the other. However, we find that in more competitive markets, strategy E often outperforms strategy S, with its relative advantage increasing as the initial carbon efficiency gap between the two parties narrows.
A plausible explanation is that under low carbon taxes, regulatory pressure is limited, and market forces become the primary driver of technology adoption. In highly competitive environments, licensing the green technology to a rival (strategy E) allows the patentee to monetize the innovation without incurring substantial fixed costs while maintaining its competitive position by strategically adjusting the licensing fee.
When the licensee faces prohibitively high technology adoption costs, strategy E becomes infeasible, shifting the burden of adoption back to the patentee. However, whether the patentee proceeds with implementation depends on the initial carbon efficiency gap between the two firms. Only when this gap is sufficiently large () such that strategy S offers the patentee substantial technological and cost advantages does it become the optimal choice. Otherwise, as carbon taxes rise, the patentee is likely to shelve the innovation due to diminishing returns.
4.2 The optimal policy of the regulator
During the green transition of the shipping industry, regulators serve as facilitators, while firms take on the role of executing the changes. Regulators’ objectives can shift depending on the specific circumstances. At times, their primary focus is on rapidly scaling the adoption of green technologies to accelerate the transition, while at other times, they aim for a more gradual, sustainable shift that balances environmental goals with industry stability. In contrast, firms, driven by the need to mitigate regulatory pressures, prioritize strategies that maximize profits. However, the regulator can guide firms in licensing but cannot make choices on behalf of firms. Thus, these differing motivations can lead to a divergence in preferences for licensing strategies.
In this subsection, we discuss two types of regulators: one facing an urgent need to promote the adoption of green technologies, while the other operates in a less pressing situation and thus places greater emphasis on overall social welfare. We begin by analyzing the licensing strategies that each type of regulator is likely to prefer. Furthermore, we examine how regulators can align their preferred strategy with firms’ profit-maximizing choices, thereby enhancing the coordination between regulatory objectives and market incentives.
Here, we follow the approach of Yenipazarli (2016) by modeling environmental damage as a quadratic function of total carbon emissions: . We define consumer surplus as according to Spence (1976) and August et al. (2021).
Green expansion policy. Regulators eager to accelerate the widespread application of green technologies often face escalating environmental pressures and urgent carbon emission targets. As a result, they pursue rapid technological diffusion to fulfill environmental commitments, reduce carbon footprints, or enhance the industry’s green competitiveness. Therefore, by comparing the green demand under different strategies (i.e., the total amount of green technology services, denoted as GD), we can derive Lemma 2.
Lemma 2. The strategy that maximizes GD for the regulator lies between strategies SO and S:
• when:
–when, if , strategy will maximize the green demand; otherwise, strategy SO will achieve the goal.
–when, strategy SO always yields the largest green demand.
• when τ ≥ strategy SO always yields the largest green demand.
The regulator undoubtedly seeks to promote the diffusion of innovation, rather than allowing it to be shelved. Additionally, the regulator aims to ensure that society can enjoy the benefits of green innovation at the lowest possible cost. Therefore, the regulator is more likely to prefer strategy SO and strategy S, as these strategies align with both the goals of maximizing innovation diffusion and minimizing the societal cost of achieving green innovation.
Proposition 3. When the :
-
If , the regulator can set a higher tax within > τ ≥ , ensuring that the strategy that maximizes green demand (GD) aligns with the patentee's profit maximizing strategy, which is strategy SO.
-
If , in addition to increasing the carbon tax, the government may need to provide additional subsidies to incentivize the patentee to choose strategy SO.
-
If the regulator sets τ < , the regulator’s and the patentee’s preferred strategies may not align. The regulator can provide subsidies to induce the patentee to select the second-best strategy that maximizes GD.
When the regulator sets the carbon tax within a higher range, whether through tax exemptions or direct subsidies, there will always be a way to align policy goals with firms’ profit objectives. However, if the carbon tax is set too low, it becomes difficult to align the regulator’s policy objectives with firms’ profit-maximizing incentives. In such cases, the regulator and the patentee may still coordinate on a second-best licensing strategy through moderate tax adjustments. Notably, the socially optimal strategy under a high carbon tax—namely, strategy SO—often coincides with the regulator's preferred second-best strategy under lower carbon taxes.
Moreover, both GD and environmental damage (ED) decrease with increasing carbon tax. Therefore, when the technology adoption costs are fixed, if the regulator’s goal is solely to maximize green adoption, it may not be necessary to impose a high carbon tax. Instead, it suffices to raise the tax just enough to ensure that the patentee does not deviate from strategy SO in favor of less desirable alternatives. However, if the regulator faces binding decarbonization targets, more aggressive tax increases may still be required to meet those environmental goals.
Sustainable green transition. In many cases, regulators do not aim solely for a rapid decline in carbon emissions over the short term. Instead, they place greater emphasis on the sustainability of the transition pathway and the long-term stability of the industry. Rather than enforcing aggressive policies that compel firms to adopt green technologies at scale within a limited time span, regulators may prefer a gradual diffusion approach. This strategy balances environmental goals with firms' adaptive capacity, helping to avoid potential negative externalities such as employment shocks, market volatility, or the survival challenges faced by small and medium-sized enterprises.
From the perspective of social welfare maximization, regulatory objectives extend beyond ED alone. They also encompass consumer surplus (CS), producer surplus (PS), and government revenue from carbon taxes (T). Accordingly, the welfare function can be represented as SW = CS + PS + T − ED.
Lemma 3. The social welfare function under each strategy is concave in τ.
This observation implies the existence of an optimal carbon tax rate that balances environmental benefits with economic efficiency. However, the optimal tax level varies across different licensing strategies, and even when the carbon tax is set at its welfare-maximizing level, carriers may not necessarily adopt the licensing structure preferred by the regulator. To further explore, we conduct a numerical analysis, specifically setting the parameters as follows: θ = 0.5, a = 50, ρp = 8, ρl = 5, ρg = 3, and µ = 0.1. We begin by examining how changes in technology adoption costs affect strategy choices of the patentee and the regulator.
As shown in Figures 6, 7, strategy SO consistently delivers the highest social welfare across different initial carbon efficiency structures, provided that technology adoption costs remain low. More importantly, under these conditions, strategy SO also aligns with the patentee's profit-maximizing choice. As a result, the regulator can confidently adjust the carbon tax to the level that maximizes SWSOwithout concern that the firm will deviate toward alternative licensing arrangements due to profit incentives.
Figure 6
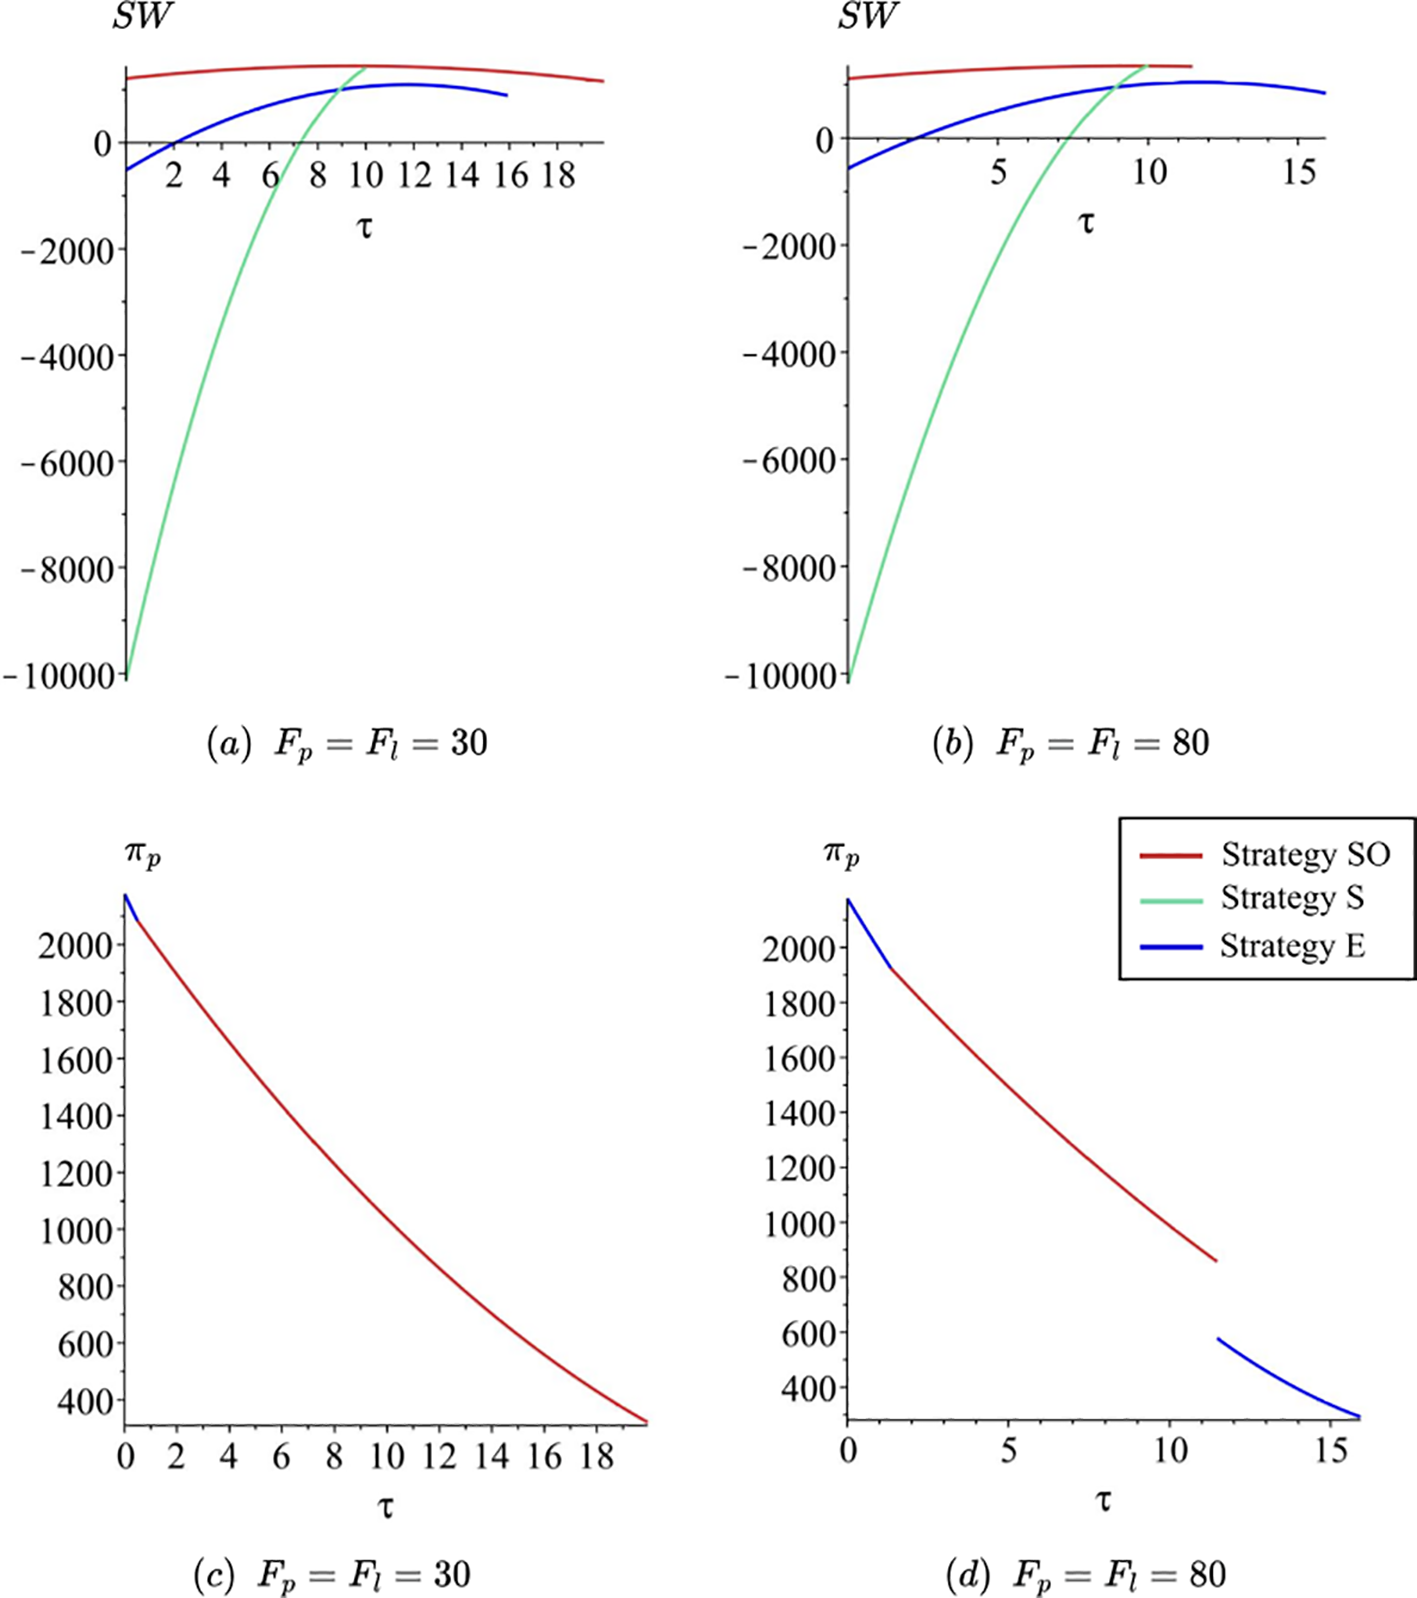
Social welfare comparison under different technology adoption costs when ρl > ρp. (a, b) The performance of social welfare under three different strategies as the carbon tax varies. (c, d) The corresponding optimal profit of the patentee under the dominant strategy across changing carbon tax levels.
Figure 7
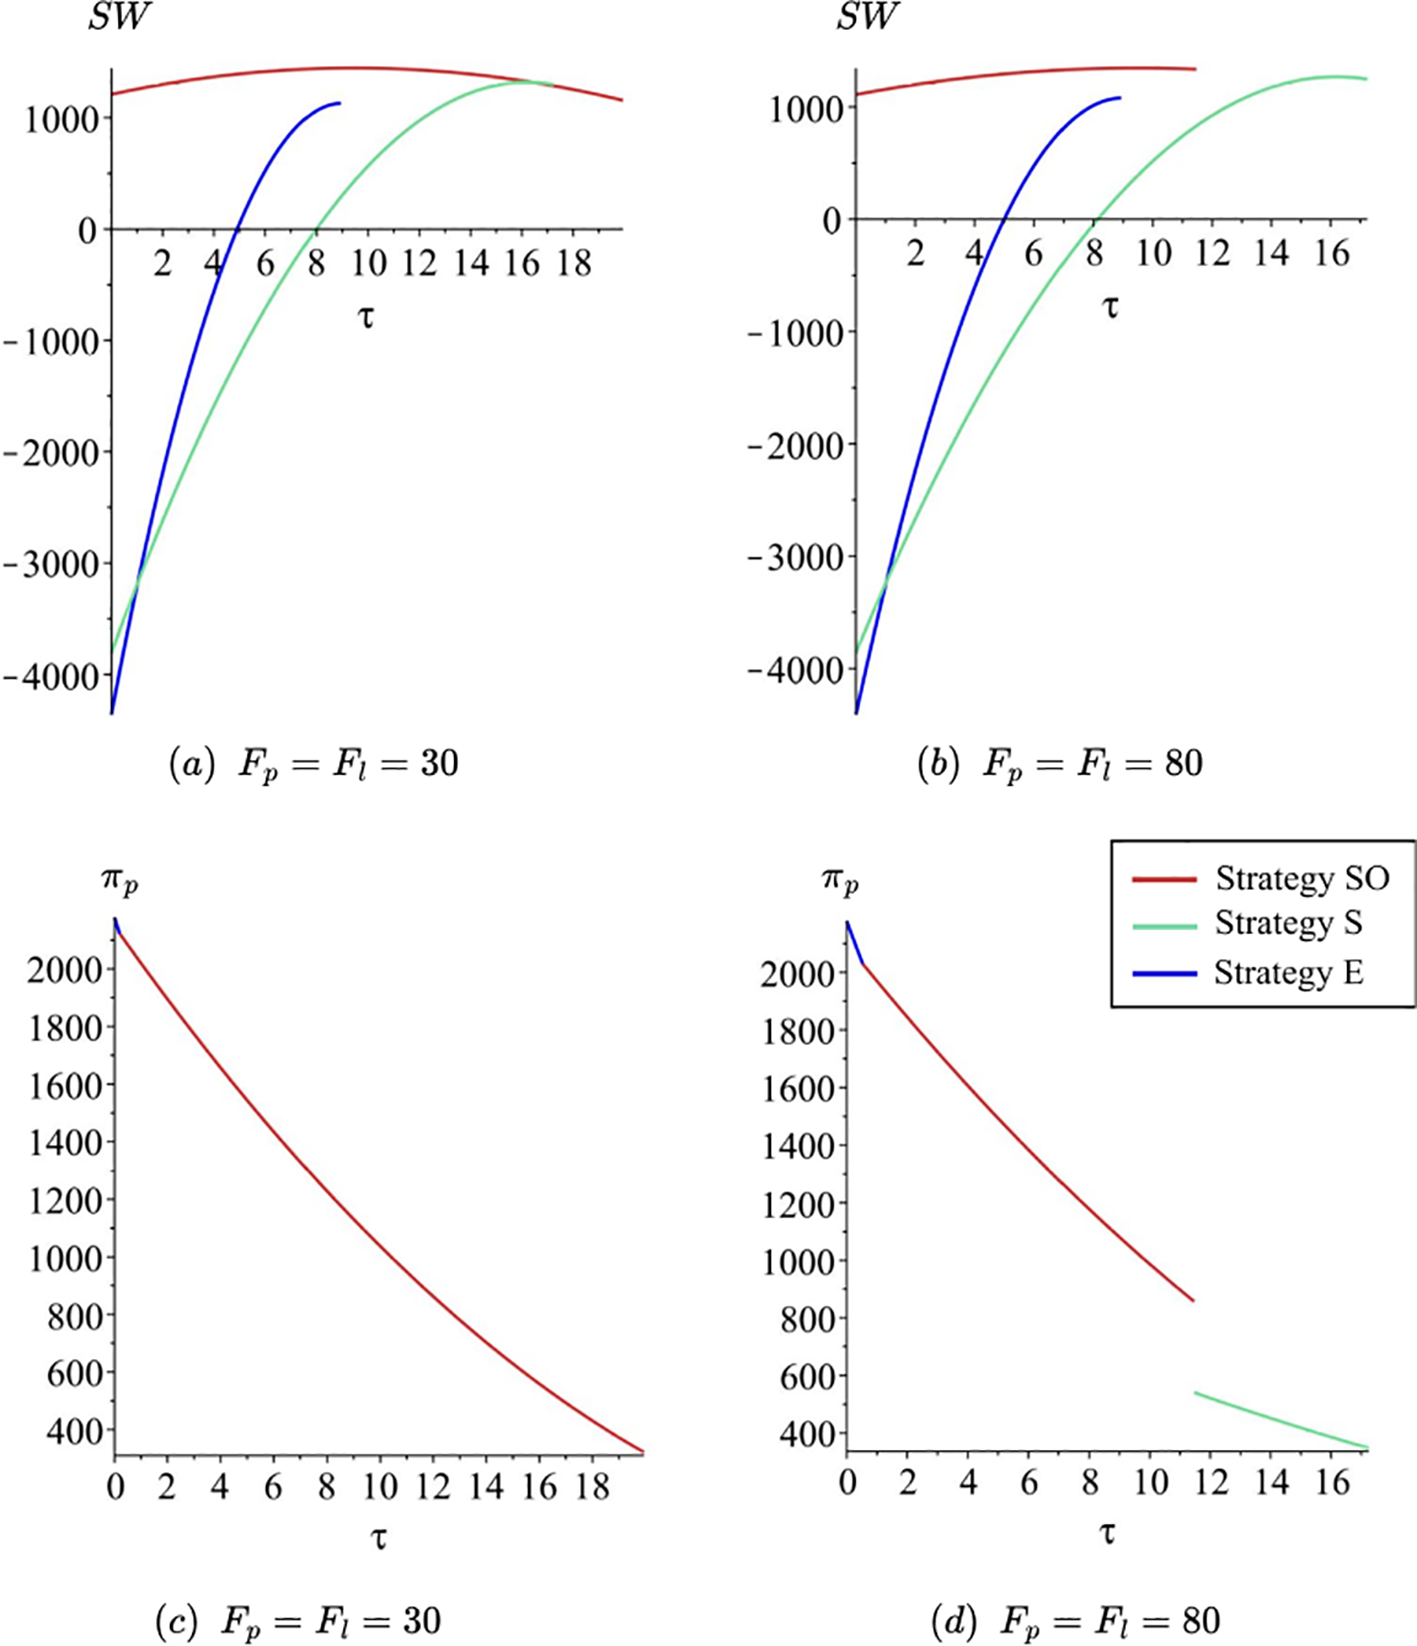
(a–d) Social welfare comparison under different technology adoption costs when ρp > ρl. (a, b) The performance of social welfare under three different strategies as the carbon tax varies. (c, d) The corresponding optimal profit of the patentee under the dominant strategy across changing carbon tax levels.
When technology adoption costs are relatively high, increasing the carbon tax gradually erodes the payoff advantage of strategy SO, resulting in a range of tax levels where this strategy becomes infeasible. In such cases, alternative licensing strategies may still yield relatively high social welfare within the infeasible range of SO and may also even align with the patentee’s profit-maximizing choice (see subfigures (b) and (d) in Figures 6, 7). However, the patentee's optimal profits under these alternative strategies are significantly lower than those attainable under strategy SO. Unless the regulator is under strong pressure to meet stringent emission reduction targets, caution should be exercised when increasing the carbon tax, as doing so may weaken the patentee's business incentives.
We then examine how the optimal licensing strategy changes as the externality cost of carbon emissions (µ) increases (see Figures 8, 9). The parameter settings are θ = 0.5, a = 50, ρp = 8, ρl = 5, ρg = 3, and Fp = Fl = 30. Since the profit curves under these settings are identical to those shown in Figures 6, 7c, we omit them here for brevity.
Figure 8
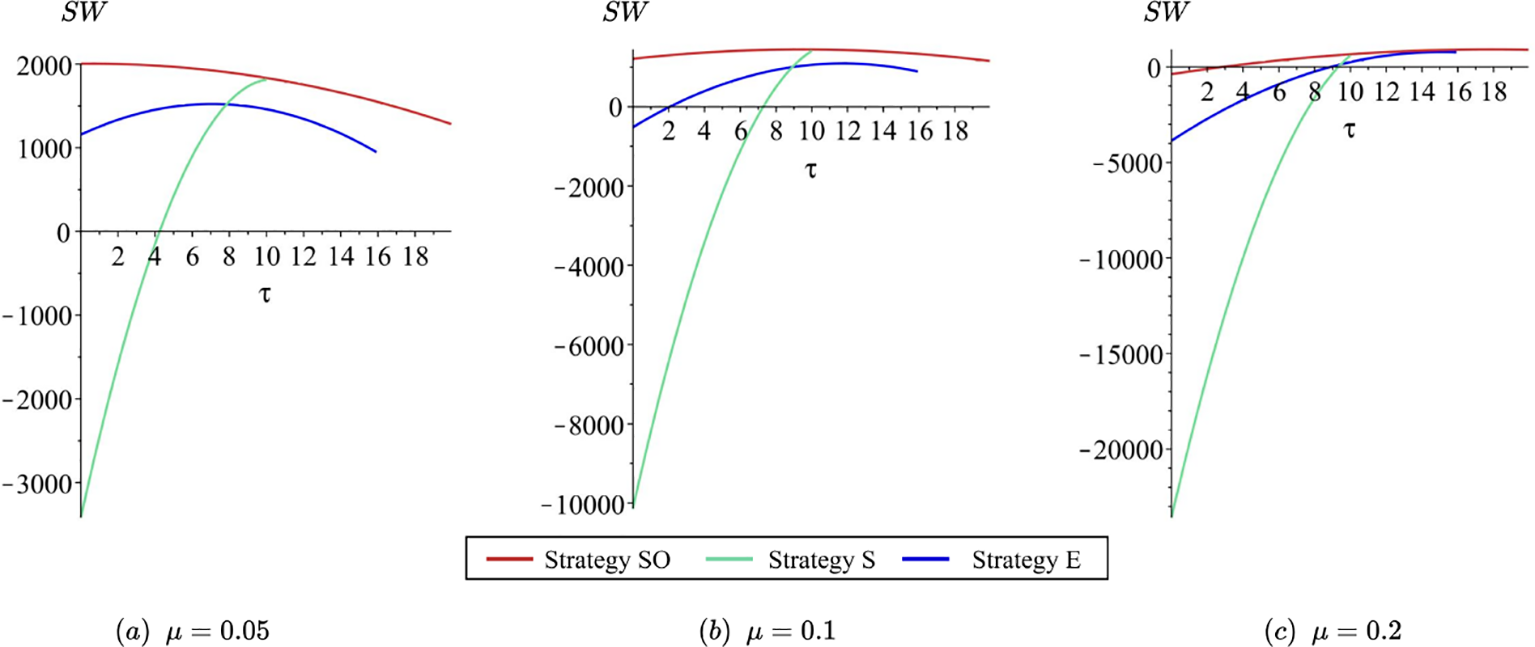
(a–c) Social welfare comparison under different µ when ρl > ρp.
Figure 9
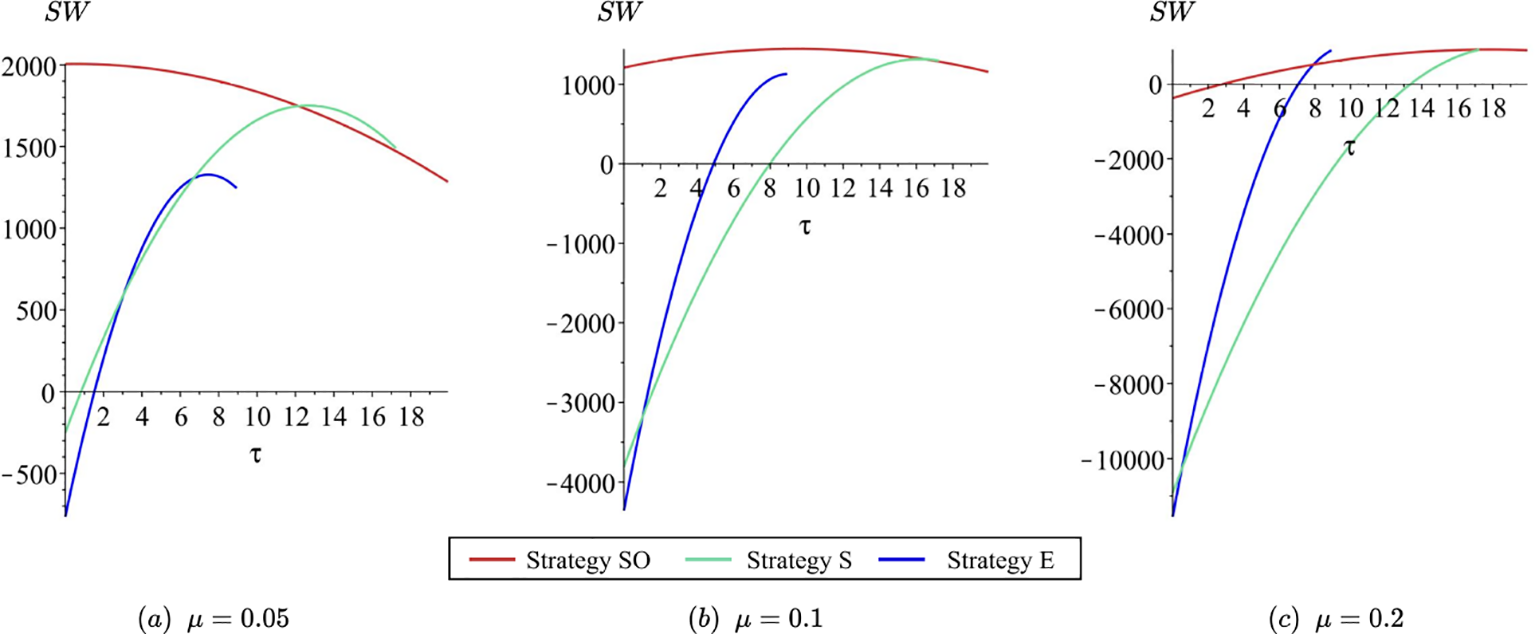
(a–c) Social welfare comparison under different µ when ρp > ρl.
Similarly, from the perspective of social welfare, differences in the initial carbon efficiency between firms do not alter the overall pattern of how the welfare curve responds to changes in µ. What is clear, however, is that as the environmental impact of carbon emissions intensifies, the regulator’s optimal carbon tax level increases accordingly. Although in some instances other strategies may temporarily yield higher social welfare than strategy SO, the patentee’s profit-maximizing choice does not shift correspondingly. Therefore, strategy SO remains the most robust option in many cases, effectively aligning private incentives with policy goals.
Next, as the carbon reduction effectiveness of green technology improves, the regulator can adopt a more flexible approach to carbon taxation. In such cases, only a modest increase in the carbon tax or a small subsidy is sufficient to discourage the patentee from choosing strategy E, thereby aligning private strategic choices with the socially optimal outcome. This coordination leads to maximized social welfare, as illustrated in Figures 10, 11. At this time, the parameter settings are θ = 0.5, a = 50, ρp = 8, ρl = 5, µ = 0.1, and Fp = Fl = 30.
Figure 10
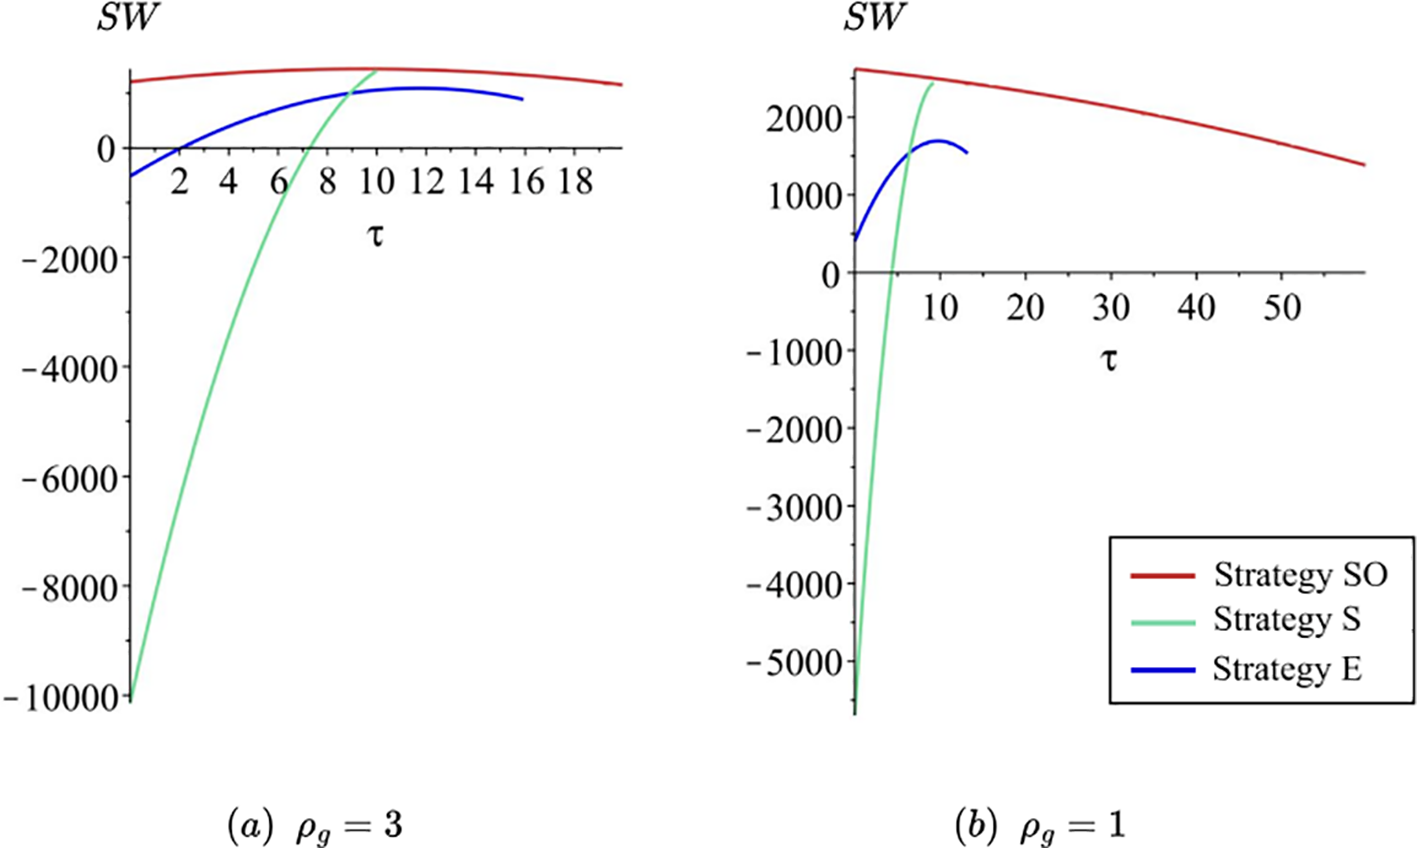
(a, b) Social welfare comparison under different ρgwhen ρl > ρp.
Figure 11
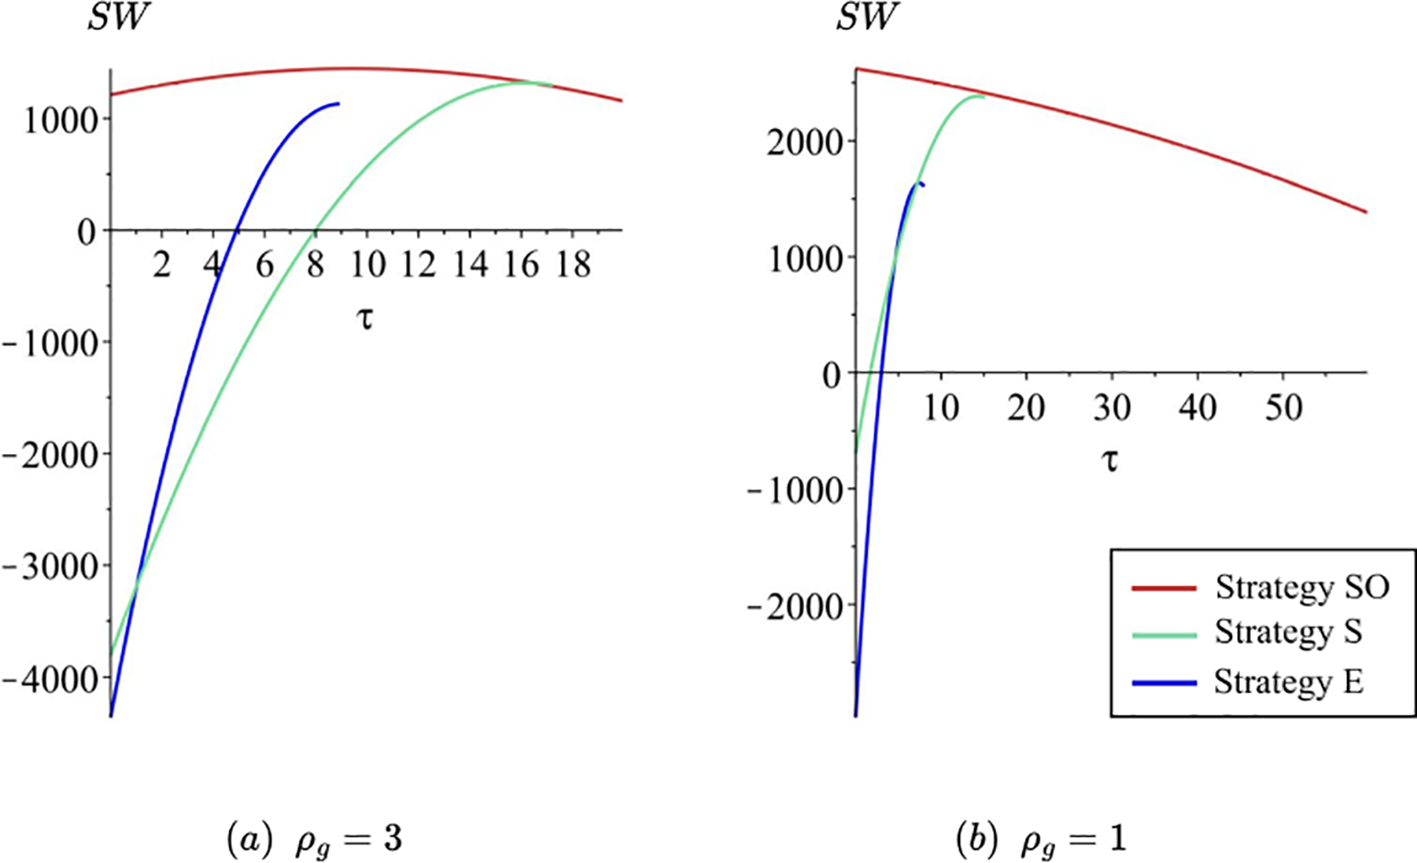
(a, b) Social welfare comparison under different ρgwhen ρp > ρl.
Finally, we examine the impact of market competition by varying the competition intensity parameter θ from 0.1 to 0.9 while holding all other parameters constant (see Figures 12, 13). The results show a clear pattern: as market competition intensifies, the feasible carbon tax ranges for all licensing strategies expand significantly. Moreover, from the regulator's perspective, more competitive markets yield substantially higher levels of social welfare even when the carbon tax is not precisely adjusted to its theoretical optimum. This implies that strong competition can partially compensate for imperfect policy calibration, offering a more flexible and resilient environment for green technology adoption.
Figure 12
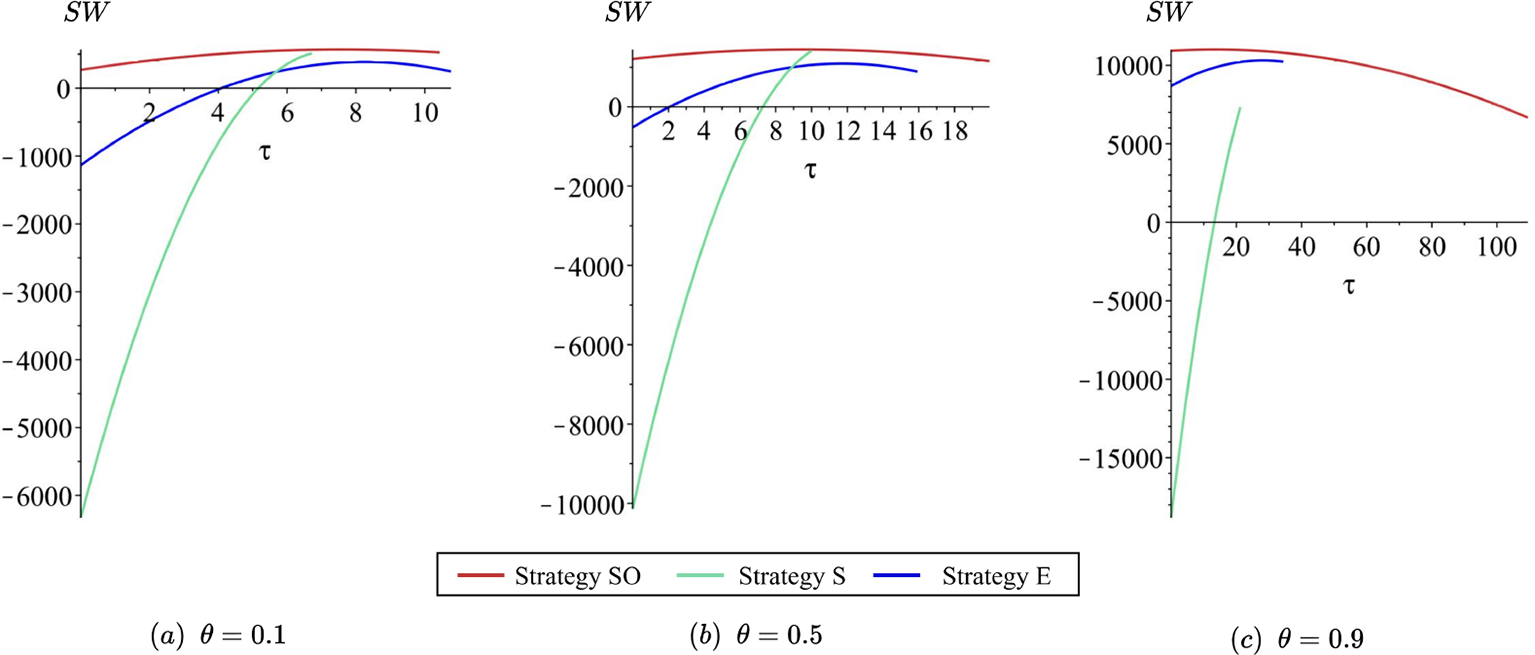
(a–c) Social welfare comparison under different θ when ρl > ρp.
Figure 13
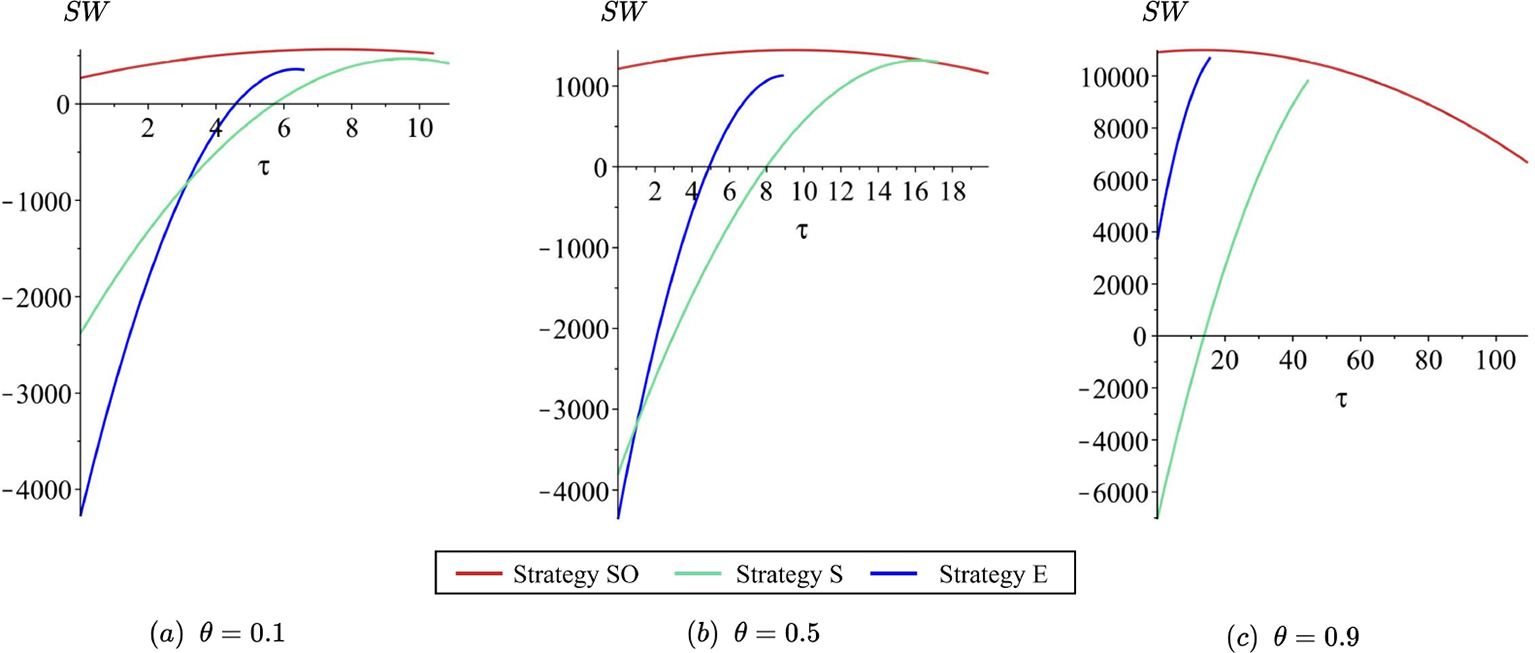
(a–c) Social welfare comparison under different θ when ρp > ρl.
Overall, the regulator tends to prefer strategy SO in most scenarios, even though alternative strategies may occasionally yield slightly higher social welfare under specific parameter settings. From the perspective of robustness and implementation feasibility, strategy SO remains the most reliable and manageable option. Therefore, the key task for the regulator is to calibrate the carbon tax such that social welfare is maximized while ensuring that the patentee has no incentive to deviate from strategy SO in favor of other, less socially optimal licensing arrangements.
5 Extension
Current incentives for corporate decarbonization are still inadequate, resulting in low adoption rates. Designing an incentive scheme that balances corporate interests with government objectives is essential to effectively achieve the decarbonization goals promoted by the government (Jiang et al., 2025). Providing tax reductions or exemptions to firms that adopt green technologies is a common policy tool to encourage green innovation and technology diffusion. In this section, we examine the conditions under which the regulator offers carbon tax discount α to firms adopting the green technology.
Proposition 4. Equilibrium prices and license fees under different strategies with a tax discount (see Table 4),
Table 4
| Strategies | Strategy | Strategy | Strategy | Strategy |
|---|---|---|---|---|
| Feasible regions | , if | |||
| , if | ||||
Equilibrium solutions.
where , , , , .
At this stage, the structure of the optimal solution and the feasible tax range, as well as the relative relationships between the feasible tax ranges and the corresponding revenues (excluding technology adoption costs), remain fundamentally consistent with the scenario in the absence of a carbon tax discount. However, notable differences emerge in the absolute values. Specifically:
Proposition 5. As α decreases:
-
The range in which strategy SO is applicable and yields a higher GD and social welfare expands significantly.
-
For the patentee, the payoff advantage of strategy SO increases markedly.
Under the strategy SO, all firms in the market are able to share green technologies, which collectively drive the reduction of carbon emissions, thus significantly lowering the overall carbon cost. The carbon tax discounts further enhance this advantage, not only reducing the tax burden but also increasing the appeal of green technologies, making firms more willing to invest resources in carbon reduction and enabling them to effectively address various regulatory requirements in a broader carbon tax environment.
Additionally, for the patentee, the introduction of carbon tax discounts makes the application of the strategy SO more profitable. In addition to the aforementioned reduction in carbon costs, the patentee can also gain higher service volumes and licensing fee revenues, significantly expanding the profit margin and thus increasing the willingness to share the technology, achieving a better balance between economic and environmental objectives.
Lemma 4. The social welfare function under each strategy is concave in α.
For the regulator, once the decision is made to guide the patentee toward adopting strategy SO, the next step is to determine the optimal carbon tax level that maximizes social welfare under this strategy. Following this, the regulator can calibrate the optimal level of carbon tax discount α to further enhance the feasibility and attractiveness of strategy SO for the patentee. Since each carbon tax level τ corresponds to a different profit distribution between the patentee and licensee, the optimal α varies with τ, ensuring that the strategy remains both economically viable for firms and aligned with the regulator's policy objectives.
However, while carbon tax exemptions and subsidies can, to some extent, align the incentives of the government and the patentee, facilitating a convergence of their objectives, the licensee still struggles to benefit. Achieving Pareto optimality for all three parties remains challenging. This is primarily because the licensee is not the innovator, and their interests are constrained by the patentee's licensing arrangements, limiting their strategic autonomy. As a result, even when upstream incentives are optimized, the licensee’s potential benefits remain restricted, creating a structural asymmetry. Moreover, from the government's perspective, there is a tendency to incentivize companies that actively innovate in response to policies, rather than those who merely wait and maintain the status quo. Thus, while the licensee may not necessarily reach optimal profits, this does not diminish the government’s efforts to drive the green transition.
6 Conclusion
In an era where environmental regulations in maritime shipping are becoming increasingly fragmented and uncertain, the ability of firms to adapt what we refer to as regulatory resilience has become a central concern. This paper develops a game-theoretic model capturing the strategic interaction between a green technology-holding patentee and a competing carrier under carbon regulation.
Our findings suggest that for a technology-leading carrier (the patentee), licensing can serve as a hedge against regulatory risk, and the decision of whether and how to license a green innovation profoundly affects both its competitive position and the industry's overall regulatory compliance capacity. When technology adoption costs remain moderate, sole licensing—where both carriers adopt the green innovation under the patentee's terms—proves to be the most robust and strategically coherent approach under a wide range of regulatory scenarios. It buffers both carriers against regulatory shocks by ensuring technology parity and reducing compliance asymmetries, also reinforcing the patentee's competitive edge through licensing income, rather than exclusive usage alone. When technology adoption costs are high, the applicability of sole licensing becomes limited. In such cases, licensing strategies that prioritize granting access to the party with the greatest need for the green technology gradually emerge as the optimal choice. However, it is important to note that the resulting technological asymmetry may in turn undermine the robustness of this kind of strategy.
For regulators, the challenge is in designing policy instruments that not only mandate cleaner outcomes but also create incentive structures for voluntary alignment. The key insight is that policy efficacy depends on compatibility with firm-level profit motives. While a well-calibrated carbon tax can induce alignment under certain conditions, it is not always sufficient, especially when the market outcome diverges from the regulator's preferred social outcome. In these cases, complementary alignment mechanisms become essential. For example, targeted subsidies or licensing incentives can offset the patentee's opportunity cost of sharing technology, restoring the alignment between private strategy and regulatory objectives.
In conclusion, reinforcing regulatory resilience in maritime shipping requires a synergistic approach. Carriers with proprietary green technologies and regulators setting environmental policies are interdependent players in the decarbonization game, and licensing of green innovations can be a strategic bridge between private profit motives and public regulatory goals. When policy tools are well-calibrated, voluntary licensing can support coherent, sector-wide responses to environmental mandates. When such alignment falters, appropriate incentives can realign incentives and ensure that the maritime sector remains on course toward both compliance and competitiveness. From a practical standpoint, facing environmental policy uncertainty in maritime shipping will require firms to view intellectual property not merely as a legal asset but as a strategic lever for regulatory resilience. Effective intellectual property (IP) management can help firms stabilize competitive positions while remaining adaptable across diverse regulatory regimes.
However, our results also indicate that under the current model setting, the passive position of the licensee makes it difficult to achieve Pareto-optimal outcomes for all stakeholders. On the one hand, this reflects the inherent trade-offs embedded in green transition strategies. On the other hand, it opens promising directions for future research, including analyses of how patentee–licensee power asymmetries shape optimal licensing strategies, or how the optimal results change when licensees are also capable of pursuing their own innovation efforts.
7 Limitations and future work
Although this paper yields some meaningful conclusions, it still has certain limitations that should be addressed in future research.
First, in constructing game-theoretic models, researchers often assume a linear demand function, symmetric production costs, and perfect information in order to obtain tractable analytical solutions and reveal the fundamental logic of firms’ strategic interactions. Although these assumptions are theoretically justified, they often deviate from real-world market conditions. In practice, the consumer demand function tends to be non-linear, cost structures vary significantly across firms, and information acquisition is typically incomplete. These factors limit the external validity of the model's conclusions. Therefore, future research could relax these idealized assumptions by incorporating heterogeneity and incomplete information, thereby enhancing the model’s practical relevance and explanatory power.
Second, this paper makes a theoretical contribution by developing a game-theoretic framework that captures the strategic interactions between competing carriers and identifies the patent-holding carrier’s optimal licensing strategy under different tax policies. The model advances the understanding of how competition and licensing mechanisms jointly influence firms' strategic behavior in the maritime sector. Nevertheless, the analysis remains conceptual and does not incorporate empirical or regulatory data. Future research could build upon this theoretical foundation by integrating stylized empirical benchmarks or scenario analyses that reflect real-world carbon-pricing regimes and technology costs (e.g., IMO regulations, EU ETS, or national carbon tax systems). Such extensions would help validate and contextualize the theoretical insights within practical policy environments.
Third, while this paper focuses on a theoretical framework examining the impact of carbon tax-based regulatory policies on licensing strategies between competing carriers, it does not explicitly consider other emerging mechanisms such as emissions trading, fuel mandates, or carbon-offset requirements. In practice, regulators often deploy a mix of policy measures, and these instruments may interact with licensing decisions in complex ways. Future research could extend the current framework to explore how licensing strategies operate under multiple, potentially interacting regulatory mechanisms, including multilateral and regional carbon regimes [e.g., IMO, EU ETS, and Carbon Border Adjustment Mechanism (CBAM)]. Such extensions would enhance the practical relevance of the model and further situate it within ongoing marine decarbonization governance debates.
Statements
Data availability statement
The original contributions presented in the study are included in the article/Supplementary Material. Further inquiries can be directed to the corresponding author.
Author contributions
YS: Conceptualization, Methodology, Project administration, Writing – review & editing. JL: Conceptualization, Writing – original draft. XF: Conceptualization, Methodology, Supervision, Writing – original draft. ZL: Conceptualization, Funding acquisition, Writing – review & editing. MZ: Writing – review & editing.
Funding
The author(s) declare that financial support was received for the research and/or publication of this article. This work was supported by the Grant of University of Macau (No. MYRG-GRG2024-00040-FBA), the National Natural Science Foundation of China (No. 72171208), Zhejiang Provincial Natural Science Foundation of China (No. LZ24G010001), Zhejiang Provincial Philosophy and Social Sciences Planning Project (No. 25QNYC016ZD), Guangdong basic and applied basic research foundation (No. 2021A1515110566), Guangdong philosophy and social science planning project (No. GD22YGL03).
Conflict of interest
The authors declare that the research was conducted in the absence of any commercial or financial relationships that could be construed as a potential conflict of interest.
The reviewer SZ is currently organizing a Research Topic with the author ZL.
Generative AI statement
The author(s) declare that Generative AI was used in the creation of this manuscript. The paper only employed AI tools for language polishing.
Any alternative text (alt text) provided alongside figures in this article has been generated by Frontiers with the support of artificial intelligence and reasonable efforts have been made to ensure accuracy, including review by the authors wherever possible. If you identify any issues, please contact us.
Publisher’s note
All claims expressed in this article are solely those of the authors and do not necessarily represent those of their affiliated organizations, or those of the publisher, the editors and the reviewers. Any product that may be evaluated in this article, or claim that may be made by its manufacturer, is not guaranteed or endorsed by the publisher.
Supplementary material
The Supplementary Material for this article can be found online at:https://www.frontiersin.org/articles/10.3389/fmars.2025.1690276/full#supplementary-material
Footnotes
1.^ https://seatrec.com/seatrec-wins-exclusive-license-from-sea-bird-scientific-to-manufacture-floats-for-argo/
2.^ https://www.wartsila.com/media/news/12-02-2025-wartsila-and-elomatic-sign-licensing-and-cooperation-agreement-on-elogrid-technology-3556227
3.^ https://maritime-executive.com/corporate/wingd-and-hyundai-extend-license-agreement-for-10-years
4.^IMO, 2023 IMO Strategy on Reduction of GHG Emissions from Ships Resolution MEPC.377(80) (IMO MEPC 2023) 4.5.2.
References
1
Akpinar H. Özer-Çaylan D. (2023). Organizational resilience in maritime business: a systematic literature review. Manage. Res. Rev.46, 245–267. doi: 10.1108/MRR-12-2021-0866
2
Arora A. Fosfuri A. (2003). Licensing the market for technology. J. Economic Behav. Organ.52, 277–295. doi: 10.1016/S0167-2681(03)00002-7
3
Asadabadi A. Miller-Hooks E. (2020). Maritime port network resiliency and reliability through co-opetition. Maritime Port Network Resiliency Reliability Through Co-opetition137, 101916. doi: 10.1016/j.tre.2020.101916
4
August T. Chen W. Zhu K. (2021). Competition among proprietary and open-source software firms: The role of licensing in strategic contribution. Manage. Sci.67, 3041–3066. doi: 10.1287/mnsc.2020.3674
5
Avagyan A. B. (2018). Algae to energy and sustainable development technologies resources, economics and system analyses new design of global environmental policy and live conserve industry (Amazon).
6
Balland O. Erikstad S. O. Fagerholt K. Wallace S. W. (2013). Planning vessel air emission regulations compliance under uncertainty. J. Mar. Sci. Technol.18, 349–357. doi: 10.1007/s00773-013-0212-7
7
Bathke H. Mu¨nch C. Von Der Gracht H. A. Hartmann E. (2022). Building resilience through foresight: The case of maritime container shipping firms. IEEE Trans. Eng. Manage. 71, 10534–10556. doi: 10.1109/TEM.2021.3137009
8
Cai G. Dai Y. Zhou S. X. (2012). Exclusive channels and re e channels and revenue sharing in a complementar enue sharing in a complementary goods market. Marketing Sci.31, 172–187. doi: 10.1287/mksc.1110.0688
9
Cariou P. Halim R. A. Rickard B. J. (2023). Ship-owner response to carbon taxes: Industry and environmental implication. Ecol. Econ212, 107917. doi: 10.1016/j.ecolecon.2023.107917
10
Charamis E. Charamis D. Kyriakopoulos G. L. Ntanos S. (2025). The growth of maritime communications and technology related to the trends in the shipping industry: A financial perspective. Economies13, 99. doi: 10.3390/economies13040099
11
Chen X. Wang X. Jing H. (2023). Technology licensing strategies for three cost-differential manufacturers. Eur. J. Operational Res.308, 622–635. doi: 10.1016/j.ejor.2022.11.027
12
Compagnie V. Struyfs K. Torsin W. (2023). Tax avoidance as an unintended consequence of environmental regulation: Evidence from the eu ets. J. Corporate Finance82, 102463. doi: 10.1016/j.jcorpfin.2023.102463
13
Cret L. Baudry M. Lantz F. (2024). How to implement the 2023 imo ghg strategy? insights on the importance of combining policy instruments and on the role of uncertainty. Mar. Policy169, 106332. doi: 10.1016/j.marpol.2024.106332
14
Cullinane K. Notteboom T. Sanchez R. Wilmsmeie G. (2012). Costs, revenue, service attributes and competition in shipping. Maritime Econ Logistics14, 265–273. doi: 10.1057/mel.2012.7
15
Davis J. (1968). Competition, contestability and the liner shipping industry. J. Transport Econ Policy20, 299–312.
16
Ding Y. Jin M. (2019). Service and pricing strategies in online retailing under carbon emission regulation. J. Cleaner Production217, 85–94. doi: 10.1016/j.jclepro.2019.01.149
17
Dominioni G. (2024). Carbon pricing for international shipping, equity, and wto law. Rev. European Comp. Int. Environ. Law33, 19–30. doi: 10.1111/reel.12540
18
Dominioni G. Petit C. A. (2024). Carbon pricing for international shipping and border carbon adjustment mechanisms: A case for regulatory cooperation. Eur. J. Risk Regul.16, 133–148. doi: 10.1017/err.2024.59
19
Ferrara A. R. Giua L. (2022). Indirect cost compensation under the eu ets: A firm-level analysis. Energy Policy165, 112989. doi: 10.1016/j.enpol.2022.112989
20
Fox N. (1992). An empirical analysis of ocean liner shipping. Int. J. Transport Econ19, 205–225.
21
Goyal S. Llop M. (2024). The shipping industry under the eu green deal: An input-output impact analysis. Transportation Res. Part A: Policy Pract.182, 104035. doi: 10.1016/j.tra.2024.104035
22
Gu B. Liu J. (2025). A systematic review of resilience in the maritime transport. Int. J. Logistics Res. Appl.28, 257–278. doi: 10.1080/13675567.2023.2165051
23
Gu B. Liu J. Chen J. (2023). Scenario-based strategies evaluation for the maritime supply chain resilience. Transportation Res. Part D: Transport Environ.124, 103948. doi: 10.1016/j.trd.2023.10394
24
Gurnani H. Erkoc M. Luo Y. (2007). Impact of product pricing and timing of investment decisions on supply chain co-opetition. Eur. J. Operational Res.180, 228–248. doi: 10.1016/j.ejor.2006.02.047
25
Haehl C. Spinler S. (2018). Capacity expansion under regulatory uncertainty: A real options-based study in international container shipping. Transportation Res. Part E: Logistics Transportation Rev.113, 75–93. doi: 10.1016/j.tre.2018.01.003
26
Haehl C. Spinler S. (2020). Technology choice under emission regulation uncertainty in international container shipping. Eur. J. Operational Res.284, 383–396. doi: 10.1016/j.ejor.2019.12.025
27
Hall B. H. Helmers C. (2013). Innovation and diffusion of clean/green technology: Can patent commons help? J. Environ. Econ Manage.66, 33–51. doi: 10.1016/j.jeem.2012.12.008
28
Ingene C. Parry M. (2007). Bilateral monopoly, identical competitors/distributors, and gametheoretic analyses of distribution channels. J. Acad. Marketing Sci.35, 586–602. doi: 10.1007/s11747-006-0006-0
29
Jiang G. Fan Q. Zhang Y. Xiao Y. Xie J. Zhou S. (2025). A tradable carbon credit incentive scheme based on the public-private-partnership. Transportation Res. Part E: Logistics Transportation Rev.197, 104039. doi: 10.1016/j.tre.2025.104039
30
Kamien M. I. (1992). Handbook of game theory with economic applications, Chapter 11. Vol. 1. (North-Holland, Amsterdam: Elsevier), 331–354.
31
Kamien M. I. Oren S. S. Tauman Y. (1992). Optimal licensing of cost-reducing innovation. J. Math. Econ21, 483–508. doi: 10.1016/0304-4068(92)90036-7
32
Kamien M. I. Tauman Y. (2002). Patent licensing: The inside story. Manchester School70, 1463–6786. doi: 10.1111/1467-9957.00280
33
Kim H.-E. (2011). The role of the patent system in stimulating innovation and technology transfer for climate change (Baden-Baden: Nomos Verlagsgesellschaft mbH & Co. KG).
34
Kou Y. Luo M. (2016). Strategic capacity competition and overcapacity in shipping. Maritime Policy Manage.43, 389–406. doi: 10.1080/03088839.2015.1105395
35
Lam J. S. L. Bai X. (2016). A quality function deployment approach to improve maritime supply chain resilience. Transportation Res. Part E: Logistics Transportation Rev.92, 16–27. doi: 10.1016/j.tre.2016.01.012
36
Lau Y.-Y. Chen Q. Poo M. C.-P. Ng A. K. Ying C. C. (2024). Maritime transport resilience: A systematic literature review on the current state of the art, research agenda and future research directions. Ocean Coast. Manage.251, 107086. doi: 10.1016/j.ocecoaman.2024.107086
37
Li D. (2021). Optimal licensing strategy of green technology in a mixed oligopoly: Fixed fee versus royalty. Managerial Decision Econ42, 942–951. doi: 10.1002/mde.3283
38
Li D. Shang C. Jiao C. (2022). Optimal licensing strategy of green technology with corporate social responsibility. Technol. Economic Dev. Economy28, 1791–1817. doi: 10.3846/tede.2022.17662
39
Li X. (2020). Reducing channel costs by investing in smart supply chain technologies. Transportation Res. Part E137, 101927. doi: 10.1016/j.tre.2020.101927
40
Lin D.-Y. Juan C.-J. Ng M. (2021). Evaluation of green strategies in maritime liner shipping using evolutionary game theory. J. Cleaner Production279, 123268. doi: 10.1016/j.jclepro.2020.123268
41
Lin G.-H. Liu Y.-P. Zhang Q. (2024). Strategic analysis of green technology unilateral licensing under carbon cap-and-trade policy. Managerial Decision Econ45, 2646–2665. doi: 10.1002/mde.4148
42
Liu J. Wu J. Gong Y. (2023). Maritime supply chain resilience: From concept to practice. Comput. Ind. Eng.182, 109366. doi: 10.1016/j.cie.2023.109366
43
Ma J. Sun X. (2023). Green technology licensing: Evaluating government subsidies based on different efficiency levels across competitors. Managerial Decision Econ44, 1920–1934. doi: 10.1002/mde.3790
44
Mansouri M. Nilchiani R. Mostashari A. (2009). “ A risk management-based decision analysis framework for resilience in maritime infrastructure and transportation systems,” in 2009 3rd Annual IEEE Systems Conference. 35–41 (Vancouver, BC, Canada: IEEE).
45
Melas K. D. Michail N. A. Louca K. G. (2025). Trade uncertainty, economic policy uncertainty and shipping costs. German Economic Rev.26, 15–33. doi: 10.1515/ger-2024-0025
46
Olaniyi E. O. Solarte-Vasquez M. C. Inkinen T. (2024). Smart regulations in maritime governance: Efficacy, gaps, and stakeholder perspectives. Mar. pollut. Bull.202, 116341. doi: 10.1016/j.marpolbul.2024.116341
47
Panahi R. Ng A. K. Afenyo M. K. Haeri F. (2020). A novel approach in probabilistic quantification of risks within the context of maritime supply chain: The case of extreme weather events in the arctic. Accident Anal. Prev.144, 105673. doi: 10.1016/j.aap.2020.105673
48
Park S. Lee H. Kim D. (2024). Regulatory compliance and operational efficiency in maritime transport: Strategies and insights. Transport Policy155, 161–177. doi: 10.1016/j.tranpol.2024.06.024
49
Piana J. (2022). Diffusion of green technology: Patents, licenses, and incentives. Tex. Env’t LJ52, 37.
50
Ranjan A. Jha J. (2019). Pricing and coordination strategies of a dual-channel supply chain considering green quality and sales effort. J. Cleaner Production218, 409–424. doi: 10.1016/j.jclepro.2019.01.297
51
Raza Z. (2020). Effects of regulation-driven green innovations on short sea shipping’s environmental and economic performance. Transportation Res. Part D: Transport Environ.84, 102340. doi: 10.1016/j.trd.2020.10234
52
Samuel S. A. (2025). Carbon pricing mechanisms for reducing greenhouse gas emissions and encouraging sustainable industrial practices. World J. Advanced Res. Rev.2, 001–024. doi: 10.30574/wjarr.2025.25.2.0350
53
SChinas O. Stefanakos C. N. (2012). Cost assessment of environmental regulation and options for marine operators. Transportation Res. Part C: Emerging Technol.25, 81–99. doi: 10.1016/j.trc.2012.05.002
54
Shah N. Brueckner J. K. (2012). Price and frequency competition in freight transportation. Transportation Res. Part A: Policy Pract.46, 938–953. doi: 10.1016/j.tra.2012.02.014
55
Song Z. Ren G. Mirabella L. Srivastava S. (2016). “ A resilience metric and its calculation for ship automation systems,” in 2016 Resilience Week (RWS). 194–199 (Chicago, IL, USA: IEEE).
56
Song J. Xu C. Wang C. (2024). Impacts of the carbon tax on green shipping supply chain under the port competition. Expert Syst.41, e13229. doi: 10.1111/exsy.13229
57
Spence M. (1976). Product differentiation and welfare. Am. Economic Rev.66, 407–414.
58
Tang O. Wan Sun P. (2018). Anti-competition of ocean shipping alliances: a legal perspective. Maritime Business Rev.3, 4–19. doi: 10.1108/MABR-08-2017-0023
59
Verschuur J. Pant R. Koks E. Hall J. (2022). A systemic risk framework to improve the resilience of port and supply-chain networks to natural hazards. Maritime Econ Logistics. 24, 1–18. doi: 10.1057/s41278-021-00204-8
60
Vukić L. Del Mar Cerbán M. (2022). Economic and environmental competitiveness of container shipping on alternative maritime routes in the asia-europe trade flow. Maritime Transport Res.3, 100070. doi: 10.1016/j.martra.2022.100070
61
Wang X. Cho S.-H. Scheller-Wolf A. (2021). Green technology development and adoption: competition, regulation, and uncertaintya global game approach. Manage. Sci.67, 201–219. doi: 10.1287/mnsc.2019.3538
62
Xu L. Yang J. (2024). Carbon pricing policies and renewable energy development: Analysis based on cross-country panel data. J. Environ. Manage.366, 121784. doi: 10.1016/j.jenvman.2024.121784
63
Yang C.-S. (2018). An analysis of institutional pressures, green supply chain management, and green performance in the container shipping context. Transportation Res. Part D: Transport Environ.61, 246–260. doi: 10.1016/j.trd.2017.07.005
64
Yang Y. (2023). Carbon pricing policies in China: Comparative analysis of carbon tax and emission trading systems. Int. J. Multidiscip. Res. Growth Eval.4, 56–61. doi: 10.54660/.IJMRGE.2023.4.5.56-61
65
Yenipazarli A. (2016). Managing new and remanufactured products to mitigate environmental damage under emissions regulation. Eur. J. Operational Res.249, 117–130. doi: 10.1016/j.ejor.2015.08.020
66
Yuan Q. Wang S. Peng J. (2023). Operational efficiency optimization method for ship fleet to comply with the carbon intensity indicator (cii) regulation. Ocean Eng.286, 115487. doi: 10.1016/j.oceaneng.2023.115487
67
Zhang W. Ji L. Chen W. (2025). Optimization of green-pricing strategies for two-sided marine freight platforms with network externality and multihoming effects. Front. Mar. Sci.12. doi: 10.3389/fmars.2025.1601322
68
Zhang Q. Zhu X. Lin G.-H. (2024). Green technological licensing strategies with fixedfee among rival firms under emissions trading scheme. Eur. J. Operational Res.318, 110–130. doi: 10.1016/j.ejor.2024.04.036
69
Zheng S. (2024). Integration strategies of shipping enterprises under environmental regulations from perspective of resource-based view. Adv. Economics Manage. Political Sci.139, 20–32. doi: 10.54254/2754-1169/2024.19200
70
Zhou S. Guo Z. Chen J. Jiang G. (2025). Large containership stowage planning for maritime logistics: A novel meta-heuristic algorithm to reduce the number of shifts. Advanced Eng. Inf.64, 102962. doi: 10.1016/j.aei.2024.102962
Summary
Keywords
shipping, regulatory resilience, green innovation, licensing strategy, carbon reduction
Citation
Shi Y, Li J, Feng X, Lian Z and Zhao M (2025) Building regulatory resilience in shipping: green technology licensing and carbon tax policies. Front. Mar. Sci. 12:1690276. doi: 10.3389/fmars.2025.1690276
Received
21 August 2025
Accepted
30 October 2025
Published
24 November 2025
Volume
12 - 2025
Edited by
Kum Fai Yuen, Nanyang Technological University, Singapore
Reviewed by
Yi-Che Shi, National Cheng Kung University, Taiwan
Shaorui Zhou, Sun Yat-sen University, China
Rubal Dua, King Abdullah Petroleum Studies and Research Center (KAPSARC), Saudi Arabia
Updates
Copyright
© 2025 Shi, Li, Feng, Lian and Zhao.
This is an open-access article distributed under the terms of the Creative Commons Attribution License (CC BY). The use, distribution or reproduction in other forums is permitted, provided the original author(s) and the copyright owner(s) are credited and that the original publication in this journal is cited, in accordance with accepted academic practice. No use, distribution or reproduction is permitted which does not comply with these terms.
*Correspondence: Xiaozhi Feng, xiaozhi.feng@ciicmc.com; Zhaotong Lian, lianzt@um.edu.mo
Disclaimer
All claims expressed in this article are solely those of the authors and do not necessarily represent those of their affiliated organizations, or those of the publisher, the editors and the reviewers. Any product that may be evaluated in this article or claim that may be made by its manufacturer is not guaranteed or endorsed by the publisher.