Abstract
Introduction:
Seagrass ecosystems are vital for carbon sequestration, shoreline stabilization, habitat provision, and nutrient cycling, thereby playing a key role in climate mitigation and adaptation. Understanding how anthropogenic pressures affect seagrass ecosystems is essential for effective coastal zone management.
Methods:
By integrating decadal satellite-based urbanization metrics with in-situ measurements of seagrass biomass and sediment organic carbon at four sites (Pamban, Mandapam North, Devipattinam, Thondi) for the periods 2010 and 2022, we quantified how the urban expansion affected the seagrass biomass and sediment carbon storage potential. Landsat series satellite imagery was analyzed using the Normalized-Difference-Built-up Index (NDBI) to quantify urban expansion. Relationships with seagrass parameters were analyzed through multivariate statistical approaches, including principal component analysis (PCA).
Results:
Results indicated a significant increase in built-up area (~12 Km2) near high-impact sites (Devipattinam, Thondi), versus ~4 Km2 increase at low-impact sites (Pamban and Mandapam North). For the built-up areas, this correlates with elevated suspended sediment matter (SSM) (31.2% increase in high urban sites), reductions in seagrass above-ground biomass (AGB: -25.52% of high urban sites), and decreased sediment organic carbon (SOC: -42.67%). Multivariate analyses, also revealed strong associations between urbanization, SSM, biomass loss, and sediment organic carbon reduction.
Discussion and conclusion:
These findings demonstrate that coastal urbanization in Palk Bay significantly undermines seagrass blue carbon potential and beneficial ecosystem services. The integrated field and remote sensing approach provides a scalable framework for monitoring tropical seagrass ecosystems, offering actionable insights for coastal zone management, conservation, and climate mitigation under increasing anthropogenic pressures.
Introduction
Seagrass ecosystems are among the most productive and ecologically significant coastal habitats. They provide ecosystem services such as carbon sequestration, shoreline stabilization, nutrient cycling, and habitat provision for diverse marine organisms. These tropical blue carbon ecosystems also play a vital role in climate mitigation by storing carbon in sediments and biomass. This lowers the atmospheric carbon dioxide concentrations. Global studies have shown a significant decline of tropical seagrass cover at an alarming rate of 16-32%, from anthropogenic pressures such as land-use change, pollution, and sedimentation, compounded by climate-driven stressors (Dunic et al., 2021; Duarte et al., 2025; Ren et al., 2024; Friess et al., 2024).
India harbors about 517 km2 of seagrass meadows (Geevarghese et al., 2018), spread mainly over Gulf of Mannar, Palk Bay, Chilika lagoon, Andaman & Nicobar Islands, and Lakshadweep. From these regions, a total of 14 seagrass species has been reported and is mainly dominated by Thalassia hemprichii, Cymodocea serrulata, Cymodocea rotundata, Halophila ovalis, Halophila beccarii, Halodule uninervis, Halodule pinifolia, and Syringodium isoetifolium. These seagrass ecosystems play a major role in India’s blue carbon potential, though they vary in their productivity, ecological services and resilience to anthropogenic stressors.
The Palk Bay region, along the southeast coast of India (Tamil Nadu), harbors extensive seagrass meadows that are ecologically and biologically significant (Thangaradjou and Bhatt, 2018). A recent study from Palk Bay reported major contribution of five seagrass species with Cymodocea serrulate having the highest contribution, followed by Cymodocea roduntata, Syringodium isoetifolium, Halodule pinifolia and Halophila ovalis (Ranith et al., 2024). Although these meadows provide essential ecosystem services, they are increasingly threatened by urban expansion, industrial activities, and associated environmental degradation (Nobi and Dinesh Kumar, 2014; Kaviarasan et al., 2025; Nguyen et al., 2025; Scherner, 2025);. Major stressors include water pollution, sediment runoff, and land-use alterations (Hossain et al., 2019; Acharyya et al., 2023). These factors affect the optimal growth of seagrass communities and have a significant impact on both habitat quality and blue carbon storage potential of the coastal ecosystem (Kaladharan et al., 2020; Ranith et al., 2024). In such biodiversity hotspots, it is important to perform comprehensive ecosystem assessments integrating studies of anthropogenic pressures, environmental variables, and seagrass dynamics. In many areas, this is being neglected. This knowledge gap potentially constrains effective coastal ecosystem management and conservation planning of seagrass communities, which in turn will have serious implications on the climate change mitigation through reduced carbon sequestration and storage potential.
Applications of advanced remote sensing technologies and geospatial analysis have improved capabilities for mapping and monitoring habitat changes, and the assessment of potential ecosystem stressors over space and time. Multi-temporal satellite datasets from Landsat and Sentinel-2 (MSI) multispectral series provide opportunities to assess land-use changes, urban expansion, and seagrass distribution at sufficient high spatial and temporal resolutions (Zhao et al., 2025; Chen et al., 2021; Ha et al., 2021). Careful processing and integration of these satellite derived datasets with in-situ biogeochemical variables are crucial in the effective integrated assessment of the interaction between anthropogenic stressors, changes in environmental quality, and potential response of ecosystems to these changes.
In this study, we overall aim to integrate satellite remote sensing and field-based biogeochemical assessments to evaluate the impacts of urbanization on the Palk Bay seagrass ecosystems during the period from 2010 to 2022, and assess the variability in the efficiency of the ecosystem to serve as a blue carbon storage. The specific objectives of this study are to: (1) quantify spatio-temporal variability in urban expansion across study sites and its impact on seagrass cover; (2) assess sediment carbon stocks and their variability under changing urban pressure; and (3) examine the interactions between urbanization, environmental variables, seagrass biomass, and carbon dynamics along high-impact to low-impact urban gradients. Based on these specific objectives, we hypothesize that urban expansion and increasing population density will negatively correlate with seagrass biomass and sediment organic carbon. This integrated approach provides empirical evidence of anthropogenic impacts on tropical seagrass ecosystems and offers a scalable framework for coastal monitoring, conservation planning, and sustainable urban development in sensitive marine habitats.
Materials and methods
Study area
Palk Bay is an ecologically significant shallow coastal regions situated along the northeast coast of the Ramanathapuram district, Tamil Nadu, India (9°55’–10°45’N, 78°58’–79°55’E), with an averaged depth of 13 meters. It connects to the Gulf of Mannar in the south via the 1.2 km wide Pamban Strait and to the Bay of Bengal in the northeast. Palk Bay is bestowed with diverse and productive ecosystems including seagrass beds, coral reefs, and mangroves that provide enormous ecological and economical services. The weather in this region is majorly affected by both southwest and northeast monsoons, with annual rainfall ranging from 762–1,270 mm and water temperatures between 24.6–29.1 °C. The adjacent alluvial and rocky substrates, along with freshwater input from rivers, create ideal breeding and feeding grounds for pelagic and demersal fishes, making Palk Bay one of India’s important fishing grounds, with an average annual fish production of approximately 70,000 tons (Azzez et al., 2016). In this study, four seagrass monitoring stations; Devipattinam (9.48°N; 78.91°E), Thondi (9.74°N; 79.03°E), Madapam North (9.29°N; 79.12°E), and Pamban (9.29°N; 79.28°E) were selected as representative seagrass locations to potentially capture gradients in urbanization, and environmental variability (Figure 1). The four stations were selected to represent a gradient of urbanization intensity, based on local knowledge, stakeholder consultations, and historical population change (2011 India census). Local stakeholders revealed that Pamban and Mandapam regions were long established as urbanized areas with slow demographic change, whereas the locations Devipattinam and Thondi have recently experienced rapid population growth and potential urban expansion.
Figure 1
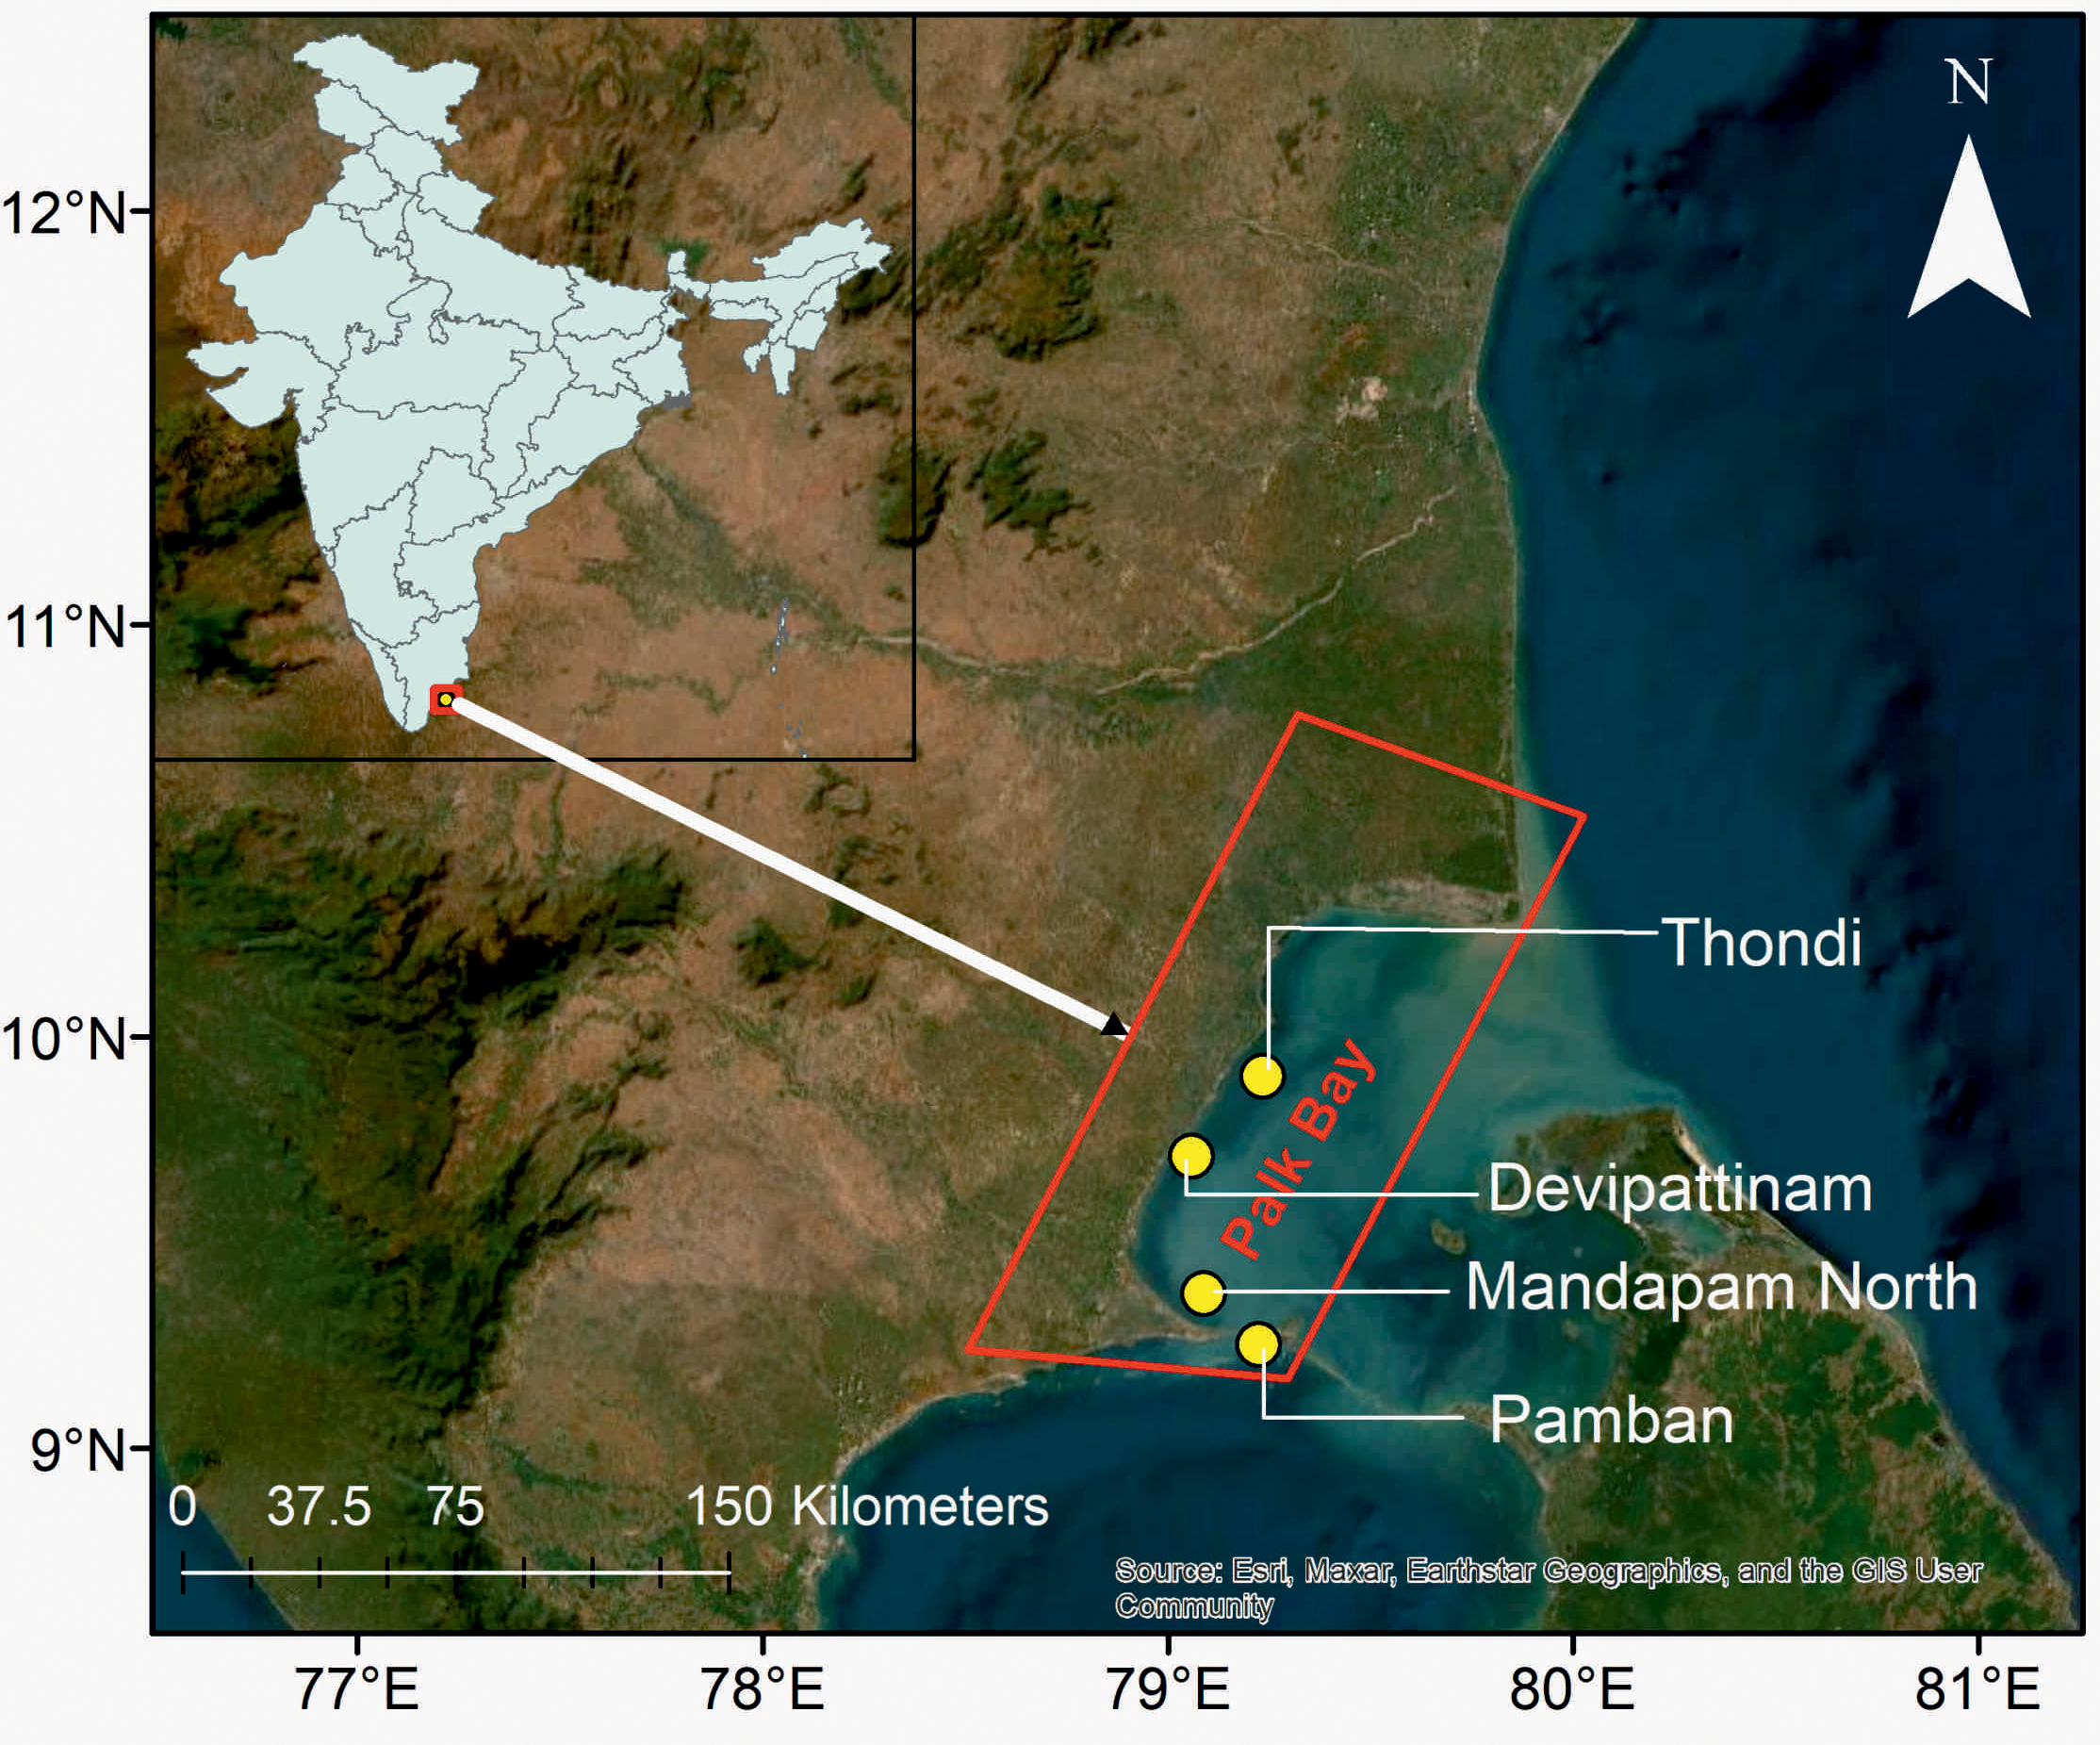
Map of the study area showing the four sampling stations.
Field sampling and biogeochemical measurements
At each monitoring station, sampling was performed monthly at 10 fixed locations during 2010 and 2022. All field sampling was conducted during day time at low tide windows to ensure safe access to shallow meadows and to minimize variability due to tidal depth differences. At each sampling location, we collected seagrass biomass samples (total biomass (TB); below-ground biomass (BGB); above-ground biomass (AGB)) using triplicate 0.25 m2 quadrats. Seagrass samples were uprooted carefully, and the above ground components (leaves), and below ground components (rhizomes and roots) were separated. The samples were then oven-dried at 60 °C to constant weight (Duarte and Chiscano, 1999; Long et al., 1994). Sediment cores (30 cm depth) samples were collected in triplicate from all sites using PVC corers, sectioned at 10cm intervals, labelled and further analyzed for organic carbon content (Ranith et al., 2024). To account for sediment compaction during sampling, compaction corrections were applied following Smeaton et al. (2020). The 10 cm core sections were stored in zip-lock plastic bags and transported to the laboratory at 4 °C. The organic matter content of the seagrass sediments was determined using loss-on-ignition, and the corresponding organic carbon was calculated based on the relationships described by Fourqurean et al. (2012). Photosynthetically available radiation (PAR) was measured using RS485 PAR sensor. Water temperature was measured using a digital thermometer. pH and salinity were measured using a Hanna digital field pH meter and a refractometer respectively. Suspended sediment matter was estimated gravimetrically by filtering known volumes of water through pre-weighed GF/F filters and drying to constant weight (Strickland and Parsons, 1972). Water samples collected in pre-cleaned sampling bottles were analyzed for dissolved oxygen, nutrients (nitrate, phosphate, silicate), and chlorophyll-a using standard methods (Strickland and Parsons, 1972). Annual average values of all parameters were obtained for each sampling location, to concisely understand the decadal change in seagrass biomass and other environmental variables across the urbanization gradient (low and high urbanized stations). Standard deviations were derived from the underlying monthly measurements, ensuring that seasonal and intermonthly variability contributed to the reported variability while keeping the study focused on annual trend, and to compare between years 2010 and 2022. While direct spatial mapping and percentage cover quantification was not conducted, changes in seagrass biomass and sediment organic carbon were used as proxies for seagrass health and density. Also, it is to note that though the seagrass communities at each station is comprised of multiple species, and they have their independent contribution to the regional blue carbon stock (Ranith et al., 2024), this study specifically focused on seagrass community level AGB, BGB, total biomass and sediment organic carbon stocks. This captures a combined contribution of all seagrass species at each sites, allowing the assessment of overall carbon storage of these regions in response to the urban change, without necessitating species-wise partitioning.
Satellite data processing and urbanization metrics
A buffer of 5 km radius was generated for each sampling location to establish the surrounding urban footprint for the seagrass survey stations. Normalized Difference Built-up Index (NDBI), calculated from surface reflectance data from Landsat 5 TM and Landsat 8 OLI datasets for the years 2010 and 2022 were used to assess the decadal variability in built-up area (2010 vs. 2022). Cloud free images were accessed and processed via Google Earth Engine. For 2010 and 2022, annual median composites were obtained to minimize cloud cover and seasonal noise. NDBI was calculated as;
where, SWIR represents short wave infrared band, and corresponds to band 5 (Landsat 5 TM)/band 6 (Landsat 8 OLI). NIR represents the near infrared band and corresponds to band 4 (Landsat 5 TM)/band 5 (Landsat 8 OLI). Total area of built-up coverage for the years 2010 and 2022 calculated for each buffer, and the mean value was extracted to represent built-up coverage for the corresponding sampling point. Mean values were extracted for each site, and decadal differences (2010 vs 2022) were used to quantify urban expansion. Similarly, population density was also used as a proxy to explain the urbanization intensity at the four study stations. The built –up area estimates were cross-checked against high-resolution google earth imagery and local land-use information to qualitatively validate the trends. Population density data were obtained from the WorldPop database (www.worldpop.org) for the years 2010 and 2020. Mean population density values were extracted for each 5 km buffer around the sampling points, and relative change in population density was determined to capture the decade-scale changes in human presence around the seagrass habitats, and thereby to assess urban pressure in the region. The assessment of population density change was limited to 2020, as WorldPop data were available only till then (Chen et al., 2021). As the 2010–2020 population trend strongly aligned with the built-up expansion patterns and local reports of continued population growth, it is assumed study that the captured decadal variability could sufficiently provide a clear and robust indication of population increase. Though extrapolating the population values to 2022 could introduce some uncertainty, the missing two years are unlikely to significantly alter the observed decadal trend. Seagrass extent for 2010 and 2022 for the studied sites was estimated using annual median composites of Normalized Difference Vegetation Index (NDVI) thresholding from the same Landsat datasets. Threshold values derived from visual inspection and prior studies were used to classify seagrass-covered areas, and total area within each 5 km buffer was extracted to quantify changes in seagrass coverage during 2010 and 2022.
Statistical analysis
Z-score transformation was used for the standardization of all continuous variables to normalize scales, and to ensure comparability across metrics. Outliers were visually inspected and retained if they represented true environmental variability. Missing data were handled via pairwise deletion (Newman, 2014), as missing values in our dataset were relatively few, scattered and randomly distributed. Two-way analysis of variance (ANOVA) was employed to test the interactive effects of urbanization level (low vs. high) during 2010 and 2022 on variables such as seagrass biomass, sediment organic carbon, and water quality variables. Significant effects and interactions were determined using F-tests at 95% level of significance. To assess the temporal changes of these variables, relative change of recorded variables between 2010 and 2022 was calculated, and independent t-tests were applied to compare the temporal changes occurred in the low and high urbanization locations. This allows to evaluate whether urbanization affects the magnitude of temporal changes in seagrass biomass, and sediment organic carbon content.
PCA was used to summarize the prevalent patterns in environmental variables through reducing the data complexity and also identifying major axis of variation. This helps in identifying the major environmental gradients that influence the seagrass sediment organic carbon dynamics. PCA was performed using the ‘prcomp’ function in R with a correlation matrix. The first two principal components (PC1 and PC2) were interpreted using variable loadings greater than 0.3. Cluster-wise mean PC scores were calculated to summarize the effects of urbanization and temporal changes on the environmental and biogeochemical parameters.
Redundancy Analysis (RDA) was then applied to understand how the seagrass biomass and sediment organic carbon stocks vary along the different environmental gradients. This will allow the direct interpretation of the influence of environmental predictors on the biological response of seagrasses and its ecological services. RDA was conducted using the ‘RDA’ function in the “vegan” package in R. Significance of the RDA model and individual axes was tested using permutation ANOVA with 999 permutations. RDA loadings were examined to identify strong positive and negative relationships, and significant predictors (p< 0.05) were highlighted to identify variables structuring urbanization variations. All statistical analysis was conducted using R (V4.3; R Core Team, 2025).
Results
The relative change in NDBI between 2022 and 2010 showed a significant increase in built-up area at all four stations (p<0.05), with Thondi (11.62 km2 in 2022 from 1.8 km2 in 2010), and Devipattinam (12.65 km2 in 2022 from 1.6 km2 in 2010) stations showing the highest relative increase (Figure 2). Population density analysis within the 5 km buffer around each sampling point showed that there was an overall increase in population density from 2010 to 2020 across all stations (Figure 3), with the highest population growth recorded at Devipattinam and Thondi.
Figure 2
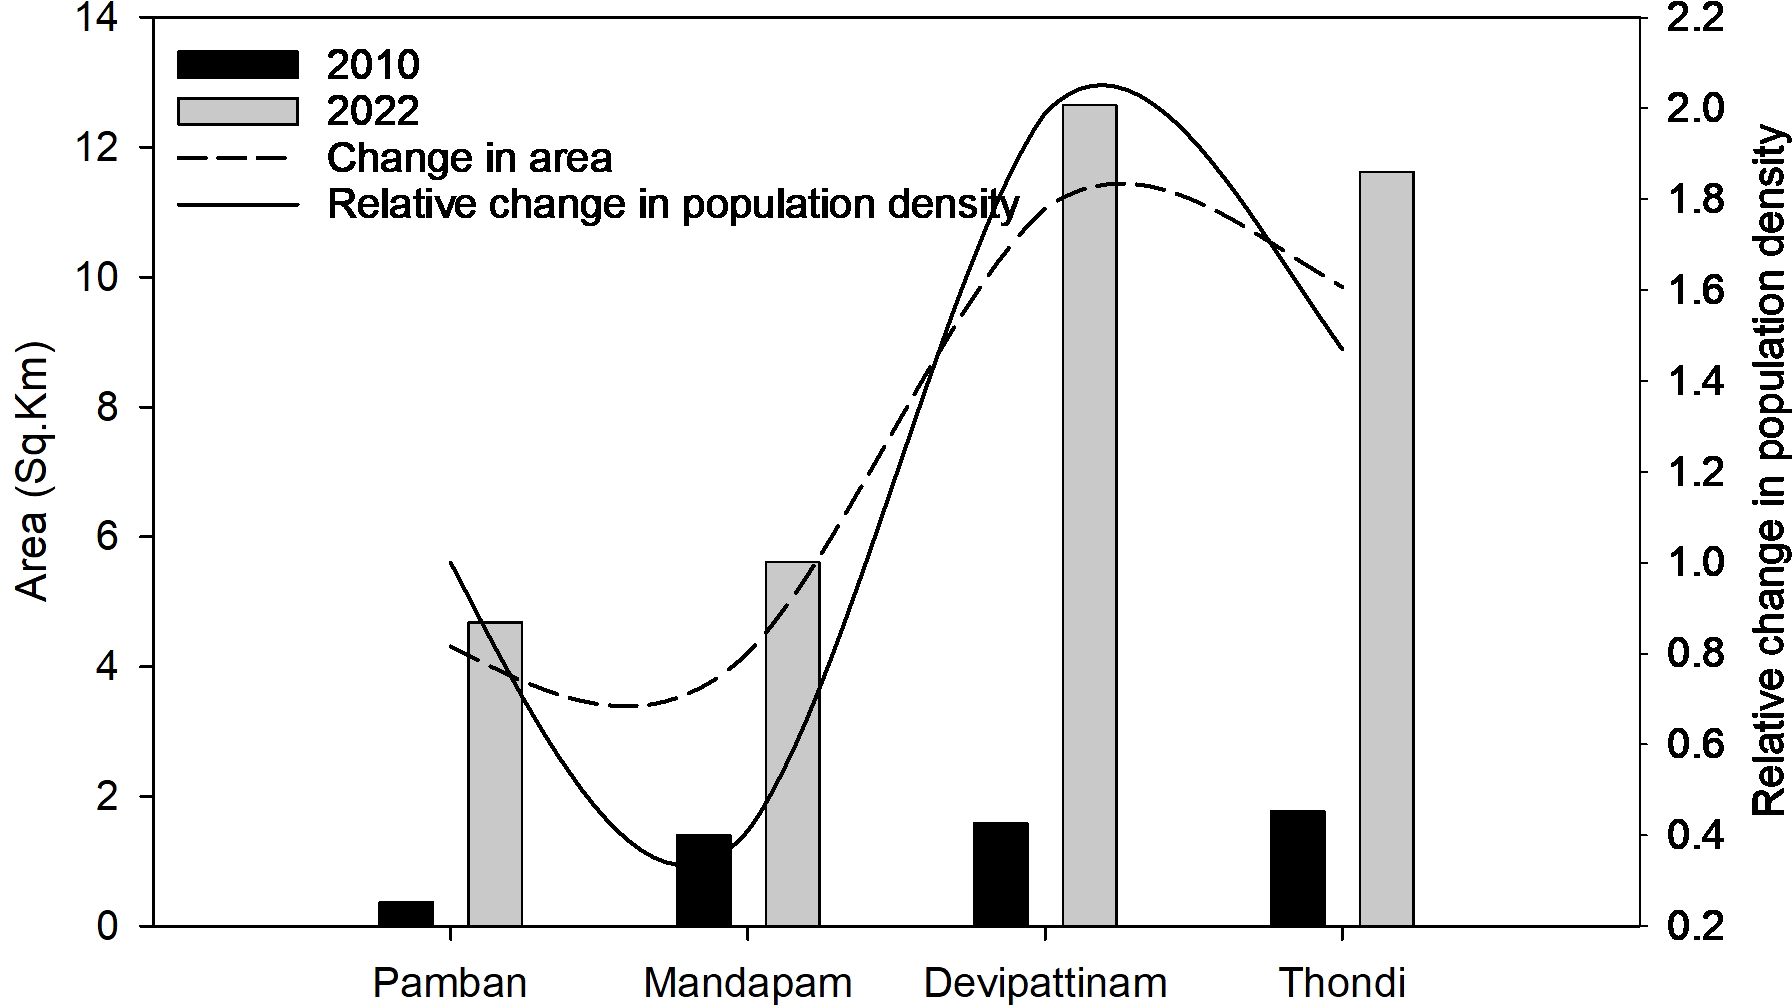
Variability in built-up area and population density (/km2) at the four survey stations. Built-up area is shown as bars (with dashed trend line), and relative population density (/km²) as a solid line.
Figure 3
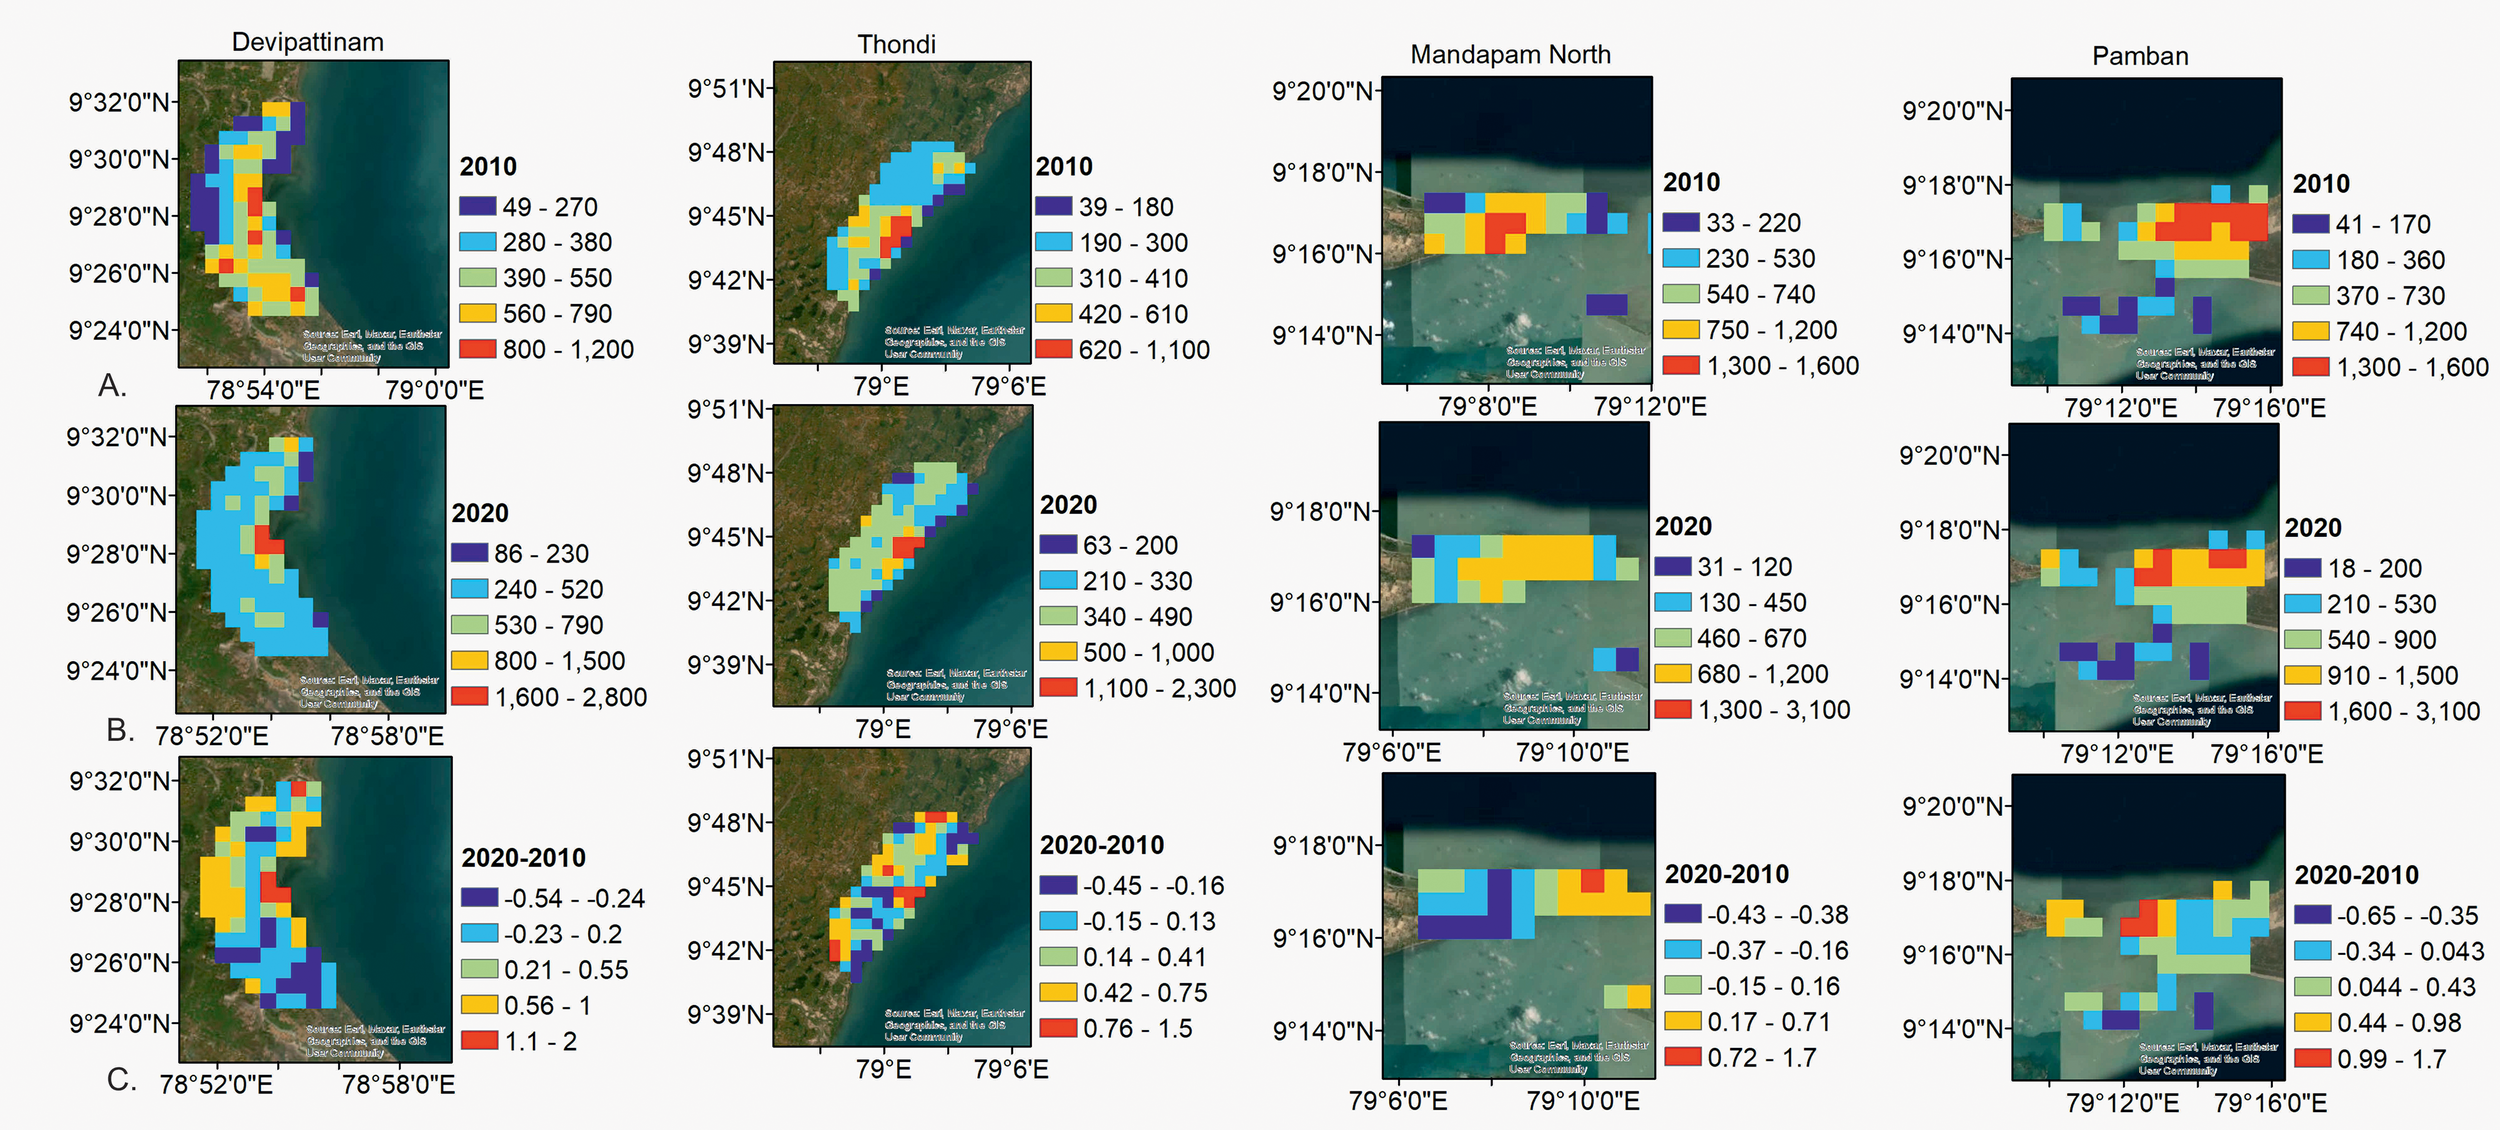
Spatial distribution in population density at the sampling stations; (A) population density in 2010, (B) population density in 2022, and (C) relative growth in population density between 2010 and 2022.
Water quality parameters in Palk Bay exhibited spatio-temporal variability with respect to the urbanization intensity, although the magnitude of change varied across the different parameters (Table 1; detailed site-wise values are provided in Supplementary Table S1). Water temperature showed minor variation between years, and urbanization levels. Two-way ANOVA indicated that the years, urbanization, as well as their interaction, have not caused any significant effect (p = 0.70) on water temperature, illustrating that thermal conditions in the study area did not differ largely over the decade. However, Photosynthetically Available Radiation (PAR) showed significant variability over the decade, with a 4.19% increase at some sites and a 7.71% decrease at others. Neither urbanization, nor the interaction of years and urbanization, showed a significant effect on PAR (p = 0.45). This demonstrates that light availability was primarily influenced by natural temporal change, and not significantly by increased anthropogenic pressures. Similarly, pH levels have minimal difference among sites and years (0.99%–1.12%), indicating no significant effects of years, urbanization, or their interaction. This implies stable pH conditions in the water column. On the contrary, salinity showed a significant effect of year (change from 2010 to 2020), (p = 0.024), but the variability in salinity between low and high urbanization sites were not significant. This indicates that interannual changes in freshwater inflow or regional hydrological patterns may have influenced salinity more than increased local urban pressures. Suspended sediment matter (SSM) values were highly inconsistent, ranging from a 7.19% decrease to a 31.2% increase between years, but neither urbanization nor the interaction effect was significant. This suggests that natural sediment dynamics from monsoonal resuspension or tidal currents can be more influential to the variance in turbidity. The concentration of dissolved oxygen (DO) revealed a significant year effect × urbanization interaction (p = 0.0011), indicating that dynamics of DO was potentially regulated by both temporal changes and influence of urbanization. Though there were no overall significant differences in annual means, high-impact urban sites tended to experience lower DO concentrations, potentially from enhanced organic matter inputs from urban runoff. Chlorophyll-a concentrations, did not vary significantly between sites and years, suggesting that urbanization, at the scale considered, did not have a significant effect on phytoplankton productivity. Dissolved inorganic carbon (DIC) showed both a significant effect of urbanization (p = 0.00135) and a significant year - urbanization interaction (p = 0.0065), indicating that high urbanized sites consistently showed higher DIC levels, owing to the enhanced carbon inputs from human activities and degradation of organic matter in sediments. There was no significant difference in nutrient ratios, specifically N:P, and silicate with either urbanization, year, or their interaction, indicating that there was no significant change in the overall nutrient stoichiometry across the study area. Overall, the water quality analysis indicates that while most physicochemical parameters remained relatively stable in 2022, compared to 2010, dissolved oxygen and DIC were significantly influenced by urbanization and temporal variation. This change in DO and DIC at high urbanization locations shows the potential impact of human activities on carbon dynamics and oxygen availability within seagrass habitats of Palk Bay.
Table 1
| Parameter | Factors | Mean difference in 2022 from 2010 (Low urban, High urban) | Residual (sum of squares, df) | Sum of squares | df | F | P value |
|---|---|---|---|---|---|---|---|
| Water temperature | Year | (-0.67%, -0.96%) | (150.16, 36) | 0.62 | 1 | 0.148 | 0.703 |
| Urbanization | 0.02 | 1 | 0.005 | 0.942 | |||
| Year: Urbanization | 0.02 | 1 | 0.005 | 0.947 | |||
| PAR | Year | (4.19%, -7.71%) | (911973.3, 36) | 1071.23 | 1 | 0.042 | 0.838 |
| Urbanization | 14478.03 | 1 | 0.572 | 0.455 | |||
| Year: Urbanization | 8323.23 | 1 | 0.329 | 0.570 | |||
| pH | Year | (0.99%, -1.12%) | (0.369, 36) | 0.00 | 1 | 0.024 | 0.877 |
| Urbanization | 0.13 | 1 | 12.902 | 0.001 | |||
| Year: Urbanization | 0.07 | 1 | 7.049 | 0.012 | |||
| Salinity | Year | (0.87%, 1.16%) | (7.9, 36) | 1.23 | 1 | 5.582 | 0.024 |
| Urbanization | 0.63 | 1 | 2.848 | 0.100 | |||
| Year: Urbanization | 0.03 | 1 | 0.114 | 0.738 | |||
| SSM | Year | (-7.19%, 31.2%) | (59463, 36) | 1392.40 | 1 | 0.843 | 0.365 |
| Urbanization | 176.40 | 1 | 0.107 | 0.746 | |||
| Year: Urbanization | 4368.10 | 1 | 2.645 | 0.113 | |||
| DO | Year | (4.61%, -9.8%) | (4.42, 36) | 0.23 | 1 | 1.907 | 0.176 |
| Urbanization | 0.01 | 1 | 0.059 | 0.809 | |||
| Year: Urbanization | 1.54 | 1 | 12.583 | 0.001 | |||
| Chlorophyll a | Year | (27.46%, 23.32%) | (74.94, 36) | 1.64 | 1 | 0.786 | 0.381 |
| Urbanization | 2.09 | 1 | 1.005 | 0.323 | |||
| Year: Urbanization | 0.06 | 1 | 0.031 | 0.861 | |||
| DIC | Year | (-6.09%, 5.73%) | (489987.2,36) | 1040.40 | 1 | 0.076 | 0.784 |
| Urbanization | 164352.40 | 1 | 12.075 | 0.001 | |||
| Year: Urbanization | 113635.60 | 1 | 8.349 | 0.006 | |||
| N:P ratio | Year | (4.3%, 57.22%) | (881.59, 36) | 50.67 | 1 | 2.069 | 0.159 |
| Urbanization | 22.08 | 1 | 0.902 | 0.349 | |||
| Year: Urbanization | 36.83 | 1 | 1.504 | 0.228 | |||
| Silicate | Year | (1.16%, -3.32%) | (438.17, 36) | 0.11 | 1 | 0.009 | 0.925 |
| Urbanization | 3.91 | 1 | 0.321 | 0.575 | |||
| Year: Urbanization | 0.51 | 1 | 0.042 | 0.840 |
Variability in water quality parameters at gradients of urbanization over time.
Seagrass extent for these regions as estimated using satellite derived NDVI thresholds, showed oth gains and losses the two years 2010 and 2022. At Pamban, seagrass area increased from 23.78 km2 to 30.05 km2 (+6.27 km2), and at Mandapam from 28.38 km2 to 33.68 km2 (+5.3km2). Contrastingly, Devipattinam showed reduction in seagrass extent from 27.18 km2 to 21.65 km2 (-5.53km2) and Thondi from 19.38 km2 to 15.48 km2 (-3.9 km2), indicating site-specific response to environmental pressures.
Both seagrass biomass and sediment carbon stocks in Palk Bay showed significant variations along the urbanization gradient and with respect to time, reflecting both environmental pressures and ecosystem responses (Table 2). At high urbanization sites, seagrass AGB declined from 12.26 ± 5.29 gm drywt/m2 in 2010 to 9.13 ± 2.34 gm drywt/m2 in 2022. Whereas, in low urbanization sites seagrass AGB increased from 13.16 ± 5.01 gm drywt/m2 in 2010 to 15.25 ± 6.18 gm drywt/m2 in 2022. Above-ground biomass (AGB) showed decadal variability, with a 15.8% increase at low urban sites and a 25.5% decline at high urban sites. Significant effect of urbanization was evident on AGB (p = 0.03), with high-impact urban sites displaying consistently lower AGB, compared to low-impact sites. Although the interaction between year and urbanization was not statistically significant (p = 0.10), the data suggest that seagrass canopy structure is strongly sensitive to anthropogenic pressures, particularly near heavily urbanized coastal areas.
Table 2
| Parameter | Factors | Mean difference in 2022 from 2010 (Low urban, High urban) | Residual (sum of squares, df) | Sum of squares | df | F | P value |
|---|---|---|---|---|---|---|---|
| AGB | Year | (15.82%, -25.52%) | (871.14, 36) | 2.730 | 1 | 0.113 | 0.739 |
| Urbanization | 123.166 | 1 | 5.090 | 0.030 | |||
| Year: Urbanization | 67.886 | 1 | 2.805 | 0.103 | |||
| BGB | Year | (22.35%, 5.9%) | (5991.81, 36) | 182.073 | 1 | 1.094 | 0.303 |
| Urbanization | 316.406 | 1 | 1.901 | 0.176 | |||
| Year: Urbanization | 68.854 | 1 | 0.414 | 0.524 | |||
| TB | Year | (21.6%, 5.15%) | (10099.81, 36) | 334.431 | 1 | 1.192 | 0.282 |
| Urbanization | 581.254 | 1 | 2.072 | 0.159 | |||
| Year: Urbanization | 138.310 | 1 | 0.493 | 0.487 | |||
| SOC | Year | (18.81%,-42.67%) | (5574.63, 36) | 2435.784 | 1 | 15.730 | <0.001 |
| Urbanization | 16178.900 | 1 | 104.481 | <0.001 | |||
| Year: Urbanization | 16178.900 | 1 | 104.481 | <0.001 |
Variability in Seagrass biomass (AGB, BGB, TB) and sediment organic carbon (SOC) at gradients of urbanization over time.
At high urbanization sites, seagrass BGB found declined from 27.83 ± 10.72 gm drywt/m2 in 2010 to 29.48 ± 11.23 gm drywt/m2 in 2022. At low urbanization sites, seagrass BGB found increased from 30.83 ± 13.63 gm drywt/m2 in 2010 to 37.724 ± 15.45 gm drywt/m2 in 2022. Seagrass BGB exhibited moderate variability between years (5.9–22.4% in high and low urban sites respectively), and neither urbanization nor the interaction between year and urbanization was statistically significant. This indicates that root and rhizome structures may be more resilient to short-term environmental changes and urban pressures than the above-ground components, potentially providing a buffer for sediment stabilization and carbon storage despite canopy degradation. Total biomass (TB), which combines above- and below-ground components, followed similar patterns, with fluctuations of 5–21.6%, between the two years and no statistically significant effects of urbanization or interaction.
In contrast, sediment organic carbon (SOC) stocks exhibited the most pronounced variation and were highly responsive to both temporal and spatial factors. At high urbanization sites, the sediment organic carbon found significantly reduced from 130.83 ± 14.64 Mg C/ha in 2020 to 75.002 ± 11.87 Mg C/ha in 2022. Whereas at low urbanization sites, there was prominent increase in sediment organic carbon from 130.83 ± 14 Mg C/ha in 2010 to 155.45 ± 7.06 Mg C/ha in 2022. The effect of year on SOC was significant (p = 0.00033), with differences ranging from an 18.8% increase to a 42.7% decrease over the decade. Urbanization had an extremely strong effect (p< 0.001), and the interaction between year and urbanization was also highly significant (p< 0.001). High-impact urban sites consistently demonstrated substantial reductions in SOC compared to low-impact sites, suggesting a marked loss of carbon retention potential in areas subjected to intense urban pressures. These results indicate the high vulnerability of sediment carbon stocks to coastal urbanization, likely driven by seagrass biomass reduction, sediment disturbance, and altered biogeochemical processes associated with human activity.
Overall, the analysis demonstrates that above-ground seagrass biomass and sediment carbon stocks are strongly affected by urbanization, with SOC being particularly sensitive. While below-ground biomass appears to be more resistant, the combined effect of reduced canopy structure and declining sediment carbon highlights a significant degradation of the blue carbon potential in heavily urbanized sectors of Palk Bay. These findings reinforce the critical link between urban expansion, seagrass health, and carbon sequestration capacity in tropical coastal ecosystems.
The relative change in seagrass above ground biomass, below ground biomass, total biomass and sediment organic carbon at the high and low urbanization 2022, compared to the observations of 2010, were significantly different (p<0.05), with significant increase observed at low urbanization locations, and significant reduction was evident at high urbanization locations. In addition to Tables 1 and 2, bar plots summarizing the measured parameters for each study area in 2010 and 2022 are presented in Figure 4, to allow easier visual comparison of changes over time.
Figure 4
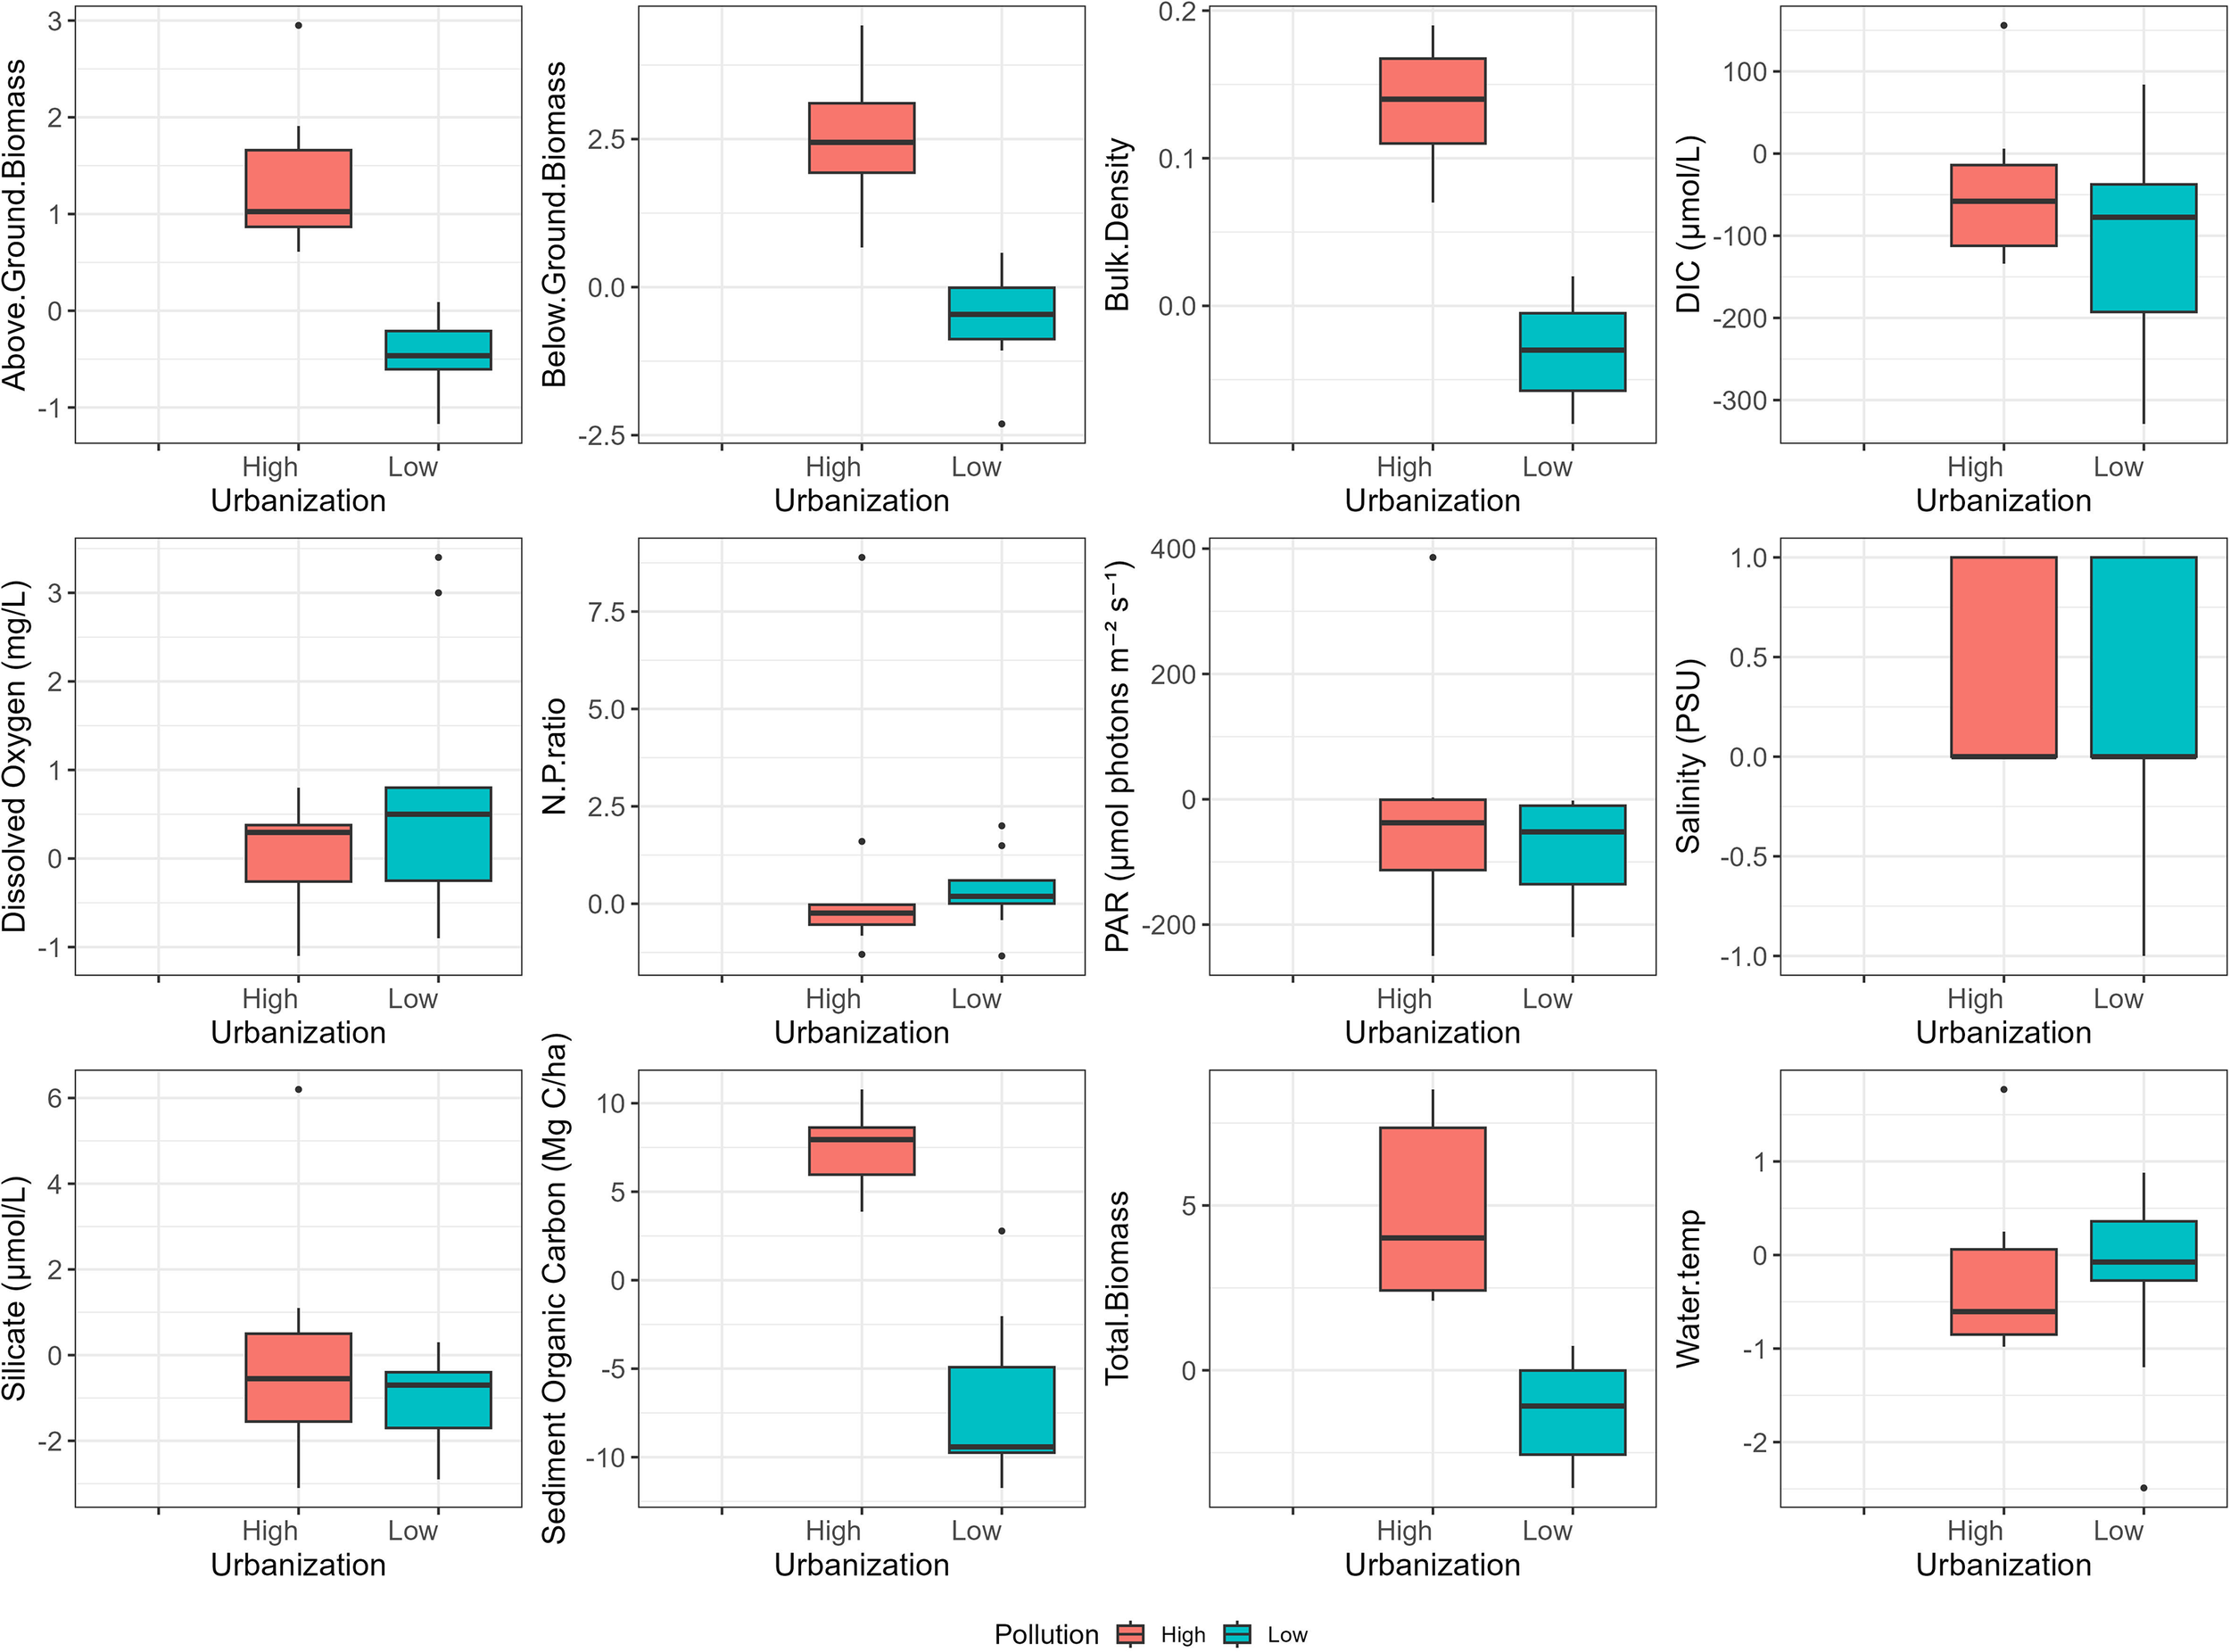
Relative changes in important seagrass and environment related variables in 2022 compared to 2010, at high and low urbanized locations.
Principal Component Analysis (PCA) was performed to summarize the variability of seagrass, sediment organic carbon, and water quality parameters across sites and years. The first seventeen principal components explained a cumulative variance of approximately 99%, with the first five components accounting for 79.93% of the total variance. PC1 alone explained 28.91% of the variance, while PC2 captured 18.87%, indicating that these two axes sufficiently represent the major environmental gradients in the dataset. PC3 explained an additional 14.54% of the variance and primarily captured secondary gradients associated with sediment properties, urbanization (built-up area), salinity, dissolved oxygen, and bulk density. Together, the PC1, PC2 and PC3 explained 62.3% of total variance in the dataset. The loadings of individual variables on PC1 and PC2 reveal the main environmental and biological drivers of variation (Table 3). PC1 was positively associated with sediment and water parameters including N:P ratio (0.429), silicate (0.405), dissolved oxygen (0.264), chlorophyll a (0.249), and sediment organic carbon (0.032), whereas it was negatively correlated with water temperature (−0.414), PAR (−0.404), and dissolved inorganic carbon (DIC) (−0.335). This suggests that PC1 primarily represents a nutrient-sediment-seagrass gradient, with higher scores reflecting nutrient enrichment and oxygen availability, and lower scores associated with thermal and irradiance stress. PC2 was dominated by negative loadings of total biomass (−0.503), below-ground biomass (−0.478), above-ground biomass (−0.444), and percentage organic carbon (−0.353), highlighting seagrass biomass and sediment organic carbon dynamics as key components of PC2 variation (Figure 5). PC3 captured complimentary variation linked to urbanization and sediment-water interaction, with strong contributions from sediment organic carbon (0.455), built-up area (-0.477), salinity (-0.417), dissolved oxygen (-0.294), and bulk density. This gives additional information on the differences in sites, but it does not alter the primary separation of sites observed along PC1 and PC2.
Table 3
| Variable | PC1 | PC2 |
|---|---|---|
| Water temperature | -0.414 | -0.080 |
| PAR | -0.404 | -0.006 |
| Dissolved inorganic carbon (DIC) | -0.335 | -0.037 |
| N:P ratio | 0.429 | 0.037 |
| Silicate | 0.405 | 0.082 |
| Total biomass (TB) | 0.028 | -0.503 |
| Below-ground biomass (BGB) | 0.022 | -0.478 |
| Above-ground biomass (AGB) | 0.033 | -0.444 |
| Percentage Organic Carbon | 0.040 | -0.353 |
PCA loadings for PC1 and PC2 showing environmental and biomass variables with strong contributions.
Only variables with absolute loadings >0.3 on at least one PC are shown. PC1 primarily captures gradients in water temperature, PAR, DIC, N:P ratio, and silicate, whereas PC2 is largely associated with biomass components.
Figure 5
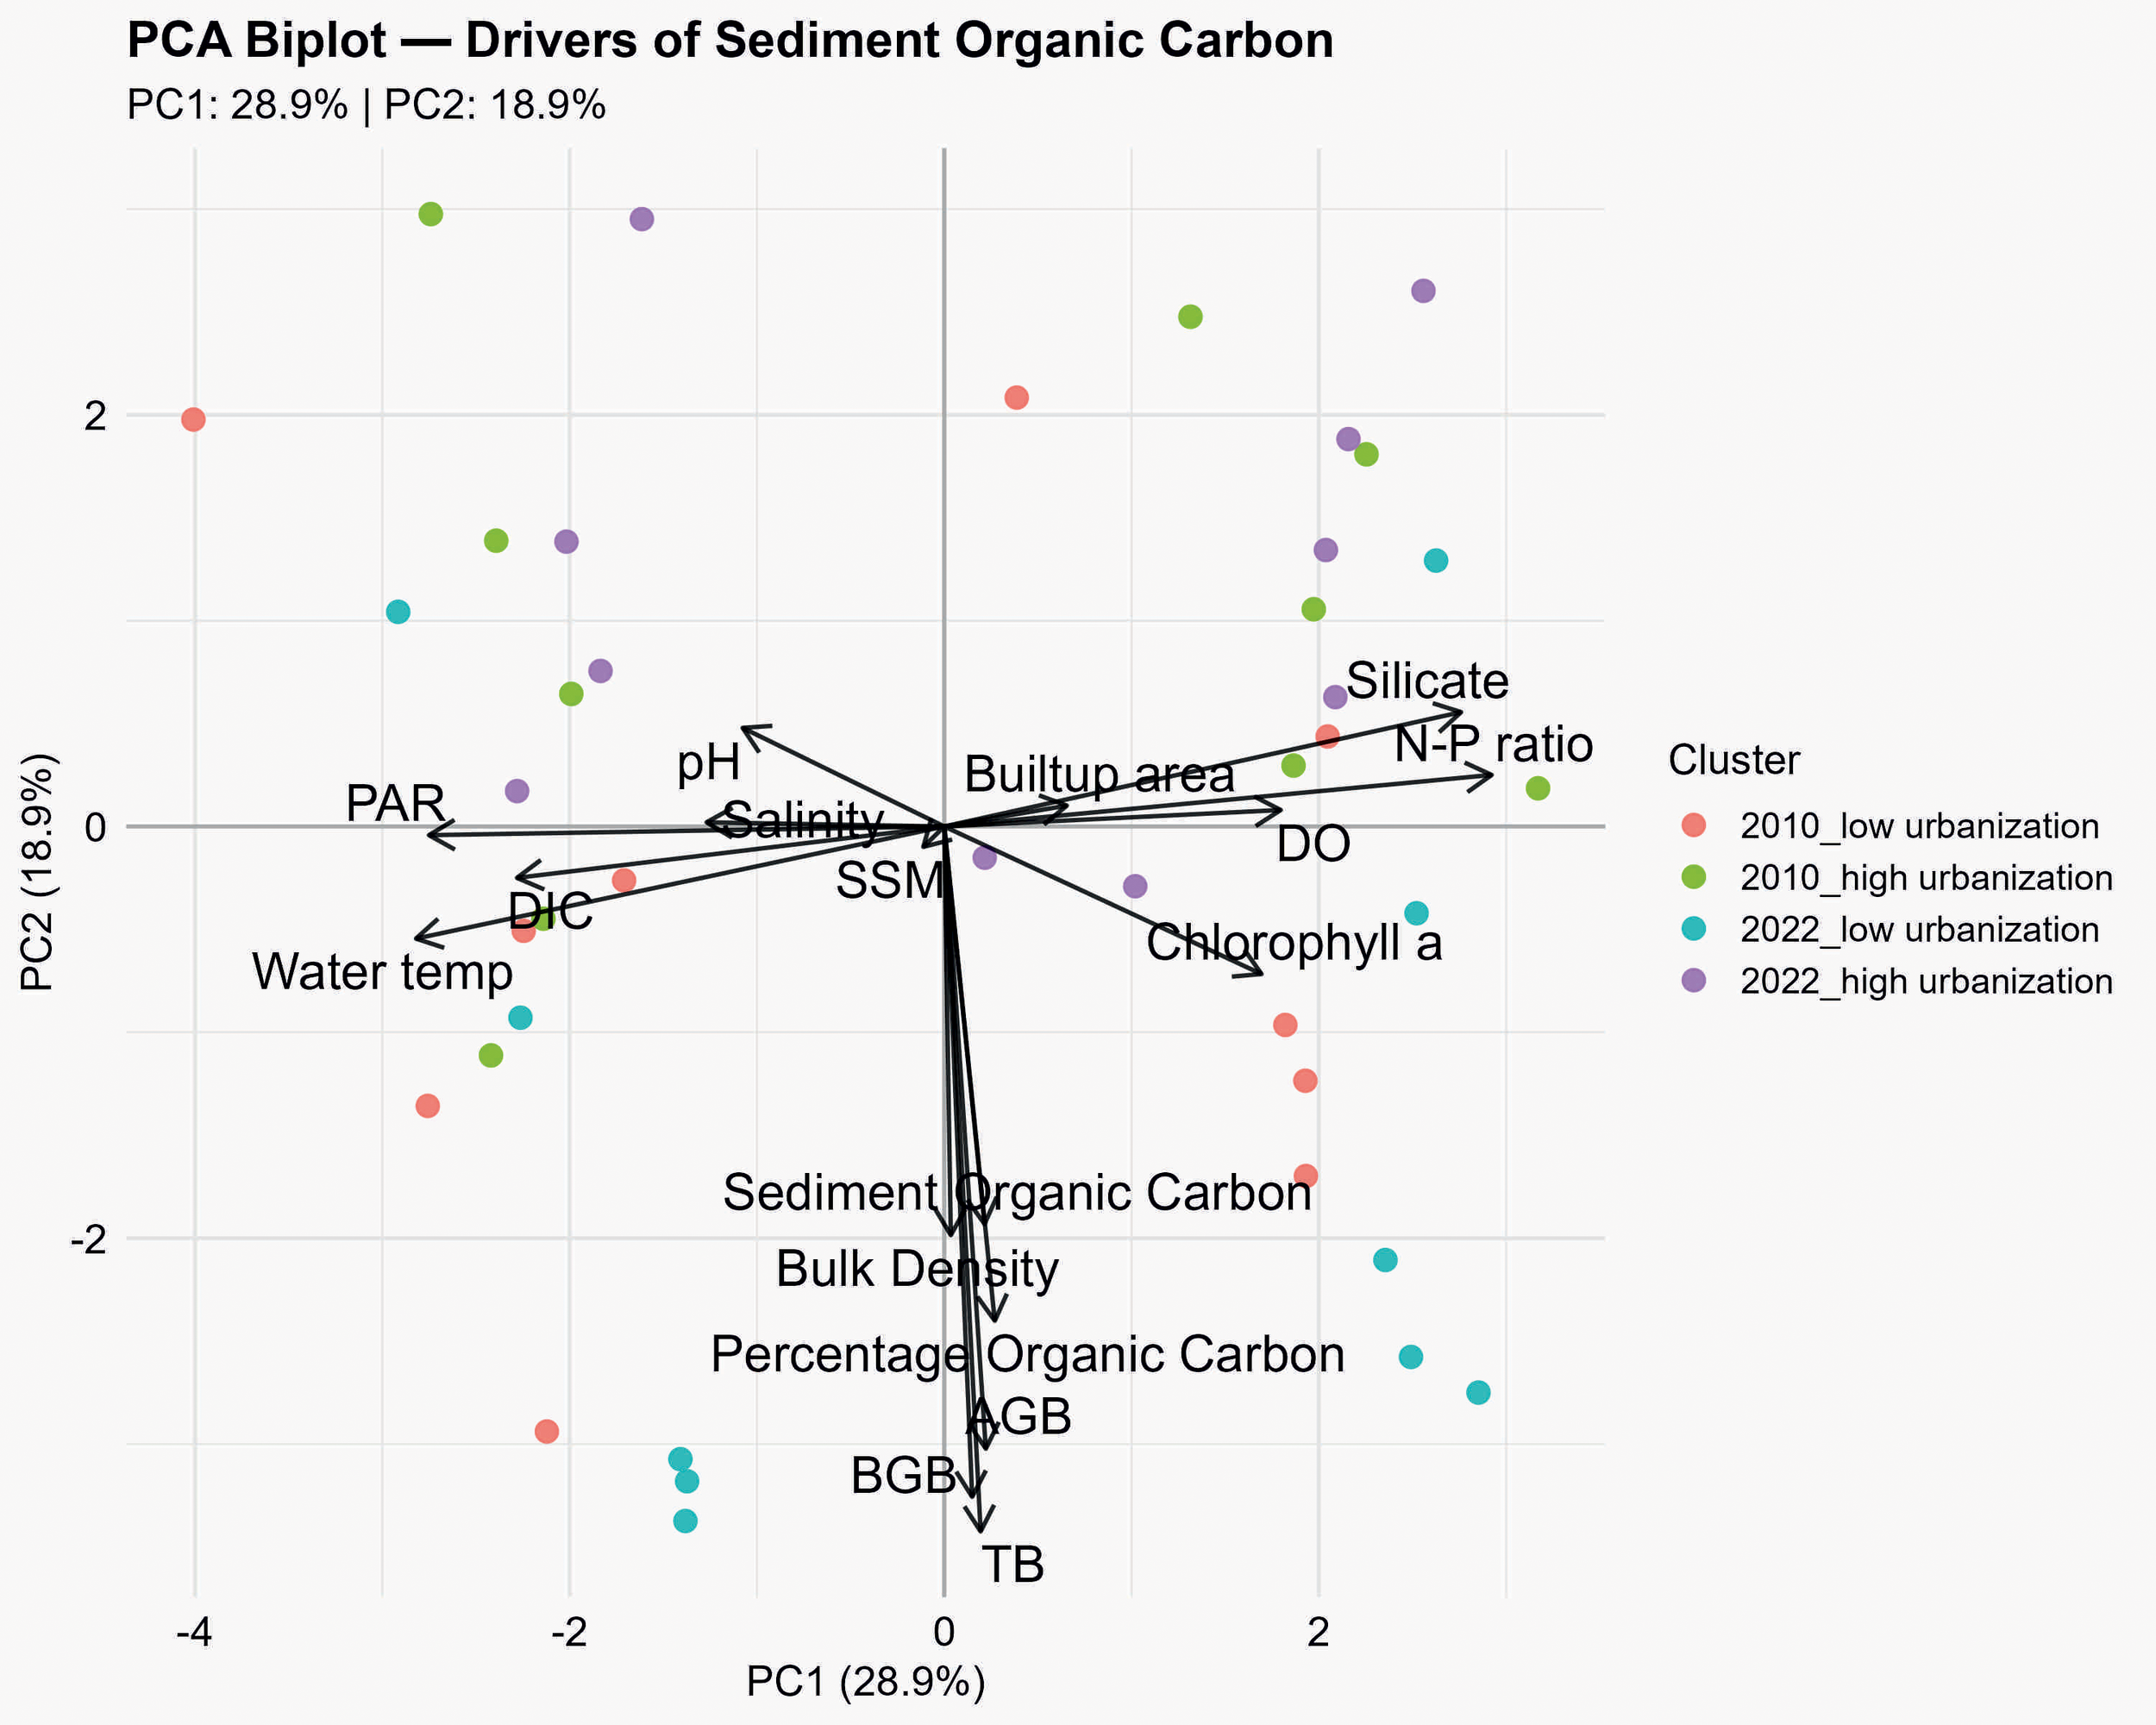
PCA biplot showing the relationship between environmental variables and SOC, and their variability across year×ubanization clusters.
Analysis of site scores along PC1, PC2 and PC3 revealed clear demarcation of urbanization and temporal factors (Supplementary Table 1). In 2010, low urbanization sites clustered around negative PC1 and PC2 values, reflecting lower nutrient inputs and relatively intact seagrass–sediment conditions. Conversely, high urbanization sites in 2010 exhibited positive PC2 values, corresponding to enhanced nutrient ratios and reduced seagrass biomass. By 2022, low urbanization sites shifted toward positive PC1 and strongly negative PC2 scores, indicating increased sediment and water nutrient levels coupled with reduced seagrass biomass, whereas high urbanization sites maintained positive PC1 and PC2 values, consistent with continued urban pressure and nutrient enrichment. PC3 captured the role of secondary gradients such as sediment properties, urbanization and water chemistry, beyond the primary nutrient–biomass gradients represented by PC1 and PC2.
Notably, though locations, Pamban and Mandapam showed signals of increased urbanization by 2022, the rate of change of urbanization in terms of built-up area and population density was very low, compared to locations Devipattinam and Thondi. Such low rate of change could have led to the lesser ecological impact on seagrass community than in high urbanization locations (Devipattinam and Thondi). The mean PCA scores for the defined clusters further emphasize these patterns (Supplementary Table 2). The 2010 low urbanization cluster had mean PC1 and PC2 values of −0.473 and −0.447, respectively. On the other hand, the high urbanization cluster had a slightly negative PC1 (−0.111), but a strongly positive PC2 (0.927), illustrating greater anthropogenic influence in high urbanized sites. By 2022, low urbanization sites exhibited a mean PC1 of 0.351 and PC2 of −1.608, suggesting increased nutrient loading, but declining seagrass biomass, while high urbanization sites showed positive mean scores on both axes (PC1 = 0.233; PC2 = 1.128), indicating persistent nutrient enrichment and seagrass degradation over the 12-year period. Examination of the actual environmental and biological parameter means across clusters (Supplementary Table 3) provides an in-depth interpretation of the PCA patterns. In 2010, low urbanization sites had higher total biomass (TB = 43.996 g m-²) and below-ground biomass (BGB = 30.833 g m-²) than high urbanization sites (TB = 40.091 g m-²; BGB = 27.832 g m-²), with similar sediment organic carbon (130.832 mg C ha-¹) and percentage organic carbon (1.017% vs. 0.590%). By 2022, low urbanization sites showed increased TB (53.498 g m-²) and BGB (37.724 g m-²) compared to 2010, but sediment organic carbon also increased (155.448 mg C ha-¹), reflecting moderate nutrient accumulation despite low urbanization. In contrast, high urbanization sites in 2022 had reduced above-ground biomass (AGB = 9.131 g m-²) and sediment organic carbon (75.002 mg C ha-¹) relative to low urbanization sites, demonstrating persistent anthropogenic pressure leading to seagrass degradation. Notably, built-up area expanded considerably between 2010 and 2022 for both low and high urbanization clusters, highlighting urbanization as a key driver of multivariate variation in the environmental variables.
While PCA identifies the major patterns of variation in the dataset without considering the underlying environmental or temporal drivers, the Redundancy Data Analysis (RDA) allows us to explicitly assess the influence of such explanatory variables on the observed multivariate patterns. The RDA results thus complement the PCA by linking the main axes of variation to specific environmental and temporal gradients (Table 4). RDA confirmed the PCA patterns, with RDA1 explaining 87.3% of the constrained variation (F = 261.17, p = 0.001). Built-up area was the strongest positive driver, while percentage organic carbon also aligned positively with RDA1, driven mainly by elevated values in 2022 low-urbanization sites rather than high-urban sites. Above-ground biomass showed a similar positive association, whereas salinity and pH were negatively related to urban influence. Temporal effects were significant, with 2022 sites generally shifting towards the positive RDA1 end, reflecting both expanded built-up area in high-urban sites and moderate nutrient accumulation in some low-urban sites. Notably, high urbanization was associated with reduced seagrass biomass and lower sediment organic carbon, indicating persistent anthropogenic pressure and habitat degradation.
Table 4
| Variable | RDA1 Loading | F-value | p-value | Direction | Significance |
|---|---|---|---|---|---|
| Built-up area | 0.533 | 44.97 | 0.001 | Positive | *** |
| Total Biomass (TB) | 0.216 | 10.33 | 0.005 | Positive | ** |
| Below-ground Biomass (BGB) | 0.006 | 1.06 | 0.346 | Neutral | Ns |
| Above-ground Biomass (AGB) | 0.462 | 22.11 | 0.001 | Positive | *** |
| % Organic Carbon | 0.739 | 51.09 | 0.001 | Positive | *** |
| Bulk Density | -0.092 | 5.74 | 0.029 | Slight Negative | * |
| Water Temperature | -0.067 | 0.50 | 0.493 | Neutral | Ns |
| PAR | 0.011 | 0.19 | 0.651 | Neutral | Ns |
| pH | -0.220 | 1.42 | 0.257 | Negative | Ns |
| Salinity | -0.405 | 0.21 | 0.654 | Negative | Ns |
| SSM | 0.032 | 0.36 | 0.555 | Neutral | Ns |
| DO | -0.205 | 0.33 | 0.592 | Negative | Ns |
| Chlorophyll a | 0.125 | 0.06 | 0.839 | Neutral | Ns |
| DIC | 0.081 | 1.73 | 0.212 | Positive | Ns |
| Urbanization (Low vs High) | 0.678 | 1.24 | 0.282 | Positive | Ns |
| Year (2010 vs 2022) | -0.263 | 16.73 | 0.001 | Negative | *** |
Summary of RDA1 loadings, F-values, and significance for environmental and biological variables. Positive/negative direction indicates the relationship with RDA1.
Discussion
A comprehensive decadal assessment of temporal and urbanization-driven changes in seagrass-associated characteristics, environmental conditions, and blue carbon dynamics over a 12-year period (2010–2022) is presented in this study. By integrating multivariate statistical and cluster analyses, this study effectively showed the significant interplay between natural temporal variability and anthropogenic pressures, revealing how these forces collectively shape coastal seagrass meadow dynamics.
The multivariate patterns show that even though natural environmental variations influence the seagrass biomass and sediment carbon content, it is the urbanization that emerge as the most consistent driver of ecosystem change, with significant implications for both carbon storage and seagrass biomass. PCA patterns provided the first clear separation of sites by both urbanization level and sampling year, with high-urbanization sites clustering away from vectors representing SOC and seagrass biomass, and low-urbanization sites shifting over time towards altered sediment profiles. RDA confirmed and quantified these relationships, with RDA1 explaining 87.3% of the constrained variation and identifying built-up area and percentage organic carbon as the strongest positive drivers along this axis. Notably, the positive association between SOC and RDA1 was driven largely by elevated 2022 values in certain low-urbanization sites, while high-urban sites exhibited persistently low SOC. High urbanization leads to reduced seagrass cover, thereby releasing SOC and reducing the C sequestration ability (Dahl et al., 2022; Jiang et al., 2018). Above-ground biomass also showed a positive relationship with RDA1, whereas salinity and pH were negatively associated, indicating that urban influence is linked to both altered sediment chemistry and reduced seagrass biomass. These multivariate outcomes provide a robust framework for interpreting how environmental gradients and human pressures jointly influence seagrass ecosystems, with statistically significant urbanization effects evident for DO and DIC.
Temporal variation contributed meaningfully to shifts in environmental conditions, biomass, and sediment properties. Parameters such as water temperature and PAR loaded negatively on PC1, suggesting that higher thermal and light regimes corresponded with reduction in seagrass and sediment responses (Collier and Waycott, 2014; Dawson and Dennison, 1996; Krumhansi et al., 2021; Wong and Dowd, 2025; Bass et al., 2024). These trends reflect both interannual variability and seasonal influences (Zimmerman, 2021; Tang and Hadibarata, 2022), which in turn modulate metabolic rates, photosynthetic efficiency, and carbon allocation between above ground (AGB) and below ground biomass (BGB) (Ganguly et al., 2017, 2018; Ranith et al., 2024). Dissolved oxygen and pH also exhibited fluctuations, likely driven by temperature–nutrient–productivity feedbacks. However, two-way ANOVA indicated that urbanization did not significantly affect these parameters, except for DO and DIC. While not all of these changes were statistically significant individually, their cumulative effect would have interacted with urbanization-driven changes to influence the sediment biogeochemistry, SOC sequestration, and nutrient cycling—processes that underpin seagrass meadow health and resilience (Miyajima and Hamaguchi, 2018; Qin et al., 2021; Seal et al., 2023).
Urbanization, however, exerted a more pronounced and direct influence. High-urbanization sites consistently displayed reduced SOC, AGB, and BGB relative to low-urbanization sites (Vedharajan et al., 2023; Dahl et al., 2022), indicating that anthropogenic pressures diminish both carbon storage capacity and seagrass growth potential (Reyes et al., 2022). Notably, the built-up area expanded by about 11–12 Km2 in Devipattinam and Thondi in 2022, compared to 2010, compared to the ~4 Km2 change in Pamban and Mandapam. These differences in the urban expansion closely align with the observed 25.5% reduction in AGB, and 42.7% decline in SOC at the high urbanization sites, compared to the low to moderate increase in the low urbanization sites. This variability reinforces the linkage between urban expansion and seagrass carbon dynamics. This pattern aligns with the PCA and RDA results, where high-urban clusters were positioned opposite vectors for biomass and SOC. The declines in SOC in 2022 high-urban sites may be attributed to sediment disturbance, altered hydrodynamics, and reduced seagrass biomass that disrupt carbon accumulation (Qin et al., 2021). In contrast, some low-urban sites showed modest SOC increases over the same period, suggesting that in the absence of intense anthropogenic disturbance, increased seagrass biomass can enhance carbon storage (Reyes et al., 2022). The interaction between time and urbanization was evident in multiple variables, particularly SOC, dissolved oxygen, and pH. Low-urban sites tended to maintain or improve SOC and biomass over time, while high-urban sites followed a declining pattern (Dunic et al., 2021; Zhang et al., 2025). Such patterns indicate that anthropogenic pressures can amplify or override the effects of natural variability (Tang and Hadibarata, 2022; Dakos et al., 2025), pushing ecosystems toward degraded states even under otherwise favorable environmental conditions.
In addition to urbanization, it is important to discuss the synergistic role of environmental processes as confounding drivers in the observed changes in seagrass ecosystem. Sediment resuspension is one of the major physical phenomena in the Palk Bay region contributed bu monsoon driven sediment pulses in the wet season and from altered hydrodynamics (Ranith et al., 2024). Resuspended sediments can cause physical damage to seagrasses from smothering, and also will accelerate sediment organic carbon loss (Macreadie et al., 2015; Ranith et al., 2024). Along with the anthropogenic pressures, the episodic heavy storm events and associated freshwater inflow can modify salinity, and nutrient condition regionally, creating short-term stress to seagrass beds (Kendrick et al., 2019). These processes interact with urbanization, sometimes amplifying its effects and sometimes masking them, which explains the temporal variability seen in our PCA and RDA results. This complex interaction underscores the need for detailed studies integrating temporal environmental dynamics and urbanization change.
Nutrient stoichiometry was another key factor linked to urbanization. At highly urbanized locations (Devipattinam and Thondi), altered N:P ratios and lower SOC (Lapointe et al., 2020; Hauxwell and Valiela, 2004), indicate nutrient imbalances that can reduce seagrass biomass and sediment carbon retention (Armitage and Fourqurean, 2016).). The N:P ratio (7.3 - 11.5) recorded from the sites were well below the canonical Redfield ratio of 16:1 suggesting nitrogen limitation in these systems. Nitrogen limitation potentially inhibits seagrass growth, resulting in reduced seagrass AGB, and BGB, which inturn limits carbon allocation to sediments, especially at high urbanization sites. Low-urban sites maintained more balanced nutrient conditions, supporting greater biomass and carbon allocation to belowground tissues, which is critical for long-term carbon sequestration (Drexler and Don, 2024). Considering the four study sites, the population density at Thondi and Devipatnam underwent an explosive increase by 2022, compared to 2010. This has resulted in an increase in built-up area by 12 km2 at these two sites, whereas, Pamban and Mandapam north exhibited only marginal increase in population density and a correspondingly small increase in built-up area of 4 km2, between 2010 and 2022. This rapid urbanization led to environmental disturbances, including nutrient inputs and sedimentation, that potentially can amplify nitrogen limitation, resulting in observed decrease in seagrass biomass and SOC. This points to a clear conclusion: urbanization reduces the ability of seagrass meadows to sustain biomass and carbon storage. In high-urban areas, multiple stressors such as increased sedimentation (Cabaço et al., 2008), reduced water clarity (Zimmerman et al., 2008), altered hydrodynamics (Widdows et al., 2008), and nutrient enrichment (Jiang et al., 2018), interact to undermine seagrass health, and associated blue carbon dynamics. These stressors not only limit photosynthetic potential through reduced light penetration, but also destabilize root–rhizome systems, thereby lowering SOC retention. In contrast, low-urban sites act as refugia, exhibiting greater ecological stability and resilience in the face of moderate environmental change.
From a management perspective, these findings underscore the urgency of integrating coastal zone planning with conservation strategies to mitigate urban impacts. Limiting the expansion of built-up areas, improving stormwater treatment, reducing nutrient and sediment runoff, and protecting low-urbanization reference sites should be priorities. Considering the growing recognition of seagrass meadows as critical blue carbon sinks, the preservation of resilient, low-urbanization seagrass meadows is essential for sustaining carbon sequestration, biodiversity, and the suite of ecosystem services these habitats provide.
Study limitations
Though NDVI provides a reliable and robust proxy for built-up area, and urbanization, there are potential uncertainties due to spectral confusion between built-up features, other structures and bare soil, along with temporal reflectance variabilities. Though we crosschecked the NDBI derived in this study against high resolution google earth imagery and local land-use information, a formal quantitative ground-truthing could not be conducted across the study regions during 2010 and 2020, and is a limitation of this study. Another limitation is the absence of high-resolution spatial mapping of seagrass coverage, and quantified seagrass cover change. Future integration of such satellite image-based seagrass maps and quantified seagrass extent will enable a more comprehensive assessment of the spatial and temporal dynamics of seagrass in relation to environmental changes. Unmeasured drivers such as grazing pressure, local environmental processes including monsoonal impact, storms, hydrodynamics etc, and role of invasive species could influence seagrass ecosystem dynamics, but were not included in the present study. This along with the limited number of sampling data is a potential limitation. Future studies need to be planned to select multiple sites representing different urbanization gradient, along with studying a wide spectrum of regional stressors to have a detailed understanding of the synergistic interaction of urbanization and environmental stressors. As the population data from world population database is available only till 2020, in this study we extrapolated the values to 2022, which might have introduced some uncertainty, and need to be treated cautiously as a limitation of the demographic analysis. Despite these limitations, the present study provides valuable information into the decadal changes in seagrass biomass, sediment carbon stocks, as a response to urbanization pressures.
Conclusion
This study shows clear evidence that both temporal variability and urbanization are major determinants of seagrass ecosystem condition, having effects on biomass, sediment organic carbon (SOC), and sediment quality. Seagrass environments with high-urbanization settings in the closest vicinity have consistently lower SOC, above ground biomass (AGB), and belowground biomass (BGB), reflecting compounded impacts of anthropogenic disturbance on carbon storage capacity and seagrass productivity. In contrast, seagrass meadows in regions associated with low urbanization impacts maintained comparatively stable ecological conditions, highlighting their ecological importance as biodiversity refugia and blue carbon preservation. By integrating multivariate analyses over a 12-year period, this study highlights the need to consider both temporal trajectories and spatial gradients in conservation planning. Protecting low-urbanization sites, improving coastal water quality, and regulating urban expansion are critical to maintaining seagrass resilience and their contribution to climate mitigation. Future research, especially marine spatial planning, should couple long-term ecological monitoring with studies focusing on regional hydrodynamics, anthropogenic pressures, and seagrass physiological responses to better predict and manage seagrass ecosystem variabilities in rapidly urbanizing coasts.
Statements
Data availability statement
The raw data supporting the conclusions of this article will be made available from the authors upon request, subject to institutional and funders data-sharing policies.
Author contributions
RR: Data curation, Validation, Conceptualization, Writing – review & editing, Software, Methodology, Writing – original draft, Formal analysis, Investigation, Visualization. NM: Conceptualization, Methodology, Supervision, Writing – review & editing, Writing – original draft, Funding acquisition, Project administration. EN: Supervision, Writing – review & editing, Conceptualization. FH: Formal analysis, Writing – review & editing, Data curation. RR: Investigation, Funding acquisition, Resources, Writing – review & editing. LP: Writing – review & editing, Resources, Funding acquisition.
Funding
The author(s) declare financial support was received for the research and/or publication of this article. The authors are thankful to the Anusandhan National Research Foundation, Government of India, for providing financial support to conduct the study through the startup research grant (SRG/2021/002318). The authors also thank the Research Council of Norway, for the financial support extended to this work via the C3-eKerala project (343511) and the Nansen Center basic funds grant no. 342624.
Acknowledgments
Authors also express their gratitude to the Nansen Environmental Research Centre (India), and the Nansen Environmental and Remote Sensing Center, Bergen Norway, for providing infrastructural and technical support.
Conflict of interest
The authors declare that the research was conducted in the absence of any commercial or financial relationships that could be construed as a potential conflict of interest.
Generative AI statement
The author(s) declare that no Generative AI was used in the creation of this manuscript.
Any alternative text (alt text) provided alongside figures in this article has been generated by Frontiers with the support of artificial intelligence and reasonable efforts have been made to ensure accuracy, including review by the authors wherever possible. If you identify any issues, please contact us.
Publisher’s note
All claims expressed in this article are solely those of the authors and do not necessarily represent those of their affiliated organizations, or those of the publisher, the editors and the reviewers. Any product that may be evaluated in this article, or claim that may be made by its manufacturer, is not guaranteed or endorsed by the publisher.
Supplementary material
The Supplementary Material for this article can be found online at: https://www.frontiersin.org/articles/10.3389/fmars.2025.1690700/full#supplementary-material
References
1
Acharyya T. Raulo S. Singh S. Sudatta B. P. Srichandan S. Baliarsingh S. K. et al . (2023). Status and conservation challenges of the second-largest seagrass bed in India: Chilika lagoon. Environ. Sci pollut. Res.30, 100265–100281. doi: 10.1007/s11356-023-29369-w
2
Armitage A. R. Fourqurean J. W. (2016). Carbon storage in seagrass soils: long-term nutrient history exceeds the effects of near-term nutrient enrichment. Biogeosciences13, 313–321. doi: 10.5194/bg-13-313-2016
3
Azzez P. A. Goldin Q. Mahendiran M. Shirish Manchi S. Mane A. M. Nishadh K. A. et al . (2016). The Ecological Baseline Assessment of the Palk Bay ( CMPA Technical Report Series No. 06, 55 pp). Deutsche Gesellschaft für Internationale Zusammenarbeit (GIZ) GmbH.
4
Bass A. V. Falkenberg L. J. Thibodeau B. (2024). Seagrasses under stress: Independent negative effects of elevated temperature and light reduction at multiple levels of organization. Limnology Oceanography. doi: 10.1002/lno.12759
5
Cabaço S. Santos R. Duarte C. M. (2008). The impact of sediment burial and erosion on seagrasses: a review. Estuarine Coast. Shelf Sci79, 354–366. doi: 10.1016/j.ecss.2008.04.021
6
Chen D. Wang Y. Shen Z. Liao J. Chen J. Sun S. (2021). Long time-series mapping and change detection of coastal zone land use based on google earth engine and multi-source data fusion. Remote Sens.14, 1. doi: 10.3390/rs14010001
7
Collier C. J. Waycott M. (2014). Temperature extremes reduce seagrass growth and induce mortality. Mar. pollut. Bull.83, 483–490. doi: 10.1016/j.marpolbul.2014.03.050
8
Dahl M. Ismail R. Braun S. Masqué P. Lavery P. S. Gullström M. et al . (2022). Impacts of land-use change and urban development on carbon sequestration in tropical seagrass meadow sediments. Mar. Environ. Res.176, 105608. doi: 10.1016/j.marenvres.2022.105608
9
Dakos V. Le Vilain A. Thebault E. Alcoverro T. Boada J. Infantes E. et al . (2025). Carbon storage of seagrass ecosystems may experience tipping points in response to anthropogenic stress-a modeling perspective. Front. Complex Syst.3, 1534330. doi: 10.3389/fcpxs.2025.1534330
10
Dawson S. P. Dennison W. C. (1996). Effects of ultraviolet and photosynthetically active radiation on five seagrass species. Mar. Biol.125, 629–638. doi: 10.1007/BF00349244
11
Drexler S. Don A. (2024). Carbon sequestration potential in hedgerow soils: Results from 23 sites in Germany. Geoderma445, 116878. doi: 10.1016/j.geoderma.2024.116878
12
Duarte C. M. Apostolaki E. T. Serrano O. Steckbauer A. Unsworth R. K. (2025). Conserving seagrass ecosystems to meet global biodiversity and climate goals. Nat. Rev. Biodiversity, 1, 150–165. doi: 10.1038/s44358-025-00028-x
13
Duarte C. M. Chiscano C. L. (1999). Seagrass biomass and production: a reassessment. Aquat. Bot.65, 159–174. doi: 10.1016/S0304-3770(99)00038-8
14
Dunic J. C. Brown C. J. Connolly R. M. Turschwell M. P. Côté I. M. (2021). Long-term declines and recovery of meadow area across the world’s seagrass bioregions. Global Change Biol.27, 4096–4109. doi: 10.1111/gcb.15684
15
Fourqurean J. W. Duarte C. M. Kennedy H. Marbà N. Holmer M. Mateo M. A. et al . (2012). Seagrass ecosystems as a globally significant carbon stock. Nat. Geosci.5, 505–509. doi: 10.1038/ngeo1477
16
Friess D. A. Shribman Z. I. Stankovic M. Iram N. Baustian M. M. Lewis C. J. E. (2024). Restoring blue carbon ecosystems. Cambridge Prisms: Coast. Futures2, e9. doi: 10.1017/cft.2024.9
17
Ganguly D. Singh G. Purvaja R. Bhatta R. Selvam A. P. Banerjee K. et al . (2018). Valuing the carbon sequestration regulation service by seagrass ecosystems of Palk Bay and Chilika, India. Ocean Coast. Manage.159, 26–33. doi: 10.1016/j.ocecoaman.2017.11.009
18
Ganguly D. Singh G. Ramachandran P. Selvam A. P. Banerjee K. Ramachandran R. (2017). Seagrass metabolism and carbon dynamics in a tropical coastal embayment. Ambio46, 667–679. doi: 10.1007/s13280-017-0916-8
19
Geevarghese G. A. Akhil B. Magesh G. Krishnan P. Purvaja R. Ramesh R. (2018). A comprehensive geospatial assessment of seagrass distribution in India. Ocean Coast. Manage.159, 16–25. doi: 10.1016/j.ocecoaman.2017.10.032
20
Ha N. T. Manley-Harris M. Pham T. D. Hawes I. (2021). Detecting multi-decadal changes in seagrass cover in tauranga harbour, New Zealand, using landsat imagery and boosting ensemble classification techniques. ISPRS Int. J. Geo-Information10, 371. doi: 10.3390/ijgi10060371
21
Hauxwell J. Valiela I. (2004). Effects of nutrient loading on shallow seagrass-dominated coastal systems: patterns and processes. Estuarine Nutrient Cycling: The influence of primary producers2, 59–92.
22
Hossain M. S. Hashim M. Bujang J. S. Zakaria M. H. Muslim A. M. (2019). Assessment of the impact of coastal reclamation activities on seagrass meadows in Sungai Pulai estuary, Malaysia, using Landsat data (1994–2017). Int. J. Remote Sens.40, 3571–3605. doi: 10.1080/01431161.2018.1547931
23
Jiang Z. Liu S. Zhang J. Wu Y. Zhao C. Lian Z. et al . (2018). Eutrophication indirectly reduced carbon sequestration in a tropical seagrass bed. Plant Soil426, 135–152. doi: 10.1007/s11104-018-3604-y
24
Kaladharan P. Zacharia P. U. Thirumalaiselvan S. Anasu Koya A. Lavanya R. Batcha S. M. (2020). Blue carbon stock of the seagrass meadows of Gulf of Mannar and Palk Bay off Coromandel Coast, south India. Indian J. Fisheries67, 149–153. doi: 10.21077/ijf.2020.67.4.98101-18
25
Kaviarasan T. Thanabalan P. Marigoudar S. R. Murthy M. R. (2025). Blue carbon potential of Indian mangroves, seagrasses, and salt marshes: A review of current knowledge and future directions for climate change mitigation. Navigating Climate Change: Impacts Biodiversity Ecosystem Resilience42, 31–59. doi: 10.1007/978-981-95-0409-1_2
26
Kendrick G. A. Nowicki R. J. Olsen Y. S. Strydom S. Fraser M. W. Sinclair E. A. et al . (2019). A systematic review of how multiple stressors from an extreme event drove ecosystem-wide loss of resilience in an iconic seagrass community. Front. Mar. Sci6, 455. doi: 10.3389/fmars.2019.00455
27
Krumhansi K. A. Dowd M. Wong M. C. (2021). Multiple metrics of temperature, light, and water motion drive gradients in eelgrass productivity and resilience. Front. Mar. Sci8, 597707. doi: 10.3389/fmars.2021.597707
28
Lapointe B. E. Herren L. W. Brewton R. A. Alderman P. K. (2020). Nutrient over-enrichment and light limitation of seagrass communities in the Indian River Lagoon, an urbanized subtropical estuary. Science of the Total Environment.699, 134068.
29
Long B. G. Skewes T. D. Poiner I. R. (1994). An efficient method for estimating seagrass biomass. Aquat. Bot.47, 277–291. doi: 10.1016/0304-3770(94)90058-2
30
Macreadie P. I. Trevathan-Tackett S. M. Skilbeck C. G. Sanderman J. Curlevski N. Jacobsen G. et al . (2015). Losses and recovery of organic carbon from a seagrass ecosystem following disturbance. Proc. R. Soc. B: Biol. Sci.282, 20151537. doi: 10.1098/rspb.2015.1537
31
Miyajima T. Hamaguchi M. (2018). “ Carbon sequestration in sediment as an ecosystem function of seagrass meadows,” in Blue Carbon in Shallow Coastal Ecosystems: Carbon Dynamics, Policy, and Implementation ( Springer Singapore, Singapore), 33–71.
32
Newman D. A. (2014). Missing data: Five practical guidelines. Organizational Res. Methods17, 372–411. doi: 10.1177/1094428114548590
33
Nguyen C. T. Downes N. K. Sitthi A. Losiri C. (2025). Tourism-induced land use transformations, urbanisation, and habitat degradation in the phu quoc special economic zone. Urban Sci9 (1), 11. doi: 10.3390/urbansci9010011
34
Nobi E. P. Dinesh Kumar P. K. (2014). Environmental characteristics of tropical coral reef-seagrass dominated lagoons (Lakshadweep, India) and implications to resilience to climate change. Environ. Earth Sci.72, 1025–1037. doi: 10.1007/s12665-013-3020-9
35
Qin L. Z. Suonan Z. Kim S. H. Lee K. S. (2021). Coastal sediment nutrient enrichment alters seagrass blue carbon sink capacity. Environ. Sci Technol.55, 15466–15475. doi: 10.1021/acs.est.1c03782
36
Ranith R. P. Menon N. Nobi E. P. Raj A. A. Sivaraj S. (2024). Assessment of coral reef connectivity in improved organic carbon storage of seagrass ecosystems in Palk Bay, India. Mar. pollut. Bull.207, 116908. doi: 10.1016/j.marpolbul.2024.116908
37
R Core Team (2025). R: A language and environment for statistical computing (Vienna, Austria: R Foundation for Statistical Computing). Available online at: https://www.R-project.org/ (Accessed October 28, 2025).
38
Ren Y. Liu S. Luo H. Jiang Z. Liang J. Wu Y. et al . (2024). Seagrass decline weakens sediment organic carbon stability. Sci Total Environ.937, 173523. doi: 10.1016/j.scitotenv.2024.173523
39
Reyes A. G. B. Vergara M. C. S. Blanco A. C. Salmo S. G. III (2022). Seagrass biomass and sediment carbon in conserved and disturbed seascape. Ecol. Res.37, 67–79. doi: 10.1111/1440-1703.12272
40
Scherner F. (2025). “ Loss of Seaweed Biodiversity in Marine Tropical Regions Caused by Unplanned Coastal Urbanization,” in Ecology of Tropical Cities, Volume I: Natural and Social Sciences Applied to the Conservation of Urban Biodiversity ( Springer Nature Switzerland, Cham), 171–186.
41
Seal S. Iyer S. Ghaneker C. Prabakaran N. Johnson J. A. (2023). Seagrass and Seaweed habitats in Gulf of Mannar and south Palk Bay region (p. 5) (Dehradun: Wildlife Institute of India), 17p.
42
Smeaton C. Barlow N. L. Austin W. E. (2020). Coring and compaction: Best practice in blue carbon stock and burial estimations. Geoderma364, 114180. doi: 10.1016/j.geoderma.2020.114180
43
Strickland J. D. H. Parsons T. R. (1972). A practical handbook of seawater analysis. (2nd edition). Bull. Fish. Res. Bd. Can167, 310 p.
44
Tang K. H. D. Hadibarata T. (2022). Seagrass meadows under the changing climate: A review of the impacts of climate stressors. Res. Ecol.4, 27–36. doi: 10.30564/re.v4i1.4363
45
Thangaradjou T. Bhatt J. R. (2018). Status of seagrass ecosystems in India, Ocean & Coastal Management, Vol. 159. 7–15. doi: 10.1016/j.ocecoaman.2017.11.025
46
Vedharajan B. Pandisamy R. Nobi E. P. Hashim S. John A. Sivakumar K. et al . (2023). “ Seagrasses in the Indian Ocean region with special reference to urbanization,” in Climate Change and Urban Environment Sustainability ( Springer Nature Singapore, Singapore), 109–124.
47
Widdows J. Pope N. D. Brinsley M. D. Asmus H. Asmus R. M. (2008). Effects of seagrass beds (Zostera noltii and Z. marina) on near-bed hydrodynamics and sediment resuspension. Mar. Ecol. Prog. Ser.358, 125–136. doi: 10.3354/meps07338
48
Wong M. C. Dowd M. (2025). Eelgrass (Zostera marina) trait variation across varying temperature-light regimes. Estuaries Coasts48, 13. doi: 10.1007/s12237-024-01439-3
49
Zhang C. Lu J. Wu J. Xiong B. (2025). Neglected biogeochemical process for ocean health: seagrass detritus simultaneously enhances phenolic endocrine-disrupting chemical capture and organic carbon sequestration. Environ. Sci Technology59 (21), 10533–10544. doi: 10.1021/acs.est.5c03543
50
Zhao L. Fan X. Xiao S. (2025). Remote-sensing indicators and methods for coastal-ecosystem health assessment: A review of progress, challenges, and future directions. Water17, 1971. doi: 10.3390/w17131971
51
Zimmerman J. B. Mihelcic J. R. Smith A. J. (2008). Global stressors on water quality and quantity. Environ Sci Technol42 (12), 4247–4254. doi: 10.1021/es0871457
52
Zimmerman R. C. (2021). Scaling up: Predicting the impacts of climate change on seagrass ecosystems. Estuaries and Coasts. 44 (2), 558–576.
Summary
Keywords
urbanization, seagrass biomass, NDBI, anthropogenic pressure, sediment organic carbon
Citation
Ranith RP, Menon NN, Nobi EP, Haris F, Raj RP and Pettersson LH (2025) Decadal-scale urban footprints on seagrass blue carbon dynamics in Palk Bay, India: a remote sensing based framework. Front. Mar. Sci. 12:1690700. doi: 10.3389/fmars.2025.1690700
Received
22 August 2025
Accepted
22 October 2025
Published
10 November 2025
Volume
12 - 2025
Edited by
Krishnan Anoop Krishnan, National Centre for Earth Science Studies, India
Reviewed by
Muthusamy Anand, Madurai Kamaraj University, India
Faisal Hamzah, National Research and Innovation Agency (BRIN), Indonesia
Updates
Copyright
© 2025 Ranith, Menon, Nobi, Haris, Raj and Pettersson.
This is an open-access article distributed under the terms of the Creative Commons Attribution License (CC BY). The use, distribution or reproduction in other forums is permitted, provided the original author(s) and the copyright owner(s) are credited and that the original publication in this journal is cited, in accordance with accepted academic practice. No use, distribution or reproduction is permitted which does not comply with these terms.
*Correspondence: Nandini N. Menon, nandinimenon@nerci.in
Disclaimer
All claims expressed in this article are solely those of the authors and do not necessarily represent those of their affiliated organizations, or those of the publisher, the editors and the reviewers. Any product that may be evaluated in this article or claim that may be made by its manufacturer is not guaranteed or endorsed by the publisher.