Abstract
Quantifying sea turtle nesting behavior is essential for recovery planning and evaluating management actions. Traditional monitoring approaches, based on nest counts from beach surveys, can misclassify non-nesting emergences, obscure true fecundity, and underestimate clutch frequency, metrics that directly influence population models and regulatory decisions. Here, we demonstrate that high-resolution acceleration data loggers (ADLs) can reliably discriminate nesting from non-nesting emergences across four imperiled species of sea turtles at sites in the Gulf of America, southeast USA, and Caribbean. From 60 recovered ADL deployments on green (Chelonia mydas; N = 10), hawksbill (Eretmochelys imbricata; N = 7), Kemp’s ridley (Lepidochelys kempii; N = 21), and loggerhead sea turtles (Caretta caretta; N = 22) lasting on average 17.5 ± 8.7 days (range 2–43 days), we identified 54 nesting events and 76 non-nesting emergences, with >97% accuracy when compared to direct observations. These data provide the first observer-validated, species-specific behavioral signatures of nesting phases and reveal correlations between egg-laying duration and clutch size. All non-nesting emergences occurred within 72 hours of subsequent nesting, allowing managers to anticipate nest deposition windows. By refining inter-nesting intervals and fecundity estimates, ADLs offer a practical path to reduce error in clutch frequency estimates. The integration of ADL-derived algorithms with satellite-transmitting tags would enable the remote, real-time monitoring of nesting activity, creating a system for the remote monitoring of inter-nesting intervals and nest fecundity that are crucial to quantify the impacts of climate change and other threats to sea turtle nesting habitat.
1 Introduction
Imperiled sea turtles have complex life cycles that include the use of disparate habitats in both marine and terrestrial environments. Their conservation requires diverse strategies that protect vulnerable life stages, which are outlined in species-specific U.S. federal recovery plans (NMFS and USFWS, 2008; NMFS and USFWS, 2011; NMFS and USFWS, 2015). The most-well-studied component of sea turtle populations is nesting females, as they are accessible to researchers on land, where they return on average every 2–5 years to nest. Although many populations have stabilized and certain populations have started to rebound (Balazs and Chaloupka, 2004; Troëng and Rankin, 2005; Chaloupka et al., 2008; Weber et al., 2014), others, such as Northwest Atlantic loggerhead turtles (Caretta caretta), have not shown trends in recovery (Ceriani et al., 2019; Blumenthal et al., 2021), and Kemp’s ridley turtles (Lepidochelys kempii) remain critically endangered (NMFS et al., 2011; NMFS and USFWS, 2015; Wibbels and Bevan, 2019).
Trends in sea turtle nesting numbers are used by managers to assess population status (refer to Esteban et al., 2017; Witherington et al., 2009; Brost et al., 2015). Together, nesting frequency and egg counts allow for the estimation of the overall fecundity per individual, a key vital rate in sea turtle life tables (Crouse et al., 1987; Richards et al., 2011) that affects trajectories of population projections. In Florida, USA, counts of individual females as well as measures of their reproductive output (i.e., number of eggs) are collected on a suite of “index” nesting beaches, and interpreted annually to assess trends across years. However, accurate measures of remigration interval and clutch frequency are lacking for many sea turtle populations (Richards et al., 2011; Lamont et al., 2014; Ceriani et al., 2019), as tagging of individual nesting females requires more resources than the widely used morning counts of nests. Still, these surveys for tracks left by nesting females are time-consuming, costly, and often include demarcation of erroneous “nests” unless the presence of eggs is verified (Casale and Ceriani, 2019). Relying on the presence of tracks to determine the occurrence of nesting events can also be problematic due to the fact that many environmental conditions (e.g., high tides, vegetation, and high winds) can obscure tracks, sometimes completely masking all evidence that a nest was laid.
Tools such as satellite and GPS tags have been increasingly used in recent years by researchers worldwide to document the frequency of nesting in individual turtles (Hart et al., 2010; Tucker, 2010; Esteban et al., 2017), a key metric in sea turtle population estimation (Weber et al., 2013; Esteban et al., 2017). When turtles emerge on the beach, the satellite tag typically sends high-quality Argos locations (e.g., location classes 3, 2, and 1) and/or GPS fixes. However, location data alone cannot reveal how long a turtle is on the beach or behavioral information such as whether the turtle successfully nested or instead exhibited a non-nesting emergence (NNE; also known as an “emerge no lay” or “false crawl”). In a recent analysis of high-resolution GPS data to assess clutch frequency for tagged green turtles (Chelonia mydas), Esteban et al. (2017) assessed GPS locations and haul-out periods to deduce the numbers of actual female turtles laying nests in an Indian Ocean study site. Their findings showed that the true number of nests laid per female was poorly estimated with direct female observations alone, and they suggested that robust estimates could be derived using biologging tools. However, because some inferences derived from the interpretation of satellite tag data may not accurately represent whether a turtle landfall event was a nesting activity or an NNE, behavioral classifications of female landfall events are still needed.
Nesting behavior in sea turtles can involve as many as 50 distinct action patterns (Lindborg et al., 2019), but the main phases of these behaviors consistently include approaching and ascending the beach, digging a nest, egg laying, nest covering, and descending the beach and returning to the ocean (Hailman and Elowson, 1992; Miller and Dinkelacker, 2008). Egg laying and hole filling do not occur during NNE events, and so fine-scale records of body movements are sufficient to differentiate nesting from NNE events. Such records have typically been documented directly by human observers, but animal-borne biologging tools can now provide such records in the absence of direct observation.
In recent years, biologging tags that include acceleration data loggers (ADLs) have been increasingly used to study the fine-scale behavior and energetics of many marine animals (Cooke et al., 2004) and have been repeatedly used to quantify animal body pitch as well as the force and frequency of body movements associated with locomotion during diving for marine turtles (Yasuda and Arai, 2009; Fossette et al., 2010, 2012; Hart et al., 2016; Okuyama et al., 2009, 2012, 2013). Anti-predator behavior (Hounslow et al., 2020), as well as nesting behaviors in sea turtles, has also been studied using ADLs. Acceleration and depth data from green sea turtles allowed for the identification of five components of nesting behavior with 86% accuracy (Nishizawa et al., 2013). More recently, Jeantet et al. (2022) showed that automatic classification of acceleration data could detect six behaviors associated with nesting events in green sea turtles with 95% accuracy, and the number of eggs laid could be calculated with 7% error. Thus, ADLs and other biosensors have the potential to provide unbiased estimates of nesting activity, NNE frequency, and fecundity of turtles in the wild without on-site human monitoring effort.
We applied animal-borne ADLs to four sea turtle species in order to 1) observe and describe the fine-scale nesting behaviors of these species using acceleration-derived metrics, 2) differentiate nesting events and NNEs based on logger data, 3) compare rates of ADL-derived NNEs to field observations, 4) calculate precise inter-nesting intervals for each individual using this tool, and 5) when possible, estimate fecundity. This effort represents a move toward more remote collection of key data using state-of-the-art technologies.
2 Methods
2.1 Sea turtle capture and tagging
We tagged adult female sea turtles nesting along beaches in Texas, Alabama, North Carolina, Florida, and the U.S. Virgin Islands during 2012–2017. Sites included Padre Island National Seashore, Texas; Bon Secour National Wildlife Refuge, Alabama; Bald Head Island, North Carolina; Dry Tortugas National Park, Florida; T.H. Stone Memorial St. Joseph Peninsula State Park, Florida; and Buck Island Reef National Monument, U.S. Virgin Islands (Figure 1). Turtles included four species: loggerheads, green turtles, Kemp’s ridleys, and hawksbills (Eretmochelys imbricata). After an individual completed any nesting or NNE activity and was returning to the water, we captured and restrained each one in a beach corral or transported the turtle (i.e., Kemp’s ridleys) to a laboratory nearby. We then scanned individuals for passive integrated transponder (PIT) tags and looked for flipper tags to determine if they were previously marked and tagged them if we detected no tags according to accepted protocols (NMFS SEFSC, 2008). We took standard morphometric measurements [curved carapace length (CCL), curved carapace width (CCW), straight carapace length (SCL), and straight carapace width (SCW)], and blood and tissue samples for other analyses. In some cases, nests were relocated according to established protocols (refer to Shaver and Caillouet, 2015; Shaver et al., 2016), and egg counts were obtained from the relocation data and used for fecundity analyses.
Figure 1
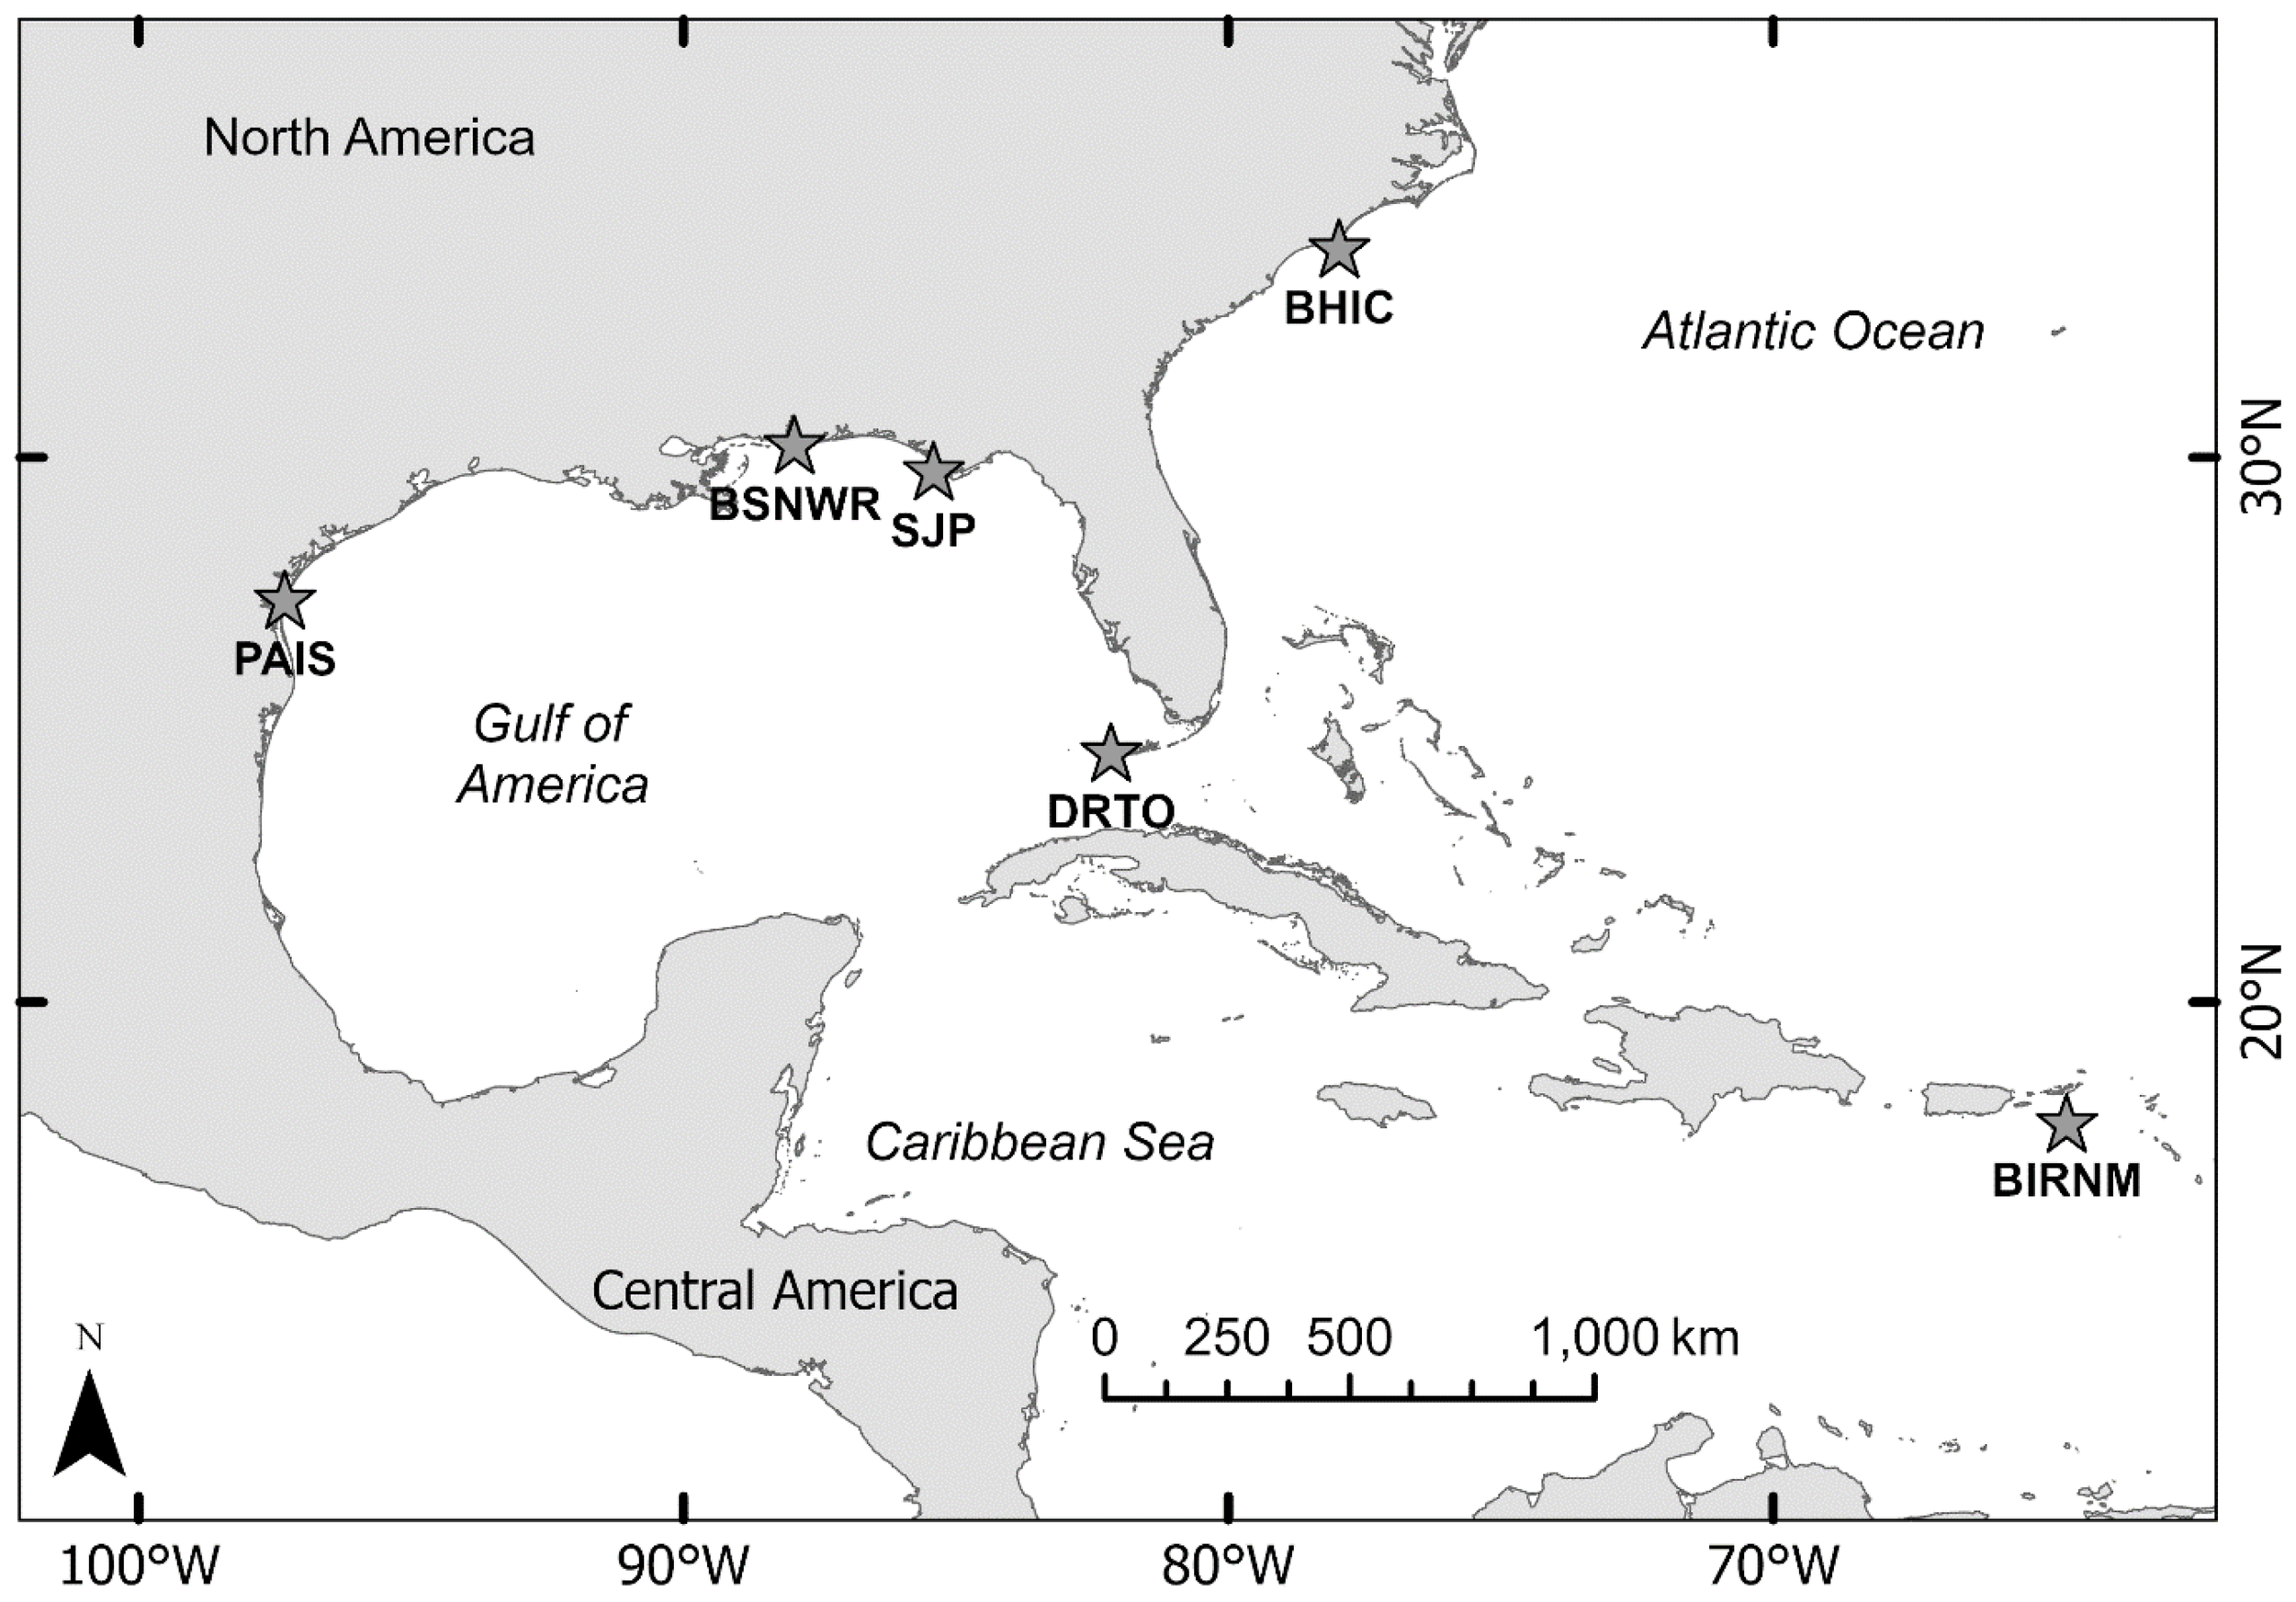
Study site map where accelerometer data loggers were deployed on nesting females. Abbreviations are as follows: PAIS, Padre Island National Seashore, TX; BSNWR, Bon Secour National Wildlife Refuge, AL; SJP, T.H. Stone Memorial St. Joseph Peninsula State Park, FL; DRTO, Dry Tortugas National Park, FL; BHIC, Bald Head Island, NC; BIRNM, Buck Island Reef National Monument, St. Croix, U.S. Virgin Islands.
2.2 Tag programming, attachment, and data processing
We programmed ADLs (Wildlife Computers, Redmond, WA, USA; TDRX or DD-X) to record acceleration at either 16 or 32 Hz and depth (meters) at 1 Hz, while we set temperature (Celsius), wet–dry status (arbitrary tag units), and light levels (arbitrary tag units) to record every 7 seconds. We additionally measured swim speed and 3D magnetic field strength for turtles that received a daily diary tag (DD-X). ADLs recorded acceleration data in m/s2, with all acceleration-derived metrics being recorded using these same units. We affixed ADLs to the anterior carapace, usually on the third or fourth vertebral scute (Figure 2), posterior to the satellite tag, following standard protocols for attachment (NMFS SEFSC, 2008; Hart et al., 2021). We outfitted turtles with either SPOT and SPLASH model satellite tags from Wildlife Computers or Kiwisat KS-101 model tags from Lotek (Havelock North, New Zealand). We attached ADLs and satellite tags using Superbond™ cool-setting epoxy (refer to Hart et al., 2021); we released turtles after the epoxy dried (approximately 1 hour later) and allowed them to return to the ocean. Observers recorded detailed, time-stamped notes (all watches, computers, and ADLs synced to time.gov prior to deployment) of turtle behavior after ADLs were affixed and subsequently whenever an ADL-tagged animal was sighted. We retrieved ADLs from turtles by recapturing individuals on subsequent nesting events. Returning turtles carrying tags were typically allowed to nest before we recaptured them for identification and tag removal.
Figure 2
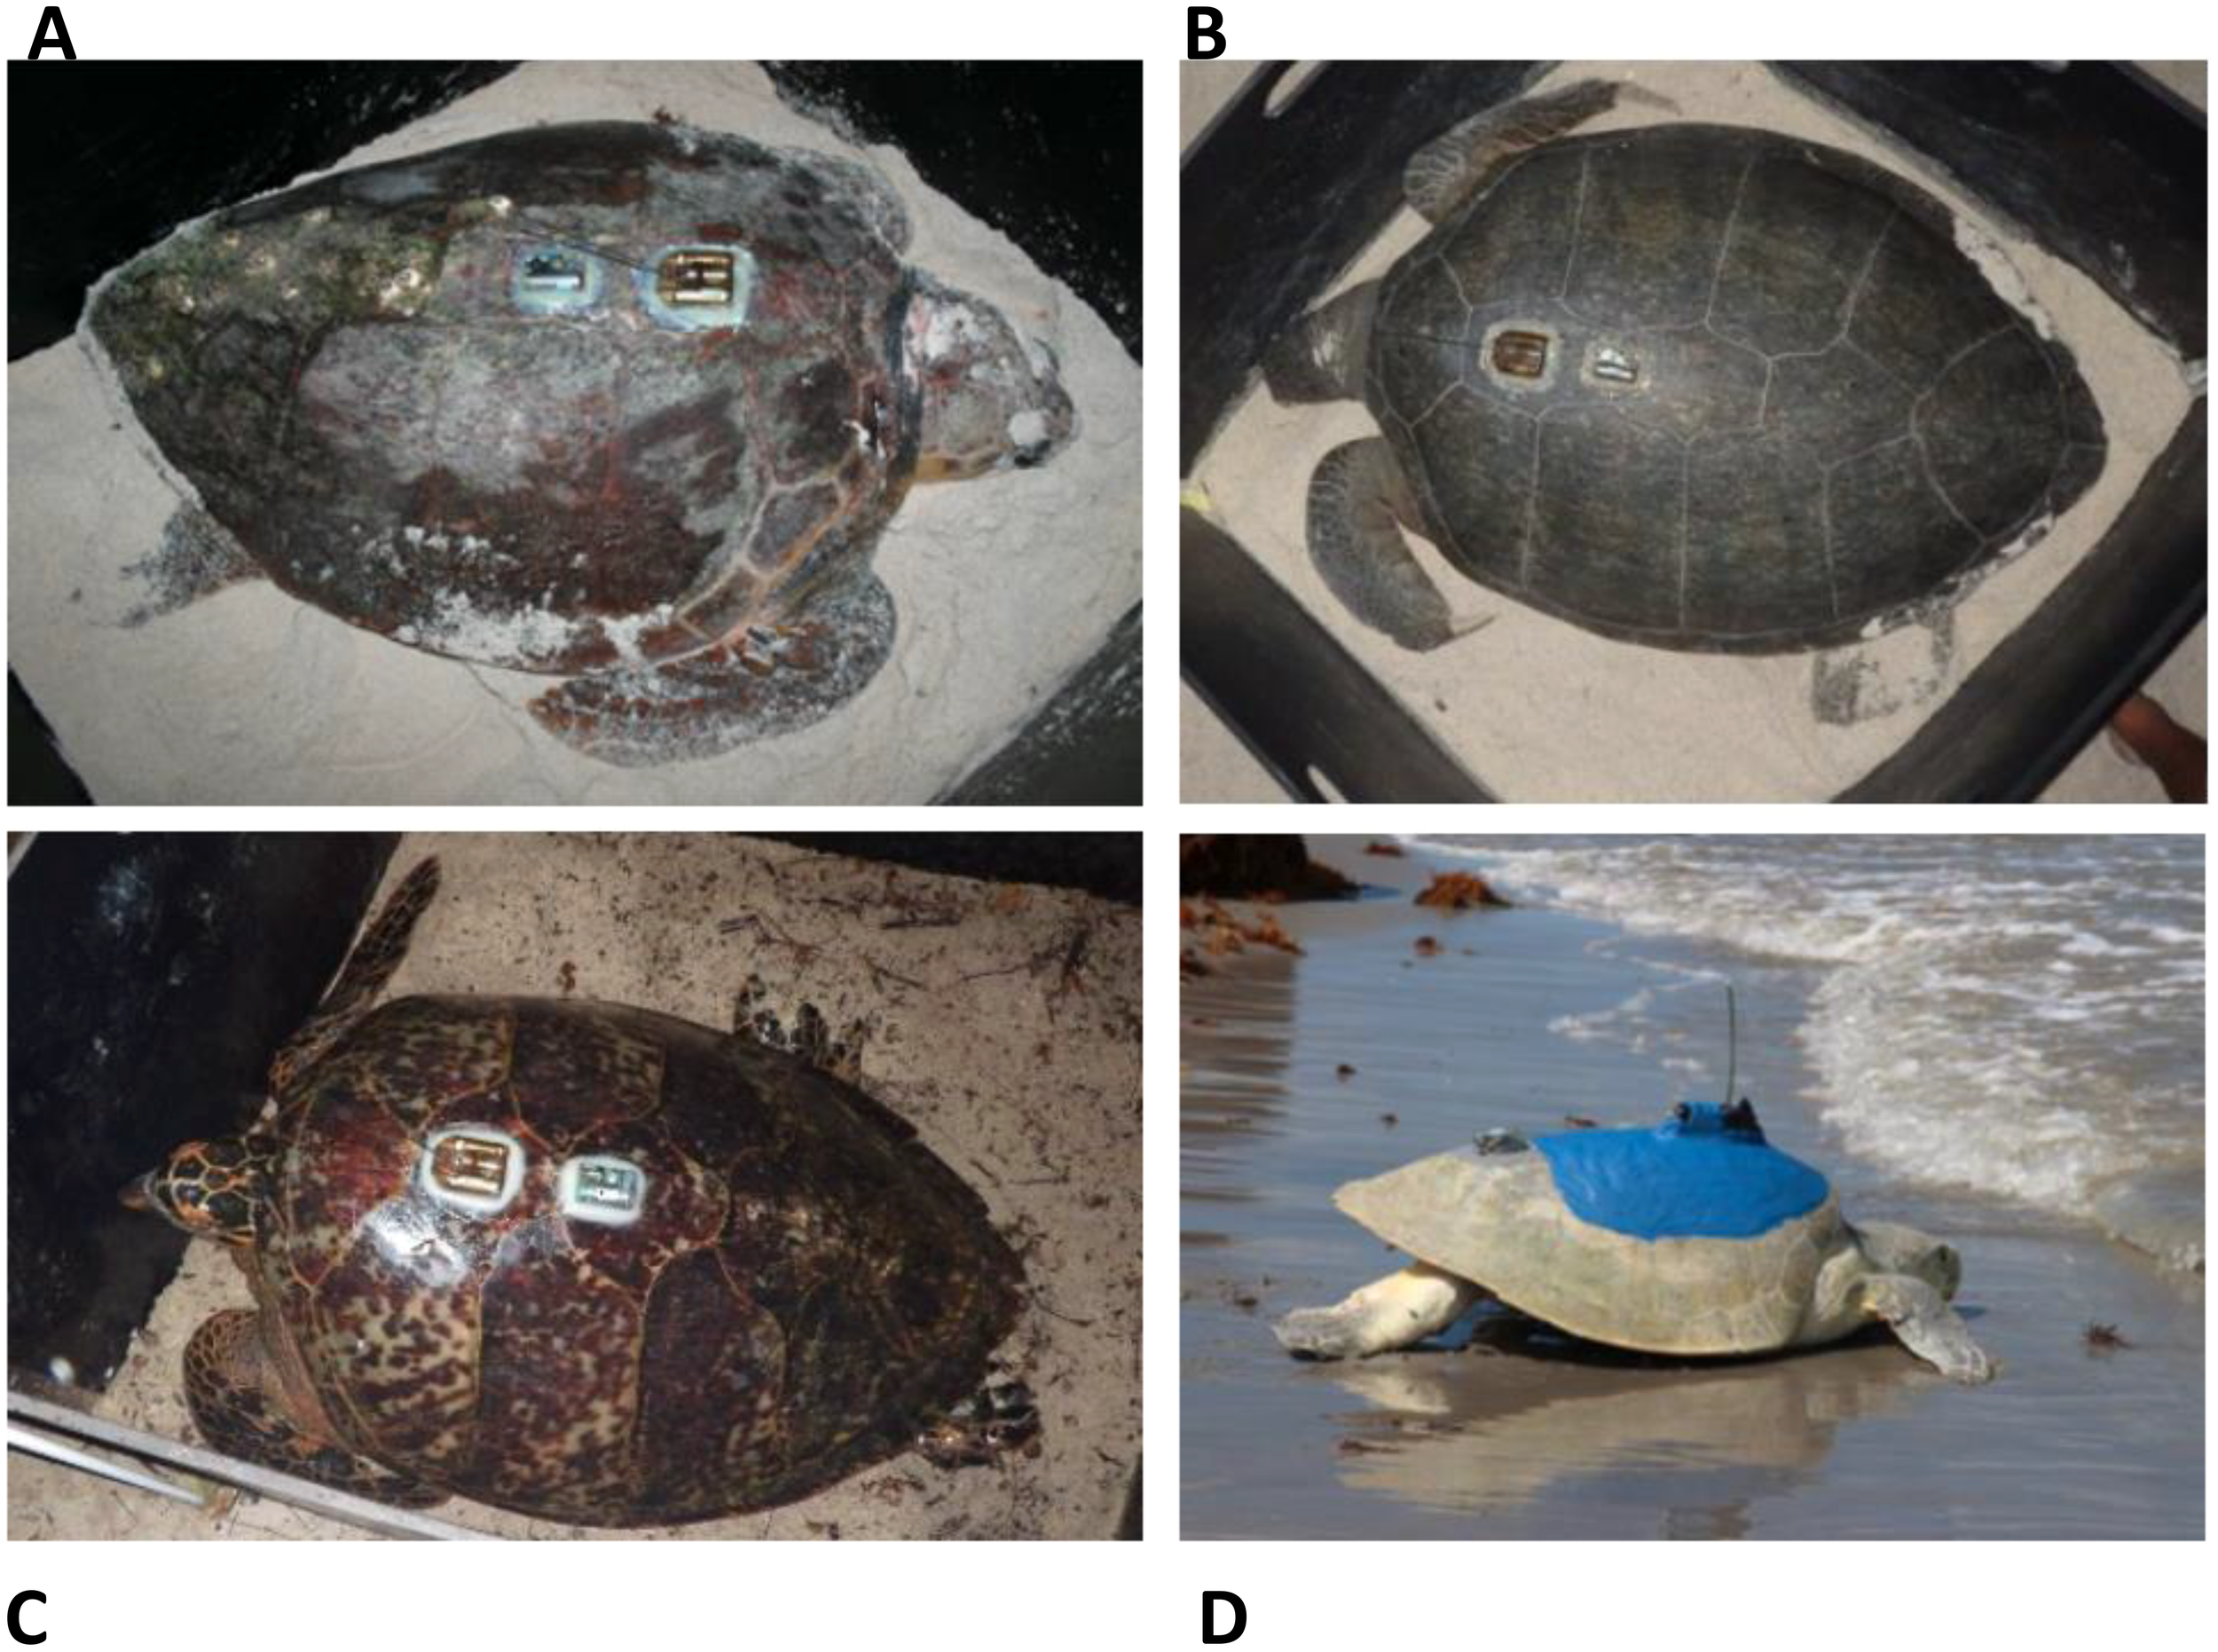
Satellite tag (anterior, with antenna) and accelerometer (ADL), which is posterior to satellite tag, shown epoxied to the carapace of a loggerhead (A), green (B), hawksbill (C), and Kemp’s ridley (D) sea turtles for this study. Photo credits: U.S. Geological Survey (A–C), and National Park Service (D). ADL, acceleration data logger.
We downloaded ADL data and processed them in Igor Pro (Wavemetrics) and R (R Development Core Team 2019). We calculated static acceleration (indicative of body position) using a 4-second running mean of the raw acceleration, while we calculated dynamic acceleration (indicative of body movement) by subtracting the static acceleration from the raw acceleration (e.g., Shepard et al., 2008a, b). Flipper beats were assessed as the dynamic acceleration of the X axis, which corresponds to a pitching and surging motion. We summed the absolute value of the dynamic acceleration along all three axes to derive overall dynamic body acceleration (ODBA; Wilson et al., 2006). We then aggregated ODBA over 1 second to match the temporal frequency of depth data. Additionally, we interpolated temperature and wet–dry status to be at the same frequency as the depth data. For daily diary ADLs, we corrected magnetometer data for the hard iron offset, and we calculated the two-dimensional heading of the animal after correcting for body pitch and roll, determined using an accelerometer.
2.3 Validating ADL data signatures through direct observation
We used observer notes of general turtle behaviors to describe and ground-truth the behaviors logged in the ADL data. To distinguish patterns in behavior that would differentiate nesting events vs. NNE events, we visually examined each turtle dataset, noted the start and end times of observed events, and compared these data-based classifications to notes from direct observations on the beach. Tag data from observer-confirmed events were then used to generate threshold criteria to automatically identify nesting and NNE events from the remaining tag data. Manual event classification from ADL data included validating nesting and NNE signatures with direct observation, after which we examined each individual’s entire ADL dataset for signs of these events. Visual scanning of the ADL data showed distinct patterns when animals were on land compared to in the water. We characterized time on land by a shallow depth near 0 m, the wet–dry sensor reading dry, and often a change in temperature as the animal emerged from the water. Although similar sensor values could occur when an animal was in the water floating at the surface, floating animals showed constant motion due to water movement, whereas turtles on land always displayed at least a short period where acceleration data indicated a cessation of movement.
Nesting behavior was comprised of similar phases across all four species (refer to Figure 3), and each phase produced characteristic data signatures across multiple channels (Table 1). Although the behavioral phases of nesting have been characterized in previous studies (e.g., Bustard and Greenham 1969; Hailman and Elowson, 1992; Lindborg et al., 2019; Jeantet et al., 2022), we sought to describe phases that were consistent across species, were inclusive of a turtle’s entire time on land, and could be reliably identified based on ADL data alone. The typical turtle displayed relatively constant flipper beats as it actively swam toward the nesting beach. Once on land, the turtle displayed high-amplitude acceleration spikes indicative of crawling with intermittent periods of rest (Figure 3b). During this initial crawling, an increase in body pitch was typically observed as the animal crawled up the beach and over the berm. After crawling, the turtle began to dig, characterized by repetitive oscillations in body pitch and alternating side-to-side rolling as the animal excavated the nest chamber with one rear flipper before pitching forward and rolling to the other side to excavate with the other rear flipper (Figure 3c). During this process, the turtle’s mean body pitch would gradually increase (i.e., increasingly head up) as the hole deepened. In addition to rolling, magnetometer data showed that turtles would shift their heading right to left depending on which rear flipper they were using to excavate. Eventually, the turtle would stop excavating the hole and remain still, indicating that it had started to lay eggs (Figure 3d). After a lengthy, stationary, egg-laying period, the turtle began filling the hole (Figure 3e), producing a locomotory pattern that typically had more constrained oscillations in pitch and roll movements compared to the excavation phase. As the turtle filled the hole with its back flippers, the mean body pitch would gradually return to approximately horizontal. After the hole was filled, the turtle would display intermittent locomotion (Figure 3f), during which time observers noted the turtle using its front flippers to swipe and cover the nest with sand. The turtle would then turn back to the ocean and intermittently crawl back into the sea, where it would resume normal swimming behavior (Figure 3g; Table 1).
Figure 3
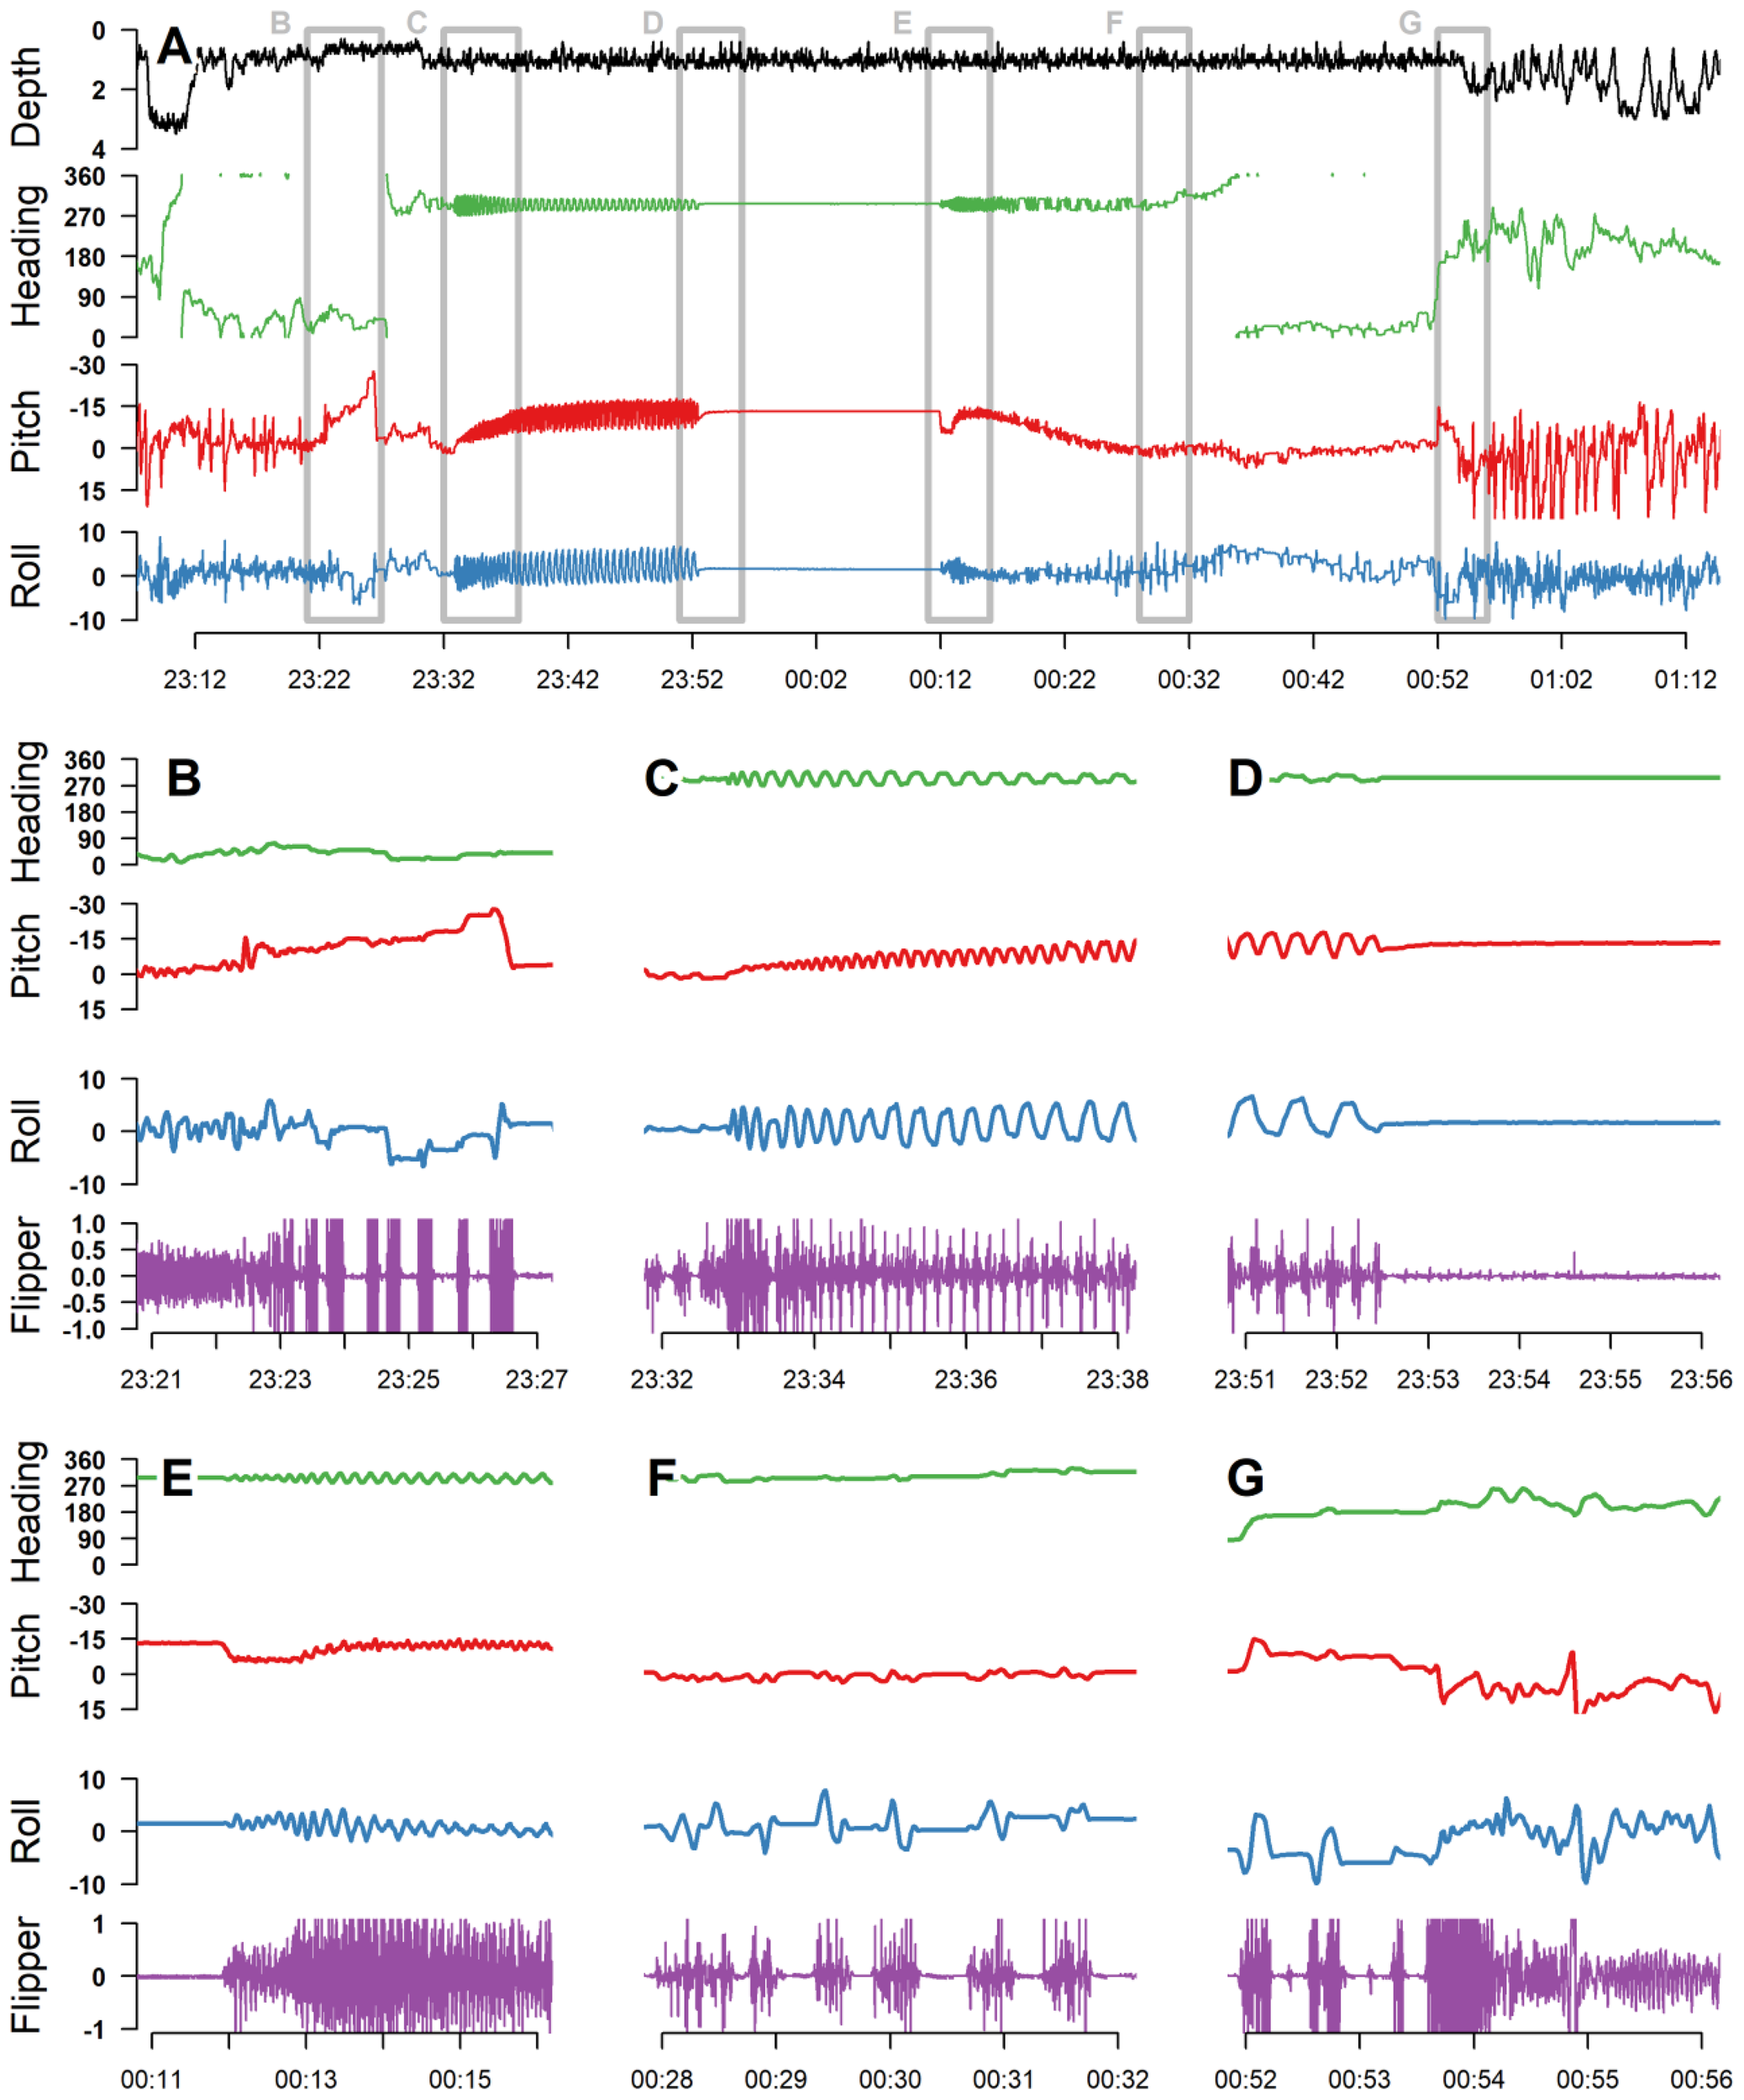
A complete nesting event from loggerhead sea turtle Sally (A), which was outfitted with a daily diary tag. Panels B–G are zoomed-in sections of panel A, corresponding to the location of the gray boxes, labelled in panel (A) The event began with the turtle swimming in a northerly direction toward the beach, displaying consistent flipper beats until 03:23 when it landed on the beach (B). Once on land, the turtle displayed high-amplitude acceleration indicative of crawling, followed by periods of rest; the steadily increasing and then quickly decreasing body pitch indicates the animal crawling up the beach and over a berm (B). At 03:33, the turtle began to dig, indicated by pitching up and rolling to its side to excavate the nest chamber and then pitching forward and rolling to its other side to excavate with its other rear flipper (C). During this process, the turtle’s body pitch gradually increased, indicating that the hole was getting deeper and its body was oriented increasingly in a head-up posture. At 03:52, the turtle stopped excavating the nest chamber and remained still, indicating that it started to lay eggs (D). At 04:14, the turtle began to move again, signifying the end of egg deposition, and then began to fill in the nest with sand using high-intensity flipper beats and less rolling and pitching than observed during excavation (E). As the turtle filled in the nest, its body pitch returned to level, and the turtle began to show more intermittent movement, using its flippers to swipe and cover the nest with sand (F). Finally, the turtle showed intermittent movement as it crawled back to the water and began swimming away at 04:54 (G).
Table 1
| Behavior | Duration | Depth (pressure) | Body position (accel) | Flipper beats* (accel) | Heading (magnetometer) | Temperature |
|---|---|---|---|---|---|---|
| Swimming approach to beach | minutes | Depth at bottom of dives steadily decreases as turtle approaches shore | Pitch positive during ascents; negative during descents | Constant flipper beats indicative of swimming | Constant, oriented toward shore | Constant |
| Crawling (landing on beach, crawling through sand over berm) | 5–50 min | Depth = 0 m | Pitch positive as turtle crawls up the beach | Intermittent, high-amplitude FB indicative of crawling; followed by periods of rest | Constant | Initial temp. drop (from air temperatures and evaporation) as turtle moves from water to air |
| Digging (digging and scooping with rear flippers, alternating between right and left) | 10–50 min | Depth = 0 m | Pitch and roll oscillate as turtle alternates rear flippers in digging motion; pitch gradually increases as posterior of body descends into hole | High-amplitude FB with relatively constant periodicity indicative of digging | Heading shifts back and forth depending on which rear flipper (right or left) is scooping sand | Constant for most; slow increase for Kemp’s (daytime nesters) |
| Egg laying (not present in NNE events) | ~6–37 min | Depth = 0 m | Constant | None | Constant | Constant |
| Filling hole (not present in NNE events) | NA; combined with crawling down beach | Depth = 0 m | Pitch gradually decreases back to horizontal as posterior of body rises | High-amplitude FB with relatively constant periodicity indicative of digging | Heading changes with each FB as head goes from side to side while digging | Constant |
| Crawling down beach and returning to water | <5 min | Depth = 0 m until water is reached; then again shows variable values associated with diving | Pitch negative as turtle crawls down the beach | Intermittent, high-amplitude FB indicative of crawling | Constant, oriented offshore | Abrupt temp. change in some cases, depending on environment |
Typical data signatures associated with nesting behaviors in four species of sea turtle.
*Dynamic acceleration or quick movements in the dorso-ventral acceleration axis that are caused by flipper movement but, on land, are very different than typical “flipper beats” during swimming. Accel, accelerometer-derived; NNE, non-nesting emergence; FB, flipper beat.
NNE events showed the same emergence behaviors and data signatures as nesting events, but typically involved turtles returning to the sea with no signs of digging or other nesting behaviors such as covering the nest (Table 1; Figure 4). Some NNE events showed movements indicative of excavation, but the behavior would eventually be abandoned with no sign of a stationary egg-laying period. Some nesting and NNE events were utilized as an opportunity for ADL removal and recovery, and thus, data signatures for complete events, including the “return to ocean” phase, were often not obtained when observers were present. However, six complete nesting events and one NNE were observed while animals carried tags (Table 2), and behaviors observed after tags were removed (crawling in the sand) were frequently validated through observations earlier in the NNE or nesting events, as well as from the original tagging events.
Figure 4
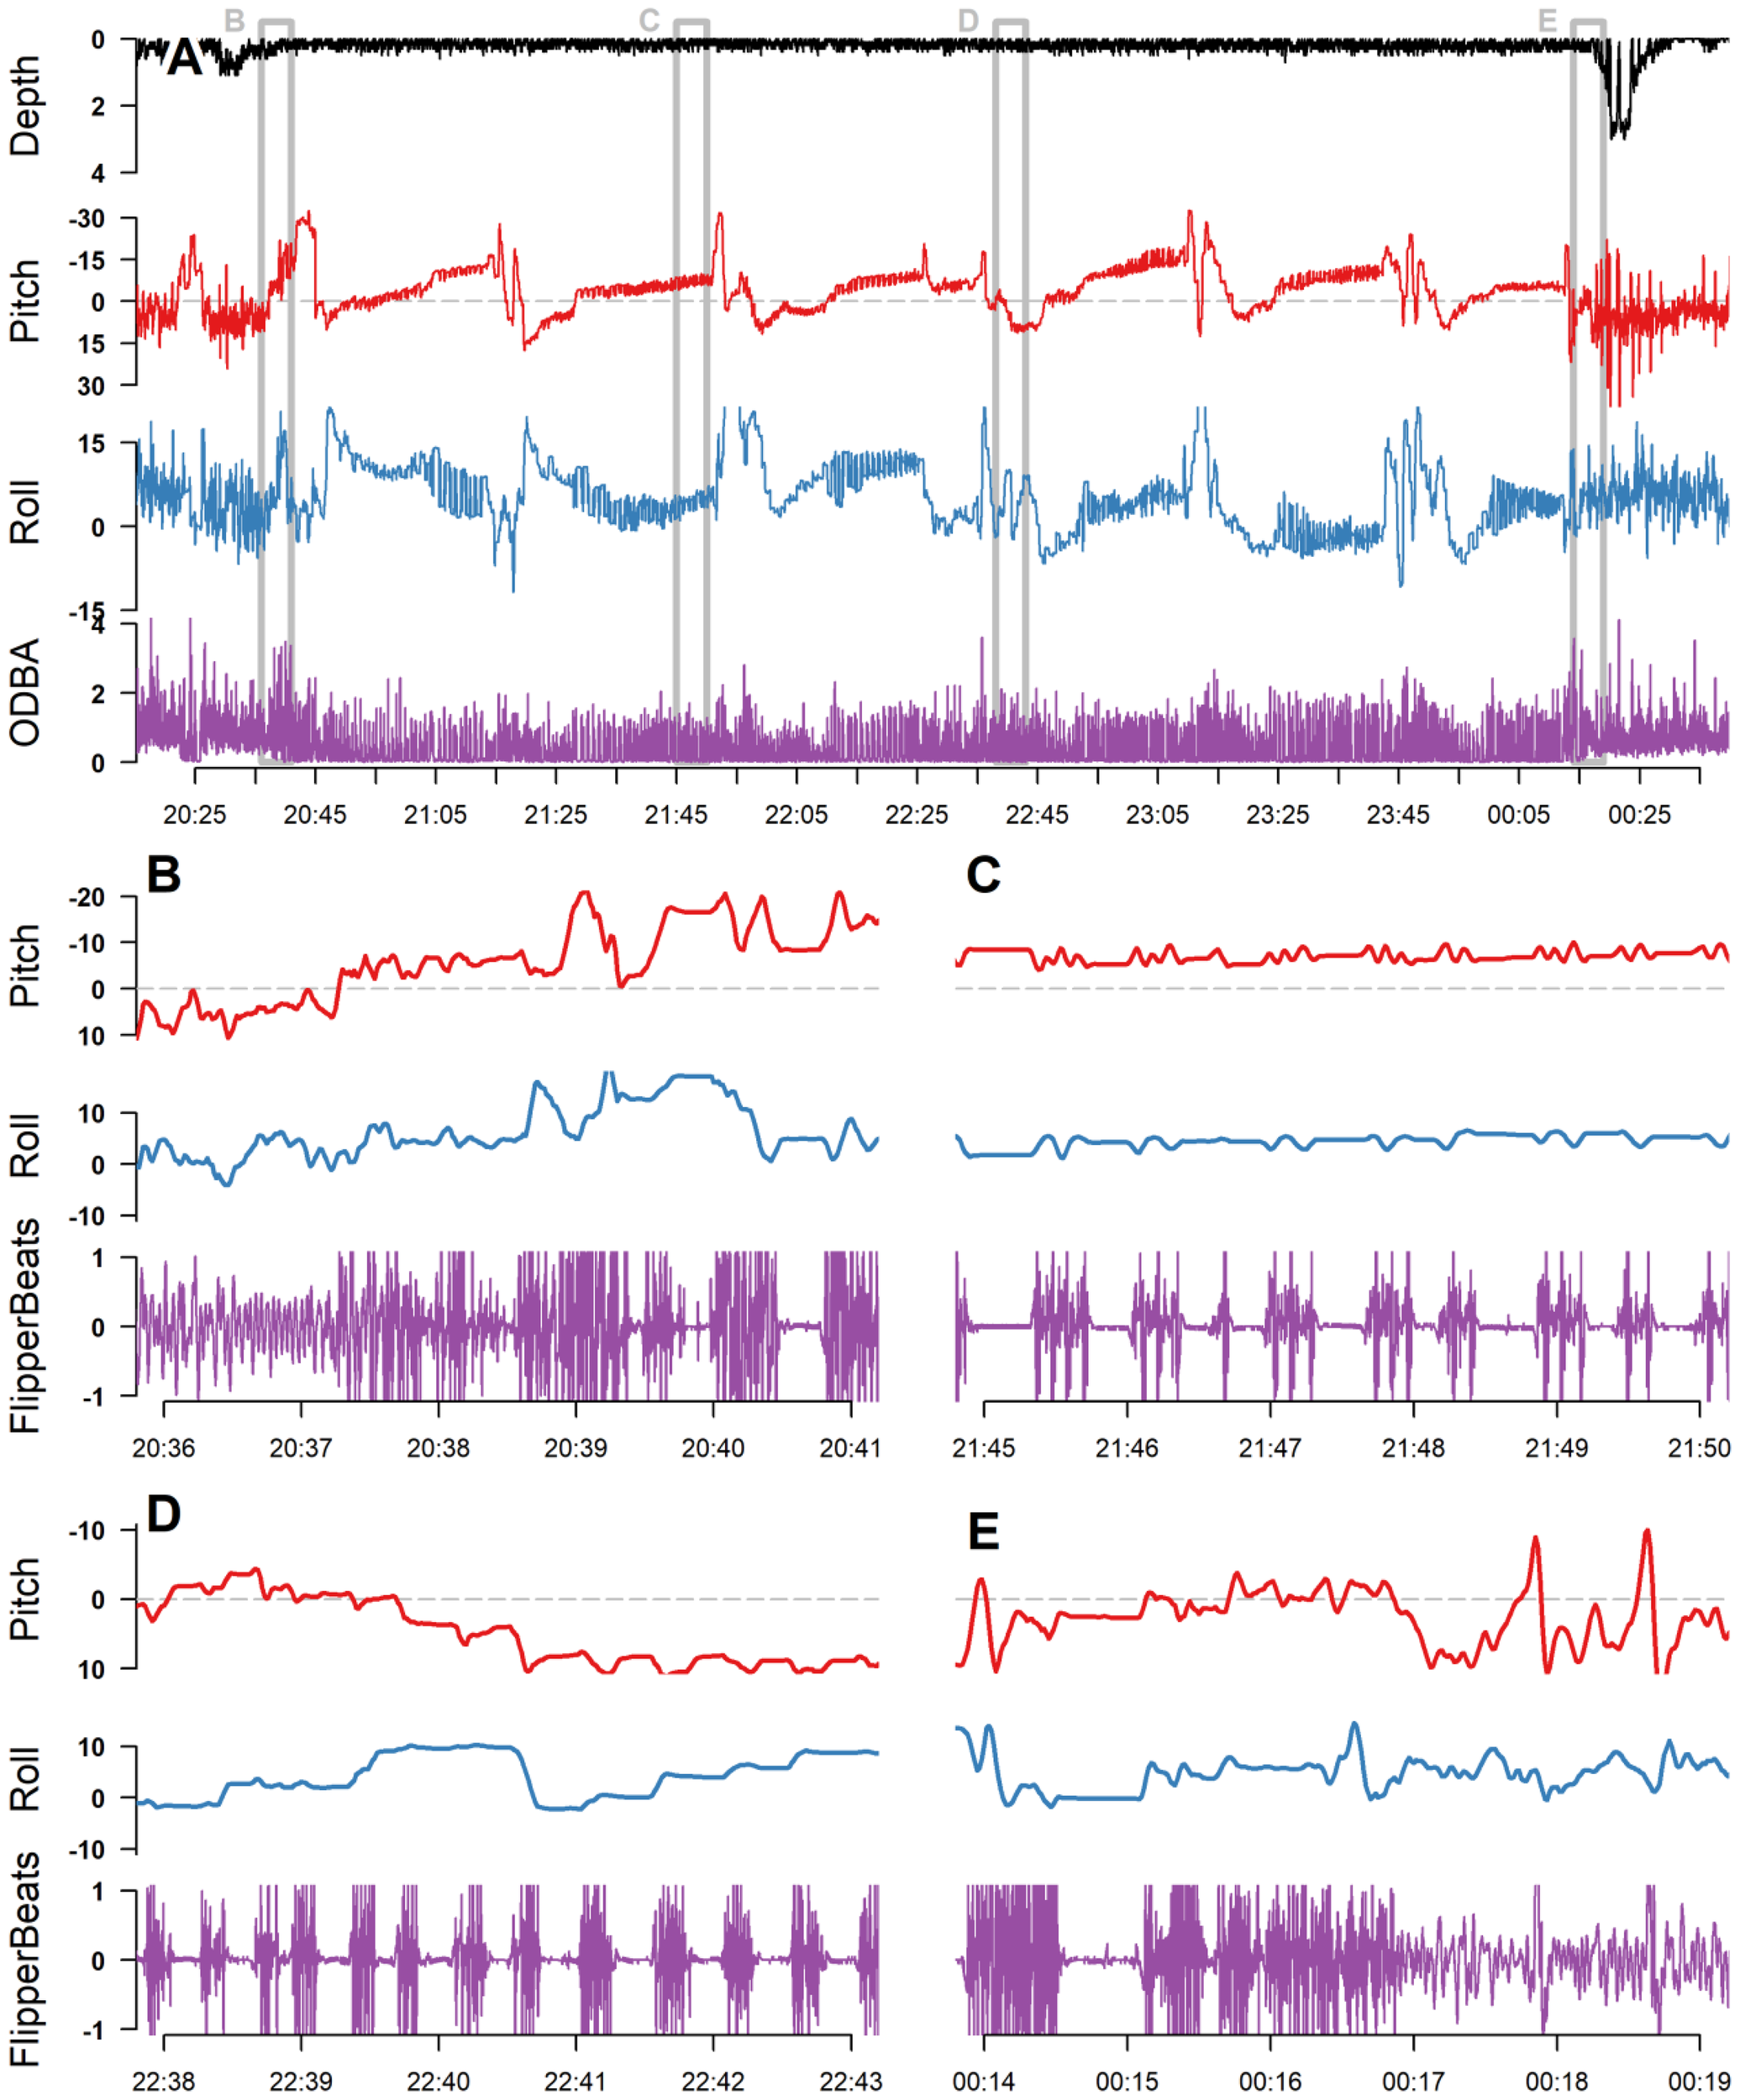
A non-nesting emergence (NNE) from Ali, a female green turtle in U.S. Virgin Islands (A). Panels (B–E) are zoomed-in sections of panel A, corresponding to the location of the gray boxes, labelled in panel (A) The event began with the turtle reaching the beach at 00:37, with high-amplitude flipper beats and increasing body pitch angle indicating that it was crawling up the beach (B). It showed several bouts of digging, indicated by high periods of intense flipper beats punctuated with resting periods (e.g., (C, D)), with large but gradual changes in body pitch indicative of the animal’s rear flippers lowering into an excavated hole (A). No long periods of rest that would indicate egg laying were observed during any of the excavation bouts, and the event ended with the animal returning to the water at 04:17, nearly 4 hours after it emerged. ODBA, overall dynamic body acceleration; depth is in m.
Table 2
| Species | Total | Complete | Duration (min) | Min | Max |
|---|---|---|---|---|---|
| Nesting overall | |||||
| Green turtle | 7 (4) | 4 (1) | 171.5 ± 35.2 | 139.2 | 219.6 |
| Hawksbill | 5 (3) | 2 (0) | 138 | 129.8 | 146.1 |
| Kemp’s ridley | 17 (16) | 1 (0) | 43.4 | 43.4 | 43.4 |
| Loggerhead | 25 (13) | 17 (5) | 100.5 ± 38.5 | 56.2 | 234.5 |
| Crawling up beach1 | |||||
| Green turtle | 7 (4) | 7 (4) | 44.9 ± 24.2 | 27.3 | 97 |
| Hawksbill | 5 (3) | 5 (0) | 31.2 ± 16.4 | 14.5 | 51.8 |
| Kemp’s ridley | 17 (8) | 17 (8) | 10.8 ± 3.3 | 5.5 | 15.8 |
| Loggerhead | 25 (8) | 25 (8) | 17.6 ± 10 | 8.2 | 46.9 |
| Digging hole2 | |||||
| Green turtle | 7 (4) | 7 (4) | 29 ± 13 | 13.8 | 50.1 |
| Hawksbill | 5 (3) | 5 (0) | 26.1 ± 8 | 16.8 | 35.8 |
| Kemp’s ridley | 17 (8) | 17 (8) | 17.4 ± 3.9 | 10.8 | 26.5 |
| Loggerhead | 25 (8) | 25 (8) | 15.9 ± 3.9 | 8.1 | 25.3 |
| Laying eggs | |||||
| Green turtle | 7 (4) | 7 (4) | 18.9 ± 6.8 | 6.7 | 25.4 |
| Hawksbill | 5 (3) | 2 (0) | 24.5 | 22 | 27 |
| Kemp’s ridley | 17 (8) | 17 (8) | 11.9 ± 2.4 | 7.6 | 18.6 |
| Loggerhead | 25 (8) | 25 (8) | 16.5 ± 5.9 | 8.9 | 36.7 |
| Filling and crawling down beach3 | |||||
| Green turtle | 4 (1) | 4 (1) | 56.8 ± 17.6 | 40.6 | 78.8 |
| Hawksbill | 2 (0) | 2 (0) | 33.2 | 31.5 | 34.9 |
| Kemp’s ridley | 1 (0) | 1 (0) | 6.6 | ||
| Loggerhead | 17 (5) | 17 (5) | 46.8 ± 27.2 | 18.3 | 141.5 |
| NNE overall | |||||
| Green turtle | 13 (3) | 10 (0) | 28.1 ± 67.6 | 2 | 220.4 |
| Hawksbill | 20 (2) | 18 (0) | 5.3 ± 3.9 | 2.3 | 17.4 |
| Kemp’s ridley | 5 (0) | 5 (0) | 11 ± 7.7 | 2.2 | 23.1 |
| Loggerhead | 38 (4) | 35 (1) | 10.4 ± 8.4 | 2.3 | 37.3 |
The number of nesting, egg-laying, and non-nesting emergence (NNE) events for each species based on visual examination of data logged in accelerometers (ADLs).
Complete denotes that the animal carried out the full behavior, including return to the ocean, while carrying an ADL. Numbers in parentheses represent the number of events that were validated by a human observer. Mean, min, and max duration were only calculated for complete events.
ADL, acceleration data logger.
1 Period of crawling until first instance of digging.
2 Only refers to the final bout of digging if there were multiple bouts detected.
3 Distinguishing hole-filling movements from crawling down beach was difficult, so these two behaviors were combined.
2.4 Automatic classification and comparison with satellite telemetry
We created a custom algorithm to automatically classify nesting events and NNEs a posteriori from ADL sensor data using criteria from our direct observations. Specifically, we classified time on land as any period with a wet–dry sensor reading >80 (proprietary tag manufacturer units) that lasted at least 120 seconds in duration. To further distinguish this from long surface intervals at sea, we also required the dry period to include at least 8 consecutive seconds with an ODBA < 0.2 m/s2, and it must have exhibited a mean depth <4 m over the previous 10 minutes. Nesting events were separated from NNE events as containing a stationary period (ODBA was never above 0.2 m/s2 for more than 3 consecutive seconds) that lasted for at least 300 consecutive seconds. This stationary period was indicative of egg laying.
In order to compare our ADL-based technique of identifying nesting and NNE events with a more traditional technique based on satellite tag data, we analyzed spatial data from satellite tags and recorded high-quality, land-based locations (as in Tucker, 2010; Hart et al., 2010; see Hart et al., 2025). These locations and times were deemed landfall events for the purposes of further analyses and characterized as either nesting events or NNEs using methods described by Hart et al. (2010). We excluded Kemp’s ridleys from spatial analyses.
R was used to conduct all statistical analyses. The duration of emergences (nesting and NNE), specific behaviors (crawling, digging, and egg laying), and inter-nesting intervals were compared among species using a series of analysis of variance (ANOVA) tests. Each turtle’s number of false crawls was standardized by their deployment duration. This false crawl rate was compared among species using ANOVA. For all among-species comparisons, if ANOVAs found significant variation, Tukey’s honestly significant difference (HSD) test was used for pairwise comparisons to determine which species differed from each other. The correlation between egg-laying duration and clutch size for Kemp’s ridleys in Texas and loggerheads in Alabama, where nest relocation efforts are permitted (see above), was assessed.
3 Results
A total of 96 adult female sea turtles (loggerhead, 41; Kemp’s ridley, 32; green turtle, 14; hawksbill, 9) were tagged, and ADLs were recovered from 60 individuals (loggerhead, 22; Kemp’s ridley, 21; green turtle, 10; and hawksbill, 7; Table 3) for a 62.5% recovery rate. ADLs remained on turtles 10–722 days, with 90% of tags removed within 40 days. ADL batteries expired before tag recovery for 21 individuals, producing a mean recording duration of 17.5 ± 8.7 days (range 2–43 days). Two individuals were recaptured on nesting beaches 2 years after being tagged, and ADLs were recovered at that time. ADLs deployed on green turtles had the shortest mean recording duration (10.6 days), whereas tags deployed on hawksbills, Kemp’s ridleys, and loggerheads had longer mean recording durations between 17.6 and 20 days (Table 3), reflecting variability in species-specific inter-nesting intervals.
Table 3
| Species | # Tagged | # Recovered | ADL record (days) |
|---|---|---|---|
| Green turtle | 14 | 10 | 10.5 ± 3.9 |
| Hawksbill | 9 | 7 | 19.9 ± 8.1 |
| Kemp’s ridley | 32 | 21 | 19.6 ± 5.8 |
| Loggerhead | 41 | 22 | 17.5 ± 11.3 |
| Total | 96 | 60 |
The number of individuals tagged, the number of recovered accelerometers (ADL), and the average recording duration for each species.
ADL, acceleration data logger.
Several nesting and NNE events detected by ADLs were confirmed by direct observation or from satellite tag data that confirmed time on land (Hart et al., 2025). We directly observed a total of 45 emergence events (N = 36 nesting; N = 9 NNE) of ADL-equipped turtles, and at least two instances of each behavior (nesting or NNE) were observed for each species except for Kemp’s ridleys, for which no NNE events were witnessed (Table 2; Hart et al., 2025). Satellite telemetry for loggerheads, green turtles, and hawksbills was used to confirm an additional 18 landfall events (N = 15 nesting; N = 4 NNE; Hart et al., 2025) that were detected by ADLs but not witnessed by observers.
3.1 Frequency of nesting and NNE behaviors across species
A total of 54 nesting events and 76 NNE events were identified from the ADL data of 60 individual turtles (Table 2), with up to four nesting events recorded in a single individual (Figure 5; Hart et al., 2025). Our manual identification of events (nesting or NNE) from the ADL data was confirmed for all 45 emergence events (N = 36 nesting; N = 9 NNE) that were also directly observed, with no mis-characterized events.
Figure 5
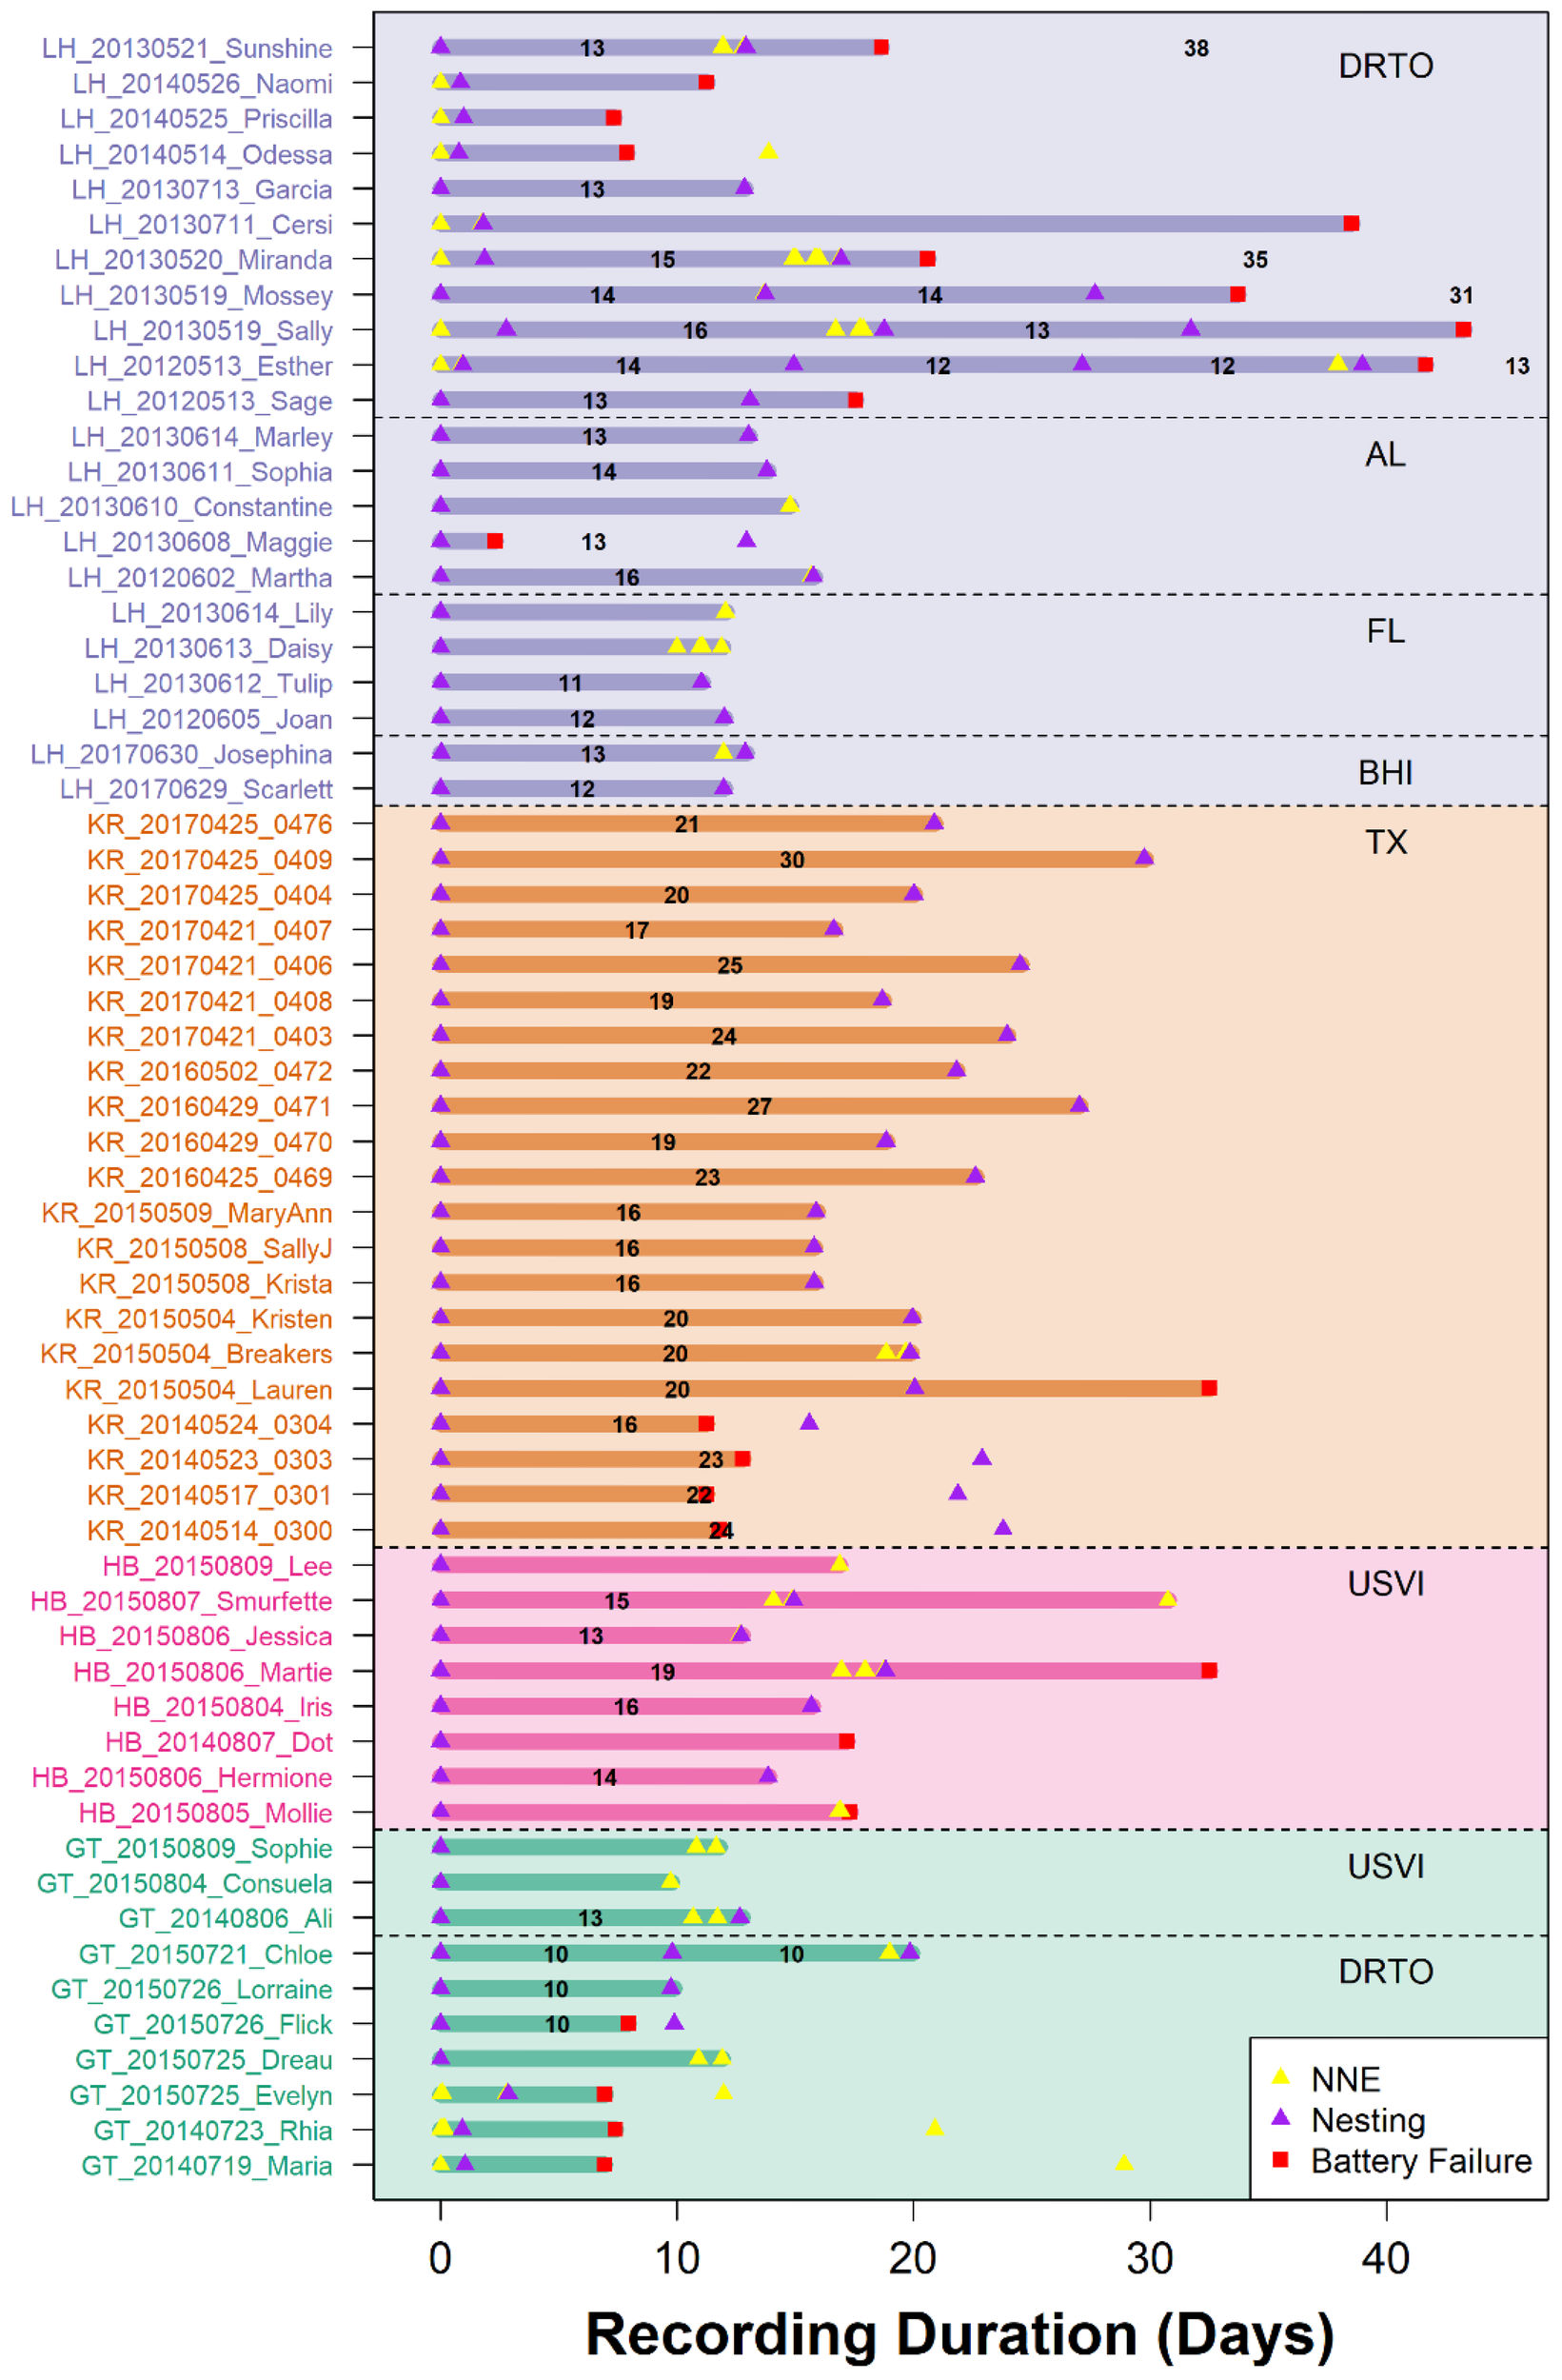
Abacus plot showing the recording duration and observed nesting and non-nesting emergence (NNE) events for all turtles, color-coded by species (purple = loggerhead, orange = Kemp’s ridley, pink = hawksbill, and green = green turtle). Black number within each recording duration is the inter-nesting interval for each turtle, derived from each ADL. See Hart et al. (2025), USGS Data release. Tagging location abbreviations are as follows: DRTO = Dry Tortugas National Park, Florida; AL = Bon Secour National Wildlife Refuge, Alabama; FL = St. Joseph State Park, Florida; BHI = Bald Head Island, North Carolina; TX = Padre Island National Seashore, Texas; USVI = Buck Island Reef National Monument, St. Croix, U.S. Virgin Islands. ADL, acceleration data logger.
A total of 24 “complete” nesting events, in which turtles returned to the ocean after nesting while still carrying their tags, were recorded by ADL data, and six of these events were documented by observers. Complete nesting events were predominantly from loggerheads (N = 17), followed by green turtles (N = 4), hawksbills (N = 2), and Kemp’s ridley (N = 1; Table 2). Of the 76 NNE events, 68 were “complete” (where tagged turtles returned to the ocean), but only one of these complete events was witnessed by observers (Table 2).
ADL-derived nesting data allowed for the calculation of 44 inter-nesting intervals, with significant differences in inter-nesting period among species (ANOVA F3,40 = 27, p < 0.001). Green turtles had the shortest inter-nesting period (N = 4, 10.75 ± 1.5 days), followed by loggerheads (N = 18, 13.3 ± 1.32 days), hawksbills (N = 5, 15.2 ± 2.3 days), and Kemp’s ridleys (N = 17, 20.7 ± 3.9 days; Table 4). In addition to the longest inter-nesting period, Kemp’s ridleys displayed the largest variation in inter-nesting period among individuals, from 16 days to a maximum of 30 days (Table 4). For loggerheads, variation was observed within individuals as well, with one turtle displaying inter-nesting periods of both 16 and 13 days, and another individual showing intervals of 14, 12, and 12 days between nesting events (Figure 5).
Table 4
| Species | Mean ± SD | Min | Max |
|---|---|---|---|
| Green turtle | 10.5 ± 1.4 | 9.7 | 12.7 |
| Hawksbill | 15.2 ± 2.3 | 12.7 | 18.8 |
| Kemp’s ridley | 20.7 ± 3.9 | 15.8 | 29.8 |
| Loggerhead | 13.2 ± 1.3 | 11 | 15.9 |
Inter-nesting intervals (days) calculated from accelerometer (ADL) data.
ADL, acceleration data logger.
3.2 Nesting event duration and correlation to fecundity
Loggerheads and hawksbills had mean nesting durations greater than 100 minutes, whereas green turtles had longer average nesting durations of 171 ± 35 min (Table 2). While we were only able to identify one complete nesting event for a Kemp’s ridley, this was the shortest nesting event observed out of all the species, at just 43 minutes. Species-specific differences in nesting durations were significant (ANOVA: F3,20 = 5.41, p = 0.006), with Kemp’s ridleys (post-hoc Tukey’s, p = 0.027) and loggerheads (Tukey’s HSD, p = 0.012) having shorter nesting durations than green turtles. Loggerheads additionally had the largest variation in their nesting duration, with their shortest nesting event lasting 56 minutes and the longest lasting 234 minutes, the longest of any turtle in this study.
Species differences were also apparent across different phases of the nesting process (Figure 6), with significant differences among species in the duration of crawling (F3,50 = 15.2, p < 0.001), digging (F3,50 = 11, p < 0.001), and egg laying (F3,47 = 6.4, p < 0.001). Kemp’s ridley and loggerhead turtles had the shortest duration of crawling up the beach before initiating digging, and both had significantly shorter durations than green sea turtles (Tukey’s HSD, loggerhead–green sea turtle: p < 0.001; Kemp’s–green sea turtle: p < 0.001). Similarly, both Kemp’s ridley and loggerhead turtles had the shortest digging durations and were significantly faster than green turtles (Tukey’s HSD, loggerhead–green sea turtle: p < 0.001; Kemp’s–green sea turtle: p < 0.001) and hawksbill turtles (Tukey’s HSD, loggerhead–hawksbill sea turtle: p < 0.01; Kemp’s–hawksbill sea turtle: p = 0.03). Kemp’s ridleys had shorter egg-laying durations than other species (Tukey’s HSD, loggerhead: p = 0.02; green turtle: p = 0.01; hawksbills: p = 0.008). We did not find any significant differences across species in the duration of post-egg-laying behavior.
Figure 6
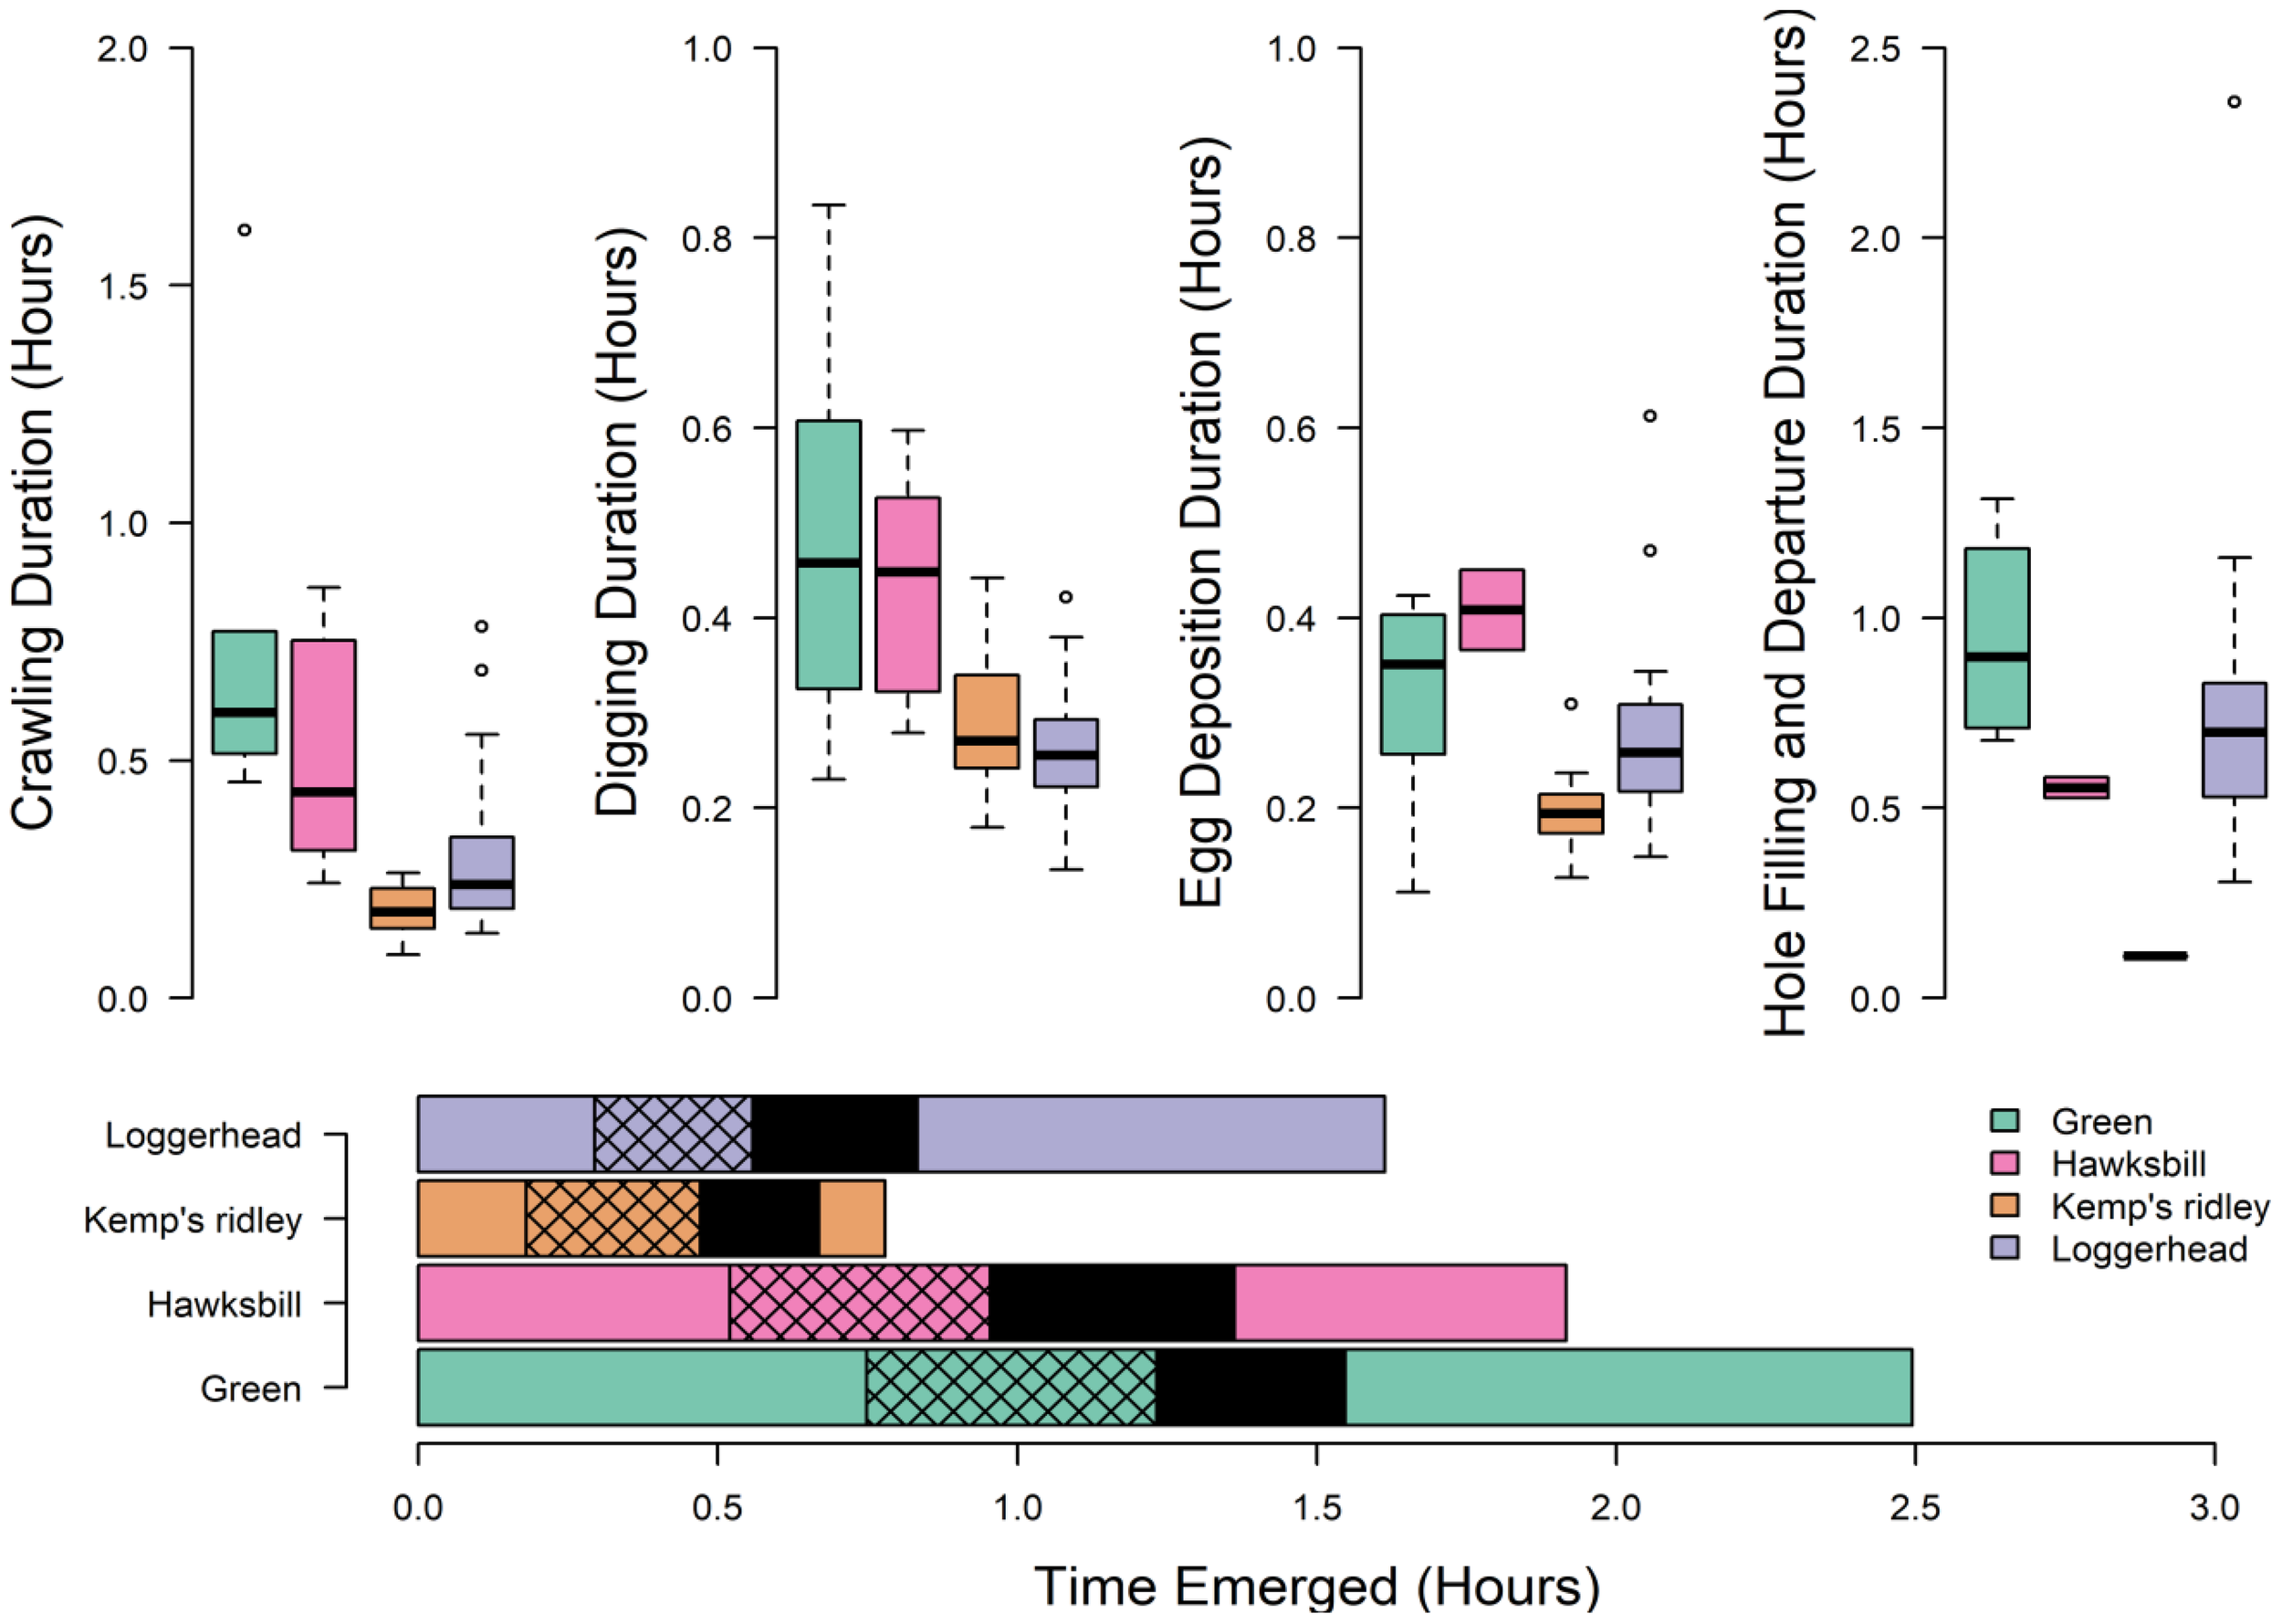
Boxplot showing the duration for each phase of nesting emergence. The horizontal histogram (bottom) shows the average emergence for each species, with the hatched bars representing digging behavior and the black box representing the egg deposition period.
We analyzed the correlation of nesting phase duration with fecundity for 20 nests (16 Kemp’s ridley and four loggerheads) for which both ADL and clutch size data were available. Total clutch size was positively correlated with the egg deposition period (F1,18 = 7.9, p = 0.01), which accounted for 30% of the variation observed in clutch size. Clutch size was not significantly correlated with duration of any other phase of nesting, nor with overall nesting event duration.
3.3 NNE duration and timing
Non-nesting emergences were relatively short in duration, with 75% of complete NNEs (N = 68) lasting less than 10 minutes and averaging just 11 ± 25 minutes. There was no difference across species in the duration of NNE events (ANOVA: F3,64 = 1.69, p = 0.17). One notable NNE performed by a green sea turtle 48 hours prior to a nesting event lasted for over 220 minutes and appeared to involve digging and then abandoning five different egg chambers. This was not directly observed by researchers, but the authors have witnessed similar long-duration NNE events in this species in the past (KMH, personal observ.), as well as in loggerheads in NW Florida (MML, personal observ.).
At least five NNEs were detected in each species, and all NNEs occurred within 72 hours prior to a nesting event (Figure 7). NNEs occurred an average of 18.2 ± 15.9 hours before a nesting event, with 36% occurring the same night as a nesting event and 50% occurring within 24 hours before a nesting event. Species had different NNE rates (ANOVA: F3,57 = 5.2, p = 0.003), with Kemp’s ridleys conducting fewer NNEs than green turtles or hawksbills (Tukey’s HSD, p = 0.003, p = 0.05), but not loggerheads (p = 0.11).
Figure 7
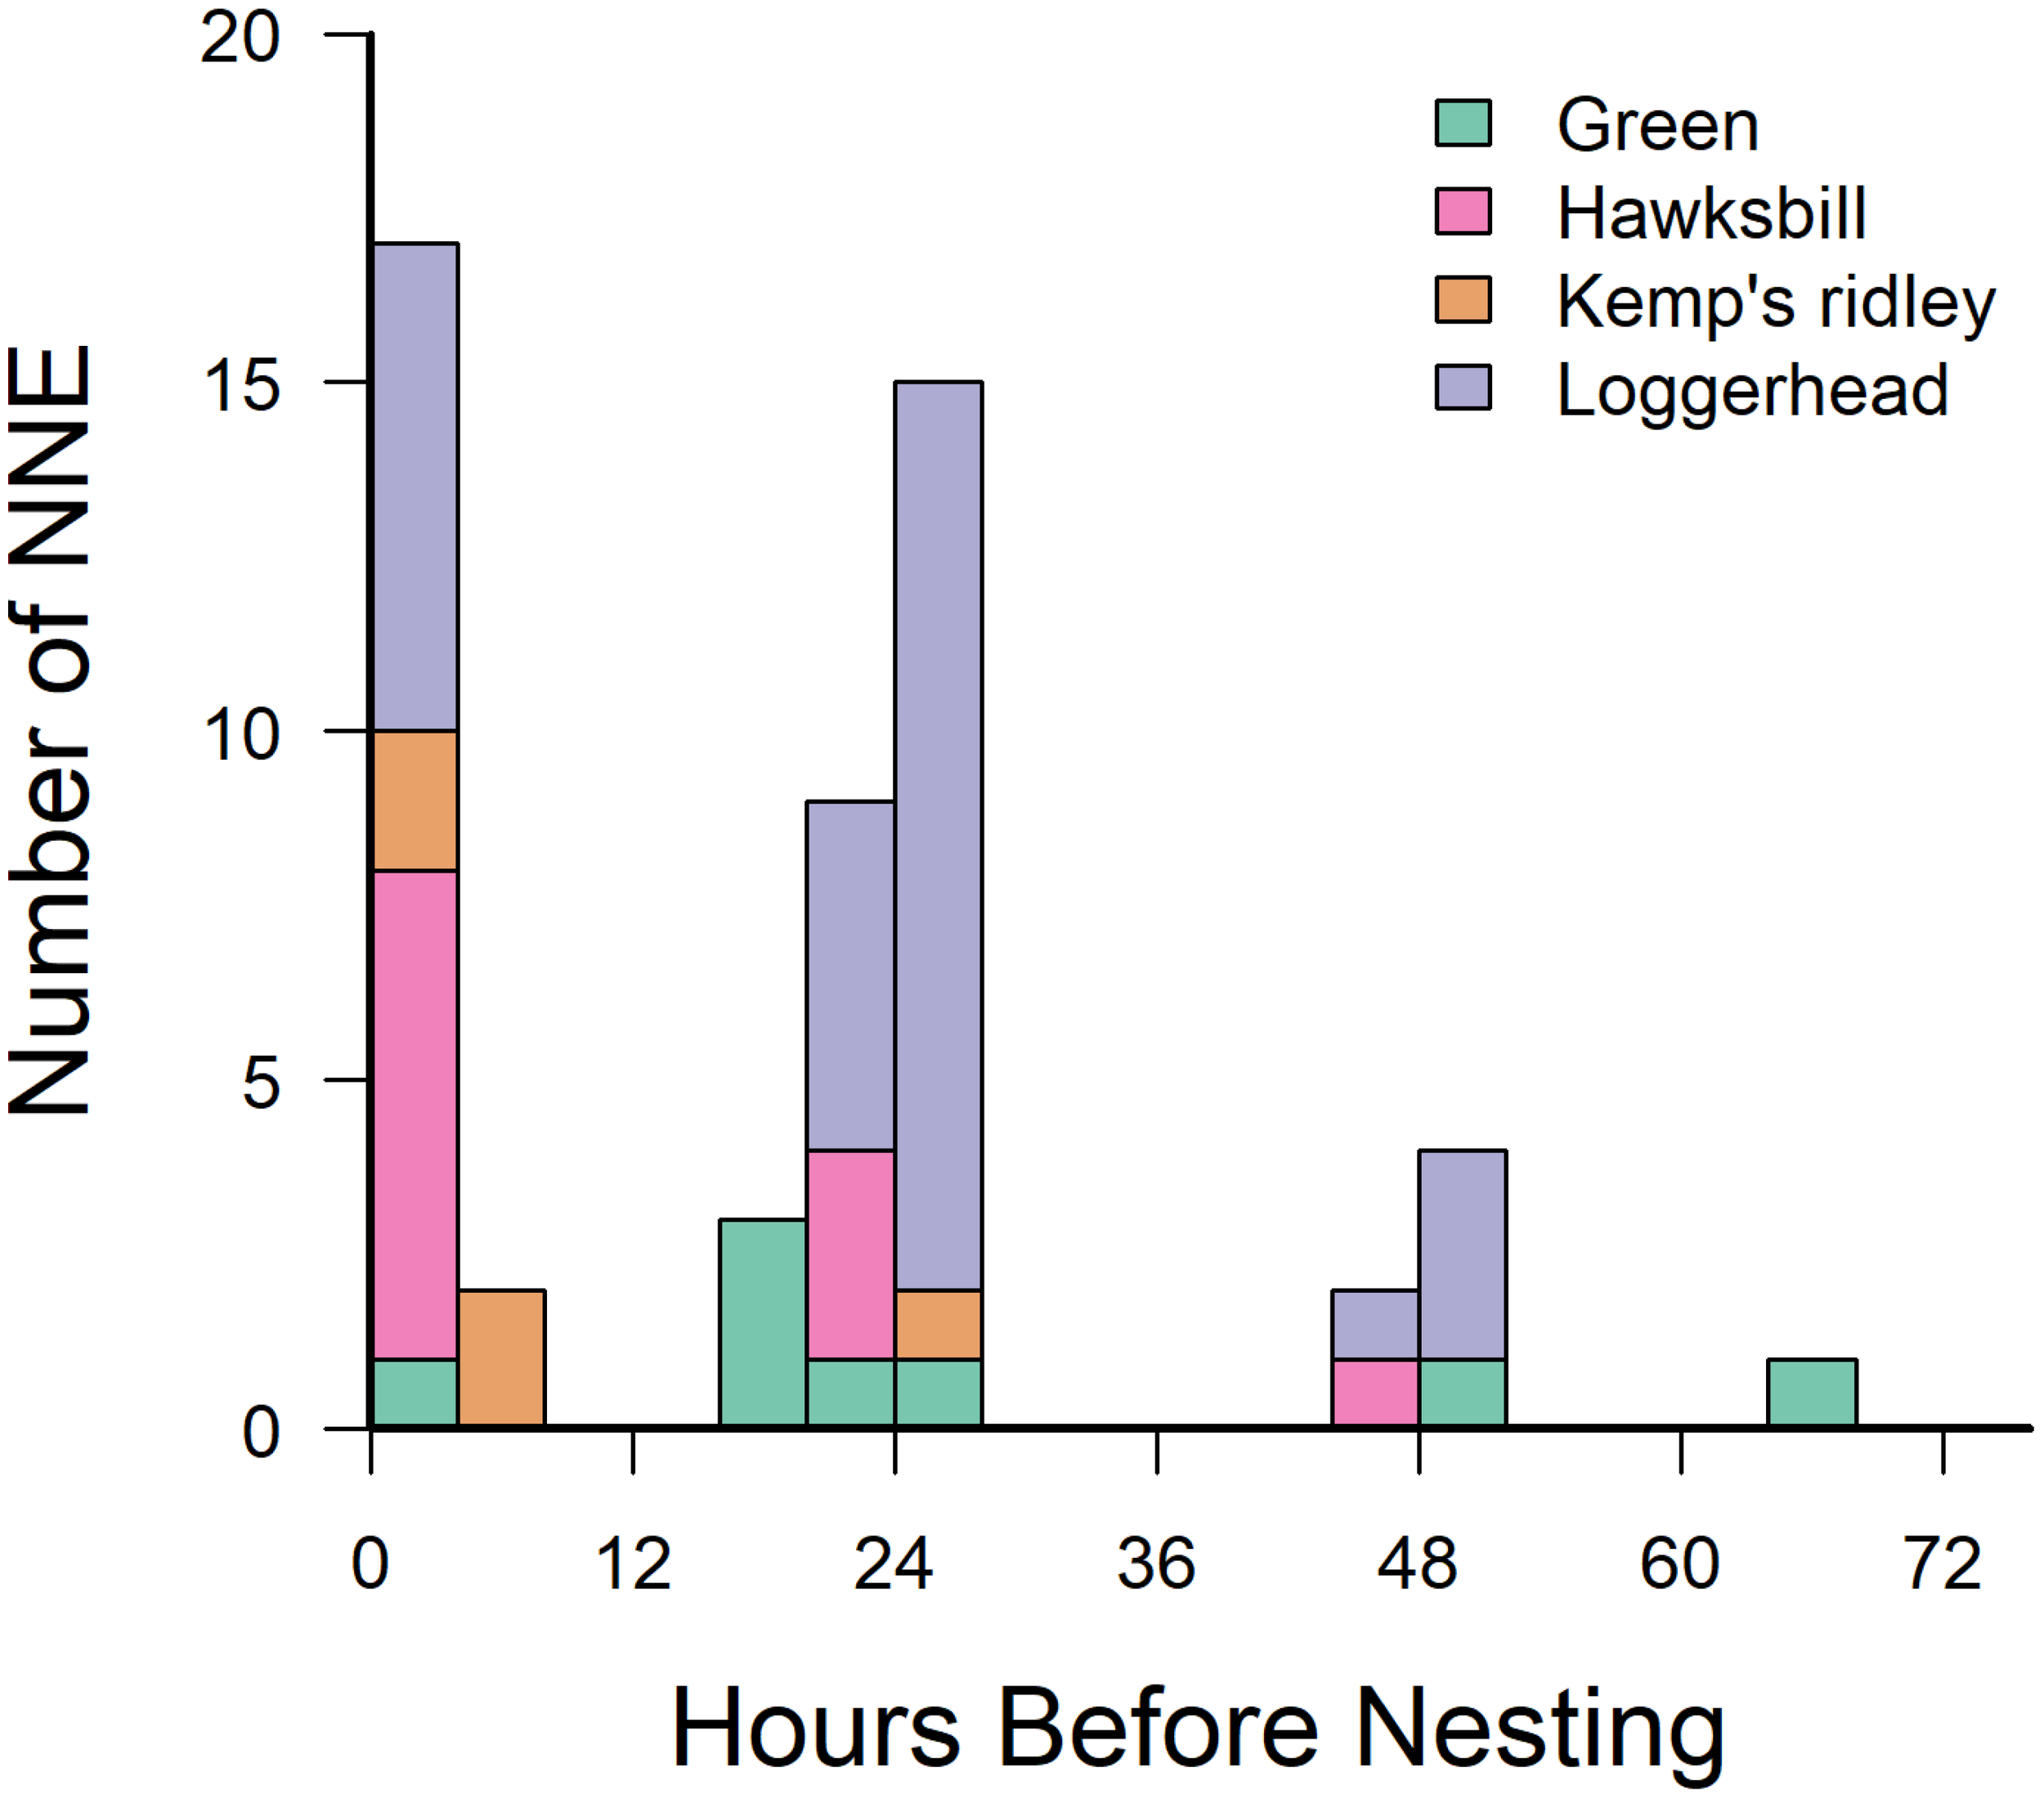
Frequency of non-nesting emergences in relation to the subsequent nesting period. Color-coded by species.
Nesting events and NNEs occurred primarily during nighttime hours (1900–0500 hours) for loggerheads, green turtles, and hawksbills, whereas all Kemp’s ridley events occurred during daylight hours (Figure 8). Nesting and NNE events showed temporal overlap for all species, but nesting events were more clustered in time, whereas NNE events occurred over a larger range of hours. Hawksbills predominantly nested between the hours of 2100 and 0000, but the majority of NNEs occurred later in the morning between 0100 and 0500. For Kemp’s ridleys, the majority of false crawls occurred early in the morning (0600–0800 h), before nesting events peaked (1000–1400 h). For green turtles, the latest nesting event occurred at 0630, but 31% (4 of 13) of NNEs occurred later than this, with three occurring during daylight hours of the early morning. There was little difference in the timing of nesting and NNE events for loggerheads (Figure 8).
Figure 8
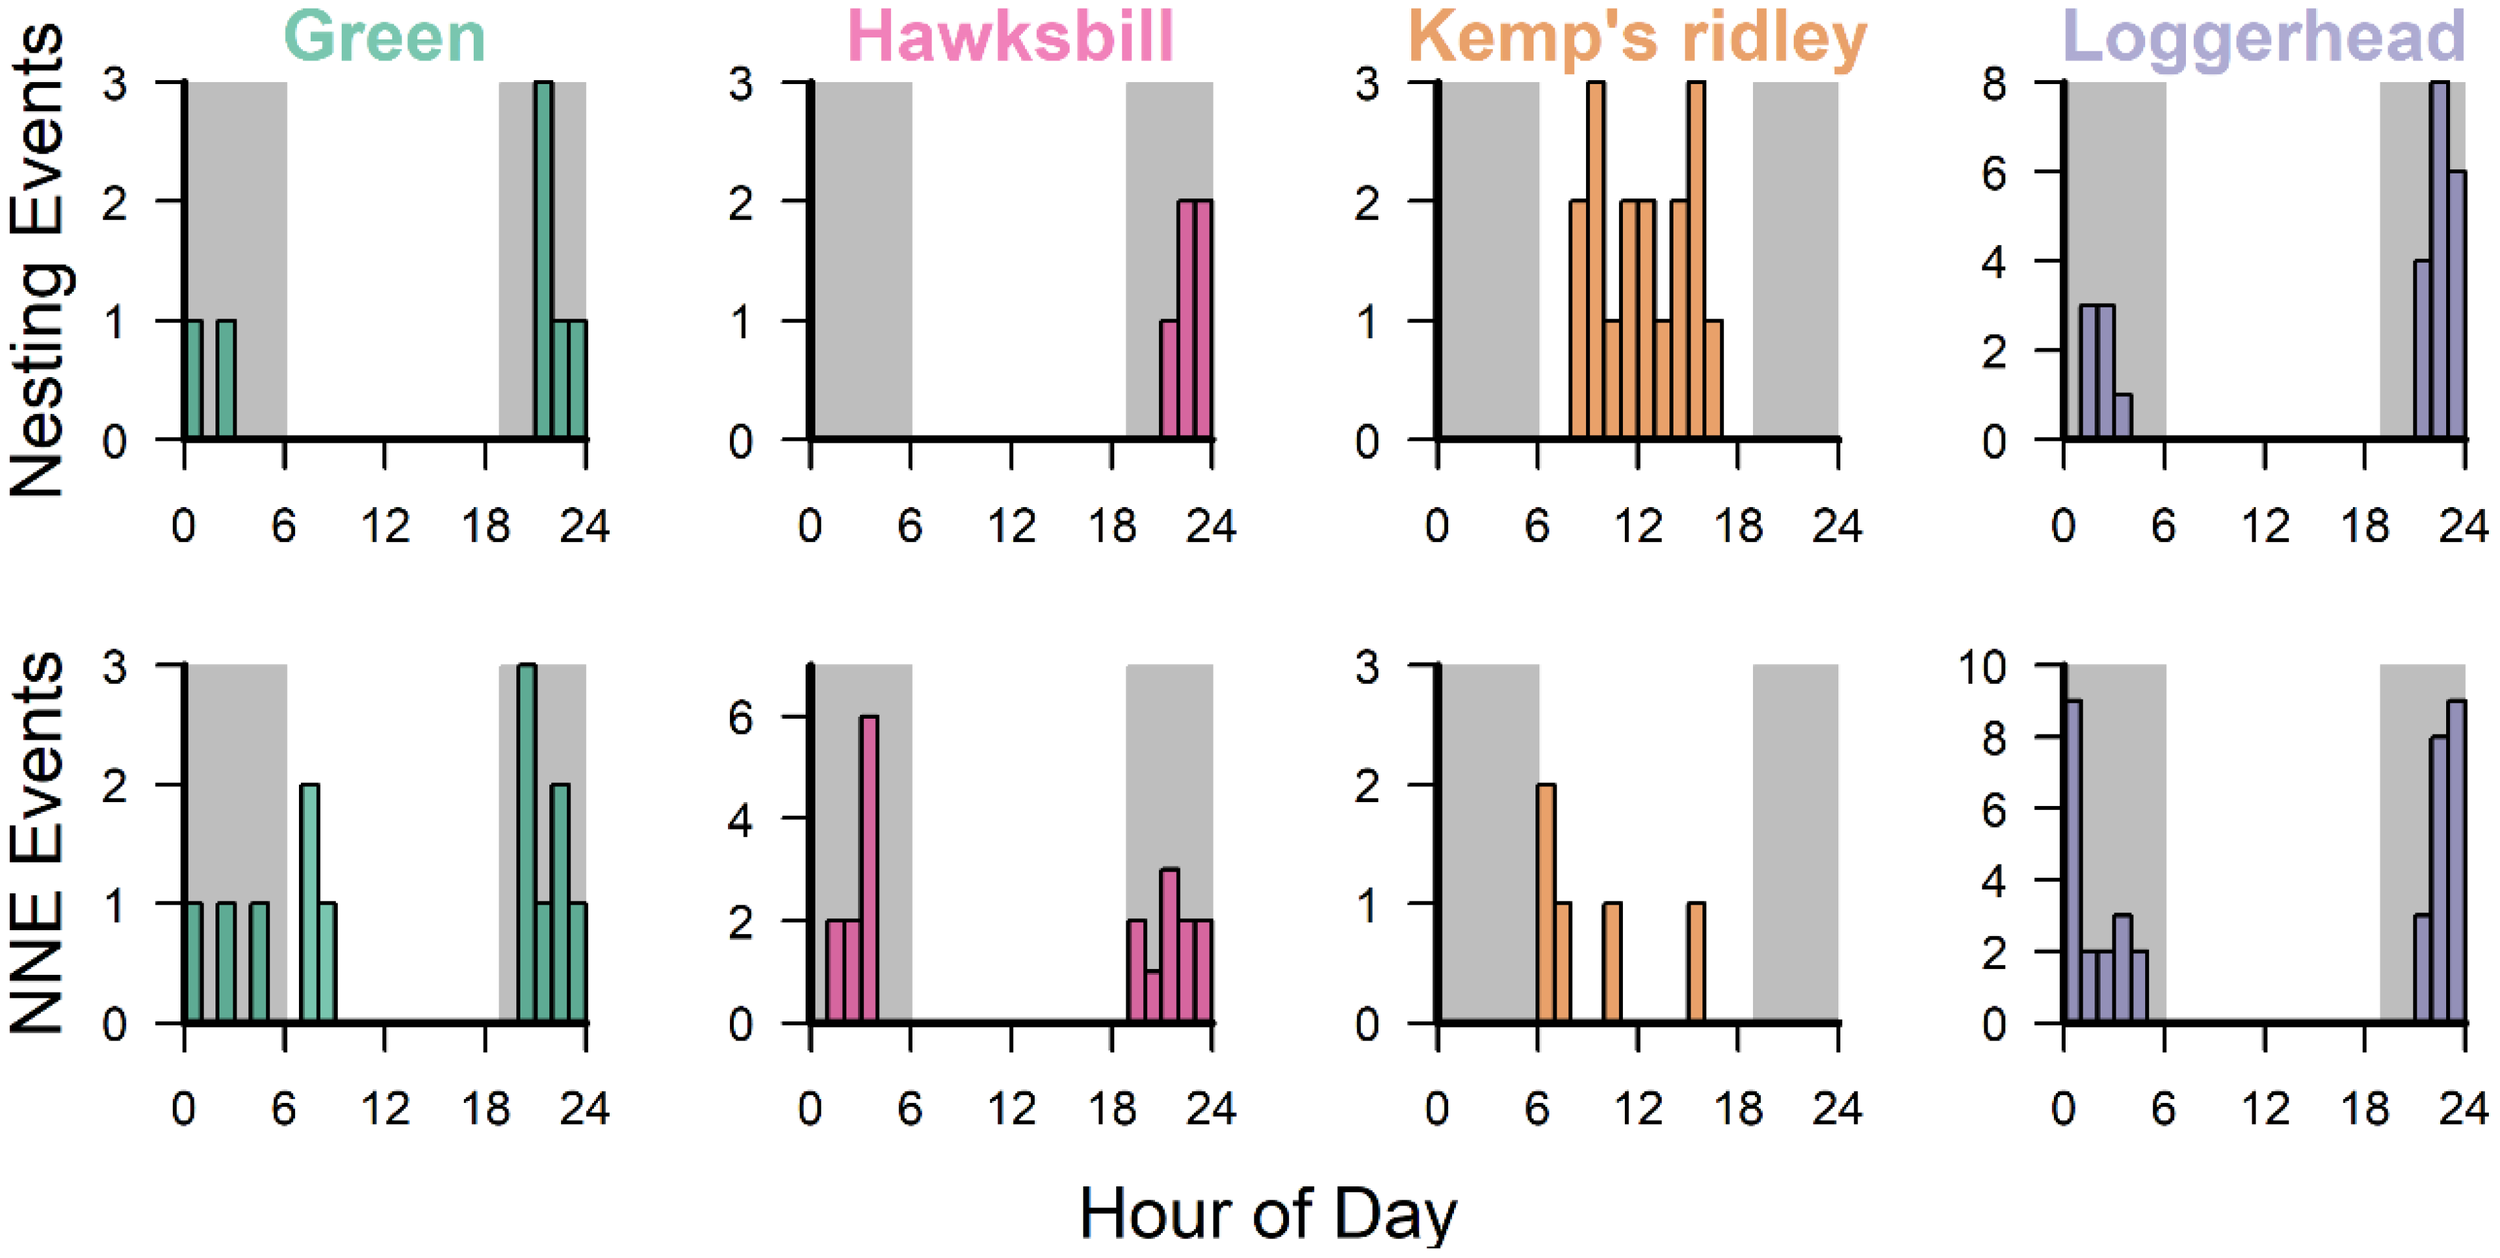
Frequency histograms showing time of day for nesting events and non-nesting emergence (NNE) events for each species. Note: X-axis is in 24-hour format for hour of day.
3.4 Automatic event classification and comparison to satellite telemetry
Automatic classification using parameters based on acceleration, depth, and wet–dry sensor data (refer to Methods) identified 118 times that a turtle was on land. Of these, 45 were classified as nesting events, and 73 were classified as NNE. Two individuals had faulty accelerometers that introduced noise in the sensor every 32nd point, which falsely increased their ODBA and thus did not meet classification criteria for being on land. The tags of two other turtles had faulty wet–dry sensors, obscuring the analysis. When these four individuals were removed from the analysis, automatic classification correctly identified 45 out of 46 nesting events (97.8% accuracy rate), and no NNEs were identified as nesting events, producing a 0% false positivity rate. The one incorrect assignment was from a nesting Kemp’s ridley that repositioned itself during egg laying and was thus classified (incorrectly) as an NNE event instead of a nesting event.
The ability to identify nesting and NNE events from satellite tag data was compared to our manual ADL method using high-quality, land-based satellite locations that were available for 12 turtles across 17 nesting events; no Kemp’s ridleys were included in this analysis. Satellite-derived classification of nesting events produced identical results to the manual ADL method for loggerheads (100%, N = 12) and green turtles (100%, N = 3). However, the satellite-based method incorrectly identified unobserved nesting events (0%, N = 2) for hawksbills. In one case, the satellite estimate suggested that the turtle nested 3 days before the ADL-derived nesting event, while in the other instance, there were no satellite-derived estimates that suggested that the turtle nested.
Analysis of satellite telemetry locations showed that locations alone severely under-represented NNE events, both by missing entire nights in which NNEs occurred and by lacking the resolution to detect multiple NNE events for a turtle in a single night. Our ADL data revealed that individuals could have multiple NNE events (up to four or five) in a single night, which were combined into a single NNE event by satellite analysis, if they were detected at all. Overall, only 6.3% of NNE events (four out of 63) were documented by satellite analysis, and only 35% (13 of 37) of nights in which an NNE event occurred were correctly classified by satellite analysis (N = 4) and direct observation (N = 9) combined.
4 Discussion
We used ADLs to discriminate the fine-scale phases of the nesting and non-nesting beach emergences for four imperiled species of sea turtles across multiple locations. This approach allowed the precise calculation of inter-nesting periods, a parameter that directly influences fecundity estimates used in demographic models. The distinct nesting stages we observed aligned with previously published green sea turtle behaviors (Nishizawa et al., 2013; Jeantet et al., 2021), and we now present these phases for green turtles in two additional locations and for three additional species. By developing species-specific behavioral signatures (refer to Hart et al., 2025), we provide the basis for future tag deployments with potential onboard event-detection algorithms that can automate nesting counts and reduce observer dependence.
Our labor-intensive methodology—tagging individuals, recording second-by-second behavioral observations, matching with ADL and satellite telemetry data, and recapturing turtles to retrieve tags—served as a critical calibration experiment. These efforts lay the foundation for the remote, unbiased detection of nesting and NNE events using pop-off technologies, especially in areas with low recapture rates (e.g., Northern Gulf; Lamont et al., 2014). By validating acceleration signatures against ground-truthed observations, we show how biologging can move beyond general nest monitoring to generate data directly relevant to population assessment and regulatory decisions.
There are currently only a few indirect methods for improving estimates of sea turtle reproductive output. Satellite telemetry revealed higher clutch frequencies (mean 5.4 nests/female) than direct beach patrol data (2.2 nests/female) in Florida loggerheads (Tucker, 2010). Analysis of other capture–recapture data that go beyond raw nest counts per female has also improved estimates of clutch frequencies (Rivalan et al., 2006). More recent genetic tagging improved clutch frequency estimates (Shamblin et al., 2021). ADLs now add a complementary tool with sub-second resolution, offering direct behavioral identification of nesting events with further refinement of clutch counts when paired with satellite or GPS tags. While previous methods estimate nesting frequency by dividing breeding duration by average inter-nesting interval, our ADL approach provides direct behavioral identification, improving the accuracy of fecundity estimates that support population models and conservation policy.
The use of ADLs can refine inter-nesting interval estimates beyond what previous technologies offered, as shown in our data (Table 4). These metrics can now be tracked over time to assess environmental or anthropogenic influences on nesting behaviors. Deploying ADLs before the nesting season could capture first clutch dates or even early mating behavior. Compared to standard satellite tags, ADLs provide higher-resolution behavioral data and greater insight into specific on-land activities, despite GPS tags’ haul-out capabilities that can have higher failure rates (Hays et al., 2021). Our findings complement those of Nishizawa et al. (2013), with similar nesting time means and phase distinctions. However, our larger sample sizes and diverse sites enabled broader species comparisons, reinforcing how deploying ADLs in wild populations can provide additional baseline data. Integrating ADLs in future monitoring could test hypotheses regarding fitness benefits of natural vs. built beaches (Pike, 2008; Wilmers et al., 2015) and detect behavioral changes from nearby human disturbances.
In aquatic settings, ADLs are being applied to assess turtle responses to ocean noise (Tyson et al., 2017) and thermoregulation behaviors linked to reproductive output (Fossette et al., 2012). ADLs could also be used to document fine-scale turtle behavior near high-risk areas, including renourished beaches. Although U.S. Army Corps of Engineers protocols require such monitoring, biologging tools are not yet standard. ADLs combined with satellite or GPS tags could reveal how turtles use renourished beaches and nearshore habitats. For instance, Lamont and Houser (2014) found that loggerhead nest density correlated with nearshore currents and sand movement, which change during renourishment projects. ADLs can track how turtles respond behaviorally to such changes.
Future directions point to greater autonomy and remote data retrieval. Advanced algorithms and multi-sensor biologging (e.g., event-detection tags), paired with satellite transmission capabilities, could enable the identification of nesting and NNE events without recapture, allowing clutch frequency to be estimated from a single deployment. Prototype pop-off ADL packages are already in use (KMH, USGS, modeled after Lear and Whitney, 2016; Whitmore et al., 2016) and are capable of collecting fine-scale data for days to weeks before pop-off and tag recovery.
5 Conclusion
Clutch frequency is critical for modeling sea turtle population trajectories, but variations in reproductive output, nest site fidelity, and nesting intervals complicate estimates of nesting female abundance (Casale and Ceriani, 2020). By pairing ADLs with satellite/GPS tags and genetic mark-recapture methods (Shamblin et al., 2021), researchers can generate robust estimates of reproductive output without repeated recaptures. Recent validation work (e.g., Hounslow et al., 2022; Jeantet et al., 2020) provides essential reference data for interpreting ADL outputs across species.
Future studies could apply existing behavior classification algorithms to assess whether nesting turtles forage during inter-nesting intervals. This could expand our understanding of resource use and energetics during the reproductive season. This collaborative work enhances sample sizes for species comparisons (Hays et al., 2004) and promotes data sharing (Hart et al., 2025). Our findings demonstrate that ADLs improve estimates of nesting and NNE behaviors and may eventually provide estimates of fecundity as well. Integrating this information into population models will likely sharpen assessments of anthropogenic impacts on reproduction and directly inform conservation strategies.
Statements
Data availability statement
The datasets presented in this study can be found in online repositories. The names of the repository/repositories and accession number(s) can be found below: https://doi.org/10.5066/P14PODHE.
Ethics statement
The animal study was approved by USGS Institutional Animal Care and Use committee and National Park Service Institutional Animal Care and Use committee. The study was conducted in accordance with the local legislation and institutional requirements.
Author contributions
KH: Methodology, Data curation, Investigation, Validation, Conceptualization, Resources, Writing – review & editing, Supervision, Visualization, Project administration, Formal analysis, Writing – original draft, Funding acquisition. CW: Visualization, Investigation, Writing – review & editing, Methodology, Writing – original draft, Formal analysis, Validation. DS: Methodology, Conceptualization, Validation, Project administration, Funding acquisition, Supervision, Writing – review & editing, Resources, Data curation. ML: Validation, Investigation, Data curation, Resources, Project administration, Writing – review & editing, Methodology, Supervision. MC: Investigation, Data curation, Writing – review & editing, Validation, Formal analysis, Project administration. AC: Investigation, Data curation, Writing – review & editing, Methodology, Formal analysis. NW: Conceptualization, Visualization, Resources, Validation, Project administration, Formal analysis, Writing – original draft, Investigation, Supervision, Writing – review & editing, Data curation, Methodology.
Funding
The author(s) declare financial support was received for the research and/or publication of this article. Funding for this work was provided by U.S. Geological Survey Ecosystems Mission Area, the U.S. Geological Survey Priority Ecosystem Studies program, the U.S. National Park Service, and the Deepwater Horizon Natural Resource Damage Assessment (NRDA).
Acknowledgments
We thank numerous NPS volunteers and interns, and USGS volunteers for field assistance. We thank NPS employees Jennifer S. Walker for help deploying and retrieving ADLs at Padre Island National Seashore, and NPS employees Clayton Pollock, Tessa Code, Ian Lundgren, and Kayla Nimmo for help retrieving ADLs in our remote study sites in the Dry Tortugas and U.S. Virgin Islands. We thank Captain Jamie Merkel for charters to Dry Tortugas. We thank Brail Stephens for helping at the T.H. Stone Memorial St. Josephe Peninsula State Park; we are grateful to Bruce Hagedorn, Justin Johnson, and Kathy Gault for their continued support at this Florida site.
Conflict of interest
The authors declare that the research was conducted in the absence of any commercial or financial relationships that could be construed as a potential conflict of interest.
Generative AI statement
The author(s) declare that no Generative AI was used in the creation of this manuscript.
Any alternative text (alt text) provided alongside figures in this article has been generated by Frontiers with the support of artificial intelligence and reasonable efforts have been made to ensure accuracy, including review by the authors wherever possible. If you identify any issues, please contact us.
Publisher’s note
All claims expressed in this article are solely those of the authors and do not necessarily represent those of their affiliated organizations, or those of the publisher, the editors and the reviewers. Any product that may be evaluated in this article, or claim that may be made by its manufacturer, is not guaranteed or endorsed by the publisher.
References
1
Balazs G. H. Chaloupka M. (2004). Thirty-year recovery trend in the once depleted Hawaiian green sea turtle stock. Biol. Conserv.117, 491–498. doi: 10.1016/j.biocon.2003.08.008
2
Blumenthal J. M. Hardwick J. L. Austin T. J. Broderick A. C. Chin P. Collyer L. et al . (2021). Cayman islands sea turtle nesting population increases over 22 years of monitoring. Front. Mar. Sci.8. doi: 10.3389/fmars.2021.663856
3
Brost B. Witherington B. Meylan A. Leone E. Ehrhart L. Bagley D. (2015). Sea turtle hatchling production from Florida (USA) beaches 2002–2012, with recommendations for analyzing hatching success. Endang. Species. Res.27, 53–68. doi: 10.3354/esr00653
4
Bustard H. R. Greenham P. (1969). Nesting Behavior of the Green Sea Turtle on a Great Barrier Reef Island. Herpetologica25, 93–102. doi: http://www.jstor.org/stable/3890951
5
Casale P. Ceriani S. A. (2019). Satellite surveys: a novel approach for assessing sea turtle nesting activity and distribution. Mar. Biol.166, 47. doi: 10.1007/s00227-019-3494-4
6
Casale P. Ceriani S. A. (2020). Sea turtle populations are overestimated worldwide from remigration intervals: correction for bias. Endanger. Species Res.41, 141–151. doi: 10.3354/esr01019
7
Ceriani S. A. Casale P. Brost M. Leone E. H. Witherington B. E. (2019). Conservation implications of sea turtle nesting trends: elusive recovery of a globally important loggerhead population. Ecosphere10, e02936. doi: 10.1002/ecs2.2936
8
Chaloupka M. Bjorndal K. A. Balazs G. H. Bolten A. B. Ehrhart L. M. Limpus C. J. et al . (2008). Encouraging outlook for recovery of a once severely exploited marine megaherbivore. Glob. Ecol. Biogeogr17, 297–304. doi: 10.1111/j.1466-8238.2007.00367.x
9
Cooke S. J. Hinch S. G. Wikelski M. Andrews R. D. Wolcott T. G. Butler P. J. (2004). Biotelemetry: a mechanistic approach to ecology. Trends Ecol. Evol.19, 334–343. doi: 10.1016/j.tree.2004.04.003
10
Crouse D. T. Crowder L. B. Caswell H. (1987). A stage-based population model for loggerhead sea turtles and implications for conservation. Ecology68, 1412–1423. doi: 10.2307/1939225
11
Esteban N. Mortimer J. A. Hays G. C. (2017). How numbers of nesting sea turtles can be overestimated by nearly a factor of two. Proc. R. Soc B284, 20162581. doi: 10.1098/rspb.2016.2581
12
Fossette S. Gleiss A. C. Myers A. E. Garner S. Leibsch N. Whitney N. M. et al . (2010). Behaviour and buoyancy regulation in the deepest-diving reptile: the leatherback turtle. J. Exper. Biol.213, 4074–4083. doi: 10.1242/jeb.048207
13
Fossette S. Schofield G. Lilley M. K. S. Gleiss A. C. Hays G. C. (2012). Acceleration data reveal the energy management strategy of a marine ectotherm during reproduction. Funct. Ecol.26, 324–333. doi: 10.1111/j.1365-2435.2011.01960
14
Hailman J. P. Elowson A. M. (1992). Ethogram of the nesting female loggerhead (Caretta caretta). Herpetologica48, 1–30. http://www.jstor.org/stable/3892915 (Accessed January 25, 2020).
15
Hart K. M. Guzy J. C. Smith B. J. (2021). Drivers of realized satellite tracking duration in marine turtles. Mov. Ecol.9, 1–14. doi: 10.1186/s40462-020-00237-3
16
Hart K. M. White C. F. Iverson A. R. Whitney N. (2016). Trading shallow safety for deep sleep: juvenile green turtles select deeper resting sites as they grow. Endang. Species. Res.31, 61–73. doi: 10.3354/esr00750
17
Hart K. M. White C. F. Lamont M. Cherkiss M. S. Whitney N. Fehr Z. (2025). Nesting and non-nesting emergences for four species of imperiled sea turtles derived from Acceleration Data Loggers 2012-2017 ( U.S. Geological Survey Data release). doi: 10.5066/P14PODHE
18
Hart K. M. Zawada D. G. Fujisaki I. Lidz B. H. (2010). Inter-nesting habitat-use patterns of loggerhead sea turtles: enhancing satellite tracking with benthic mapping. Aquat. Biol.11, 77–90. doi: 10.3354/ab00296
19
Hays G. C. Ferreira L. C. Sequeira A. M. Meekan M. G. Duarte C. M. Bailey H. et al . (2016). Key questions in marine megafauna movement ecology. Trends Ecol. Evol.31, 463–475. doi: 10.1016/j.tree.2016.02.015
20
Hays G. C. Laloë J.-O. Rattray A. Esteban N. (2021). Why do satellite tags stop relaying data? Ecol. Evol. 11:7093–7101. doi: 10.1002/ece3.7558
21
Hays G. C. Metcalfe J. D. Walne A. W. Wilson R. P. (2004). First records of flipper beat frequency during sea turtle diving. J. Exp. Mar. Biol. Ecol.303, 243–260. doi: 10.1016/j.jembe.2003.11.010
22
Hounslow J. L. Fossette S. Byrnes E. E. Whiting S. D. Lambourne R. N. Armstrong N. J. et al . (2022). Multivariate analysis of biologging data reveals the environmental determinants of diving behavior in a marine reptile. R. Soc. Open Sci.2022, 9. doi: 10.1098/rsos.211860
23
Jeantet L. Hadetskyi V. Vigon V. Korysko F. Paranthoen N. Chevallier D. (2022). Estimation of the Maternal Investment of Sea Turtles by Automatic Identification of Nesting Behavior and Number of Eggs Laid from a Tri-Axial Accelerometer. Animals12, 520. doi: 10.3390/ani12040520
24
Jeantet L. Planas-Bielsa V. Benhamou S. Geiger S. Martin J. Siegwalt F. et al . (2020). Behavioural inference from signal processing using animal-borne multi-sensor loggers: a novel solution to extend the knowledge of sea turtle ecology. R. Soc Open Sci.7, 200139. doi: 10.1098/rsos.200139
25
Jeantet L. Vigon V. Geiger S. Chevallier D. (2021). Fully convolutional neural network: A solution to infer animal behaviours from multi-sensor data. Ecol. Model.450, 109555. doi: 10.1016/j.ecolmodel.2021.109555
26
Lamont M. M. Fujisaki I. Carthy R. R. (2014). Estimates of vital rates for a declining loggerhead turtle (Caretta caretta) subpopulation: implications for management. Mar. Biol.161, 2659–2668. doi: 10.1007/s00227-014-2537-0
27
Lamont M. M. Houser C. (2014). Spatial distribution of loggerhead turtle (Caretta caretta) emergences along a highly dynamic beach in the northern Gulf of Mexico. J. Exp. Mar. Biol. Ecol.453, 98–107. doi: 10.1016/j.jembe.2013.11.006
28
Lear K. O. Whitney N. M. (2016). Bringing data to the surface: recovering data loggers for large samples sizes from marine vertebrates. Anim. Biotelem4, 12. doi: 10.1186/s40317-016-0105-8
29
Lindborg R. Neidhardt E. Smith J. R. Schartz B. Hernandez V. Savage A. et al . (2019). An ethogram describing the nesting behavior of green sea turtles (Chelonia mydas). Herpetologica75, 114–122. doi: 10.1655/D-18-00015
30
Miller J. D. Dinkelacker S. A. (2008). “ Reproductive structures and strategies of turtles,” in Biology of turtles. Eds. WynekenJ.GodfreyM. H.BelsV. ( CRC Press, London), 225–278.
31
National Marine Fisheries Service (NMFS) U.S. Fish and Wildlife Service (USFWS) Secretaria de Medio Ambiente yRecursos Naturales (SEMARNAT) (2011). Bi-national recovery plan for the kemp’s ridley sea turtle (Lepidochelys kempii). 2nd ed (Silver Spring, MD, USA: National Marine Fisheries Service), 156.
32
National Marine Fisheries Service (NMFS); U.S. Fish and Wildlife Service (USFWS) (2015). “ Kemp’s ridley sea turtle (Lepidochelys kempii) 5-year review: summary and evaluation,” in National marine fisheries service, office of protected resources ( U.S. Fish and Wildlife Service, Southwest Region, Silver Spring, MD, USA), 63.
33
National Marine Fisheries Service and U.S. Fish and Wildlife Service (2008). Recovery plan for the northwest atlantic population of the loggerhead turtle (Caretta caretta). 2nd Edn (Silver Spring, MD: National Marine Fisheries Service and US Fish and Wildlife Service).
34
National Marine Fisheries Service and U.S. Fish and Wildlife Service (2011). Endangered and threatened species; determination of nine distinct population segments of loggerhead sea turtles as endangered or threatened. Fed. Regist.76, 58868–58952. https://www.fws.gov/sites/default/files/federal_register_document/2011-23960.pdf"2011-23960.pdf.
35
National Marine Fisheries Service Southeast Fisheries Science Center (2008). “ Sea turtle research techniques manual,” in NOAA technical memorandum NMFSSEFSC-579 ( NOAA Technical Memorandum, Washington, DC).
36
Nishizawa H. Noda T. Yasuda T. Okuyama J. Arai N. Kobayashi M. (2013). Decision tree classification of behaviors in the nesting process of green turtles (Chelonia mydas) from tri-axial acceleration data. J. Ethol31, 315–322. doi: 10.1007/s10164-013-0381-1
37
Okuyama J. Kataoka K. Kobayashi M. Abe O. Yoseda K. Arai N. (2012). The regularity of dive performance in sea turtles: a new perspective from precise activity data. Anim. Behav.84, 349–359. doi: 10.1016/j.anbehav.2012.04.033
38
Okuyama J. Kawabata Y. Naito Y. Arai N. Kobayashi M. (2009). Monitoring beak movements with an acceleration datalogger; a useful technique for assessing the feeding and breathing behaviors of sea turtles. Endang. Species. Res.10, 39–45. doi: 10.3354/esr00215
39
Okuyama J. Nakajima K. Noda T. Kimura S. Kamihata H. Kobayashi M. et al . (2013). Ethogram of immature green turtles: behavioral strategies for somatic growth in large marine herbivores. PloS One8, e65783. doi: 10.1371/journal.pone.0065783
40
Pike D. A. (2008). Natural beaches confer fitness benefits to nesting marine turtles. Biol. Lett.4, 704–706. doi: 10.1098/rsbl.2008.0359
41
R Core Team (2019). R: A language and environment for statistical computing (Vienna: R Foundation for Statistical Computing).
42
Richards P. M. Epperly S. P. Heppell S. S. King R. T. Sasso C. R. Moncada F. et al . (2011). Sea turtle population estimates incorporating uncertainty: a new approach applied to western North Atlantic loggerheads Caretta caretta. Endang. Species. Res.15, 151–158. doi: 10.3354/esr00379
43
Rivalan P. Pradel R. Choquet R. Girondot M. Prévot-Julliard A.-C. (2006). Estimating clutch frequency in the sea turtle Dermochelys coriacea using stopover duration. Mar. Ecol. Prog. Ser.317, 285–295. doi: 10.3354/meps317285
44
Shamblin B. M. Dodd M. G. Pate S. M. Godfrey M. H. Pfaller J. B. Williams K. L. et al . (2021). In search of the “missing majority” of nesting loggerhead turtles: improved inter-seasonal recapture rates through subpopulation-scale genetic tagging. Mar. Biol.168, 16. doi: 10.1007/s00227-020-03820-9
45
Shaver D. J. Caillouet C. W. Jr. (2015). Reintroduction of Kemp’s ridley (Lepidochelys kempii) sea turtle to Padre Island National Seashore, Texas and its connection to head-starting. Herp. Cons. Biol.10, 378–435. https://herpconbio.org/Volume_10/Symposium/Shaver_Caillouet_2015.pdf.
46
Shaver D. J. Rubio C. Walker J. S. George J. Amos A. F. Reich K. et al . (2016). Kemp’s ridley sea turtle (Lepidochelys kempii) nesting on the Texas coast: geographic, temporal, and demographic trends through 2014. Gulf Mexico Sci.33, 158–178. doi: 10.18785/goms.3302.04
47
Shepard E. L. C. Wilson R. P. Halsey L. G. Quintana F. Laich A. G. Gleiss A. C. et al . (2008a). Derivation of body motion via appropriate smoothing of acceleration data. Aquat. Biol.4, 235–241. doi: 10.3354/ab00104
48
Shepard E. L. C. Wilson R. P. Quintana F. Laich A. G. Liebsch N. Albareda D. A. et al . (2008b). Identification of animal movement patterns using tri-axial accelerometry. Endang. Species Res.10, 47–60. doi: 10.3354/esr00084
49
Troëng S. Rankin E. (2005). Long-term conservation efforst contribute to positive green turtle Chelonia mydas nesting trend at Tortuguero, Costa Rica. Biol. Conserv.121, 111–116. doi: 10.1016/j.biocon.2004.04.014
50
Tucker A. D. (2010). Nest site fidelity and clutch frequency of loggerhead sea turtles are better elucidated by satellite telemetry than by nocturnal tagging efforts: implications for stock estimation. J. Exp. Mar. Biol. Ecol.383, 48–55. doi: 10.1016/j.jembe.2009.11.009
51
Tyson R. B. Piniak W. E. D. Domit C. Mann D. Hall M. Nowacek D. P. et al . (2017). Novel bio-logging tool for studying fine-scale behaviors of marine turtles in response to sound. Front. Mar. Sci.4. doi: 10.3389/fmars.2017.00219
52
Weber N. Weber S. B. Godley B. J. Ellick J. Witt M. Broderick A. C. (2013). Telemetry as a tool for improving estimates of marine turtle abundance. Biol Conserv167, 90–96. doi: 10.1016/j.biocon.2013.07.030
53
Weber S. B. Weber N. Ellick J. Avery A. Frauenstein R. Godley B. J. et al . (2014). Recovery of the South Atlantic’s largest green turtle nesting population. Biodivers. Conserv.23, 3005–3018. doi: 10.1007/s10531-014-759-6
54
Whitmore B. M. White C. F. Gleiss A. C. Whitney N. M. (2016). A float-release package for recovering data-loggers from wild sharks. J. Exp. Mar. Biol. Ecol.475, 49–53. doi: 10.1016/j.jembe.2015.11.002
55
Wibbels T. Bevan E. (2019). Lepidochelys kempii (errata version published in 2019). IUCN Red List Threat. Species, e.T11533A155057916. https://static1.squarespace.com/static/5b80290bee1759a50e3a86b3/t/5bb3fd448165f55177a79846/1538522437498/SWOT13_p32-33_Kemps+Ridley.pdf
56
Wilmers C. C. Nickel B. Bryce C. M. Smith J. A. Wheat R. E. Yovovich V. (2015). The golden age of bio-logging: how animal-borne sensors are advancing the frontiers of ecology. Ecology96, 1741–1753. doi: 10.1890/14-1401.1
57
Wilson R. P. White C. R. Quintana F. Halsey L. G. Liebsch N. Martin G. R. et al . (2006). Moving towards acceleration for estimates of activity-specific metabolicrate in free-living animals: the case of the cormorant. J. Anim. Ecol.75, 1081–1090. doi: 10.1111/j.1365-2656.2006.01127.x.J.L
58
Witherington B. Kubilis P. Brost B. Meylan A. (2009). Decreasing annual nest counts in a globally important loggerhead sea turtle population. Ecol. Appl.19, 30–54. doi: 10.1890/08-0434.1
59
Yasuda T. Arai N. (2009). Changes in flipper beat frequency, body angle and swimming speed of female green turtles Chelonia mydas. Mar. Ecol. Prog. Ser.386, 275–286. doi: 10.3354/meps08084
Summary
Keywords
behavior, accelerometer, remote sensing, marine turtle, conservation
Citation
Hart KM, White CF, Shaver DJ, Lamont MM, Cherkiss MS, Crowder A and Whitney NM (2025) Biologging to identify nesting and non-nesting emergences for four species of imperiled sea turtles. Front. Mar. Sci. 12:1691053. doi: 10.3389/fmars.2025.1691053
Received
22 August 2025
Revised
27 September 2025
Accepted
04 November 2025
Published
05 December 2025
Volume
12 - 2025
Edited by
Marc Girondot, Université Paris-Saclay, France
Reviewed by
Steve Dunbar, Loma Linda University, United States
Michael James Roast, University of Veterinary Medicine Vienna, Austria
Updates
Copyright
At least a portion of this work is authored by Kristen M. Hart, Donna J. Shaver, Margaret M. Lamont, Michael S Cherkiss, and Andrew G. Crowder on behalf of the U.S. Government and as regards Dr. Hart, Dr. Shaver, Dr. Lamont, Dr. Cherkiss, Dr. Crowder and the U.S. Government, is not subject to copyright protection in the United States. Foreign and other copyrights may apply.
This is an open-access article distributed under the terms of the Creative Commons Attribution License (CC BY). The use, distribution or reproduction in other forums is permitted, provided the original author(s) and the copyright owner(s) are credited and that the original publication in this journal is cited, in accordance with accepted academic practice. No use, distribution or reproduction is permitted which does not comply with these terms.
*Correspondence: Kristen M. Hart, kristen_hart@usgs.gov
† Present address: Andrew G. Crowder, Xylem, Boca Raton, FL, United States
Disclaimer
All claims expressed in this article are solely those of the authors and do not necessarily represent those of their affiliated organizations, or those of the publisher, the editors and the reviewers. Any product that may be evaluated in this article or claim that may be made by its manufacturer is not guaranteed or endorsed by the publisher.