 Milan Stehlik1,2
 M. Alejandro Dinamarca2,3*
 Fernando Rojas2,3*
 Claudia Ibacache-Quiroga2,3
 Karoll González-Pizarro2,3Fernanda Figueroa-Ajraz2,3Bastián Barraza-Morales2,3
- 1Institute of Statistics, Faculty of Sciences, Universidad de Valparaíso, Valparaíso, Chile
- 2Center for Micro-Bioinnovation, Universidad de Valparaíso, Valparaíso, Chile
- 3School of Nutrition and Dietetics, Faculty of Pharmacy, Universidad de Valparaíso, Valparaíso, Chile
Introduction: Understanding how environmental factors modulate microbial growth and biofilm formation is essential for predicting ecosystem dynamics and biotechnological outcomes. In this study, we investigated the responses of Cobetia sp. MM1IDA2H-1 across controlled temperature and pH gradients, combining laboratory assays with advanced predictive models. Understanding these effects is key for predicting bacterial behavior in ecosystems.
Methods: We examined the growth and biofilm responses of Cobetia sp. MM1IDA2H-1 across controlled temperature and pH gradients, combining laboratory assays with nonlinear modeling. kinetics were analyzed using logistic functions within the generalized additive models for location, scale, and shape (GAMLSS) framework, while residual variability was assessed through linear mixed-effects modeling to quantify fixed and random effects.
Results: The two-step approach yielded robust estimates, revealing a clear trade-off between strategies for planktonic growth and colonization. Maximum growth rates were observed at mesophilic temperatures (35–37°C) and slightly acidic to neutral pH, whereas biofilm formation increased under alkaline conditions (pH ≥ 8) and across a broader thermal range.
Discussion: Our findings highlight suggests a coordinated interplay among bacterial proliferation, migration and colonization strategies in dynamic environments. The predictive quality of the GAMLSS models enabled extrapolation of laboratory patterns to realistic ecosystem scenarios, demonstrating their potential for both environmental forecasting, marine microbial and biotechnology studies. This integrative framework bridges marine microbiology with marine ecology.
1 Introduction
Ocean acidification and warming are reshaping marine ecosystems by altering chemical and physical parameters that are critical for microbial life (Talukder et al., 2022). Rising atmospheric CO2 decreases seawater pH, disrupting metabolic functions, enzymatic activity, and microbial community structure (Doney et al., 2009; Hofmann et al., 2010). Temperature and pH are fundamental environmental parameters that critically influence the physiology of marine bacteria and their ecological strategies for biomass production and biofilm formation. In Vibrio parahaemolyticus, optimal growth temperatures are positively associated with increased cellular adhesion and biofilm development (Billaud et al., 2022). Conversely, the eurythermic species Cobetia marina exhibits biofilm formation across a broad temperature range, particularly under lower temperature conditions (Dinamarca et al., 2025b). Similar trends have been observed under reduced pH levels, which further modulate biofilm stability and structure (Zhai et al., 2023). These environmental stressors influence both the metabolism and physiology of pathogenic and nonpathogenic marine bacteria, and play a pivotal role in determining the structural integrity and long-term persistence of biofilms—key elements for microbial survival and ecological interactions within marine ecosystems.
Given the fundamental role of biofilms in marine ecosystems—particularly in surface colonization, nutrient cycling, and microbial succession (Cooney et al., 2024)—a deeper understanding of their formation and persistence under environmental stress is critical. Prototypical species such as Cobetia marina have emerged as robust model organisms due to their dual capacity for planktonic growth and efficient surface colonization (Guo et al., 2018), making them ideal candidates for studying biofilm dynamics in fluctuating marine conditions.
The quantitative analysis of microbial growth and biofilm formation under environmental drivers such as pH and temperature highlights the need for statistical frameworks that can accommodate nonnormality, overdispersion, and unbalanced designs in biological data. For instance, Dinamarca et al. (2025b) used nonstandard ANOVA-like methods to evaluate temperature-dependent biofilm formation in Cobetia marina, demonstrating the feasibility of flexible approaches under biologically complex conditions. More generally, hybrid strategies that combine interpretable modeling frameworks with distributional flexibility have proven useful in capturing nonlinear responses and heteroscedastic variability (Dinamarca et al., 2025c; Rojas et al., 2025).
Modeling microbial responses to abiotic gradients requires approaches that can capture nonlinear growth dynamics while accounting for both biological and technical variability (Yang et al., 2022). Similar nonlinear frameworks have also been applied in operational contexts such as pharmaceutical supply chains, where demand is dynamic and uncertain (Rojas et al., 2019). These cross-disciplinary experiences highlight the utility of stochastic and hierarchical models for representing complex behaviors across systems.
In microbial ecophysiology, logistic models are especially valuable because they capture key growth phases (lag, exponential, stationary) through parameters with direct biological interpretation (Zwietering et al., 1990; Baranyi and Roberts, 1994). Their ability to estimate maximum growth rate, asymptotic density, and adaptation time makes them a foundational tool for analyzing microbial responses to selective pressures. Temperature, for instance, has been shown to significantly reduce the asymptotic OD600, reflecting thermal stress that limits carrying capacity and elicits physiological adaptation (Georgiades et al., 2023).
Although mixed-effects models are widely applied in ecology and experimental biology, their use in microbial growth—and especially biofilm formation—remains limited (Harrison et al., 2018; Bridier et al., 2011). Ignoring the nested structure of microbiological data (e.g., replicates in microplates) risks biased inference, particularly under nonlinear responses and variance heterogeneity (Stoffel et al., 2021). In this context, we ask: How do seawater pH and temperature modulate the growth dynamics and biofilm-forming capacity of Cobetia sp., and to what extent can nonlinear and hierarchical models help quantify both fixed and random components of variability?
We hypothesize that both environmental variables significantly affect asymptotic density, growth rate, and biofilm production of Cobetia sp., exhibiting nonlinear and interactive effects. We further expect that part of the variability reflects replicate-specific responses, which can be formally assessed using residual-based mixed modeling.
The remainder of this paper is organized as follows: Section 2 details the experimental setup and statistical modeling strategies. Section 3 presents results for growth kinetics and biofilm analyses under pH and temperature variation. Section 4 discusses ecological and methodological implications of our findings and outlines future directions.
2 Methodology
2.1 Experimental design and data sources
The growth kinetics of Cobetia sp. MM1IDA2H-1 were evaluated under the seawater temperatures ranging from 35°C to 42°C and pH levels from 5.0 to 8.0, while biofilm formation assays encompassed a broader range, from 8°C to 42°C for temperature and 4.5 to 9.5 for pH. Cultures of Cobetia sp. MM1IDA2H-1 were grown in a complex marine broth for oligothrophic bacteria composed of (per liter): yeast extract, 1.0 g; tryptone, 5.0 g; and filtered, sterilized seawater obtained from the Chilean coast at Montemar, Valparaíso, Pacific Ocean (32°57′24″ S, 71°33′10″ W). Additionally, in selected experiments, growth assays in defined media, M9 medium was used, containing the following formulation (per liter): 6.78 g Na2HPO4, 3.0 g KH2PO4, 0.5 g NaCl, and 1.0 g NH4Cl, supplemented with 3% NaCl to simulate marine conditions. Plates were incubated at each selected temperature using a spectrophotometer equipped with temperature and agitation control (Tecan Infinite 200 Pro, serial number: 1310009538), ensuring continuous shaking and aeration during growth.
Growth kinetics were assessed using a spectrophotometer equipped with incubation and temperature control. Optical density at 600 nm (OD600) was recorded every 15 min over approximately 63 h (80 cycles). These time-resolved measurements, conducted under varying pH and temperature conditions, enabled the construction of detailed growth curves for subsequent modeling of environmental effects.
Biofilm formation was quantified using polystyrene microplates, where cells were incubated under the specified temperature and pH conditions. After incubation, biofilms were stained and quantified by absorbance measurements, enabling the assessment of sessile growth responses across the tested gradients. The biofilms produced by Cobetia sp. MM1IDA2H-1 at different temperatures and pH levels were measured by the crystal violet method (O’Toole and Kolter, 1998) using polyvinyl chloride 96-well microplates. Plates were incubated at each selected temperature in a spectrophotometer equipped with temperature and agitation control (Tecan Infinite 200 Pro, serial number: 1310009538). After incubation, plates were stained with crystal violet, rinsed twice with sterile water, and treated with acetic acid in ethanol to measure absorbance, following (O’Toole and Kolter, 1998).
To quantify the influence of pH and temperature on growth dynamics, we fitted nonlinear logistic models parameterized with biologically interpretable components (asymptote, inflection point, growth rate). These models were estimated using the nonlinear GAMLSS framework, allowing covariates to affect both the location and dispersion of the growth response. Separate models were fitted for temperature and pH. To assess potential residual variability attributable to biological or technical replicates (e.g., individual wells), we analyzed the residuals from the GAMLSS models using linear mixed-effects models (“lmer”) with random intercepts for replicate wells.
Biofilm formation was assessed under controlled culture conditions through independent experiments designed to evaluate the effects of varying temperature and pH. Assays were performed during both the exponential and stationary growth phases to capture distinct physiological states. Biofilms were quantified using the crystal violet staining method in 96-well polyvinyl chloride microplates, with all measurements conducted in triplicate. Optical density (OD) at 540 nm was recorded for each well to determine biofilm biomass, while OD at 600 nm was previously measured for the same wells to obtain corresponding growth kinetics. For temperature variation assays, the culture pH was maintained at 7.5, whereas for pH variation assays, the incubation temperature was held constant at 35°C.
Biofilm data were modeled using nonlinear least squares (NLS) to fit unimodal Gaussian-shaped curves as a function of temperature or pH. In a final analytical stage, the relationship between biofilm formation and estimated maximum growth rate (µmax) was explored using GAMLSS models incorporating environmental covariates as interacting predictors. As in the growth analysis, residual variability in these models was evaluated using mixed-effects modeling.
The integrated dataset thus includes:
● Growth curve data: Background-corrected OD600 values measured over time, along with associated pH, temperature, and replicate information.
● Biofilm data: Final absorbance values from crystal violet staining, measured separately as functions of pH and temperature.
This experimental and analytical framework enabled the evaluation of both short-term planktonic growth and longer-term biofilm formation of Cobetia sp. under environmentally relevant stressors, while accounting for replicate-level variability.
All datasets and R scripts used in this study are publicly available at: https://doi.org/10.5281/zenodo.15863458.
2.2 Mathematical background and modeling strategy
Bacterial growth was modeled using a sigmoidal logistic function, which captures the three main phases of microbial development: lag, exponential, and stationary. The general form of the growth model is given in Equation 1:
Where:
● A is the asymptotic maximum OD, reflecting the carrying capacity,
● xmid is the inflection point of the growth curve (in log-time),
● s is a scale parameter related to the steepness of the curve.
This formulation was selected because it provides parameters with direct biological interpretation and is well-suited to growth data collected over time. Biologically, the parameter xmid represents the time point at which the bacterial population reaches half of its maximum density, corresponding to the inflection of the growth curve and therefore reflecting the duration of the adaptation (lag) phase. The scale parameter s determines the steepness of the curve around this inflection point, which is directly related to the rate of transition between exponential growth and the stationary phase. Together, these parameters provide interpretable measures of microbial physiology under environmental stress.
2.2.1 Nonlinear GAMLSS: a flexible modeling framework
We adopted a hierarchical framework that combines nonlinear growth models with residual-based mixed-effects modeling. Growth curves were described with biologically interpretable logistic functions, incorporating seawater temperature and pH as covariates, and estimated using nonlinear generalized additive models for location, scale, and shape (GAMLSS) (Rigby and Stasinopoulos, 2005), which allow simultaneous modeling of mean and dispersion while handling heteroscedasticity.
A key advantage of GAMLSS is that it does not require the response variable to follow a normal distribution. Instead, it supports a wide family of distributions from the exponential family and beyond (e.g., Normal, Gamma, t-distribution, Zero-Inflated models), making it particularly suitable when residuals exhibit skewness, kurtosis, or heteroscedasticity. Additionally, GAMLSS supports diverse link functions, nonparametric smoothers such as splines, piecewise (segmented) functions, and nonlinear predictors, making it highly adaptable to complex biological data.
In our case, the logistic growth function was used as a nonlinear predictor for the location parameter µ(t), while environmental covariates were incorporated into both the location and dispersion parameters given in Equations 2, 3, respectively:
Where Z denotes either standardized pH or standardized temperature, and σ is the dispersion (scale) parameter of the selected distribution (e.g., Normal, Student’s t). These models were fitted using the nlgamlss() function in R, allowing simultaneous estimation of fixed covariate effects and time-dependent heteroscedasticity. Models have been validated by linear and nonlinear performance metrics, demonstrating good fitness quality.
2.2.2 Estimation of maximum growth rate
The maximal growth rate µmax was derived analytically from the fitted logistic curve. For a standard three-parameter logistic function, the first derivative with respect to log-time reaches its maximum at the inflection point, and the rate is given by Equation 4:
This expression is valid under the assumption that the response follows the logistic form given in Eq. (1). µmax was computed for each growth curve (e.g., per replicate or condition) and later used as a covariate in models of biofilm formation.
2.2.3 Use of nonlinear least squares
In cases where the data consisted of a single response value per condition—such as the biofilm formation data measured at discrete levels of temperature or pH—we used NLS to fit unimodal Gaussian-shaped curves of the form given in Equation 5:
Here, x is the environmental variable (pH or temperature), and A, m, and s represent the amplitude, optimal condition, and spread of the response, respectively. In our study, the Biofilm response variable corresponds to the normalized biofilm index (OD540/OD600), obtained as the absorbance of crystal violet staining (OD540) divided by the final planktonic density (OD600) of the culture. This ratio is dimensionless, and therefore Eq. (5) is expressed without explicit units. NLS was preferred in these cases due to the low number of replicates and the lack of temporal structure in the data.
2.2.4 Biofilm modeling
For biofilm research, Gaussian models provide a compact representation of unimodal responses to environmental gradients such as pH and temperature. They capture optimal conditions where performance peaks at intermediate values and declines toward extremes (Kragh et al., 2016). This bell-shaped behavior, shaped by physiological constraints, is consistently observed in both marine and clinical biofilms. In Dinamarca et al. (2025a), fractional models of growth are used, which allow for greater precision by respecting data dispersion under suboptimal conditions. In our study, biofilm formation was modeled with NLS using Gaussian response functions, fitted independently across pH and temperature gradients (Pinheiro and Bates, 2000; West et al., 2015).
2.2.5 Residual-based linear mixed-effects modeling
While GAMLSS and NLS allow flexible modeling of the mean and variance structures, they do not incorporate random effects directly. To evaluate whether unexplained replicate-level variability remained in the data, we extracted standardized (quantile) residuals from each model and analyzed them using linear mixed-effects models. Here, replicate-level variability refers specifically to differences among individual wells in the 96-well plates, each well representing an independent biological replicate under the tested condition, rather than aggregated averages across wells. Equation 6 – introduces the residual term in the model:
with representing the random intercept for replicate k, and ϵik the residual error. This approach allowed us to partition the residual variance into marginal (fixed) and conditional (fixed + random) components, providing insight into the contribution of well-to-well or replicate-specific effects.
2.2.6 Modeling the relationship between growth and biofilm
To assess whether biofilm formation was associated with bacterial growth dynamics under environmental stress, we modeled ODBiofilm as a function of the estimated µmax, in interaction with either pH or temperature. These models were formulated as GAMLSS, allowing flexible distributions for the response variable and inclusion of nonlinear or interaction terms.
Specifically, we considered models of the form given in Equation 7:
Where:
● is the location parameter (mean) of the distribution modeling ODBiofilm,
● is the maximal growth rate estimated from logistic fits,
● represents either standardized pH or temperature (modeled separately),
● captures the interaction effect between growth rate and environmental condition.
The error distribution for ODBiofilm was selected based on residual diagnostics and flexibility to accommodate nonnormality. All models were fitted using the gamlss() function in R, and the presence of random replicate-level effects was evaluated post hoc by applying linear mixed-effects models to the standardized residuals.
This multistep modeling strategy—logistic curve fitting, residual analysis, and interaction modeling—enabled us to dissect the complex influence of environmental stressors on both planktonic growth and biofilm physiology in a statistically robust and biologically interpretable manner.
2.2.7 Predictive modeling frameworks
Beyond descriptive analyses, predictive modeling frameworks provide tools to anticipate microbial responses under untested environmental conditions. In this study, nonlinear GAMLSS and GAMLSS.NL models were evaluated not only as descriptive fits but also as predictive tools, enabling the study of growth and biofilm formation in ecologically realistic scenarios.
2.2.8 Extension to multinutrient effects and inhibition
The modeling framework can be directly extended to include multiple nutrients (e.g., carbon, nitrogen, phosphorus) in addition to temperature and pH. In the growth models, the single covariate can be replaced by a vector of covariates with main effects and interactions (e.g., ). Within GAMLSS, these effects can enter both the location and dispersion submodels (e.g., ), and nonlinearity can be handled via smoothers or nonlinear predictors.
To capture nutrient inhibition, mechanistic terms can be incorporated in the nonlinear predictor, e.g., a Haldane/Monod-inhibition form for a limiting substrate S, or an Emax with inhibitory Hill component. These inhibition terms can be embedded in nlgamlss() through a user-defined nonlinear function with estimable (KS, KI) parameters. When multiple nutrients act jointly, either Liebig-type “minimum” logic or multiplicative Monod terms can be specified, depending on the biological hypothesis.
For biofilm responses, the univariate Gaussian curve in Eq. 5 can be generalized to a multivariate unimodal surface in (Temp, pH, C, N, P), for example, using a separable product of Gaussians or a full quadratic form (elliptical peak), fitted by NLS in the same way.
From a practical standpoint, we recommend penalized smooth interactions (e.g., tensor-product smooths) for flexible yet regularized effects across Temp–pH–nutrient axes, and block-wise cross-validation extended along the added covariate axes to preserve out-of-sample evaluation.
2.2.9 Cross-validation strategy
To evaluate out-of-sample predictive performance, we implemented cross-validation strategies tailored to each analysis. For growth curves (OD600 over time), we applied block-wise cross-validation along the time axis within each environmental condition (temperature or pH). Each fold was trained on ∼65% of the time points (at least 30) and tested on contiguous held-out segments, preserving the temporal ordering of growth. For the biofilm–pH relationship, we focused on the exponential phase, fitting Gaussian response models and assessing predictive accuracy by block-wise cross-validation along the pH axis. For the growth→biofilm mapping (OD600 as predictor of OD540/600 under temperature), we also used block-wise cross-validation in the OD600 domain. Predictive accuracy was quantified on held-out data using root mean square error (RMSE), Mean Absolute Error (MAE), and pseudo-R2. When model calibration on training subsets was unstable, fallback fits were applied to ensure robust predictions.
2.3 R code for growth and biofilm modeling
The implementation steps for parameter optimization and convergence diagnostics are summarized in Algorithm 1.
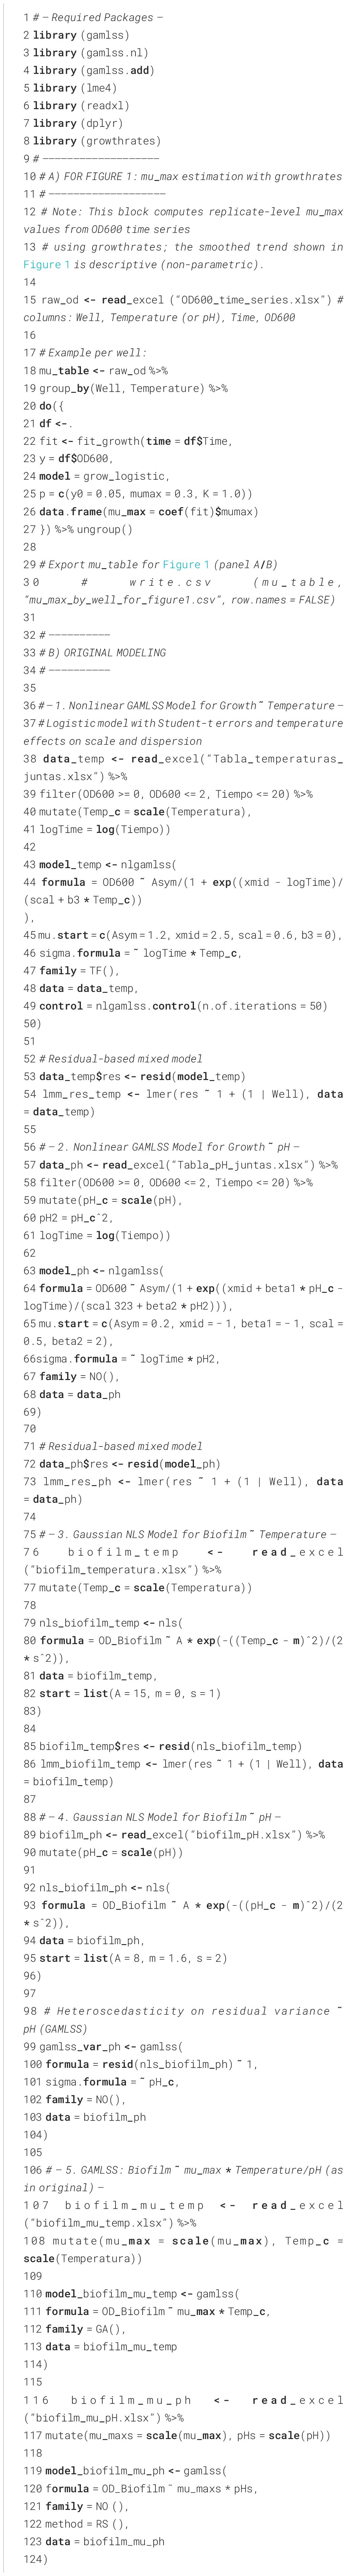
Algorithm 1. Listing 1R script: original modeling (GAMLSS/NLS) and growth rate calculation.
2.4 Workflow overview
1. Empirical patterns linking biofilm formation and maximum growth rate: Estimate replicate-level µmax from OD600 time series with growth rates (R), see (Petzoldt, 2022), and display nonparametric smoothed trends with 95% confidence intervals (CIs).
2. Data preparation: Load OD and biofilm data, filter invalid values, convert formats, and standardize time scales and units (OD600).
3. Growth modeling (GAMLSS.NL): Fit flexible nonlinear logistic models to OD600 using nlgamlss, allowing different shapes, inflection points, and residual structures (Stasinopoulos et al., 2015).
4. Residual modeling (LMM): Fit linear mixed-effects models to residuals from GAMLSS.NL to assess replicate-level variability (Bates et al., 2015).
5. Biofilm modeling (NLS + LMM): Use Gaussian NLS fits for unimodal biofilm response (OD540/OD600) versus temperature and pH; fit LMMs on residuals for replicate effects.
6. Linking growth and biofilm (GAMLSS): Model biofilm as a function of µmax and environmental covariates (pH or temperature) using flexible distributions.
7. Diagnostics: Assess model fit with R2, residual plots, convergence, and compare marginal versus conditional variance explained.
8. Predictive performance: Models were tested for their predictive performance across pH and temperature ranges to evaluate their utility in ecological and biotechnological applications.
9. Synthesis: Interpret the ecological and physiological relevance of growth–biofilm relationships under stressor gradients.
3 Results
3.1 Empirical patterns linking biofilm formation and maximum growth rate
Figure 1 provides a joint view of biofilm formation and µmax across the tested temperature (Figure 1A) and pH (Figure 1B) gradients. Biofilm formation is represented as boxplots of OD540/OD600, while µmax was estimated using the growth rates package in R (see Petzoldt, 2022), and depicted as smoothed trends with 95% confidence intervals. These estimates, derived independently from the GAMLSS-based models applied in this study, are shown as a complementary perspective of the physiological response. This integrated representation highlights how environmental conditions simultaneously shape planktonic growth potential and the propensity for matrix production, setting the stage for the detailed results described below.
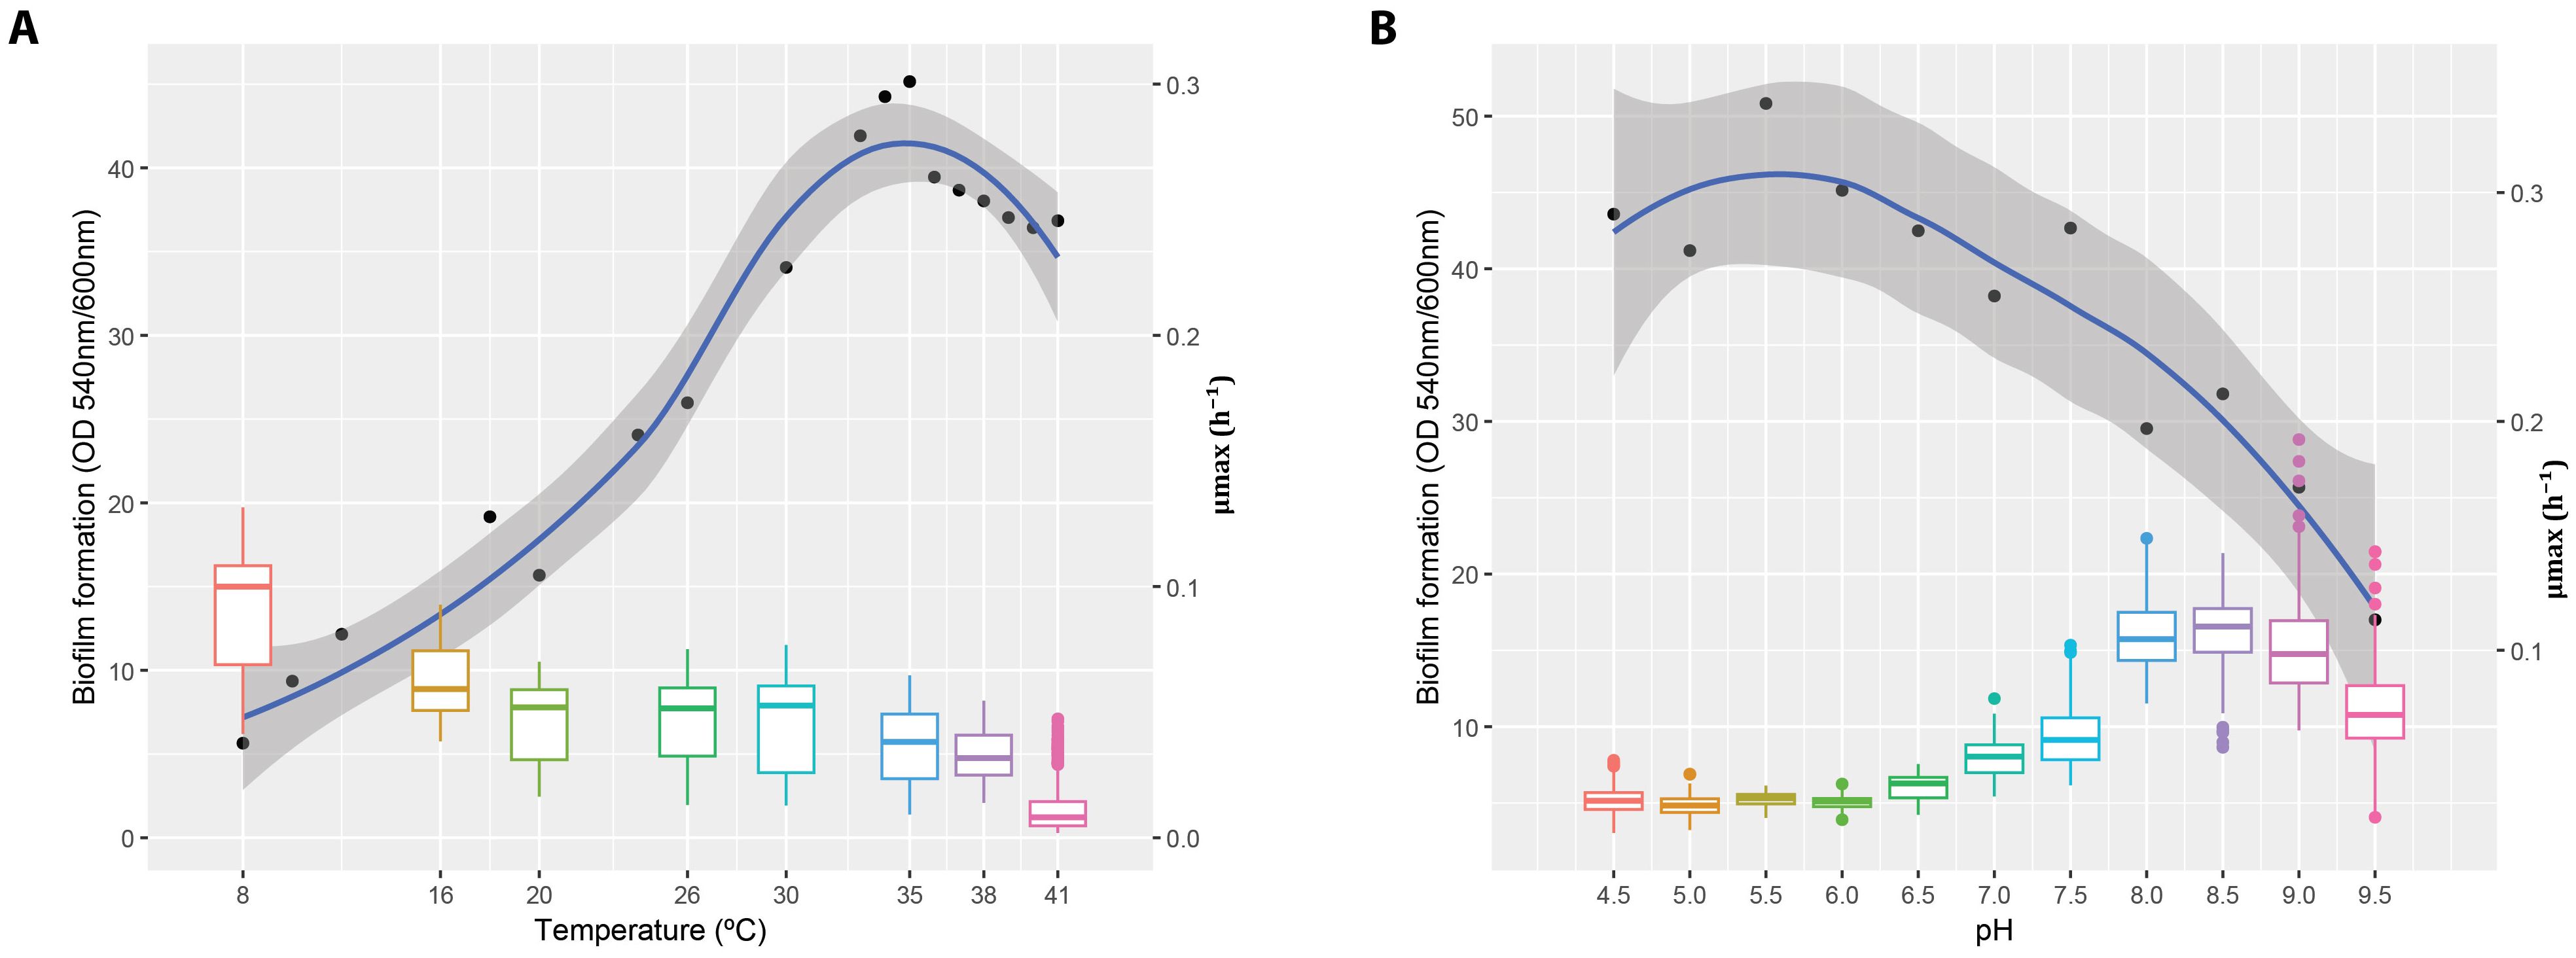
Figure 1. Biofilm formation and maximal growth rates of Cobetia sp. MM1IDA2H-1 under varying pH and temperature conditions. The left y-axis represents biofilm formation (OD540/OD600), while the right y-axis corresponds to the maximal growth rate (µmax). Biofilm formation is displayed as boxplots aligned with the left axis, where OD540/OD600 ratios indicate biofilm biomass measured at different temperatures (A) and pH levels (B). Smoothed blue curves on the right axis show µmax values calculated from the exponential growth phase using the growth rates package in R, with shaded areas indicating 95% confidence intervals. This integrated representation highlights the inverse relationship between planktonic growth and biofilm formation across both environmental gradients.
Figure 1A reveals a clear unimodal relationship between temperature and both µmax and biofilm production. The maximum growth rate increases with temperature, peaking between 35°C and 38°C, and declines at 41°C. In contrast, biofilm formation decreases with increasing temperature, indicating that higher thermal conditions limit surface-associated growth. These trends are consistent with the GAMLSS-based model results, reinforcing temperature as a primary driver of bacterial physiological activity.
Figure 1B shows a negative association between pH and µmax: as seawater alkalinity increases beyond pH 8.0, the maximum growth rate declines markedly. Interestingly, biofilm formation exhibits greater variability under alkaline conditions and appears to increase despite the reduction in µmax. This decoupling suggests that, under certain stress-inducing pH levels, bacterial populations may divert metabolic resources from exponential growth toward survival strategies such as biofilm formation. These findings support the hypothesis that biofilm development can be promoted under suboptimal growth conditions, as a protective adaptation to environmental stress.
Together, these plots provide ecological context for interpreting the statistical modeling results and highlight the complex interplay between growth kinetics and phenotypic plasticity in biofilm development under varying abiotic conditions.
3.2 Descriptive patterns of growth under abiotic stressors
To complement the model-based analysis, we provide a descriptive characterization of planktonic growth under different temperature and pH conditions in Tables A1 and A2, and Figures A1 and A2, respectively in Appendix 1. These figures and tables summarize OD600 trajectories and final OD600 statistics for Cobetia sp. MM1IDA2H-1 across all tested conditions. Growth was optimal at intermediate temperatures (37°C–39°C) and at moderately alkaline pH, while extreme conditions resulted in reduced growth.
3.3 Influence of environmental temperature on the planktonic growth and biofilms of Cobetia sp. MM1IDA2H-1
Table 1 presents the estimated parameters of the GAMLSS-TF model used to fit the planktonic growth of Cobetia sp. as a function of time and temperature. The model employed a nonlinear logistic structure for the mean response (optical density, OD600), where the growth scale parameter was allowed to vary linearly with temperature.
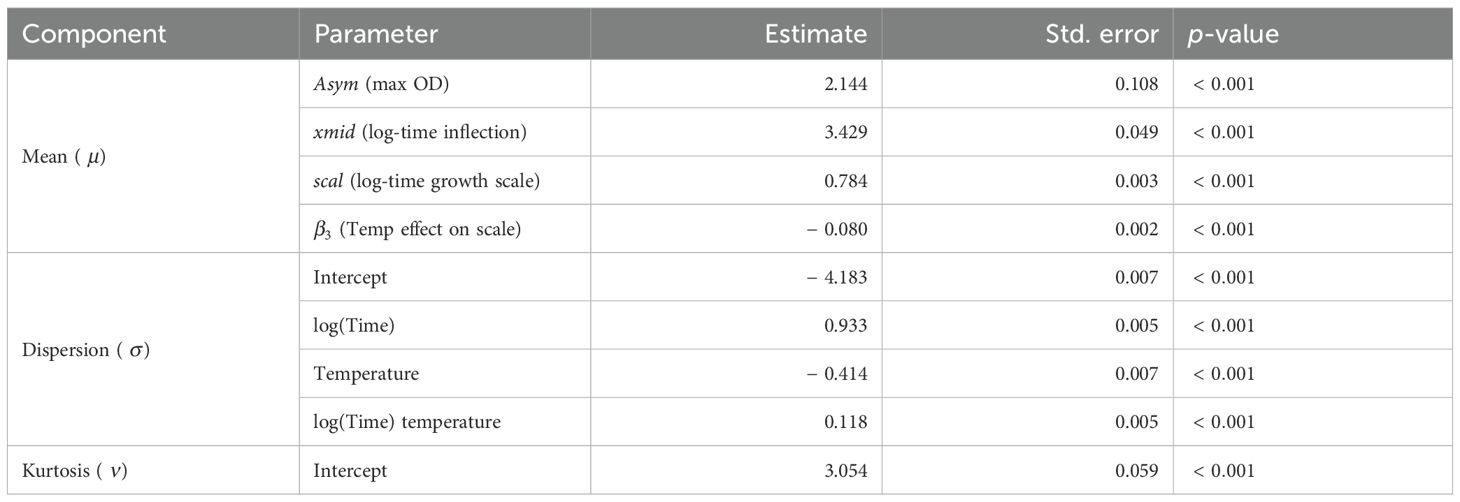
Table 1. Estimated parameters of the GAMLSS-TF model for Cobetia sp. growth across temperatures.
The estimated β3 coefficient (− 0.080, p < 0.001) indicates that increasing temperature reduces the duration of the exponential phase, i.e., growth accelerates with temperature.
In the dispersion model (σ), the negative effect of temperature (− 0.414) and the positive interaction with log(Time) (0.118) suggest heteroscedasticity: variability in OD increases over time but is modulated by temperature.
The model also accounts for heavy-tailed behavior in the residuals via the Student’s t-distribution (TF family), with an estimated ν of 3.054, indicating moderate deviations from normality. Overall, the model explains a substantial proportion of the variance (R2 = 0.67), supporting its adequacy for describing microbial growth under thermal stress.
The model includes a nonlinear logistic mean function and a log-linear variance structure, both dependent on temperature and time.
To further explore the variability not captured by the GAMLSS nonlinear model, we analyzed the standardized residuals using a linear mixed-effects model with random intercepts for the experimental units (wells). This post hoc model revealed a conditional R2 of 0.123, indicating that approximately 12.3% of the residual variance could be attributed to differences between wells. The marginal R2 was 0.000, confirming that no fixed effect was included at this stage—only random variability. These results support the existence of small but nonnegligible well-to-well heterogeneity in growth measurements, even after accounting for time and temperature effects through the nonlinear GAMLSS-TF model. This highlights the value of including random effects in experimental microbiological studies to better account for technical or biological variation across replicates.
3.4 Temperature dependence of µmax
The replicate-level estimates and smoother in Figure 2 confirm the strong dependence of the µmax on temperature, with a clear optimum at 35°C followed by a sharp decline at higher values. Consistently, Figure 1A illustrates that biofilm formation peaks under cold conditions (optimum at 8°C), while µmax reaches its maximum at 35°C. Together, these results highlight an inverse relationship between planktonic growth and fitness, suggesting a temperature-driven trade-off between proliferation and biofilm development.
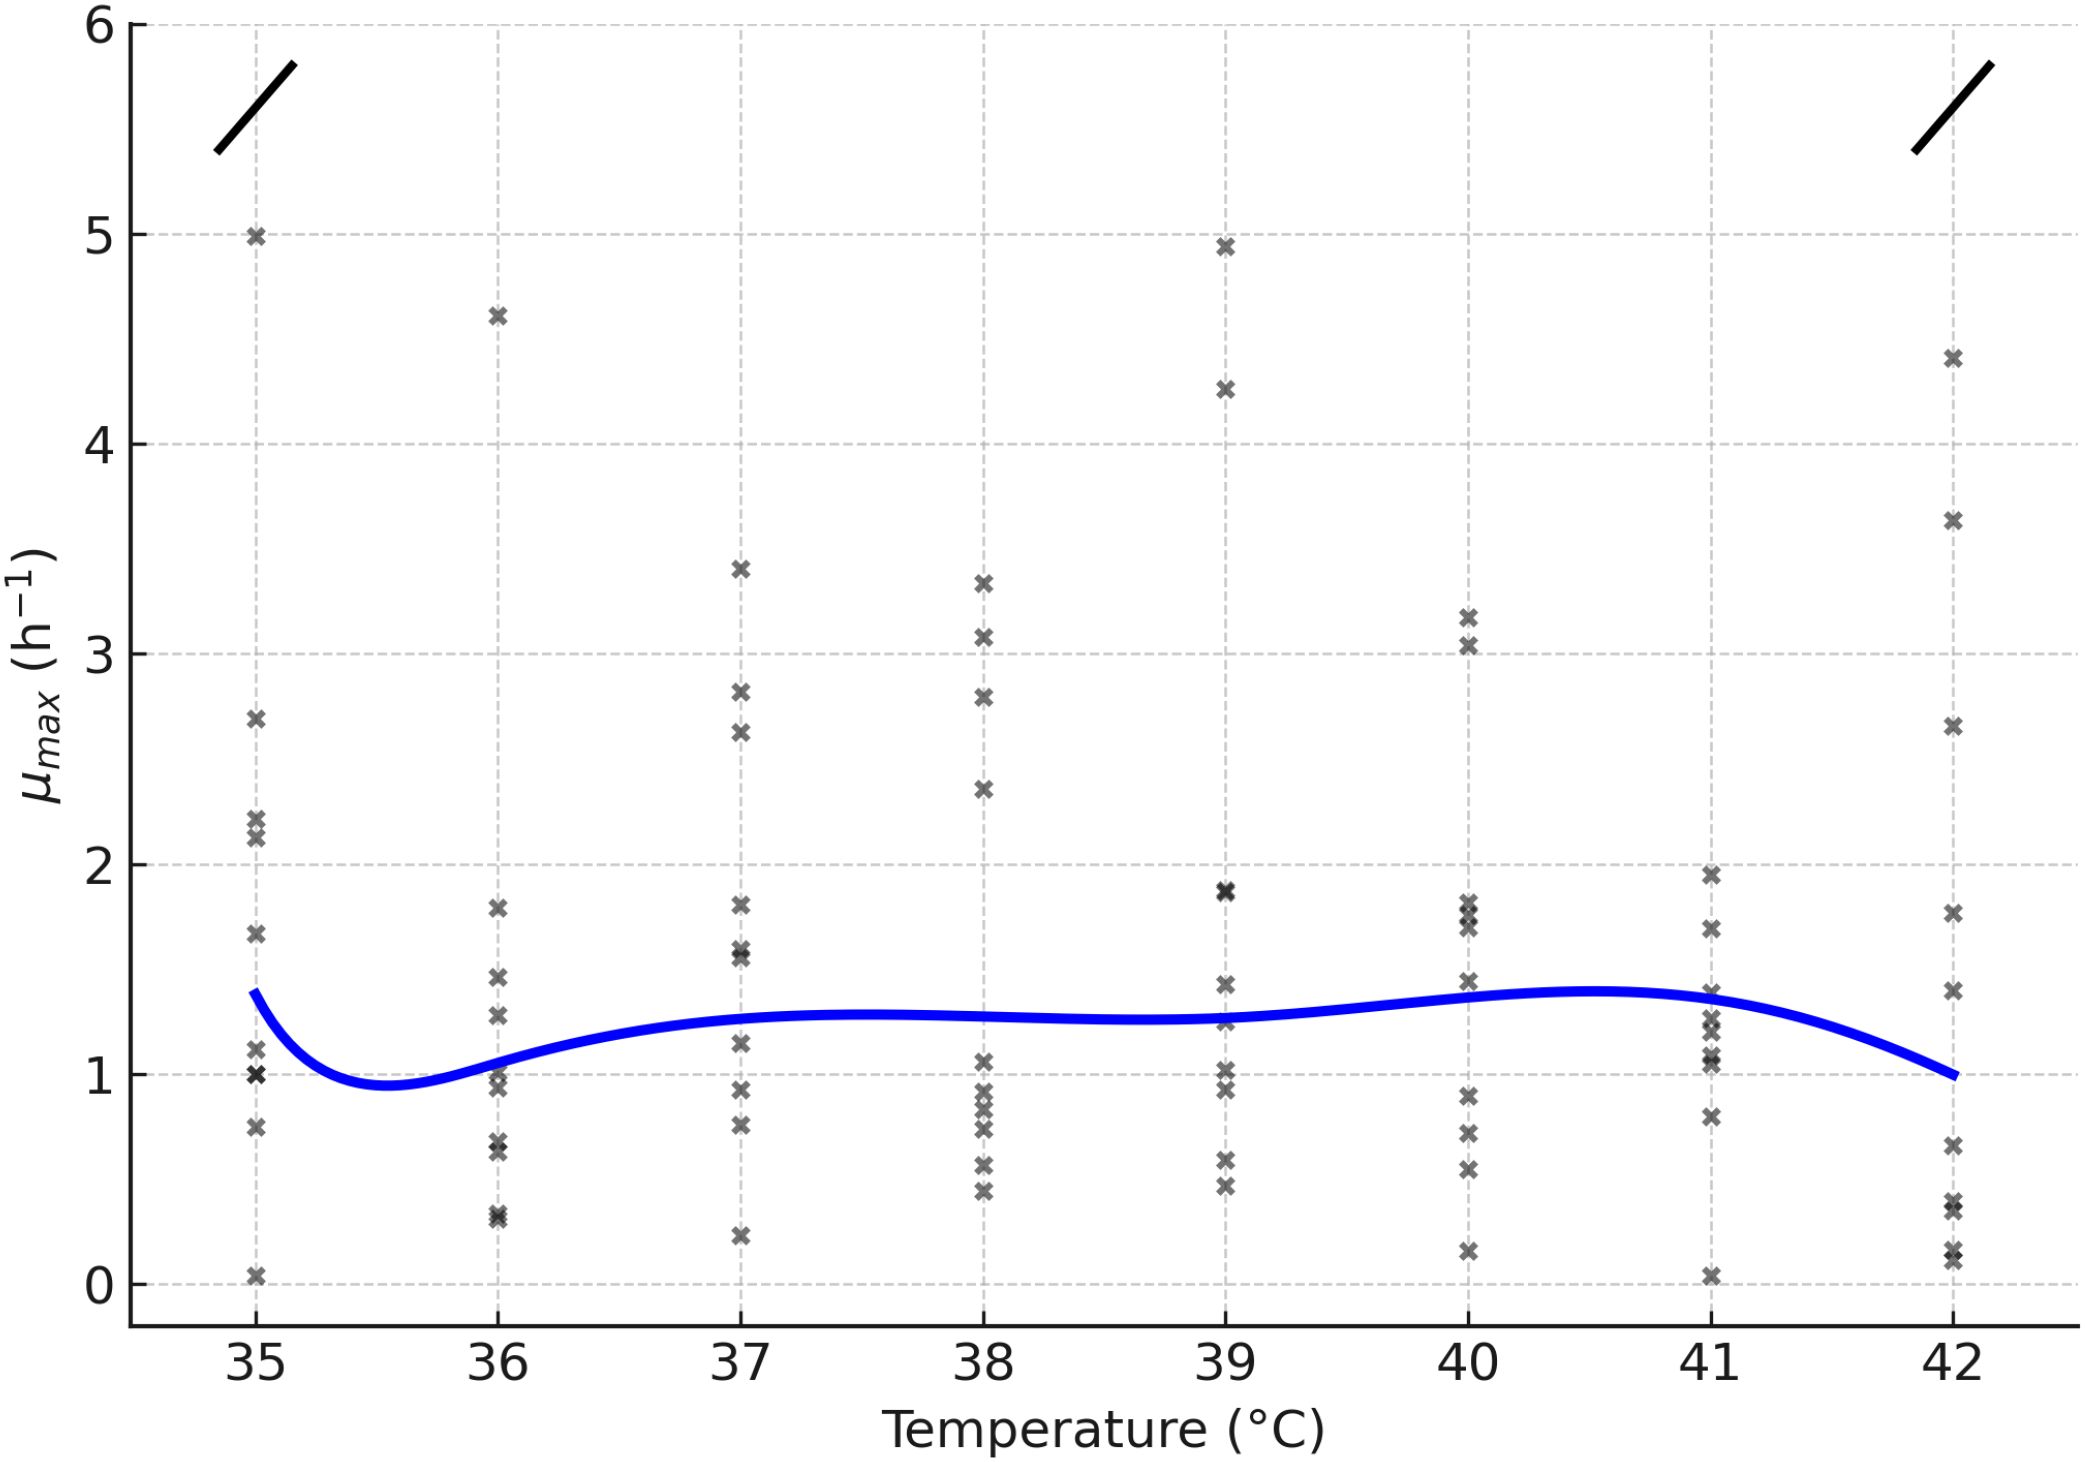
Figure 2. Relationship between maximum growth rate (µmax, h−1) and temperature. Individual replicates are shown as points, and the blue line represents the fitted trend. An axis break was introduced to avoid distortion caused by an extreme outlier, facilitating the interpretation of the main data range.
The biofilm response to environmental gradients was modeled using a Gaussian unimodal function (Eq. 5), where A is the amplitude, m the optimum, and s the spread of the response.
Table 2 summarizes the model parameters. The amplitude parameter was estimated as A = 12.68, the optimum temperature as m = 8.00°C, and the spread as s = 22.64°C. The model achieved a reasonably good fit with a residual standard error (RMSE) of 1.91 and a coefficient of determination R2 = 0.701, indicating that about 70% of the variability in biofilm index across temperatures was explained. These results confirm a unimodal relationship between temperature and biofilm production, with a peak at low temperature.
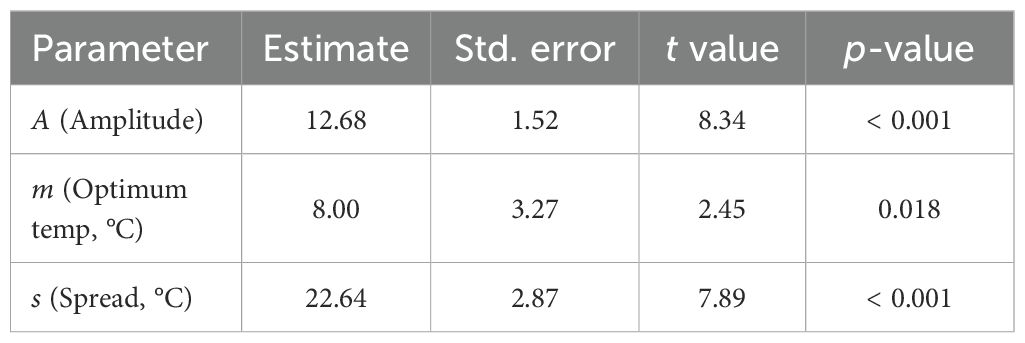
Table 2. Nonlinear Gaussian model fitted to the biofilm index as a function of temperature (free fit).
To evaluate the remaining variability due to unmodeled heterogeneity between experimental units, a linear mixed-effects model was applied to the residuals, including random intercepts for the well. This allowed each replicate well in the microplate to have its own baseline response level, accounting for well-to-well variability beyond the fixed effects of pH and temperature. The residual model yielded a conditional R2 = 0.060 and marginal R2 = 0.000, suggesting minimal unexplained variance attributable to replicate effects after adjusting for the nonlinear temperature relationship (6%). Moreover, model (1) achieved good overall performance based on validation metrics MSE, RMSE, MAE, and Symmetric Mean Absolute Percentage Error (SMAPE). For temperature, the corresponding values were 0.0056, 0.075, 0.0524, and 45.92, respectively.
To investigate whether bacterial growth rate modulates the effect of temperature on biofilm formation, we fitted a GAMLSS model including an interaction between binned values of µmax and standardized temperature (Table 3). In the interaction model (Table 3), the negative main effect of standardized temperature (β = − 3.356, p < 0.001) indicates that lower temperatures are associated with higher biofilm. In parallel, high µmax strata show markedly negative coefficients (e.g., − 2.300 and − 2.385), implying reduced biofilm at faster exponential growth. The significant positive interaction for the intermediate µmax bin (0.74, 1.05] attenuates the temperature slope (from − 3.356 to − 0.536 per + 1 SD), suggesting a compensatory regime without reversing the overall negative temperature–biofilm association. Altogether, these effects are consistent with our qualitative observation that biofilm accumulation peaks at lower temperatures (around 8°C), whereas exponential growth reaches its maximum at higher temperatures (around 35°C). This divergence highlights a trade-off between planktonic growth and biofilm formation across the thermal gradient.
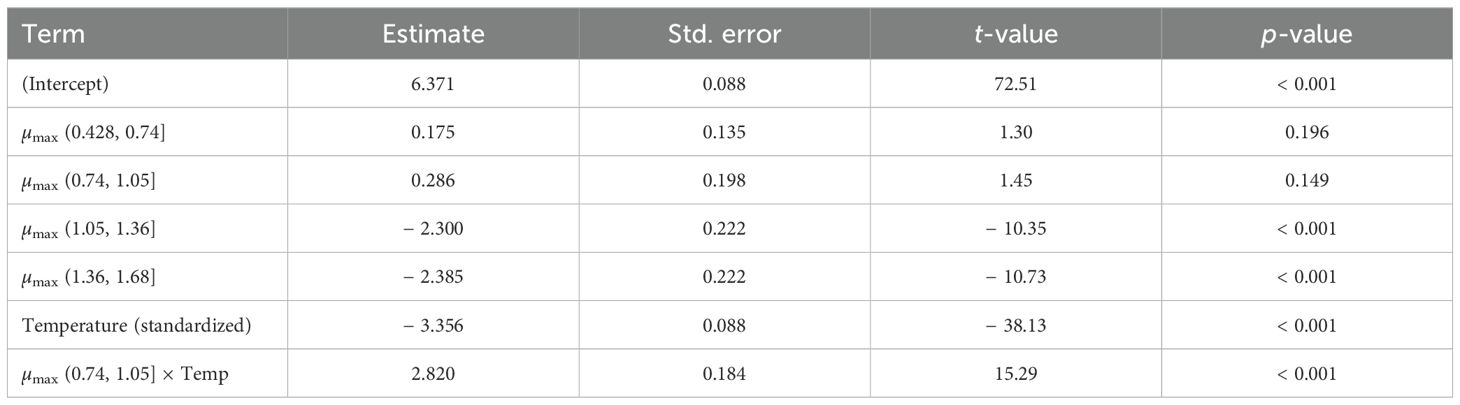
Table 3. GAMLSS model estimating the biofilm index as a function of binned µmax (growth rate) and standardized temperature, including their interaction.
Overall, the model achieved a high pseudo-R2 of 0.837, indicating strong explanatory power. However, a subsequent residual analysis using a linear mixed-effects model showed a low conditional R2 = 0.049 (4.9%), suggesting that variability due to replicate differences (well) accounted for only a small portion of the residual variance. This reinforces the robustness of the fixed-effects structure in capturing the main environmental and physiological drivers of biofilm formation.
As a justification for the nonlinear fit of model (2), we achieved good overall performance based on validation metrics MSE, RMSE, MAE, and SMAPE. For temperature, these values are $0.0050, 0.0705, 0.0501$ and $45:92$ respectively.
The interaction model (Table 3) reveals a negative main effect of standardized temperature on biofilm and negative coefficients for high µmax strata, indicating that faster exponential growth is associated with reduced fitness. Around the thermal optimum (~ 35°C), increasing temperature does not further raise µmax but is accompanied by a decline in biofilm. Conversely, cooling below the optimum slows exponential growth (lower µmax) while biofilm accumulation increases. This asymmetric thermal response aligns with the hypothesized growth–fitness trade-off under suboptimal conditions.
3.5 Asymmetric thermal response and growth–fitness trade-off
(A) Biofilm model with a 35°C hinge: We fitted a piecewise specification around 35°C while controlling for maximal growth rate:
Where dpos = max(0,T−35) and dneg = max(0,35−T). The model showed a strong negative slope above the optimum (dpos coefficient = − 0.760 OD units per + 1°C; SE = 0.047; t = − 16.02; p < 2 · 10−16), while dneg could not be estimated because no observations were available below 35°C (all dneg = 0). The smooth effect of µmax was highly significant (edf = 4.885, F = 33.56, p < 2 · 10−16). Overall fit was high (adj. R2 = 0.796, deviance explained = 79.7%, n = 850). These results indicate that, holding µmax constant, warming beyond 35°C reduces biofilm formation.
(B) Does µmax increase above 35°C? In the T > 35°C subset (two unique temperatures: 38°C and 41°C), a linear trend revealed a marked decline in maximal growth rate with additional warming:
Consistently, a categorical comparison showed versus (difference , ).
Taken together, these analyses support an asymmetric thermal response consistent with a growth–fitness trade-off. Above the growth optimum (~ 35°C), biofilm declines by ≈ 0.76 OD units per + 1°C, even after adjusting for µmax, while µmax itself decreases with further warming. In contrast, our low-temperature assays (below 35°C; reported elsewhere in the manuscript) show increased biofilm under cooler conditions, in line with slower exponential growth (lower µmax). This pattern links back to the study hypothesis by indicating that temperature modulates fitness not only through its effect on µmax, but also via a direct thermal component that becomes particularly evident beyond the optimum.
3.6 Influence of environmental pH on the planktonic growth and biofilms of Cobetia sp. MM1IDA2H-1
To analyze the influence of environmental pH on the planktonic growth of Cobetia sp. MM1IDA2H-1, we fitted a nonlinear GAMLSS model using a logistic growth function, where both the inflection point (xmid) and the scale parameter were allowed to vary with standardized pH (linear and quadratic terms, respectively). In contrast to the model fitted for temperature, this model assumed a Normal distribution of the response variable (OD600). The model achieved a pseudo-R2 of 0.262, reflecting a moderate fit and suggesting considerable biological variability in response to pH levels (Table 4).
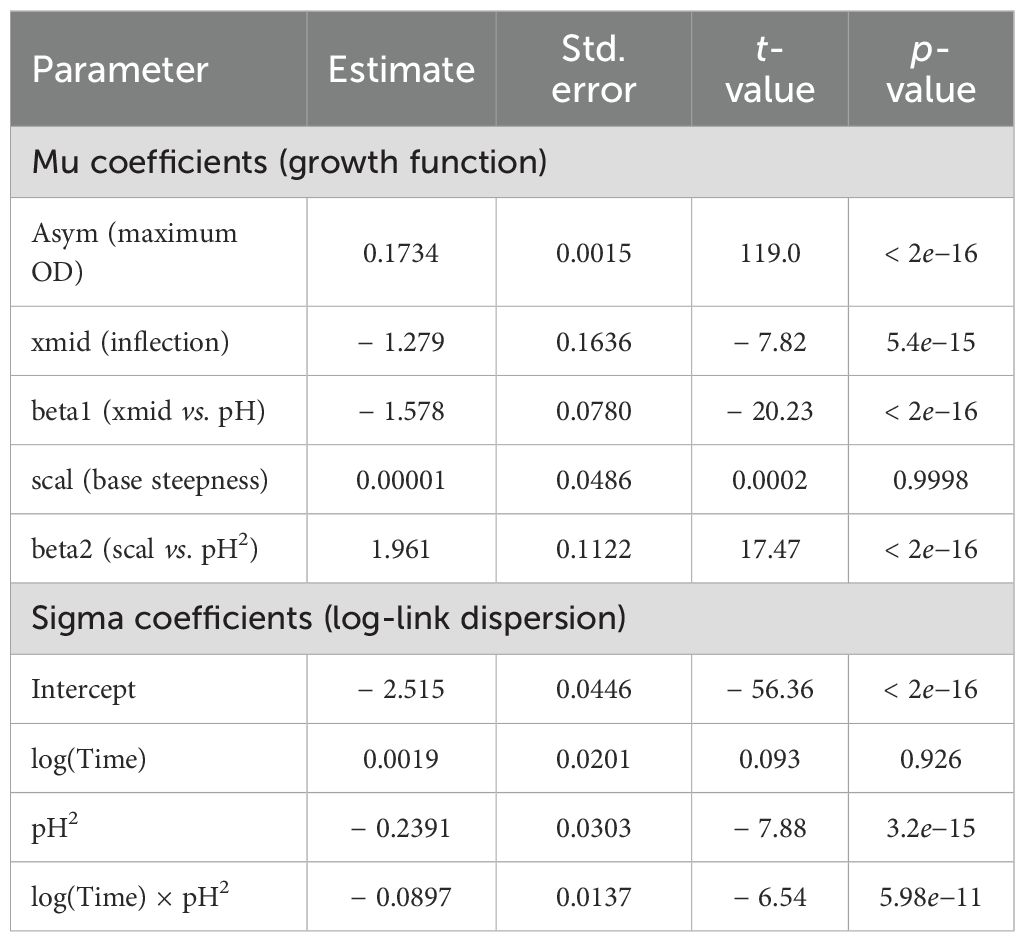
Table 4. Estimated parameters for the nonlinear GAMLSS model of the OD600 as a function of time and standardized pH.
Parameter estimates revealed a strong negative linear effect of pH on the inflection point and a significant quadratic effect on the scale parameter, indicating that both the position and steepness of the growth curve changed with pH. The dispersion parameter (sigma), modeled using a log link function, also showed significant interaction between time and pH2, suggesting heteroscedastic variance across the pH spectrum.
To quantify residual variability at the replicate level, a linear mixed-effects model was fitted to the residuals of the GAMLSS model using the well ID as a random intercept. The conditional R2 was 0.114, and the marginal R2 was 0.000, indicating that a small proportion of residual variance could be attributed to between-replicate differences.
As a justification for the nonlinear fit of model (2), we achieved good overall performance based on validation metrics MSE, RMSE, MAE, and SMAPE. For pH, the values are 0.2619, 0.0526, 0.04, and 26.6, respectively. While the logistic S-function provided a biologically interpretable framework under most conditions, its fit was limited for growth curves at extreme pH values, where trajectories became nonmonotonic, suggesting stress-induced growth inhibition or decline. In such cases, the low pseudo-R2 values indicate that the logistic model alone does not fully capture the underlying processes. Alternative approaches, such as biphasic or fractional logistic models, Richards-type curves, or models incorporating inhibition terms, could improve the representation of growth under strong stress. Therefore, the statement of “good overall performance” should be understood as applying primarily to temperature treatments and to neutral or near-neutral pH conditions, while predictive accuracy was poor across extreme pH ranges.
3.7 pH dependence of µmax
The trend depicted in Figure 3 reveals higher µmax values under mildly alkaline conditions (approximately pH 7.8–8.5), with reduced rates at more acidic or more alkaline extremes. This behavior matches the expected physiological sensitivity of marine bacteria to pH stress (Doney et al., 2009; Hofmann et al., 2010; Zhai et al., 2023).
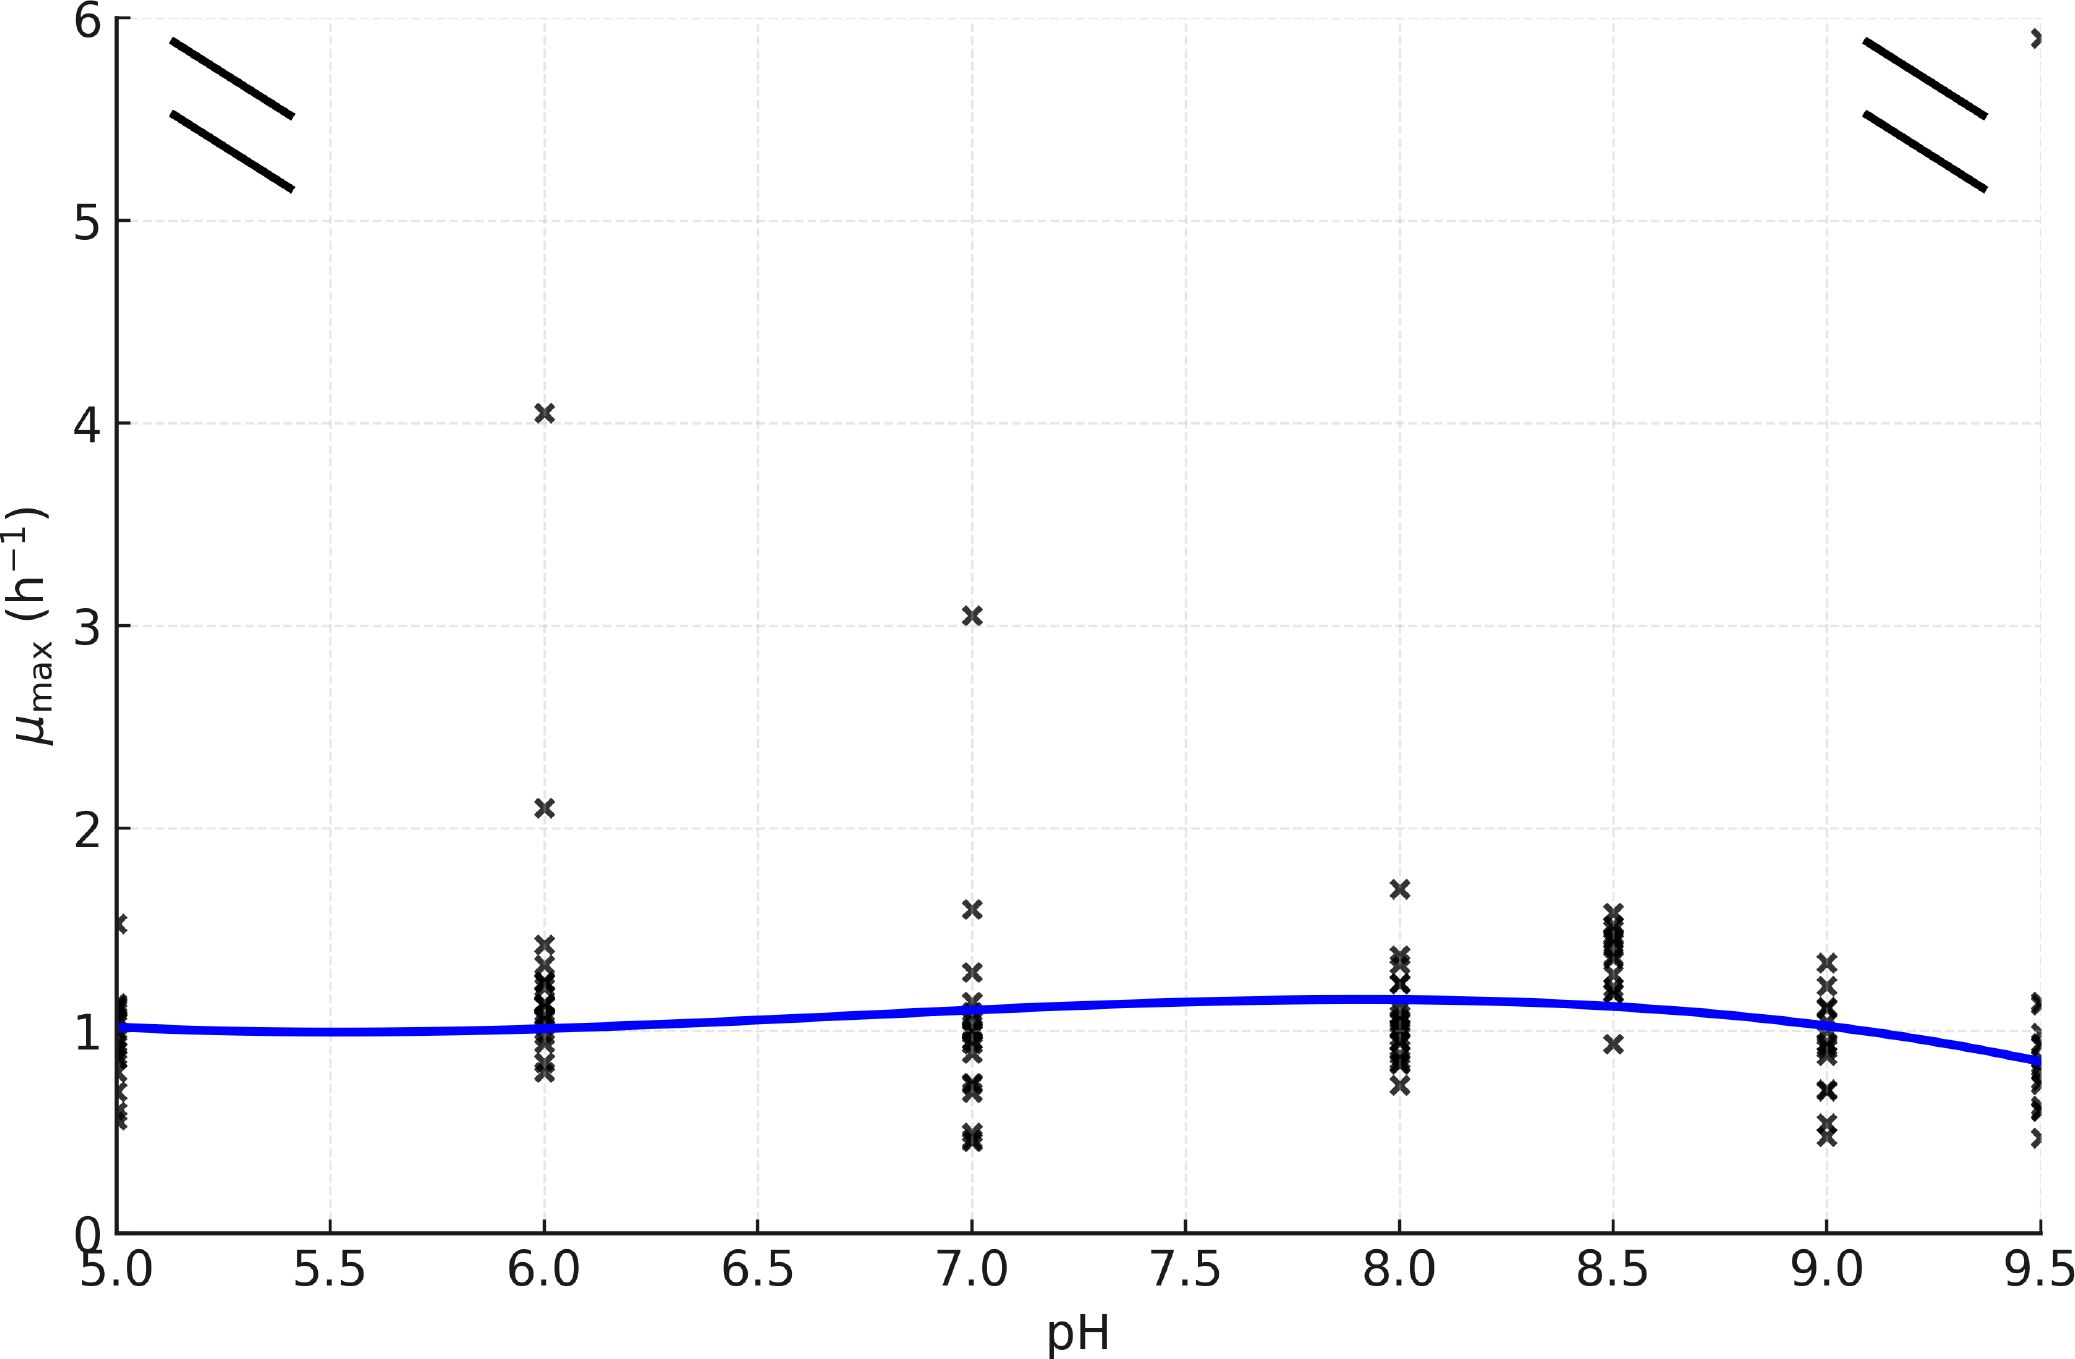
Figure 3. Relationship between maximum growth rate (µmax, h−1) and culture medium pH. Individual replicates are shown as points, and the blue line represents the fitted trend. An axis break is included to improve visualization by reducing the influence of a single high-value outlier.
To investigate the relationship between environmental pH and biofilm formation during the stationary phase, we fitted a Gaussian NLS model to describe OD540/600 as a function of centered pH (pHc). The model achieved a pseudo-R2 of 0.611, indicating a reasonably good fit and suggesting a bell-shaped pattern of biofilm response across the pH gradient.
Parameter estimates revealed that the peak of biofilm formation occurred near pHc = 1.61 (corresponding to pH 8.6), with a spread parameter s = 2.36, suggesting a broad pH tolerance (Table 5).
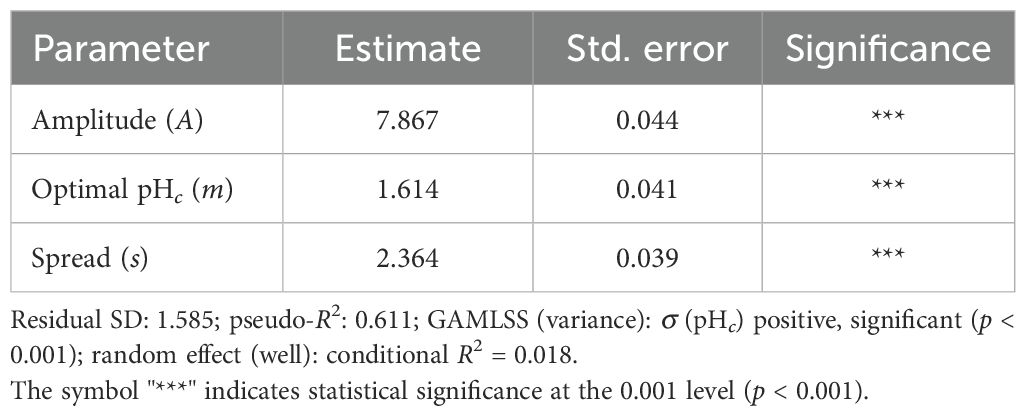
Table 5. Nonlinear least squares model (Gaussian form) describing the OD540/600 biofilm index as a function of centered pH.
To assess heteroscedasticity, we modeled the residual variance using a GAMLSS model with the sigma parameter linked to pHc. The results showed a significant positive association, indicating increasing variability in biofilm formation at higher pH levels. However, a linear mixed model on the residuals showed a negligible random effect of the replicate (well), with a conditional R2 of 0.018.
Moreover, model (1) achieved good global performance based on validation metrics MSE, RMSE, MAE, and SMAPE. For pH, the values are 0.0001, 0.0584, 0.487, and 35.98, respectively.
To further explore how planktonic growth rate and environmental pH jointly influence biofilm formation, we fitted a GAMLSS model using a Normal distribution. The model included the interaction between standardized µmax and standardized pH (pHs) as predictors of OD540/600 in the stationary phase.
The results (Table 6) showed significant main effects of both µmax and pHs, as well as a significant negative interaction. This suggests that the relationship between growth rate and biofilm formation depends on the pH context, with increasing pH amplifying the effect of lower growth rates in reducing biofilm production.
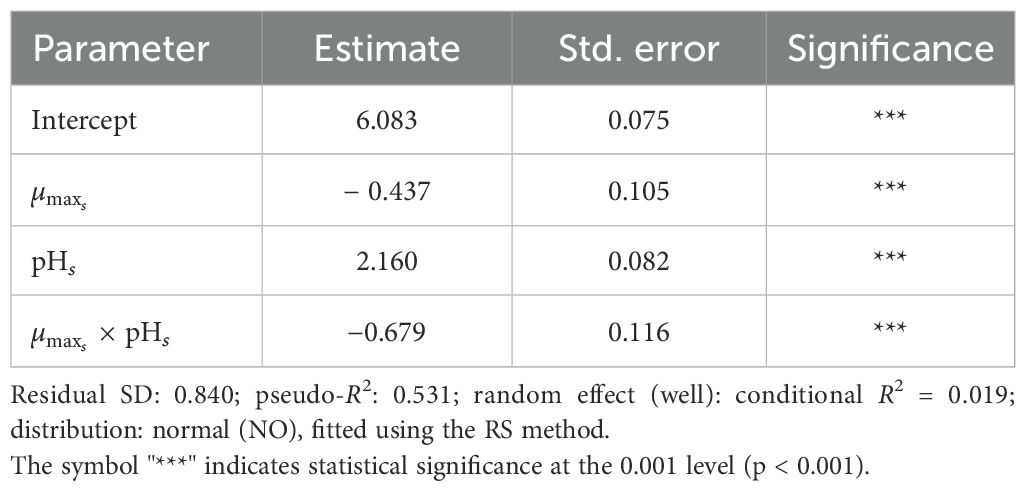
Table 6. GAMLSS model describing OD540/600 as a function of standardized maximum growth rate (), standardized pH (pHs), and their interaction.
The model achieved a pseudo-R2 of 0.531, reflecting moderate explanatory power. The residual variance was constant, and the random effect of replicate (well) was minimal, with a conditional R2 of 0.019.
3.8 Integrated response surface
The inferred surface of µmax suggests that maximal growth rates occur around the upper-mesophilic range of temperatures (high 30°C) and under mildly alkaline conditions (approximately pH 8–8.5), see Figure 4. Departures from these regions lead to gradual declines in µmax along both axes, consistent with thermal and pH stress. Importantly, this surface is inferred from marginal datasets (temperature and pH measured in separate experiments); therefore, it should be interpreted as a smooth additive approximation rather than a direct observation from a factorial design. This visualization synthesizes the two one-dimensional trends and highlights the joint region where growth is expected to be faster.
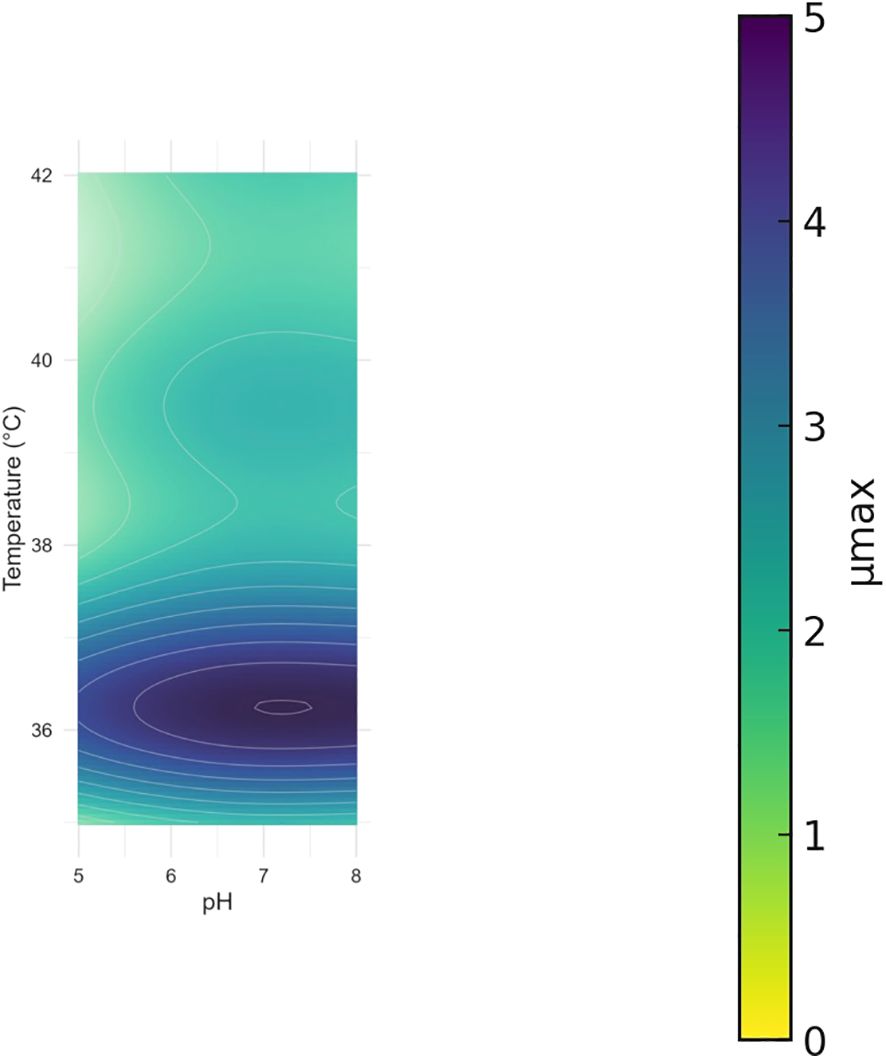
Figure 4. Inferred surface of µmax as a function of temperature and pH, constructed from marginal experiments using additive smoothers (µmax(T, pH) = c + fT(T) + fpH(pH)). Note that this surface is not based on factorial combinations but on separate temperature and pH assays.
3.9 Cross-validation results
For growth-over-time curves, block-wise CV showed high predictive performance at all temperatures, with a median pseudo-R2 of approximately 0.83 (Table 7). Across all pH conditions, predictive power was lower, with pseudo-R2 values of approximately 0.3, reflecting trajectories that were more difficult to predict variation under these treatments (Table 8).
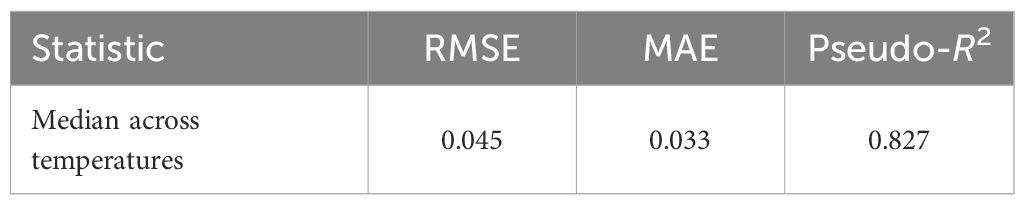
Table 7. Growth (OD600 vs. time) across temperatures, block-wise CV.
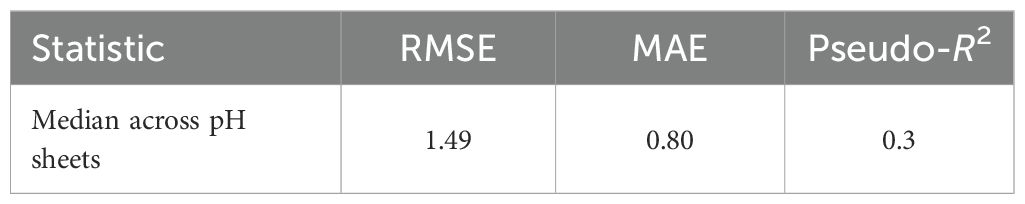
Table 8. Growth (OD600 vs. time) across pH sheets, block-wise CV.
The cross-validation analyses confirmed that the proposed models can generalize to data not used in calibration, with results varying by condition and endpoint. For the biofilm–pH relationship, we focused on the exponential phase. Block-wise CV along the pH axis showed moderate predictive accuracy (RMSE = 3.65, MAE = 3.45, pseudo-R2 = 0.33; Table 9), indicating that the Gaussian response model captures a meaningful fraction of the variability across pH conditions.
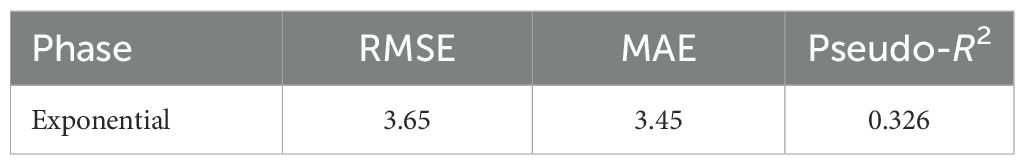
Table 9. Biofilm vs. pH (Gaussian), block-wise cross-validation, exponential phase.
For growth→biofilm under temperature, out-of-sample predictive accuracy was weak (Table 10) suggesting that biofilm formation depends on additional mechanisms beyond growth kinetics.
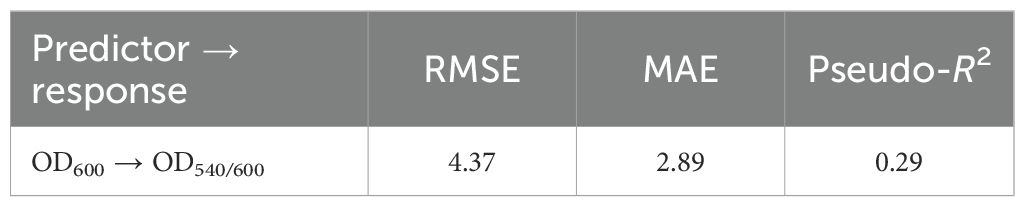
Table 10. Growth→biofilm mapping under temperature (Gaussian), block-wise CV.
4 Discussion
This study investigated the interactive effects of seawater acidification and warming on the growth kinetics and biofilm formation capacity of Cobetia sp. MM1IDA2H-1 using a flexible statistical framework. Specifically, we aimed to evaluate whether environmental factors modulate growth trajectories and biofilm production in nonlinear and potentially interacting ways. Our findings support this hypothesis and offer new insights into microbial responses under environmental changes and stress.
4.1 Growth dynamics under temperature and pH variation
We adopted logistic-type growth models to represent microbial kinetics, a well-established approach in microbiology due to its ability to capture saturation behavior in population growth (Dinamarca et al., 2025b). The shape of these curves allowed us to extract interpretable parameters such as maximum cell density and growth rate. By extending the model to include covariates and interactions, we effectively reduced the residual unexplained variability, particularly that previously attributed to replicate wells, as confirmed by the mixed-effects analysis. This strategy differs from traditional nonlinear mixed-effects modeling but offers transparency and adaptability to diverse data structures (Rojas et al., 2019).
Temperature significantly reduced the asymptotic OD600, consistent with thermal stress constraining the carrying capacity and triggering genetic and physiological adaptive responses that enable Cobetia sp. to persist across its broad thermal niche (Georgiades et al., 2023). Adaptation to low versus elevated temperatures proceeds through distinct regulatory and physiological programs: at high temperatures, impaired enzymatic performance and metabolic imbalance are observed (Hofmann et al., 2010; Billaud et al., 2022), whereas at low temperatures, cells typically adjust cytoplasmic membrane composition (homeoviscous adaptation), shift metabolic fluxes, and exhibit reduced division rates, with biofilm-level studies also confirming temperature-sensitive community restructuring (Zhai et al., 2023). pH also exerted a strong effect, with higher values modulating growth potential and altering temporal dynamics, mirroring broader observations of microbial sensitivity to ocean acidification (Doney et al., 2009; Talukder et al., 2022). The reduction in OD600 observed in Figure A1 may partly reflect a pH drift during bacterial growth, potentially linked to ammonium release from the metabolic breakdown of proteins in the complex medium. Such acidification processes are well documented in marine bacteria and can reduce optical density by altering both cell viability and medium turbidity. While our design focused on externally imposed pH levels, these endogenous shifts highlight the importance of buffering capacity and metabolic by-products in shaping growth curves. Future experiments should therefore monitor pH dynamics during cultivation to disentangle externally imposed conditions from biologically induced fluctuations.
Importantly, our results showed that in Cobetia sp. MM1IDA2H-1, pH exerted a more pronounced effect than temperature, suggesting that acidification may play a dominant role in shaping microbial population dynamics under climate change scenarios (Yu et al., 2025).
Beyond temperature and pH, the same framework can incorporate multiple nutrients as covariates (and inhibition terms) in both growth and biofilm models, enabling joint responses to multifactor gradients, while retaining interpretability via mechanistic or semimechanistic components.
4.2 Insights from biofilm formation modeling
To model biofilm formation, we employed Gaussian-type regression models that assume bell-shaped responses to environmental gradients. While such models are broadly suitable for microbial phenotypes with clear optima flanked by inhibitory extremes (Dinamarca et al., 2025b), our data reveal a marked asymmetry around the thermal optimum: cooling from the optimum toward the lower bound is associated with higher biofilm despite slower exponential growth, whereas warming above the optimum leads to a sharper reduction in biofilm. This pattern aligns with a growth–fitness trade-off under suboptimal thermal conditions (see Section 3). We note that differences in asymptotic OD (biomass) could mediate part of this signal; accordingly, future analyses should explicitly control for biomass by including the asymptotic OD as a covariate or by evaluating a biomass-normalized biofilm index (e.g., ODBiofilm/Asym). These steps would help disentangle intrinsic fitness responses from biomass-dependent measurement effects and refine the characterization of the observed asymmetry.
We found that increasing temperature above the thermal optimum had a negative impact on biofilm production: as temperature rose from the µmax peak (near 35°C) toward the upper range (38°C–41°C), biofilm levels declined, consistent with heat stress-induced suppression of fitness mechanisms and extracellular matrix synthesis (Cooney et al., 2024). Conversely, pH positively influenced biofilm absorbance, especially during exponential growth, indicating enhanced sessile behavior under less acidic conditions. Our findings support a temperature-dependent decoupling between planktonic growth rate and surface fitness: above the growth optimum, biofilm declines without a concomitant increase in µmax, whereas below the optimum, µmax decreases as biofilm increases. This pattern is consistent with a growth–fitness trade-off and reinforces the central claim that environmental forcing (temperature) modulates biofilm formation partly through, but not exclusively by, its effect on µmax.
The observed trade-off—reduced planktonic growth but increased biofilm formation at higher pH—suggests that Cobetia sp. may shift its ecological strategy depending on environmental stressors, reinforcing its adaptive plasticity (Guo et al., 2018).
4.3 Modeling strategy and reproducibility
The main methodological contribution of this study is the sequential use of nonlinear regression and residual mixed-effects modeling. This flexible approach enables the separation of fixed covariate effects from replicate-level variation, improving model fit without requiring complex NLME implementations (Dinamarca et al., 2025c; Rojas et al., 2025).
Interestingly, the magnitude of random effects was small in our experimental data, indicating high reproducibility and biological robustness in Cobetia sp. responses. Reporting such findings is essential, as most literature focuses on significant effects, potentially biasing our understanding of biological systems. Our results underscore the value of mixed-effects modeling as a standard for microbial ecophysiology, even when random effects are minimal. The predictive ability of nonlinear GAMLSS models allows for anticipating growth and biofilm formation under combinations of temperature and pH not explicitly tested in laboratory experiments. This predictive framework is particularly valuable for scaling up results to natural marine ecosystems or biotechnological processes, where experimental replication across all possible conditions is unfeasible.
The combination of nonlinear modeling and post hoc residual analysis provided robust estimates of how pH and temperature modulate microbial behavior, highlighting that this approach can disentangle environmental effects from replicate-level variability.
4.4 Cross-validation
The cross-validation results demonstrate that the models can make meaningful out-of-sample predictions in specific contexts. For the biofilm–pH relationship, predictive accuracy was moderate during the exponential phase, indicating that Gaussian response models can generalize across unseen pH conditions. In contrast, the growth→biofilm mapping under temperature showed weak predictive ability, highlighting the involvement of additional mechanisms in biofilm development. For growth curves, predictive accuracy was consistently high across most temperatures under block-wise CV, with declines only at upper thermal limits, consistent with biological stress. Across pH sheets, predictive performance remained weak, reflecting the flat and nearly indistinguishable trajectories under these treatments. Together, these analyses clarify where predictive use of the models is supported (temperature-dependent growth, exponential-phase biofilm) and where it is limited (stationary-phase biofilm, growth→biofilm, pH-dependent growth).
4.5 Ecological context and future directions
Regarding the experimental conditions and their relevance to marine ecosystems, this study utilized laboratory conditions that reflect the nutrients and environmental physical and chemical variables present in intertidal ponds, the indigenous habitats of Cobetia marina. A complex medium was used for cultivating marine oligotrophic bacteria, containing nutrients and minerals that mimic the natural conditions of seawater. These components provide the necessary nutrients for marine microorganisms while maintaining an environment similar to their natural habitat. This medium is particularly useful for studying oligotrophic bacteria, which thrive in nutrient-poor conditions, as it supports their growth without overwhelming them with excessive nutrients. Additionally, seawater was used to provide salts representative of the original habitat of the bacteria, associated with alkaline conditions, which are naturally altered by bacterial growth in a closed batch culture. This setup closely resembles the conditions of the original habitat of the bacteria, corresponding to intertidal ponds.
To situate our model in realistic ecosystem scenarios, future work should integrate environmental datasets from global ocean monitoring platforms. Open-access resources such as NOAA NCEI, Copernicus Marine Service (CMEMS), NASA Ocean Color, and the World Ocean Atlas provide high-resolution temperature and salinity data. Complementarily, pH and acidification data can be accessed from platforms such as SOCAT, GLODAP, OA-ICC, and GOA-ON.
These datasets allow the projection of colonization potential and physiological thresholds of Cobetia sp. across realistic spatiotemporal gradients. By aligning laboratory-based model parameters with field environmental conditions, it becomes possible to forecast microbial behavior under different ocean change scenarios.
Moreover, future experiments should include factorial designs combining temperature and pH effects on biofilm production. Linking growth metrics (e.g., µmax) to functional outcomes such as extracellular matrix composition will also deepen mechanistic understanding. Finally, expanding this modeling framework to multispecies communities will enhance ecological relevance (Stoffel et al., 2021).
4.6 Limitations
This study has several limitations. First, temperature and pH were tested in separate experimental designs for biofilm formation, which restricted our ability to analyze interactive effects on this phenotype. Another limitation is that the experiments were performed in a nutrient-rich marine medium rather than under the oligotrophic conditions typical of seawater. While this choice facilitated reproducible growth and biofilm assays, it does not fully replicate the resource limitations encountered in natural marine environments. Likewise, the pH was not buffered by the CO2–carbonate system that maintains ocean pH around 8.1, but instead was adjusted directly for each assay. For biofilm formation across temperature gradients, the culture pH was maintained at 7.5, whereas for assays across pH levels, the incubation temperature was kept constant at 35°C. These methodological decisions ensured controlled testing of the two stressors separately. Nonetheless, they imply that the observed responses should be interpreted as physiological potentials under simplified laboratory conditions. Future studies should aim to incorporate seawater buffering systems and nutrient-limited conditions to enhance ecological realism and better approximate the complexity of natural marine microbiomes.
Second, while the two-step modeling approach successfully captured fixed and random effects, it may not fully account for nonadditive dynamics or non-Gaussian residual distributions. Third, the physiological mechanisms underlying the observed biofilm enhancement under elevated pH remain speculative and warrant molecular-level validation. Lastly, projecting model parameters to ecosystem conditions assumes environmental homogeneity and microbial stability, which may not reflect dynamic ocean systems.
5 Conclusions
This study demonstrated that temperature and pH gradients exert distinct but interconnected effects on the growth dynamics and biofilm formation of Cobetia sp. MM1IDA2H-1. While thermal stress primarily limited the carrying capacity, pH modulated both the maximum growth rate and matrix production, with elevated values enhancing biofilm formation.
By combining nonlinear GAMLSS and mixed-effects modeling, we captured both the flexibility of growth responses and the variability across replicates, overcoming the limitations of classical logistic approaches. This methodological framework provides a robust basis for studying microbial adaptation under multifactorial stressors.
Beyond the experimental scope, the findings underscore that acidification may play a dominant role in shaping microbial dynamics under climate change scenarios. Extending these models with open oceanographic datasets could help project microbial functional responses to future environmental conditions. Finally, the adoption of predictive modeling approaches, such as GAMLSS and its nonlinear extensions, broadens the utility of our results beyond retrospective description. These models enable forecasting of microbial performance under stressor gradients, supporting both ecological inference and applied uses in food, pharmaceutical, and environmental biotechnology.
Data availability statement
The datasets presented in this study can be found in online repositories. The names of the repository/repositories and accession number(s) can be found below: https://doi.org/10.5281/zenodo.15863458.
Author contributions
MS: Resources, Writing – review & editing, Supervision, Visualization, Validation. MD: Resources, Conceptualization, Visualization, Funding acquisition, Writing – original draft. FR: Methodology, Software, Writing – original draft, Conceptualization, Formal Analysis, Project administration, Data curation. CI-Q: Writing – original draft, Validation, Investigation. KG-P: Writing – review & editing, Investigation. FF-A: Data curation, Writing – review & editing, Software. BB-M: Data curation, Software, Writing – review & editing.
Funding
The author(s) declare financial support was received for the research and/or publication of this article. Financial support was received by MAD Project from the Chilean Agencia Nacional de Investigación y Desarrollo (ANID), grant EXPLORACIÓN 13220184, and CIQ grant DIUV-CIDI 15/2024 Universidad de Valparaíso.
Acknowledgments
We acknowledge Centro de Micro-Bioinnovación, DIUV-CIDI 15/2024, Universidad de Valparaíso.
Conflict of interest
The authors declare that the research was conducted in the absence of any commercial or financial relationships that could be construed as a potential conflict of interest.
Generative AI statement
The author(s) declare that no Generative AI was used in the creation of this manuscript.
Any alternative text (alt text) provided alongside figures in this article has been generated by Frontiers with the support of artificial intelligence and reasonable efforts have been made to ensure accuracy, including review by the authors wherever possible. If you identify any issues, please contact us.
Publisher’s note
All claims expressed in this article are solely those of the authors and do not necessarily represent those of their affiliated organizations, or those of the publisher, the editors and the reviewers. Any product that may be evaluated in this article, or claim that may be made by its manufacturer, is not guaranteed or endorsed by the publisher.
References
Baranyi J. and Roberts T. A. (1994). A dynamic approach to predicting bacterial growth in food. Int. J. Food Microbiol. 23, 277–294. doi: 10.1016/0168-1605(94)90157-0
Bates D., Mächler M., Bolker B., and Walker S. (2015). Fitting linear mixed-effects models using lme4. J. Stat. Software 67, 1–48. doi: 10.18637/jss.v067.i01
Billaud M., Seneca F., Tambutté E., and Czerucka D. (2022). An increase of seawater temperature upregulates the expression of vibrio parahaemolyticus virulence factors implicated in adhesion and biofilm formation. Front. Microbiol. 13, 840628. doi: 10.3389/fmicb.2022.840628
Bridier A., Briandet R., Thomas V., and Dubois-Brissonnet F. (2011). Resistance of bacterial biofilms to disinfectants: a review. Biofouling 27, 1017–1032. doi: 10.1080/08927014.2011.626899
Cooney C., Sommer B., Marzinelli E. M., and Figueira W. F. (2024). The role of microbial biofilms in range shifts of marine habitat-forming organisms. Trends Microbiol. 32, 190–199. doi: 10.1016/j.tim.2023.07.015
Dinamarca A., Ibacache-Quiroga C., Gonzalez-Pizarro K., Kiselak J., Barraza-Morales B., Leon Schuffeneger B., et al. (2025a). Comprehensive and deep learning classification for analyses of biological complexity of growth and biofilms of cobetia marina under different temperature growths. PloS One submitted.
Dinamarca M., Ibacache-Quiroga C., González-Pizarro K., Plaza González I., Kiseľák J., Barraza-Morales B., et al. (2025b). Non-standard anova like statistical analysis of cobetia marina mm1ida2h-1 biofilm formation behavior at different temperatures. Stochastic Anal. Appl. 43 (4), 533–552. doi: 10.1080/07362994.2025.2527085
Dinamarca M., Rojas F., Ibacache-Quiroga C., and González-Pizarro K. (2025c). Modeling time series with sarimax and skew-normal and zero-inflated skew-normal errors. Mathematics 13, 1892. doi: 10.3390/math13111892
Doney S. C., Fabry V. J., Feely R. A., and Kleypas J. A. (2009). Ocean acidification: the other co2 problem. Annu. Rev. Mar. Sci. 1, 169–192. doi: 10.1146/annurev.marine.010908.163834
Georgiades E., Scianni C., and Tamburri M. N. (2023). Biofilms associated with ship submerged surfaces: implications for ship biofouling management and the environment. Front. Mar. Sci. 10. doi: 10.3389/fmars.2023.1197366
Guo P., Cao B., Qiu X., and Lin J. (2018). Draft genome sequence of the crude oil-degrading and biosurfactant-producing strain cobetia sp. qf-1. Genome Announcements 6, 10–1128. doi: 10.1128/genomeA.01456-17
Harrison X. A., Donaldson L., Correa-Cano M. E., Evans J., Fisher D. N., Goodwin C. E., et al. (2018). A brief introduction to mixed effects modelling and multi-model inference in ecology. PeerJ 6, e4794. doi: 10.7717/peerj.4794
Hofmann G. E., Barry J. P., Edmunds P. J., Gates R. D., Hutchins D. A., Klinger T., et al. (2010). The effect of ocean acidification on calcifying organisms in marine ecosystems. Oceanography 23, 36–47.
Kragh K. N., Hutchison J. B., Melaugh G., Rodesney C., Roberts A. E., Irie Y., et al. (2016). The role of multicellular aggregates in biofilm formation. mBio 7, e00237–e00216. doi: 10.1128/mBio.00237-16
O’Toole G. A. and Kolter R. (1998). Initiation of biofilm formation in Pseudomonas fluorescens wcs365 proceeds via multiple, convergent signalling pathways: a genetic analysis. Mol. Microbiol. 28, 449–461. doi: 10.1046/j.1365-2958.1998.00797.x
Petzoldt T. (2022). growthrates: Estimate Growth Rates from Experimental Data. R package version 0.8.4.
Pinheiro J. C. and Bates D. M. (2000). Mixed-effects models in S and S-PLUS (New York, NY: Springer). doi: 10.1007/b98882
Rigby R. and Stasinopoulos D. (2005). Generalized additive models for location, scale and shape (with discussion). Appl. Stat 54, 507–554. doi: 10.1111/j.1467-9876.2005.00510.x
Rojas F., Leiva V., Wanke P., Lillo C., and Pascual J. (2019). Modeling lot-size with time-dependent demand based on stochastic programming and case study of drug supply in Chile. PloS One 14, e0212768. doi: 10.1371/journal.pone.0212768
Rojas F., Yáñez J., and Cortés M. (2025). Hybrid statistical–metaheuristic inventory modeling: Integrating sarimax with skew-normal and zero-inflated errors in clinical laboratory demand forecasting. Mathematics 13, 3001. doi: 10.3390/math13183001
Stasinopoulos M., Rigby R., and Lambert P. (2015). gamlss.nl: Fitting non linear parametric GAMLSS models. R package version 4.1-0.
Stoffel M. A., Nakagawa S., and Schielzeth H. (2021). partr2: Partitioning r2 in generalized linear mixed models. PeerJ 9, e11414. doi: 10.7717/peerj.11414
Talukder B., Ganguli N., Matthew R., vanLoon G. W., Hipel K. W., Orbinski J., et al. (2022). Climate change-accelerated ocean biodiversity loss & associated planetary health impacts. J. Climate Change Health 6, 100114. doi: 10.1016/j.joclim.2022.100114
West B. T., Welch K. P., and Galecki A. T. (2015). Linear mixed models: A practical guide using statistical software (New York, NY: CRC Press).
Yang L., Yang Q., Lin L., Luan T., Yang Q., Li P., et al. (2022). Effects of wetland, tide, and season on benthic biofilms and related sediment properties in two mangrove wetlands of the pearl river estuary. Front. Mar. Sci. 9. doi: 10.3389/fmars.2022.1043826
Yu S., Lu X., and Lu H. (2025). Marine microbial biofilms on diverse abiotic surfaces. Front. Mar. Sci. 12. doi: 10.3389/fmars.2025.1482946
Zhai C., Liang Y., Yu H., Ji Y., Chen X., Wang M., et al. (2023). Ocean acidification alters the benthic biofilm communities in intertidal soft sediments. Front. Mar. Sci. 10. doi: 10.3389/fmars.2023.1117826
Zwietering M. H., Jongenburger I., Rombouts F. M., and van’t Riet K. (1990). Modeling of the bacterial growth curve. Appl. Environ. Microbiol. 56, 1875–1881. doi: 10.1128/aem.56.6.1875-1881.1990
Appendix 1. Supplementary growth curves and descriptive statistics.
1.1 Growth dynamics across temperature conditions
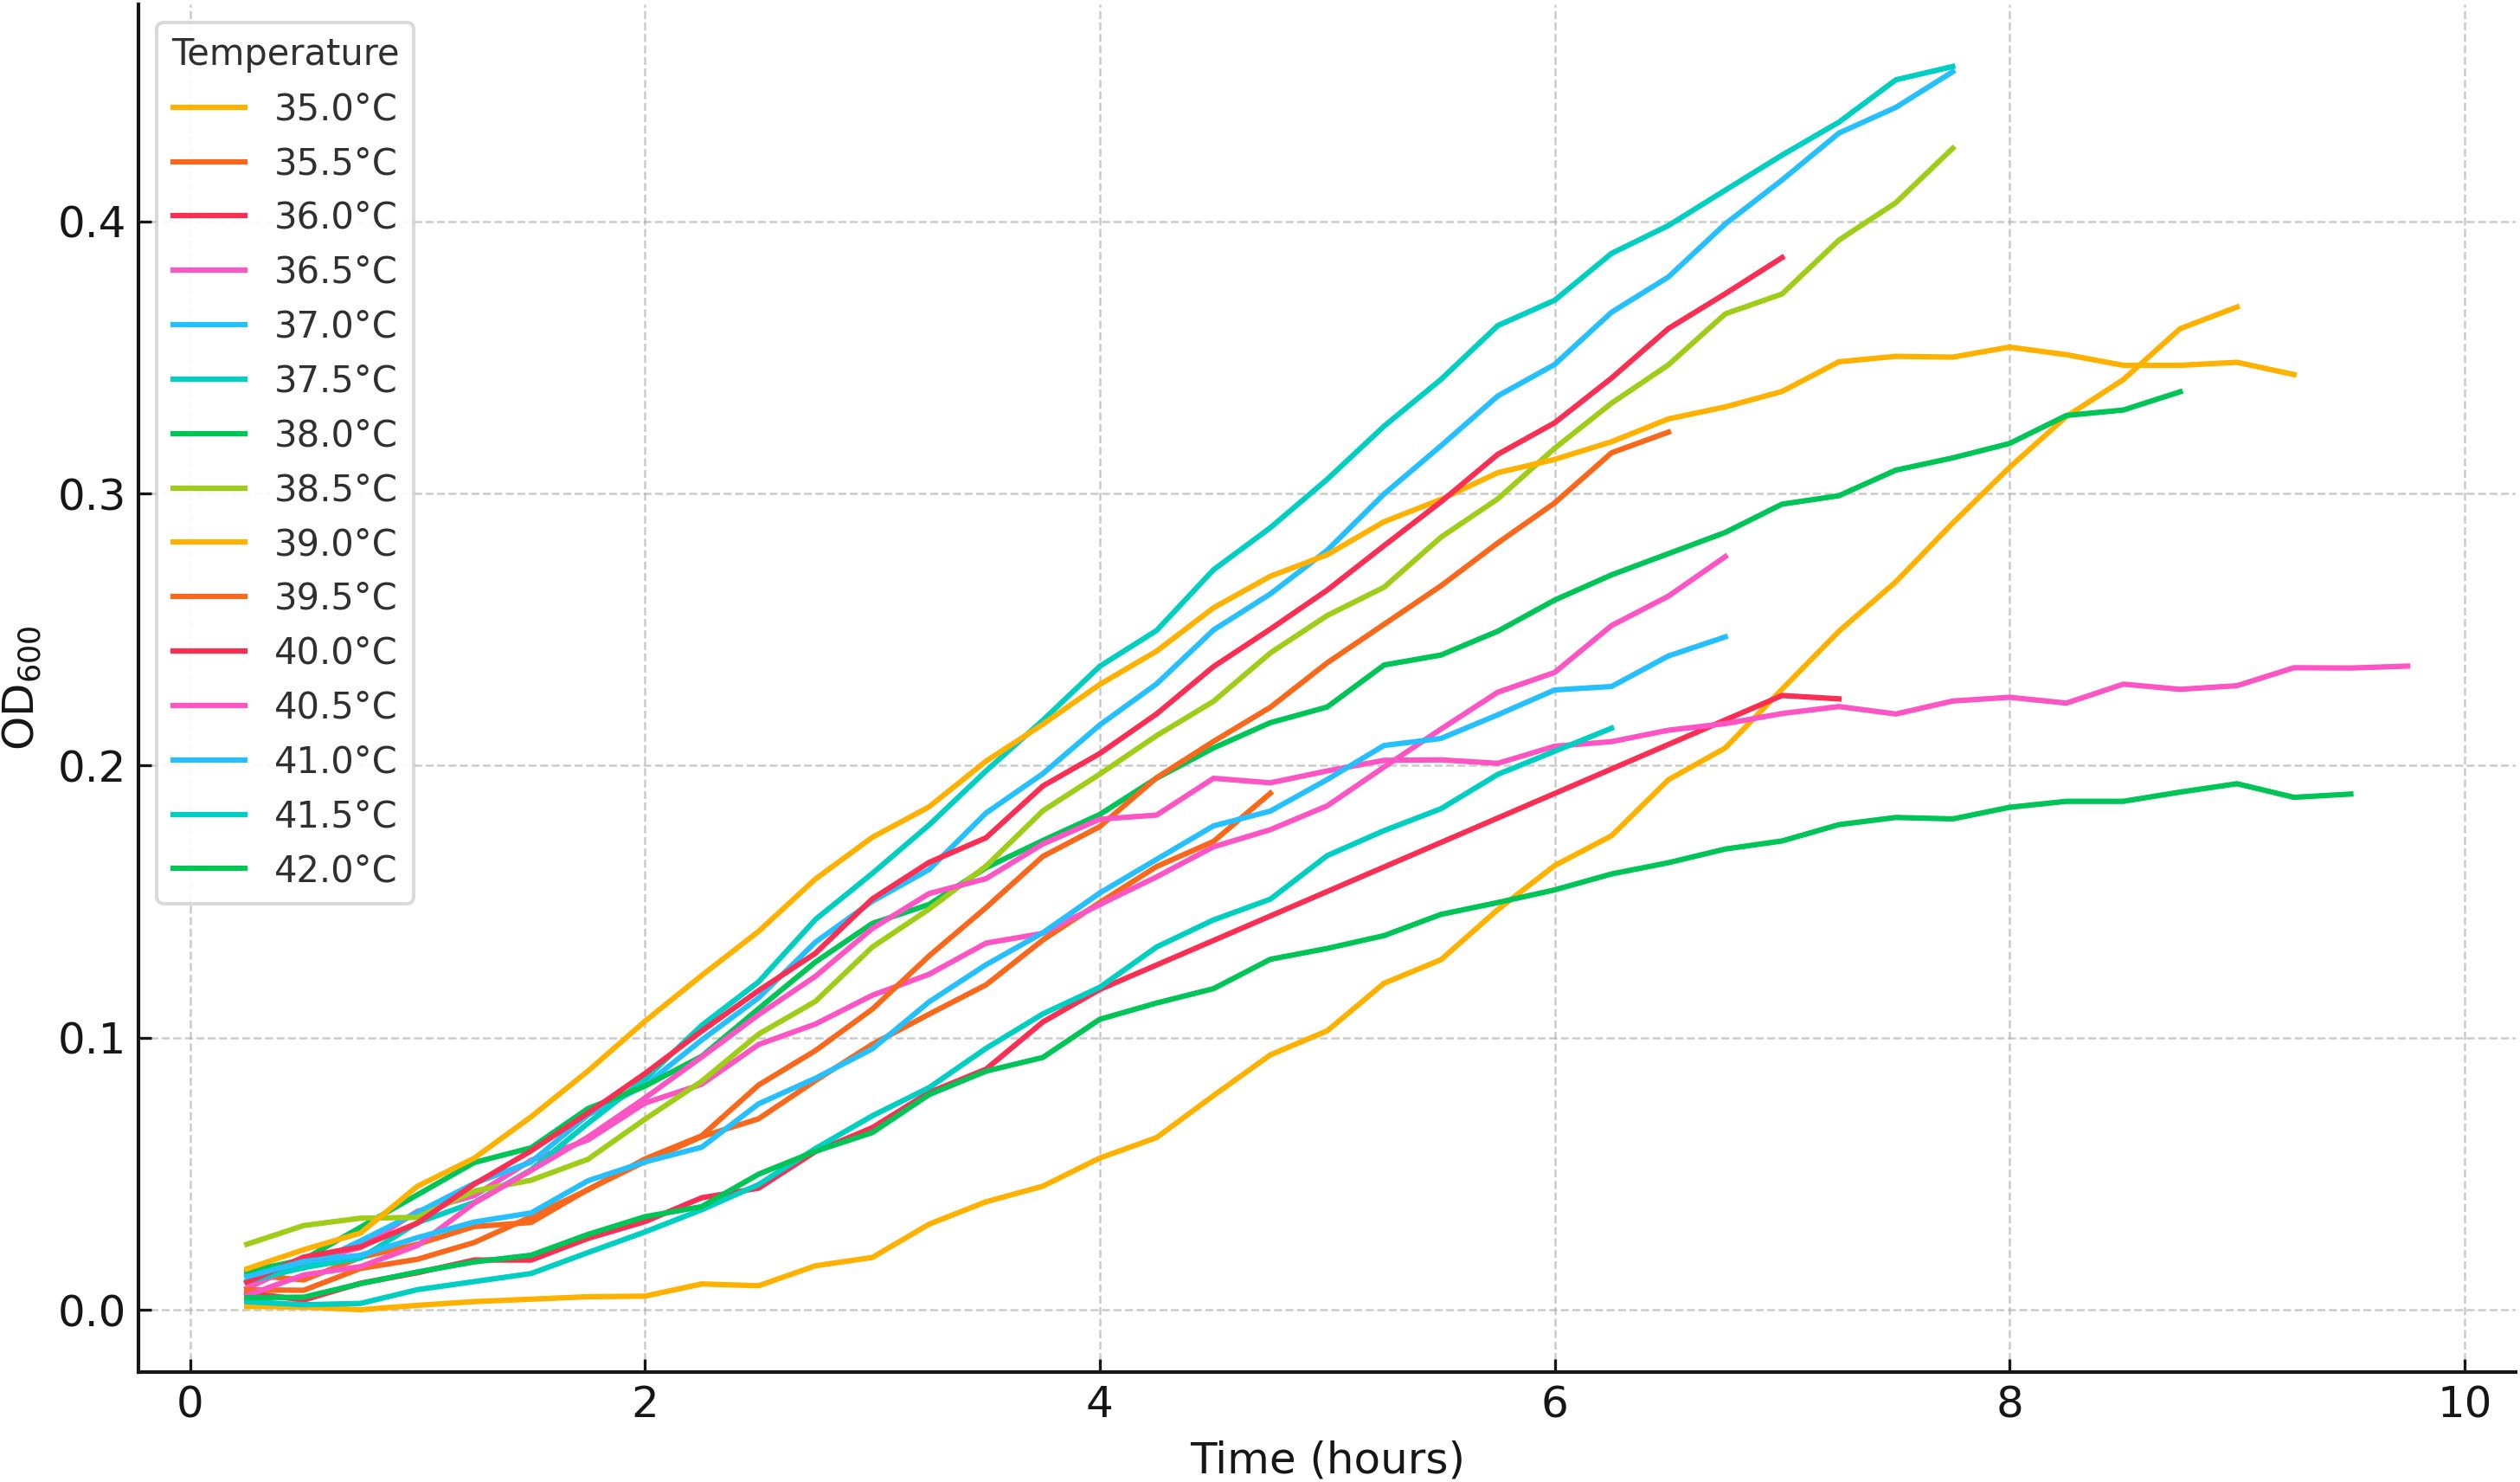
Figure A1. Representative OD600 growth curves of Cobetia sp. under different temperatures. One replicate per condition is shown.
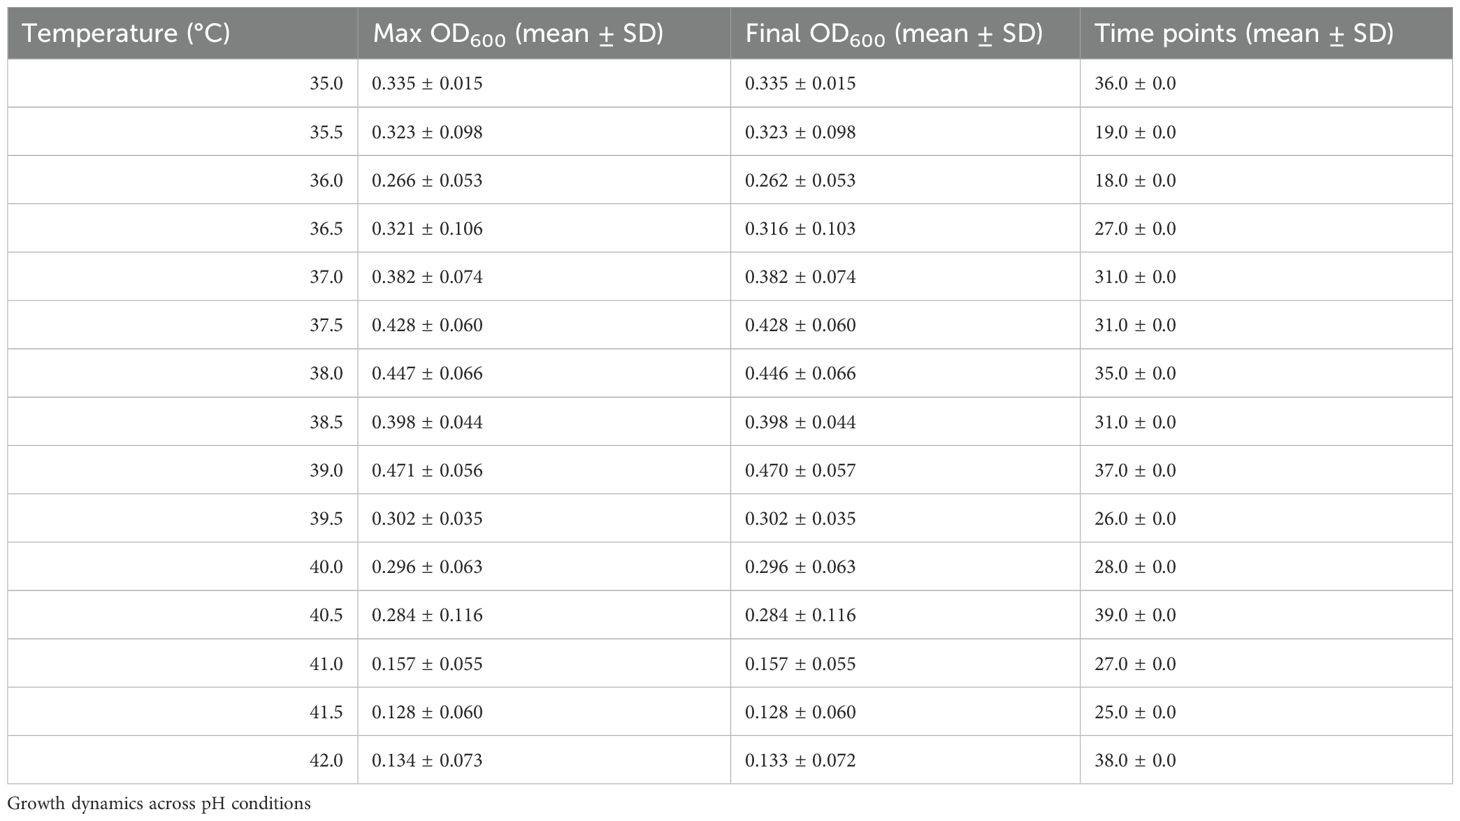
Table A1. Summary of OD600 growth data for Cobetia sp. MM1IDA2H-1 across temperatures.
1.2 Growth dynamics across pH conditions
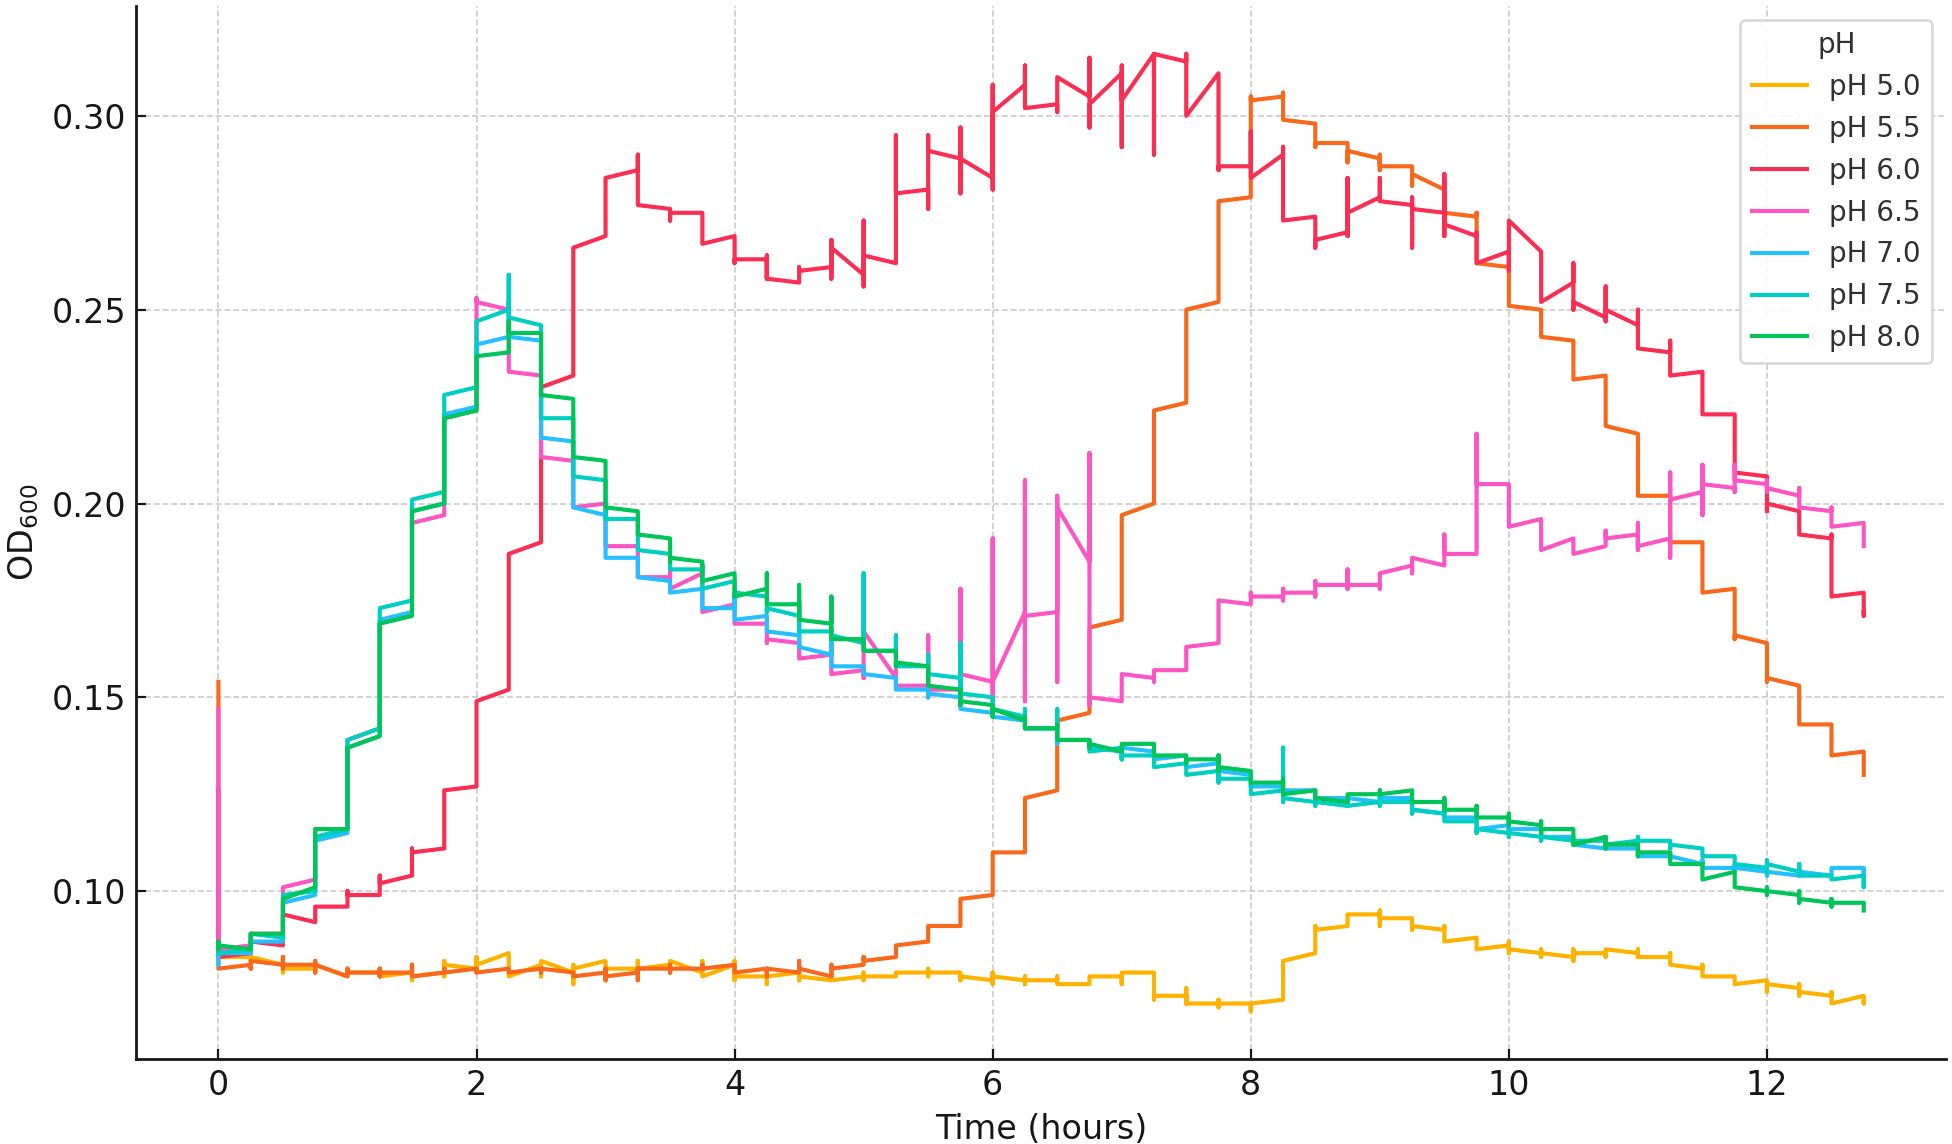
Figure A2. Representative growth curves of Cobetia sp. at selected M9 salts medium pH values. One replicate per pH was selected, and all curves were truncated to a common maximum time to ensure consistent comparison.
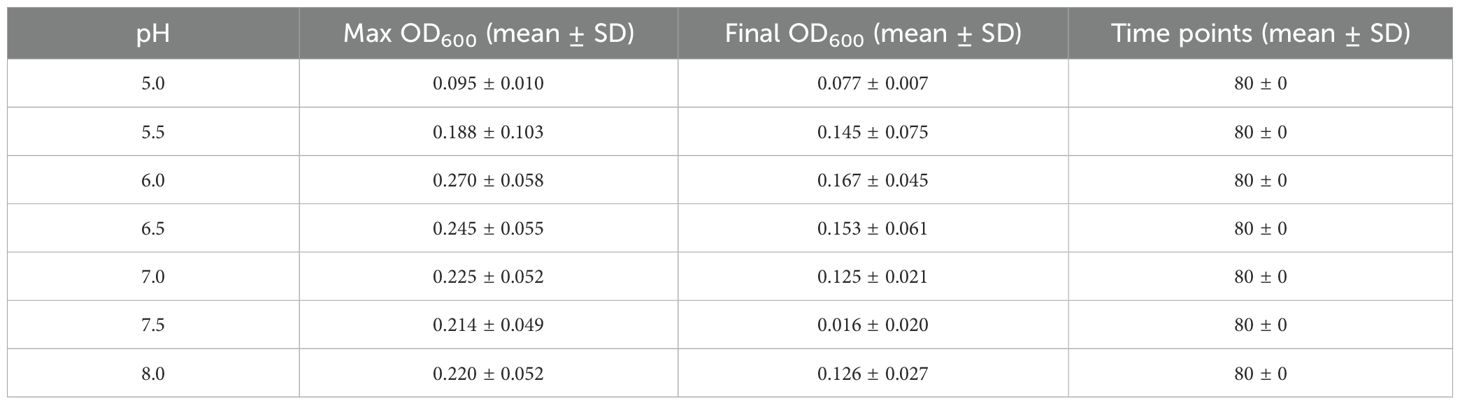
Table A2. Summary of OD600 growth data for Cobetia sp. MM1IDA2H-1 at selected M9 salts medium pH values.
Keywords: Cobetia sp., nonlinear growth model, GAMLSS, biofilm, seawater pH, temperature, mixed-effects modeling
Citation: Stehlik M, Dinamarca MA, Rojas F, Ibacache-Quiroga C, González-Pizarro K, Figueroa-Ajraz F and Barraza-Morales B (2025) Modeling the effects of seawater pH and temperature on the growth and biofilm formation of Cobetia sp. MM1IDA2H-1 using nonlinear GAMLSS and residual mixed-effects analysis. Front. Mar. Sci. 12:1691225. doi: 10.3389/fmars.2025.1691225
Received: 23 August 2025; Accepted: 24 October 2025;
Published: 19 November 2025.
Edited by:
Inês Bezerra Gomes, University of Porto, PortugalReviewed by:
George E. Kapellos, Massachusetts Institute of Technology, United StatesAaron Yip, Duke University Department of Biomedical Engineering, United States
Copyright © 2025 Stehlik, Dinamarca, Rojas, Ibacache-Quiroga, González-Pizarro, Figueroa-Ajraz and Barraza-Morales. This is an open-access article distributed under the terms of the Creative Commons Attribution License (CC BY). The use, distribution or reproduction in other forums is permitted, provided the original author(s) and the copyright owner(s) are credited and that the original publication in this journal is cited, in accordance with accepted academic practice. No use, distribution or reproduction is permitted which does not comply with these terms.
*Correspondence: M. Alejandro Dinamarca, YWxlamFuZHJvLmRpbmFtYXJjYUB1di5jbA==; Fernando Rojas, ZmVybmFuZG8ucm9qYXNAdXYuY2w=