 Seonghee Jeong
 Doshik Hahm
 Dong-Jin Kang
 TaeKeun Rho
 Sujin Kang3
 Tongsup Lee
- 1Department of Oceanography, Pusan National University, Busan, Republic of Korea
- 2Marine Research Institute, Pusan National University, Busan, Republic of Korea
- 3Marine Environmental Research Department, Korea Institute of Ocean Science and Technology, Busan, Republic of Korea
- 4Department of Ocean Science, University of Science and Technology, Daejeon, Republic of Korea
The Seychelles–Chagos Thermocline Ridge (SCTR) is a persistent open-ocean upwelling region, yet its nitrate-isotope dynamics remain sparsely documented. To clarify how physical transport and biological uptake shape these signals, we measured nitrate concentrations and dual-isotope ratios (δ15N, δ18O) along a meridional section in the southwestern tropical Indian Ocean. Below the upper layer, isotopic compositions primarily reflect the origin and biogeochemical history of distinct water masses, including Circumpolar Deep Water from the south and denitrification-influenced Red Sea Overflow Water from the north. In the upper 100 m, however, patterns depart from simple Rayleigh or steady-state expectations and are best explained by two-end-member mixing between newly upwelled, low-isotope nitrate and surface waters containing isotopically enriched residual nitrate from prior assimilation. The mixing imprint becomes detectable only when nitrate drawdown exceeds ∼80%, indicating that physical mixing can overprint classical assimilation signals under moderate consumption. Together, these results clarify when curved trajectories in nitrate-isotope space should appear and provide a practical basis for interpreting nitrogen cycling in upwelling systems where nutrient supply, water-mass advection, and biological uptake jointly control the observed isotope distributions.
1 Introduction
The Seychelles–Chagos Thermocline Ridge (SCTR) is a persistent open-ocean upwelling region in the southwestern tropical Indian Ocean that plays a crucial role in regional biogeochemistry. Although its precise spatial extent varies across studies, the SCTR is generally centered near 8°S and 60–65°E, defined by shallow thermocline depth, surface chlorophyll concentrations, and sea surface temperature anomalies (Xie et al., 2002; Hermes and Reason, 2008; Resplandy et al., 2009). Vertical nutrient supply in the SCTR is driven primarily by wind-induced Ekman divergence, which facilitates the upward transport of nitrate-rich subsurface waters into the euphotic zone (Resplandy et al., 2009; Vinayachandran et al., 2021). This upwelled nitrate fuels surface phytoplankton growth and contributes to carbon export, as evidenced by recent observations of enhanced particulate organic carbon flux and elevated mesopelagic ecosystem activity in the region (Kim et al., 2022; Seo et al., 2024). Despite these findings, most prior studies have relied on satellite-derived estimates and numerical models to infer the biogeochemical dynamics in the SCTR (Dilmahamod et al., 2016; McCreary et al., 1993; Sreeush et al., 2018). Direct field measurements of nutrient dynamics in the SCTR have been few, leaving the nitrogen transformation pathways governing surface production and subsurface remineralization poorly constrained.
Nitrate dual-isotope measurements (δ15N, δ18O) provide essential constraints on nitrogen cycling. The isotopic composition of nitrate is shaped primarily by biological consumption processes, including phytoplankton assimilation and water-column denitrification, which impart fractionation on both N and O typically of similar magnitude (Granger et al., 2004, 2010). During assimilation, preferential uptake of 14N and 16O enriches the residual nitrate pool in δ15N and δ18O, commonly 5–8‰ under laboratory and field conditions (Sigman et al., 1999; Casciotti et al., 2002; Granger et al., 2004). As a result of this process, the unconsumed, residual nitrate pool becomes progressively enriched in the heavier isotope; this enrichment therefore serves as a tracer of the extent of nutrient utilization. In oxygen-deficient zones such as the Arabian Sea, denitrification produces much larger effects (typically 20–30‰) and co-enriches both δ15N and δ18O in the remaining nitrate due to kinetic fractionation during intracellular nitrate reduction and efflux (Brandes et al., 1998; Voss et al., 2001; Granger et al., 2008).
Nitrate production processes–primarily nitrification and remineralization–also influence isotopic composition but differently from consumption. Nitrification yields nitrate with δ15N close to that of the remineralized organic N, whereas its δ18O derives largely from ambient seawater and O2, producing oxygen isotope ratios close to ambient waters (Boshers et al., 2019). In contrast, nitrogen fixation introduces reactive nitrogen with a distinct signature: N-fixing microorganisms convert atmospheric N2 (near 0‰ in δ15N) into bioavailable forms that, after assimilation and remineralization followed by nitrification, can lower ambient nitrate δ15N, especially where fixed nitrogen is a dominant input (Minagawa and Wada, 1986; Carpenter et al., 1997; Knapp et al., 2008). These imprints together shape nitrate δ15N-δ18O patterns in surface and subsurface waters.
Nitrate isotopic composition in the Indian Ocean has been investigated in several pivotal studies that provide context for understanding the SCTR. In the subtropical southern Indian Ocean, Harms et al. (2019) analyzed nitrate isotope distributions alongside temperature–salinity and oxygen profiles to characterize water masses and assess their origins and nitrogen cycling histories. δ15N data from Southern Ocean surface transects were used to quantify the isotope effect of nitrate assimilation and evaluate its use as a paleoceanographic proxy (Sigman et al., 1999). These studies highlight how both local biological processes and remote source signatures, such as upstream-derived nitrate transported laterally, shape the isotopic composition of nitrate in the subtropical Indian Ocean. More recently, Marshall et al. (2023b) emphasized the role of the Agulhas Current in carrying nitrate signals from the Indian into the Atlantic Ocean, while instabilities within the Agulhas Current system have been shown to enhance upward nitrate fluxes in the southwestern subtropical Indian Ocean (Marshall et al., 2023a). The Arabian Sea, with its strong water-column denitrification, has revealed complex nitrogen cycling through isotopic analyses of nitrate and nitrite in its oxygen-deficient zone, underscoring the importance of dual-isotope tracers for understanding subsurface nitrogen cycling dynamics (Altabet et al., 2002; Gaye et al., 2013; Martin and Casciotti, 2017).
While previous studies have characterized nitrogen cycling in the broader Indian Ocean, the SCTR remains under-explored despite its unique upwelling-driven dynamics. In situ isotopic observations are essential for disentangling the relative roles of nitrate assimilation, regeneration, and vertical or lateral transport in shaping the nitrogen cycle in this region. We investigated the processes that shape the vertical distribution of nitrate isotopes in the southwestern tropical Indian Ocean, including the SCTR, where persistent upwelling and complex water-mass interactions influence nitrogen cycling. Using nitrate isotope data (δ15N and δ18O), we examined the respective roles of large-scale water-mass transport, biological assimilation, and physical mixing. Our findings reveal unexpected isotopic patterns in the upper water column that deviate from classical fractionation models, suggesting that the interplay between upwelling, assimilation, and mixing creates distinct isotopic signatures. These insights provide a new framework for interpreting nitrate isotope distributions across diverse upwelling regimes and help reconcile contrasting patterns observed between the Indian and Pacific oceans.
2 Material and methods
2.1 Water sampling and analysis of nitrate isotopes
Hydrographic data and water samples were collected aboard the RV Isabu in the western Indian Ocean (60–68°E, 4–12°S) for the period December 18–29, 2021. The sampling was mostly conducted in the SCTR, except for one station near 12°S, located to the south of the southern boundary of the SCTR (Figure 1).

Figure 1. Sampling stations in the Western Indian Ocean overlaid on the depth of the 20 °C isotherm (D20, m). Blue circles represent sampling stations from this study, where CTD measurements, nutrient analyses, and nitrate isotope analyses were conducted, and red triangles represent sampling stations from Harms et al. (2019). The D20 were estimated using December temperature data from the World Ocean Atlas 2023 (WOA23), provided by NOAA/NCEI (Locarnini et al., 2024). The dataset has a spatial resolution of 1° × 1° and represents climatological monthly means for December, averaged over the period 1965–2022.
Temperature, salinity, and dissolved oxygen data were recorded using conductivity, temperature, and depth(CTD) sensors (SBE 911plus and SBE 43, Sea-Bird Scientific, WA, USA). Dissolved oxygen measurements from the sensor were calibrated against concentrations determined by Winkler titration using a spectrometric titrator (DOT-05, Kimoto Electric Co., Ltd., Japan). The water samples for nutrient analysis were acquired using Niskin samplers without filtration and stored in a cryogenic freezer at −80 °C. Prior to sampling, all bottles were thoroughly pre-rinsed with the sampled seawater to minimize contamination. The frozen samples were later thawed and analyzed in the laboratory using a gas-segmented flow analyzer (QuAAtro 39, SEAL Analytical, Wisconsin, USA) for nitrate concentration measurements, based on the method described in Rho et al. (2015, 2022). Based on repeated measurements of reference solutions, the analytical precision for nitrate was approximately 0.2 μM.
The water samples for nitrate isotope analysis were filtered through 47 mm GF/F Whatman filters (Cytiva, MA, USA) and collected in ThermoFischer Scientific (Massachusetts, USA) Nalgene high density polyethylene (HDPE) bottles (Altabet et al., 2019). Immediately after collection, the samples were stored in a freezer, with the temperature being maintained at −80 °C until analysis. In the laboratory, nitrate in thawed samples were reduced to N2O using the Ti(III)-reduction method (Altabet et al., 2019). This method has been used in a number of recent studies (Bourbonnais et al., 2023; Rotiroti et al., 2023; Matiatos et al., 2021). Under acidic conditions, nitrate in the sample was reduced by Ti3+ to N2O gas (Burns, 1962). This reaction is shown in Equation 1.
To eliminate nitrite interference in the sample, which could also be reduced to N2O during the reaction, sulfamic acid was added before introducing TiCl3 (Granger and Sigman, 2009). The produced N2O was measured using an isotope ratio mass spectrometer (MAT 253 Plus, Thermo Fisher Scientific, MA, USA) connected to an automatic preparation system (Precon and GasBench II; Thermo Fisher Scientific, MA, USA).
The Ti(III)-reduction method yields incomplete conversion of nitrate to N2O, potentially causing isotopic fractionation (Altabet et al., 2019). To minimize this effect, we prepared the standards and samples under identical conditions (reagent volumes, reaction time, temperature). Further, we diluted high-nitrate samples with low-nutrient seawater to match the target concentrations (e.g., 1, 3, 5, and 10 μM). Under these uniform conditions, N2O signal intensities remained stable within ± 5%, implying the conversion from to N2O was consistent among the samples. This value is well below the 15% threshold that could introduce biases of ∼ 1‰ in δ15N and 0.8‰ in δ18O (Altabet et al., 2019). The overall consistency indicates that any fractionation from incomplete conversion was negligible, supporting the reliability of our δ15N and δ18O measurements.
Calibration and analytical validation were performed using USGS32 (δ15N = +180‰, δ18O = +25.7‰) and USGS34 (δ15N = −1.8‰, δ18O = −27.9‰) standards. Systematic errors in mass spectrometry tend to increase with greater “isotopic distance” between the sample and the standard (Mariotti et al., 1981). To minimize such errors, we prepared mixed standards, two for δ15N and three for δ18O, by combining USGS32 and USGS34 to yield intermediate δ15N and δ18O values across the sample range. These were used to generate calibration curves with high linearity (Supplementary Figure S1), which improved measurement accuracy and consistency. Analytical errors for both δ15N and δ18O, determined from replicate standards, were less than 0.3‰. Water samples with concentrations below 1 μM were excluded from isotopic ratio analysis because of insufficient N2O production. To ensure consistency and monitor instrument drift, calibration standards were analyzed in an interval of ∼8 h.
2.2 Nitrate assimilation models
Two models are conventionally used in oceanographic studies to examine isotopic fractionation, namely the Rayleigh and steady-state models (Mariotti et al., 1981; Sigman et al., 1999). The Rayleigh model is applicable to a closed system, and is used when a unidirectional transformation occurs under a constant kinetic isotope effect, and the reactant nitrogen pool is neither replenished nor lost during the transformation. It is represented as follows:
where δ15Ninitial represents the initial 15N of the reactant nitrogen pool, denotes the kinetic isotope effect, and f represents the fraction of remaining reactant ([NO3−]/[[NO3−]initial]). If nitrate is supplied continuously, partially consumed, and partially exported, a steady-state model (open system) is followed:
As both nitrogen and oxygen isotopes are subject to the same degree of fractionation during assimilation, Equations 2, 3 can also be applied to oxygen isotopes.
3 Results
3.1 Hydrographic and isotopic characteristics of the upper layer
The sea surface temperature in the study area consistently exceeded 27°C, showing no significant spatial variation (Figure 2A). We used the 20°C isotherm (D20) as an indicator of thermocline depth because it effectively represents the depth of a strong temperature gradient and is conventionally employed in SCTR research (Xie et al., 2002; Lee et al., 2022). At most CTD stations, D20 was located at depths of 70–80 m (Figure 2A), consistent with previous observations and modeling studies in the SCTR (Donguy and Meyers, 1995; Hermes and Reason, 2008; Zheng et al., 2016). An exception occurred at the southernmost station near 12°S, where D20 reached a depth of 130 m. Owing to the significant variation in D20 depths, we classified stations north of 12°S as within the SCTR and the station south of 12°S as outside the SCTR.
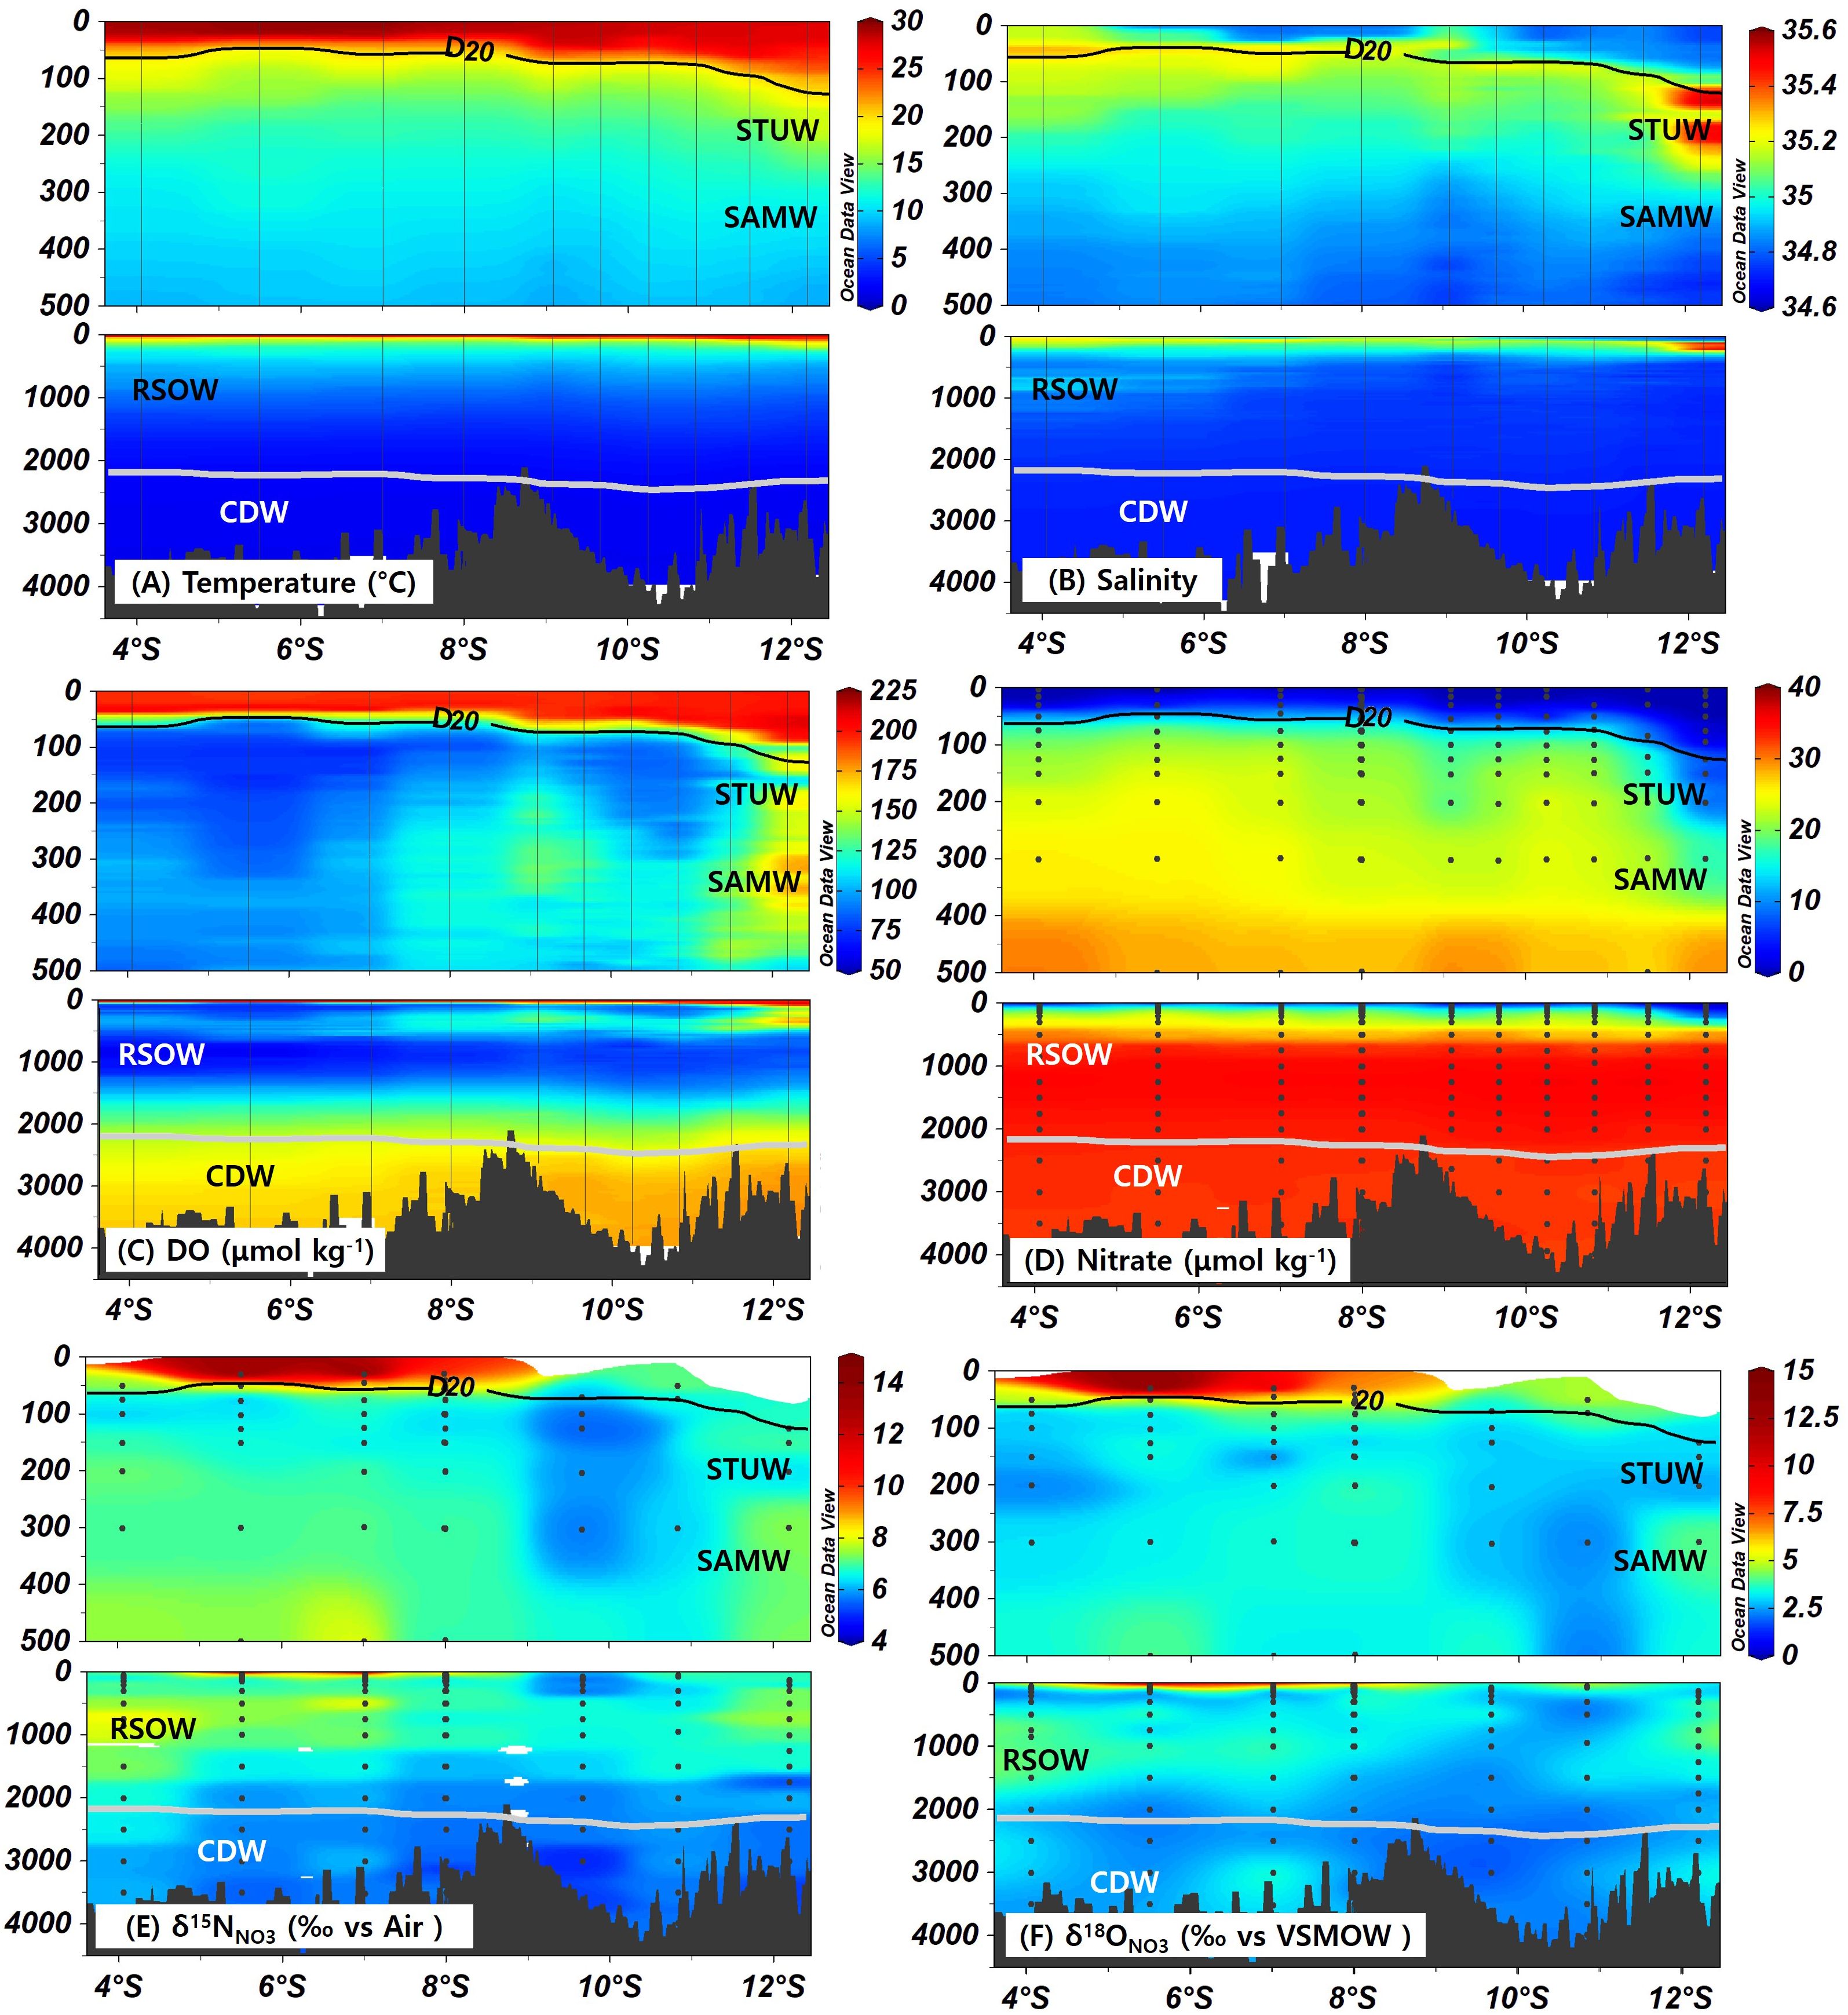
Figure 2. Distributions of (A) temperature (°C), (B) salinity, (C) dissolved oxygen (µmol kg−1), (D) Nitrate (µmol kg−1), and Nitrate isotopes (E) δ15N (‰) and (F) δ18O (‰) in the study area. Top figures provide detailed distributions within the upper layer (0–500 m), whereas the bottom figures offer an overview of the entire water column, respectively. Black line represents D20. Light gray contour lines represent sigma-theta (typically ∼27.8), marking the boundaries of the CDW layer. Water-mass annotations (STUW, SAMW, RSOW, CDW) mark their typical domains along the section.
At the southernmost station (100–150 m depth), subsurface salinity exceeded 35.4, accompanied by high oxygen concentrations above 160 µmol kg−1 (Figure 2; Supplementary Figure S2). Both salinity and oxygen values were notably higher than those of the waters further north. These characteristics were consistent with the presence of the South Indian Subtropical Underwater (STUW; 18.2–21.1°C, 35.4–35.7; O’Connor et al., 2005; Talley et al., 2011; Kim et al., 2021), which forms through the subduction of high-salinity subtropical surface waters. Another layer with high oxygen concentrations (exceeding 170 µmol kg−1) was observed below the STUW at depths of 300–750 m in the non-SCTR region (Figure 2; Supplementary Figure S2). This layer exhibited potential temperature and salinity characteristics consistent with Subantarctic Mode Water (SAMW), which forms through winter surface cooling between the subantarctic and subtropical fronts and typically lies within a density range of 26.4–27.0 σθ (McCartney, 1979; Herraiz-Borreguero and Rintoul, 2011).
The nitrate concentrations in the surface layer were depleted to less than 1 µmol kg−1. The depletion was more pronounced in the subsurface layer (<500 m) of the non-SCTR region than in the SCTR region (Figure 2D). Correspondingly, the nitracline differed between the SCTR and non-SCTR regions. Note that nitracline is defined in this study as the depth at which nitrate concentrations exceed 1 µmol kg−1, following previous approaches that use a prescribed nitrate threshold (Cullen and Eppley, 1981; Koeve et al., 1993; Martin and Pondaven, 2003). The nitracline was shallower (15–85 m) in the SCTR region but deeper in the non-SCTR region, reaching 125 m, indicating enhanced nitrate availability in the upper layer of the SCTR. The higher nutrient availability was ascribed to the likely upwelling of nutrient-rich water in the SCTR region (Resplandy et al., 2009). A cross section of chlorophyll fluorescence (Supplementary Figure S3) showed a subsurface maximum that was shallower and somewhat stronger over the SCTR and gradually deepened south of 12°S, co-locating with the shallow D20 and the nitracline.
In the SCTR region, the δ15N and δ18O levels above the D20 were elevated at ranges of 7–15‰ and 4–15‰, respectively (Figure 2). These values exceeded those observed below the D20, where δ15N and δ18O averaged 6.4 ± 0.7‰ and 3.0 ± 0.6‰, respectively. Similar isotopic values were found in the subsurface salinity maximum layer at 100–150 m near 12°S, which corresponds to the STUW, where δ15N and δ18O were measured at 6.7 ± 0.3‰ and 2.8 ± 0.2‰, respectively. At greater depths (300–400 m) near 12°S, the SAMW-like waters exhibited slightly higher values, exceeding 7‰ for δ15N and 4‰ for δ18O.
3.2 Hydrographic and isotopic characteristics of intermediate and deep layers
The intermediate waters across our study area were generally characterized by an oxygen minimum layer that arises from intense oxygen consumption during the remineralization of sinking organic matter. This low-oxygen condition was particularly pronounced in the northern area (4–7°S). Here, in the intermediate 750 m), the salinity levels exceeding 34.8 were significantly higher than those in the southern area, and the lowest oxygen concentrations (as low as 60 μmol kg−1) were recorded, suggesting the spread of low-oxygen water from the north (Figure 2; Supplementary Figure S2). Historical data from the World Ocean Atlas 18 indicate that oxygen concentrations in the intermediate layer south of the equator remain below 100 μmol kg−1, despite ongoing mixing with surrounding waters (Ditkovsky et al., 2023). Considering that the potential temperature and salinity in this layer were aligned with the characteristic of Red Sea Overflow Water (RSOW; 5–14°C, 34.8–35.4;27.2–27.4 kg m−3; Emery, 2001; Talley et al., 2011), these waters potentially originated from the mixing of RSOW and low-oxygen water from the Arabian Sea (Menezes, 2021). The low-oxygen waters between 4°S and 7°S were characterized by relatively high δ15N and δ18O values, typically exceeding 7‰ and 3.5‰, respectively (Figure 2).
In contrast with the intermediate layer, which exhibited low oxygen below 100 µmol kg−1, the dissolved oxygen levels in the deep layer increased with depth, exceeding 150 µmol kg−1 below 2500 m. The high O2 feature was more pronounced in the southern region (south of 9°S), where water with O2 concentrations over 175 µmol kg−1 occurred below 3000 m (Figure 2; Supplementary Figure S2). The ranges of potential temperature and salinity in this region were similar to those of the Circumpolar Deep Water (CDW) (1–2 °C, 34.62–34.73; σθ = 27.8; Emery, 2001; Kim et al., 2020). This finding was a consistent with a northward migration of the CDW with high O2 from higher latitudes. Nitrate concentrations increased with depth, peaking at approximately 36 µmol kg−1 between 1000 and 1250 m, before declining to below 35 µmol kg−1 at depths exceeding 2500 m, where CDW was prevalent. In this deep layer, the measured average values for δ15N and δ18O were 5.6 ± 0.3‰ and 2.5 ± 0.4‰, respectively (Figure 2).
4 Discussion
4.1 Influence of water masses on the nitrate isotope distribution
Nitrate isotope distributions in the Indian Ocean reflect the interplay of multiple water masses, each possessing a distinct isotopic signature that stems from its origin and biogeochemical history. Purely biological processes alone cannot fully explain the observed patterns, underscoring the need to consider physical oceanographic factors. In this study, we first identified water masses by primarily using temperature–salinity (T–S) characteristics and oxygen distributions (Supplementary Figure S2; see Section 3). Subsequently, we compared our measured nitrate isotope ratios (δ15N, δ18O) with existing data from previous studies (Harms et al., 2019; Marshall et al., 2023b). This was done to place our observations in a broader regional context and assess the consistency of water mass signatures. Below, we briefly describe each water.
We identified SAMW near 12°S at 300–400 m depth, where δ15N and δ18O reached 7.4 ± 0.1‰ and 3.8 ± 0.4‰, respectively, i.e., elevated values in comparison with that in deeper layers (Figure 2). Such enrichment reflects preformed nitrate that had been consumed partially at high latitudes before subduction (Talley et al., 2011; DiFiore et al., 2006; Rafter et al., 2013), leaving the residual nitrate isotopically heavier. As SAMW spreads northward, it transports isotopically enriched, preformed nitrate into the lower thermocline. This factor explains the elevated δ15N values observed at 300–400 m near 12°S.
At depths of 700–900 m in the northern part of the study region, we observed a water mass characterized by relatively high salinity and low oxygen concentrations (Supplementary Figure S2), consistent with the properties of RSOW (Emery, 2001; Talley et al., 2011). This layer exhibited elevated δ15N and δ18O values of 7.7 ± 0.5‰ and 3.7 ± 0.7‰, respectively (Figure 2). These isotopic signatures are consistent with the influence of RSOW, which mixes with low-oxygen waters originating in the Arabian Sea before entering the Indian Ocean (Menezes, 2021). The RSOWcarries the isotopic imprint of extensive denitrification in the Arabian Sea, where nitrate δ15N values can exceed 20‰ in active denitrification zones (Gaye et al., 2013; Martin and Casciotti, 2017). The enrichment we observed suggests that RSOWretains this denitrification-derived signature as it is advected into the SCTR region.
In deeper layers below 2500m, δ15N and δ18O reach the lowest reflected levels in our dataset, namely 5.6 ± 0.3‰ and 2.5 ± 0.4‰, respectively, where CDW, characterized by cold, oxygen-rich conditions, is the dominant water mass (Figure 2; Supplementary Figure S2). Originating in the Southern Ocean, CDW functions as a reservoir for upstream-derived nitrate, with a possible contribution from nitrate regenerated via remineralization-nitrification, and is generally characterized by low δ15N and δ18O values during transport. The low isotopic values primarily result from the incomplete biological utilization of nitrate in the Southern Ocean, where a large fraction of nitrate is subducted before being assimilated (Sigman et al., 2000; DiFiore et al., 2006; Rafter et al., 2013). The isotopically light, upstream-derived nitrate becomes incorporated into CDW, which carries it into the deep ocean, making CDW the primary deep water nitrate reservoir in the region. Low-δ15N sinking organic matter produced by incomplete assimilation in the Southern Ocean can be remineralized and subsequently nitrified, adding regenerated nitrate to CDW and reinforcing its isotopically light δ15N and δ18O characteristics.
The nitrate isotopic composition observed in this study is broadly consistent with that in previous reports from the subtropical and tropical Indian Ocean (Harms et al., 2019; Marshall et al., 2023b). This consistency supports the validity of our dataset and its comparability with existing regional observations. A summary of representative δ15N and δ18O values for major water masses across studies is provided in Supplementary Table S1. Taken together, these results highlight the importance of water mass origin in shaping the distribution of nitrate isotope composition across depths. However, in the upper ocean, where physical mixing alone cannot fully account for the observed isotopic enrichment, biological processes such as partial assimilation should also be considered.
4.2 Nitrate assimilation and isotopic signatures in the upper layer
4.2.1 Upwelling-driven changes in nitrate assimilation and isotopic mixing in the SCTR
In the upper 100 m of the SCTR regions, we observed a trend of increasing δ15N and δ18O with decreasing depth toward the surface (Figure 2). This conclusion follows from the observed co-variation in the upper 0–100 m–nitrate decreases while both δ15N and δ18O increase (Figures 2E, F). This pattern aligns with the findings of previous studies, i.e., elevated isotope ratios in surface waters are associated with phytoplankton assimilation (Smart et al., 2015; Rafter and Sigman, 2016; Peters et al., 2018).
To further explore the mechanisms driving these isotopic variations, we applied both Rayleigh and steady-state models of nitrate assimilation (Mariotti et al., 1981; Sigman et al., 1999). These models depend on parameters that include the initial nitrate concentration, isotopic composition, and kinetic isotope effect. In the analysis, we set the initial nitrate concentration at 20 µmol kg−1, corresponding to the inflection point (“kink”), where δ15N and δ18O start increasing sharply (Figure 3A; Rafter and Sigman, 2016). This threshold marks the transition where isotopic fractionation by biological assimilation becomes evident, making it the most appropriate end-member for the analysis. The isotope effect was set at 6‰, based on information in previous field and laboratory studies (Casciotti et al., 2002; Yoshikawa et al., 2005; Rafter and Sigman, 2016).
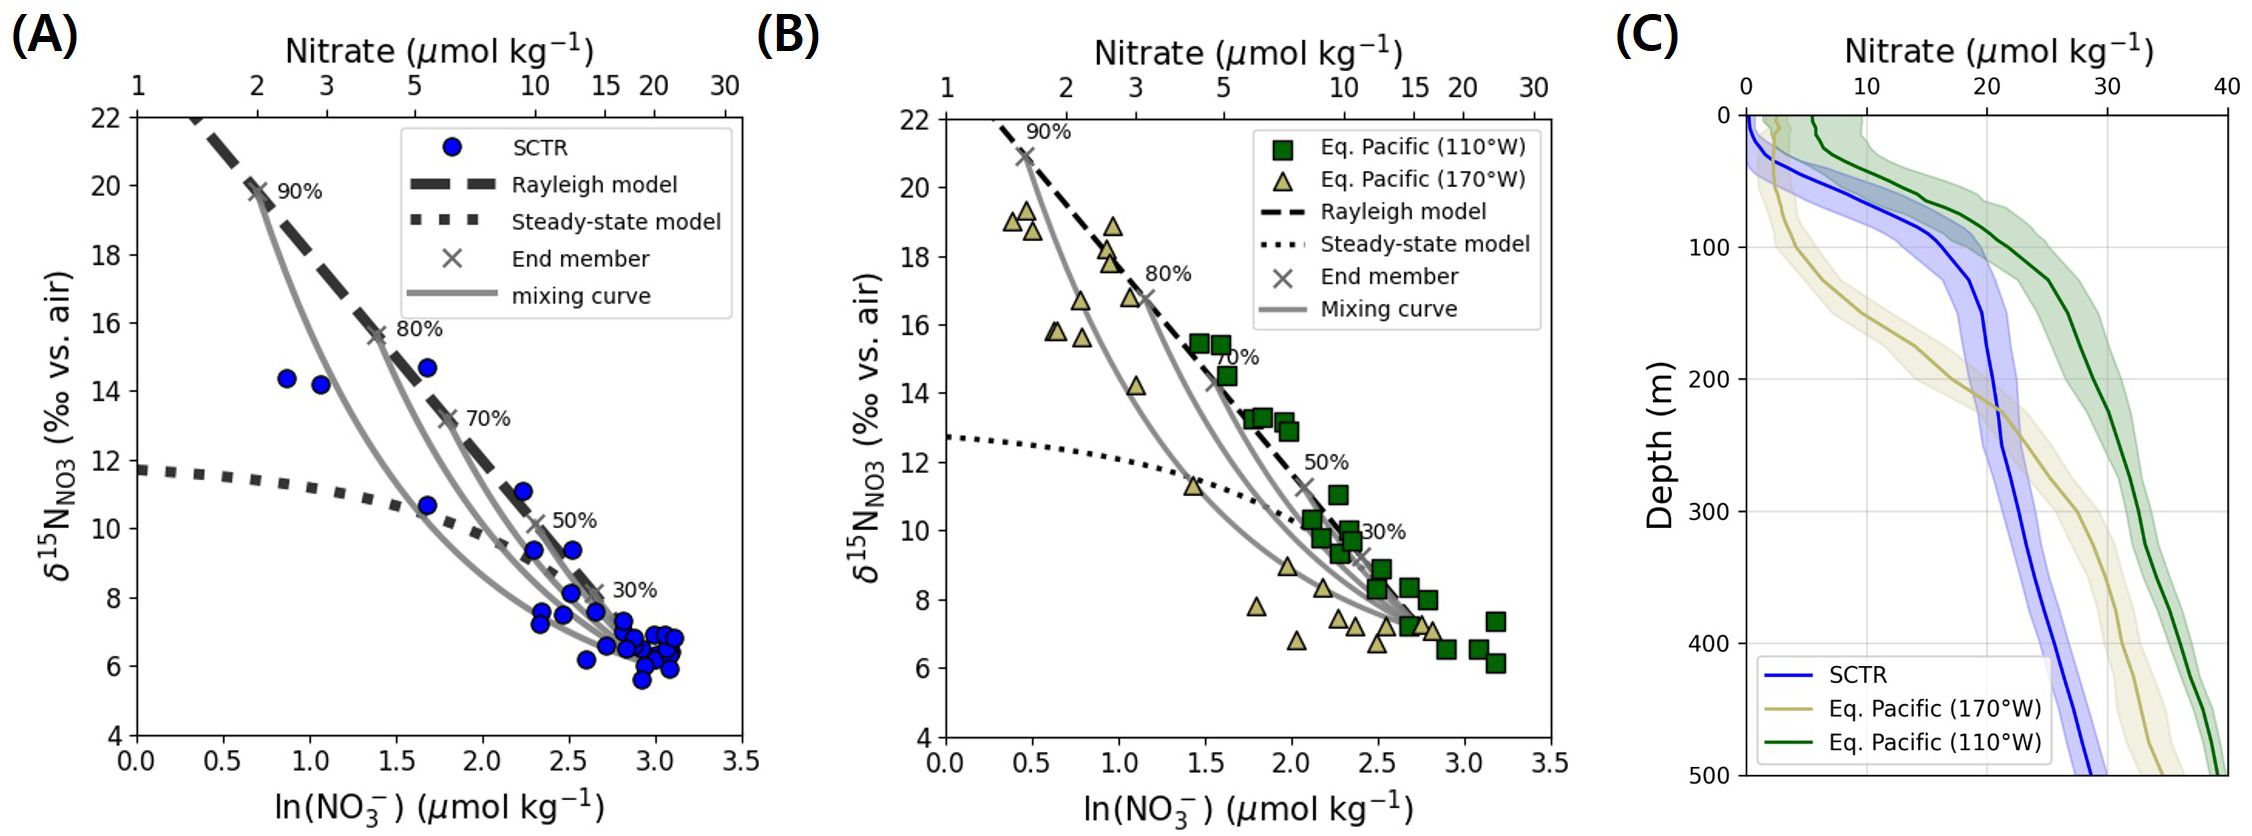
Figure 3. (A) Relationship between nitrate δ15N and the natural logarithm of nitrate concentration (ln[NO3–]) in the upper 100 m of the SCTR. The dashed line represents a Rayleigh fractionation model with = 6‰, the dotted line shows the steady-state model, and the solid gray curves represent isotopic mixing trajectories between source nitrate and fractionated end-members. Black crosses indicate representative degrees of nitrate consumption. (B) Same relationship for equatorial Pacific data from Rafter and Sigman (2016), grouped by longitude: green squares represent the eastern equatorial Pacific (110°W), where strong upwelling sustains high nitrate and a Rayleigh-type signal dominates; light olive green triangles represent the central Pacific (170°W), where weaker upwelling allows greater drawdown and mixing curvature to emerge. Modeled curves are overlaid as in (A). (C) Vertical profiles of nitrate concentration (µmol kg−1) in the SCTR (blue), the central equatorial Pacific at 170°W (light olive green), and the eastern equatorial Pacific at 110°W (green), based on WOA23 annual climatological data (1965– 2022). Shaded envelopes represent one standard deviation around the mean. Surface nitrate drawdown is strongest in the SCTR and 170°W, potentially enabling greater isotopic contrast and the expression of post-assimilation mixing, whereas more moderate drawdown at 110°W may limit such expression despite possible mixing.
Given the year-round upwelling in the SCTR region from the deep to the upper layers (McCreary et al., 1993; Lee et al., 2022), the relationship between the isotopic ratios and concentration could be expected to closely follow the steady-state (open system) model, i.e., nitrate is supplied and assimilated continuously. Conversely, we observed numerous values in the SCTR region that aligned closely with the Rayleigh (closed system) model or fell between the Rayleigh and steady-state model lines (magenta dashed and dotted lines in Figure 3A). Such deviations suggest that the Rayleigh model alone cannot account for the observed nitrate isotope distribution.
To account for the deviations from both Rayleigh and steady-state models, we considered isotopic mixing between nitrate pools with different assimilation histories. This scenario can arise when newly upwelled, isotopically lighter nitrate is introduced into surface waters in which biological uptake has already enriched the remaining nitrate pool (Sigman et al., 1999; Rafter and Sigman, 2016). The resulting mixture produces isotope signatures that deviate from the Rayleigh trajectory, typically shifting to lower δ15N and δ18O values.
To better represent the observed curvature, we adopted a two-end-member mixing model using the inflection point nitrate (20 µmol kg−1) as the source and highly fractionated surface nitrate as the enriched end-member. As nitrate consumption progressed, the isotopic contrast between the two end-members increased, and the mixing curve became more concave below the Rayleigh slope (Figure 3A). At low drawdown (<50%), the curve appeared nearly linear; however, with consumption above 80%, which is common in the SCTR upper layer (Figures 2, 3C), the mixing signal was expressed fully. The observed SCTR data closely followed this predicted curvature, supporting the conclusion that post-assimilation mixing plays a key role in shaping the isotopic distribution, beyond what is captured by Rayleigh or steady-state models alone.
The SCTR exhibits clear signs of post-assimilation mixing, yet these processes occur within a regime that is effectively quasi-closed in terms of vertical nitrate supply. This characterization is supported by persistently low surface nitrate concentrations (<1 μmol kg−1) in both in situ observations and climatological datasets (Figures 2D, 3C; Garcia et al., 2024). Local Ekman pumping is weak (1–3 × 10⁻⁶ m s−1; Mubarrok et al., 2023), and strong stratification further suppresses vertical exchange (George et al., 2018; Dilmahamod et al., 2016). Whereas episodic thermocline shoaling could introduce pulses of nitrate (Gandhi et al., 2012), the prevailing physical structure promotes surface parcel isolation. Under these conditions, assimilation could proceed close to completion, enriching the residual nitrate pool. Intermittent injections of lighter nitrate could subsequently mix into this enriched background (Resplandy et al., 2009), producing the isotopic curvature observed in the SCTR.
To place the SCTR in a broader context, we compared its isotopic structure with nitrate profiles from the equatorial Pacific (Figure 3; Rafter and Sigman, 2016). At 110°W in the eastern Pacific, vertical velocities reach 1.5–2 × 10⁻⁴ m s−1 (Johnson et al., 2001; Meinen et al., 2001; Poulain, 1993), enabling rapid nitrate supply and drawdown. These conditions have been interpreted as yielding Rayleigh-type signals ascribed to closed-system-like behavior over short timescales–analogous to batch cultures (Rafter and Sigman, 2016; Rafter, 2024). However, such trajectories can also arise transiently when assimilation outpaces physical exchange, even in open systems. Importantly, the absence of isotopic curvature at 110°W does not preclude the occurrence of post-assimilation mixing. Instead, any such mixing could be isotopically masked because of insufficient contrast between residual and incoming nitrate under moderate drawdown. In contrast, at 170°Win the central Pacific, where upwelling is slower (1.9–2.3 × 10⁻⁵ m s−1; Weisberg and Qiao, 2000; Johnson et al., 2001), the isotopic profiles deviate from the Rayleigh slope and resemble the SCTR mixing curve (Figure 3B). These differences are evident in the vertical nitrate profiles across regions (Figure 3C), that derive from the World Ocean Atlas 2023 (WOA23; Locarnini et al., 2024) annual climatological nitrate fields (1965–2022). The profiles reveal that the SCTR and 170°W both experience deeper drawdown than 110°W, facilitating greater isotopic contrast. These patterns suggest that the isotopic expression of assimilation and mixing varies systematically with upwelling intensity and the extent of nitrate consumption. For reference, vertical velocities over the SCTR are about 1–3 × 10⁻⁶ m s−1 (Mubarrok et al., 2023), consistent with weak Ekman pumping in this region.
Although Rayleigh-like signals are traditionally interpreted as evidence of system closure, our analysis highlights that such trajectories can emerge in systems where assimilation is incomplete and mixing is not isotopically resolvable. At 110°W, for instance, nitrate consumption reaches only ∼70% (Rafter and Sigman, 2016), limiting the isotopic contrast required to express curvature. In contrast, the SCTR and 170°W showed drawdown levels above 80%, allowing the mixing between enriched and fresh nitrate to manifest visibly in isotope space (Supplementary Figure S4). These observations support a more flexible interpretation, namely that Rayleigh behavior and post-assimilation mixing are not mutually exclusive but, instead, reflect different outcomes depending on nitrate consumption levels and nutrient supply conditions. Accurate interpretation of nitrate isotope distributions in upwelling regions requires considering how incomplete drawdown can obscure the effects of mixing. What appears Rayleigh-like could, in some instances, reflect masked mixing rather than true closure. Therefore, apparent model fits must be evaluated in light of both physical transport and assimilation context to avoid oversimplified interpretations. This perspective underscores that the distinction between Rayleigh behavior and mixing often lies in their isotopic visibility rather than in the presence or absence of mixing itself.
The δ15N–δ18O relationship of nitrate provides further evidence that biological assimilation is the dominant process shaping the isotopic composition in the upper SCTR (Supplementary Figure S5). Nitrate samples from the upper 100 m define a nearly 1:1 assimilation trend between δ15N and δ18O. Two samples, however, plot slightly above this line–a pattern that can occur when regenerated nitrate originates from organic matter produced either by N2-fixation or by partial nitrate assimilation (Rafter et al., 2013). Because the N* (DIN−16×PO43– +2.9; Deutsch et al., 2001) values of these samples are not elevated relative to nearby stations, the latter interpretation appears more likely. These samples also coincide with those showing small deviations below the modeled mixing curve in the δ15N–[NO3–] relationship (Figure 3A), suggesting that both features reflect a minor regeneration imprint within an assimilation-dominated regime. Overall, these relationships indicate that nitrate assimilation governs the isotopic behavior in the upper SCTR, with only a weak contribution from in situ nitrification.
4.2.2 Contrasting nitrogen processes in the SCTR and the surrounding Indian Ocean
To improve understanding of regional variability in nitrate assimilation and isotopic fractionation within the southwest Indian Ocean, we compared our data with previously published values from the subtropical southern Indian Ocean (Harms et al., 2019). As shown in Figure 1, these reference stations are located to the south and east of the SCTR, providing spatial context for interpreting differences in nitrogen cycling regimes. As nitrate was almost completely depleted throughout the upper 100 m at most stations outside the SCTR, we extended the comparison to 500 m depth, where the nitrate concentrations facilitated isotopic analysis.
Phytoplankton assimilation of nitrate is a globally widespread process that elevates the δ15N and δ18O values of residual nitrate (DiFiore et al., 2006; Smart et al., 2015; Peters et al., 2018). However, in oligotrophic regions, where surface nitrate is fully consumed, the residual nitrate is often insufficient to reflect isotopic fractionation. This pattern has been noted in several transect studies that included oligotrophic environments, particularly at stations where surface nitrate was nearly absent (Harms et al., 2019; Yoshikawa et al., 2018; Lehmann et al., 2018). In the SCTR, surface waters showed partial nitrate assimilation, as evidenced by increasing δ15N values from approximately 3‰ to 14‰, along with nitrate concentrations decreasing from ∼ 20 μmol kg−1 to below the detection limit within the upper 100 m (Figures 3A, 4). Although surface nitrate was largely depleted in the SCTR region (Figure 2D), residual nitrate remained within the upper layer, facilitating isotopic fractionation. Here, “partial assimilation” refers to the incomplete consumption of nitrate within the productive upper layer, rather than at the immediate surface.
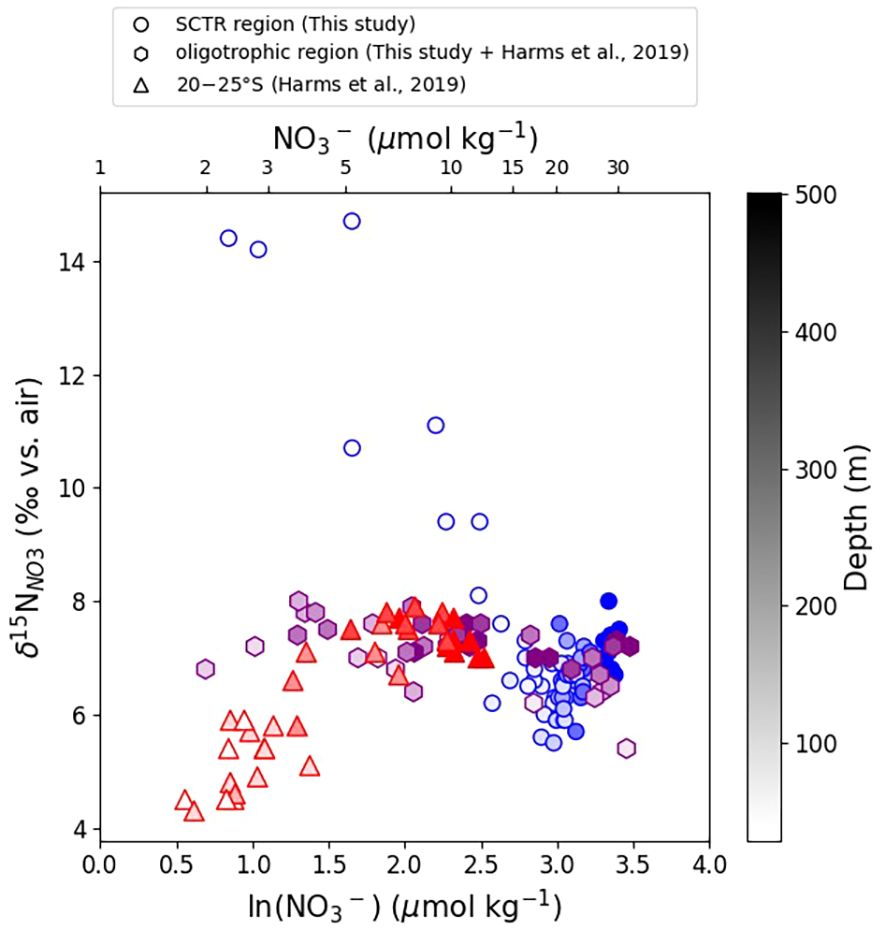
Figure 4. Plot of nitrate δ15N (‰) against the natural logarithm of nitrate concentration [NO3–] (µmol kg−1) for stations shallower than 500 m from both this study and previously published data (Harms et al., 2019). Symbols in the plot represent the following: blue circles denote the SCTR region (this study), purple hexagons represent the oligotrophic region (including our non-SCTR samples and those of Harms et al., 2019), and red triangles indicate the 20–25°S region. Shade intensity of each color corresponds to the depth at the respective location.
Conversely, at a non-SCTR station near 12°S, nitrate was nearly absent throughout the upper 100 m (Figure 2D), precluding isotopic analysis. This observation agrees with prior findings (Harms et al., 2019) that surface nitrate is typically fully consumed in the subtropical southern Indian Ocean. However, between ∼100 and 500 m, δ15N values ranged from 6‰ to 8‰ (Figure 4), probably reflecting a combination of organic matter remineralization and water mass mixing. The absence of isotopic fractionation in this subsurface nitrate pool is consistent with complete surface nitrate consumption. Subsequently, nitrate is regenerated at depth from sinking organic matter without retaining the assimilation signal (Sigman and Fripiat, 2019).
Additional insight comes from the subtropical dataset at 20–25°S reported by Harms et al. (2019). In that region, δ15N values between 100 m and 300 m decrease toward the surface as [NO3–] declines. Previous studies have attributed this pattern to inputs of isotopically light nitrogen from diazotrophy and the subsequent return of this low-δ15N signal to the nitrate pool via remineralization-nitrification (Carpenter et al., 1997; Knapp et al., 2008). Atmospheric deposition can also supply isotopically light nitrogen to the surface; however, its contribution in the southwestern Indian Ocean is considered minor (Duce and Tindale, 1991). This context renders N2 fixation the primary source of low-δ15N nitrate at these latitudes. By comparison, the SCTR displays isotopic enrichment in the upper layer due to partial assimilation under nutrient-limited conditions, whereas adjacent oligotrophic regions reflect full nitrate consumption and/or the addition of isotopically light nitrogen, resulting in lower δ15N values even at depth.
5 Conclusion
In this study, we examined the vertical distribution of nitrate isotopes in the SCTR, a key upwelling region in the southwestern tropical Indian Ocean. The isotopic composition in the deep and intermediate layers primarily reflects the influence of distinct water masses. The CDW, originating in the Southern Ocean, carries isotopically light, upstream-derived nitrate, with a possible contribution from nitrate regenerated via remineralization-nitrification, whereas enrichment in the intermediate layer is linked to denitrified waters advected from the northern Indian Ocean. In the upper layer, elevated δ15N and δ18O values result from biological assimilation under limited but sustained nitrate supply. However, these patterns deviate from expectations based on classic Rayleigh or steady-state fractionation. These observations align with a two-end-member mixing model involving newly upwelled and isotopically enriched residual nitrate. These findings support a broader interpretive framework in which isotopic signals shaped by nitrate assimilation (via Rayleigh-type fractionation) can be modified further by post-assimilation mixing. The extent to which each process dominates is governed by the balance between nutrient supply and biological demand in upwelling environments. This framework helps to reconcile the diverse isotopic behaviors observed across different oceanic regimes.
Although our observations offer key insights into nitrogen cycling in the SCTR, the dataset reflects only a short observational window. Interannual climate variability, particularly the Indian Ocean Dipole (IOD) and El Nin˜o–Southern Oscillation (ENSO), modulates upwelling intensity and nutrient supply, potentially altering nitrate isotope distributions at seasonal to annual timescales.
To better constrain the mechanisms and variability of nitrogen cycling in this dynamic system, future research should include multi-year time-series observations of nitrate isotopes across different climate phases. Integrating isotopic data with physical and biogeochemical models could help facilitate distinguishing the roles of water mass transport, upwelling, and biological transformation. Additional focus on nitrogen fixation and its isotopic imprint would clarify external nitrogen inputs to the region.
Data availability statement
The original contributions presented in the study are included in the article/Supplementary Material. Further inquiries can be directed to the corresponding author.
Author contributions
SJ: Methodology, Investigation, Writing – review & editing, Visualization, Writing – original draft. DH: Conceptualization, Writing – review & editing, Supervision. D-JK: Writing – review & editing, Funding acquisition, Project administration. TR: Resources, Writing – review & editing. SK: Investigation, Writing – review & editing. PS: Methodology, Writing – review & editing, Investigation. TL: Supervision, Writing – review & editing.
Funding
The author(s) declare financial support was received for the research and/or publication of this article. This research was supported by Korea Institute of Marine Science & Technology Promotion (KIMST) funded by the Ministry of Oceans and Fisheries (RS-2022-KS221662). SJ was partially supported by KIMST funded by the Ministry of Oceans and Fisheries (RS-2023–00254680).
Acknowledgments
The authors wish to thank the crew of the R/V Isabu for their invaluable assistance with the onboard work. We would like to sincerely thank the editor and reviewers for their constructive and insightful comments, which helped us to improve the clarity and quality of our manuscript.
Conflict of interest
The authors declare that the research was conducted in the absence of any commercial or financial relationships that could be construed as a potential conflict of interest.
Generative AI statement
The author(s) declare that no Generative AI was used in the creation of this manuscript.
Any alternative text (alt text) provided alongside figures in this article has been generated by Frontiers with the support of artificial intelligence and reasonable efforts have been made to ensure accuracy, including review by the authors wherever possible. If you identify any issues, please contact us.
Publisher’s note
All claims expressed in this article are solely those of the authors and do not necessarily represent those of their affiliated organizations, or those of the publisher, the editors and the reviewers. Any product that may be evaluated in this article, or claim that may be made by its manufacturer, is not guaranteed or endorsed by the publisher.
Supplementary material
The Supplementary Material for this article can be found online at: https://www.frontiersin.org/articles/10.3389/fmars.2025.1692656/full#supplementary-material
References
Altabet M. A., Higginson M. J., and Murray D. W. (2002). The effect of millennial-scale changes in Arabian Sea denitrification on atmospheric CO2. Nature 415, 159–162. doi: 10.1038/415159a
Altabet M. A., Wassenaar L. I., Douence C., and Roy R. (2019). A Ti (III) reduction method for one-step conversion of seawater and freshwater nitrate into N2O for stable isotopic analysis of 15N/14N, 18O/16O and 17O/16O. Rapid Commun. Mass. Spectromet. 33, 1227–1239. doi: 10.1002/rcm.8454
Boshers D. S., Granger J., Tobias C. R., Bo¨hlke J. K., and Smith R. L. (2019). Constraining theOxygen isotopic composition of nitrate produced by nitrification. Environ. Sci. Technol. 53, 1206–1216. doi: 10.1021/acs.est.8b03386
Bourbonnais A., Chang B. X., Sonnerup R. E., Doney S. C., and Altabet M. A. (2023). Marine N2O cycling from high spatial resolution concentration, stable isotopic and isotopomer measurements along a meridional transect in the eastern Pacific Ocean. Front. Mar. Sci. 10. doi: 10.3389/fmars.2023.1137064
Brandes J. A., Devol A. H., Yoshinari T., Jayakumar D. A., and Naqvi S. W. A. (1998). Isotopic composition of nitrate in the central Arabian Sea and eastern tropical North Pacific: A tracer for mixing and nitrogen cycles. Limnol. Oceanogr. 43, 1680–1689. doi: 10.4319/lo.1998.43.7.1680
Burns E. (1962). Reduction of ammonium nitrate with titanium(III) chloride in acid media. Anal. Chim. Acta 26, 143–147. doi: 10.1016/s0003-2670(00)88360-9
Carpenter E. J., Harvey H., Fry B., and Capone D. G. (1997). Biogeochemical tracers of the marine cyanobacterium Trichodesmium. Deep. Sea. Res. Part I.: Oceanogr. Res. Papers. 44, 27–38. doi: 10.1016/s0967-0637(96)00091-x
Casciotti K. L., Sigman D. M., Hastings M. G., Bo¨hlke J. K., and Hilkert A. (2002). Measurement of the oxygen isotopic composition of nitrate in seawater and freshwater using the denitrifier method. Anal. Chem. 74, 4905–4912. doi: 10.1021/ac020113w
Cullen J. and Eppley R. (1981). Chlorophyll maximum layers of the Southern-California Bight and possible mechanisms of their formation and maintenance. Oceanol. Acta 4, 23–32.
Deutsch C., Gruber N., Key R. M., Sarmiento J. L., and Ganachaud A. (2001). Denitrification and N2 fixation in the pacific ocean. Global Biogeochem. Cycles. 15, 483–506. doi: 10.1029/2000gb001291
DiFiore P. J., Sigman D. M., Trull T. W., Lourey M. J., Karsh K., Cane G., et al. (2006). Nitrogen isotope constraints on subantarctic biogeochemistry. J. Geophys. Res.: Oceans. 111. doi: 10.1029/2005jc003216
Dilmahamod A., Hermes J., and Reason C. (2016). Chlorophyll-a variability in the Seychelles–Chagos Thermocline Ridge: Analysis of a coupled biophysical model. J. Mar. Syst. 154, 220–232. doi: 10.1016/j.jmarsys.2015.10.011
Ditkovsky S., Resplandy L., and Busecke J. (2023). Unique ocean circulation pathways reshape the Indian Ocean oxygen minimum zone with warming. Biogeosciences 20, 4711–4736. doi: 10.5194/bg-20-4711-2023
Donguy J. R. and Meyers G. (1995). Observations of geostrophic transport variability in the western tropical Indian Ocean. Deep. Sea. Res. Part I.: Oceanogr. Res. Papers. 42, 1007–1028. doi: 10.1016/0967-0637(95)00047-A
Duce R. A. and Tindale N. W. (1991). Atmospheric transport of iron and its deposition in the ocean. Limnol. oceanogr. 36, 1715–1726. doi: 10.4319/lo.1991.36.8.1715
Emery W. J. (2001). Water types and water masses. Encyclopedia. Ocean. Sci. 6, 3179–3187. doi: 10.1006/rwos.2001.0108
Gandhi N., Ramesh R., Prakash S., Noronha S., and Anilkumar N. (2012). Primary and new production in the thermocline ridge region of the southern Indian Ocean during the summer monsoon. J. Mar. Res. 70, 779–793. doi: 10.1357/002224012806770928
Garcia H. E., Bouchard C., Cross S. L., Paver C. R., Reagan J. R., Boyer T. P., et al. (2024). World ocean atlas 2023, volume 4: dissolved inorganic nutrients (phosphate, nitrate, and silicate). doi: 10.25923/39qw-7j08
Gaye B., Nagel B., Da¨hnke K., Rixen T., and Emeis K. (2013). Evidence of parallel denitrification and nitrite oxidation in the ODZ of the Arabian Sea from paired stable isotopes of nitrate and nitrite. Curr. Sci. 27, 1059–1071. doi: 10.1002/2011gb004115
George J. V., Nuncio M., Anilkumar N., Chacko R., and Rajashekhar D. (2018). Seasonal Surface Chlorophyll a Variability in the Seychelles–chagos thermocline ridge (Current Science Association). Current Science 114, 868. doi: 10.18520/cs/v114/i04/868-878
Granger J. and Sigman D. M. (2009). Removal of nitrite with sulfamic acid for nitrate N and O isotope analysis with the denitrifier method. Rapid Commun. Mass. Spectromet. 23, 3753–3762. doi: 10.1002/rcm.4307
Granger J., Sigman D. M., Lehmann M. F., and Tortell P. D. (2008). Nitrogen and oxygen isotope fractionation during dissimilatory nitrate reduction by denitrifying bacteria. Limnol. Oceanogr. 53, 2533–2545. doi: 10.4319/lo.2008.53.6.2533
Granger J., Sigman D. M., Needoba J. A., and Harrison P. J. (2004). Coupled nitrogen and oxygen isotope fractionation of nitrate during assimilation by cultures of marine phytoplankton. Limnol. Oceanogr. 49, 1763–1773. doi: 10.4319/lo.2004.49.5.1763
Granger J., Sigman D., Rohde M., Maldonado M., and Tortell P. (2010). N and O isotope effects during nitrate assimilation by unicellular prokaryotic and eukaryotic plankton cultures. Geochim. Cosmochim. Acta 74, 1030–1040. doi: 10.1016/j.gca.2009.10.044
Harms N. C., Lahajnar N., Gaye B., Rixen T., Da¨hnke K., Ankele M., et al. (2019). Nutrient distribution and nitrogen and oxygen isotopic composition of nitrate in water masses of the subtropical southern Indian Ocean. Biogeosciences 16, 2715–2732. doi: 10.5194/bg-16-2715-2019
Hermes J. C. and Reason C. J. C. (2008). Annual cycle of the South Indian Ocean (Seychelles-Chagos) thermocline ridge in a regional ocean model. J. Geophys. Res.: Oceans. 113. doi: 10.1029/2007JC004363
Herraiz-Borreguero L. and Rintoul S. R. (2011). Subantarctic mode water: Distribution and circulation. Ocean. Dynamics. 61, 103–126. doi: 10.1007/s10236-010-0352-9
Johnson G., Mcphaden M., and Firing E. (2001). Equatorial pacific ocean horizontal velocity, divergence, and upwelling. J. Phys. Oceanogr. 31, 839–849. doi: 10.1175/1520-0485(2001)031<0839:EPOHVD>2.0.CO;2
Kim M., Kang J.-H., Rho T., Kang H.-W., Kang D.-J., Park J.-H., et al. (2022). Mesozooplankton community variability in the Seychelles–Chagos Thermocline Ridge in the western Indian Ocean. J. Mar. Syst. 225, 103649. doi: 10.1016/j.jmarsys.2021.103649
Kim J., Kim Y., Kang H.-W., Kim S. H., Rho T., and Kang D.-J. (2020). Tracing water mass fractions in the deep western Indian Ocean using fluorescent dissolved organic matter. Mar. Chem. 218, 103720. doi: 10.1016/j.marchem.2019.103720
Kim Y., Rho T., and Kang D.-J. (2021). Oxygen isotope composition of seawater and salinity in the western Indian Ocean: Implications for water mass mixing. Mar. Chem. 237, 104035. doi: 10.1016/j.marchem.2021.104035
Knapp A. N., DiFiore P. J., Deutsch C., Sigman D. M., and Lipschultz F. (2008). Nitrate isotopic composition between Bermuda and Puerto Rico: Implications for N2 fixation in the Atlantic Ocean. Global Biogeochem. Cycles. 22. doi: 10.1029/2007gb003107
Koeve W., Eppley R., Podewski S., and Zeitzschel B. (1993). An unexpected nitrate distribution in the tropical North Atlantic at 18° N, 30° W—implications for new production. Deep. Sea. Res. Part II.: Topical. Stud. Oceanogr. 40, 521–536. doi: 10.1016/0967-0645(93)90030-Q
Lee E., Kim C., and Na H. (2022). Suppressed upwelling events in the Seychelles–chagos thermocline ridge of the southwestern tropical Indian ocean. Ocean. Sci. J. 57, 305–313. doi: 10.1007/s12601-022-00075-x
Lehmann N., Granger J., Kienast M., Brown K. S., Rafter P. A., Martínez-Méndez G., et al. (2018). Isotopic evidence for the evolution of subsurface nitrate in the western equatorial Pacific. J. Geophys. Res.: Oceans. 123, 1684–1707. doi: 10.1002/2017JC013527
Locarnini R. A., Mishonov A. V., Baranova O. K., Reagan J. R., Boyer T. P., Seidov D., et al. (2024). World ocean atlas 2023, volume 1: temperature. doi: 10.25923/54bh-1613
Mariotti A., Germon J. C., Hubert P., Kaiser P., Letolle R., Tardieux A., et al. (1981). Experimental determination of nitrogen kinetic isotope fractionation: Some principles: illustration for the denitrification and nitrification processes. Plant Soil 62, 413–430. doi: 10.1007/bf02374138
Marshall T. A., Beal L., Sigman D. M., and Fawcett S. E. (2023a). Instabilities across the agulhas current enhance upward nitrate supply in the southwest subtropical Indian ocean. AGU. Adv. 4. doi: 10.1029/2023av000973
Marshall T. A., Sigman D. M., Beal L. M., Foreman A., Martínez-García A., Blain S., et al. (2023b). The agulhas current transports signals of local and remote Indian ocean nitrogen cycling. J. Geophys. Res.: Oceans. 128. doi: 10.1029/2022jc019413
Martin T. and Casciotti K. (2017). Paired N and O isotopic analysis of nitrate and nitrite in the Arabian Sea oxygen deficient zone. Deep. Sea. Res. Part I.: Oceanogr. Res. Papers. 121, 121–131. doi: 10.1016/j.dsr.2017.01.002
Martin A. and Pondaven P. (2003). On estimates for the vertical nitrate flux due to eddy pumping. J. Geophys. Res.: Oceans. 108. doi: 10.1029/2003JC001841
Matiatos I., Wassenaar L. I., Monteiro L. R., Venkiteswaran J. J., Gooddy D. C., Boeckx P., et al. (2021). Global patterns of nitrate isotope composition in rivers and adjacent aquifers reveal reactive nitrogen cascading. Commun. Earth Environ. 2, 52. doi: 10.1038/s43247-021-00121-x
McCartney M. S. (1979). Subantarctic mode water (Woods Hole, Massachusetts, USA: Woods Hole Oceanographic Institution).
McCreary J. P., Kundu P. K., and Molinari R. L. (1993). A numerical investigation of dynamics, thermodynamics and mixed-layer processes in the Indian Ocean. Prog. Oceanogr. 31, 181–244. doi: 10.1016/0079-6611(93)90002-u
Meinen C. S., McPhaden M. J., and Johnson G. C. (2001). vertical velocities and transports in the equatorial pacific during 1993–99. J. Phys. Oceanogr. 31, 3230–3248. doi: 10.1175/1520-0485(2001)031<3230:VVATIT>2.0.CO;2
Menezes V. V. (2021). Advective pathways and transit times of the Red Sea Overflow Water in the Arabian Sea from Lagrangian simulations. Prog. Oceanogr. 199, 102697. doi: 10.1016/j.pocean.2021.102697
Minagawa M. and Wada E. (1986). Nitrogen isotope ratios of red tide organisms in the East China Sea: A characterization of biological nitrogen fixation. Mar. Chem. 19, 245–259. doi: 10.1016/0304-4203(86)90026-5
Mubarrok S., Azminuddin F., and Jang C. J. (2023). Assessment of thermocline depth bias in the Seychelles–Chagos Thermocline Ridge of the Southwestern Indian Ocean simulated by the CMIP6 models. Front. Mar. Sci. 10. doi: 10.3389/fmars.2023.1239885
O’Connor B. M., Fine R. A., and Olson D. B. (2005). A global comparison of subtropical underwater formation rates. Deep. Sea. Res. Part I.: Oceanogr. Res. Papers. 52, 1569–1590. doi: 10.1016/j.dsr.2005.01.011
Peters B. D., Lam P. J., and Casciotti K. L. (2018). Nitrogen and oxygen isotope measurements of nitrate along the US GEOTRACES eastern pacific zonal transect (GP16) yield insights into nitrate supply, remineralization, and water mass transport. Mar. Chem. 201, 137–150. doi: 10.1016/j.marchem.2017.09.009
Poulain P.-M. (1993). Estimates of horizontal divergence and vertical velocity in the equatorial Pacific. J. Phys. oceanogr. 23, 601–607. doi: 10.1175/1520-0485(1993)023<0601:EOHDAV>2.0.CO;2
Rafter P. A. (2024). On the variability of equatorial Pacific nitrate and iron utilization. Oceanography 37, 72–84. doi: 10.5670/oceanog.2024.411
Rafter P. A., DiFiore P. J., and Sigman D. M. (2013). Coupled nitrate nitrogen and oxygen isotopes and organic matter remineralization in the Southern and Pacific Oceans. J. Geophys. Res.: Oceans. 118, 4781–4794. doi: 10.1002/jgrc.20316
Rafter P. A. and Sigman D. M. (2016). Spatial distribution and temporal variation of nitrate nitrogen and oxygen isotopes in the upper equatorial Pacific Ocean. Limnol. Oceanogr. 61, 14–31. doi: 10.1002/lno.10152
Resplandy L., Vialard J., Lévy M., Aumont O., and Dandonneau Y. (2009). Seasonal and intraseasonal biogeochemical variability in the thermocline ridge of the southern tropical Indian Ocean. J. Geophys. Res.: Oceans. 114. doi: 10.1029/2008JC005246
Rho T. K., Coverly S., Kim E.-S., Kang D.-J., Kahng S.-H., Na T.-H., et al. (2015). Practical considerations for the segmented-flow analysis of nitrate and ammonium in seawater and the avoidance of matrix effects. Ocean. Sci. J. 50, 709–720. doi: 10.1007/s12601-015-0064-7
Rho T., Son P., Choi S.-H., and Kang D.-J. (2022). Cryogenic freezing: A reliable preservation method of samples for seawater nutrient analysis. Limnol. Oceanogr.: Methods 20, 543–552. doi: 10.1002/lom3.10503
Rotiroti M., Sacchi E., Caschetto M., Zanotti C., Fumagalli L., Biasibetti M., et al. (2023). Groundwater and surface water nitrate pollution in an intensively irrigated system: Sources, dynamics and adaptation to climate change. J. Hydrol. 623, 129868. doi: 10.1016/j.jhydrol.2023.129868
Seo J., Kim I., Kang D.-J., Lee H., Choi J. Y., Ra K., et al. (2024). Particulate organic carbon export fluxes across the Seychelles-Chagos thermocline ridge in the western Indian Ocean using 234th as a tracer. Front. Mar. Sci. 10. doi: 10.3389/fmars.2023.1288422
Sigman D. M., Altabet M. A., McCorkle D. C., Francois R., and Fischer G. (1999). The δ15n of nitrate in the southern ocean: Consumption of nitrate in surface waters. Global Biogeochem. Cycles. 13, 1149–1166. doi: 10.1029/1999gb900038
Sigman D. M., Altabet M. A., McCorkle D. C., Francois R., and Fischer G. (2000). The δ15n of nitrate in the southern ocean: Nitrogen cycling and circulation in the ocean interior. J. Geophys. Res.: Oceans. 105, 19599–19614. doi: 10.1029/2000jc000265
Sigman D. M. and Fripiat F. (2019). “Nitrogen isotopes in the ocean,” in Encyclopedia of Ocean Sciences, 3rd ed. (Oxford, United Kingdom: Elsevier), 263–278. doi: 10.1016/B978-0-12-409548-9.11605-7
Smart S. M., Fawcett S. E., Thomalla S. J., Weigand M. A., Reason C. J. C., and Sigman D. M. (2015). Isotopic evidence for nitrification in the Antarctic winter mixed layer. Global Biogeochem. Cycles. 29, 427–445. doi: 10.1002/2014gb005013
Sreeush M. G., Valsala V., Pentakota S., Prasad K. V. S. R., and Murtugudde R. (2018). Biological production in the Indian Ocean upwelling zones–Part 1: refined estimation via the use of a variable compensation depth in ocean carbon models. Biogeosciences 15, 1895–1918. doi: 10.5194/bg-15-1895-2018
Talley L. D., Pickard G. L., Emery W. J., and Swift J. H. (2011). Indian Ocean: Supplementary Materials (Southampton, U.K.: International WOCE Project Office). doi: 10.1016/b978-0-7506-4552-2.10023-x
Vinayachandran P. N. M., Masumoto Y., Roberts M. J., Huggett J. A., Halo I., Chatterjee A., et al. (2021). Reviews and syntheses: Physical and biogeochemical processes associated with upwelling in the Indian Ocean. Biogeosciences 18, 5967–6029. doi: 10.5194/bg-18-5967-2021
Voss M., Dippner J. W., and Montoya J. P. (2001). Nitrogen isotope patterns in the oxygen-deficient waters of the Eastern Tropical North Pacific Ocean. Deep. Sea. Res. Part I.: Oceanogr. Res. Papers. 48, 1905–1921. doi: 10.1016/s0967-0637(00)00110-2
Weisberg R. H. and Qiao L. (2000). Equatorial upwelling in the central Pacific estimated from moored velocity profilers. J. Phys. Oceanogr. 30, 105–124. doi: 10.1175/1520-0485(2000)030<0105:EUITCP>2.0.CO;2
Xie S.-P., Annamalai H., Schott F. A., and McCreary J. P. (2002). Structure and mechanisms of south Indian ocean climate variability. J. Climate 15, 864–878. doi: 10.1175/1520-0442(2002)015<0864:SAMOSI>2.0.CO;2
Yoshikawa C., Makabe A., Matsui Y., Nunoura T., and Ohkouchi N. (2018). Nitrate isotope distribution in the subarctic and subtropical north pacific. Geochem. Geophys. Geosyst. 19, 2212–2224. doi: 10.1029/2018gc007528
Yoshikawa C., Yamanaka Y., and Nakatsuka T. (2005). An ecosystem model including nitrogen isotopes: perspectives on a study of the marine nitrogen cycle. J. Oceanogr. 61, 921–942. doi: 10.1007/s10872-006-0010-5
Keywords: nitrate isotopes, Indian Ocean, Seychelles–Chagos Thermocline Ridge, nitrogen cycle, upwelling
Citation: Jeong S, Hahm D, Kang D-J, Rho T, Kang S, Son P and Lee T (2025) Upwelling shapes nitrate isotope distribution in the Seychelles–Chagos Thermocline Ridge in the Indian Ocean. Front. Mar. Sci. 12:1692656. doi: 10.3389/fmars.2025.1692656
Received: 26 August 2025; Accepted: 10 November 2025; Revised: 08 November 2025;
Published: 25 November 2025.
Edited by:
Wentao Wang, Chinese Academy of Sciences (CAS), ChinaReviewed by:
Chisato Yoshikawa, Japan Agency for Marine-Earth Science and Technology (JAMSTEC), JapanXiaosong Zhong, Ministry of Natural Resources, China
Copyright © 2025 Jeong, Hahm, Kang, Rho, Kang, Son and Lee. This is an open-access article distributed under the terms of the Creative Commons Attribution License (CC BY). The use, distribution or reproduction in other forums is permitted, provided the original author(s) and the copyright owner(s) are credited and that the original publication in this journal is cited, in accordance with accepted academic practice. No use, distribution or reproduction is permitted which does not comply with these terms.
*Correspondence: Doshik Hahm, aGFobUBwdXNhbi5hYy5rcg==