Abstract
The Nanji Islands, a nationally protected marine reserve in China, support high biodiversity but face significant fishery resource depletion. This study aims to describe the community structure of larval and juvenile fishes in the surf zone, a critical nursery habitat, to provide baseline data for conservation and management. Monthly surf zone sampling was conducted at five stations around Nanji Island from March 2023 to February 2024. Samples were collected during daytime (8:00-17:00) using a seine net (1×4m, 1mm mesh) with three replicates per station. A total of 8,568 fish were collected, representing 35 species from 21 families. The community was dominated by postflexion larvae (89.41%). Engraulidae was the most abundant family, with Engraulis japonicus constituting 91.30% of all specimens. Species number and catch per unit of effort (CPUE) peaked in August (16 species) and May, respectively, with minimal abundances from December to March. All diversity indices were highest in August and lowest in January. Cluster analysis of the data from 12 months indicated a strong, though not statistically significant, ecological pattern of community separation. The five stations were divided into western and eastern clusters. The species number, Margalef’s richness index, and Shannon–Wiener’s diversity index showed a positive correlation with temperature, but salinity showed a negative correlation with species number, CPUE and Shannon–Wiener’s diversity index. Niche partitioning observed between surf zone and open sea species in the Nanji Islands indicates that the surf zone acts as a specialized nursery for a subset of species (e.g., Engraulis japonicus and Lateolabrax maculatus), as opposed to a general habitat for all larval and juvenile fishes. The research contributes essential data necessary for the conservation and sustainable management of Nanji Island’s fisheries.
1 Introduction
The Nanji Islands are located southeast of Pingyang County, Zhejiang Province in the East China Sea and were designated as one of China’s first five national marine nature reserves in 1990. They were later accepted by United Nations Educational, Scientific and Cultural Organization (UNESCO) as a member of the World Network of Biosphere Reserves. The islands are 45 km away from the mainland, with a total protected area of 201.06 km2 and a land area of 11.13 km2, comprising 85 islands, including Nanji Island (Cai, 2021). This area is part of the Wen-Tai fishing grounds and is influenced by the Taiwan Warm Current and the Jiangzhe Coastal Current (Li et al., 2024). The specific geographic location and unique natural environment have created a rich and diverse marine ecosystem, making it one of the richest fishery resources areas in the East China Sea. However, the marine fishery resources in the Pingyang County have declined in recent years (Figure 1) (Wenzhou Municipal Bureau of statistics, and Survey Office of the National Bureau of Statistics in Wenzhou, 2012-2023). Lin (2011) reported that the economically important fish species, such as Larimichthys crocea and Larimichthys polyactis, declined sharply, while there is an increase in the occurrence of low-value fish, like Harpadon nehereus and Benthosema pterotum. Current research on fish resources in the Nanji Islands mainly involved species composition (Sarr et al., 2024), the relationship between fish distribution and environmental factors (Sarr et al., 2023), and aquaculture (Yin et al., 2025).
Figure 1
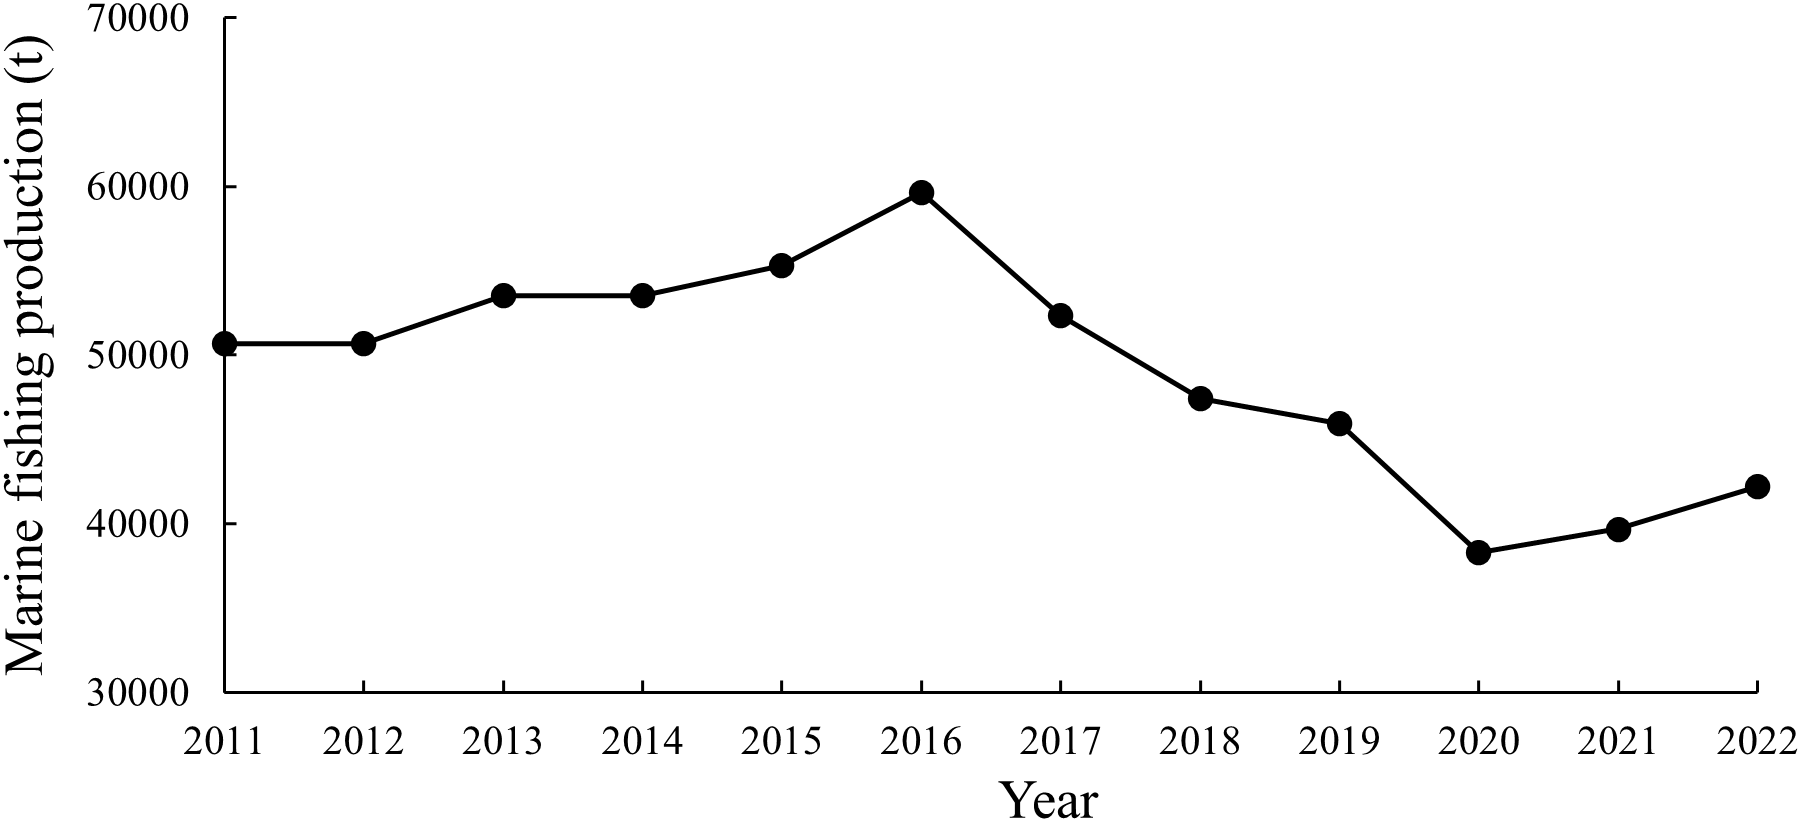
Marine fishing production in the Pingyang County from 2011 to 2022 (Wenzhou Municipal Bureau of statistics, and Survey Office of the National Bureau of Statistics in Wenzhou, 2012-2023).
The early life stages of fish, such as eggs and larvae, are highly vulnerable, with mortality rates reaching up to 99%. This extreme mortality is largely attributed to the larvae’s limited swimming capabilities, which hinder their ability to escape unfavorable environmental conditions, avoid predators, or locate sufficient prey (Arevalo et al., 2023). The survival of fish larvae directly affects the fish community. It is important to investigate the early life stages of fish assemblages to assess the fish resources, and these investigations could be used for the conservation and management of fisheries. However, there has been limited research regarding on the early life stages of fishes in the Nanji Islands. Wang et al. (2024) conducted a monthly collection at 12 stations around the Nanji Islands by using horizontal tow at the surface layer throughout one year. The fish larvae and juveniles were collected by a larval net (1.3 m mouth diameter, 0.5 mm mesh aperture). A total of 59 species in 31 families were collected. It’s interesting that the larval density was the highest in winter than other seasons due to huge number of Sebastiscus marmoratus preflexion larvae.
Surf zones, the area of breaking waves abutting ocean beaches, serve as nurseries, refuges, foraging areas, and dispersal corridors for organisms, especially fishes, in their early life stages (Olds et al., 2018; Xia et al., 2023). A large number of studies have been conducted in the surf zone of South Africa (McGregor et al., 2021; Muller et al., 2023), Brazil (Esmaeili et al., 2021; Contente et al., 2023), United States (Marraffini et al., 2024), Australia (Henderson et al., 2022), and Japan (Iida et al., 2021; Shimizu et al., 2022), mainly focus on species composition and community structure, distribution, sampling methods and food habits, among others. The surf zone was easily overlooked, and the survey of larval and juvenile fish in the surf zone started late in China, and the relevant studies were primarily focused on the Yangtze River estuary (Jiang et al., 2008; 2009) and adjacent water (Chen et al., 2011; Mao et al., 2013; Wang et al., 2018), as well as the Hainan Island (Xia et al., 2023; 2024) and the Jiulong River (Lin et al., 2009). These surf zones serve as essential nursery habitats for numerous commercially valuable species.
In this study, we aimed to determine the main changes in the fish community structure in the sandy beach surf zones of Nanji Island throughout one year, identify the dominant species, clarify the relationships between larval and juvenile fishes and environmental factors, and discuss the differences in larval and juvenile fish assemblages between the surf zone and the open sea. This information can provide valuable support to the local fisheries industry.
2 Materials and methods
Larval and juvenile fishes were collected monthly from March 2023 to February 2024 at five sampling stations (St.1-St.5, Table 1, Figure 2) in the sandy beach surf zones along the coast of Nanji Island during daytime. A small seine net (1 × 4 m, 1 mm mesh aperture) was used to collect the fish. The net was actively towed by two wading researchers along a path parallel to the shoreline. Each haul covered a distance of approximately 50 m at a constant walking speed and a water depth of 0.2 to 1.0 m. Sampling was repeated three times at each sampling station. Water temperature (°C) and salinity (ppt) were measured on site with a thermometer and a digital salinometer during the sampling period. This study was conducted under a fishing permit authorized and granted by the Nanji Islands National Marine Nature Reserve Administration.
Table 1
| Station | Artificial facility nearby |
|---|---|
| St.1 | village, ferry port, aquaculture cages |
| St.2 | village, aquaculture cages |
| St.3 | tourist spot |
| St.4 | village |
| St.5 | biggest village, fishing port |
Situation of sampling stations in the sandy beach surf zone of Nanji Island.
All sampling stations substrate are sandy.
Figure 2
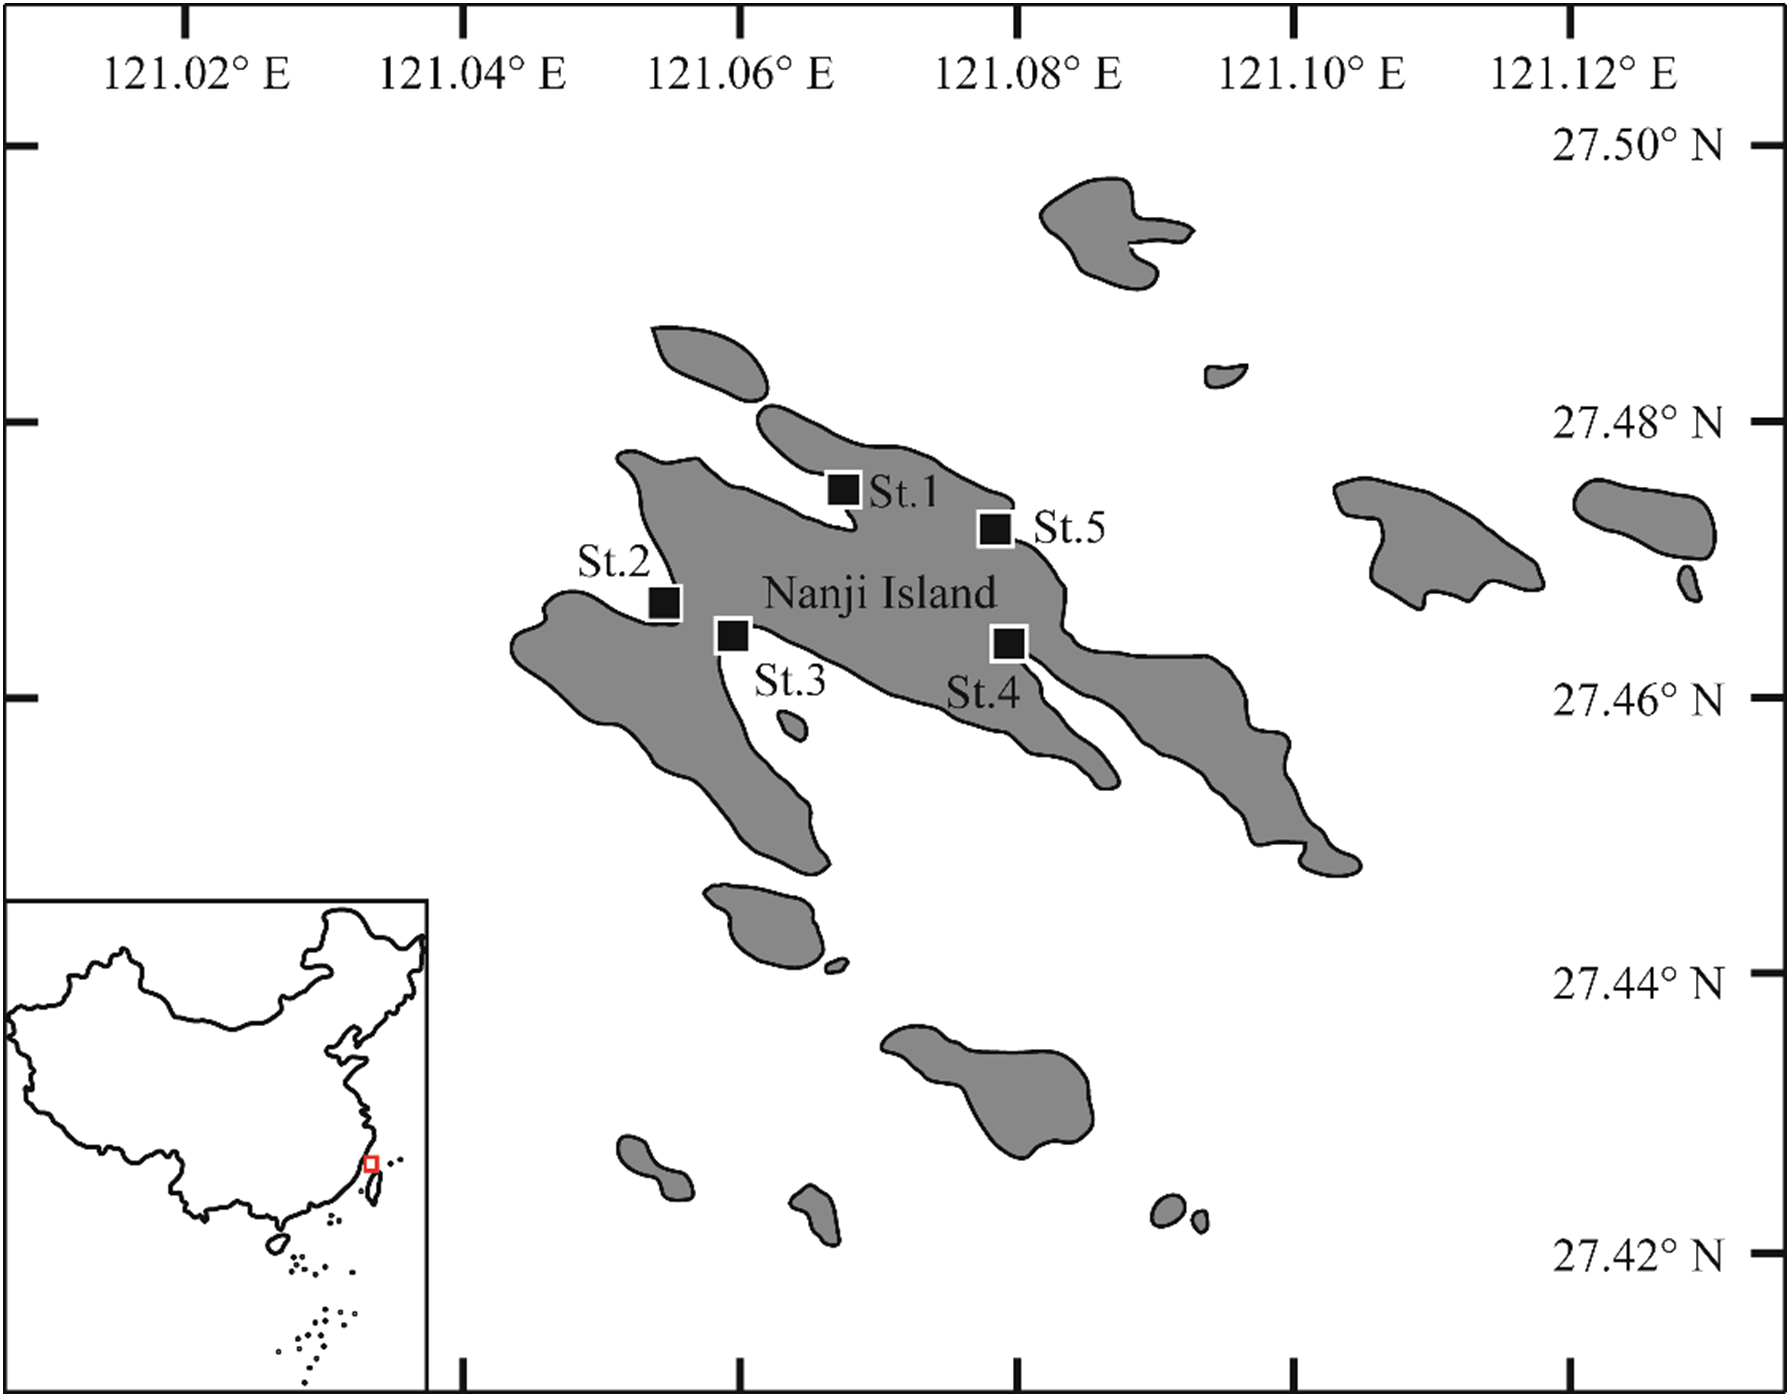
Sampling stations in the sandy beach surf zone of Nanji Island, Zhejiang Province, China. Black squares represent sampling stations.
All samples were fixed in a 5% seawater formalin solution and subsequently preserved in 75% ethanol. Fish were counted and identified to the lowest possible taxonomic level based on the number of myomere, fin composition, the shape and location of head spine and melanophore, etc., identified using morphological characteristics described in (Okiyama, 2014; Wu and Zhong, 2021). Unlabeled lengths refer to body length (BL) (notochord length for preflexion and flexion larvae, and standard length for postflexion larvae, juveniles, and young individuals). A maximum of 100 specimens of each species were measured in each haul.
The catch per unit of effort (CPUE, individual/hauls) was calculated using the following equation
where n is the number of collected individual, E is the number of hauls.
The index of relative importance (IRI) was calculated for each species using the formula
where N% is the percentage of the number of each species among the total number of fish species and F% is the species frequency per species sampled in percentage. Accordingly, each species was defined as dominant (IRI ≥ 100), common (100 > IRI ≥ 10), or rare (IRI < 10).
Diversity studies were conducted using Margalef’s richness index (D), Shannon–Wiener’s diversity index (H’), and Pielou’s evenness index (J) (Xia et al., 2023).
where S is the number of larval and juvenile fishes; N is the number of species; and Pi is the proportion of individuals in taxa i.
To evaluate the variation in the structure of the larval and juvenile fish assemblages, the CPUE data were log10(x+1) transformed to mitigate the influence of extremum and then analyzed using non-metric multi-dimensional scaling (n-MDS) based on the Bray–Curtis’s similarity index. For visualization, a two-dimensional n-MDS plot was generated with cluster points (CLUSTER) to illustrate the relationships among samples. Stress is a value between 0 and 1 and expresses a proportion between the distance in the original dissimilarity matrix and the fitted distance in ordination space. The lower the stress value, the better is the fit. The stress values <0.05 indicate excellent. The analysis of similarities (ANOSIM) was employed to assess differences between assemblages (by month or station), while the percentage similarity analysis (similarity of percentage analysis, SIMPER) was used to identify the contributions of individual species to the overall similarity within communities (Jiang et al., 2009). All these analyses were conducted using Primer 6.0.
Differences in the species number, CPUE, Margalef’s richness index, Shannon–Wiener’s diversity index, and Pielou’s evenness index among all sampling months or stations were tested using the Kruskal–Wallis test. Furthermore, Spearman correlation coefficients were calculated using SPSS 19.0 to examine the relationships between environmental and biotic variables.
3 Results
3.1 Species composition
In the present study, a total of 8568 larval and juvenile fishes were collected, representing 35 species, 28 genera, and 21 families (Table 2). Among them, postflexion larvae constituted the majority (89.41%), followed by young (7.56%), juveniles (2.98%), and flexion larvae (0.05%). No earlier stage larvae were collected. Engraulidae was the most abundant family, with three species accounting for 91.33% of the total number of collected fish. Other families with multiple species included Mugilidae, Gerreidae, Terapontidae, Sparidae, and Lutjanidae (each with three species), followed by Kyphosidae and Sillaginidae (each with two species). The remaining families were represented by a single species each. According to the IRI results, the dominant species was Engraulis japonicus, accounting for 91.30% of the total number of samples collected. The common species was Valamugil speigleri (2.73%), while all other species were rare species.
Table 2
| Species | Abundance% | Developmental stage | Body length (mm) | IRI | Occurring Month |
|---|---|---|---|---|---|
| Engraulidae | |||||
| Engraulis japonicus† | 91.3 | Post,Y | 12.40-61.75 | 464.26 | 5, 6 |
| Stolephorus commersonii† | 0.01 | Post | 28.96 | 0.01 | 10 |
| Thryssa hamiltonii | 0.02 | Post | 16.13-16.37 | 0.01 | 9 |
| Chanidae | |||||
| Chanos chanos† | 0.34 | Post | 9.67-12.35 | 0.96 | 7, 9 |
| Myctophidae | |||||
| Benthosema pterotum† | 0.08 | Y | 27.72-32.91 | 0.14 | 11 |
| Gobiidae | |||||
| Tridentiger obscurus | 0.01 | Post | 7.65 | 0.01 | 8 |
| Ambassidae | |||||
| Ambassis gymnocephalus† | 0.64 | Post-J | 3.8-13.86 | 3.26 | 7, 9 |
| Mugilidae | |||||
| Planiliza haematocheilus† | 0.15 | Y | 13.67-42.45 | 0.6 | 7, 8, 10, 11 |
| Mugil cephalus† | 0.19 | Y | 15.01-29.69 | 0.74 | 3, 12, 2 |
| Valamugil speigleri | 2.73 | Y | 12.05-166.60 | 29.32 | 4, 6 |
| Exocoetidae | |||||
| Hirundichthys oxycephalus | 0.01 | Post | 4.40 | 0.01 | 6 |
| Carangidae | |||||
| Trachinotus ovatus | 0.02 | Y | 59.12-61.48 | 0.01 | 8 |
| Sphyraenidae | |||||
| Sphyraena pinguis | 0.02 | Y | 55.01-59.26 | 0.01 | 8 |
| Gerreidae | |||||
| Gerres erythrourus | 0.43 | J | 10.78-14.79 | 1.71 | 6, 8, 9 |
| Gerres filamentosus | 0.08 | J | 11.40-15.40 | 0.18 | 7, 8 |
| Gerres japonicus† | 0.18 | Post-J | 6.03-11.49 | 0.4 | 7, 8 |
| Mullidae | |||||
| Upeneus japonicus | 0.01 | Y | 64.94 | 0.01 | 7 |
| Kyphosidae | |||||
| Girella punctata | 0.13 | Post-Y | 14.23-38.41 | 0.29 | 4, 6 |
| Microcanthus strigatus | 0.01 | J | 15.17 | 0.01 | 4 |
| Terapontidae | |||||
| Pelates quadrilineatus† | 0.01 | J | 10.75 | 0.01 | 6 |
| Terapon jarbua† | 0.58 | Post-J | 10.70-40.36 | 6.59 | 6, 11 |
| Terapon theraps | 0.02 | J | 8.70-8.77 | 0.03 | 6, 7 |
| Leiognathidae | |||||
| Nuchequula nuchalis | 0.04 | J | 11.40-12.71 | 0.04 | 8 |
| Lutjanidae | |||||
| Lutjanus fulviflamma | 0.01 | Y | 19.09 | 0.01 | 8 |
| Lutjanus sp.1 | 0.01 | Y | 20.79 | 0.01 | 10 |
| Lutjanus sp.2 | 0.01 | Y | 18.51 | 0.01 | 10 |
| Scatophagidae | |||||
| Scatophagus argus† | 0.02 | J-Y | 10.04-24.21 | 0.03 | 7, 9 |
| Stichaeidae | |||||
| Dictyosoma burgeri | 0.12 | F-Post | 6.00-13.46 | 0.26 | 4 |
| Moronidae | |||||
| Lateolabrax maculatus† | 0.36 | Post-Y | 11.18-74.8 | 2.66 | 3, 6 |
| Sillaginidae | |||||
| Sillago japonica | 0.09 | Post-J | 9.97-14.44 | 0.21 | 6, 8 |
| Sillago sihama† | 0.89 | Post-J | 9.87-17.58 | 7.02 | 7, 9 |
| Sparidae | |||||
| Acanthopagrus latus† | 0.21 | J-Y | 10.90-17.19 | 0.83 | 11, 1-2 |
| Acanthopagrus schlegelii† | 0.30 | J-Y | 11.72-28.01 | 1.71 | 4,5 |
| Pagrus major | 0.01 | J | 12.12 | 0.01 | 8 |
| Tetraodontidae | |||||
| Takifugu alboplumbeus | 0.92 | Post-Y | 6.04-24.60 | 7.81 | 4-6, 8, 10 |
Species composition, developmental stage (F: flexion larvae; Post: postflexion larvae; J: juveniles; Y: young), body length, index of relative importance (IRI) values, and occurring month of larval and juvenile fishes collected from the surf zone of Nanji Island from March 2023 to February 2024.
†represents this species occurred in the open sea of the Nanji islands (Wang et al., 2024).
3.2 Temporal variations
The CPUE increased from March to May 2023, then declined from June 2023 to February 2024 (Figure 3). The highest CPUE was recorded in May, when 7554 postflexion larvae of E. japonicus were collected (Kruskal–Wallis test, p = 0.015). The highest species number was observed in August (16 species), followed by June and July (11 species each). In contrast, only one or two species with few individuals were collected during later autumn and winter (Kruskal–Wallis test, p = 0.004). Margalef’s richness index ranged from 0 to 3.58, with a mean value of 1.21 ± 0.27 (Kruskal–Wallis test, p = 0.023). Pielou’s evenness index ranged from 0 to 0.85 (mean 0.56 ± 0.08, Kruskal–Wallis test, p = 0.023), and the Shannon–Wiener diversity index ranged from 0 to 2.36 (mean 0.95 ± 0.20, Kruskal–Wallis test, p = 0.023). All three diversity indexes exhibited similar trends, with the highest values in August, followed by July and June, and the lowest in January (Figure 4).
Figure 3
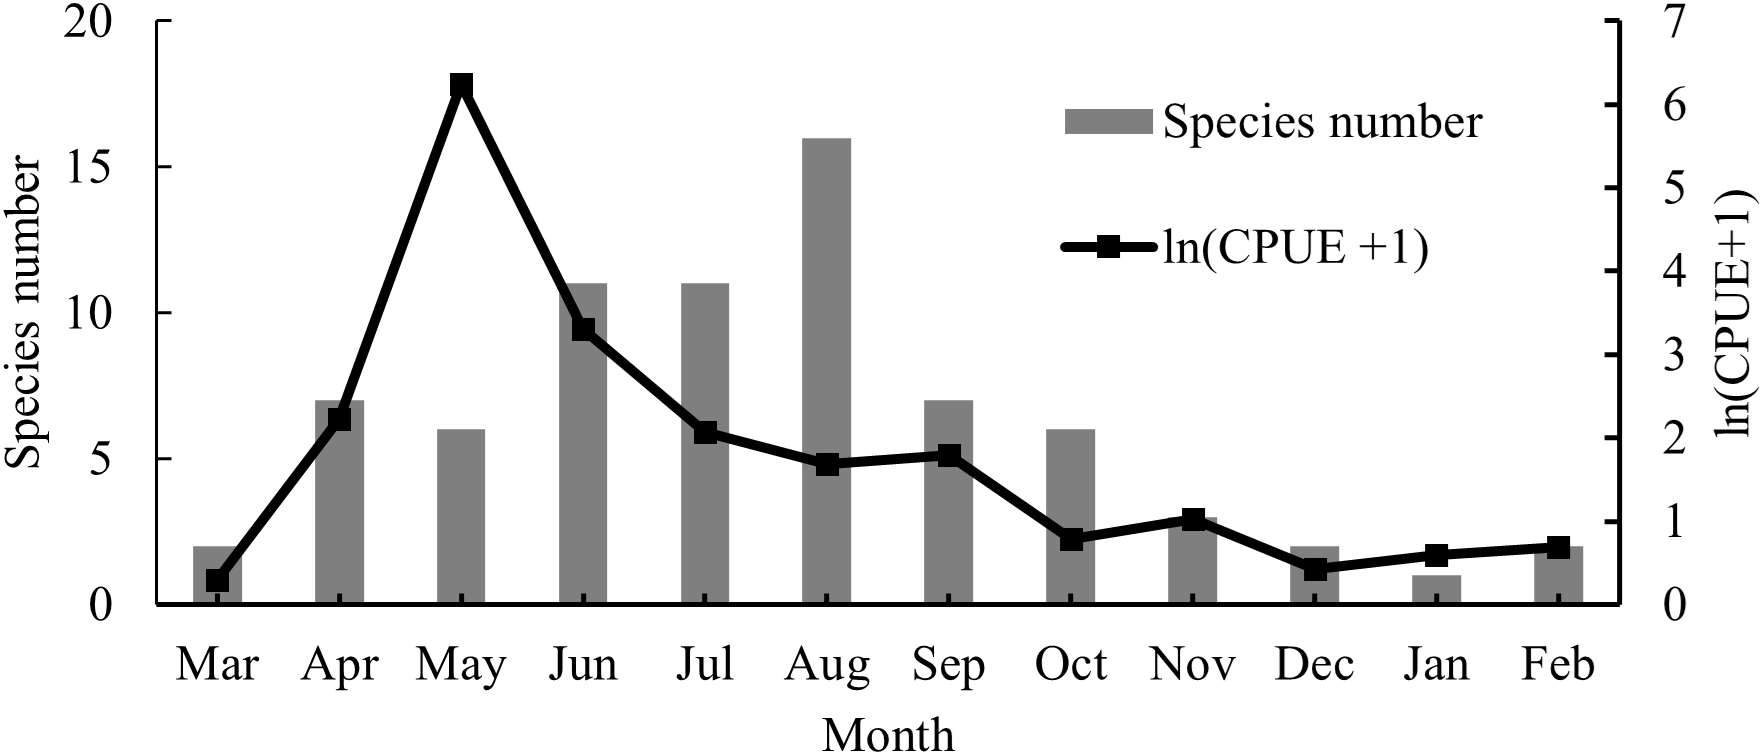
Temporal variations of species number and CPUE.
Figure 4
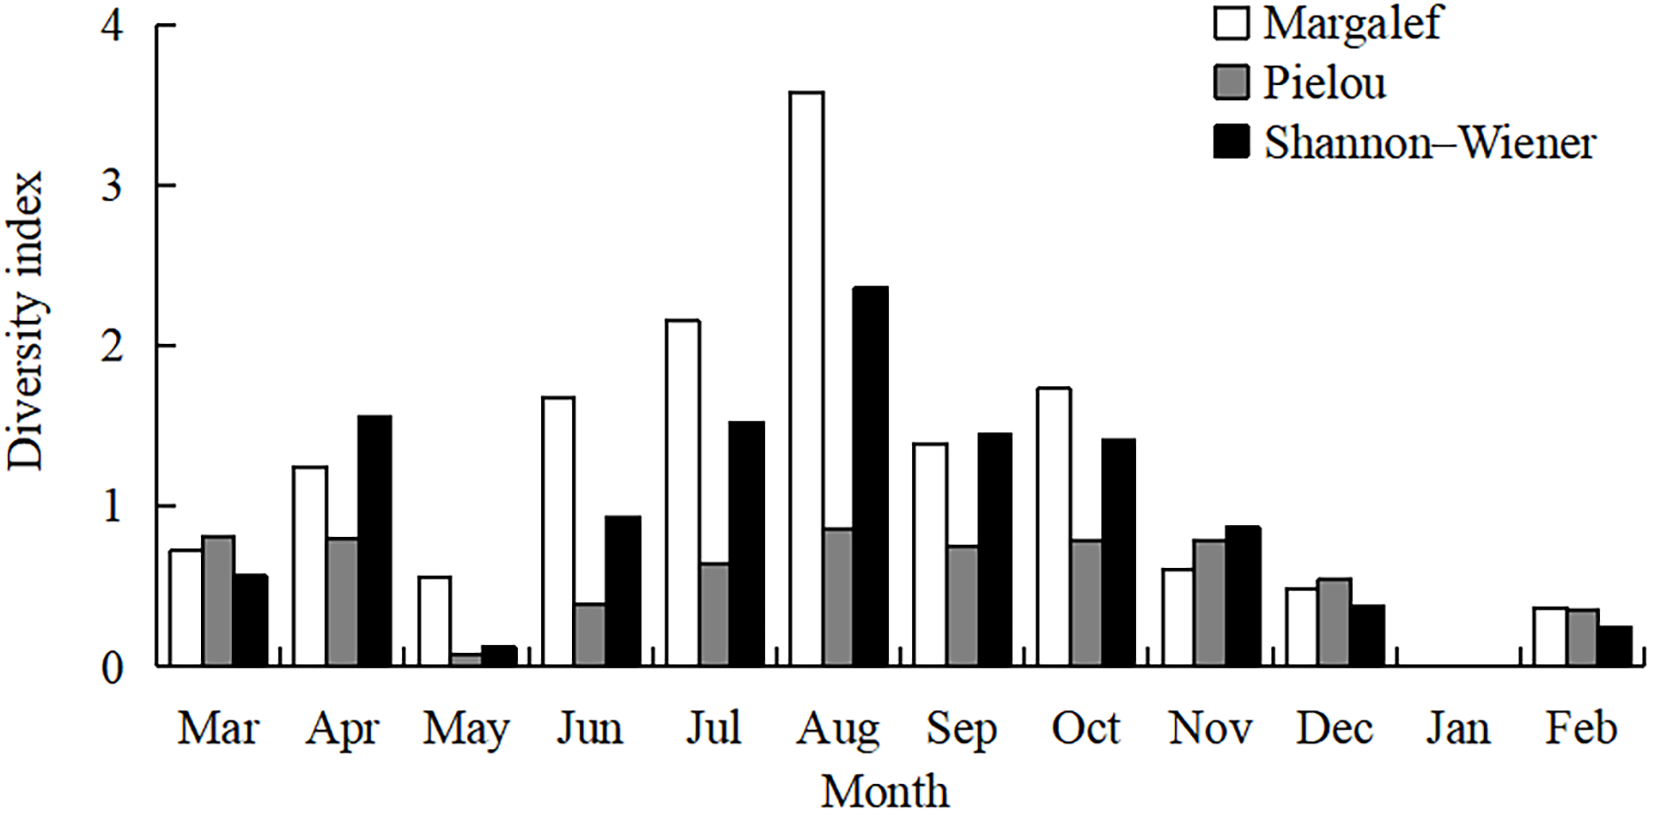
Temporal variations of three diversity indexes.
The monthly cluster analysis revealed that the12 months could be divided into four groups based on a similarity threshold of 10 (Figure 5). February, March, and December formed Group I (winter group), April-June formed Group II (spring group), July-November formed Group III (summer-autumn group), January was Group IV. The n-MDS analysis showed a stress value of 0.01. ANOSIM analysis revealed a strong, though not statistically significant, ecological pattern of community separation (R = 0.958, P = 0.1), potentially due to limited sample size. SIMPER analysis showed that the average similarity within Group I was 14.30%, with Mugil cephalus contributing 100.00%. The average similarity with Group II was 42.78%, with V. speigleri contributing 54.68% and E. japonicus contributing 26.65%. The average similarity within Group III was 32.02%, with Terapon jarbua, Sillago sihama, and Planiliza haematocheilus contributing 46.79%, 22.85%, and 15.04%, respectively.
Figure 5
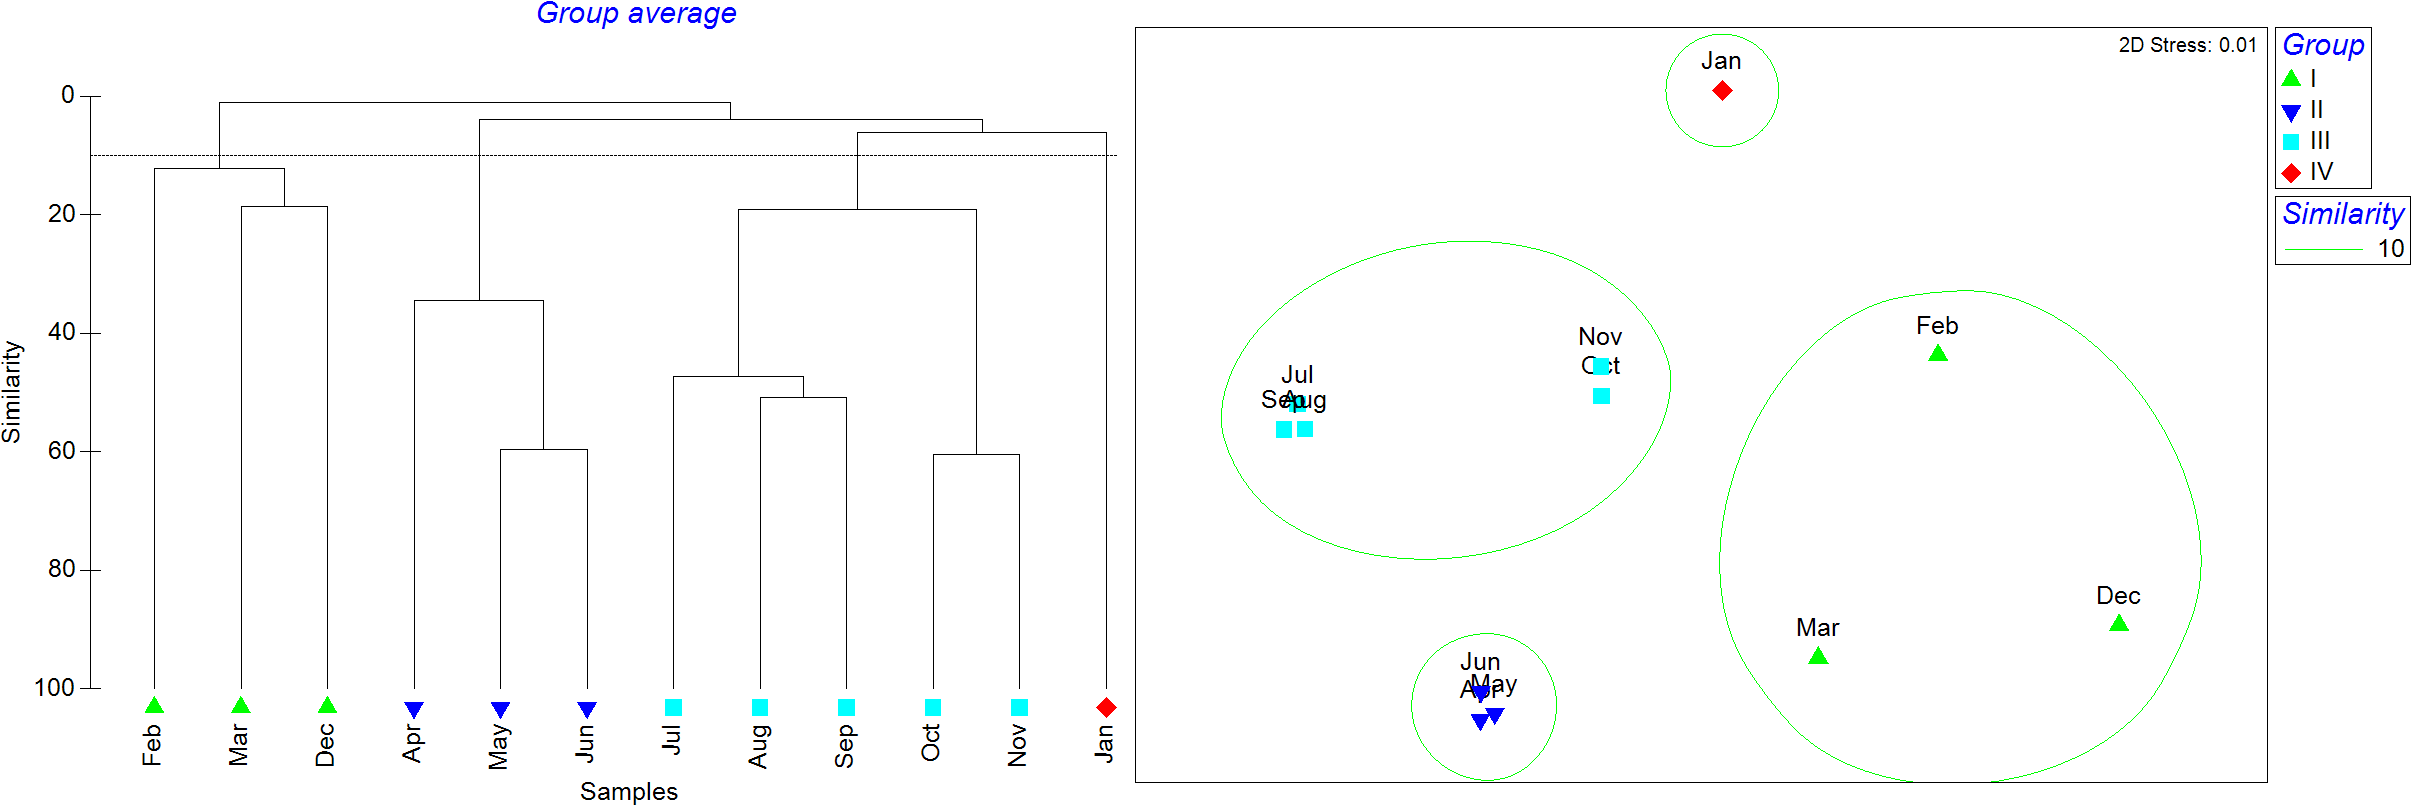
Cluster analysis of larval and juvenile fish community among 12 months.
3.3 Spatial variations
The highest CPUE was observed at St.3, followed by St.4, St.5, St.1, and St.2 (Kruskal–Wallis test, p = 0.035). Species number was highest at St.5 and lowest at St.3 (Figure 6, Kruskal–Wallis test, p = 0.058). Margalef’s richness index ranged from 0.68 to 4.05, with a mean value of 2.67 ± 0.56 (Kruskal–Wallis test, p = 0.076). Pielou’s evenness index ranged from 0.02 to 0.88 (mean 0.48 ± 0.13, Kruskal–Wallis test, p = 0.050)), and Shannon–Wiener diversity index ranged from 0.04 to 2.49 (mean 1.38 ± 0.38, Kruskal–Wallis test, p = 0.060). All diversity indexes were highest at St.2 and lowest at St.3 (Figure 7).
Figure 6
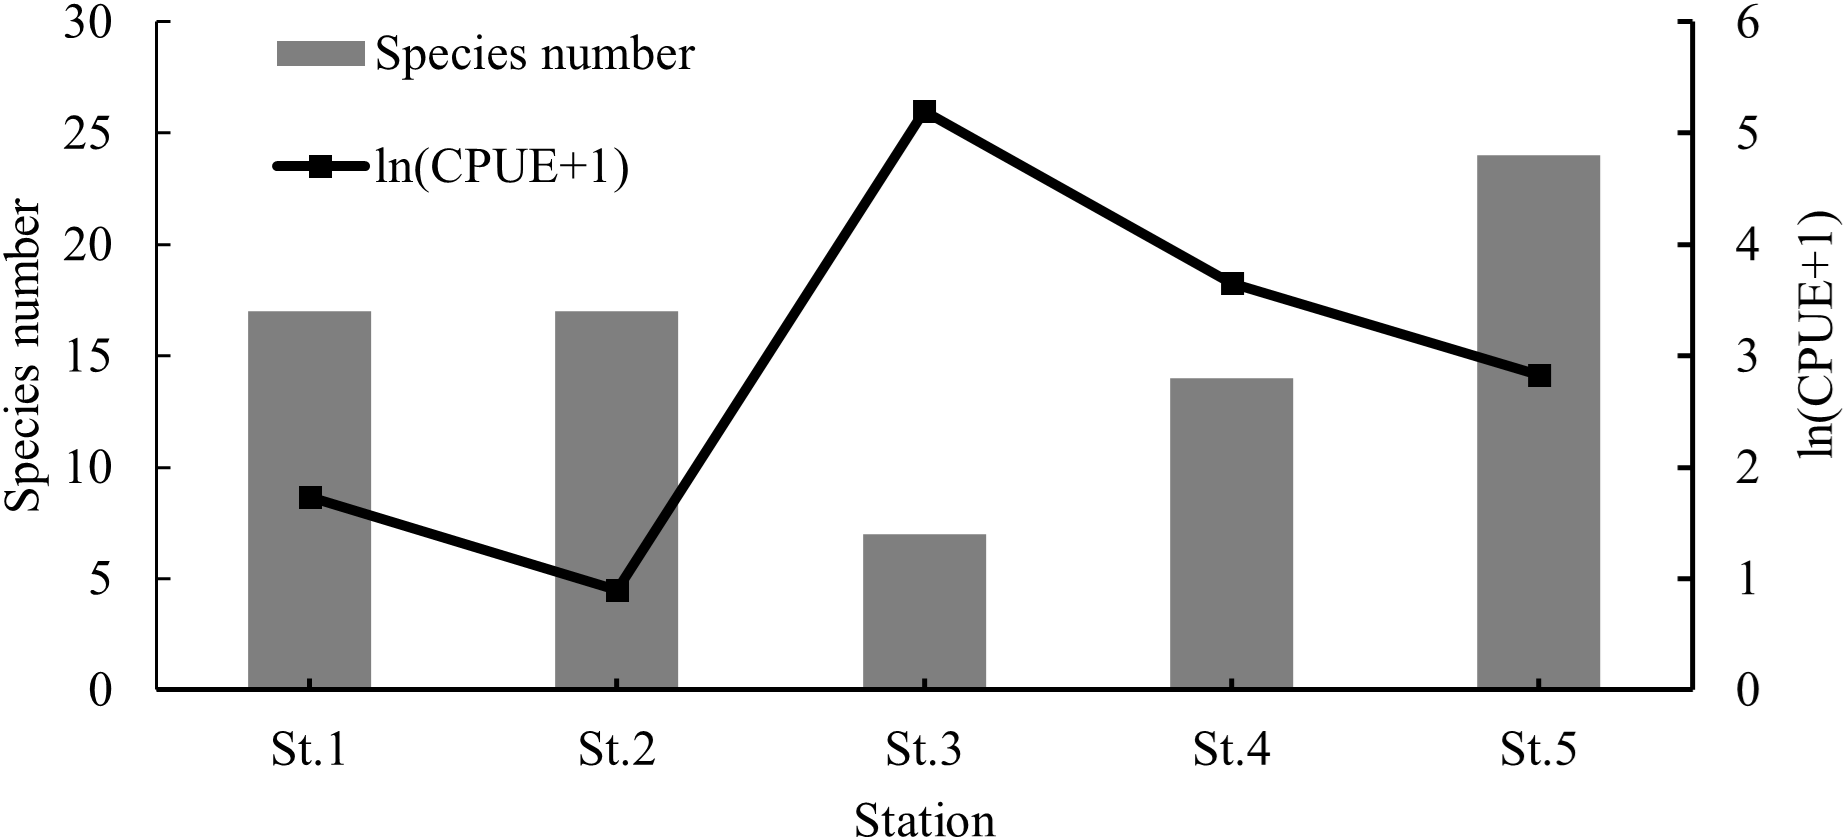
Spatial variations of species number and CPUE.
Figure 7
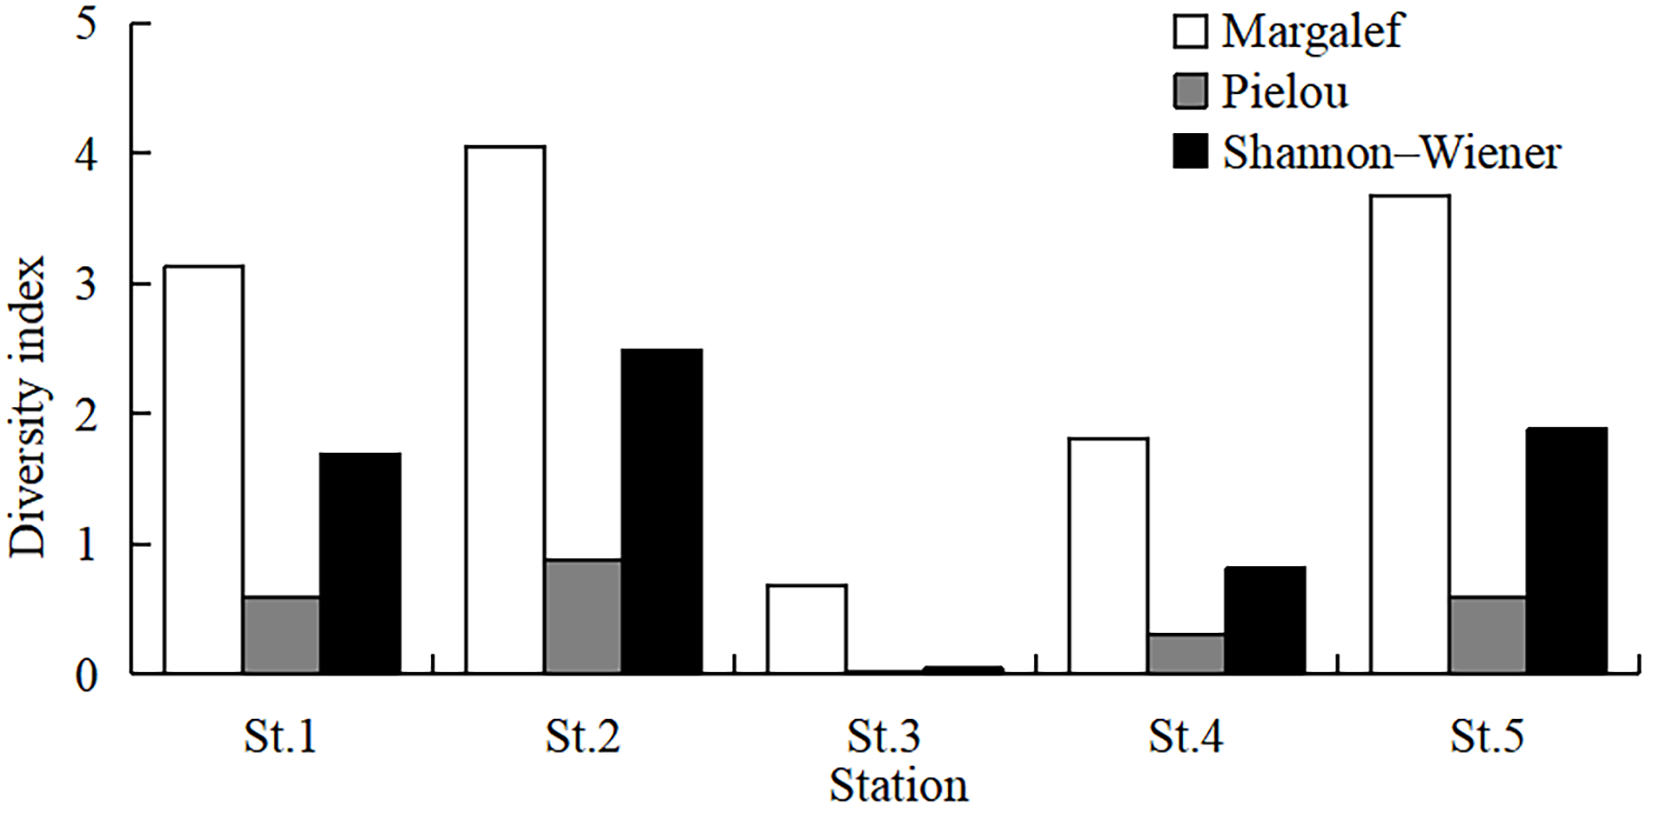
Spatial variations of three diversity indexes.
The station cluster analysis revealed that the five stations could be divided into two groups based on a similarity threshold of 30 (Figure 8). Sts.1–2 was clustered as Group I, located on the west coast of the island, while Sts.3–5 formed Group II, located on the east coast. The n-MDS analysis showed a stress value of 0. ANOSIM analysis revealed a strong but not statistically significant ecological pattern between the two groups (R = 0.833, P = 0.1) due to limited sample size. SIMPER analysis showed that the average similarity within Group I was 36.78%, with V. speigleri contributing 27.47%, Gerres erythrourus contributing 12.97%, and T. jarbua contributing 12.97%. The average similarity within Group II was 51.06%, with E. japonicus contributing 71.22% and V. speigleri contributing 13.71%.
Figure 8
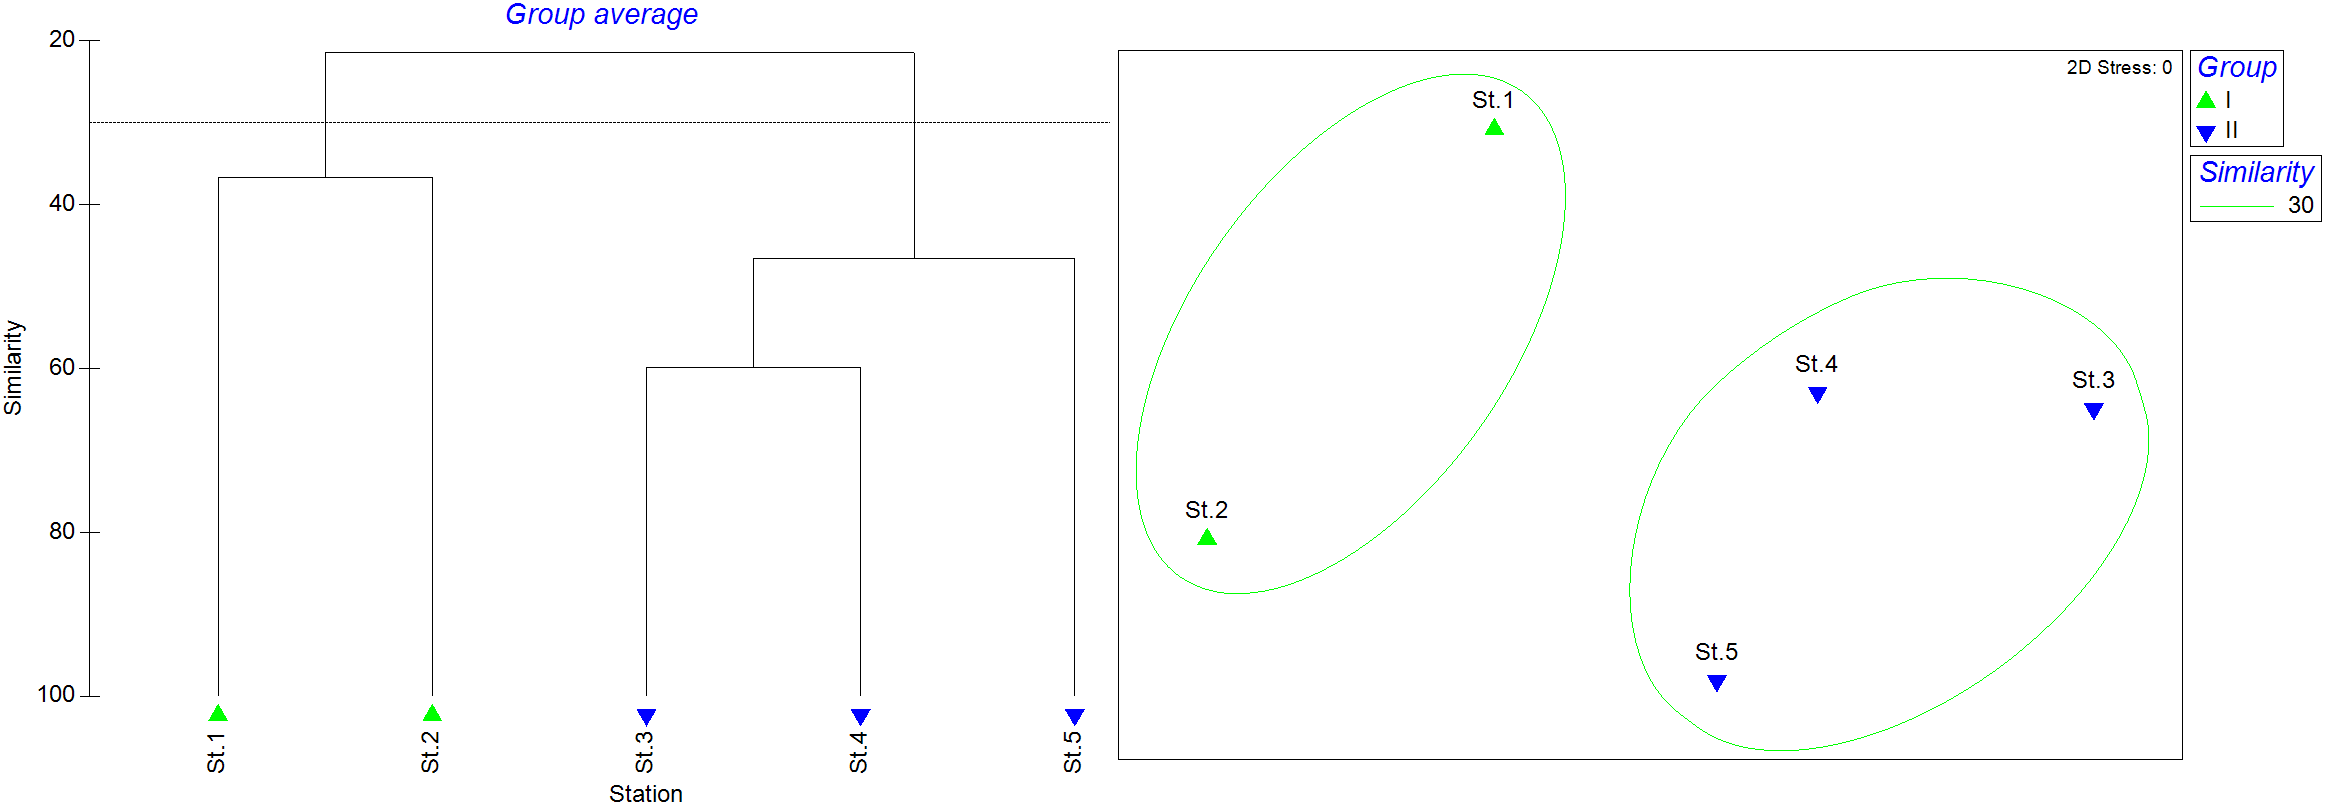
Cluster analysis of larval and juvenile fish community among 5 stations.
3.4 Environmental conditions
The water temperature in the sandy beach surf zones exhibited distinct seasonal variations. It gradually increased from March to September 2023 and then decreased steadily until February 2024. The temperature was notably lower in January and February 2024. Salinity showed highly variability throughout the study period. It remained around 24 ppt from March to July 2023. In August and September 2023, the salinity dropped to relatively low levels due to the influence of the typhoon season. From October 2023 to February 2024, salinity returned to approximately 30 ppt (Figure 9).
Figure 9
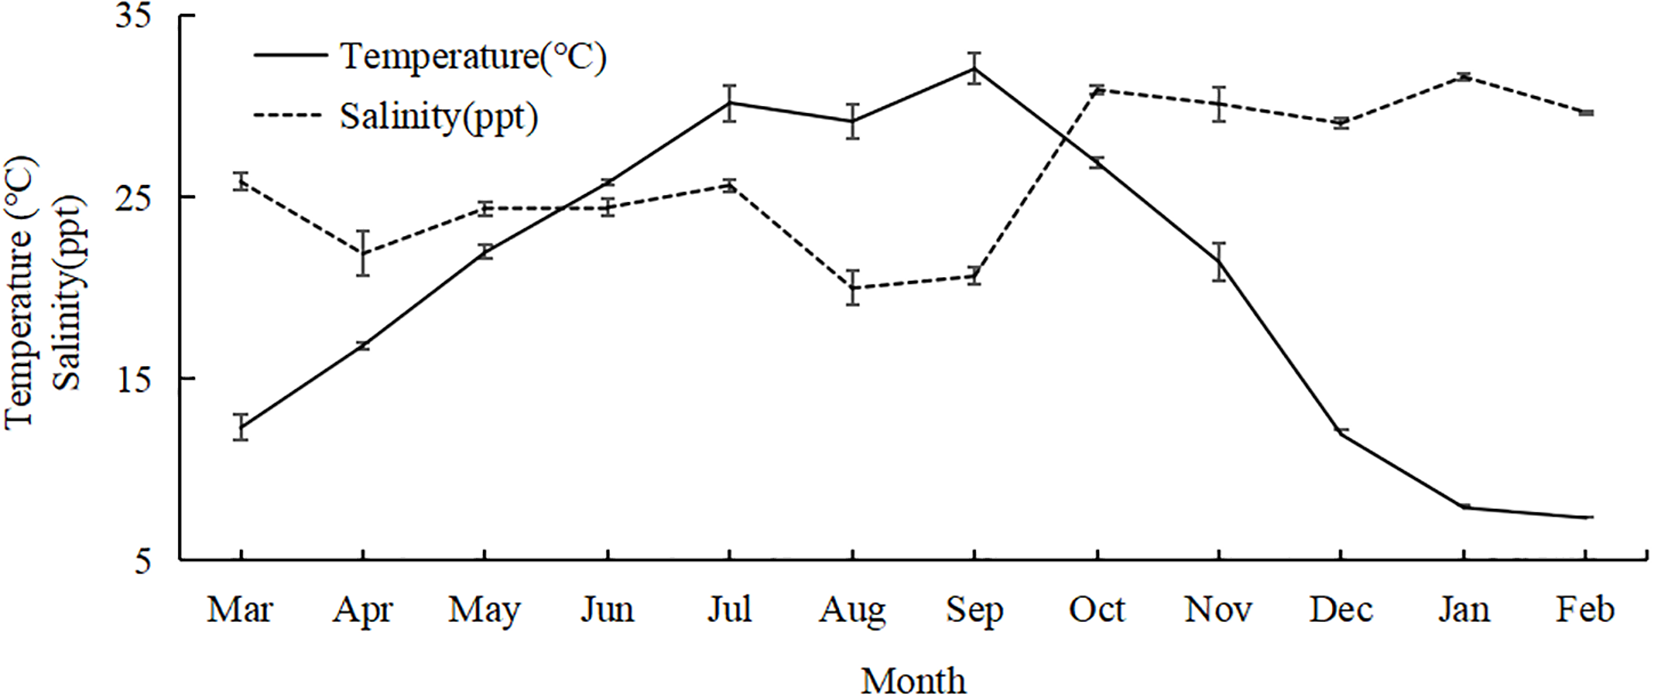
Water temperature and salinity from March 2023 to February 2024.
3.5 The relationships between environmental and biotic variables
The species number, Margalef’s richness index, and Shannon–Wiener’s diversity index exhibited positive correlation with temperature (p < 0.05, Table 3). In contrast, salinity showed a negative correlation with species number, CPUE, and Shannon–Wiener’s diversity index (p < 0.05). Other variables did not show significant correlations with either temperature or salinity (p > 0.05).
Table 3
| Environmental Biotic |
Species number | CPUE | Margalef | Pielou | Shannon–Wiener |
|---|---|---|---|---|---|
| Temperature | 0.828** | 0.566 | 0.853** | 0.343 | 0.706* |
| Salinity | -0.747** | -0.608* | -0.524 | -0.371 | -0.608* |
Matrix showing the Spearman correlation coefficients for environmental and biotic variables.
*p < 0.05, **p < 0.01.
4 Discussion
4.1 The dominant species in the Chinese surf zone
The fish species diversity in the surf zone varies markedly across different regions. In Nanji Island a total of 35 species were collected (Table 2), with Engraulis japonicus being the dominant species and Valamugil speigleri as the common species. In Sijiao Island, 46 species were recorded, and the main dominant species were Mugil cephalus, Lateolabrax maculatus, and E. japonicus (Mao et al., 2013). In the sandy beaches of Zhoushan Islands, 37 species were collected, with Chelon affinis (Mugilidae) being the most dominant, followed by Tridentiger trigonocephalus (Gobbidae), L. maculatus, and Stolephorus chinensis (Clupeidae) (Wang et al., 2018). In Gaolong Bay, 83 species were collected, Terapon jarbua (Theraponidae), Moolgarda seheli (Mugilidae), Ambassis urotaenia and Ambassis dussumieri (Ambassidae) were the dominant species (Xia et al., 2024).
In the estuarine environments, larval and juvenile fishes are often dominated by migratory, brackish or freshwater species. For example, in the Jiulong River estuary, China, 91 species were collected, with Ambassis gymnocephalus (Ambassidae) being the most dominant, followed by Sillago sihama (Sillaginidae), Acentrogobius pflaumii (Gobbidae), and Konosirus punctatus (Clupeidae) (Lin et al., 2009). In the Yangtze River estuary, Coilia nasus (Engrualidae) was the main dominant species, followed by Hemiculter sp. (Cyprinidae) and Pseudolaubuca sp. (Cyprinidae) (Jiang et al., 2008).
In summary, Engrualidae, Cyprinidae and Ambassidae tend to dominate in estuarine surf zones, while Mugilidae, Theraponidae, Ambassidae, Engrualidae and Clupeidae are more prevalent in oceanic surf zone.
4.2 Spatial and temporal distribution
This study demonstrates that larval and juvenile fishes in the sandy beach surf zones of Nanji Island were not randomly distributed but exhibited significant seasonal variability. Species number shows a positive correlation with temperature, peaking in August during the summer months. In contrast, CPUE does not show a correlation with temperature. The highest CPUE values occurred in May due to the present of large schools of E. japonicus postflexion larvae (more than 1000 and 5000 ind. by the second and third hauls, respectively, at St.3).
Engraulis japonicus, the most abundant species, was predominantly in the postflexion stage in May and transitioned to the young stage in June. These larvae were also dominant in the open sea of the Nanji Islands from May to June (Wang et al., 2024). Based on developmental stage and body length (Figure 10), the size of the larvae collected by larval net in the open sea is extremely smaller than those collected by seine net in the sandy beach surf zones, it appears that E. japonicus may utilize the surf zones as nursery ground, a phenomenon also observed in Sijiao Island (Mao et al., 2013). The local names for the larvae and juveniles of this species are Dingxiangyu and Xiangyan, respectively, both of which are important commercial fish in the Nanji Islands (Cai, 2021). Their sustainable utilization and management require greater attention.
Figure 10
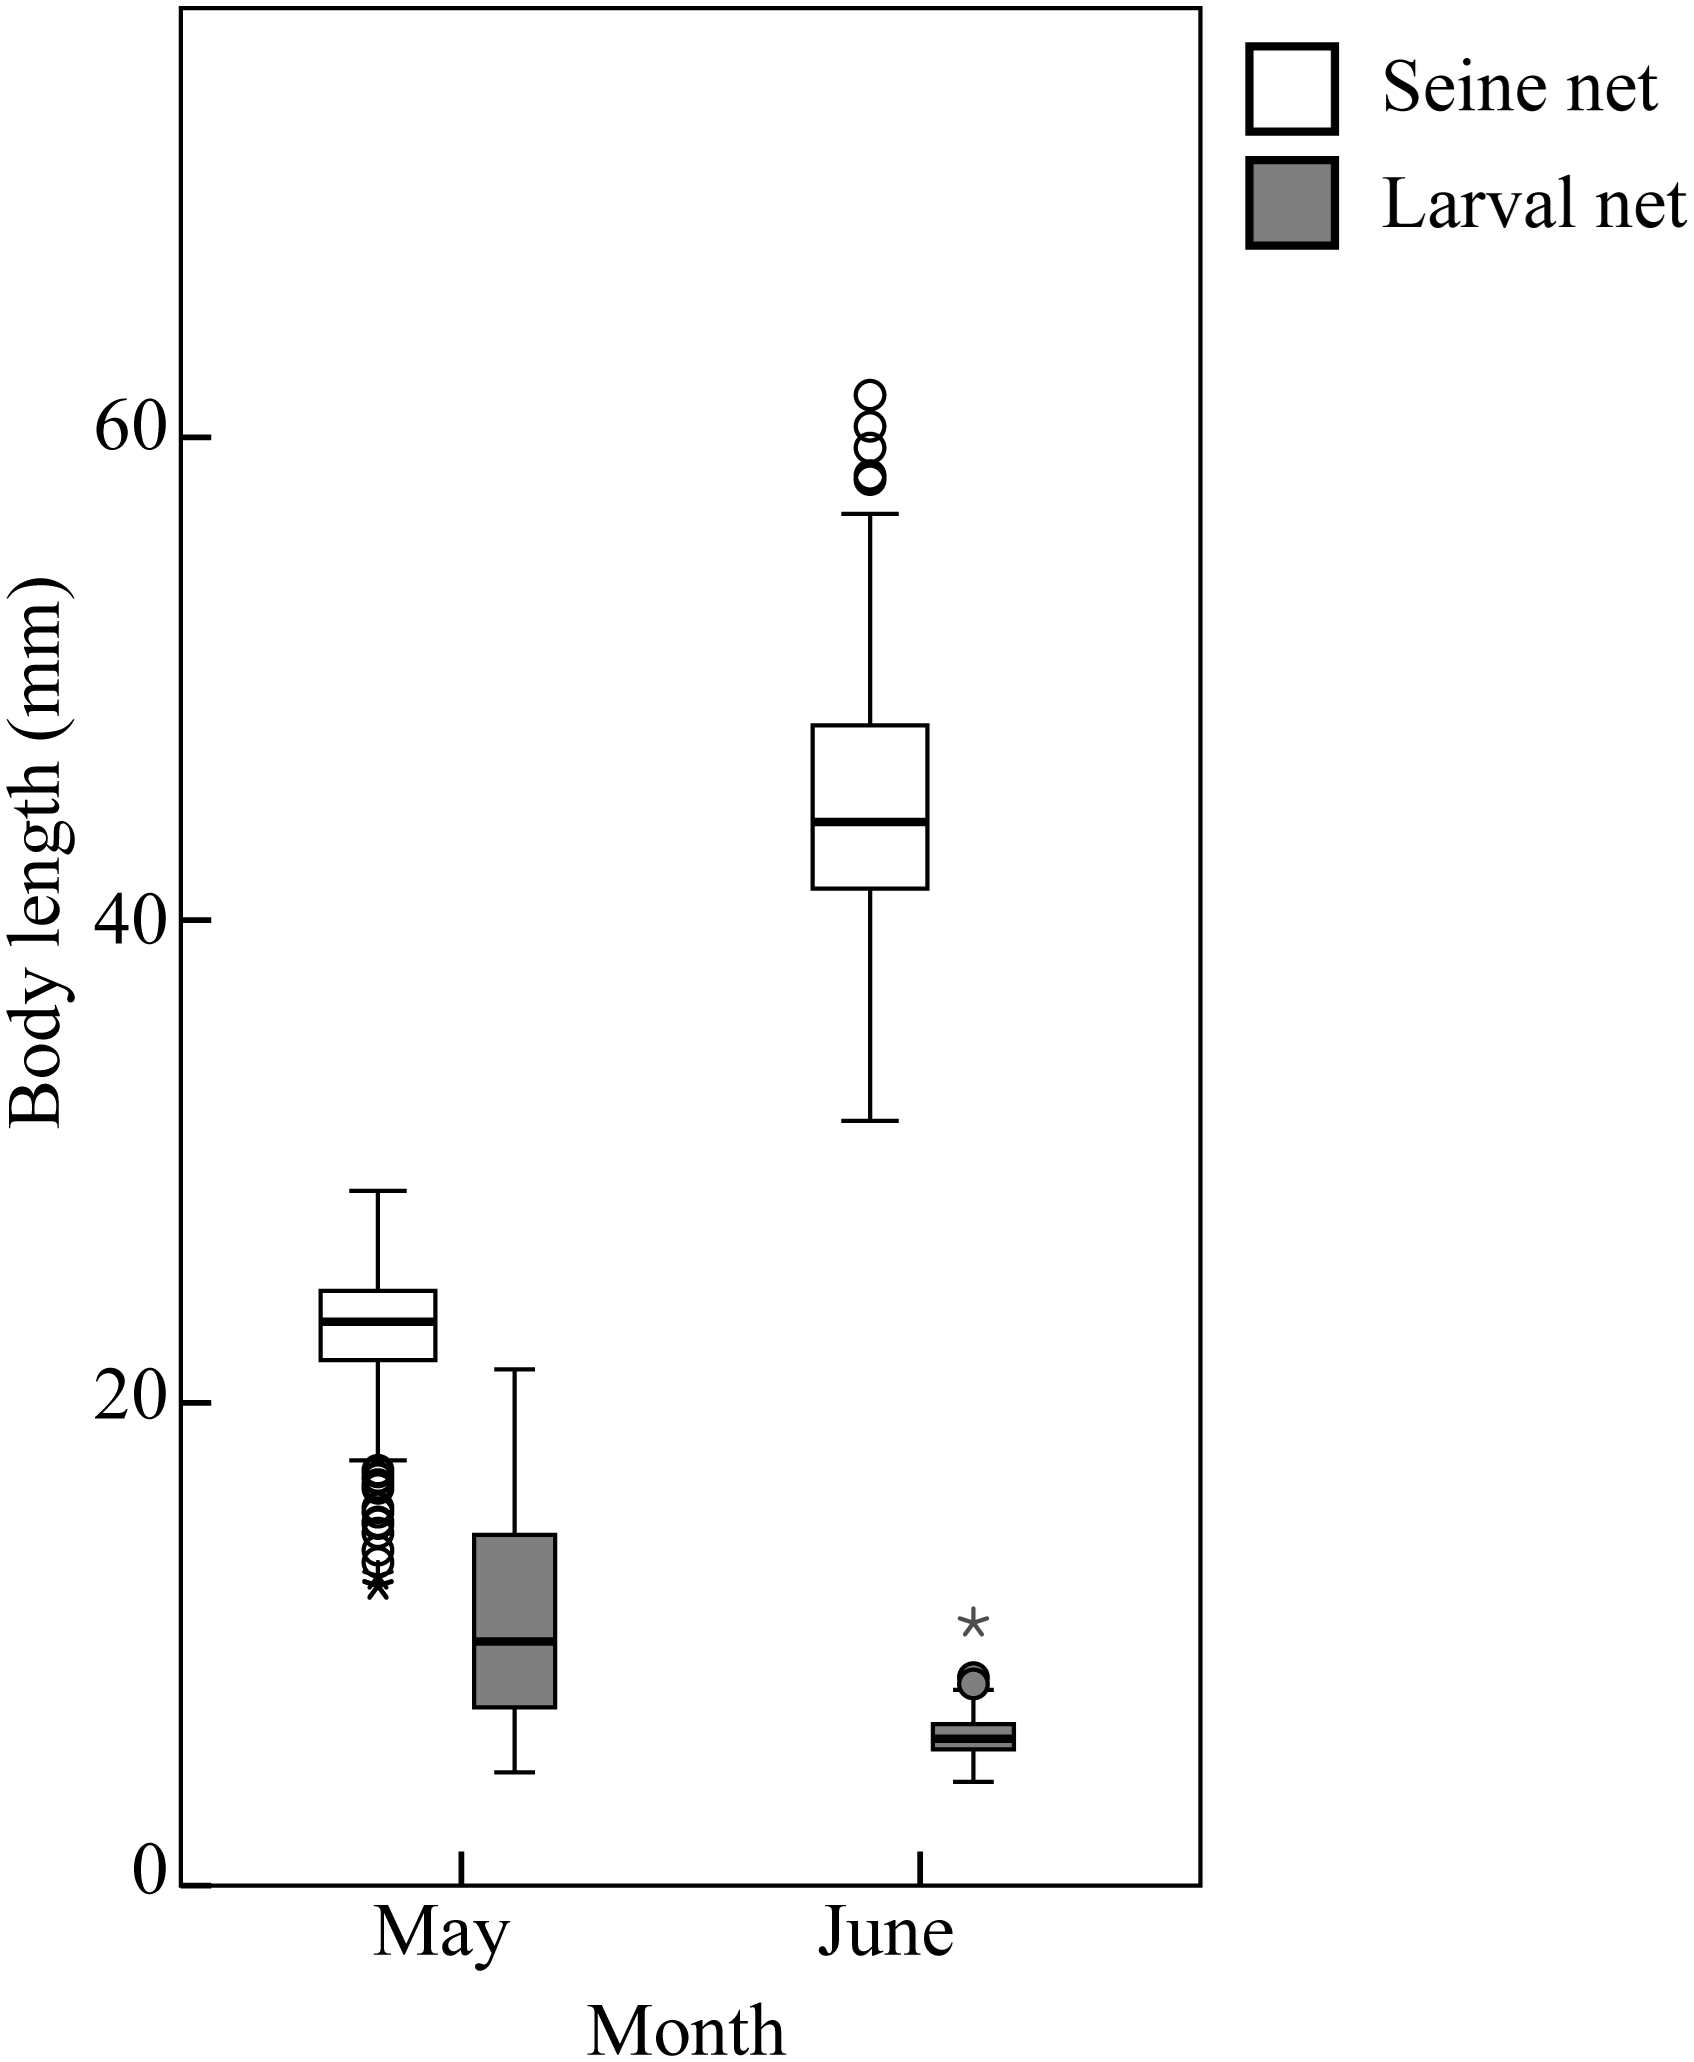
Body length of Engraulis japonicus collected by seine net and larval net in Nanji Island. Circles represent potential outliers, asterisk represents extreme value.
In the open sea of the Nanji Islands, there were 59 species collected by a larval net. The developmental stages, most of them preflexion larvae, were earlier than those in the surf zones. The density was higher in autumn and winter and lower in spring and summer, and species number was higher in summer and lower in winter (Wang et al., 2024). While seasonal trend in species number aligns with prior findings, CPUE patterns in the present study were inversely related. In winter, Sebastiscus marmoratus and Lateolabrax maculatus was the dominant species in the open sea (Wang et al., 2024). L. maculatus was also present in the surf zone from March to June, whereas S. marmoratus was absent. Compared to L. maculatus larvae in the open sea, those in the surf zone exhibited substantially greater body lengths (Figure 11). This finding aligns with previous studies by Chen et al. (2011) and Mao et al. (2013), who also reported a significant growth in body length of L. maculatus from March to June in the surf zones of Hangzhou Bay and Sijiao Island. This size discrepancy is not merely a descriptive pattern but likely reflects a substantial survival advantage. Larger body size in early life stages is a key trait linked to higher survival rates; it confers a refuge from a wider range of gape-limited predators and enhances swimming ability for efficient foraging and predator avoidance (Robert et al., 2023). These results further support the role of surf zones as nursery habitats for E. japonicus and L. maculatus.
Figure 11
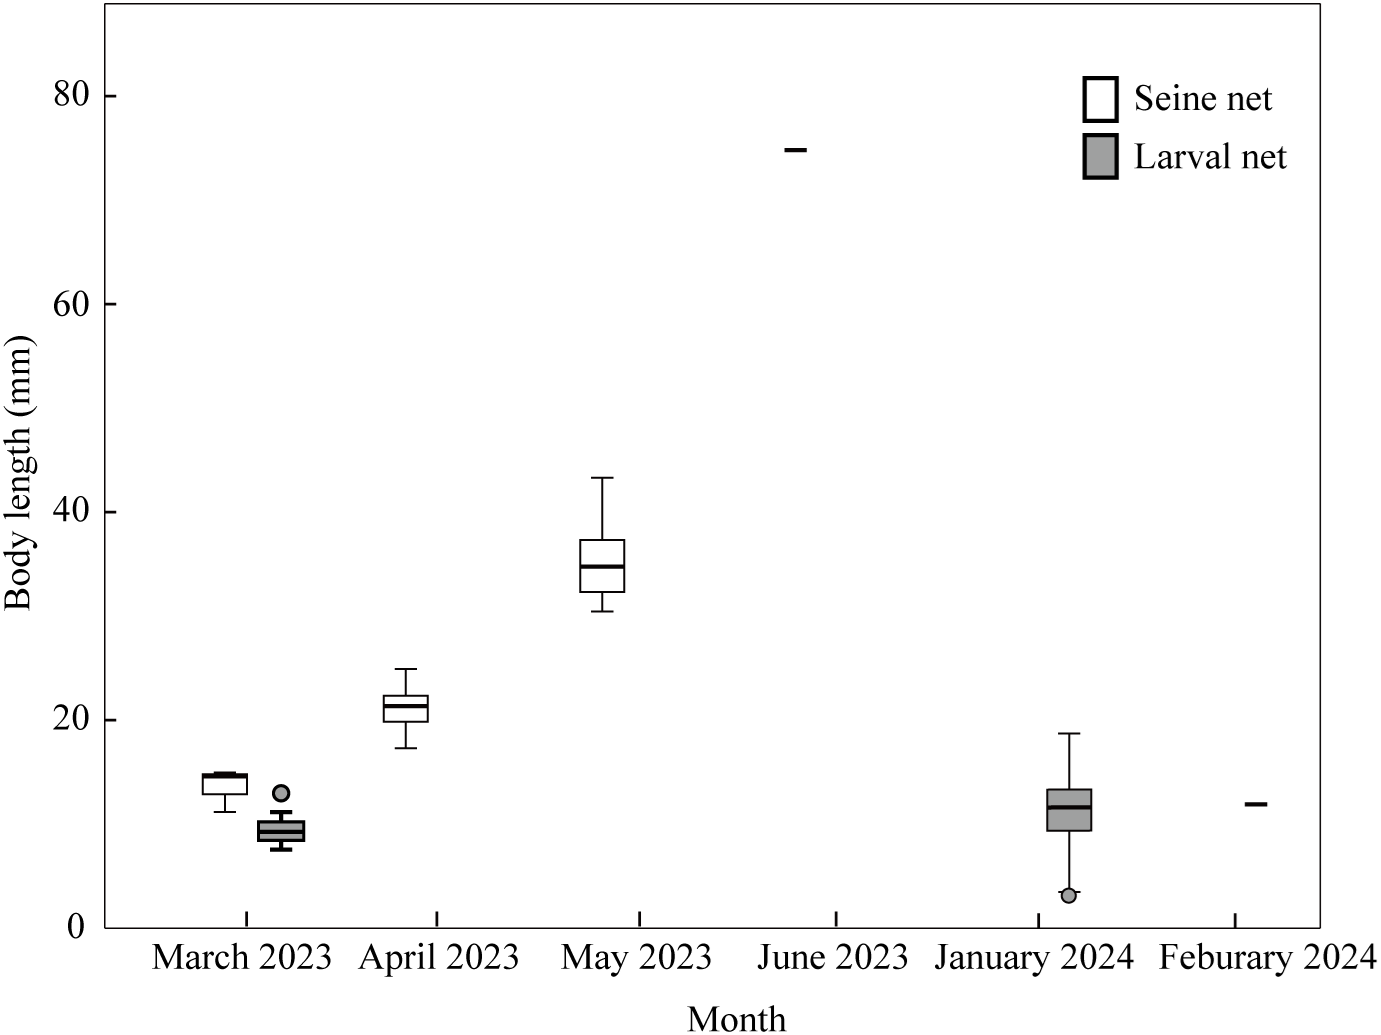
Body length of Lateolabrax maculatus collected by seine net and larval net in Nanji Island. Circles represent potential outliers.
The low species overlap (only 15 shared species) underscores the distinct ecological functions of the surf zone and the open sea (Wang et al., 2024). The surf zone species are likely benthic-oriented or require shallow, structured nurseries, like E. japonicus and L. maculatus (Mao et al., 2013). Conversely, the open sea species are presumably planktonic forms that depend on stable, pelagic conditions during larval stages. S. marmoratus, an ovoviviparous, reef-associated species with limited mobility and no long-distance migratory behavior (Jin, 2006), appears to avoid littoral zone. Instead, its larvae likely settle in the deeper layer after they grow up, explaining the absence of high CPUE values for this species in surf zones during winter. This clear niche partitioning highlights the surf zone’s role as a critical nursery for a specific subset of species rather than a universal habitat for all larval and juvenile fishes. The main contributing species in the sandy beach surf zone also show distinct differences in occurrence and duration, likely due to variations in spawning seasons and migration routes. Valamugil speigleri, E. japonicus, Gerres erythrourus, and Terapon jarbua first appear in the surf zone in April, May and June, respectively, with durations ranging from 2 to 6 months (Table 2). Notably, E. japonicus is only found on the east coast of the island, while V. speigleri, G. erythrourus, and T. jarbua occur on both coasts. This suggests that differences in physicochemical or biological factors, such as turbidity, light, flow velocity and direction, prey organisms, and predators, may influence species distribution even in sandy beaches with similar geomorphology and substrate (Pessanha et al., 2021). To explore the reasons behind these differences in species distribution across similar sandy beach habitats, it is necessary to supplement the study with surveys of plankton communities and additional physicochemical parameters.
4.3 The relationships between larval fish and environmental factors
The species number and diversity indexes in the sandy beach surf zones of Nanji Island exhibited significantly positive and negative correlation with temperature and salinity, respectively. This finding aligns with broader observations that water temperature has a substantial impact on fish species diversity and abundance, often following a clear seasonal pattern in many marine ecosystems (Olds et al., 2018). Specifically, water temperature is positively correlated with fish abundance and diversity (Rodrigues and Vieira, 2013). Jiang et al. (2008) reported that the monthly trends of species number and abundance of larval and juvenile fishes in the surf zone of the Yangtze River estuary were consistent with water temperature. Seasonal changes in community structure were relatively pronounced, with higher larval and juvenile fish diversity and abundance when the average water temperature exceeded 23 °C. Water temperature not only directly influences fish reproduction and proliferation of bait organisms but also indirectly affects the spatial and temporal distribution of larval and juvenile fishes by influencing individual growth and development (Jiao et al., 2016).
Salinity also plays a crucial role in shaping the composition of larval and juvenile fish species. The observed negative correlation between salinity and species number, CPUE and Shannon–Wiener’s diversity index may be attributed to episodic freshwater input, particularly since recorded salinities generally remained within marine conditions (Figure 9). For instance, during summer, typhoon-induced heavy rainfall may attract more euryhaline fishes, such as Trachinotus ovatus and Gerres spp. (Wu and Zhong, 2021), thereby enhancing overall diversity. Furthermore, freshwater inflow, especially from the village near St. 5 (Table 1), may deliver terrestrial nutrients that stimulate localized primary productivity and subsequently enrich the prey resources for certain fish species. Chen et al. (2011) compared the southern branch of the Yangtze River estuary and the northern shore of Hangzhou Bay, two geographically closely connected areas but differently influenced by freshwater discharge from the Yangtze River. The study found significant differences in species composition between these areas. In the southern branch of the Yangtze River estuary, where salinity remained low throughout the year, larval and juvenile fishes were predominantly migratory and freshwater fishes. In contrast, on the northern shore of Hangzhou Bay, larval and juvenile fishes were mainly estuarine and marine fishes, and a higher diversity were found in this area due to the salinity variations. Similar patterns have been observed in other regions, such as within and outside Tokyo Bay (Arayama et al., 2002), the estuary of the Lima River (Ramos et al., 2006), and adjacent coastal waters (Azeiteiro et al., 2006).
5 Conclusion
A total of 8568 larval and juvenile fishes were collected from the sandy beach surf zones of Nanji Island, representing 35 species and 21 families. The highest abundance of larval and juvenile fishes was recorded in May, primarily dominated by postflexion larvae of Engraulis japonicus, which were only found on the east coast of the island. The highest species diversity was observed in August. Temperature showed a positive correlation with species number, Margalef’s richness index, and Shannon–Wiener’s diversity index, while salinity showed negative correlations with species number, CPUE, and Shannon–Wiener’s diversity index. Additional physicochemical parameters should be examined in the future study.
The fish composition differed significantly between the surf zones and the open sea, with only 15 species shared between the two habitats, suggested significant niche partitioning. Engraulis japonicus, the most dominant species in the surf zone, and Lateolabrax maculatus were also present in the open sea. However, individuals of both species exhibited larger body sizes in the surf zones compared to those collected in open waters, suggesting that these species utilize sandy beach surf zones as nursery grounds for growth and development.
Statements
Data availability statement
The raw data supporting the conclusions of this article will be made available by the authors, without undue reservation.
Ethics statement
Ethical approval was not required for the study involving animals in accordance with the local legislation and institutional requirements. This study complies with the Specifications for oceanographic survey—Part 6: Marine biological survey and laws of China. Larval and juvenile fish samples were collected with a seine net, as this sampling method results in the mortality of the sampled fishes; they were not reared or maintained in the laboratory. According to the above guidelines, ethical approval was not needed for this study.
Author contributions
XW: Investigation, Writing – original draft, Writing – review & editing. DZ: Formal Analysis, Investigation, Writing – original draft. QL: Data curation, Investigation, Validation, Visualization, Writing – original draft. TL: Data curation, Formal Analysis, Investigation, Software, Writing – original draft. JZ: Funding acquisition, Methodology, Supervision, Writing – review & editing. WC: Investigation, Resources, Writing – original draft. SX: Project administration, Resources, Writing – original draft. SC: Conceptualization, Supervision, Writing – review & editing.
Funding
The author(s) declare financial support was received for the research and/or publication of this article. This study was supported by the Nanji Islands National Marine Nature Reserve Administration.
Acknowledgments
We extend our sincere gratitude to the staff from Nanji Islands National Marine Nature Reserve Administration for their generous assistance with sample collection. We also wish to thank to Roland Passmore for improving the English of this manuscript.
Conflict of interest
The authors declare that the research was conducted in the absence of any commercial or financial relationships that could be construed as a potential conflict of interest.
Generative AI statement
The author(s) declare that no Generative AI was used in the creation of this manuscript.
Any alternative text (alt text) provided alongside figures in this article has been generated by Frontiers with the support of artificial intelligence and reasonable efforts have been made to ensure accuracy, including review by the authors wherever possible. If you identify any issues, please contact us.
Publisher’s note
All claims expressed in this article are solely those of the authors and do not necessarily represent those of their affiliated organizations, or those of the publisher, the editors and the reviewers. Any product that may be evaluated in this article, or claim that may be made by its manufacturer, is not guaranteed or endorsed by the publisher.
References
1
Arayama K. Imai H. Kanou K. Kohno H. (2002). Ichthyofauna of surf zones in the outer Tokyo Bay. La mer.40, 59–70.
2
Arevalo E. Cabral H. N. Villeneuve B. Possémé C. Lepage M. (2023). Fish larvae dynamics in temperate estuaries: A review on processes, patterns and factors that determine recruitment. Fish Fish.24, 466–487. doi: 10.1111/faf.12740
3
Azeiteiro U. M. Bacelar-Nicolau L. Resende P. Gonçalves F. Pereira M. J. (2006). Larval fish distribution in shallow coastal waters off North Western Iberia (NE Atlantic). Estuarine Coast. Shelf Sci.69, 554–566. doi: 10.1016/j.ecss.2006.05.023
4
Cai H. C. (2021). An overview of Nanji Islands National Marine Nature Reserve (Beijing: China Ocean Press).
5
Chen Y. G. Zhang Y. Zhong J. S. Ge K. K. Mao C. Z. Fang Y. Q. (2011). Comparison in fish larvae and juvenile assemblages between the surf zones of south branch of Yangtze River Estuary and north coast of Hangzhou Bay. J. Shanghai Ocean Univ.20, 688–696.
6
Contente R. F. Marion C. Silva J. V. Soeth M. Condini M. V. L. Almeida L. L. et al . (2023). Surf-zone fish assemblage structure and its diel variability in an ocean beach of Espírito Santo (Central Brazilian coast). Lat. Am. J. Aquat. Res.51, 133–144. doi: 10.3856/vol51-issue1-fulltext-2925
7
Esmaeili Y. S. Corte G. N. Checon H. H. Gomes T. R. C. Lefcheck J. S. Amaral A. C. Z. et al . (2021). Comprehensive assessment of shallow surf zone fish biodiversity requires a combination of sampling methods. Mar. Ecol. Prog. Ser.667, 131–144. doi: 10.3354/meps13711
8
Henderson C. J. Gilby B. L. Olds A. D. Mosman J. Connolly R. M. Hyndes G. et al . (2022). Connectivity shapes functional diversity and maintains complementarity in surf zones on exposed coasts. Estuaries Coasts.45, 1534–1544. doi: 10.1007/s12237-022-01046-0
9
Iida M. Yagi Y. Iseki T. (2021). Occurrence of wild chum salmon fry in the surf zone, and spawning and emergence timing in the adjacent nonstocked river in Niigata Prefecture, Japan. Fish. Sci.87, 549–557. doi: 10.1007/s12562-021-01535-4
10
Jiang R. J. Zhong J. S. Li L. Liu L. Lin N. (2009). The community structure of fish larvae and juveniles in the surf zone of the Yangtze River Estuary. J. Shanghai Ocean Univ.18, 42–46.
11
Jiang R. J. Zhong J. S. Zhang D. L. Fu C. Z. (2008). Species composition and diversity of fish larvae and juveniles in the surf zone of the Yangtze River Estuary. Zool. Res.29, 297–304. doi: 10.3724/SP.J.1141.2008.00297
12
Jiao X. M. Mao C. Z. Chen Y. G. Zhang X. Y. Zhong J. S. Hua W. H. et al . (2016). Ecological research progress of larvae and juvenile fishes in coastal surf zone. J. Huaihai Inst. Technol. (Nat. Sci. Ed.)25, 70–75. doi: 10.3969/j.issn.1672-6685.2016.02.016
13
Jin X. B. (2006). Fauna Sinica Ostichthyes: Scorpaeniformes (Beijing: Science Press).
14
Li H. T. Xu N. A. Yang Z. B. Lei Y. L. Chen J. X. Zhan Z. F. et al . (2024). Assessing the changes in marine microalgae diversity in the Nanji Islands Nature Reserve over the past decades using sediment eDNA. Front. Mar. Sci.11, 1466434. doi: 10.3389/fmars.2024.1466434
15
Lin X. L. (2011). Current status and research on marine capture fisheries in Pingyang County. Sci. Technol. Innovation Herald.1, 138. doi: 10.16660/j.cnki.1674-098x.2011.01.190
16
Lin N. Shen C. C. Zhong J. S. (2009). Composition of fish larvae and juveniles in surf zone of Jiulong River estuary. J. Shanghai Ocean Univ.18, 686–694.
17
Mao C. Z. Zhong J. S. Fang Y. Q. Ge C. G. Yang P. H. Chen Y. G. et al . (2013). Species composition and habitat use patterns of fish larvae and juveniles inhabiting the surf zone of a sandy beach at Sijiao Island. J. Fish. Sci. China.20, 166–176. doi: 10.3724/SP.J.1118.2013.00166
18
Marraffini M. L. Hamilton S. L. Marin J. R. Ladd M. Koval G. Madden J. R. et al . (2024). Evaluating the influence of marine protected areas on surf zone fish. Conserv. Biol.38, e14296. doi: 10.1111/cobi.14296
19
McGregor S. Strydom N. A. Campbell E. E. (2021). Association of early stage fishes with surf diatom Anaulus australis accumulations in a warm temperate surf zone, South Africa. Estuarine Coast. Shelf Sci.263, 107653. doi: 10.1016/j.ecss.2021.107653
20
Muller C. Lett C. Porri F. Pattrick P. Bailey D. Denis H. et al . (2023). Coastal connectivity of an abundant inshore fish species: model-data comparison along the southern coast of South Africa. Mar. Ecol. Prog. Ser.731, 89–104. doi: 10.3354/meps14272
21
Okiyama M. (2014). An Atlas of Early Stage Fishes in Japan. 2nd ed (Kanagawa: Donghai University Publishing Association).
22
Olds A. D. Vargas-Fonseca E. Connolly R. M. Gilby B. L. Huijbers C. M. Hyndes G. A. et al . (2018). The ecology of fish in the surf zones of ocean beaches: A global review. Fish Fish.19, 78–89. doi: 10.1111/faf.12237
23
Pessanha A. L. M. Sales N. S. da Silva Lima C. S. Clark F. J. K. de Lima L. G. de Lima D. E. P. C. et al . (2021). The occurrence of fish species in multiple habitat types in a tropical estuary: Environmental drivers and the importance of connectivity. Estuarine Coast. Shelf Sci.262, 107604. doi: 10.1016/j.ecss.2021.107604
24
Ramos S. Cowen R. K. Ré P. Bordalo A. A. (2006). Temporal and spatial distributions of larval fish assemblages in the Lima Estuary (Portugal). Estuarine Coast. Shelf Sci.66, 303–314. doi: 10.1016/j.ecss.2005.09.012
25
Robert D. Shoji J. Sirois P. Takasuka A. Catalán I. A. Folkvord A. (2023). Life in the fast lane: revisiting the fast growth-high survival paradigm during the early life stages of fishes. Fish Fish.24, 863–888. doi: 10.1111/faf.12774
26
Rodrigues F. L. Vieira J. P. (2013). Surf zone fish abundance and diversity at two sandy beaches separated by long rocky jetties. J. Mar. Biol. Assoc. UK.93, 867–875. doi: 10.1017/S0025315412001531
27
Sarr C. Yu C. G. Ndiaye O. Diadhiou H. Ndour N. (2023). Community structure of fish in Nanji Islands National Nature Reserve and its relationship with environmental variation. J. Water Resour Prot.15, 377–392. doi: 10.4236/jwarp.2023.158022
28
Sarr C. Yu C. G. Ndiaye O. Diadhiou H. Ndour N. (2024). Fish assemblage and abundance distribution in Nanji Islands Marine Nature Reserve in relation to season change. J. Agric. Chem. Environ.13, 13–32. doi: 10.4236/jacen.2024.131002
29
Shimizu M. Nanjo K. Tanita I. Kon K. Yamada H. (2022). Food habits of fishes in a subtropical seagrass bed in Nagura Bay, Ishigaki Island, southern Japan. J. Mar. Biol. Assoc. UK.102, 361–369. doi: 10.1017/S0025315422000601
30
Wang H. X. Jiang R. J. Xu K. D. He Z. T. Chen F. Liu Z. J. (2018). Species composition and diversity of fish larvae and juveniles in the surf zone of Zhoushan Archipelago in spring and summer. J. Zhejiang Ocean Univ. (Nat. Sci.).37, 107–113. doi: 10.3969/j.issn.1008-830X.2018.02.003
31
Wang X. D. Zhao D. B. Liu Q. A. Lu T. Y. Zhong J. S. Chen W. D. et al . (2024). Species composition of fish larvae and juveniles in the Nanji Islands, China. Fishes.9, 421. doi: 10.3390/fishes9110421
32
Wenzhou Municipal Bureau of statistics, and Survey Office of the National Bureau of Statistics in Wenzhou (2012–2023a). Wenzhou Statistical Yearbook 2012–2023. (Beijing: China Statistics Press).
33
Wu H. L. Zhong J. S. (2021). Key to Marine and Estuarial Fishes of China. (Beijing: China Agriculture Press).
34
Xia W. T. Miao Z. B. Chen K. Lu Y. Wang S. Zhu J. Y. et al . (2024). Seasonal patterns of juvenile fish assemblages in the surf zones of tropical sandy beaches along Gaolong Bay, Hainan Island, China. Divers. Distrib.30, e13913. doi: 10.1111/ddi.13913
35
Xia W. T. Miao Z. B. Wang S. Chen K. Liu Y. L. Xie S. G. (2023). Influence of tidal and diurnal rhythms on fish assemblages in the surf zone of sandy beaches. Fish. Oceanogr.32, 448–460. doi: 10.1111/fog.12639
36
Yin J. Cai L. N. Li J. H. Yan X. J. Zhang B. B. (2025). Study on the aquaculture of large yellow croaker in the coastal zone of Zhejiang Province based on high-resolution remote sensing. Remote Sens.17, 9. doi: 10.3390/rs17010009
Summary
Keywords
community structure, diversity pattern, early stages of fish, littoral zone, Nanji Islands National Marine Nature Reserve, spatial-temporal variations
Citation
Wang X, Zhao D, Liu Q, Lu T, Zhong J, Chen W, Xie S and Chen S (2025) Larval and juvenile fish assemblages in the sandy beach surf zones of Nanji Island, China. Front. Mar. Sci. 12:1693531. doi: 10.3389/fmars.2025.1693531
Received
27 August 2025
Accepted
30 October 2025
Published
18 November 2025
Volume
12 - 2025
Edited by
Siu Gin Cheung, City University of Hong Kong, China
Reviewed by
Juan Du, Chinese Academy of Fishery Sciences (CAFS), China
Daniela Alemany, CONICET - UNMDP, Argentina
Updates
Copyright
© 2025 Wang, Zhao, Liu, Lu, Zhong, Chen, Xie and Chen.
This is an open-access article distributed under the terms of the Creative Commons Attribution License (CC BY). The use, distribution or reproduction in other forums is permitted, provided the original author(s) and the copyright owner(s) are credited and that the original publication in this journal is cited, in accordance with accepted academic practice. No use, distribution or reproduction is permitted which does not comply with these terms.
*Correspondence: Junsheng Zhong, jszhong@shou.edu.cn
Disclaimer
All claims expressed in this article are solely those of the authors and do not necessarily represent those of their affiliated organizations, or those of the publisher, the editors and the reviewers. Any product that may be evaluated in this article or claim that may be made by its manufacturer is not guaranteed or endorsed by the publisher.