Abstract
Shoreline dynamics are a critical concern for coastal regions worldwide, particularly in economically vital estuarine deltas with dense populations and infrastructure. Long-term monitoring is essential for understanding responses to both natural and anthropogenic forces and for informing sustainable coastal management. This study analyzes the spatiotemporal evolution of shorelines in Shenzhen Bay, China, over 35 years (1986–2020) using Landsat-derived shorelines at five-year intervals. Rate-of-change statistics were calculated using the Digital Shoreline Analysis System (DSAS). Results show substantial morphological changes: artificial shorelines increased by 120%, biological shorelines by 89%, sandy shorelines decreased by 64%, and total shoreline length increased by 9% overall. The bay area decreased by 18.5% due to reclamation. More than half (54.8%) of Net Shoreline Movement (NSM) values fall within 0–1000 m, but spatial patterns reveal marked contrasts between Shenzhen and Hong Kong: Shenzhen transects show a much greater mean displacement (965.13 m) than Hong Kong (81.65 m). End Point Rate (EPR) analysis confirms faster change rates in Shenzhen (28.10 m/a) compared with Hong Kong (2.37 m/a). Analysis of driving forces indicates that while sea level rise (1.85 mm/a) and sediment accumulation contributed to observed changes, anthropogenic activities—particularly land reclamation and channel engineering—were the dominant factors. These findings highlight the urgent need for integrated coastal management strategies to balance development and ecosystem conservation in rapidly urbanizing estuarine environments.
1 Introduction
The coastal zone, a critical transition region between land and ocean, plays a vital role in economic development, transportation and tourism industry (Nithu et al., 2019). Unfortunately, shorelines are undergoing significant changes due to both natural processes (e.g. sea level rise (SLR), winds, waves, and tides) and anthropogenic activities (Guariglia et al., 2006; Hsu et al., 2007). Especially in recent decades, rapid population growth, coastal industrialization, technology-related industries, and the marine economy, the coastal zone is under the ecological and environmental pressure brought about by intensive human development activities (Eludoyin et al., 2012). The shoreline is regarded as an important indicator of the ecological security of the coastal zone, reflecting the changes in the natural environment of the coastal zone and the degree of intervention of human activities (Fan et al., 2020). Therefore, analyzing the spatiotemporal evolution of the shoreline in coastal zone and their driving forces is essential for urban planning, construction, and sustainable development.
At present, research on shoreline change primarily relies on remote sensing imagery to analyze spatiotemporal dynamics, followed by investigation into driving factors such as intensive human development (Li and Damen, 2010; Xu et al., 2016; Zhang and Hou, 2020), population growth (Liu et al., 2017; Sui et al., 2020), geological processes (Valeyev et al., 2019), climate change (Bamunawala et al., 2018) and other anthropogenic and natural influences (Thoai et al., 2019). Recent studies have employed advanced geospatial techniques to quantify and predict shoreline evolution. For instance, Palanisamy et al. (2024) applied the Digital Shoreline Analysis System (DSAS) model to assess shoreline changes along the southern coast of Rio de Janeiro (1986–2018) and project future positions for 2032 and 2042. Similarly, Fogarin et al. (2023) combined satellite imagery with machine learning and DSAS to assess shoreline evolution trends on the Venice coast during 2015–2019. In China, Qiao et al. (2018) utilized DSAS and remote sensing to analyzed spatiotemporal changes of Shanghai shoreline and explored its response to natural and anthropogenic activities during 1960–2015. Based on remote sensing images, Zhang Z. et al. (2024) identified harbor construction as the dominant driver of shorelines changes in Rizhao estuarine zone during 1985–2020.
As a rapidly developing core city in China’s Pearl River Delta region, Shenzhen has been the focus of numerous studies examining coastal transformation in recent years. Previous research has revealed significant spatiotemporal variations in Shenzhen's shoreline evolution under intense anthropogenic pressure. Li et al. (2009) found that the length of Shenzhen shoreline increased first and then decreased from 1978 to 2005, with human activities identified as the dominant driver. Through analysis of Landsat imagery and four shoreline evaluation indices, Wei et al. (2023) reported continuous shoreline extension from 1979 to 2019, accompanied by rapid proliferation of artificial shorelines. Gao and Zeng (2012) employed Landsat TM data to analyze and project the shoreline changes in Shenzhen from 1986 to 2020, revealing pronounced spatial disparities with more intensive modifications occurring in western sectors compared to eastern areas, along with substantial land reclamation exceeding 74 km² that was projected to reach 108.9 km². The shoreline of Hong Kong underwent rapid expansion from 1989 to 2021, with the intensity of shoreline change peaking at 1.47% during 2004–2009 (Yi et al., 2023). Over the periods 1991–2000, 2000–2011, and 2011–2018, the shoreline increased by 11.30 km, decreased by 1.81 km, and increased by 1.44 km, respectively, reflecting a gradually decelerating trend in the rate of change (Zhan et al., 2021). The reclaimed land in Hong Kong has been expanding over the past decades, with increases of 10.93 km² and 18.39 km² during the periods 1989–1994 and 1999–2004, respectively. However, the expansion rate has slowed in recent years, reaching only 5.21 km² between 2016 and 2021 (Yi et al., 2023).
The changes in the shorelines of Shenzhen and Hong Kong are driven by both anthropogenic and natural factors (Zhan et al., 2021). As coastal cities with central urban areas located along the shore, both Shenzhen and Hong Kong have experienced significant population migration to coastal zones, leading to increased infrastructure development such as housing and public services, which has resulted in continuous land reclamation. The low-lying coastal topography of both Shenzhen and Hong Kong makes them susceptible to impacts from glacier melt and sea-level rise associated with the greenhouse effect. Combined with the influence of typhoons, these factors intensify coastal erosion and contribute to shoreline changes (Zhan et al., 2021). Situated in the Pearl River Estuary, Shenzhen and Hong Kong have also been significantly affected in recent years by a substantial reduction in sediment discharge from the Pearl River, which has exerted notable influences on the evolution of the estuarine shoreline (Zhan et al., 2021).
The Shenzhen Bay shoreline represents one of the most dynamic coastal segments within the Guangdong-Hong Kong-Macao Greater Bay Area, exhibiting pronounced morphological changes over recent decades (Li and Damen, 2010; Wei et al., 2023). Previous studies utilizing remote sensing imagery have documented substantial coastal transformations in this area. Notably, Li and Damen (2010) conducted an analysis of shoreline changes based on remote sensing images of the Pearl River Estuary from 1979 to 2003, identifying the Shekou Peninsula as experiencing the most significant modifications, primarily driven by extensive port construction and urban development. Wei et al. (2023) revealed continued seaward expansion of the Shekou Peninsula between 2004 and 2008, with maximum shoreline advancement rates reaching 422.19 m/a.
However, existing studies have effectively characterized general shoreline changes and emphasized anthropogenic influences, several research gaps remain. It emphasizes studying the impact of human activities on shoreline changes but gives less consideration to other natural factors. Current investigations predominantly: (1) focus on morphological changes without comprehensive analysis of temporal variation patterns; (2) emphasize human impacts while neglecting natural contributing factors; and (3) concentrate on the Shenzhen portion with limited examination of the Hong Kong section.
To address these limitations, this study employs Landsat imagery across eight temporal intervals spanning 35 years to: (1) quantify shoreline type conversions; (2) analyze spatiotemporal change patterns using the DSAS model; and (3) quantitatively disentangle the relative contributions of anthropogenic vs. natural drivers. Our findings provide critical scientific support for sustainable coastal management and informed decision-making regarding Shenzhen Bay's economic development and ecological conservation.
2 Study site and dataset
2.1 Study site
Shenzhen Bay (113°53′–114°05′ E, 22°30′–22°39′ N), as a semi-enclosed shallow bay, situated between Shenzhen City and the Hong Kong along the eastern side of the Pearl River Estuary in China (Figure 1). This ecologically and economically significant water body exhibits distinct geomorphological and hydrological characteristics, with an average water depth of 2.9 m and mean tidal range of 1.37 m (Zhou et al., 2020). The bay covers approximately 90.8 km² and receives freshwater inputs from a 596 km² catchment area that encompasses some of China's most economically developed and densely populated regions (Zhou et al., 2020). Shenzhen Bay has a subtropical maritime climate with an annual average air temperature of 23°C and precipitation of 1750 mm (Zhou et al., 2020). Five major rivers - Dasha, Shenzhen, Wutong, Yulan, and Tianshuiwei discharge directly into the bay (Figure 1). The buffer zone of 2 km inland from the Shenzhen Bay shoreline of 2020 was taken as the coastal zone (Figure 1). Since the reform and opening up, large-scale industrialization and urbanization construction have changed the land use types and shoreline types of the coastal zone in Shenzhen Bay (Li and Damen, 2010). These dramatic anthropogenic modifications make Shenzhen Bay an ideal study site to: (1) examine urbanization-induced shoreline change mechanisms, and (2) develop science-based management strategies for sustainable coastal development.
Figure 1
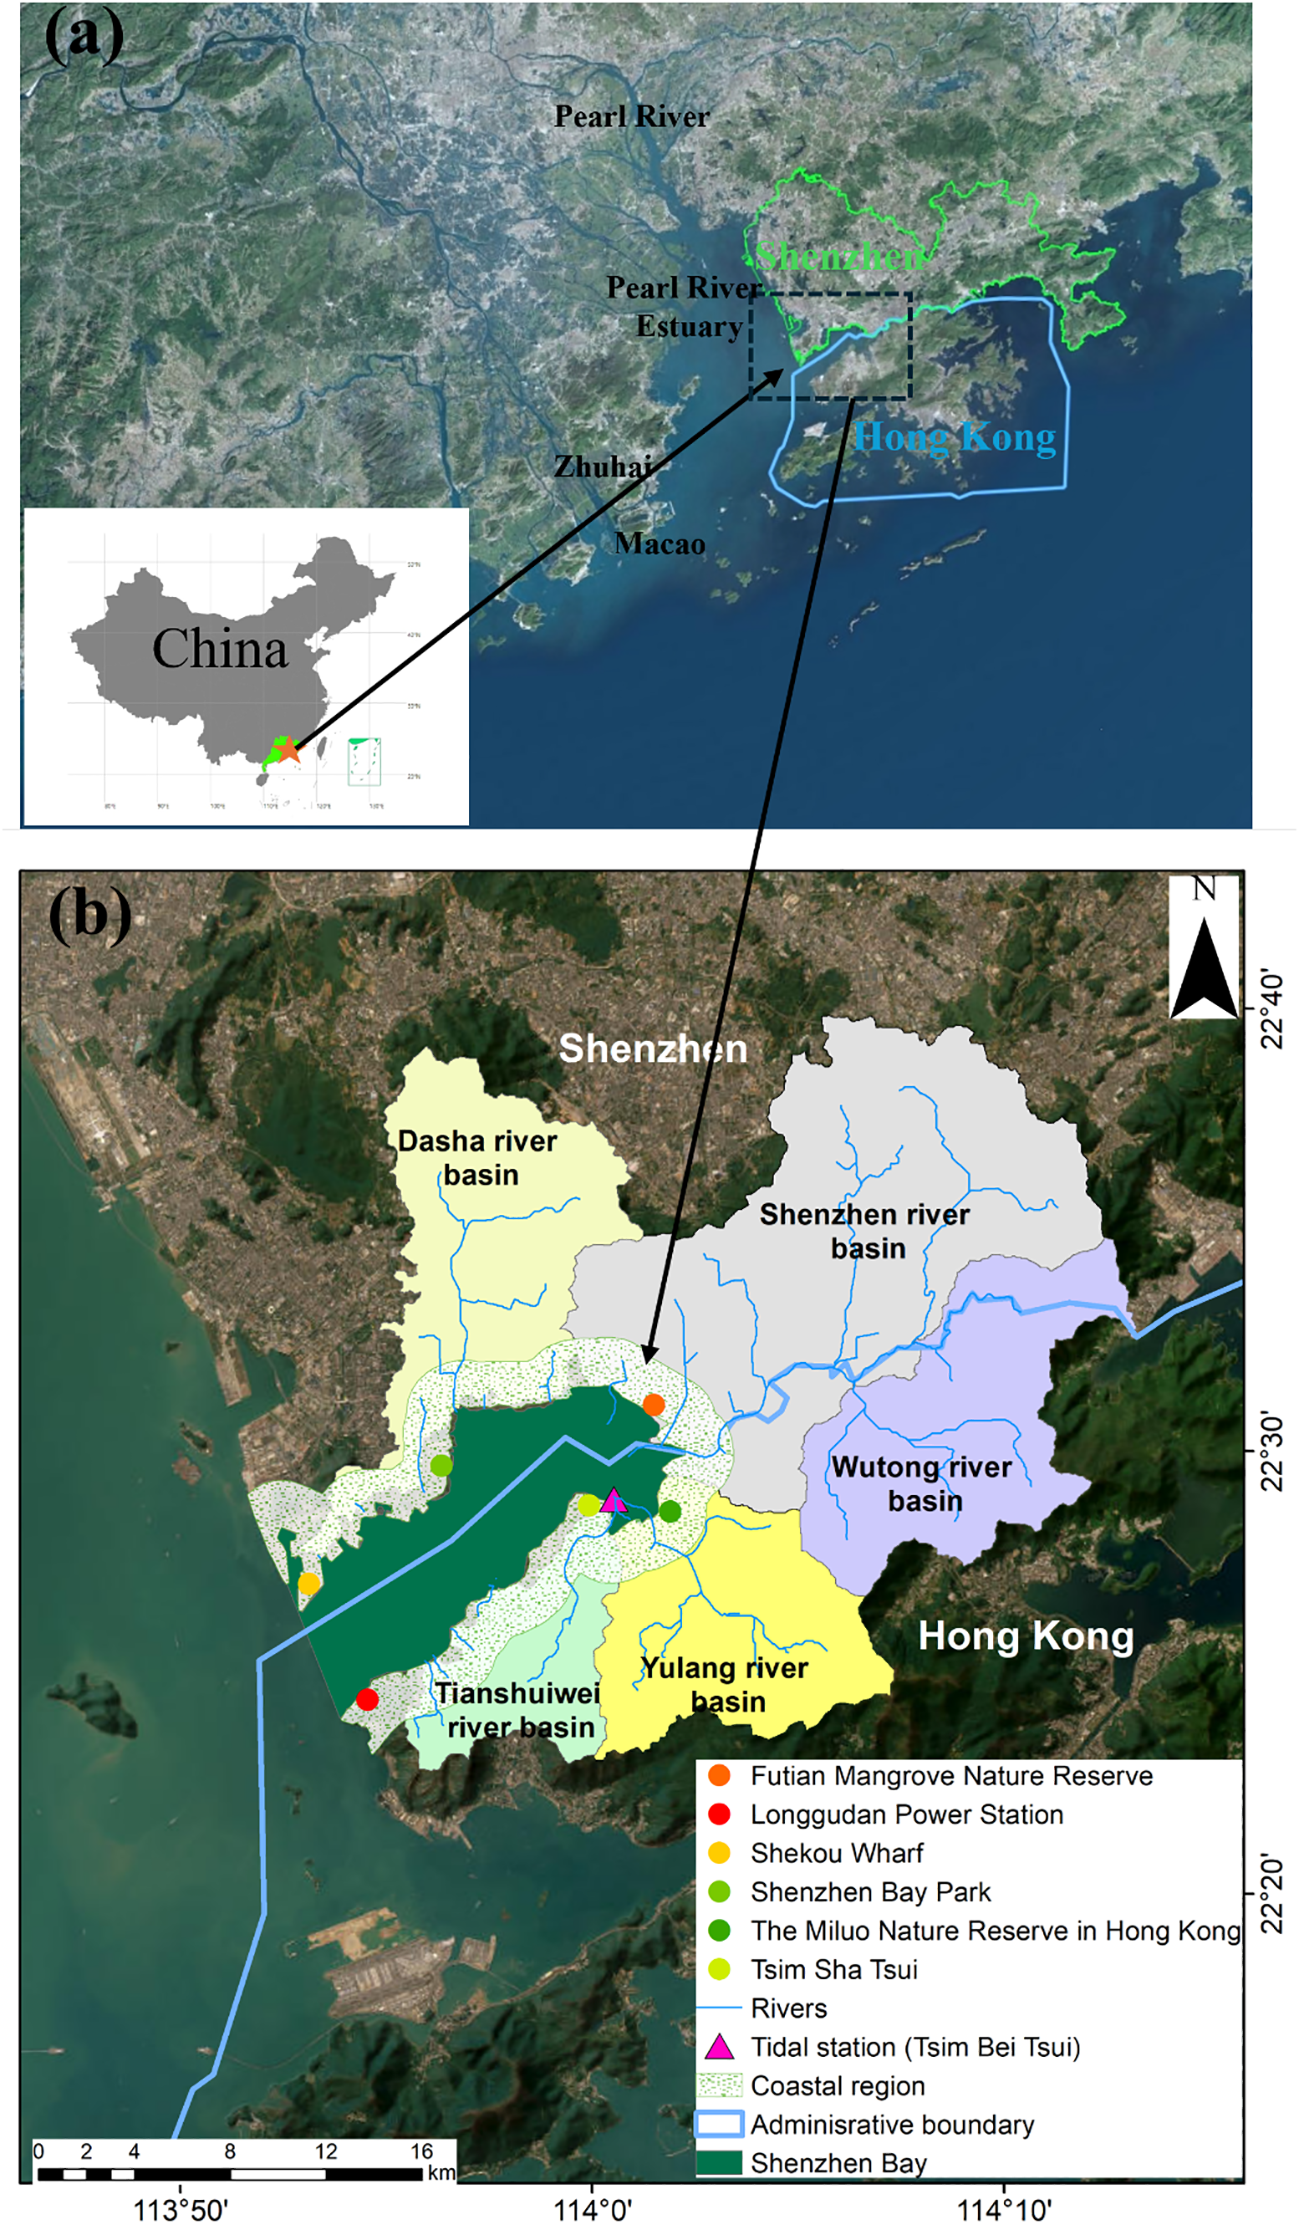
Location map of Shenzhen Bay. (a) Shenzhen and Hong Kong in the Guangdong-Hong Kong-Macao Greaer Bay Area; (b) Shenzhen Bay and its watershed.
2.2 Dataset
This study utilized multi-temporal Landsat satellite imagery (Landsat 5 TM and Landsat 8 OLI/TIRS) spanning 1986–2020 for shoreline detection and change rate estimation in Shenzhen Bay (Table 1). The image selection criteria prioritized cloud-free scenes (<10% cloud cover) acquired during low-tide periods to ensure optimal shoreline visibility. The land use date of coastal zone (1986–2020) is provided by Data Center for Resources and Environmental Sciences, Chinese Academy of Sciences (Xu et al., 2018). Annual tidal records from the Tsim Bei Tsui monitoring station, provided by the Hong Kong Observatory (https://www.hko.gov.hk/sc/cis/yearlyTide.htm?stn=TBT). The sediment accumulation date of Shenzhen Bay is obtained from Kang et al. (2024). All spatial datasets were georeferenced to the WGS84 coordinate system and resampled to 30 m resolution to maintain consistency across the temporal series. The land use data were reclassified into six categories (farmland, forest, grassland, water, construction land, and ocean) to facilitate correlation analysis with shoreline changes.
Table 1
| Number | Satellite image | Sensor | Orbit number/line number | Acquisition date | Spatial resolution |
|---|---|---|---|---|---|
| 1 | Landsat5 | TM | 122/44 | 07/30/1986 | 30 |
| 2 | Landsat5 | TM | 122/44 | 05/06/1990 | 30 |
| 3 | Landsat5 | TM | 122/44 | 12/30/1995 | 30 |
| 4 | Landsat5 | TM | 122/44 | 10/24/2000 | 30 |
| 5 | Landsat5 | TM | 122/44 | 11/23/2005 | 30 |
| 6 | Landsat5 | TM | 122/44 | 09/18/2010 | 30 |
| 7 | Landsat8 | OLI_TIRS | 122/44 | 10/18/2015 | 30 |
| 8 | Landsat8 | OLI_TIRS | 122/44 | 12/02/2020 | 30 |
Parameter information of remote sensing satellite image data.
3 Methods
The proposed approach consists of three main steps:(1) image preprocessing for Landsat data to obtain the orthophoto series, (2) shoreline interpretation to obtain the various types of shorelines from 1986 to 2020, (3) shoreline modeling to analyze the spatiotemporal changes over the 35 years. The technical details of each processing stage are elaborated in the following subsections.
3.1 Shoreline extraction and analysis
Landsat time-series data were radiometrically calibrated and orthorectified to generate comparable multi-temporal orthophoto datasets. Atmospheric correction was performed using the FLAASH algorithm to minimize scattering effects, while topographic normalization accounted for terrain-induced distortions.
The shoreline, defined as the dynamic interface between terrestrial and marine environments, represents a critical ecotone where land-sea interactions create unique geomorphological and ecological features. For this study, we developed a comprehensive shoreline classification system through integrative analysis of: (1) Spectral characteristics derived from multi-temporal Landsat imagery. (2) Coastal zone land use types. (3) Field-validated geomorphological features specific to Shenzhen Bay.
This tripartite classification scheme categorizes shorelines into three principal types (Wei et al., 2023; Zhao et al., 2022): Artificial shorelines: anthropogenically modified structures including seawalls, reclaimed land, and port facilities. Sandy shorelines: natural sedimentary shores composed of unconsolidated granular materials. Biological shorelines: vegetated interfaces featuring mangroves and other coastal wetland ecosystems.
Multiple spectral water indices have been developed for surface water detection in remote sensing applications, including Normalized Difference Water Index (NDWI) (McFeeters, 1996), Modified Normalized Difference Water Index (MNDWI) (Xu, 2006), the Automated Water Extraction Index (AWEI) (Feyisa et al., 2014; Zhang Z. et al., 2024), and WI2015 (Fisher et al., 2016). This study employs the MNDWI (Equation 1) for land-water boundary delineation due to its demonstrated advantages in: (1) Maintaining stable performance in delineating water from land (Huang et al., 2018). (2) Effectively suppressing built-up land noise compared to conventional NDWI (Xu, 2018). (3) Providing more accurate water classification in urbanized coastal areas.
The equation of MNDWI as follows (Xu, 2006):
where GREEN is the green band, and MIR is the Middle Infrared band.
The DSAS model, implemented within ArcGIS 10.4 desktop, was employed to quantify spatiotemporal shoreline changes in Shenzhen Bay (Eludoyin et al., 2012). This widely-accepted geospatial tool enables comprehensive analysis of coastal dynamics through three primary functions: (1) shoreline digitization, (2) change rate calculation, and (3) visualization of erosion/accretion patterns (Matin and Hasan, 2021; Valderrama-Landeros and Flores-De-Santiago, 2019). DSAS is significant for shoreline management, planning and coastal community risk assessment (Qiao et al., 2018). At present, shoreline spatial evolution methods mainly include dynamic segmentation method, baseline method, and area method (Li and Damen, 2010; Thoai et al., 2019). In the study, the baseline method in DSAS was selected for its demonstrated effectiveness in quantifying coastal change rates (Nan, 2018), the main steps are as following: (1) A 500 m landward buffer from the 1986 shoreline served as the reference baseline, representing the most stable historical shoreline position prior to intensive urban development (Wei et al., 2023). (2) Transects are obtained by making vertical sections along the baseline to the shorelines of different periods. The spacing of adjacent profile lines is set at 50 m (Qiao et al., 2018), and the shoreline is numbered successively according to the spatial distribution of the shoreline from the southwest (Shenzhen) to the southeast (Hong Kong) of Shenzhen Bay (Figure 2). (3) For calculating shoreline change rates, two statistical parameters were utilized: Net Shoreline Movement (NSM) and End Point Rate (EPR) (Equation 2).
Figure 2
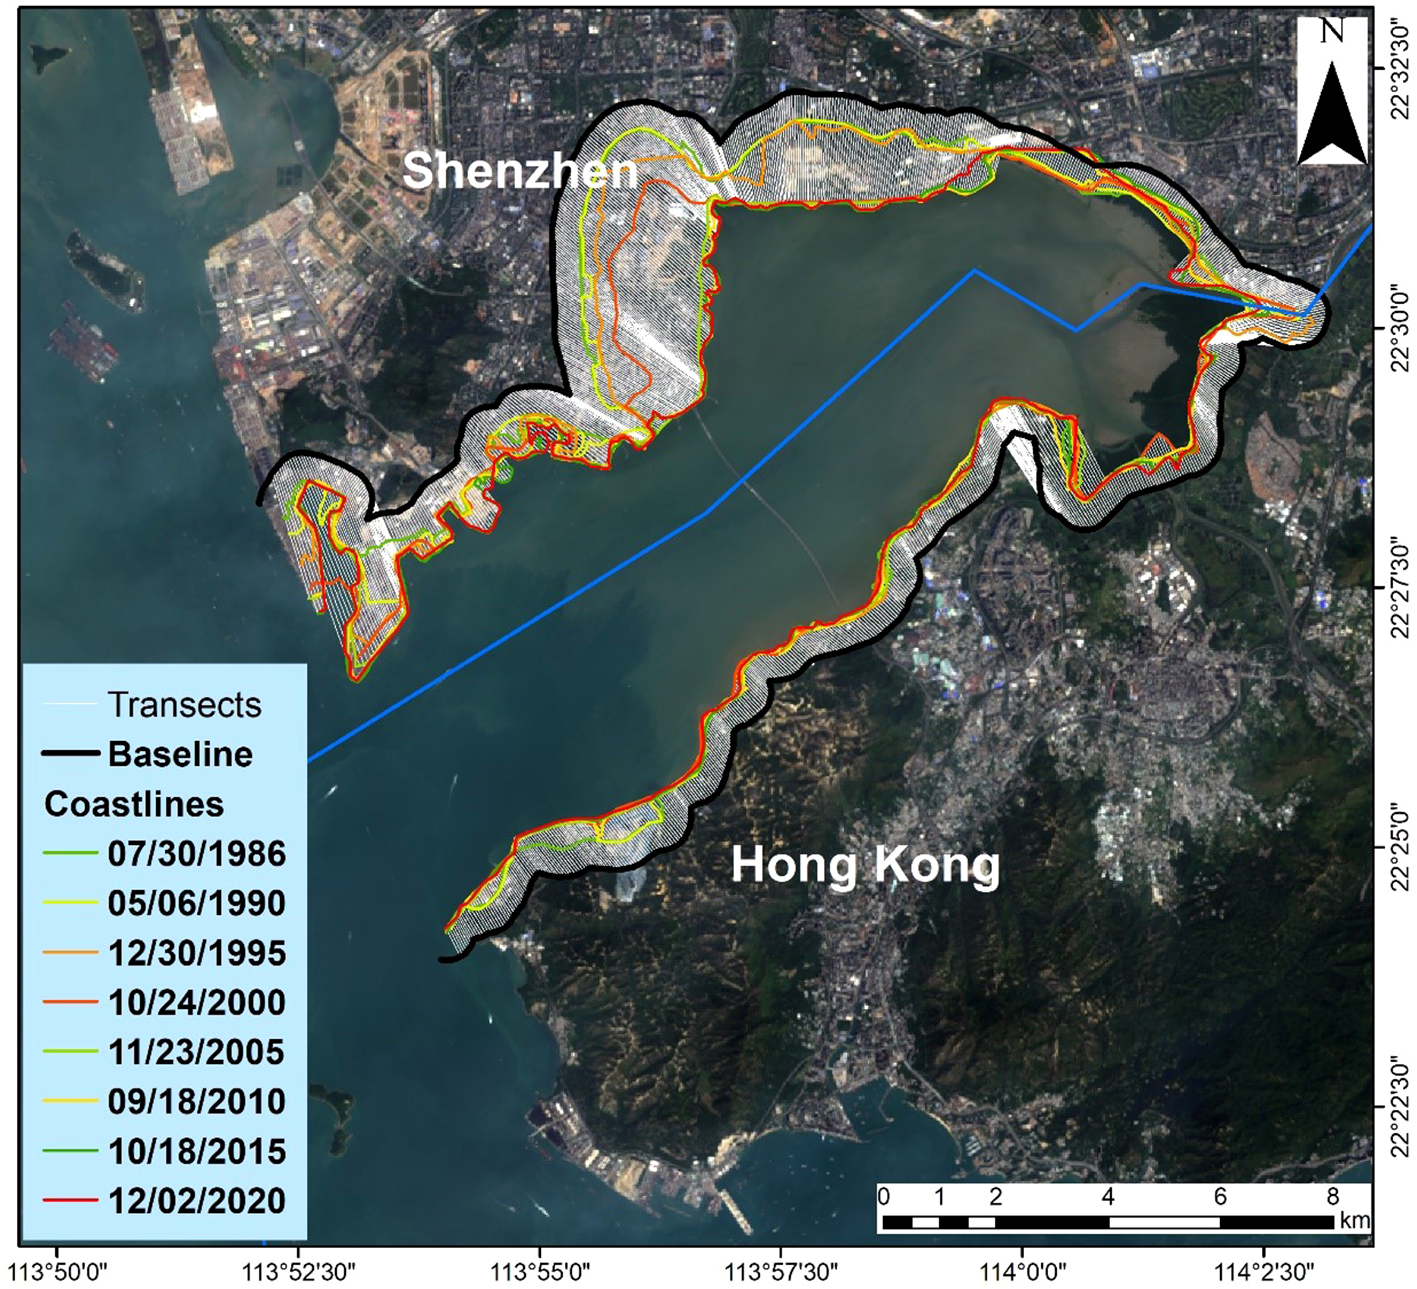
The transects and shorelines of Shenzhen Bay.
NSM represents the total distance between the earliest and most recent shorelines in multiple shoreline periods (Himmelstoss et al., 2021):
where D1 is the distance between the earliest shoreline and the baseline, D2 is the distance between the most recent shoreline and baseline (Equation 3).
EPR represents the rate of between the earliest and most recent shorelines in multiple shoreline periods (Himmelstoss et al., 2021):
where T1 is the time of the earliest shoreline, T2 is the time of the recent shoreline.
3.2 Shoreline length change intensity and human activity intensity index model
The CLCI was used to compare shoreline change in different periods (Zhao et al., 2022):
where CLCIij is the CLCI between year i and year j; Li and Lj are the shoreline length of year i and year j. The absolute of CLCI greater presents the shoreline change more dramatically.
Land use/cover change (LUCC) serves as a robust proxy for anthropogenic disturbances, representing the most visible spatial manifestation of socioeconomic development (Wu et al., 2014). To systematically evaluate human pressures on coastal ecosystems, this study employed the HAII - a well-established metric that quantifies the magnitude of anthropogenic modification across landscapes (Chen et al., 2001; Liang and Liu, 2011). The HAII was calculated for the Shenzhen Bay coastal zone using the following formulation (Chen et al., 2001; Xu Y. et al., 2015; Liu et al., 2016 come from Bai et al., 2019, 22; Bai et al., 2019):
where: N is the number of coastal zone land use types; An is the area of n coastal zone land use type; S is area of the total coastal zone; kn is the assigned value for the interference intensity of the n-th land use type, which is obtained from the Tabel 2 (Bai et al., 2019). The kn in Supplementary Table S1 represents the previously established classification criteria for the response of land use to human activities in the study of the coastal zone of Shenzhen (Bai et al., 2019).
3.3 Evaluation of shoreline extraction accuracy
To evaluate the accuracy of shoreline extraction from Landsat imagery, this study randomly selected four epochs of high-spatial-resolution (5 m) Google Earth images from the years 1990, 2000, 2010, and 2020. Shorelines extracted from these images were compared with those derived using the MNDWI method in this research. The DSAS model was employed to generate evenly spaced transects perpendicular to the shoreline. The distance difference between the two sets of shorelines on the same transect was calculated and used as the extraction error. According to Hou et al. (2014) the theoretical maximum permissible error for shoreline extraction from 30 m resolution remote sensing imagery is 28.28 m. An error smaller than this value indicates that the interpretation accuracy at that transect meets the required standard. Based on this criterion, Table 2 shows that the qualification rates for all four studied years in the research area exceeded 83%, confirming that the interpretation accuracy satisfies the requirements.
Table 2
| Year | Number of samples / unit | Number of qualified samples / unit | Mean error / % |
|---|---|---|---|
| 1990 | 1000 | 836 | 83.60% |
| 2000 | 1000 | 850 | 85% |
| 2010 | 1000 | 877 | 87.70% |
| 2020 | 1000 | 864 | 86.40% |
Accuracy assessment of shoreline information.
4 Results
4.1 The length change of different shoreline styles during 1986-2020
The superposition of eight multi-temporal shoreline classifications (Figure 3) reveals distinct evolutionary patterns across Shenzhen Bay from 1986 to 2020. Overall, the shoreline keeps an advancing trend towards the ocean side, demonstrating the dominant influence of anthropogenic coastal modification throughout the study period (Figure 3).
Figure 3
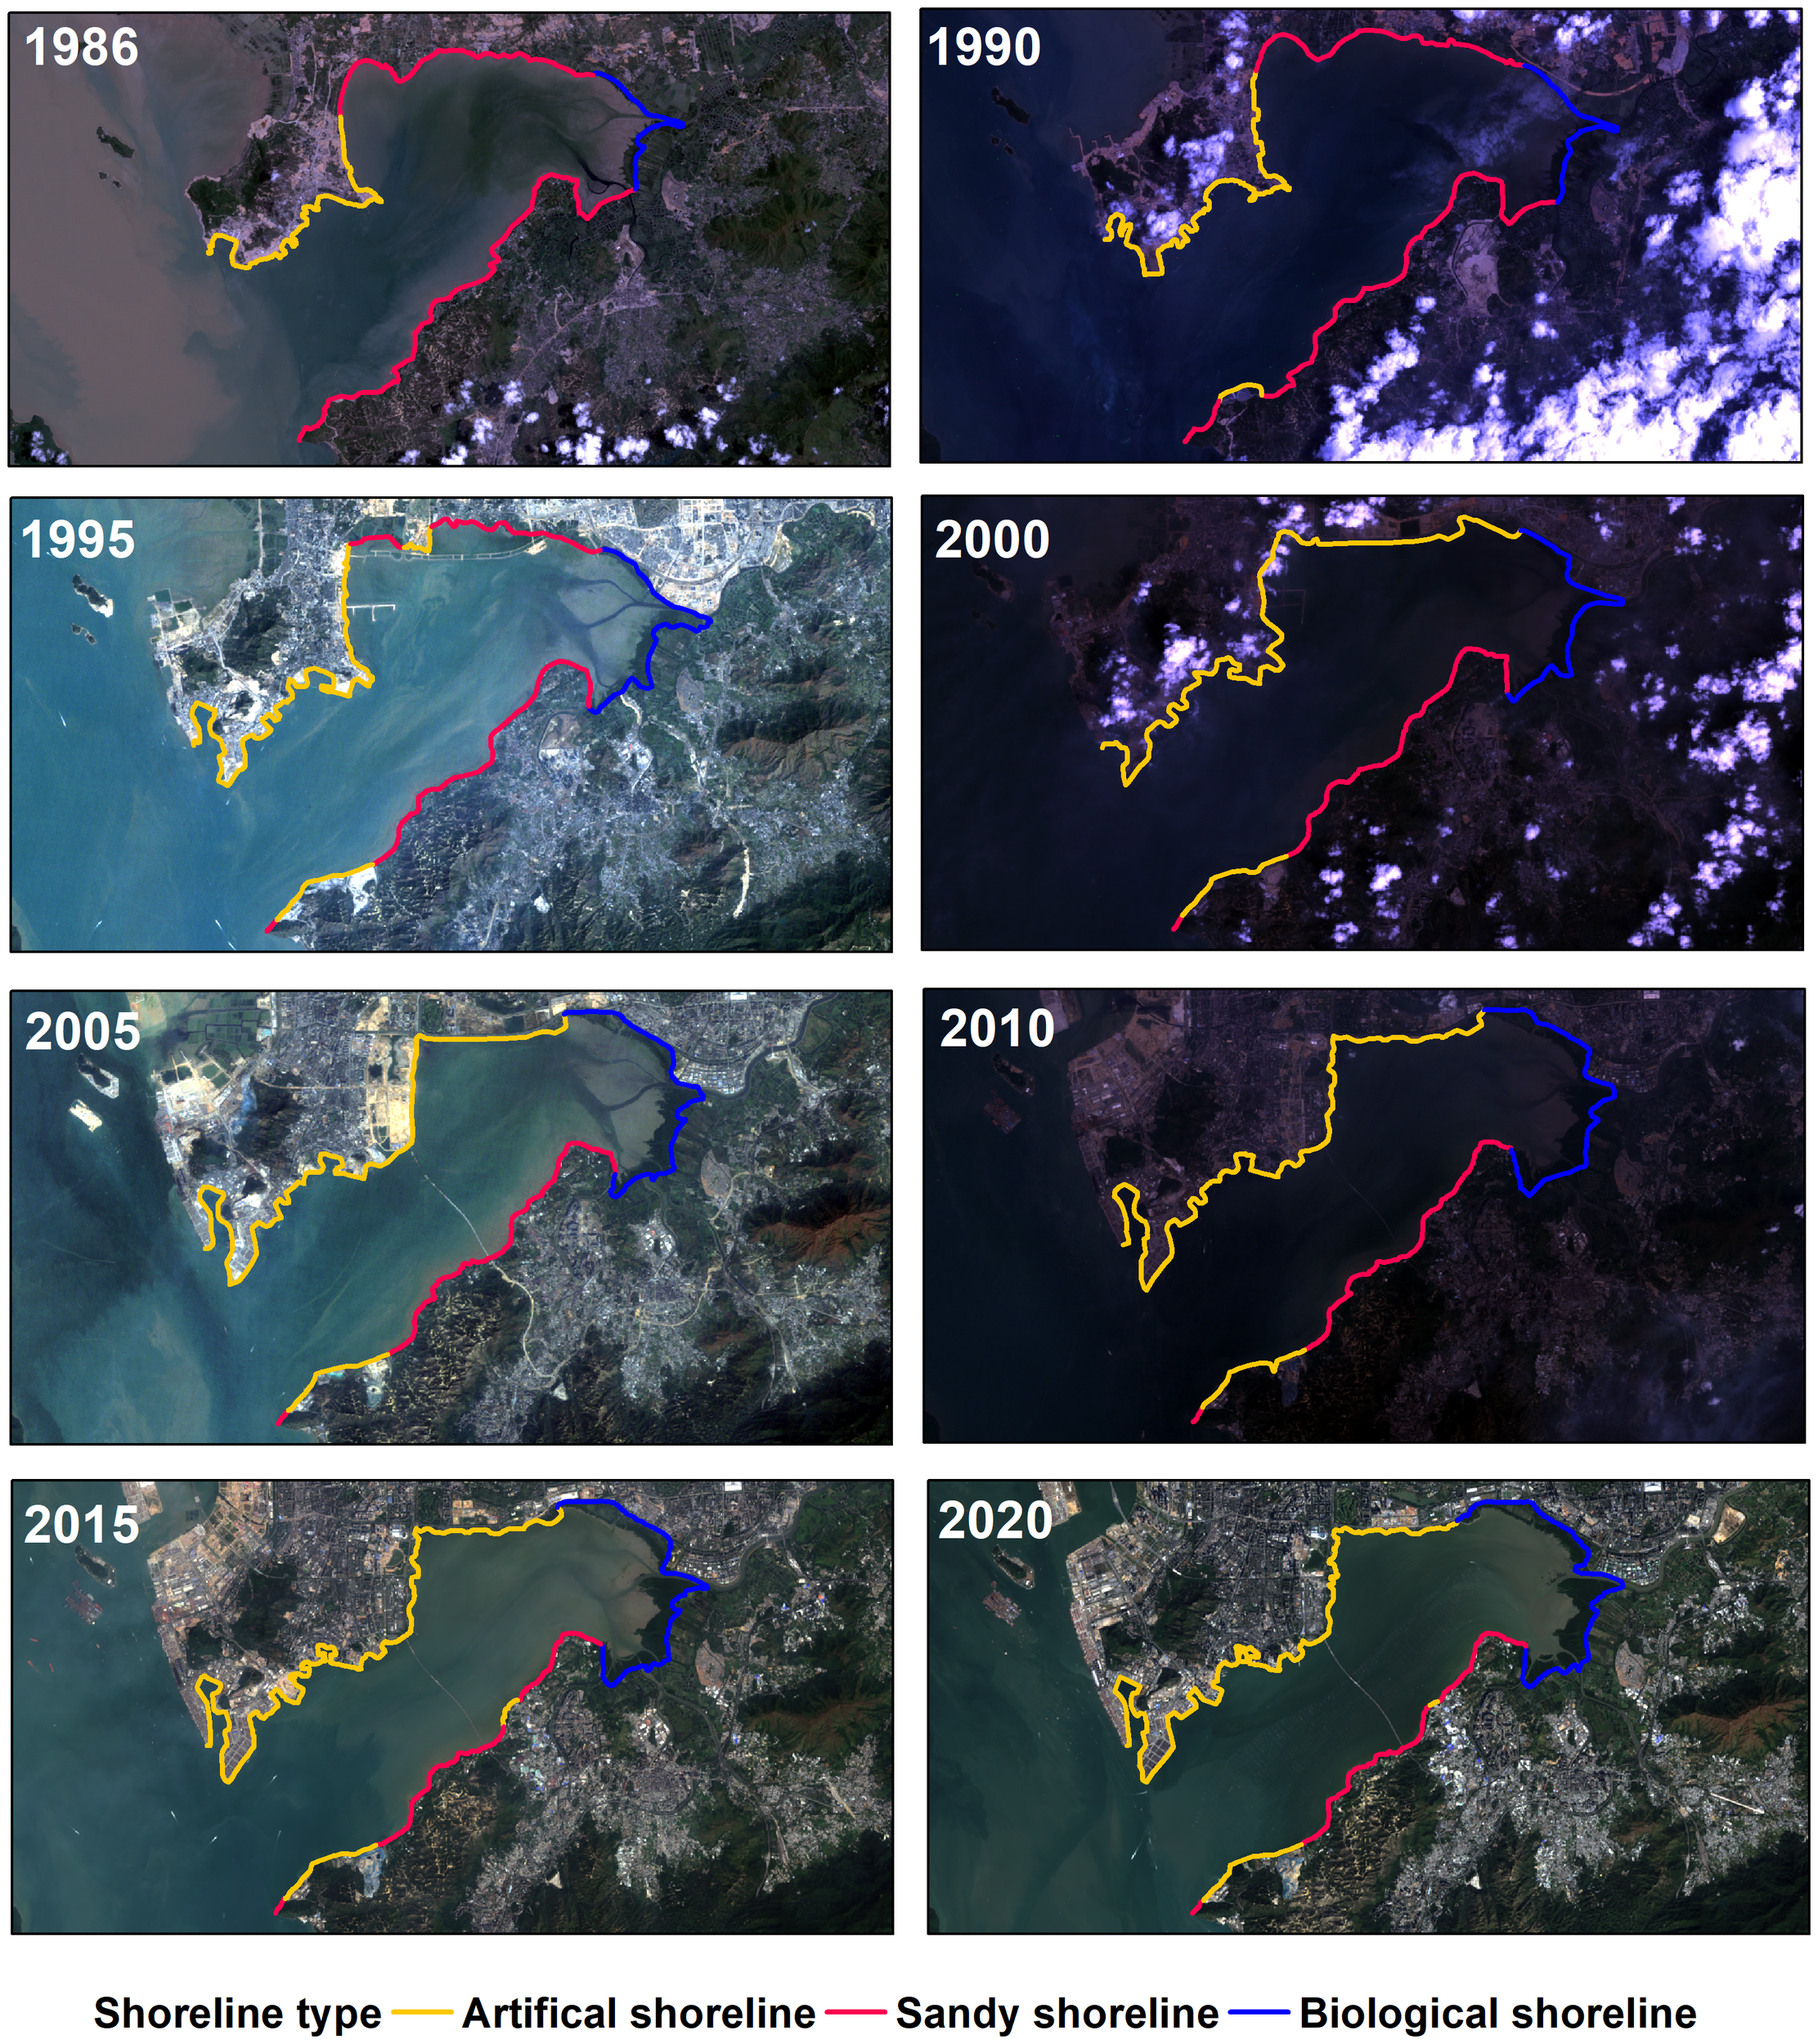
Spatial distribution of different shoreline types in Shenzhen Bay in 1986-2020.
The temporal analysis reveals a tripartite evolutionary sequence. Accelerated expansion (1986–1995): rapid shoreline length extension (0.53 km/a) during China's initial economic reform period. Transient recession (1995–2000): significant shoreline retreat (-1.20 km/a) potentially associated with macroeconomic impacts of the Asian Financial Crisis. Moderate recovery (2000–2020): renewed but regulated shoreline advancement (0.30 km/a) under revised coastal management policies, environmental impact assessment requirements, and sustainable development frameworks.
In the past 35 years, the shoreline composition underwent substantial reorganization (Figure 4). The sand shoreline reduced rapidly, artificial shoreline and biological shoreline increased quickly during 1986–2020 (Figure 4a). The sandy shorelines exhibited a 63.5% reduction (34.0 km to 12.4 km), declining from 58.2% to 19.2% of total shoreline length (Figure 4a). This dramatic loss primarily occurred during 1986–1995 (1.3 km/a reduction rate). Artificial shorelines demonstrated 120.5% expansion (16.1 km to 35.5 km), increasing their proportion from 27.6% to 55.8% (Figure 4c). The most rapid artificialization occurred during 1986–1995 increasing 81.4%. Biological shorelines displayed continuous growth (8.3 km to 15.7 km), with percentage contribution rising from 13.7% to 25.2% (Figure 4c). This pattern reflects both conservation efforts and natural colonization in protected zones.
Figure 4
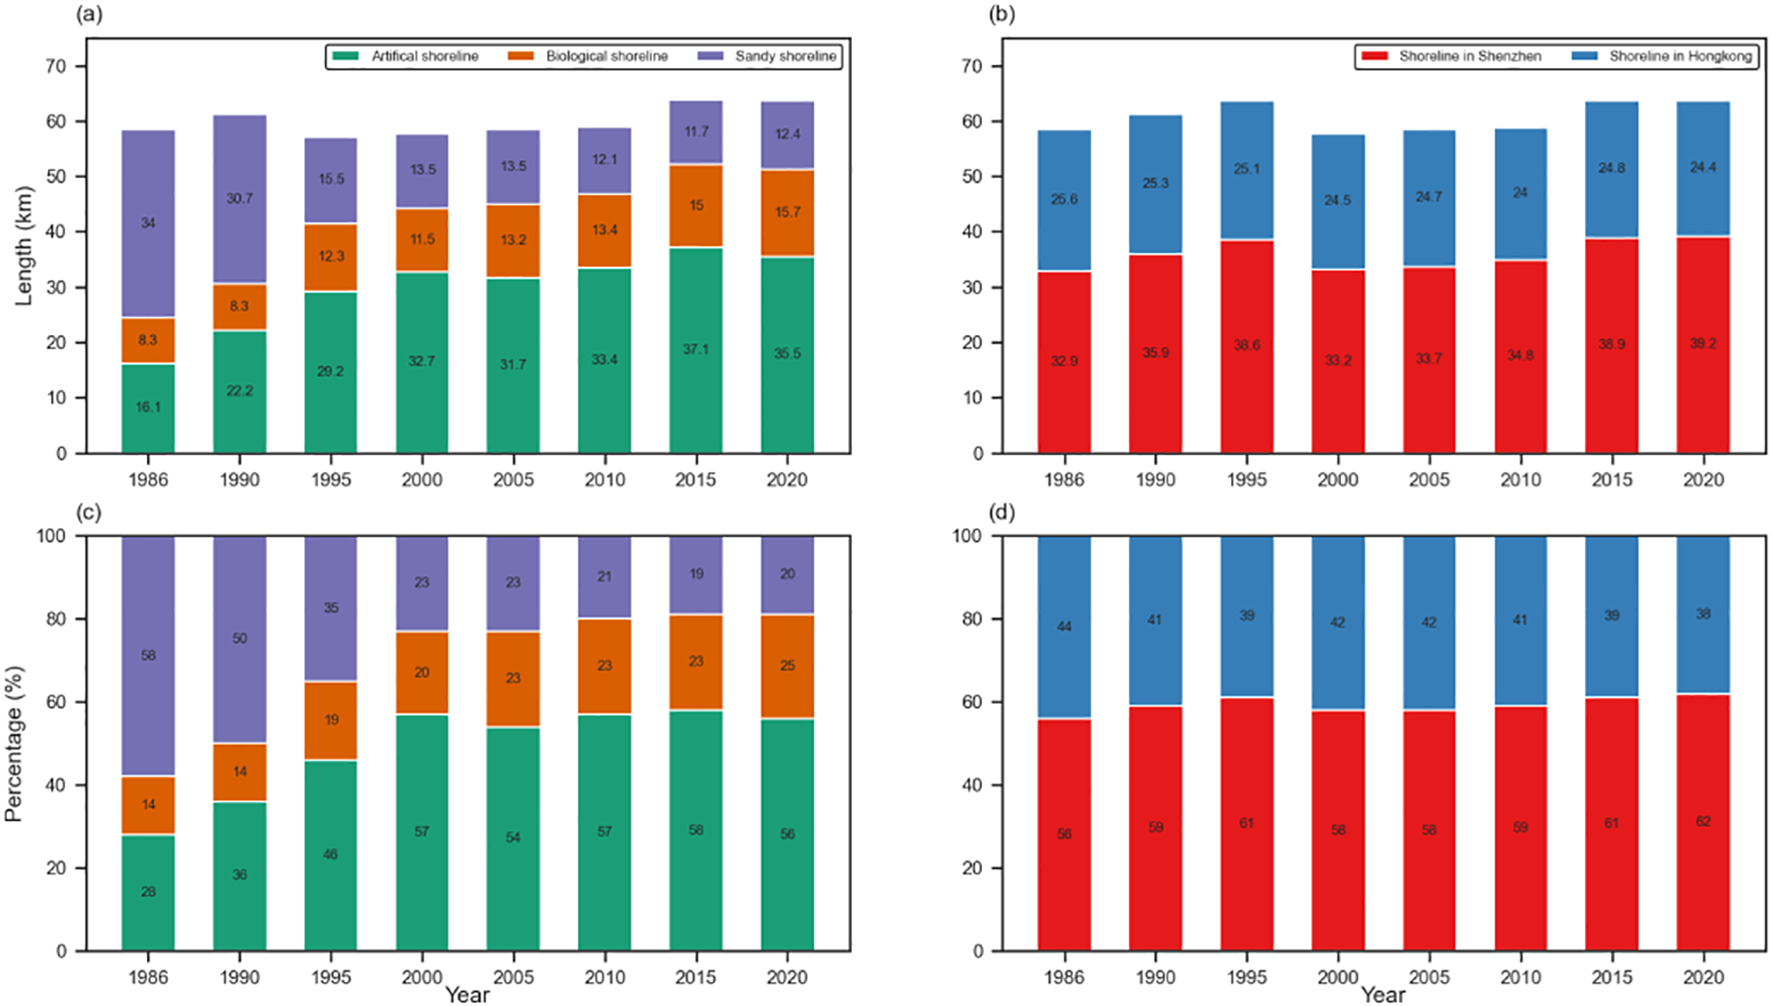
The change of different shorelines style in different periods. (a) Length of different shoreline styles; (b) Length of shoreline in different areas; (c) Percentage of different shoreline styles; (d) Percentage of shoreline in different areas.
Marked differences in shoreline dynamics were observed across administrative boundaries. During 1986–2020, in Shenzhen sector, the shoreline length displayed aggressive coastal advancement by 0.57 km/a and the proportion of the shoreline in Shenzhen increased from 56% to 62%, ranking among the most rapidly modifying urban shorelines globally (Figure 4d). During 1986–2020, in Hong Kong sector, the shoreline length showed marginal retreat by -0.17 km/a and the proportion of the shoreline in Hong Kong decreased from 44% to 38% (Figure 4b).
4.2 Shenzhen Bay area change during 1986-2020
Figure 5 presents a comprehensive quantification of the spatiotemporal changes in Shenzhen Bay's surface area from 1986 to 2020. The analysis reveals a statistically significant reduction in total bay area, decreasing from 112.24 km² to 91.45 km² over the 35-year study period, representing an average annual loss of 0.70 km²/a (Figure 5a). In the Shenzhen sector, the most pronounced modifications occurred in two key locations: Shekou Wharf area which characterized by progressive seaward expansion for port infrastructure development and Shenzhen Bay Park vicinity due to systematic land reclamation for urban recreational space (Figure 5b). Conversely, the Hong Kong sector demonstrated more localized changes, concentrated in: Tsim Bei Tsui which exhibiting moderate shoreline adjustments and Longgudan Power Station area due to display limited but measurable modifications.
Figure 5
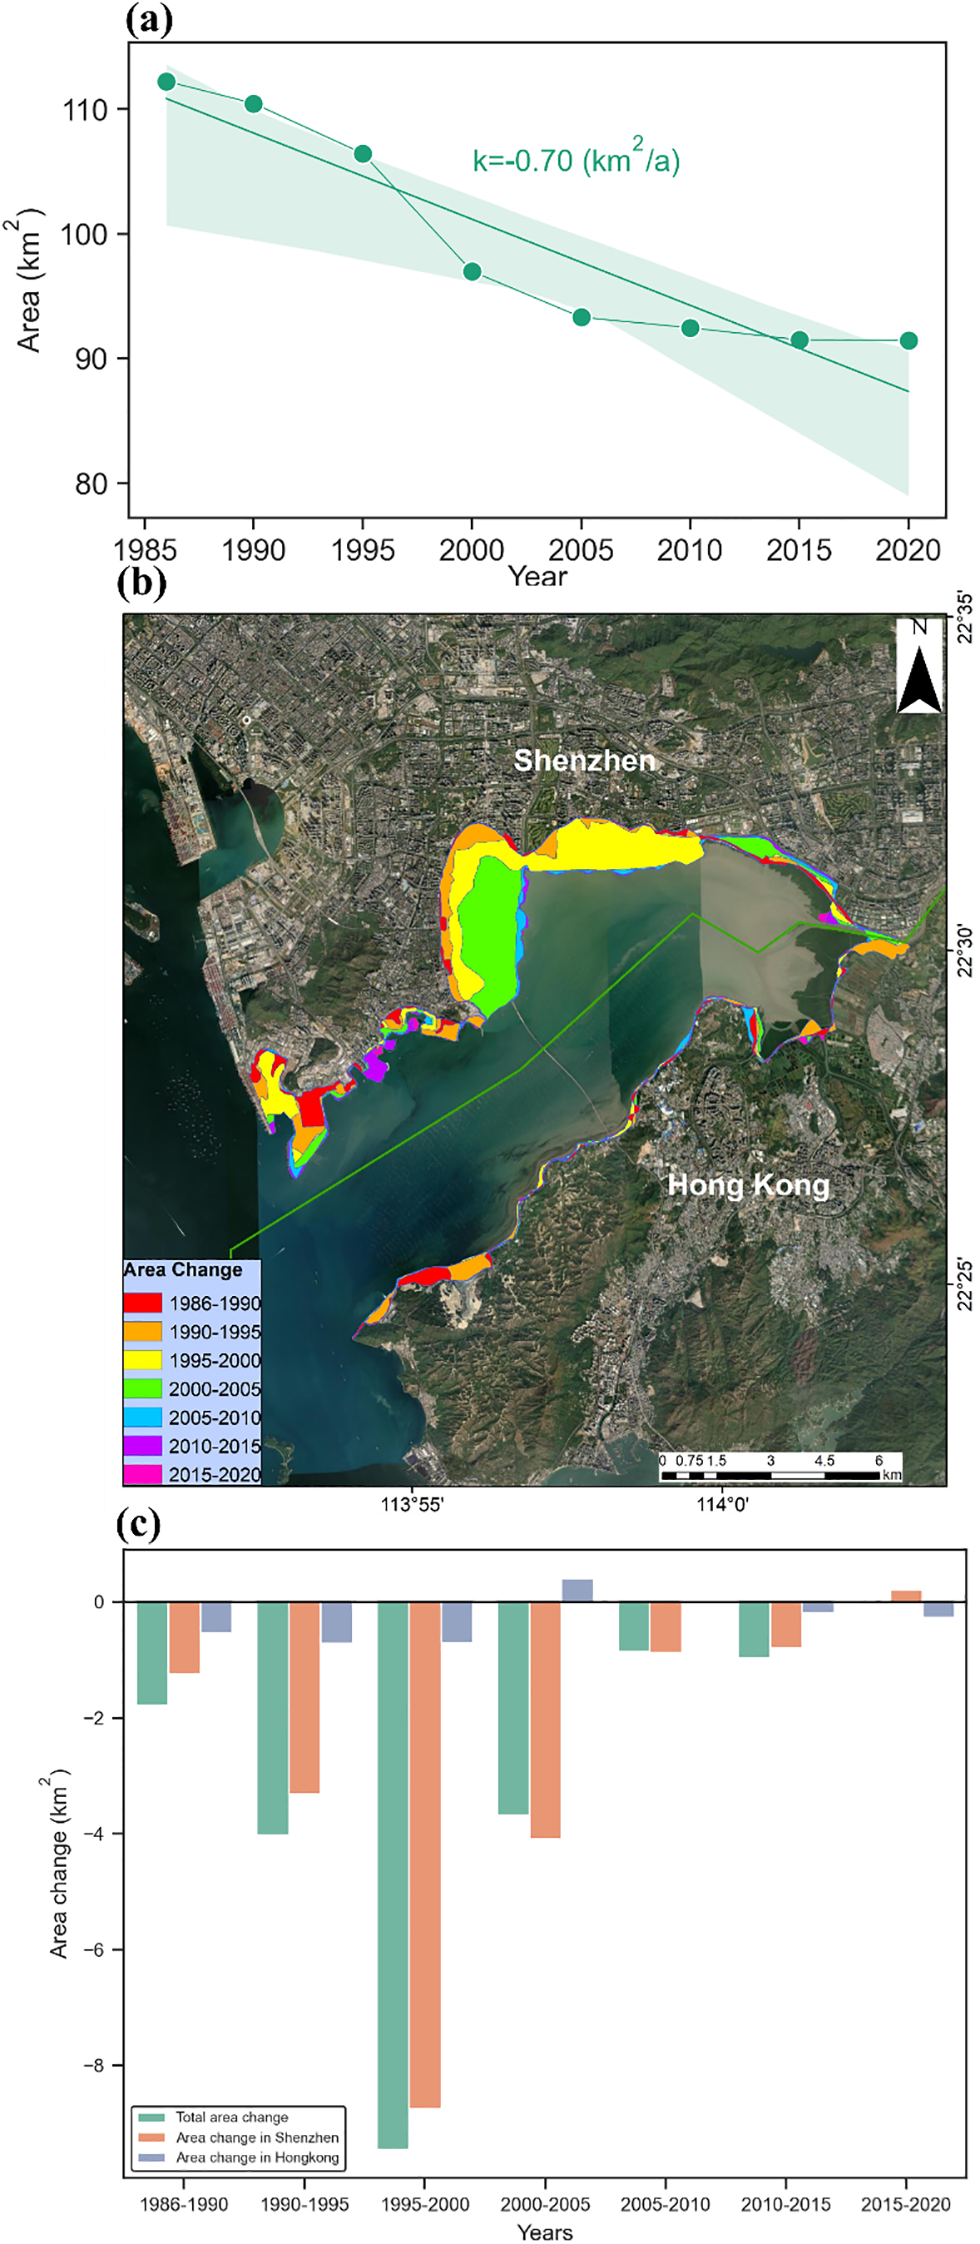
The area changes of Shenzhen Bay. (a) Spatial change; (b) Temporal change during 1986–2020; (c) Temporal change for each period. The reference area is the 1986 Shenzhen Bay area interpreted in this research.
The differential spatial patterns between sectors reflect contrasting coastal management approaches, with Shenzhen's aggressive development strategy producing significantly greater areal reductions compared to Hong Kong's more conservative modifications. These quantified changes provide critical baseline data for assessing the cumulative impacts of coastal urbanization in semi-enclosed bay systems.
The periodic analysis of Shenzhen Bay's areal changes reveals distinct temporal patterns and spatial disparities (Figure 5c). The total surface area reduction of 20.79 km² (1986–2020) followed a nonlinear trajectory, characterized by an initial phase of accelerated decline (1986–2000) followed by progressive moderation (2000–2020). Spatial decomposition of these changes demonstrates striking administrative disparities, with the Shenzhen sector accounting for 91% of total area loss (18.13 km²), compared to merely 1.96 km² in the Hong Kong sector. The temporal variability of areal changes is particularly noteworthy. The peak modification period (1995–2000) with an area reduction of 9.45 km² coincided with intensive port expansion projects, large-scale coastal infrastructure development, and unprecedented urbanization pressures. The minimum areal change of -0.04 km² observed during 2015–2020 reflects the combined effects of stricter coastal management policy implementation, near-saturation of reclaimable coastal areas, and enhanced environmental protection measures.
Periodic averages (-2.97 km²/period) mask substantial intra-decadal variability, highlighting the importance of high-temporal-resolution analysis for understanding coastal transformation processes. These quantified patterns provide critical insights into the nonlinear dynamics of coastal urbanization, the measurable effectiveness of policy interventions, and the spatially concentrated distribution of anthropogenic impacts. These quantified patterns provide critical insights into the nonlinear dynamics of coastal urbanization, the measurable effectiveness of policy interventions, and the spatially concentrated distribution of anthropogenic impacts.
4.3 Net shoreline movement and spatiotemporal shoreline change during 1986-2020
We calculated shoreline change in the direction of transects over the research period including 8 periods by DSAS model (Figure 6). Herein NSM between 1986 and 2020 are analyzed in detail, as shown in Figure 6. The NSM metric reveals that accretion dominated the bay's morphological evolution, with distinct spatial and administrative variations. As seen in Figure 6a, accretion was the main change mode of shoreline over the past 35 years. Statistical analysis of shoreline changes revealed that 76.6% of transects exhibited seaward progression (comprising 53.7% with moderate accretion [0–1000 m], 21.2% showing significant advancement [1000–3000 m], and 1.6% displaying extreme progradation [>3000 m]), while 23.4% experienced landward retreat. The NSM values exhibited pronounced spatial gradients. The Shenzhen sector exhibited pronounced coastal progradation with a mean NSM of 965.13 m, featuring distinct accretion hotspots at Shekou Wharf (NSM > 3000 m) and Shenzhen Bay Park (2000–3000 m) that directly correlate with intensive land reclamation projects. The Hong Kong sector demonstrated minimal coastal displacement (mean NSM = 81.65 m), maintaining stable configurations in protected zones that reflect its conservative coastal management approach.
Figure 6
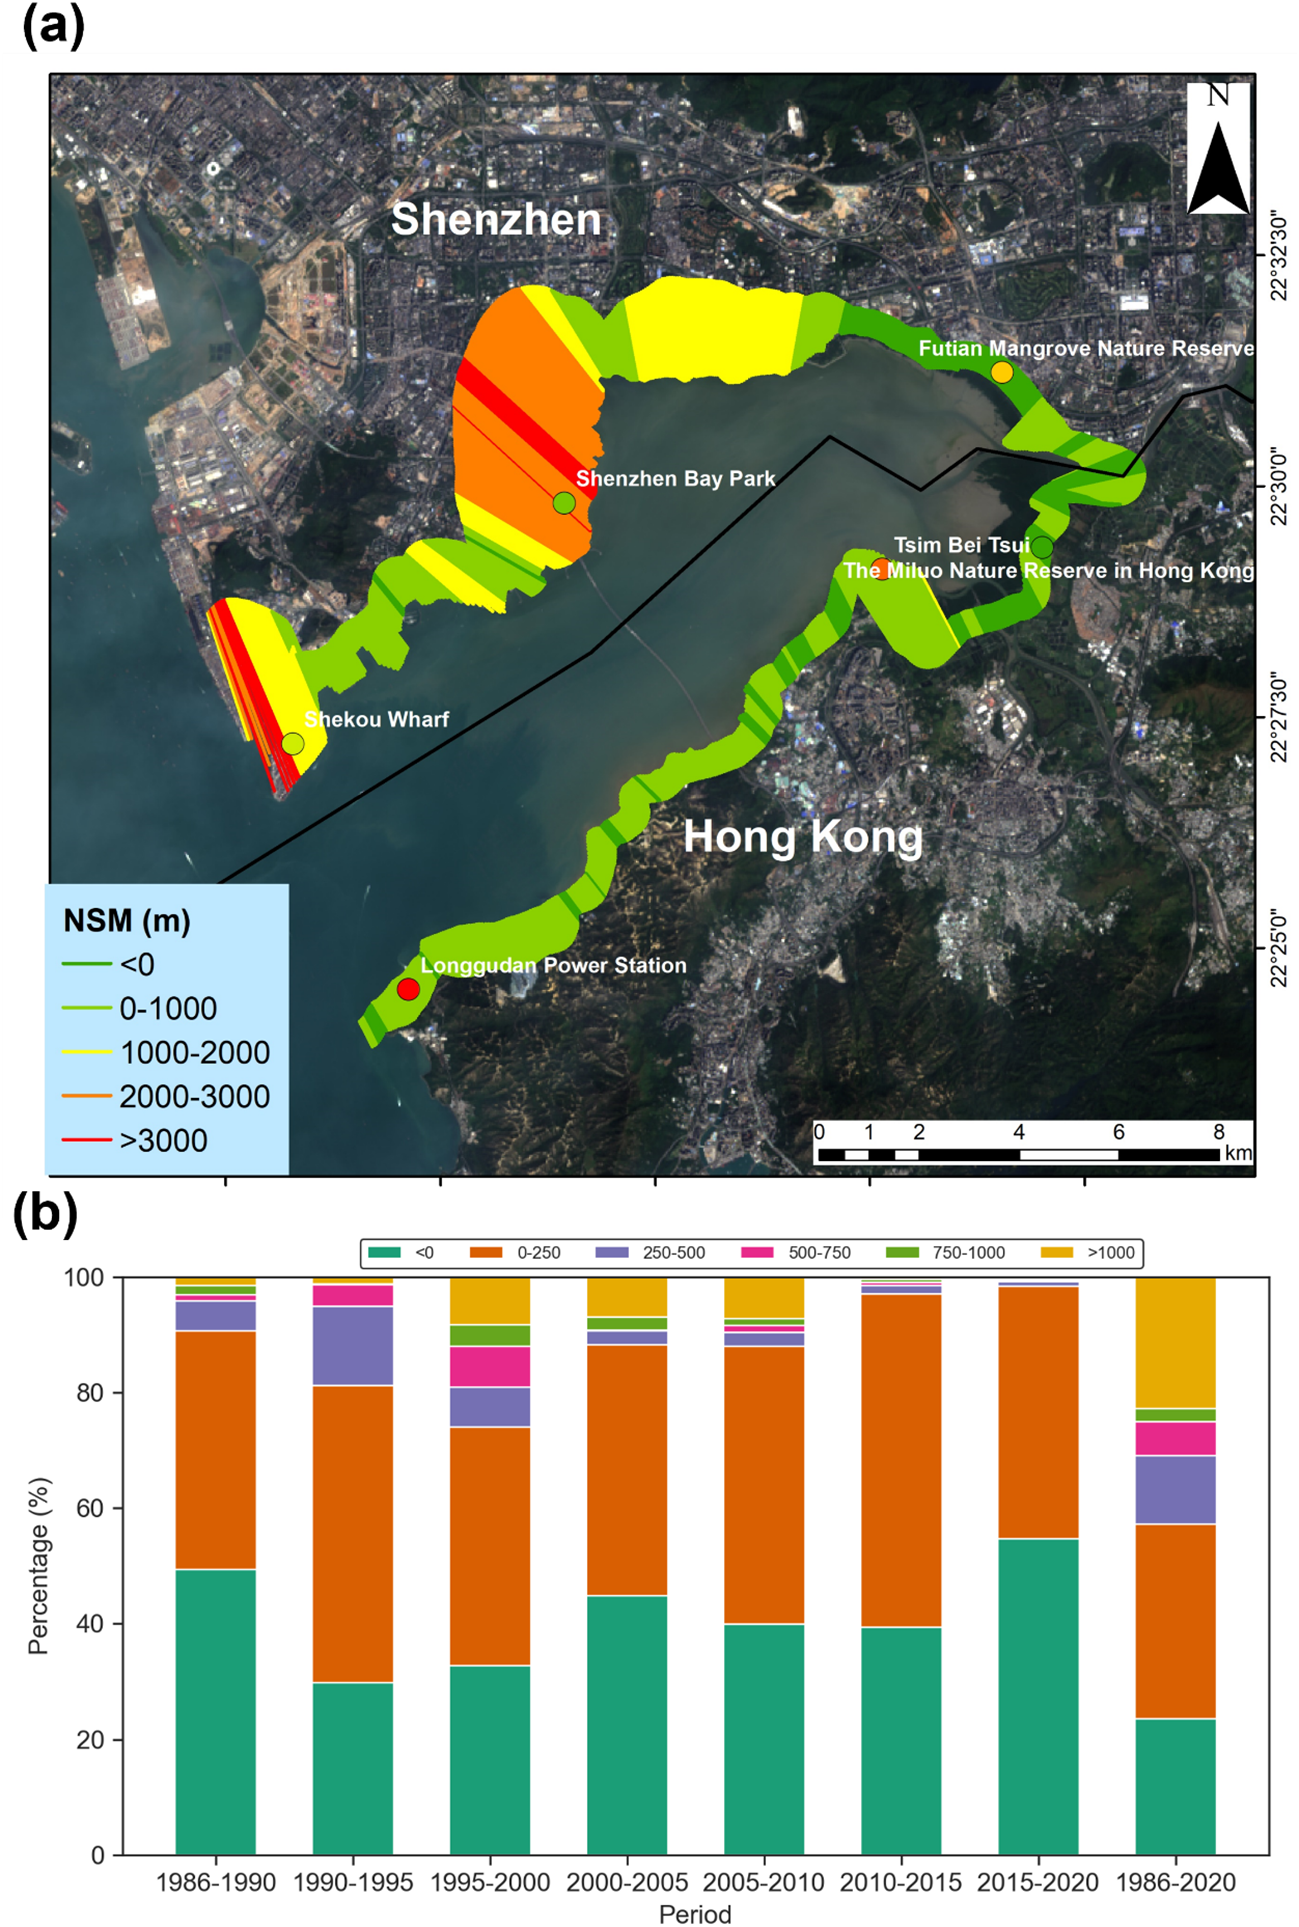
Net Shoreline Movement (NSM) distribution and statistics during 1986–2020. (a) NSM spatial distribution; (b) The percentage of different value intervals of NSM.
Analysis of NSM value distributions across the eight study periods reveals significant temporal variations in coastal evolution dynamics (Figure 6b). The periods 1986–1990 and 2015–2020 exhibited peak erosion susceptibility, with negative NSM values accounting for 49.38% and 54.73% of transects respectively. These distinct erosional phases correspond to fundamentally different drivers: early-stage coastal restructuring during initial development (1986–1990) and increased storm frequency/intensity associated with climate change impacts (2015–2020). The predominance of the 0–250 m NSM range as the modal class (mean frequency = 41.54%) reflects moderate sustained progradation, effective coastal stabilization measures, and balanced sediment budgets across most sectors. The non-monotonic trend in positive NSM percentages reveals a triphasic coastal evolution pattern for progressive increase during the development phase, gradual decrease through the stabilization phase (2000–2015), and renewed erosional pressure in the recent period (2015–2020).
Percentage distributions derived from DSAS-generated NSM values along 50 m-spaced transects (n=1,047). Positive values indicate seaward displacement relative to baseline of 1986. This temporal analysis elucidates the cyclical nature of coastal modification processes, evaluates the efficacy of management interventions, and reveals climate change-induced impacts on coastal stability dynamics.
The EPR metric was employed to quantify decadal-scale shoreline changes across Shenzhen Bay from 1986 to 2020 (Figure 7). Spatial analysis of 1,047 transects (divided into Shenzhen [1-540] and Hong Kong [540–1047] sectors) revealed striking disparities in coastal modification intensities. The Shenzhen sector exhibited aggressive coastal progradation with a mean EPR of 28.10 m/a (1986–2020), peaking at 79.28 m/a (1995–2000) during port expansions and 54.28 m/a (2000–2005) with park construction. In contrast, the Hong Kong sector maintained marginal changes with a mean EPR of 2.37 m/a. The EPR trajectory revealed an accelerated modification phase (1995–2005) with a mean rate of 5.06 m/a. Subsequently, a stabilization phase emerged (2005–2020) featuring significantly reduced rates (-3.08 m/a). The EPR patterns exhibit strong correlations with three key anthropogenic drivers: land reclamation timelines, infrastructure investment cycles, and policy implementation milestones.
Figure 7
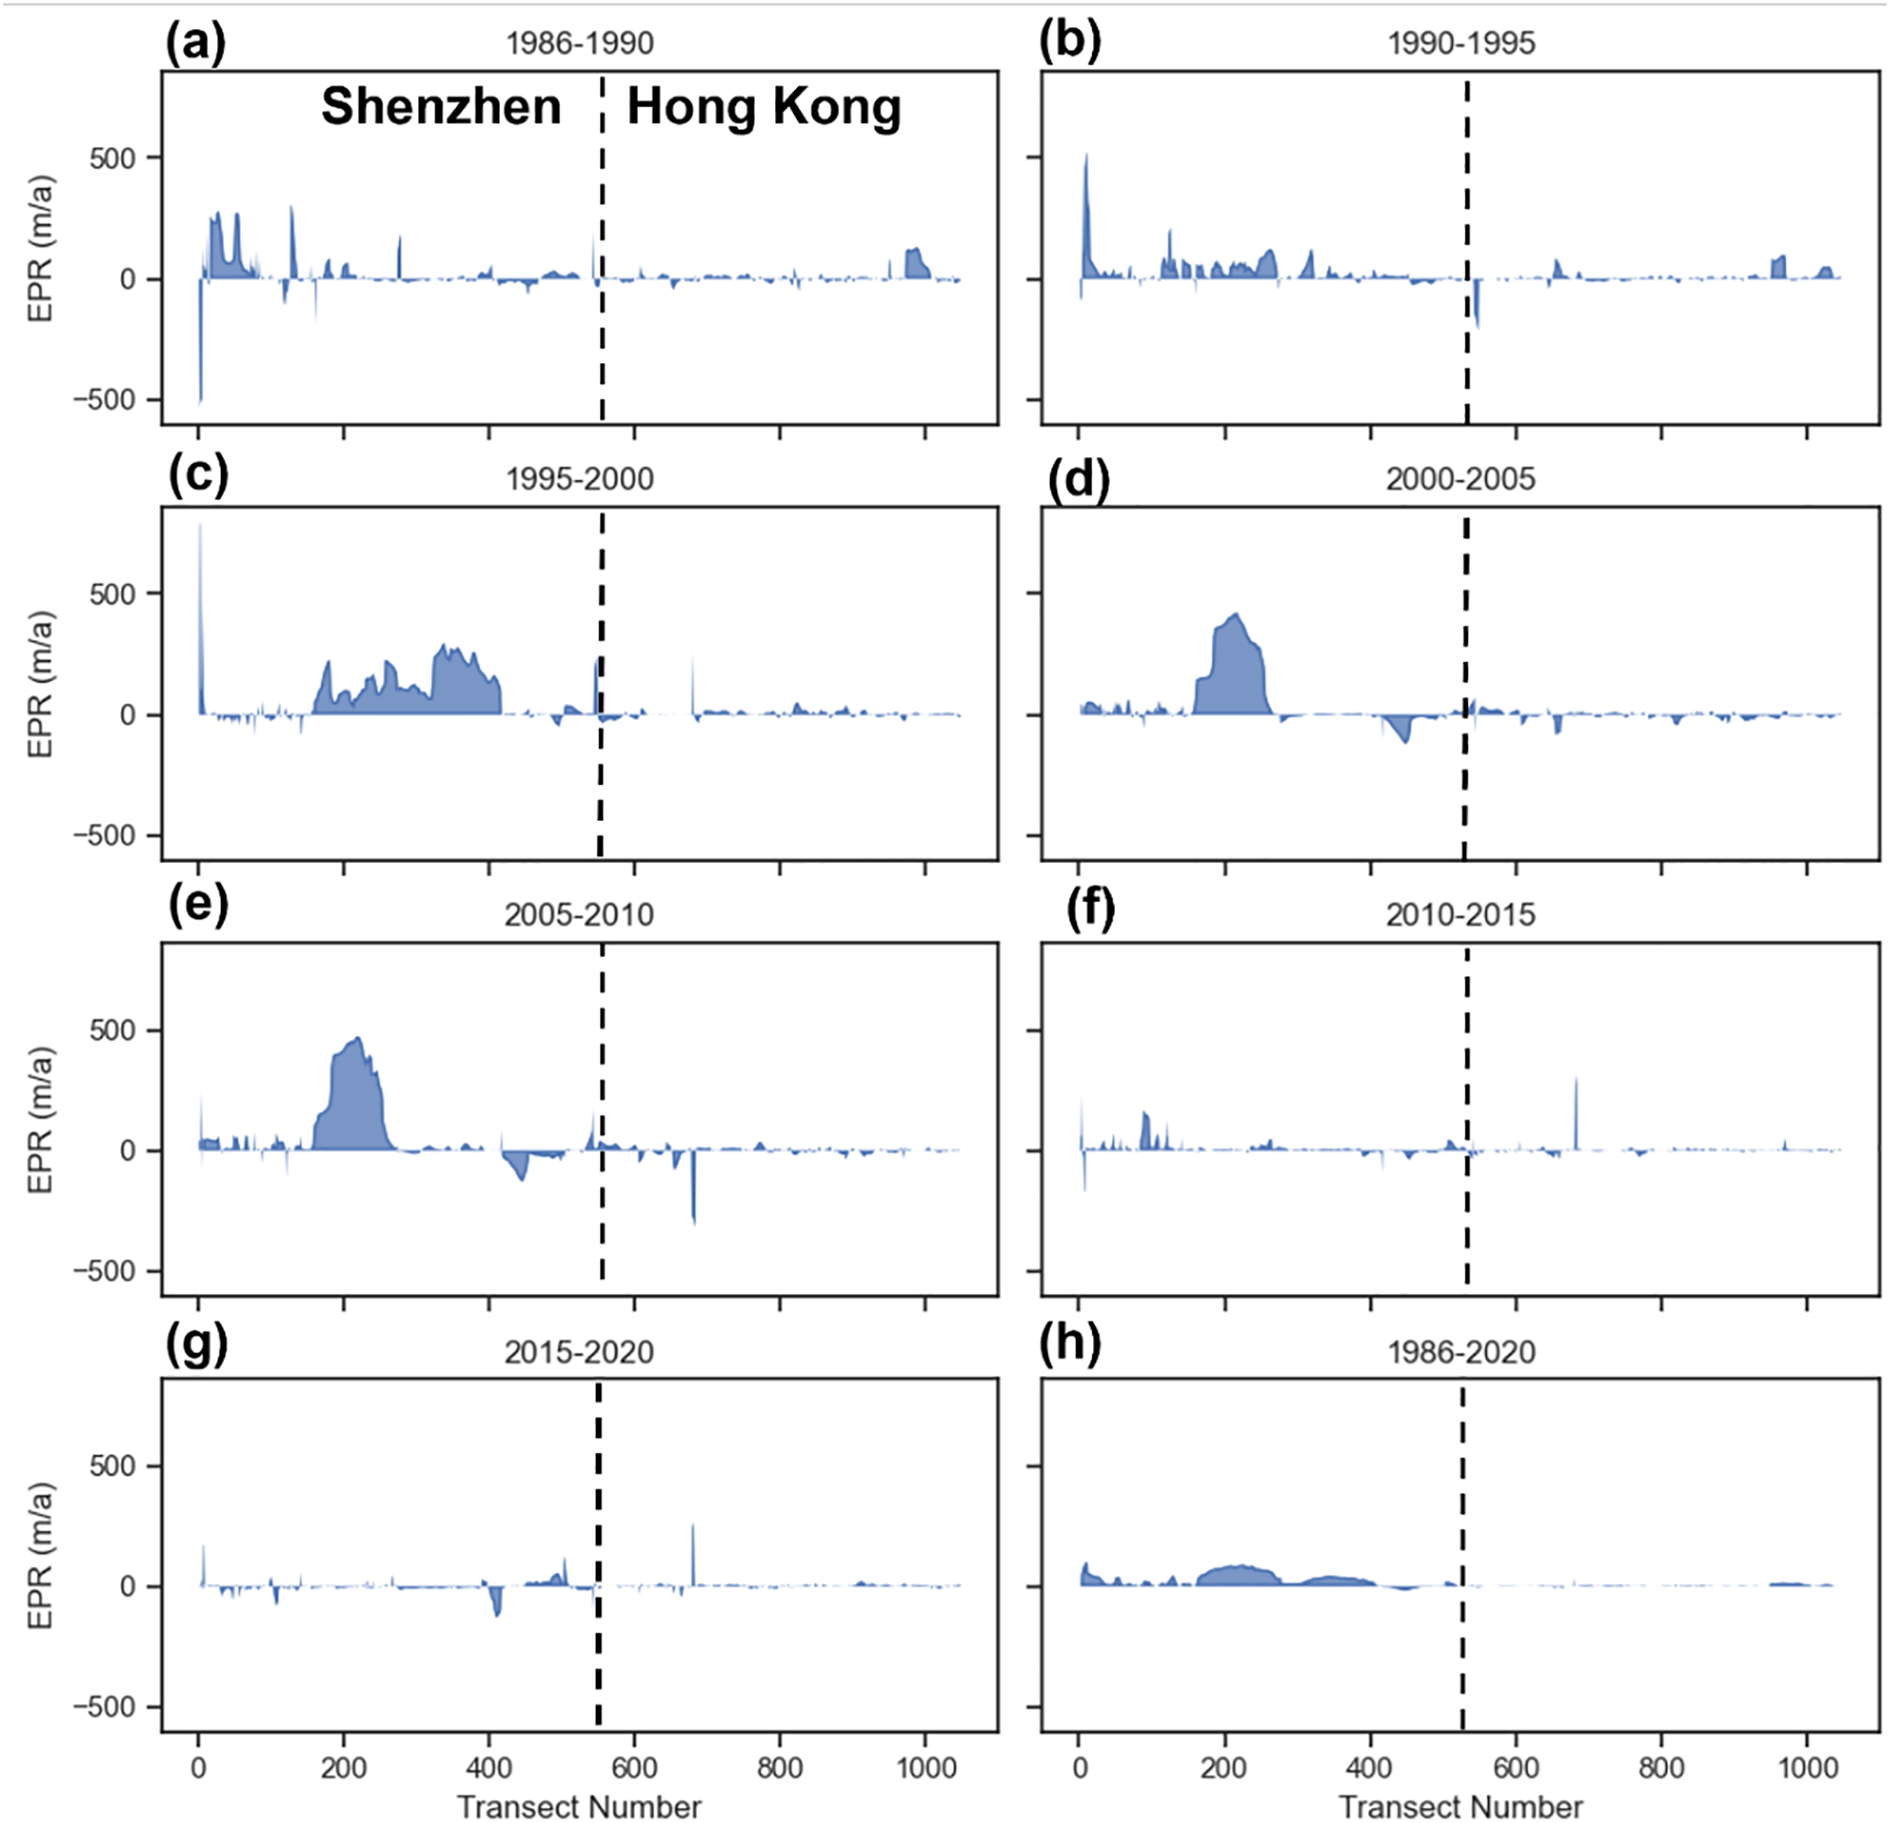
Shoreline change rates indicated by (End Point Rate) EPR at each period from 1986 to 2020. (a) 1986-1990; (b) 1990-1995; (c) 1995-2000; (d) 2000-2005; (e) 2005-2010; (f) 2010-2015; (g) 2015-2020; (h) 1986-2020.
5 Discussion
5.1 The influence of human activities on the changes of shorelines
The CLCI (Equation 4) index was employed to quantitatively assess the spatiotemporal patterns of shoreline modification in Shenzhen Bay from 1986 to 2020 (Table 3). The analysis revealed a characteristic "decrease-increase-decrease" cyclical trend in coastal modification rates, with three distinct periods exhibiting particularly intense anthropogenic impacts. During the initial development phase (1986–1990), the CLCI reached 1.211, coinciding with Shenzhen's establishment as a Special Economic Zone and corresponding infrastructure expansion. This was followed by sustained high-intensity modification (CLCI = 0.793) during 1990–1995, reflecting accelerated urbanization processes. Most notably, the period 2010–2015 demonstrated peak transformation intensity (CLCI = 1.653), directly attributable to large-scale land reclamation projects associated with the Qianhai development initiative. The accelerated urbanization process in Shenzhen Bay has precipitated substantial land use transformations that have directly influenced coastal morphological changes, as evidenced by the spatiotemporal patterns shown in Figure 8. Over the 35-year study period (1986–2020), the coastal zone experienced a dramatic conversion of natural landscapes to anthropogenic uses, with particularly pronounced changes in the Shenzhen sector compared to relatively stable conditions in Hong Kong. The construction land area expanded exponentially from 20.95% to 58.20% of total coastal zone, while ocean areas witnessed a precipitous decline from 20.95% to merely 0.47%, reflecting extensive land reclamation activities (Figure 8) (Equation 5).
Table 3
| Periods | CLCI |
|---|---|
| 1986–1990 | 1.211 |
| 1990–1995 | 0.793 |
| 1995–2000 | -1.895 |
| 2000–2005 | 0.250 |
| 2005–2010 | 0.153 |
| 2010–2015 | 1.653 |
| 2015–2020 | -0.029 |
The CLCI of Shenzhen Bay in different periods.
Figure 8
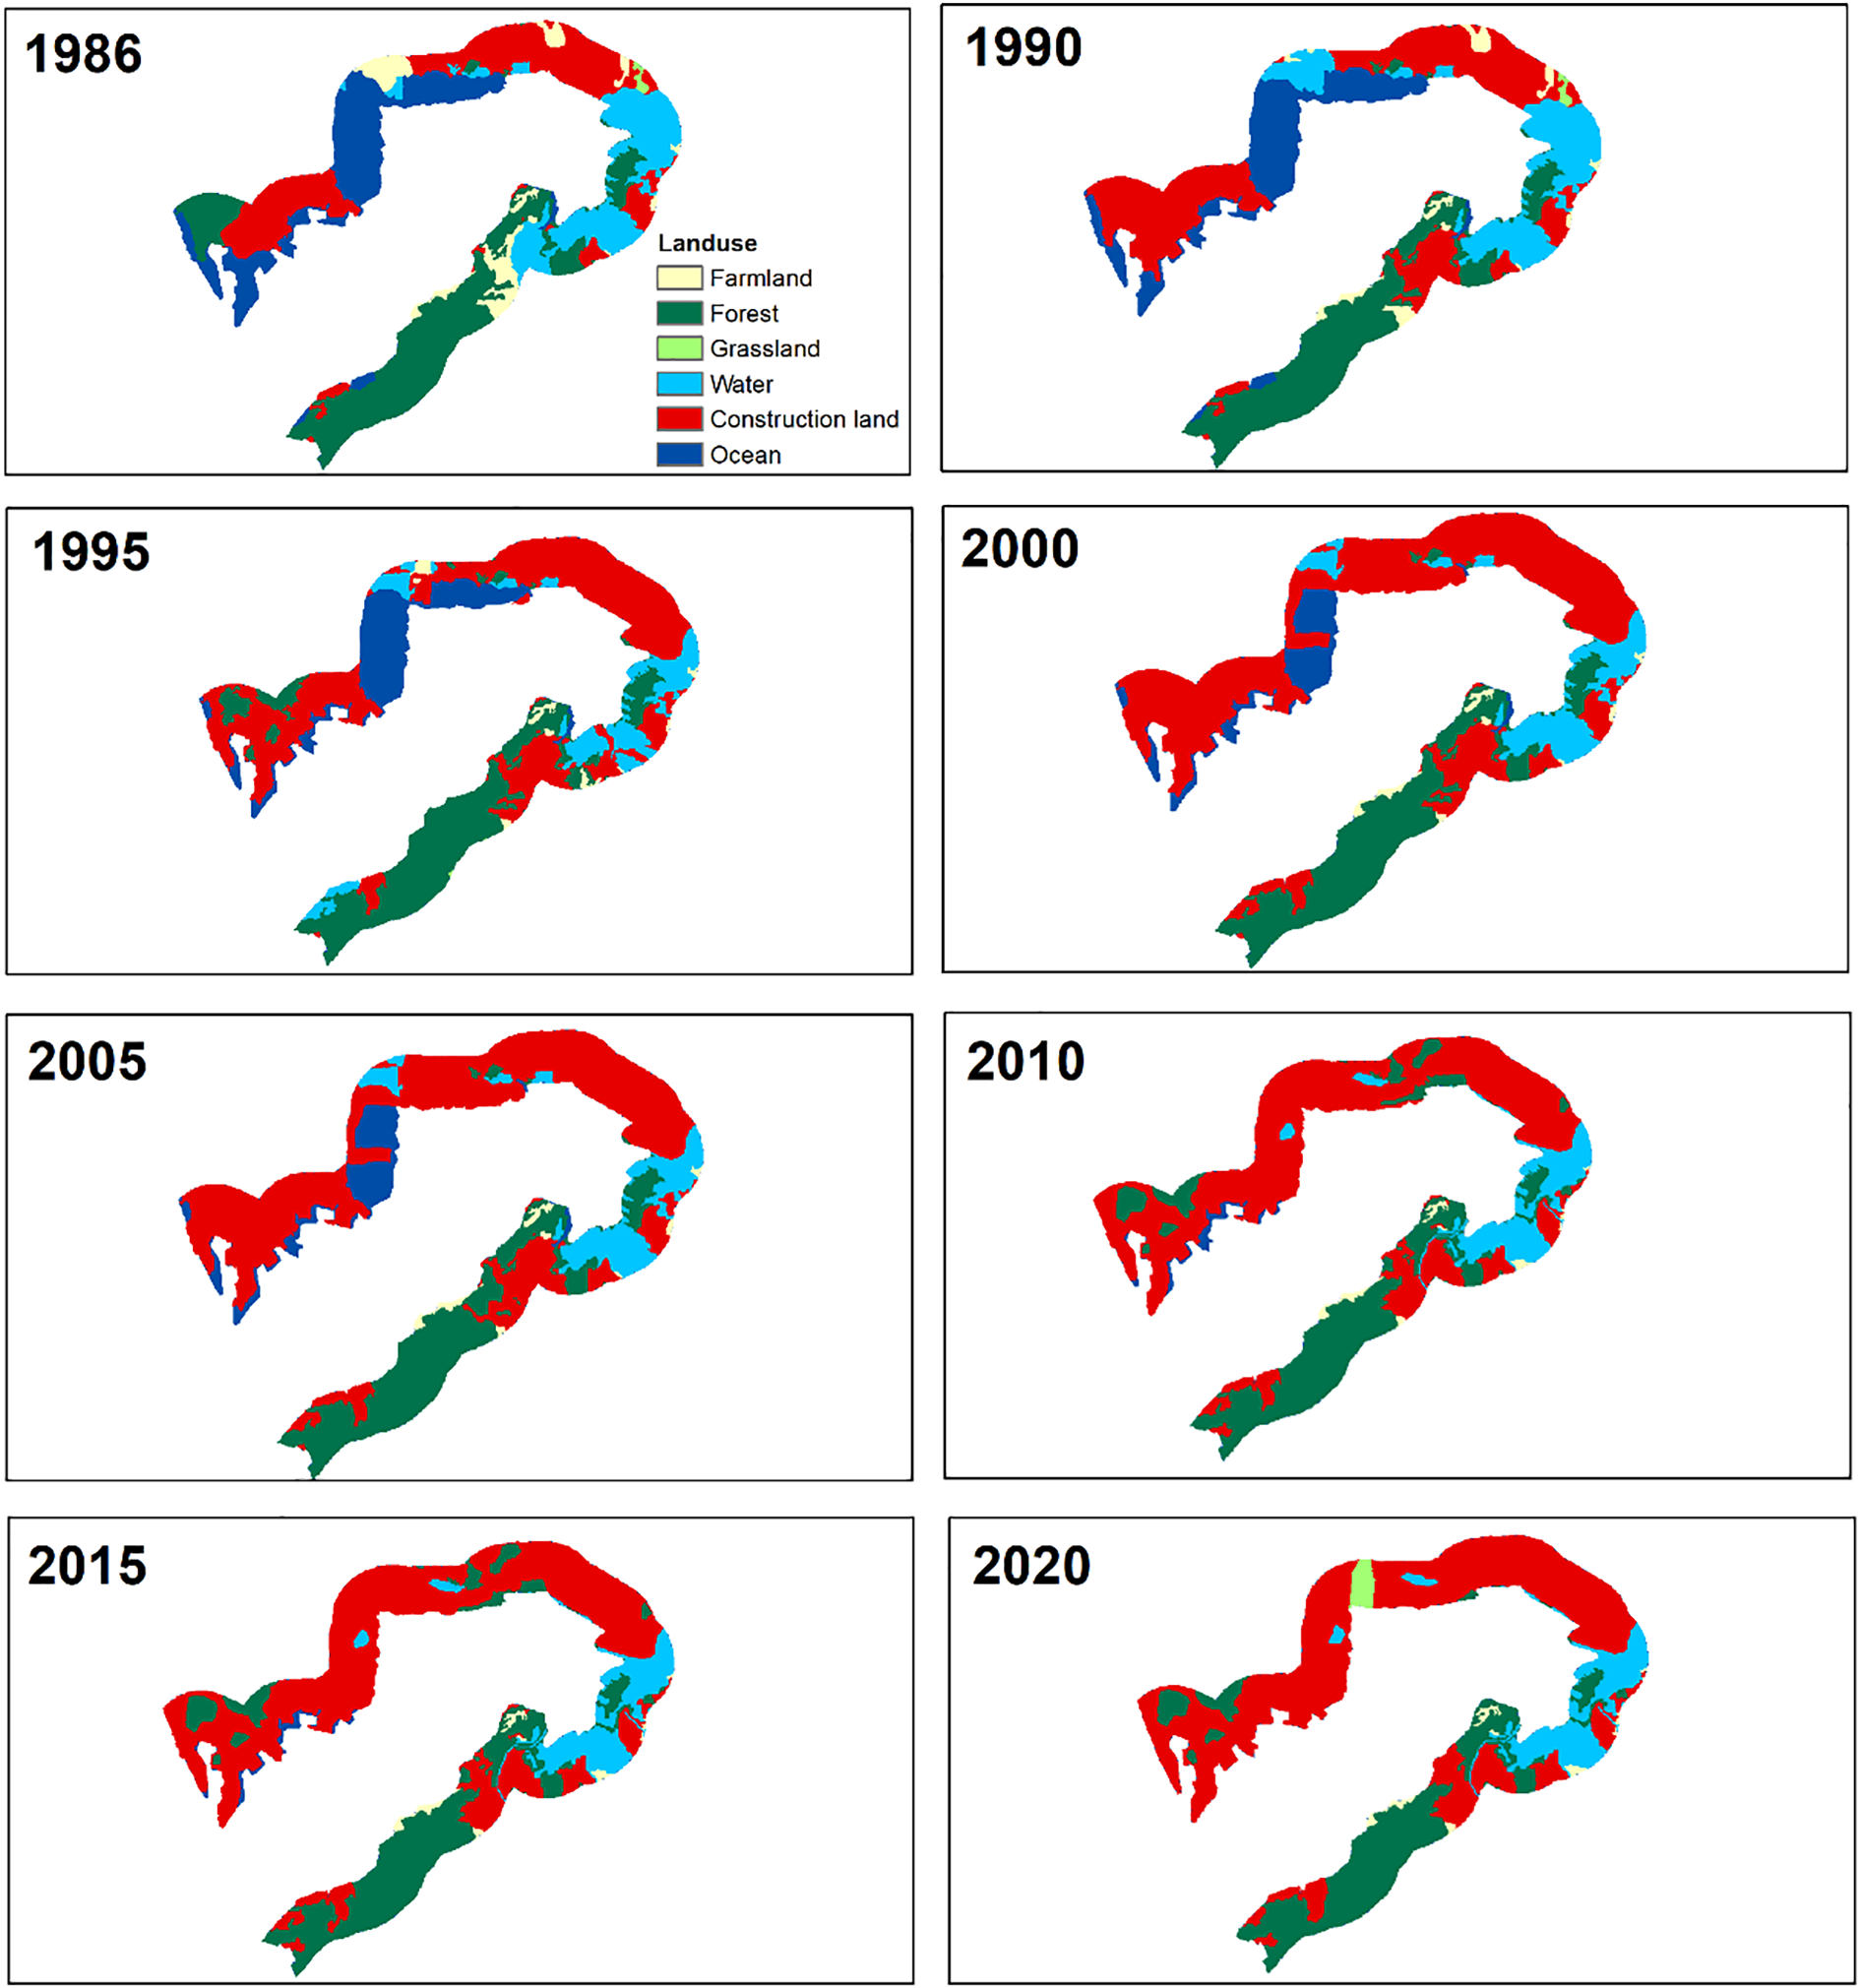
The land use of Shenzhen Bay region in 1986-2020.
The HAII model was adopted to measure the degree of interference from human activities on the coastal zone of Shenzhen Bay (Figure 9). In the past 35 years, the value of HAII showed an increased tendency. From 1986 to 2000, the HAII drastic changed, increasing by 0.10 /a, which indicates that the influence of human activities on the coastal zone was very strong during this period (Figure 9). The HAII performed relatively steadily from 2000 to 2020, increasing by only 0.006/a, indicating that the impact of human activities on the coastal zone was gradually weakening (Figure 9). The major construction events of Shenzhen Bay from 1980 to 2020 are statistically shown in Supplementary Table S2.
Figure 9
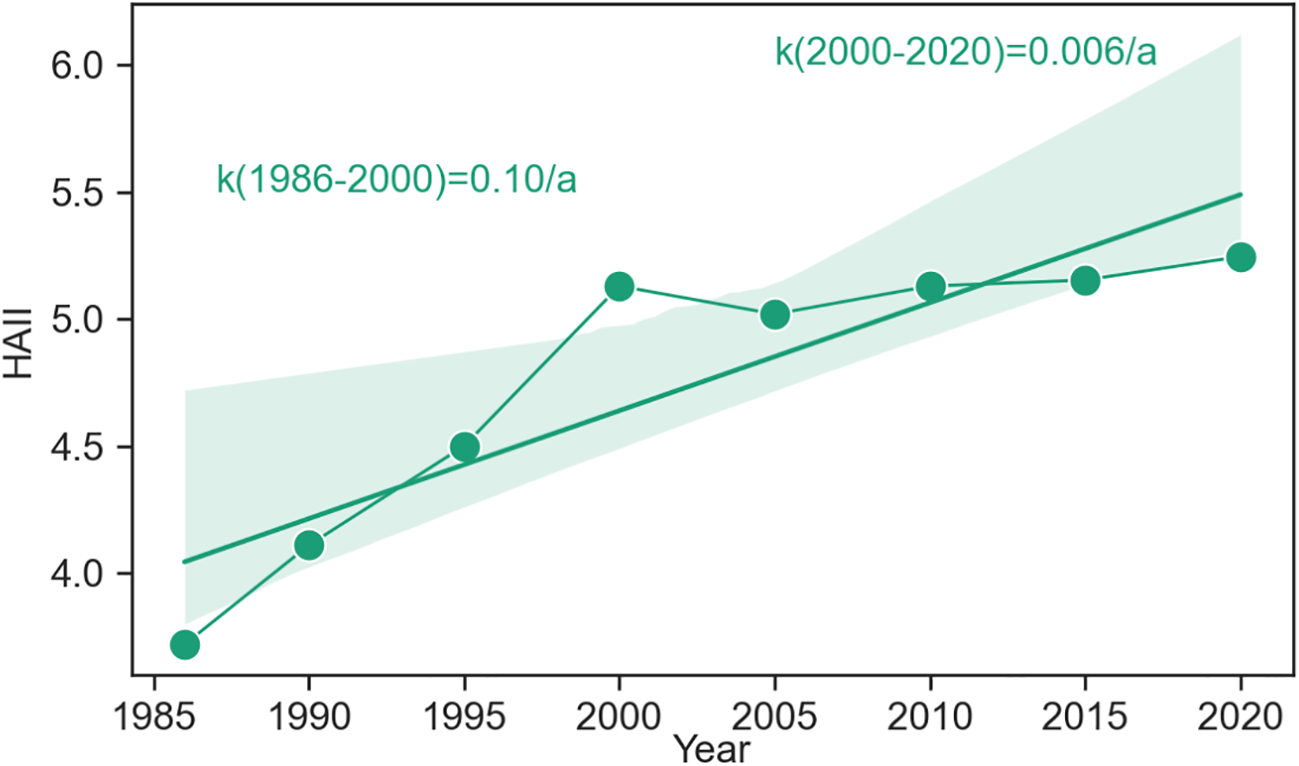
The change of (Human Activity Intensity Index) HAII from 1986 to 2020.
Human activities alter the type and spatial configuration of existing natural or artificial shorelines by creating new shoreline structures. In the Dachan Bay-Shenzhen River estuary segment of Shenzhen Bay, aside from protected natural shorelines such as the Mangrove Coastal Ecological Park and Futian Mangrove Ecological Park-which are dominated by mangrove conservation areas-the remaining shoreline is largely artificial, formed through land reclamation and nearly fully developed. Available land for residential construction is virtually nonexistent. In recent years, this coastal segment has been progressively planned and developed with major projects including the Shahe Golf Course, Shenzhen Bay Super Headquarters Base, Happy Coast, and Shenzhen Bay Park (Wei et al.,2023). Viewed against the 40-year timeline of China's reform and opening-up policy, the western shore of Shenzhen Bay underwent distinct phases of coastal development. From 1979 to 1988, aquaculture expanded rapidly on the western shore, supported by favorable policies. Between 1994 and 2008, development priorities shifted toward sea reclamation and the progressive construction of public facilities extending seaward. Since 2008, however, coastal protection has gained increasing attention in Shenzhen, with relevant authorities strengthening restrictions on land reclamation activities. As a result, the rate of shoreline change in Shenzhen Bay has gradually slowed (Wei et al., 2023).
These quantified intensity patterns provide compelling evidence of the dominant role of human activities in reshaping the bay's coastal morphology and land use types in the coastal zone, with modification rates showing stronger correlation with regional economic development milestones than with natural coastal processes.
5.2 The influence of natural factors on the changes of shorelines
The long-term evolution of estuarine delta shorelines, including Shenzhen Bay, results from the complex interplay of both natural processes and human activities (Pilkey and Cooper, 2004; Rahman et al., 2011; Syvitski et al., 2009). While natural factors drive shoreline erosion and accretion across varying spatiotemporal scales, this study specifically examines fiver fundamental and persistent natural drivers of coastal dynamics: relative SLR, riverine sediment supply, tidal, and river discharge (Mann and Westphal, 2014). These intrinsic natural mechanisms interact with anthropogenic modifications to shape the observed patterns of shoreline change. The analysis of these natural forcing factors provides a crucial baseline for understanding and distinguishing human-induced coastal changes from natural variability in this rapidly urbanizing estuarine system.
5.2.1 SLR influence
To assess SLR impacts on Shenzhen Bay's coastal dynamics, this study utilized long-term tidal records (1986–2020) from the Tsim Bei Tsui station (22°29'11" N, 114°00'42" E), the nearest permanent tide gauge with continuous monitoring data adjacent to the study area. As shown in Supplementary Figure S1, the station recorded a significant secular trend of SLR at 1.85 mm/a, characterized by interannual fluctuations superimposed on the persistent rising trajectory. This documented SLR exerts a counteracting influence on the predominantly shoreline trends observed in Shenzhen Bay, progressively reducing the sediment accommodation space and increasing coastal squeeze effects that constrain the potential for continued seaward expansion, particularly in low-lying reclaimed areas vulnerable to inundation and enhanced erosion during extreme water level events. The growth and expansion of mangroves depend on suitable hydrodynamic and salinity conditions. Sea-level rise is projected to prolong inundation duration and increase water salinity, potentially leading to mangrove loss (Feng et al., 2020). SLR may also cause seawater intrusion in local coastal areas, typically manifested as rising tidal levels, reduced sedimentation, significant marine transgression, and shoreline retreat along sandy and silty coasts. As such, it represents one of the major natural factors contributing to shoreline erosion in Shenzhen Bay.
5.2.2 Sediment influence
Among various influencing factors, sediment discharge is the most significant factor affecting shoreline changes in estuarine deltas (Liu et al., 2015). Sediment supply has been identified as a critical factor influencing shoreline dynamics in Shenzhen Bay (Qiao et al., 2018), with Supplementary Figure S2 illustrating the spatial and temporal patterns of sediment accumulation in both inner (2002–2020) and outer (2009–2020) bay regions. The data reveal a consistent depositional trend throughout the study period, with the inner bay accumulating sediment at 67.75×10⁴ m³/a (equivalent to 1.5 cm/a, Supplementary Figure S2b) compared to 35.25×10⁴ m³/a (equivalent to 0.98 cm/a, Supplementary Figure S2b) in the outer bay (Kang et al., 2024), demonstrating a clear gradient of decreasing siltation intensity from the outer to inner bay areas. This deposition pattern primarily results from tidal-driven transport of sand originating from Lingdingyang Bay, which serves as the dominant sediment source for Shenzhen Bay's ongoing accretion, highlighting the crucial role of external sediment inputs in maintaining the bay's sediment budget and influencing its shoreline evolution.
5.2.3 Storms influence
Shenzhen is characterized by a typical south subtropical monsoon climate. Located within the Pearl River Delta, which is one of the regions in China most significantly affected by typhoons, the area is highly vulnerable to these weather systems (Gao et al., 2019; Zhang Z. et al., 2023). Storms are a dominant driver of coastal hazards, inducing rapid erosion and shoreline retreat over periods of hours to days. While the ensuing calm waves can facilitate some natural beach recovery by re-depositing sediment, the overall sediment budget tends to be negative, resulting in a net loss (Wei et al., 2023).
5.2.4 Tidal influence
Shenzhen Bay is a semi-open bay that is influenced by tidal changes (Zhang H. et al., 2024; Kang et al., 2024). Tidal action drives the runoff from the Pearl River Estuary into Shenzhen Bay, resulting in water-level fluctuations that alter the bay's shoreline (Yu, 2022). Driven by tidal forces, which transport sediment from Lingdingyang as the primary source of siltation in Shenzhen Bay, the erosion-deposition evolution of the bay is significantly influenced by Lingdingyang's hydrodynamic conditions during extreme weather, leading to alterations in its shoreline changes (Kang et al., 2024). Tidal changes shape the macroscopic pattern and sedimentary environment of the coastal zone, and their influence is medium to long-term and fundamental.
5.2.5 River discharge influences
Rivers transport sediment eroded from their watersheds to the estuary, where sufficient sediment supply leads to accretion and delta formation (e.g., the Yellow River and Yangtze River Deltas), prograding the shoreline—a process most pronounced during flood seasons when enhanced sediment transport capacity rapidly delivers vast quantities of sediment to the ocean, making this the critical period for delta growth. The rivers entering Shenzhen Bay have low flow rates and supply little sediment; as a result, their effects on water level variations and shoreline changes are minimal (Xu Z. et al., 2015; Yu, 2022).
5.3 The impact of shoreline changes on the ecological environment
The shoreline changes in Shenzhen Bay have significantly altered its areal extent, exerting profound impacts on local ecological environment. From 1986 to 2020, Shenzhen Bay underwent extensive land reclamation due to urban expansion in both Shenzhen and Hong Kong (e.g., Qianhai, Houhai, and the Shenzhen River Estuary development), resulting in an approximately 18.5% reduction in bay area. The proportion of natural shorelines (including sandy and biological shorelines) decreased from 72% in 1986 to 44% in 2020, while artificial shorelines increased to 56% coverage. The changes in the shoreline of Shenzhen Bay have had a significant impact on the local ecological environment.
5.3.1 Tidal prism and dynamics
Due to shoreline changes, the flow velocity and direction in the Yellow River Delta have generally exhibited a declining trend, with variation magnitudes ranging between 0.34% and 25.94% (Zhang L. et al., 2023). The expansion of the shoreline in Bohai Bay has led to a reduction in residual flow, weakened water exchange capacity, decreased pollutant diffusion ability, and diminished the diluting effect of river discharge on seawater (Han et al., 2018). Human activities in the region have led to a decline in the ratio of annually-averaged rising tide duration to falling tide duration in Hangzhou Bay from 0.85 to 0.63 (Xie et al., 2017). Concurrently, the tidal prism at the interface between the inner and outer bay has decreased by approximately 25% since the 1980s. This reduction has been accompanied by a certain intensification of net landward sediment flux, contributing to enhanced sedimentation within the inner bay (Xie et al., 2017). Following 2014, a reduction in current velocity of 8–21% was observed, largely attributable to land reclamation (Xie et al., 2024). Future continued expansion of the Yellow River Delta could further extend sediment deposition areas and form new channel pathways (Zhang L. et al., 2023). Human activities in the region have led to a decline in the ratio of annually-averaged rising tide duration to falling tide duration in Hangzhou Bay from 0.85 to 0.63 (Xie et al., 2017). Concurrently, the tidal prism at the interface between the inner and outer bay has decreased by approximately 25% since the 1980s. This reduction has been accompanied by a certain intensification of net landward sediment flux, contributing to enhanced sedimentation within the inner bay (Xie et al., 2017). Following 2014, a reduction in current velocity of 8–21% was observed, largely attributable to land reclamation in Hangzhou Bay (Xie et al., 2024).
Two decades of land reclamation have resulted in a 15.6% reduction in Shenzhen Bay's tidal prism (Guo and Zhu, 2005). This significant decrease in tidal volume has led to diminished current velocities and altered flow patterns, substantially compromising the bay's capacity for pollutant dilution and dispersion (Guo and Zhu, 2005). The accumulation and concentrations of heavy metals in Shenzhen Bay sediments are significantly influenced by land reclamation activities (Zhang et al., 2021). The reclamation projects have modified tidal wave propagation, resulting in shortened flood duration and prolonged ebb duration in certain areas, potentially exacerbating estuarine sedimentation (Ji et al., 2022). Studies have found that following reclamation activities in Shenzhen Bay, the magnitude and distribution of residual currents at the bay mouth and the head of the bay remained largely unchanged; however, residual currents in the inner bay intensified. Additionally, an overall decline in water quality and a reduction in environmental capacity were observed (Ni et al., 2001). Urbanization in Shenzhen has reduced both flood-tide and ebb-tide ranges, consequently increasing flood control pressures along the Shenzhen River (Zhang and Mao, 2015). Due to an expansion in the middle of the Bay, Shenzhen Bay has been experiencing persistent siltation (Wu et al., 2023). Therefore, to protect the ecological environment of Shenzhen Bay, it is imperative to implement strict controls on land reclamation activities in the area.
5.3.2 Impact on sediment
In addition to a marked decline during 1983–2014, suspended sediment concentration has further decreased by 29–38% in Hangzhou Bay (Xie et al., 2024). Moreover, sediment transport from the Changjiang Estuary to Hangzhou Bay has diminished by 36–53%, accounting for the recent bed erosion observed in the northern part of the bay mouth (Xie et al., 2024).
Reclamation is projected to increase the annual sediment input into Shenzhen Bay, while slightly decreasing the average sediment concentration in the bay. The spatial extent of sedimentation is expected to expand both at the estuary and the bay mouth, with a slight increase in sedimentation rates. Moreover, areas of erosion near reclamation zones in the inner bay are likely to expand, leading to localized shallow sedimentation along concave segments of the new shoreline (Qin et al., 2002). Currently, there is limited research on the impacts of shoreline changes on hydrodynamics and sediment dynamics in Shenzhen Bay. Future studies should employ relevant numerical models to investigate the mechanisms through which shoreline changes influence the ecological environment of Shenzhen Bay.
5.3.3 Impact on mangroves
During 1988–2017, the implementation of land reclamation in Shenzhen Bay has reduced tidal ranges, resulting in significant sediment accumulation that has created suitable habitat conditions for mangrove expansion, accounting for 78.4% of total mangrove growth (Feng et al., 2020). The mangrove forests in Shenzhen Bay, primarily distributed in the Futian Mangrove Nature Reserve and the Mai Po Nature Reserve, constitute the most critical component of the Shenzhen Bay biological shoreline (Wei et al., 2023). The mangrove area in Shenzhen Bay increased from 259.6 ha to 527.1 ha between 1988 and 2017, with 81.8% of this growth occurring in the Mai Po Mangrove area in Hong Kong (Feng et al., 2020). This expansion of mangroves has led to a rapid increase in the biological shoreline, which grew from 8.3 km to 15.7 km between 1986 and 2020, with respective increases of 53% in Shenzhen and 47% in Hong Kong (Figure 3).
It is important to note that the shoreline used for this delineation corresponds to the landward boundary of the mangroves, as defined in existing literature (Quang and Van An, 2025; Luo et al., 2021; Thakur et al., 2021). Consequently, the mangroves are not represented as a distinct land-use category within the area shown in Figure 8. Therefore, the fact that mangroves are not included in the land use types of the Shenzhen Bay coastal zone is a flaw in this study. According to the remote sensing images from 1986 to 2020, with the exception of a few years with lower image clarity (1990, 2000, and 2010), a visual interpretation reveals that both the area and distribution range of mangroves in Shenzhen Bay have shown an increasing trend (Figure 3). This finding is consistent with previous research results (Feng et al., 2020).
5.4 Comparative analysis of shoreline changes on the Shenzhen vs Hong Kong sides
Due to differing coastal protection policies implemented by Shenzhen and Hong Kong over the past decades, the shoreline changes on opposite sides of Shenzhen Bay have varied significantly (Xia et al., 2020). Overall, between 1986 and 2020, the intensity of shoreline change on the Shenzhen side of Shenzhen Bay was considerably higher than that on the Hong Kong side. Specifically, the NSM and EPR along the Shenzhen shoreline reached 965.13 m and 28.10 m/a, respectively, whereas the corresponding values for the Hong Kong side during the same period were 81.65 m and 2.37 m/a. The Shenzhen side’s values were approximately 11.82 and 11.86 times greater than those of the Hong Kong side, respectively (Table 4). Driven by intensive human activities, the artificial shoreline length increased rapidly—particularly on the Shenzhen side, where it expanded by 15.05 km, compared to only 4.36 km on the Hong Kong side (Table 4). Most of this expansion occurred at the expense of sandy shorelines, which decreased by 12.58 km and 9.13 km along the Shenzhen and Hong Kong sides, respectively (Table 4). The Shenzhen River Regulation Project have been identified as the primary cause of changes in mangrove distributions (Wang, 2022). In contrast, biological shorelines increased by 3.87 km on the Shenzhen side and 3.49 km on the Hong Kong side, showing comparable magnitudes of change on both sides (Table 4).
Table 4
| Indicators | Shenzhen | Hong Kong | Ratio (Shenzhen/Hong Kong) | |
|---|---|---|---|---|
| Shoreline type length change (km) | Artificial shoreline | 15.05 | 4.36 | 3.46 |
| Biological shoreline | 3.87 | 3.49 | 1.11 | |
| Sandy shoreline | -12.58 | -9.03 | 1.39 | |
| Total length | 6.34 | -1.18 | -5.37 | |
| Shoreline type percentages change (%) | Artificial shoreline | 21.40 | 6.90 | 3.10 |
| Biological shoreline | 5.50 | 4.90 | 1.12 | |
| Sandy shoreline | -21.50 | -17.20 | 1.25 | |
| Area change (km2) | -18.82 | -1.96 | 9.60 | |
| NSM (m) | 965.13 | 81.65 | 11.82 | |
| EPR (m/a) | 28.10 | 2.37 | 11.86 | |
Comparison of different indicators of shoreline change between the Shenzhen side and Hong Kong side of Shenzhen Bay.
Located at the estuary of the Pearl River, Shenzhen Bay is subject to natural processes such as estuarine erosion and sedimentation. However, human factors exert a stronger influence on shoreline changes than natural factors, with significantly more pronounced impacts on the Shenzhen side than on the Hong Kong side (Yi et al., 2023).
5.5 Compared with studies on shoreline changes in other regions
Driven by extensive land reclamation, river deltas exhibit a clear response pattern characterized by an increase in total shoreline length and a marked shift from natural to artificial shorelines. Over the past few decades, land reclamation has significantly reshaped the coastline of eastern China, leading to a continuous increase in total coastline length and a growing proportion of artificial shoreline (Yan et al., 2023). The lengths of the entire shoreline and the artificial shoreline of mainland China increased from 30,041.22 km and 10,022.49 km in 1990 to 32,977.34 km and 17,660.84 km in 2020, with annual change rates of 97.87 km/a and 254.61 km/a, respectively (Li et al., 2023). From 1990 to 2020, the rate of natural shoreline decreased from 66.68% to 42.29%, and the artificial shoreline increased from 33.32% to 57.71% in China (Li et al., 2023). Due to reclamation activities and port construction, the shoreline of the Bohai Sea has exhibited an average rate of change of 188.47 m/a and an average accretion distance of 3.55×10³ m toward the sea during past 30 years (Ding et al., 2020). Shanghai’s total shoreline length increased by 25.7% from 472.6 km in 1960 to 594.2 km in 2015 (Qiao et al., 2018). From 1973 to 2021, the total length of the shoreline of the Pearl River Estuary increased from 240.09 km to 416.00 km, and that of the continental shoreline from 186.87 km to 246.21 km (Zhang et al., 2022).
Driven by land reclamation, a key response observed in river deltas is a substantial alteration in their areal extent, often leading to expansion. Between 2009 and 2019, the Yellow Delta exhibited an area expansion rate reaching 7.68 km²/a. From 1974 to 2014, the area of the Changjiang Subaerial Delta increased by 871 km2, with a net accretion rate of 21.8 km2/a (Wang et al., 2017). It turned out that more than 45.3% of area increment of the Changjiang Estuary was attributed to reclamation (Wang et al., 2017). Due to the shoreline changes, the Shanghai area expanded by 1,192.5 km2 by 2015, which was an increase of 19.9% relative to its 1960 area (Qiao et al., 2018). From 1973 to 2021, the total reclamation area of the Pearl River Estuary increased by 28,256.06 ha (Zhang et al., 2022).
Land reclamation acts as a key driver of profound alterations in key shoreline change metrics—NSM, EPR, and LRR—in river delta systems. According to the DSAS statistics, the NSM of the shoreline on the north of Hangzhou Bay was 773.58 m, the EPR and the LRR were 22.10 m/a and 27.00 m/a during 1985-2020, respectively (Liang et al., 2023). Between 2009 and 2019, the Yellow Delta exhibited a NSM of 1285 m and a LRR of 127.7 m/a (Zhang L. et al., 2023). In the Rizhao estuary area from 1985 to 2020, LRR values ranged from -2.27 m/a to 1.87 m/a in the southern part, while the northern part experienced LRR variations between -7.61 m/a and 13.54 m/a (Zhang Z. et al., 2024). Between 1960 and 2015, 10.6% of the total transects exceeded 3 km of NSM in Shanghai, with a maximum value of approximately 20 km at eastern Hengsha Island (Qiao et al., 2018). From 1985 to 2020, the NSM of the Hangzhou Bay south shoreline was 4109.57 m, and the EPR and LRR were 117.42 m/a and 132.22 m/a, respectively (Liang et al., 2023).
Between 1986 and 2020, the total shoreline length of Shenzhen Bay increased by 5,160 m, representing a growth of 9%. Compared to regions such as Bohai Bay, the Yellow River Delta, and Hangzhou Bay, the overall increase in shoreline length in Shenzhen Bay was relatively modest, and its rate of shoreline expansion was also lower than that of Shanghai. This can be primarily attributed to the relatively minor changes along the Hong Kong side of Shenzhen Bay. During the same period, the proportion of artificial shoreline in Shenzhen Bay rose from 27.6% to 55.8%, a level similar to mainland China (Li et al., 2023). Meanwhile, the bay area of Shenzhen Bay decreased by 18.5%, a rate of change close to the rate of land expansion observed in Shanghai, indicating that both metropolises have undergone similar urbanization processes over the past few decades (Qiao et al., 2023). On the Shenzhen side, the NSM was 965.13 m, which is highly consistent with that of the Yellow River Delta, while the EPR reached 28.10 m/a, a value comparable to that of the north of Hangzhou Bay (Zhang L. et al., 2023; Liang et al., 2023). The findings of this study demonstrate that the changes in the shoreline of Shenzhen Bay are consistent with those observed in other reclamation-affected estuaries and bays along eastern China, thereby verifying the reliability of the research results.
6 Conclusions
This study investigated the spatiotemporal evolution of Shenzhen Bay's shoreline from 1986 to 2020 through systematic analysis of Landsat time-series imagery at five-year intervals, with the high temporal resolution of the dataset enabling comprehensive characterization of shoreline dynamics over the 35-year study period. The research employed multiple quantitative indicators - including NSM, shoreline length change, areal transformation, and EPR - to precisely delineate and assess coastal changes across different temporal scales, while simultaneously examining both natural (e.g., SLR, sediment supply) and anthropogenic (e.g., land reclamation, urban expansion) drivers underlying the observed shoreline modifications.
The results reveal complex but predominantly accretional shoreline dynamics in Shenzhen Bay over the 35-year study period, with marked spatial disparities between the rapidly developing Shenzhen sector and more stable in Hong Kong areas. Quantitative analysis demonstrates a 120% expansion of artificial shorelines and 89% growth of biological shorelines, contrasted by a 64% reduction in sandy shorelines, resulting in a net 9% increase in total shoreline length alongside an 18.5% decrease in bay area due to extensive reclamation. Spatial patterns show 53.7% of NSM values falling within the 0–1000 m range, with Shenzhen transects exhibiting significantly greater mean displacement (965.13 m) compared to Hong Kong (81.63 m), while EPR analysis confirms substantially higher change rates in Shenzhen (28.10 m/a) versus Hong Kong (2.37 m/a). Although natural factors (SLR at 1.85 mm/a and sediment accumulation) contributed to coastal evolution, anthropogenic drivers - particularly large-scale land reclamation and channel engineering projects - emerged as the dominant forces shaping Shenzhen Bay's shoreline transformation.
The comprehensive documentation of Shenzhen Bay's shoreline dynamics in this study establishes a critical baseline for both reconstructing historical evolutionary patterns and projecting future shoreline trajectories, with the analytical framework and quantitative findings particularly supporting predictive modeling of coastal changes under various development scenarios. Our results suggest that the current accretional trend will likely persist in coming decades, primarily driven by continued anthropogenic modifications rather than natural processes, a projection supported by the strong correlation between observed shoreline changes and human activity intensity indices. These findings identify accelerated coastal accretion as an urgent environmental management priority for Shenzhen Bay, requiring immediate integration into coastal zone planning through: (1) revised regulations on reclamation projects, (2) enhanced monitoring of sediment dynamics, and (3) ecosystem-based adaptation strategies that balance developmental needs with environmental sustainability in this rapidly urbanizing marine system.
Statements
Data availability statement
The original contributions presented in the study are included in the article/Supplementary Material. Further inquiries can be directed to the corresponding author/s.
Ethics statement
Written informed consent was obtained from the individual(s), and minor(s)' legal guardian/next of kin, for the publication of any potentially identifiable images or data included in this article.
Author contributions
QH: Data curation, Methodology, Visualization, Writing – original draft, Writing – review & editing. XW: Conceptualization, Supervision, Visualization, Writing – review & editing. YH: Formal Analysis, Funding acquisition, Supervision, Validation, Writing – review & editing. EM: Funding acquisition, Supervision, Writing – review & editing. JY: Formal Analysis, Supervision, Validation, Visualization, Writing – review & editing. JW: Funding acquisition, Writing – review & editing.
Funding
The author(s) declared financial support was received for this work and/or its publication. This research was supported by the Shenzhen Science and Technology Program (No. KCXST20221021111416039), Shenzhen Science and Technology Program (No. GJHZ20240218113602005), the National Natural Science Foundation of China (42207061), and Natural Science Foundation of Guangdong (2023A1515012100).
Conflict of interest
Authors QH, YH, JY, JW were employed by Shenzhen Water Planning & Design Institute Co.,Ltd.
The remaining authors declare that the research was conducted in the absence of any commercial or financial relationships that could be construed as a potential conflict of interest.
Generative AI statement
The author(s) declare that no Generative AI was used in the creation of this manuscript.
Any alternative text (alt text) provided alongside figures in this article has been generated by Frontiers with the support of artificial intelligence and reasonable efforts have been made to ensure accuracy, including review by the authors wherever possible. If you identify any issues, please contact us.
Publisher’s note
All claims expressed in this article are solely those of the authors and do not necessarily represent those of their affiliated organizations, or those of the publisher, the editors and the reviewers. Any product that may be evaluated in this article, or claim that may be made by its manufacturer, is not guaranteed or endorsed by the publisher.
Supplementary material
The Supplementary Material for this article can be found online at: https://www.frontiersin.org/articles/10.3389/fmars.2025.1695029/full#supplementary-material
References
1
Bai Y. Li H. Li X. Su Y. Han Y. Chen J. (2019). Landscape Patterns of Shoreline and Coastal Zone in Shenzhen City and Their Responses to Intensity ofHuman Activities for 4 Periods since 1990. Wetland Sci.17, 335–343. doi: 10.13248/j.cnki.wetlandsci.2019.03.010
2
Bamunawala J. Ranasinghe R. Van Der Spek A. Maskey S. Udo K. (2018). Assessing future shoreline change in the vicinity of tidal inlets via reduced complexity modelling. J. Coast. Res.85, 636–640. doi: 10.2112/si85-128.1
3
Chen F. Chen G. Bao H. Peng B. (2001). Analysis on land use change and human driving force in urban f ringe. J. Natural Resour.16, 204–210. doi: 10.00.3037(2001)03.0204.07
4
Ding X. Shan X. Chen Y. Jin X. Muhammed F. R. (2020). Dynamics of shoreline and land reclamation from 1985 to 2015 in the Bohai Sea, China. J. Geographical Sci.29, 2031–2046. doi: 10.1007/s11442-019-1703-1
5
Eludoyin O. S. Oduore T. Obafemi A. A. (2012). Spatio-temporal analysis of shoreline changes in bonny island, Nigeria. EJESM5, 123–130. doi: 10.4314/ejesm.v5i2.2
6
Fan Q. Liang L. Liang F. Sun X. (2020). Research progress on shoreline change in China. J. Coast. Res.99, 281–295. doi: 10.2112/si99-041.1
7
Feng Z. Tan G. Xia J. Shu C. Chen P. Wu M. et al . (2020). Dynamics of mangrove forests in Shenzhen Bay in response to natural and anthropogenic factors from 1988 to 2017. J. Hydrol591, 125271. doi: 10.1016/j.jhydrol.2020.125271
8
Feyisa G. L. Meilby H. Fensholt R. Proud S. R. (2014). Automated Water Extraction Index: A new technique for surface water mapping using Landsat imagery. Remote Sens Environ.140, 23–35. doi: 10.1016/j.rse.2013.08.029
9
Fisher A. Flood N. Danaher T. (2016). Comparing Landsat water index methods for automated water classification in eastern Australia. Remote Sens Environ.175, 167–182. doi: 10.1016/j.rse.2015.12.055
10
Fogarin S. Zanetti M. Dal Barco M. K. Zennaro F. Furlan E. Torresan S. et al . (2023). Combining remote sensing analysis with machine learning to evaluate short-term coastal evolution 800 trend in the shoreline of Venice. Sci. Total Environ.859, 160293. doi: 10.1016/j.scitotenv.2022.160293
11
Gao J. Pan S. Wang H. Zhang J. (2019). Storm surge simulation based on coupling model:a case study of the western Shenzhen water. Mar. Sci. 803 Bull.38, 662–674. doi: 10.11840/j.issn.1001-6392.2019.06.008
12
Gao M. Zeng H. (2012). Dynamic change of the shoreline in shenzhen during 1986-2020. Trop. Geogr.32, 274–279. doi: 10.13284/j.cnki.rddl.001615
13
Guariglia A. Buonamassa A. Losurdo A. Saladino R. Trivigno M. L. Zaccagnino A. et al . (2006). A multisource approach for shoreline mapping and identification of shoreline changes. Ann. Geophys-Italy49, 295–304. doi: 10.4401/ag-3155
14
Guo W. Zhu D. (2005). Reclamation and its impact on marine environment in shenzhen area, China. J. Nanjing Univ. (Natural Sciences)41, 286–296. doi: 10.3321/j.issn:0469-5097.2005.03.008
15
Han J. Shen Y. Su M. Yu C. (2018). Numerical simulation of hydrodynamic and water quality effects of shoreline changes in Bohai Bay. Front. Earth Sci.12, 625–639. doi: 10.1007/s11707-018-0688-x
16
Himmelstoss E. A. Henderson R. E. Kratzmann M. G. Meredith G. Farris A. S. (2021). “ Digital shoreline analysis system (DSAS) version 5.1 user guide (104p),” in Retrieved from U.S. Geological Survey Open-File Report (Reston, Virginia, US: U.S. Geological Survey) 2021–1091.
17
Hou X. Wu T. Wang Y. Xu X. Chen Q. (2014). Extraction and accuracy evaluation of multi-temporal shorelines of mainland China since 1940s. Mar. Sci.11, 66–73. doi: 10.11759/hykx20131217001
18
Hsu T.-W. Lin T.-Y. Tseng I. F. (2007). Human impact on coastal erosion in Taiwan. J. Coast. Res.234, 961–973. doi: 10.2112/04-0353r.1
19
Huang C. Chen Y. Zhang S. Wu J. (2018). Detecting, extracting, and monitoring surface water from space using optical sensors: A review. Rev. Geophys56, 333–360. doi: 10.1029/2018rg000598
20
Ji X. Huang L. Zhang W. Yao P. (2022). On the mechanism behind the variation of the tidal current asymmetry in response to reclamations in lingding bay, China. J. Mar. Sci. Eng.10, 951. doi: 10.3390/jmse10070951
21
Kang Y. Lu C. Gao S. Wu Y. (2024). Riverbed erosion -deposition dynamics and driving mechanisms in Shenzhen Bay 2002-2020. Adv. Water Sci.35, 947–959. doi: 10.14042/j.cnki.32.1309.2024.06.008
22
Li X. Damen M. C. J. (2010). Shoreline change detection with satellite remote sensing for environmental management of the Pearl River Estuary, China. J. Mar. Syst.82, S54–S61. doi: 10.1016/j.jmarsys.2010.02.005
23
Li Y. Wang Y. Peng J. Wu J. Lv X. (2009). Research on dynamic changes of shoreline in Shenzhen city based on Landsat image. Resour. Sci.31, 875–883. doi: 10.3969/j.issn.1009-5349.2014.08.002
24
Li Y. Yang E. Pan Y. Wang J. (2023). Characteristics of suspended sediment transport in qiantang estuary and its influence mechanism. J. Zhejiang Ocean Univ. (Natural Science)42, 463–470. doi: 10.3969/j.issn.1008-830X.2023.05.012
25
Li K. Zhang L. Chen B. Zuo J. Yang F. Li L. (2023). Analysis of China’s coastline changes during 1990–2020. Remote Sens-Basel15, 981. doi: 10.3390/rs15040981
26
Liang J. Chen C. Song Y. Sun W. Yang G. (2023). Long-term mapping of land use and cover changes using Landsat images on the Google Earth Engine Cloud Platform in bay area- A case study of Hangzhou Bay, China. Sustain. Horizons7, 100061. doi: 10.1016/j.horiz.2023.100061
27
Liang F. Liu L. (2011). Quantitative analysis of human disturbance intensity of landscape patterns and preliminary optimization of ecological function regions:a case of Minqing county in Fujian Province. Resour. Sci.33, 1138–1144.
28
Liu P. Wang Q. Zhan C. Wang X. Du G. (2015). Study on the evolution law and influencing factors of the coastal line of the yellow river delta from 1959 to 2002 based on DSAS and FA. Oceanologia Et Limnologia Sin.46, 585–594. doi: 10.11693/hyhz20141200343
29
Liu C. Wu X. Cao X. Wu G. (2017). Analysis of shoreline changes and the socio-economic driving mechanisms in shenzhen, China. Mar. Geod40, 378–403. doi: 10.1080/01490419.2017.1319447
30
Liu Y. Li J. Yuan L. Shi X. Yang L. Chen P. (2016). Patterns of landscape ecological risks in Xiangshangang Bay Basin of China. Mar. Sci. Bull.35, 21–29.doi: 10.11840/j.issn.1001-6392.2016.01.004
31
Luo Z. Zhang L. Chen B. Sun Y. Be J. (2021). Analysis of the spatial and temporal changes of Thailand's coastline from 1990 to 2020. J. Mar. Sci.39, 56–66. doi: 10.3969/j.issn.1001-909X.2021.01.007
32
Mann T. Westphal H. (2014). Assessing long-term changes in the beach width of reef islands based on temporally fragmented remote sensing data. Remote Sens-Basel6, 6961–6987. doi: 10.3390/rs6086961
33
Matin N. Hasan G. M. J. (2021). ). A quantitative analysis of shoreline changes along the coastof Bangladesh using remote sensing and GIS techniques. Catena201, 105185. doi: 10.1016/j.catena.2021.105185
34
McFeeters S. K. (1996). The use of the Normalized Difference Water Index (NDWI) in the delineation of open water features. Int. J. Remote Sens17, 1425–1432. doi: 10.1080/01431169608948714
35
Nithu R. Gurugnanam B. Sudhakar V. Glitson Francis P. (2019). Estuarine shoreline change analysis along The Ennore river mouth, south east coast of India, using digital shoreline analysis system. Geod Geodyn10, 205–212. doi: 10.1016/j.geog.2019.04.002
36
Palanisamy P. Sivakumar V. Velusamy P. Natarajan L. (2024). Spatio-temporal analysis of shoreline changes and future forecast using remote sensing, GIS and kalman filter model: A case study of Rio de Janeiro, Brazil. J. S Am. Earth Sci.133, 104701. doi: 10.1016/j.jsames.2023.104701
37
Pilkey O. H. Cooper J. A. G. (2004). Society and sea level rise. Science303, 1781–1782. doi: 10.1126/science.1093515
38
Qiao G. Mi H. Wang W. Tong X. Li Z. Li T. et al . (2018). 55-year, (1960–2015) spatiotemporal shoreline change analysis using historical DISP and Landsat time series data in 887 ShanghaiInt. J. Appl. Earth Obs68, 238–251. doi: 10.1016/j.jag.2018.02.009
39
Qin H. Ni J. Li Y. (2002). Determination of Post-reclamation Coastline Based on Sediment Transport Model. J. Sediment Res.03, 52–58.doi: 10.16239/j.cnki.0468-155x.2002.03.009
40
Quang N. H. Van An N. (2025). Four decades of mangrove shoreline changes driven by human activities in the Red River Delta. Estuarine. Coast. Shelf Sci.314, 109145. doi: 10.1016/j.ecss.2025.109145
41
Rahman A. F. Dragoni D. El-Masri B. (2011). Response of the Sundarbans shoreline to sea level rise and decreased sediment flow: A remote sensing assessment. Remote Sens Environ.115, 3121–3128. doi: 10.1016/j.rse.2011.06.019
42
Sui L. Wang J. Yang X. Wang Z. (2020). Spatial-temporal characteristics of shoreline changes in Indonesia from 1990 to 2018. Sustainability-Basel12, 3242. doi: 10.3390/su12083242
43
Syvitski J. P. M. Kettner A. J. Overeem I. Hutton E. W. H. Hannon M. T. Brakenridge G. R. et al . (2009). Sinking deltas due to human activities. Nat. Geosci2, 681–686. doi: 10.1038/ngeo629
44
Thakur S. Mondal I. Bar S. Nandi S. Ghosh P. B. Das P. et al . (2021). Shoreline changes and its impact on the mangrove ecosystems of some islands of Indian Sundarbans, North-East coast of India. J. Cleaner Production284, 124764. doi: 10.1016/j.jclepro.2020.124764
45
Thoai D. T. Dang A. N. Kim Oanh N. T. (2019). Analysis of shoreline change in relation to meteorological conditions and human activities in Ca mau cape, Viet Nam. Ocean Coast. Manage171, 56–65. doi: 10.1016/j.ocecoaman.2019.01.007
46
Valderrama-Landeros L. Flores-De-Santiago F. (2019). Assessing coastal erosion and accretion trends along two contrasting subtropical rivers based on remote sensing data. Ocean Coast. Manage169, 58–67. doi: 10.1016/j.ocecoaman.2018.12.006
47
Valeyev A. Karatayev M. Abitbayeva A. Uxukbayeva S. Bektursynova A. Sharapkhanova Z. (2019). Monitoring shoreline dynamics of alakol lake in Kazakhstan using remote sensing data. Geosciences9, 404. doi: 10.3390/geosciences9090404
48
Wang Z. (2022). The Development and application of flood and tide control dispatching management platform for Shenzhen River basin. Water Resour. Dev. Manage.6, 61–67. doi: 10.16616/j.cnki.10-1326/TV.2022.06.12
49
Wang C. Zhao Y. Zou X. Xu X. Ge C. (2017). Recent changing patterns of the Changjiang (Yangtze River) Estuary caused by human activities. Acta Oceanologica Sin.36, 87–96. doi: 10.1007/s13131-017-1017-z
50
Wei S. Fu D. Liu D. Xu H. Li G. Cheng Y. (2023). Remote sensing monitoring of Shenzhen shoreline changes over the Past 40 Years. Trop. Geogr.43, 986–1004. doi: 10.13284/j.cnki.rddl.003589
51
Wu W. Wang L. Lei X. Zheng Y. Wei J. Mao X.-Z. (2023). Sustainable estuarine governance based on artificial island scheme for a highly anthropogenic influenced Shenzhen Bay, China. J. Hydrol616, 128784. doi: 10.1016/j.jhydrol.2022.128784
52
Wu L. Yang S. Liu X. Luo Y. Zhou X. Zhao H. (2014). Response analysis of land use change to the degree of human activities in Beiluo River basin since 1976. Acta Geographica Sin.69, 54–63. doi: 10.11821/dlxb201401005
53
Xia H. Long Y. Liu C. Liu J. (2020). Analysis of the spatio-temporal evolution of the shoreline in the pearl river delta from 1973 to 2018. J. Mar. Sci.38, 26–37. doi: 103969/j.issn.1001-909X.2020.02.004
54
Xie D. Chen Y. Pan C. Zhang S. Wei W. Wang Z. B. et al . (2024). Response of suspended sediment dynamics to human activities in the transitional zone between Changjiang Estuary and Hangzhou Bay. Front. Mar. Sci.11. doi: 10.3389/fmars.2024.1440754927
55
Xie D. Pan C. Wu X. Gao S. Wang Z. B. (2017). Local human activities overwhelm decreased sediment supply from the Changjiang River: Continued rapid accumulation in the Hangzhou Bay-Qiantang Estuary system. Mar. Geology392, 66–77. doi: 10.1016/j.margeo.2017.08.013
56
Xu H. (2006). Modification of normalised difference water index (NDWI) to enhance open water features in remotely sensed imagery. Int. J. Remote Sens27, 3025–3033. doi: 10.1080/01431160600589179
57
Xu N. (2018). Detecting shoreline change with all available Landsat data over 1986–2015: A case study for the state of Texas, USA. Atmosphere-Basel9, 107.doi: 10.3390/atmos9030107
58
Xu N. Gao Z. Ning J. (2016). Analysis of the characteristics and causes of shoreline variation in the Bohai Rim, (1980–2010). Environ. Earth Sci.75, 719. doi: 10.1007/s12665-016-5452-5
59
Xu X. Liu J. Zhang S. Li R. Yan C. Wu S. (2018). China multi-period land use land cover remote sensing monitoring data set (CNLUCC) (Beijing, China: Resources and Environmental Sciences, Chinese Academy of Sciences (RESDC)).
60
Xu Z. Ma Q. Jiang L. (2015). Prediction and impact study of sediment accumulation in shenzhen bay. Water Resour. Hydropower Eng.46, 95–100. doi: 10.13928/j.cnki.wrahe.2015.02.022
61
Xu Y. Sun X. Tang Q. (2015). Human activity intensity of land surface: concept, method and application in China. Acta Geographica Sin.70, 1068–1079. doi: 10.11821/dlxb201507004
62
Yan F. Wang X. Huang C. Zhang J. Su F. Zhao Y. et al . (2023). Sea reclamation in mainland China: process, pattern, and management. Land Use Policy127, 106555. doi: 10.1016/j.landusepol.2023.106555
63
Yi N. Tang J. Yang Y. Gao X. Song S. Hu Q. (2023). Variations of shoreline and land use in Guangdong-Hong Kong-Macao Greater Bay Area from 1989 to 2021. Mar. Geology Front.39, 1–11. doi: 10.16028/j.1009-2722.2022.158
64
Yu R. (2022). The influence degree of the Pearl River tidal current on the water level of Shenzhen Bay. China Sci. Technol. Inf.12, 106–109.033 957. doi: 10.3969/j.issn.1001-8972.2022.12.033
65
Zhan Y. Wu Y. Li C. Wu Y. (2021). The spatio-temporal changes of the shoreline in the Guangdong-Hong Kong-Macao Greater Bay Area from 1991 to 2018. Ocean Dev. Manage.10, 39–44. doi: 10.20016/j.cnki.hykfygl.2021.10.007
66
Zhang Y. Hou X. (2020). Characteristics of shoreline changes on southeast asia islands from 2000 to 2015. Remote Sens-Basel12, 519. doi: 10.3390/rs12030519
67
Zhang Z. Hu J. Zhou K. Zhang P. (2023). Storm surge simulations of the coastal area of Shenzhen using different types of typhoon meteorological fields—a case study of Typhoon Mangkhut. J. Trop. Oceanography42, 1–14. doi: 10.11978/2023017
68
Zhang X. Lin J. Huang H. Deng J. Chen A. (2022). Analysis on the dynamics of coastline and reclamation in pearl river estuary in China for nearly last half century. Water14, 1228. doi: 10.3390/w14081228979
69
Zhang S. Mao X.-Z. (2015). Hydrology, sediment circulation and long-term morphological changes in highly urbanized Shenzhen River estuary, China: A combined field experimental and modeling approach. J. Hydrol529, 1562–1577. doi: 10.1016/j.jhydrol.2015.08.027
70
Zhang Q. Ren F. Xiong X. Gao H. Wang Y. Sun W. et al . (2021). Spatial distribution and contamination assessment of heavy metal pollution of sediments in coastal reclamation areas: a case study in Shenzhen Bay, China. Environ. Sci. Eur.33, 90. doi: 10.1186/s12302-021-00532-9
71
Zhang L. Shi H. Xing H. Li P. Ma P. (2023). Analysis of the evolution of the Yellow River Delta shoreline and the response of the tidal current field. Front. Mar. Sci.10. doi: 10.3389/fmars.2023.1232060
72
Zhang Z. Wang Z. Liang B. Leng X. Yang B. Shi L. (2024). Shoreline change analysis in the estuarine area of Rizhao based on remote sensing images and numerical simulation. Front. Mar. Sci.11. doi: 10.3389/fmars.2024.1488577
73
Zhang H. Zhang X. Zhou W. (2024). Analysis of the impact of tidal channels on the current dynamics of dachan bay, shenzhen. Pearl River45, 40–45. doi: 10.3969/j.issn.1001-9235.2024.S1.007
74
Zhao L. Wu M. Zheng L. Luan S. Zhao X. Xue M. et al . (2022). Temporal-spatial changes and driving analysis of the northern shorelines of Jiaodong Peninsula. Remote Sens. Nat. Resoureces34, 87–96. doi: 10.6046/zrzyyg.2022101
75
Zhou Y. Wang L. Zhou Y. Mao X. Z. (2020). Eutrophication control strategies for highly anthropogenic influenced coastal waters. Sci. Total Environ.705, 135760. doi: 10.1016/j.scitotenv.2019.135760
Summary
Keywords
Shenzhen Bay, spatiotemporal shoreline change, landsat, digital shoreline analysis system (DSAS), anthropogenic activities
Citation
He Q, Wu X, Huang Y, Ma E, Yang J and Wang J (2025) Spatiotemporal evolution of shorelines in Shenzhen Bay (1986–2020): contrasting impacts of rapid urbanization in Shenzhen and natural processes in Hong Kong. Front. Mar. Sci. 12:1695029. doi: 10.3389/fmars.2025.1695029
Received
29 August 2025
Revised
08 November 2025
Accepted
10 November 2025
Published
10 December 2025
Volume
12 - 2025
Edited by
Dongfeng Xie, Zhejiang Institute of Hydraulics & Estuary, China
Reviewed by
Zezheng Liu, Zhuhai Campus, China
Shuyu Zhang, Zhejiang Tongji Vocational College of Science and Technology, China
Updates
Copyright
© 2025 He, Wu, Huang, Ma, Yang and Wang.
This is an open-access article distributed under the terms of the Creative Commons Attribution License (CC BY). The use, distribution or reproduction in other forums is permitted, provided the original author(s) and the copyright owner(s) are credited and that the original publication in this journal is cited, in accordance with accepted academic practice. No use, distribution or reproduction is permitted which does not comply with these terms.
*Correspondence: Yilong Huang, huangyl@swpdi.com
Disclaimer
All claims expressed in this article are solely those of the authors and do not necessarily represent those of their affiliated organizations, or those of the publisher, the editors and the reviewers. Any product that may be evaluated in this article or claim that may be made by its manufacturer is not guaranteed or endorsed by the publisher.